Embed Size (px)
Citation preview

AD-AI03 320 RAND CORP SANTA MONICA CA F/S 20/4THE H-P SUB X METHOD FOR PREDICTING TRANSITION, CU)JAN 81 A R WAZZAN, C GAZLEY, A M SMITH
UNCLASSIFIED RAND/P-6581 R
"Eil

L (L-
T H- NETHOD FOR PREDICTING TRANSITION
A. R. Wazzan, C. Gazley, Jr., A. M. 0. Smith
C-0
%0
Janury-4481
:-,2 !~DI ISBUTION_ !A
Approved for public rekK"B'Di-~~r~b ~ nl ~ed
- ---- -- --
/
/ o ~ f-'i /P-65
81 8 25 096

The Rand Paper Series
Papers are issued by The Rand Corporation as a service to its professional Staff. Theirpurpose is to facilitate the exchange of ideas among those who share the author's researchinterests; Papers are not reports prepared in fulfillment of Rand's contracts or grants.Views expressed in a Paper are the author's own, and are not necessarily shared by Randor its research sponsors.
The Rand CorporationSanta Monica. (alifornia 90406

THE H-R METHOD FOR PREDICTING TRANSITIONx
A. R. Wazzan, C. Gazley, Jr., A. M. 0. Smith
January 1981 w
Acce!7sion For
VT 3RA&I
!i'ced
* ity Codea
L aad/or
C cI al DIS UON A
7Appr ovea for puablic reloMjD " , to Uni tted /
* " a . .k....
THE H-R. METHOD FOR PREDICTING TRANSITION
A. R. Wazzan, C. Gazley, Jr. and A. M. 0. Smith
1. INTODUMONm
This paper gives a brief description of a shortcut method, the HII
method, for predicting transition in a wide class of boundary layer flows,
including the effects of pressure gradient, surface heat transfer and suc-
tion. Here H and . Are the body shape factor and the Reynolds number,
based on distance x measured in the direction of the flow, respectively.
The method is extremely simple to use and a good substitute to the well
known but rather complicated method. ..
II. THE en METHOD OF FORECASTING TRN TION
The H-Rx method has not been correlated with test data but rather
has been justified in terms of Tollmien-Schlichting waves and e9 type cal-
culations. Data are gradually being accumulated that show that the •9
method is the best all around method that now exists for predicting boun-
dary layer transition. Since the H-Rx method is rooted in the e 9 method,
we proceed to make some coments about the latter.
Transition, although it may commence with the amplification of Tollmien-
Schlichting waves as described by linear stability theory, is dominated in
its late stages by three dimensional and non-linear effects. Why then does
9transition occur at a disturbance amplification ratio at of about at a e
(I] as computed from linear instability theory?
The e9 method is rooted in the following observations: Liepmann [2]
hypothesized that at the breakdown to turbulence, the Reynolds stress
T -pu'v' due to the amplified fluctuations becomes comparable in magni-
• Consultant The Rand Corporation,Santa Monica,California; also Professor The
University of California,Los Angeles."0Consultant The Rand Corporation,Santa Monica,California;also Adjunct Professor
The University of California,Los Angeles. Associate Fellow AIAA.
** Adjunct Professor The University of California,Los Angeles.Fellow AIAA.
tude to the maximum mean laminar shear stress T= p(i/ay)" The ratio r/1L
is given by
T/TL [kb(-) a(x]max (1)
where cf is the skin friction coefficient, u' is the disturbance amplitudefL n
at the neutral point, b - vl/ul and k = u'v'/uv, a(x) is the amplification
factor with respect to the neutral point, u and v are velocities in the x and
y direction respectively and prime indicates disturbance values. Obremski
et al. [3] observes that in a low turbulence environment the critical Tollmien-
Schlichting mode at the beginning of amplification may possess an amplitude
U' of the order of 0.001% ue, or perhaps even less; ue is the edge velocity.nee
Furthermore, Klebanoff et al. [4] found, in detailed examination of flat
plate measurements, that disturbance growth via the laminar instability mecha-
nism ceases to be valid when the rms velocity fluctuation v' in the boundary
layer reaches (u/ue) a" = 0.015, but that the first appearance of turbulent
spots is expected at about (u'/ue)max = 0.20. Assuming that these figures
represent disturbance growth not only on a flat plate but aL6o on airfoils
and bodies of revolution, all at low free stream turbulence level, we find
that amplification in the linear regime [(u'/u ) /(u'/u ) z 0.015/0.00001e max n e
1500 z e7.35 ] substantially exceeds the amplification in the nonlinear regime
[0.20/0.015 z 13 = e2 .6]. Total amplification (- 0.20/0.00001) at transition
is seen to be about 20,000 e9 9 ; this amplification is of the same order as
that reported by Michel [5], e 9 " , and computed by Smith et al. [6] and van
Ingen (7] from linear instability theory. This amplification factor is con-
sistent with the hypothesis of Liepmann. If we set T/TL 1, (u'/u )L n e
0.00001,cfL = 0.664R 1"/ 2 with RL 3x10⁶ (for transition on a flat plate),
(u'/v')tr = 0(10) and (uv/u'TV'n tr 0(10) at transition, then eq. (1) gives
4 9.an amplification at transition a(xt z 1.4x10⁴ u • "
. This suggests that
2

in boundary layer flows, where free-stream turbulence is very low, the
growth of Tollmien-Schlichting waves controls the development to turbulent
flow and so linear instability theory can be used as a basis for forecast-
ing transition.
9III. SOME PREDICTIONS FROM STABILITY TMEORY AND THE e METHOD
The factors being considered in this note, for either two-dimensional
or axisymmetric low speed flow are (1) effect of pressure gradient, (2) ef-
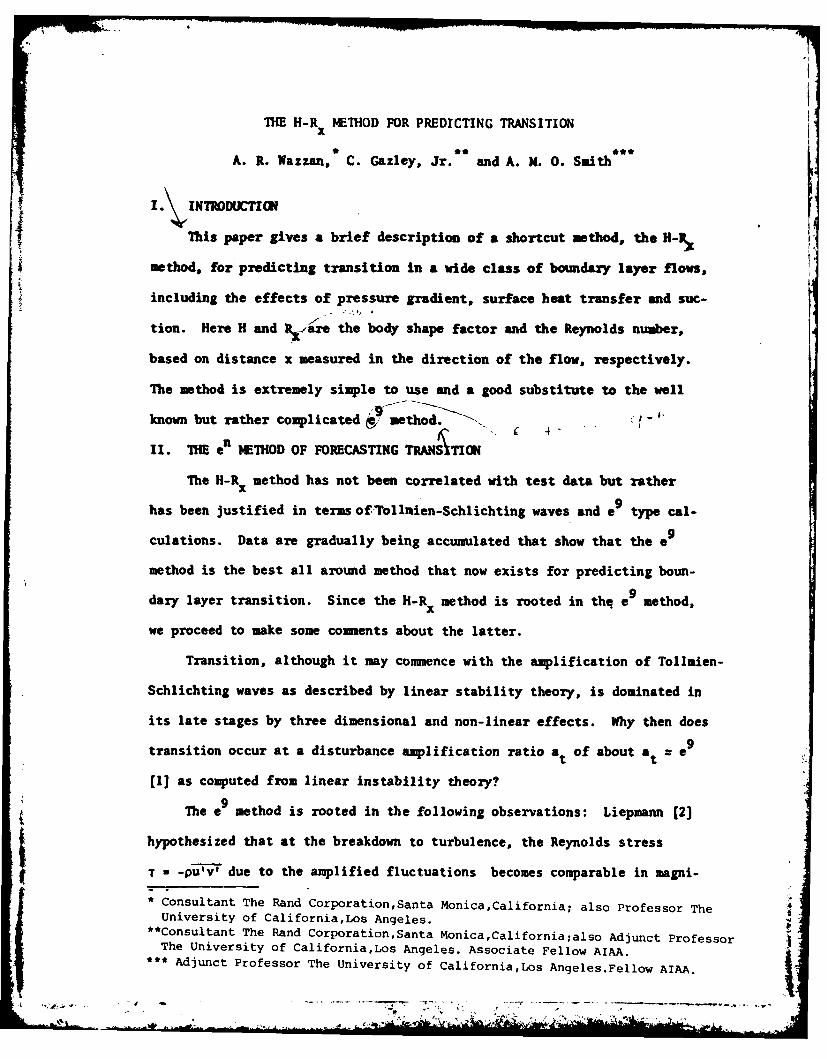
fect of suction, and (3) effect of wall heating or cooling. Figure I shows
the results of calculations of the neutral stability point for wedge and
other flows under a large variety of conditions. It contains results for
an adiabatic flat plate with varying degrees of mass transfer, including
the asymptotic suction case. The largest number of points are for various
wedge flows in water with and without heat. The significant fact is that the
neutral stability point when plotted in the form of the critical Reynolds
number, R6 crit, vs. H, the shape factor, this rather considerable variety
of flows forms a simtte well defined curve. Shape factor is the immediate
determinant of neutral stability rather than some more remote measure such
as Hartree's B or Pohlhausen's A.
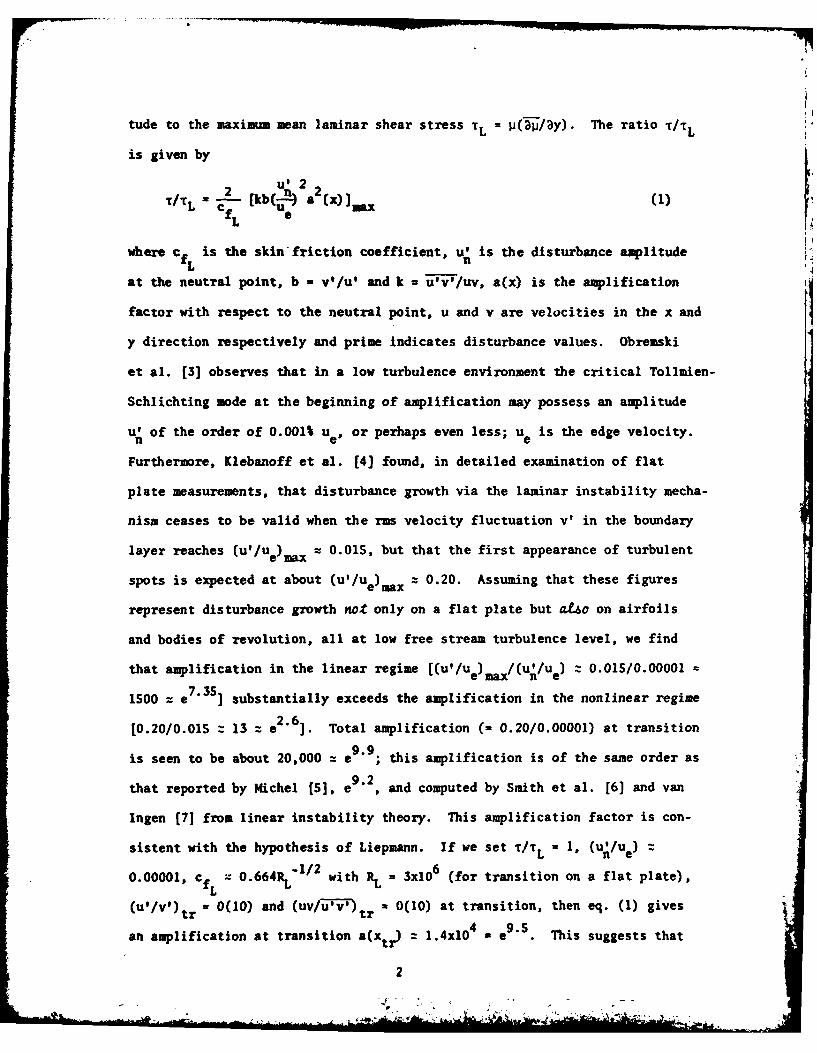
The present authors proceeded to determine if a similar correlation
existed at transition as predicted by the e9 method. Suction was not in-
cluded in the study but a considerable number of wedge flows with various
wall temperatures were studied for water. The results are shown in Figure
2, which also includes the data of Figure 1. But in Figure 2 the calcu-
lated values are plotted in terms of Rx vs. H rather than R,. vs. H. Again,
except for the highest temperature differentials the data form well defined
curves; the scatter is so small that suction effects would undoubtedly
fall along the same curve. The correlation indicates that the neutral and
transition points are primarily a function of H. Pressure gradient, heating
p . ,.*- F .
and suction are only methods of influencing H. The results of Figure 2 are
only for two-dimensional and similar flows, but they suggest a method of
predicting transition: for the conditions of the problem, make a plot of H
vs. Rx, from ordinary boundary layer calculations, as one proceeds back along
the body. The plot will always start beneath the two loci of Figure 2.
9When the curve crosses the e locus, transition should occur. An equation
that fits the e9 locus very will is (for bodies of revolution Rx is replaced
with Rs where s is the distance measured along the surface of the body):
9 23log[RxCeg)] = -40.4557 + 64.8066H - 26.7S38H + 3.3819H$ , (2)x|
2.1 < H < 2.8
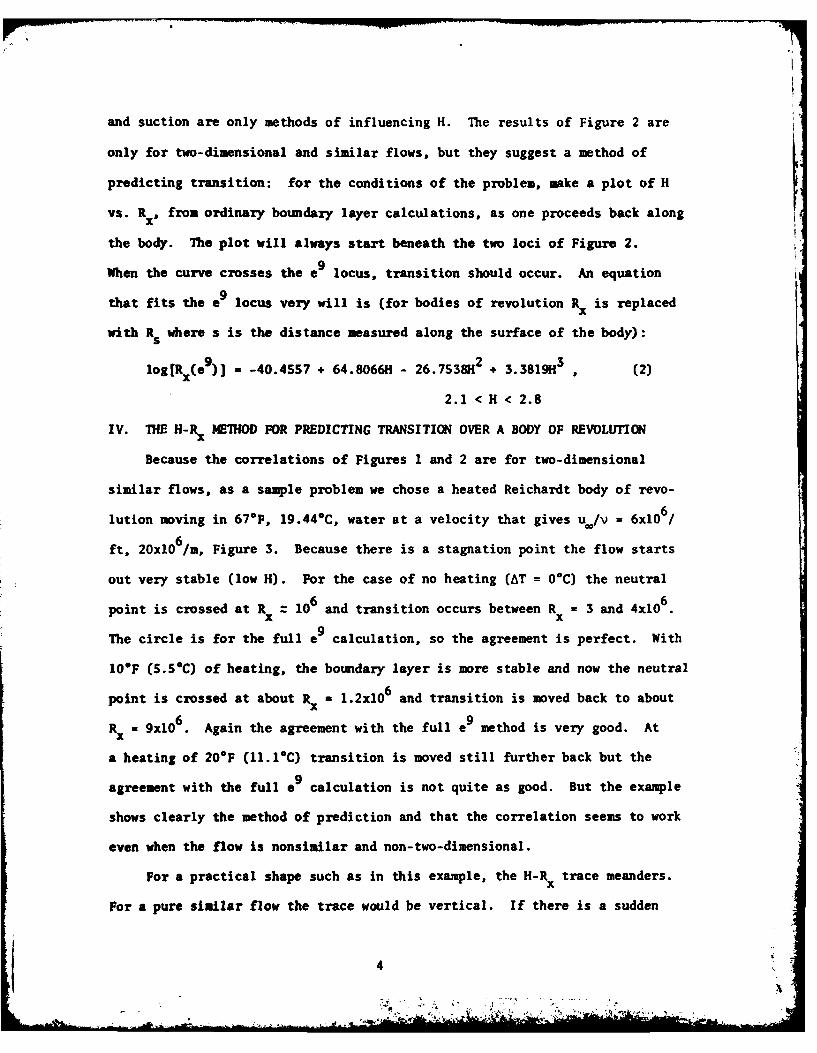
IV. THE H-Rx METhOD FOR PREDICTING TRANSITION OVER A BODY OF REVOLUTION
Because the correlations of Figures 1 and 2 are for two-dimensional
similar flows, as a sample problem we chose a heated Reichardt body of revo-
lution moving in 67*F, 19.44*C, water at a velocity that gives u./v = 6xi06/
6ft, 20x10 /a, Figure 3. Because there is a stagnation point the flow starts
out very stable (low H). For the case of no heating (AT = 0°C) the neutral
point is crossed at Rx = 106 and transition occurs between Rx = 3 and 4x10⁶
The circle is for the full e9 calculation, so the agreement is perfect. With
100F (5.50C) of heating, the boundary layer is more stable and now the neutral
point is crossed at about Rx = 1.2xi06 and transition is moved back to about
69Rx = 9x10 . Again the agreement with the full e9 method is very good. At
a heating of 20"F (11.1C) transition is moved still further back but the
agreement with the full e9 calculation is not quite as good. But the example
shows clearly the method of prediction and that the correlation seems to work
even when the flow is nonsimilar and non-two-dimensional.
For a practical shape such as in this example, the H-Rx trace meanders.
For a pure similar flow the trace would be vertical. If there is a sudden
4
7w. .... . .. . .. .. . .. ...........

change in pressure gradient, suction or heat the trace would be horizontal
for some distance. Note that only ordinary but accurate boundary layer cal-
culations of H vs. R are needed for transition prediction, not lengthy
stability calculations.
V. DISCUSSION
Other simple methods of predicting transition lack the generality of
the H-Rx method because they are correlations based on parameters that are
more removed from the best measure of stability, H. Michel's method for
instance is an excellent correlation method, correlating R~vs. Rx at transi-
tion for two-dimensional incompressible flow, e.g., airfoils. But when
bodies of revolution, heat, or suction are considered the correlation is
no longer applicable. The same kind of trouble applies to methods like
Granville's [8], .whibh correlates with a pressure gradient parameter such
as Pohlhausen's A. Obviously this kind of method fails if other means than
pressure gradients are used to affect transition. Consider a fixed point
on a particular body. That point has one value of A regardless of the degree
of suction or heating. But if H is used as the correlating parameter, changes
at that point in the boundary layer flow, as by heating or suction, manifest
themselves in changes in H. However, we must stress that when there is heat
transfer more than the shape factor is involved, particularly if temperature
differences are high. For instance, in the full e9 method using the extended
Orr-Somerfeld equation [1], additional terms such as d 2/dy2 enter the sta-
bility problem in addition to the basic velocity profile data that determines
H. Note that the correlation is poor at high heating rates where H < 2.1,
Figure 2.
The H-Rx method for predicting transition gives reasonable answers so
long as the flow does not vary too much from nearly similar flow, i.e., local
S

similarity. Also it is applicable only so long as the effects of surface
roughness, vibrations and freestream turbulence level are sufficiently low,
just as required for the basic e9 method. The method is also restricted
to heating rates where Tw-T does not exceed about 23"C.
The correlation has been developed entirely theoretically using the
e 9 method as if it were exact- for predicting transition. No attempt has
been made to develop the correlation from experimental data, partly because
of the labor involved but partly because good test data are quite scarce
for unusual conditions such as heating in water. The main fact that can
be claimed therefore is that the H-R. method is a very convenient substi-
tute for calculating nearly the same results as the full e9 method. Also
of course this sample case is not the only one that has been studied; the
H-Rx method has been used extensively in other studies with plausible predic-
9tions, and a number of other comparisons with the full e method have been
made. Where the flow differs widely from the conditions of the correlation,
a check should be made by the full e9 method. But for a large range of
practical conditions, the H-R method seems accurate, convenient and quitex
general.
6

i,
0
0
1ooAy
0
03
AD
0
WO
102 0
o FLAT PLATE-MASS TRANSFER [910 ASYMPTOTIC SUCTION I101A WEDGE FLOWS-COLD [111v WEDGE FLOWS-HOT, AT w < 22.220 C,
To -19,44 C
101 I I I I I2.0 2.4 2.8 3.2
H
Figure 1

-AT -0
A tT, OF AT,DC
A-0.15 0-30 0-17a -0.10 0-30 0-17*-0.05 0-30 0-17*0 0-30 0-1760.10 0-30 0-17 i
lo - * 0.20 0-110 0-43* ~ *0.40 0-120 0-49
0. 46
Re~e 106- R)A
io5 HEATED WEDGEFLOWS IN WATE\R
10-T 670 F, 19.440 C
1031 21 1-1 tIi i i i19 2.1 2.3 2.5 2.7 2.9 3.1
H - P/0
Figure 2

io8 ReXC~ \Re ( 9 )Xci\ Me
300\250
10 200\150
Re ~ 100
1
0\
2.0 2 5.40 2.6 2.
H -6*/0
F~igure 3

REFERENCES
1. Wazzan, A. R., Gazley, C., Jr., and Smith, A. M. 0., "Tollmien-Schlichting
Waves and Transition", Prog. Aerospace Sci., Vol. 18, pp. 351-392, Per-
gamon Press, London 1979.
2. Liepmann, H. W., "Investigations of Laminar Boundary-Layer Stability and
Transition on Curved Boundaries", NACA Adv. Conf. Rept. No. 3130, later
W-107, 1943.
3. Obreaski, H. J., W4rkovin, M. V., Landahl, M., with contributions from
Wazzan, A. R., Okamura, T. T., and Smith, A. N. 0., "A Portfolio of
Stability Characteristics of Incompressible Boundary Layers", AGARDO-
GRAPH No. 134, NATO, Paris, 1969.
4. Klebanoff, P., Tidstrom, K. D., and Sargent, L. M., "The Three-Dimensional
Nature of Boundary Layer Instability", J. Fluid Mech., Vol. 12, 1962,
pp. 1-34.
5. Michel, R., "Etude de la Transition sur les Profils d'aile-Establissement
d'un Point de Transition et Calcul de la Trainee de Profil en Incompress-
ible", ONERA, Rapport 1/1758A, 19S1.
6. Smith, A. N. 0., and Gamberoni, H., "Transition, Pressure Gradient and
Stability Theory", Douglas Aircraft Company, Long Beach, CA, Report
ES26388, 1956.
7. van Ingen, J. L., "A Suggested Semi-Empirical Method for the Calculation
of Boundary Layer Transition Region", Univ. of Technology, Dept. of Aero.
Engr., Delft, The Netherlands, Report VTH-74, 1956.
8. Granville, P. S., "Comparison of Existing Methods for Predicting Transi-
tion from Laminar to Turbulent Flow on Bodies of Revolution", Naval Ship
Research and Development Center, TN 111, 1968.
7

9. Tsou, F. K., and Sparrow, E. M., "Hydrodynamic Stability of Boundary
Layer with Surface Mass Transfer", Appl. Sci. Res., Vol. 22, 1970,
pp. 273-286.
10. Hughes, T. H., and Reid, W. H., "On the Stability of the Asymptotic
Suction Boundary Layer Profile", J. Fluid Mech., Vol. 23, 1965, pp.
71S-73S.
11. Wazzan, A. I., Okazura, T. T., and Smith, A. M. 0., "Spatial and
Temporal Stability Charts for the Falkner-Skan Boundary Layer Profiles".
Douglas Aircraft Company, Long Beach, CA, Report No. DAC-6708, Sept.
1968.
8

LIST OF FIGURES
Figure I Critical Reynolds number R, *cdit vs. H.
Figure 2 Critical and transition (computed) Reynolds number for adiabatic
and heated wedge flows in water. 0 is Hartree's 0
Figure 3 Paths of bounday-layer deve lopment (H vs. V~ and predicted
transition for a 13:1 Reichardt body. Comparison with heated
wedge-flow predictions. Circles denote point where Re s(eg) is
reached, u.,/v a 64106 /ft, 20xl10 6 /a. s is length measured along
the body surface.