Embed Size (px)
Citation preview

FruitLook Manual V5 – January 2019
Contact us for more information via: [email protected] or 074 322 6574

Content of this Manual
This manual will provide a 6-step basic introduction on FruitLook:
Step 1: Register to FruitLook (Once Only) Step 2: Place your fields orders A. New field orders B. Duplicate fields from other seasons C. Order single field from field database D. Delete fields from your account Step 3: Analyse your fields A. MyFields Overview B. MyFields C. MyField Analysis Step 4: Export data to Excel or other software Step 5: FruitSupport Step 6: Get more information on FruitLook

STEP 1 Register to FruitLook (Once only)
Contact us for more information via: [email protected] or 074 322 6574

Step 1: Register to FruitLook (only once)
Select
“Register for free”
on the FruitLook homepage

Step 1: Register to FruitLook (only once)
1. Fill in the registration form. The fields with an * are obligatory.
2. Remember to tick Yes to subscribe to the newsletter.
3. You registration will only be saved if all the terms and conditions have been ticked.
4. Press “Save” at the bottom of the form when you have completed your details.
5. FruitLook will send you an email with a link to confirm your registration. Please confirm your registration by pressing this link.1
1 Please note: Your confirmation email might end up in your spam-folder (especially if you use gmail, hotmail or icloud) . If you have not received a confirmation email please check your spam-folder. If you cannot find your email there, contact us via [email protected] and we will help you.
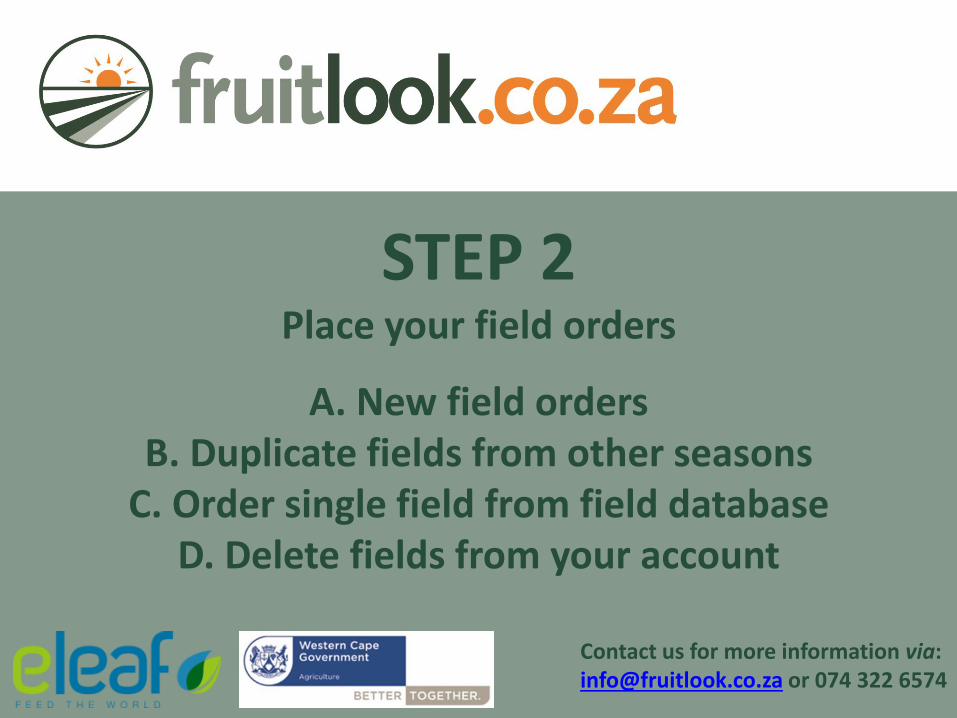
STEP 2 Place your field orders
A. New field orders B. Duplicate fields from other seasons
C. Order single field from field database D. Delete fields from your account
Contact us for more information via:
[email protected] or 074 322 6574

PLEASE NOTE: AVAILABILITY OF DATA DIFFERS PER YEAR
The monitoring area of FruitLook expanded over the years. Data is ONLY available for the year of choice during the order process if it was captured inside the monitoring area of the respective FruitLook season.
The following seasons are available:
2010-11 to 2014-15 2015-2016 2016-2017 Current extent available from 2017-18

1. Select “Add new field” on the homepage
This button will open the screen shown on the right.
2. Select how you want to delineate your fields:
a) Draw
b) Select a plot (default)
c) via a Shapefile
Step 2: Place your field orders A. New field orders

1. Navigate to your field via the viewer. You can also fill in your address in the address bar above the map. Keep the “, ZA” at the end as there could be a town/area in another part of the world. Zoom in until the green field boundaries appear.
2. Once the green field boundaries appear you can select your field by a click of your mouse > if required you can alter field boundaries by moving the white dots.
3. Fill in a field name. Use the preferable convention {cultivar name} followed by {block name/number}
4. Then, add a category (e.g. Farm name) select a crop type and the seasons you want to order data for.
5. Select “Add to Cart” at the bottom of the screen to add your field to your shopping cart.
Step 2.A.a Select a plot
Zoom in to your field until you see the green field boundaries appear.

1. Select “Draw” to manually draw in the boundaries of your field.
2. Zoom to your field using the viewer. You can also fill in your adress in the adress bar above the map
3. To draw your field, you “click” along the borders of the field. Once you have completed the drawing, you can still make changes by moving the white dots.
4. Once you are satisfied, fill in a field name, category, crop type and the season(s) of interest.
5. Click the “Add to cart” button.
Step 2.A.b The “draw” tool
Minimum size of a block is 0,5ha

1. Select “Shapefile” in the “Add your field”-screen -> if you are interested in uploading multiple fields at once.
2. A new screen will open with instructions to upload a shapefile successfully. Please follow
these carefully.
3. After compressing your shapefile into a zip file, upload it using the “Choose File” option, followed by “Import”.
4. If you require help with this, please contact us.
Step 2.A.c Adding fields using a Shapefile

1. Once you pressed “upload” more details will appear where you can select the season(s) you want to order data for. Once you have selected these, click “Add to cart”
2. All the shapes field details will appear below where you can review the name, category and crop and make the necessary changes, if needed, before clicking on “Add to cart”.
Step 2.A.c Adding fields using a Shapefile

Step 2: Place your field orders A. New field orders
1. After pressing “Add to cart” a message
will appear saying*
“The field “X” has been added to your shopping cart. Add another field below or proceed to the checkout” 2. You can either choose to:
a) delineate a new field and add this one to the cart as well. This is done through the same steps as described in the previous slides.
b) Or proceed to the “Checkout”. This
will open a new screen, which contains the shopping cart showing your field orders.
* except when loading via a shapefile which will take you directly to “Checkout”

Step 2: Place your field orders A. New field orders – Additional product (optional) - FruitSupport
1. Once you clicked on “Checkout” you access the “Shopping cart”. Here you will see (right at the top)
the Additional product: FruitSupport. Subscribe to this by clicking on “Add to cart”.
2. Select the fields you want FruitSupport to assist with. Scroll down the list and click on “Add to cart”. A field can only be added once.
3. Note: FruitSupport is only available in-season, for the current season. Read more about it on page 40.

Step 2: Place your field orders A. New field orders
By clicking “Checkout” you access the shopping cart. Here, you have two options: 1) You continue adding more fields by clicking
the button. By pressing this button you will return to the “Add your field”-screen.
2) You are done adding fields and want to
order your data:
• Select “I agree with the terms” (there will be 2 if you added the FruitSupport)
• Press “Order”
A pop-up will appear to thank you for your order. Your products will be available in “MyFields Overview” in maximum 30 minutes (continue to Step 3 of this Manual) Note: After you have placed your order you will receive an email with an invoice for your order, indicating that the data is provided free of charge (cost = 0 Rand).

1. Go to your “MyFields Overview”-page or by clicking on “MyFields”.
2. Select “Add fields from other seasons” in the submenu at the bottom of the page.
3. Select the season you want to copy fields from and the season(s) you want to copy these fields to. All fields of this season, with the same crop type and category, will be duplicated to your season of interest.
4. Once you have selected your season(s), press “Add fields”. This will instantly move you to the shopping cart.
5. In the shopping care you cannot change field outlines, crop types, etc. You can however, remove fields from the ordering list by pressing the -button behind each specific field.
6. When satisfied, select “I agree with the terms” and subsequently press “Order” to order all your fields for the new season.
7. If you are ordering a new season – remember to add FruitSupport as well.
Step 2: Place your field orders B. Duplicate fields from other seasons
You can reorder fields from season to season so you don’t have to draw in your fields again. To do so:

1. Go to your “MyFields Overview”-page or by clicking on “MyFields”.
2. Select “Add single field from database” in the submenu at the bottom of the page.
3. This button will open your field database, which consists of fields ordered in past seasons (hence some repititions).
4. If you want to order a field for the new season, go to this field and press “add this field”.
5. This will open the “Add your field”-page. You will see your field delineated. You can make adjustments if required. Make sure your field name is correct and your crop type and season are selected. Subsequently press “Add to cart”.
6. Follow the remaining order process.
Step 2: Place your field orders C. Order single field from field database

1. In the “MyFields Overview” page, select “Delete fields from list”.
2. Select the field(s) you want to delete by ticking the box across from the field name. Scroll to the bottom of the list and click on
3. A pop-up will appear. Select “Ok” to delete the selected field(s), or “Cancel” to not delete the field. After you press “Ok” the field will be deleted for the selected season.
Note: If you accidently delete a field you can re-order it again.
Step 2: Place your field orders D. Delete fields from your account

STEP 3 Analyse your fields
A. MyFields Overview B. MyFields
C. MyField Analysis
Contact us for more information via: [email protected] or 074 322 6574

Step 3: Analyse your fields
To view your ordered data, select “My fields” > this will direct you to the MyFields Overview page.

Step 3: Analyse your fields A. MyFields Overview
MyFields Overview • The table shows the dataset values for the last week • You can view the field details in “MyFields” by clicking the field within the table.
Filter the fields you see in the table, for example
only show apricots, or only the fields of a
certain category. You can also view different
weeks.
Change the datasets visible in the table. You can choose a minimum of 1 and a maximum of
5.
Smart Export of Field Data to Excel: Further explained in Step 4 of
this Manual.
You can sort fields according to ascending or
descending values
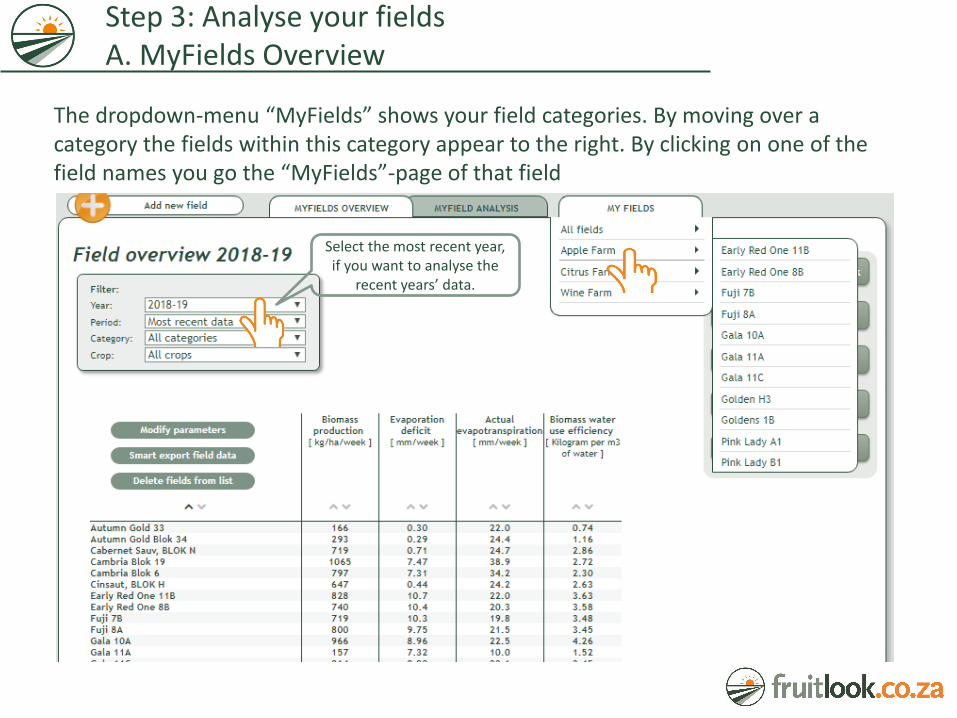
The dropdown-menu “MyFields” shows your field categories. By moving over a category the fields within this category appear to the right. By clicking on one of the field names you go the “MyFields”-page of that field
Step 3: Analyse your fields A. MyFields Overview
Select the most recent year, if you want to analyse the
recent years’ data.

Step 3: Analyse your fields B. MyFields
By selecting a specific field through “MyFields” or “MyFieldsOverview” you can view the details of individual fields.
Field details can be added here
You can change your field name and category here You can change your crop type
here

Toggle between table or graph view
Average field values per week
Description of map
Change background view to satellite or hybrid (combination of
satellite and map) for better orientation
Step 3: Analyse your fields B. MyFields via MyFields Overview
Select a specific pixel to see its exact value
Select “Growth”, “Moisture” or “Mineral” data products. “My Selection is the same as the
datasets you choose to view in MyFieldsOverview
The histogram displays the variation in your field. Would like
to see variation in your fields more clearly? You can adjust the
legend by moving the sliders below the histogram. Press
"Recalculate" to alter the legend, press "Reset" to go back to the
original scale.
Select to edit your fieldshape. Your fieldshape cannot be changed
more than 5%.
Click here for a short description of what the dataset means.

Step 3: Analyse your fields B. MyFields via MyFields Overview
Temporal variation: Each dot represents the average value (calculated from the different colours in the picture below) of your field for a specific week. You can select each dot to see the spatial variation in the picture for that specific week.
Spatial variation: Shows an overview of your field. Can be used to detect heterogeniety in your field.

• “MyField Analysis” allows you to compare different datasets and fields over time and for different years.
• In “MyField Analysis” you can use: a) “Graph Comparison” – “graphical curves” b) “Field Comparison” – “picture comparison”
• In the next slides both functionalities are explained.
Step 3: Analyse your fields C. MyField Analysis

Use the “Graph comparison” tool in “MyFields Analysis” to view and compare temporal changes of various fields in one graph. It is important to select the different “tabs” in the right order, otherwise it will reset the previous sections. Start from the top left and end bottom right.
1. Select season 2. Select field category
3. Select Field
Step 3: Analyse your fields C. MyField Analysis – Graph Comparison
By pressing “Add to graph”, the temporal development of the selected datasets of the selected field is depicted in a graph. Within the graph you can view simultaneously:
• Multiple fields • Multiple seasons • A maximum of two datasets
4. Select dataset

Legend
Timeframe for data display –
anywhere between Aug
and Jul
Vertical axis of first dataset
displayed; in this case biomass production
The dots display the value per dataset through time. By moving over the dots field information for that specific period will appear. By clicking
the dot the spatial overview of that field at that specific time will open in “MyFields”. Note, these graphs are exactly the same as those displayed
under “MyFields”
Step 3: Analyse your fields C. MyField Analysis – Graph comparison
In this example three fields from the Grabouw area are compared for the 2017-18 season. The deviating trend in field Grabouw3 is clearly visible.

Legend; different datasets of the same field always have
the same color. The Biomass Production is displayed with
circular icons, the Evapotranspiration Deficit
with square icons.
Vertical axis of second dataset; in this case Evapotranspiration Deficit in mm/week
Step 3: Analyse your fields C. MyField Analysis – Graph comparison
In this example Biomass Production and Evapotranspiration Deficit of a field in Hexriver Valley are compared for the 2017-18 season. The decreases in Biomass Production corresponds clearly with the increases in Evapotranspiration Deficit.
Vertical axis of first dataset; in this case Biomass Production in kg/ha/week

Step 3: Analyse your fields C. MyField Analysis –Comparing different fields
By pressing “Add”, the spatial development of a specific dataset is depicted through time in the “MyField Analysis”-page (next slides). Within the display you can simultaneously view:
• Multiple fields • Multiple seasons • With no limit on datasets
Use the “Field comparison” tool in “MyFields Analysis” to view and compare spatial and temporal changes in various fields, through pictures. It is important to select the different tabs in the right order otherwise it will reset your selections.
1. Select season 2. Select field category
3. Select Field 4. Select dataset
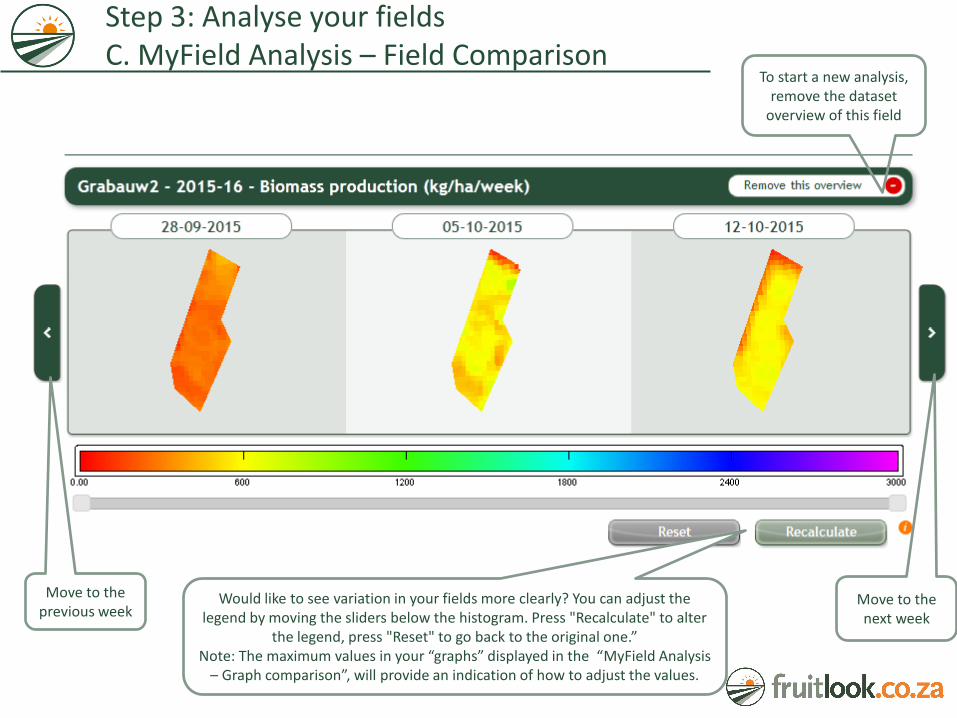
To start a new analysis, remove the dataset
overview of this field
Move to the next week
Move to the previous week
Would like to see variation in your fields more clearly? You can adjust the legend by moving the sliders below the histogram. Press "Recalculate" to alter
the legend, press "Reset" to go back to the original one.” Note: The maximum values in your “graphs” displayed in the “MyField Analysis
– Graph comparison”, will provide an indication of how to adjust the values.
Step 3: Analyse your fields C. MyField Analysis – Field Comparison

Compare two fields
Some Notes: Week 06-02-2012: Low(er) biomass production in both fields Week 13-02-2012: Low(er) biomass production in Jonkershoek only Week 20-02-2012: Biomass production increased in both fields Note the spatial variation visible
Step 3: Analyse your fields C. MyField Analysis – Field Comparison

Compare two datasets
Typically, a strong relationship exists between biomass production and actual evapotranspiration. Again, note the spatial variation visible.
Step 3: Analyse your fields C. MyField Analysis – Field Comparison

STEP 4 Export data to Excel or other software
Contact us for more information via: [email protected] or 074 322 6574

Step 4: Export data to Excel or other software
You export your field data to Excel in the “MyFields”-overview page. This is ideal if you want to integrate the FruitLook data with your own datasets (e.g. Production, etc.). To do so : 1. Go to “MyFields Overview”. 2. Select “Smart export field data”. 3. A pop-up will appear allowing you to select the appropriate season, field(s) and
datasets.

Step 4: Export data to Excel or other software
1. After selecting “Smart Export field data” a pop-up will appear where you select the appropriate season, field(s) and datasets. Note: you can only export the data from one season at a time.
2. After making your selection press “Export data” to export a .csv file of your selected field data.
3. This .csv file provides the average value per timestep for each dataset and field selected. Note: this data is equivalent to the data from each graph.

Step 4: Export data to Excel or other software
FruitLook data can be exported to Excel in “MyField Analysis” as well. To do so : 1. Go to “MyField Analysis”. 2. Add your field and datasets 3. Press “Export CSV” to export the displayed fields and datasets. 4. Open the produced .csv in Excel.

Step 4: Export data to Excel or other software
1. Select the “Data” tab 2. Press “Text to Columns” 3. Select “Delimited” in the pop-up
4. Press “Next” 5. Select “Comma” as delimiter 6. Press “Finish”
This describes how to open a .csv file in Microsoft Excel 2010+ for the first time. After opening the .csv in Excel:
The data is now presented in columns. Subsequently save your data in .xlsx format.

Step 4: Export data to Excel or other software
The pivot functionality was developed due to a need to compare more than one parameter a week as well as the progress of various blocks over the season. This tool can be especially useful for your seasonal analysis. So how can you start using pivot tables yourself? There are three things needed (each header is a link, when clicked on the relevant document will open): 1. The script: The pivot tables are created via a .bas-file, which has specified instructions on how this pivot table can be created from the FruitLook export. Please read the instructions (see next point) carefully before running the script (Pivotize.bas). Do not directly run it after downloading - you will see in the instructions where it is applicable. 2. The Pivotize manual: The manual provides a step-by-step instruction to transform your FruitLook csv into an easy-to-use pivot table. If you need help, don't hesitate to contact us. 3. An example: The charts are set up to compare the four weekly parameters and the four instantaneous parameters with each other. In the created document you can either view all 4 weekly parameters (Biomass production, Actual Evapotranspiration, Evapotranspiration Deficit, and Biomass Water Use Efficiency), or all 4 instantaneous parameters (Vegetation Index, Leaf Area Index, Upper Leaf Nitrogen, and Total Plant Nitrogen), as well as a summary of each of the parameters in their respective tabs. The graph page can be printed for reporting purposes with all the blocks in the 4 charts as the same colour allowing easy identification. The pivot functionality was developed due to a need to compare more than one parameter a week as well as the progress of various blocks over the season. If you need any help, please do not hesitate to contact us via [email protected] or call us on (+27) 074 322 6574.
Pivot tables for seasonal analysis

• FruitSupport is a complementary service as part of FruitLook, tracking growth variation in your block.
• A strong increase in variation in growth might indicate a problem, possible affecting your yield. FruitSupport sends out a warning email at the end of a week (once the new FruitLook data has been updated online) if anomalies are detected.
• You can order FruitSupport per field using the FruitSupport service-tab on the homepage or when ordering fields.
• When using FruitSupport we invite
you to provide us feedback via [email protected].
PLEASE NOTE: FruitSupport is a support tool based on satellite information and not a replacement for in-field inspections.
Step 5: FruitSupport

FruitSupport tracks the variation in growth throughout the growth season, depicted in the graph on the right. The development of variation through time is depicted in green. As can be seen this blocks shows a strong increase in relative variation from the middle of the growth season onwards, which might indicate a growth issue. This is even more likely considering the drop in biomass production, depicted on the left axis, which occurs simultaneously to this increase in variation.
Step 5: FruitSupport
If such an increase is detected, a warning email is send. An example email is depicted on the left. Within this email you can click on the name of the detected blocks opening the FruitLook website for this specific block.
FruitSupport is run on a weekly basis after the weekly data products have become available on the FruitLook website. This means you will receive one email per week from FruitSupport.

STEP 6 Get more information from FruitLook
A. Background articles B. View demonstration fields
C. Dataset descriptions D. Newsletter + Website news section
E. Contact us!
Contact us for more information via: [email protected] or 074 322 6574

Many articles have been written
on (the use of) FruitLook through the last 10 years.
A selection of
these articles can be found under “See more..” on
the website
Step 6: Get more information about FruitLook A. Background Articles

Each article can be opened by
clicking the article name
Step 6: Get more information about FruitLook A. Background Articles

The demoblocks shows what type of information is
available on FruitLook.
To see the same
kind of information for
your own fields/farm, you need to register and draw your
fields (Step 1 to 3 of this Manual).
Step 6: Get more information about FruitLook B. View demonstration fields

Step 6: Get more information about FruitLook C. Dataset descriptions
On the homepage: Select “Growth”, “Moisture” or
“Minerals” for a descriptions of the FruitLook datasets and
example uses.

You can remain up to date on FruitLook by reading our monthly FruitLook newsletter
and the FruitLook news section.
This newsletter is send once a month during
the growth season and contains information
on new developments, upcoming events and examples of FruitLook
data use.
The news section also informs you on the ins and outs of FruitLook
and upcoming training sessions.
Step 6: Get more information about FruitLook D. Newsletter + Website news section

Thanks for reading through this Manual.
For more help, suggestions, feedback, comments, questions, remarks….
contact [email protected]
Have a fruitful season!
Step 6: Get more information about FruitLook E. Contact us!