Embed Size (px)
Citation preview

Fructose 1-phosphate is the one and only physiological effectorof the Cra (FruR) regulator of Pseudomonas putida
Max Chavarría a,b, Gonzalo Durante-Rodríguez a, Tino Krell c, César Santiago d, Jan Brezovsky e,Jiri Damborsky e, Víctor de Lorenzo a,⇑a Systems and Synthetic Biology Program, Centro Nacional de Biotecnología (CNB-CSIC), Cantoblanco, Madrid 28049, Spainb Escuela de Química, Universidad de Costa Rica, 2060 San José, Costa Ricac Department of Environmental Protection, Estación Experimental del Zaidín, CSIC, C/Profesor Albareda, Granada, Spaind X-ray Crystallography Unit, Centro Nacional de Biotecnología (CNB-CSIC), Cantoblanco, Madrid 28049, Spaine Loschmidt Laboratories, Department of Experimental Biology and Research Centre for Toxic Compounds in the Environment (RECETOX), Faculty of Science, Masaryk University,Kamenice 5/A13, 625 00 Brno, Czech Republic
a r t i c l e i n f o
Article history:Received 14 March 2014Revised 31 March 2014Accepted 31 March 2014
Keywords:CraFruRPseudomonas putidaFructose 1-phosphateFructose operon
a b s t r a c t
Fructose-1-phosphate (F1P) is the preferred effector of the catabolite repressor/activator (Cra)protein of the soil bacterium Pseudomonas putida but its ability to bind other metabolic intermediatesin vivo is unclear. The Cra protein of this microorganism (CraPP) was submitted to mobility shift assayswith target DNA sequences (the PfruB promoter) and candidate effectors fructose-1,6-bisphosphate(FBP), glucose 6-phosphate (G6P), and fructose-6-phosphate (F6P). 1 mM F1P was sufficient to releasemost of the Cra protein from its operators but more than 10 mM of FBP or G6P was required to freethe same complex. However, isothermal titration microcalorimetry failed to expose any specific inter-action between CraPP and FBP or G6P. To solve this paradox, transcriptional activity of a PfruB-lacZfusion was measured in wild-type and DfruB cells growing on substrates that change the intracellularconcentrations of F1P and FBP. The data indicated that PfruB activity was stimulated by fructose butnot by glucose or succinate. This suggested that CraPP represses expression in vivo of the cognatefruBKA operon in a fashion dependent just on F1P, ruling out any other physiological effector.Molecular docking and dynamic simulations of the Cra-agonist interaction indicated that bothmetabolites can bind the repressor, but the breach in the relative affinity of CraPP for F1P vs FBP isthree orders of magnitude larger than the equivalent distance in the Escherichia coli protein. Thisassigns the Cra protein of P. putida the sole role of transducing the presence of fructose in the mediuminto a variety of direct and indirect physiological responses.� 2014 The Authors. Published by Elsevier B.V. on behalf of the Federation of European Biochemical Societies. This
is an open access article under the CC BY-NC-ND license (http://creativecommons.org/licenses/by-nc-nd/3.0/).
1. Introduction
The enterobacterial catabolite repressor/activator (Cra) proteinis a pleiotropic regulator that controls expression of a large numberof metabolic genes in response to the flux of central glycolyticintermediates [1,2]. In particular, the Cra protein of Escherichia coli(CraEC) represses transcription of genes such as fruB, pfkA, pykA,pykF, acnB, edd, eda, mtlADR and gapB [1,3–6] while stimulating
expression of others e.g., ppsA, fbp, pckA, acnA, icd, aceA, and aceB[1,7–10]. The Cra protein was first identified as repressor of thefructose operon (fruBKA; [11]) thereby the earlier (and synony-mous) name FruR. But, which is the metabolite sensed by Cra,the levels of which report on the status of carbon metabolic fluxes?
The first hints to answer this question came from a number ofstudies published in the 90s demonstrating that the effects of Craon transcription can be counteracted in vitro by lM levels of fruc-tose-1-phosphate (F1P) as well as by concentrations of fructose-1,6-bisphosphate (FBP) above 5 mM [1,4,11,12]. However, theresponse of CraEC to high levels of FBP has been a matter of contro-versy in the literature, as some studies have suggested that in vitroassays of the regulator to this effector could be misleading due tocontamination with F1P [11]. In contrast, other Authors claim thatFBP is a genuine CraEC effector [4,13] and that the glycolytic flux of
http://dx.doi.org/10.1016/j.fob.2014.03.0132211-5463/� 2014 The Authors. Published by Elsevier B.V. on behalf of the Federation of European Biochemical Societies.This is an open access article under the CC BY-NC-ND license (http://creativecommons.org/licenses/by-nc-nd/3.0/).
Abbreviations: Cra, catabolic repression/activation protein; F1P, fructose-1-phosphate; FBP, fructose-1,6-bisphosphate; G6P, glucose 6-phosphate; F6P,fructose-6-phosphate; ITC, isothermal calorimetry⇑ Corresponding author. Address: Centro Nacional de Biotecnología – CSIC,
Campus de Cantoblanco, Madrid 28049, Spain. Tel.: +34 91 585 4536; fax: + 34 91585 4506.
E-mail address: [email protected] (V. de Lorenzo).
FEBS Open Bio 4 (2014) 377–386
journal homepage: www.elsevier .com/locate / febsopenbio

Author's personal copy
E. coli is sensed by the interaction of the CraEC with FBP indepen-dently of the carbon source used [13,14]. However, the functionsof Cra in other species are less clear, as the regulator is also presentin bacteria that hardly adopt a metabolic regime (i.e., no glycolyticactivity) that produces high FBP levels.
The metabolically versatile soil bacterium Pseudomonas putidais one of such cases. In one hand, the central biochemical routesgenerate F1P only when cells grow on fructose (Fig. 1a and Supple-mentary Fig. S1; [15]). Moreover, as this bacterium lacks phospho-fructokinase, FBP can be produced exclusively only either anupward reaction of trioses back to their cognate hexose, or byphosphorylation of fructose 1-P by FruK (Fig. 1a). Structural, bio-chemical and biophysical studies have revealed that the Cra pro-tein ortholog of P. putida strain KT2440 (CraPP; 74% similarity and48% identity with the CraEC; [16]) regulates the fruBKA operon(Fig. 1b) encoding the fructose phosphotransferase system PTSFru
[16,17] and also that F1P is its preferred metabolic effector [16].Specifically, electrophoretic mobility shift assays (EMSA) showedthat as little as 1 lM of F1P prevented binding of purified CraPP
to the PfruB promoter DNA. In contrast no effects on the CraPP-DNA complex were brought about by any other metabolite testedat the concentrations up to 1 mM. Isothermal titration calorimetry(ITC) experiments with the same protein revealed also that F1Pbinding to CraPP occurs with a 1:1 stoichiometry and a very highaffinity (KD �200 nM). But consistently with the EMSAexperiments, neither FBP nor glucose-6-phosphate (G6P)generated any ITC signal when mixed with CraPP [16]. Finally,while diffracting CraPP-F1P co-crystals are easy to produce, it hasnot been possible thus far to generate CraPP-FBP counterparts.Taken together, the data above suggest that there is no interactionof FBP with the CraPP protein, at least at effector concentrations
61 mM. Still, the literature reports that intracellular pools of FBPand other glycolytic intermediates can go in bacteria up to>15 mM under some physiological conditions [18]. Therefore, thepublished experiments do not altogether rule out that other com-pounds can also be physiological effectors of CraPP.
In view of the uncertainly on the role of FBP as agonist of CraPP
we set out to clarify unequivocally the nature of the metabolic sig-nal that lets this regulator to detach in vivo from its genomic bind-ing sites. By using a suite of biochemical, computational andgenetic approaches we show that no metabolite other than F1Pmay act as an effector of CraPP. Since F1P is generated in P. putidaexclusively from exogenously added fructose, we argue that CraPP
is the main transducer of the presence of this sugar in the mediuminto up/down downregulation of a large number of genes, whetherdirectly (i.e., via interaction with genomic CraPP-binding sites) orindirectly through the action of proteins of the PTSFru systemencoded by fruBKA.
2. Results and discussion
2.1. Binding of CraPP protein to DNA fragments containing single anddouble operators
The conditions of reference for examining the influence ofvarious glycolytic intermediates in the attachment of CraPP to itsgenomic operators [16] is shown in Fig. 2a. The test involves 3components: the CraPP protein purified to homogeneity [16], a290 bp radioactively labeled DNA fragment spanning the singleoperator for the regulator found in the PfruB promoter (Fig. 1b;[16,17]) and F1P as an effector. Consistently with previous data(i) as little as 50 nM protein suffices to bind 100% of the target
Fig. 1. Metabolic regulation of the fructose operon of P. putida. (a) Generation of F1P and FBP upon entry of hexoses in the metabolic network of P. putida. F1P is producedfrom extracellular fructose, which enters the cell through the PTSFru system (FruBA). FBP is generated also from fructose by phosphorylation of F1P by FruK. When growing onglucose or succinate the lack of phosphofructokinase [15] makes FBP to be produced exclusively through a back reaction of trioses into hexoses. Relevant enzymes andtransformations are indicated (see Supplementary Fig. S1 for an expanded metabolic map). (b) Regulatory region of the fruBKA operon of P. putida. Note the organization of thegenes and the PfruB promoter containing one Cra operator (the quasi-palindromic 50TTAAACGTTTCA30 sequence in red). While F1P de-represses the promoter by releasing Crabinding to PfruB, the role of FBP is less clear. Numbers flanking the operon indicate the genomic coordinates of the fruR fruBKA operon of P. putida KT2440.
378 M. Chavarría et al. / FEBS Open Bio 4 (2014) 377–386

Author's personal copy
DNA (KD = 26.3 ± 3.1 nM; [16]) and (ii) the presence of F1P releasesmost of the DNA-CraPP complex and impedes such a completebinding to occur in vitro, even at the highest concentrations ofthe regulator. The data of Fig. 2a is also consistent with the bindingto one single-site operator, as present in the DNA probe employed,at least through CraPP levels 5–500 nM. Given the extraordinarysensitivity of the EMSA test, we used the same setup for examiningthe potential of other glycolytic intermediates i.e., FBP and G6P toact also as agonists of the same regulator. To this end we repeatedthe conditions of the experiment of Fig. 2a but using mM concen-trations of each of the candidate effectors. Note that the bindingmixtures contain 50 nM of purified His6-CraPP [16], 0.05 nM ofthe labeled DNA fragment and 1–15 mM of each potential agonist(Fig. 2b). Therefore the effectors are in large molar excess, up to3 � 105-fold. The gel of Fig. 2b shows that while FBP had no detect-able effect on the stability of the CraPP-DNA interaction, G6P wasable to partially dissociate the complex at its highest concentra-tions i.e., P10–15 mM. A third glycolytic intermediate, fructose-6-P (F6P) was tested as well, but we did not observe any effect inthe stability of the CraPP-DNA interaction even when added tothe binding reaction at the highest concentration (not shown).
Although the results of Fig. 2 were observed at very high effec-tor levels, they do open the possibility that F1P could not be theonly CraPP agonist. Since increasing further the concentrations ofCraPP, FBP or G6P in the assays for verifying such a possible out-come would make little physiological sense we resorted to a differ-ent strategy for amplifying the sensitivity of the binding assay. Tothis end, we employed a DNA sequence containing two operators
for Cra instead of the one used before. The rationale of this choiceis that one can expand the effector sensitivity of a regulatorydevice by changing the affinity of the cognate transcription factor(TF) for DNA rather than altering the effector-protein interactionproper. In this way, a residual responsiveness of the TF to an effec-tor becomes well detectable if the affinity for the target operator isartificially enhanced [19]. In our case, the alternative probe is a290 bp DNA fragment corresponding to the regulatory region offructose operon of E. coli (Supplementary Fig. S2) which isknown to contain two site (O1 50TGAAACGTTTCA30; O2 50TGAATCGTTTCA30) that are cooperatively bound by the regulator [11].Fig. 3a shows how the CraPP protein interacts with such a targetDNA with two binding sites and the disrupting effect of addingF1P. The two retarded bands that show in the gel are explainedas the result of CraPP binding to either one (complex I) or bothoperators (complex II) in the labeled DNA probe. When the EMSAswere repeated with high FBP and G6P concentrations (Fig. 3b), theresults indicated much more clearly than in the case of the single-operator probe (cf. Fig. 2b) that both glycolytic intermediates couldrevert the protein-DNA interactions. These results are compatiblewith earlier observations by Ramseier et al. [11] in that thetranscriptional repression caused by CraEC can be relieved in vitroby P5 mM FBP. Still, as these effector concentrations are at theupper limit and beyond those reported in the literature [18] thereis a legitimate doubt of whether the action of FBP on CraPP bindingto DNA reflects a genuine, specific regulatory occurrence. Alterna-tively, they could be the result of using artifactually high effectorconcentrations that lead to non-reliable effects. The in vitro andin vivo experiments below were designed to shed light on thisoutstanding question.
2.2. Interactions of CraPP with FBP and G6P are unspecific
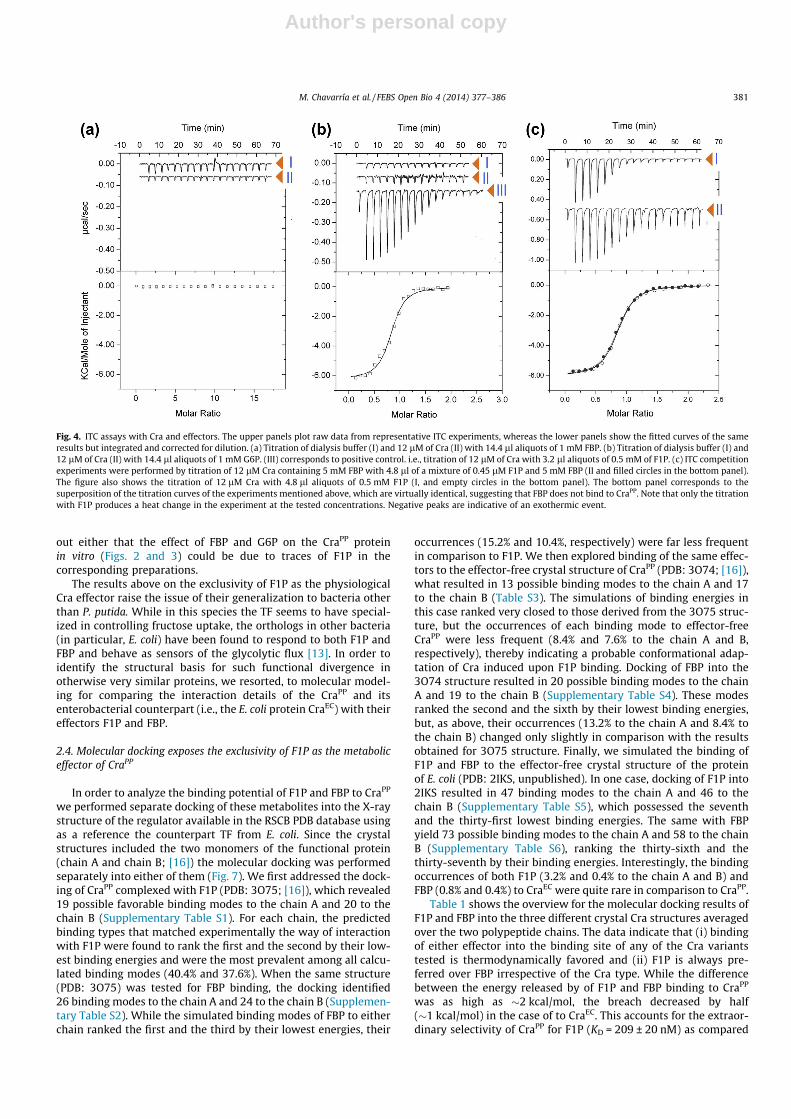
In order to shed light on the nature of Cra effector(s), the inter-action parameters of purified CraPP with the two principal candi-date metabolites were examined by means of isothermal titrationmicrocalorimetry (ITC) as explained in the Methods section. Thebenchmark for these tests was the ITC signals brought about bythe interaction of the same CraPP used in the EMSA experimentswith the bona fide effector F1P. Prior to microcalorimetric assaysof the protein a number of buffer titrations were carried out toidentify the maximal concentration of a compound that give riseto acceptable dilution heats. For the compounds studied, such con-centration was found to be 1 mM. The reference titration of Crawith F1P under such conditions is shown in Fig. 4b (equivalentto ITC curve I in Fig. 4c). This control reproduced faithfully theresults reported in [16]: F1P binding to CraPP caused favourableenthalpy changes, the effector-protein complex had an apparentstoichiometry of one F1P/monomer, and the KD �200 nM. Whenthis experiment was repeated with FBP or G6P heat changes wereidentical to the buffer titration with this ligand, indicating anabsence of binding (curves I of Fig. 4a and b). Note that underthe experimental conditions used the final ligand concentrationin the cell was of 175 lM, which implies that a low-affinity inter-action cannot be detected. Increasing the concentration of theligand was not possible due to large dilution heats at the concen-trations above 1 mM for all metabolites studied. To visualize apotential low-affinity interaction between FBP and Cra, an alterna-tive strategy was chosen in which a mixture of 12 lM CraPP with5 mM of FBP was titrated with a mixture of 0.45 lM F1P in5 mM FBP. If FBP bound to Cra with an affinity in the lower mMrange, the presence of this ligand at Cra would alter the thermody-namic parameters of F1P as mentioned above (Fig. 4b). However,this was not the case because the titration pattern of the CraPP-FBP mixture with F1P (curve II in Fig. 4c) revealed thermodynamicparameters close to the titration of CraPP with F1P-only (ITC curve I
Fig. 2. Interactions of the Cra protein of P. putida with its target region of thefructose operon in response to various metabolic effectors. (a) Retardation assaywith increasing concentrations of Cra in the absence or presence of F1P 1 mM. Lane1: Control free DNA probe containing the PfruB promoter of P. putida, which has onesingle Cra operator (Fig. 1b). Lanes 2–7: 5 to 500 nM of Cra protein-only, no effector.Lane 8: DNA probe in the presence of 1 mM F1P, no protein (control, C). Lanes 9–14:5 to 500 nM of Cra protein with 1 mM F1P. (b) Retardation assay with 50 nM of Craand different candidate effectors. Lane 1: free DNA probe, no protein (control, C).Lane 2: 50 nM Cra only, no effectors (Ref). Lane 3: 50 nM Cra protein and 1 mM F1P.Lanes 4–7: 50 nM Cra protein and 1–15 mM FBP. Lane 8: 50 nM Cra protein and1 mM F1P. Lanes 9–12: 50 nM Cra protein 50 nM and 1–15 mM of G6P. Gelexperiments were performed as indicated in the Section 4.
M. Chavarría et al. / FEBS Open Bio 4 (2014) 377–386 379

Author's personal copy
in Fig. 4c). These series of ITCs therefore revealed that CraPP doesnot bind FBP with affinities in the lower milimolar range, therebyindicating that the protein is highly selective for F1P. These dataare not entirely compatible with the evidence of Fig. 3 showingthat augmenting the sensitivity of CraPP binding to its DNA targetsallowed to see a clear effect of high concentrations of either FBP orG6P in the stability of the complex. What could be the origin ofsuch a phenomenon? Since we were unable to come to aconclusion with the biochemical approaches described above weresorted to a super-sensitive in vivo biosensor system forunequivocally determine the physiological effector(s) of theprotein at stake.
2.3. In vivo experiments designate F1P as the only physiologicaleffector of CraPP
In order to solve the conundrum above (i.e., CraPP responds tohigh concentrations of FBP in EMSA experiments but specific inter-actions are not detected with ITC) we recreated the regulatory sys-tem in vivo with various genetic constructs. To this end we firsttransferred the low-copy number plasmid pMCH1 [17] to P. putidaKT2440. This plasmid carries a translational fusion fruB0-0lacZwhich allows the readout of CraPP binding in vivo to the promoterof the fruBKA operon. In the absence of metabolic effectors, CraPP
binds strongly its operator in the region of the PfruB promoter(Fig. 1) and represses production of b-galactosidase [16,17]. Onthe contrary, when CraPP metabolic agonists release repression,the lacZ fusion is transcribed and the reporter is expressed. In orderto measure accurately b-galactosidase we adopted a variant of the
Miller assay [20] that uses the super-sensitive b-Galacto-LightPlusTM luminiscent substrate of the enzyme [21].
Since P. putida cannot internalize phosphorylated sugars F1P/FBP, these effectors could not be added directly to the mediumfor examining their action in vivo. Instead, as the metabolic mapof P. putida KT2440 has been determined ([15,22,23]; Supplemen-tary Fig. S1) we considered to manipulate intracellular levels of F1Por FBP by growing the cells on distinct substrates. Significant con-centrations of F1P can be brought about by simply growing cells onfructose, because this hexose becomes transformed instantly intoF1P upon transport through the PTSFru system (Fig. 1a; [17]). How-ever, growth in the same sugar also leads to generation of low-mMconcentrations of FBP (�1.3 mM, Fig. 5a), what makes interpreta-tion of any fruB0-0lacZ induction result impossible. Therefore, weattempted to increase the concentration of FBP, while keepingF1P levels to the lowest achievable in vivo. Analysis of FBP in suc-cinate-grown and glucose-grown cells revealed levels of this effec-tor in the range 60 lM and 275 lM, respectively (Fig. 5a). Since,according to the metabolic models of P. putida, F1P can only begenerated by fructose (Supplementary Fig. S1), any fruB0-0lacZactivity of cells growth on either succinate or glucose should betraced to the effect of FBP. Inspection of the results of Fig. 5b indi-cated that the fruB0-0lacZ was strongly induced as expected in fruc-tose-grown cells and not induced at all in succinate cultures. Theseextreme values set the upper and the lower limits of activity of thereporter fusion, as there was a plenty of an optimal inducer (F1P,fructose) and very low concentrations of the candidate effector(FBP, succinate). However in the presence of glucose reporter cellsnearly tripled the readout of b-galactosidase as compared to succi-nate conditions (Fig. 5c). Since F1P cannot be formed under theseconditions, the result suggested that the levels of FBP detected inthese cells could induce the PfruB promoter and thus be an authen-tic physiological effector of CraPP. The data shown in Fig. 6, how-ever, ruled out altogether this possibility. In this case, werepeated the same experiment with glucose but using a DfruBmutant as the host of the fruB0-0lacZ reporter system. This strainis unable to transport fructose and therefore cells exclude any pos-sible trace of this sugar that may contaminate the glucose added tothe medium. When b-galactosidase was measured in the DfruBstrain, the differences between succinate and glucose altogetherdisappeared (Fig. 6a). To ensure that the lack of fruB entirelyprevented the entry of fructose in the medium we run a controlexperiment in which succinate-grown cells having or lacking afunctional fruB gene were added with growing concentrations offructose. As shown in Fig. 6c, as little as 10 lM fructose sufficedmultiply by 3-fold the levels of b-galactosidase of succinate-grownwild-type cells. In contrast, the DfruB mutant kept very low theactivity of the reporter even at higher fructose concentrations.Taken together, these results mean that (i) the levels of FBP thatP. putida cell may accumulate are not sufficient to de-repress thePfruB promoter, (ii) FBP is not a physiological effector of the CraPP
protein and (iii) the residual expression of fruB0-0lacZ in glucose-grown cells is due to a contamination of this sugar by traces offructose. Although the glucose employed in the experiments ofFigs. 5 and 6 has the maximum commercial purity (>99.5%,SIGMA), this sugar can be partially converted to fructose in bothslightly acid and basic aqueous solutions [24]. The process beginsby the spontaneous opening of the hemiacetal ring to an open-chain aldehyde, which undergoes keto-enol tautomerization toits enediol form – which is shared by the two sugars. Subsequenttautomerization to different keto forms produces open-chain fruc-tose, the cyclization of which completes the process. On this basis,it has been calculated that >1% of glucose can tautomerize tofructose [25]. Such traces of fructose would suffice to explain theinduction of fruB0-0lacZ in glucose-grown cells – while clarifyingthe conundrum of FBP as a non-agonist of CraPP. We cannot rule
Fig. 3. Binding of the Cra protein of P. putida to a target DNA containing twocooperative sites. (a) Retardation assay with increasing concentrations of Cra in theabsence or presence of F1P 1 mM. Lane 1: Control free DNA probe containing thePfruB promoter of E. coli, which has two cooperative Cra-binding sites (Supplemen-tary Fig. S2). Lanes 2–7: 5 to 500 nM of Cra protein-only, no effector. Lane 8: DNAprobe in the presence of 1 mM F1P, no protein (control, C). Lanes 9–14: 5 to 500 nMof Cra protein with 1 mM F1P. (b) Retardation assay with 50 nM of Cra and differentcandidate effectors. Lane 1: free DNA probe, no protein (control, C). Lane 2: 50 nMCra only, no effectors (Ref). Lane 3: 50 nM Cra protein and 1 mM F1P. Lanes 4–7:50 nM Cra protein and 1–15 mM FBP. Lane 8: 50 nM Cra protein and 1 mM F1P.Lanes 9–12: 50 nM Cra protein 50 nM and 1–15 mM of G6P.
380 M. Chavarría et al. / FEBS Open Bio 4 (2014) 377–386
Author's personal copy
out either that the effect of FBP and G6P on the CraPP proteinin vitro (Figs. 2 and 3) could be due to traces of F1P in thecorresponding preparations.
The results above on the exclusivity of F1P as the physiologicalCra effector raise the issue of their generalization to bacteria otherthan P. putida. While in this species the TF seems to have special-ized in controlling fructose uptake, the orthologs in other bacteria(in particular, E. coli) have been found to respond to both F1P andFBP and behave as sensors of the glycolytic flux [13]. In order toidentify the structural basis for such functional divergence inotherwise very similar proteins, we resorted, to molecular model-ing for comparing the interaction details of the CraPP and itsenterobacterial counterpart (i.e., the E. coli protein CraEC) with theireffectors F1P and FBP.
2.4. Molecular docking exposes the exclusivity of F1P as the metaboliceffector of CraPP
In order to analyze the binding potential of F1P and FBP to CraPP
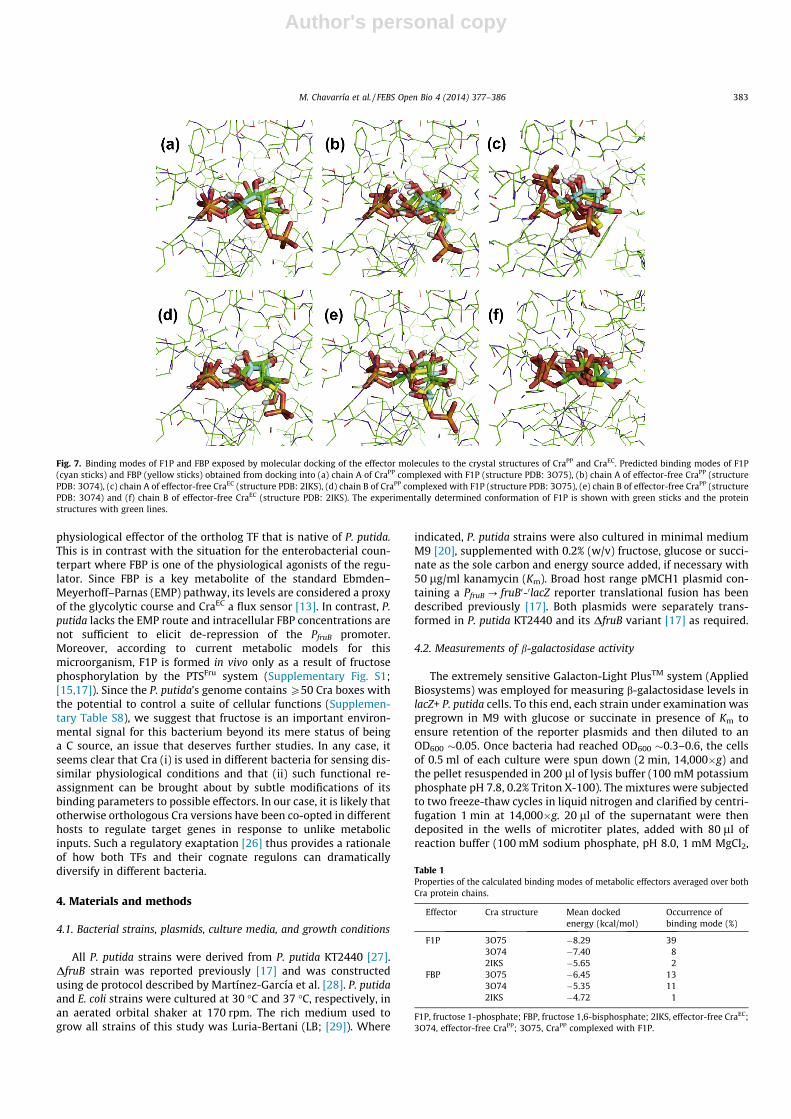
we performed separate docking of these metabolites into the X-raystructure of the regulator available in the RSCB PDB database usingas a reference the counterpart TF from E. coli. Since the crystalstructures included the two monomers of the functional protein(chain A and chain B; [16]) the molecular docking was performedseparately into either of them (Fig. 7). We first addressed the dock-ing of CraPP complexed with F1P (PDB: 3O75; [16]), which revealed19 possible favorable binding modes to the chain A and 20 to thechain B (Supplementary Table S1). For each chain, the predictedbinding types that matched experimentally the way of interactionwith F1P were found to rank the first and the second by their low-est binding energies and were the most prevalent among all calcu-lated binding modes (40.4% and 37.6%). When the same structure(PDB: 3O75) was tested for FBP binding, the docking identified26 binding modes to the chain A and 24 to the chain B (Supplemen-tary Table S2). While the simulated binding modes of FBP to eitherchain ranked the first and the third by their lowest energies, their
occurrences (15.2% and 10.4%, respectively) were far less frequentin comparison to F1P. We then explored binding of the same effec-tors to the effector-free crystal structure of CraPP (PDB: 3O74; [16]),what resulted in 13 possible binding modes to the chain A and 17to the chain B (Table S3). The simulations of binding energies inthis case ranked very closed to those derived from the 3O75 struc-ture, but the occurrences of each binding mode to effector-freeCraPP were less frequent (8.4% and 7.6% to the chain A and B,respectively), thereby indicating a probable conformational adap-tation of Cra induced upon F1P binding. Docking of FBP into the3O74 structure resulted in 20 possible binding modes to the chainA and 19 to the chain B (Supplementary Table S4). These modesranked the second and the sixth by their lowest binding energies,but, as above, their occurrences (13.2% to the chain A and 8.4% tothe chain B) changed only slightly in comparison with the resultsobtained for 3O75 structure. Finally, we simulated the binding ofF1P and FBP to the effector-free crystal structure of the proteinof E. coli (PDB: 2IKS, unpublished). In one case, docking of F1P into2IKS resulted in 47 binding modes to the chain A and 46 to thechain B (Supplementary Table S5), which possessed the seventhand the thirty-first lowest binding energies. The same with FBPyield 73 possible binding modes to the chain A and 58 to the chainB (Supplementary Table S6), ranking the thirty-sixth and thethirty-seventh by their binding energies. Interestingly, the bindingoccurrences of both F1P (3.2% and 0.4% to the chain A and B) andFBP (0.8% and 0.4%) to CraEC were quite rare in comparison to CraPP.
Table 1 shows the overview for the molecular docking results ofF1P and FBP into the three different crystal Cra structures averagedover the two polypeptide chains. The data indicate that (i) bindingof either effector into the binding site of any of the Cra variantstested is thermodynamically favored and (ii) F1P is always pre-ferred over FBP irrespective of the Cra type. While the differencebetween the energy released by of F1P and FBP binding to CraPP
was as high as �2 kcal/mol, the breach decreased by half(�1 kcal/mol) in the case of to CraEC. This accounts for the extraor-dinary selectivity of CraPP for F1P (KD = 209 ± 20 nM) as compared
Fig. 4. ITC assays with Cra and effectors. The upper panels plot raw data from representative ITC experiments, whereas the lower panels show the fitted curves of the sameresults but integrated and corrected for dilution. (a) Titration of dialysis buffer (I) and 12 lM of Cra (II) with 14.4 ll aliquots of 1 mM FBP. (b) Titration of dialysis buffer (I) and12 lM of Cra (II) with 14.4 ll aliquots of 1 mM G6P. (III) corresponds to positive control. i.e., titration of 12 lM of Cra with 3.2 ll aliquots of 0.5 mM of F1P. (c) ITC competitionexperiments were performed by titration of 12 lM Cra containing 5 mM FBP with 4.8 ll of a mixture of 0.45 lM F1P and 5 mM FBP (II and filled circles in the bottom panel).The figure also shows the titration of 12 lM Cra with 4.8 ll aliquots of 0.5 mM F1P (I, and empty circles in the bottom panel). The bottom panel corresponds to thesuperposition of the titration curves of the experiments mentioned above, which are virtually identical, suggesting that FBP does not bind to CraPP. Note that only the titrationwith F1P produces a heat change in the experiment at the tested concentrations. Negative peaks are indicative of an exothermic event.
M. Chavarría et al. / FEBS Open Bio 4 (2014) 377–386 381

Author's personal copy
to the E. coli’s counterpart. The higher binding promiscuity of CraEC
is further supported by significantly larger number of possiblebinding modes of both docked effectors as well as lower probabilityof their calculated binding modes.
2.5. Molecular dynamics of F1P and FBP bound to CraPP
To gain a further insight on the selectivity of CraPP for itsphysiological effector we run simulations of the interactions ofF1P and FBP bound to the CraPP structure (PDB: 3O75) and theCraEC (PDB: 2IKS). Once reaching a constant temperature, thedynamically simulated systems were found to be equilibratedbased on the stable values of energies, density, gyration radiusand the mean root square deviation of protein backbone atoms,over the entire length of the production molecular dynamicssimulation (data not show). The binding free energy calculatedby MM-PBSA and the normal mode analysis for all four investi-gated complexes are shown in Supplementary Table S7. In good
agreement with the data of docking calculations presented above,the favorable free binding energies confirm that both F1P and FBPcan bind to either Cra variant. However, the divergence betweenthe free binding energy of F1P and FBP (Supplementary Table S7)is significantly larger in the case of CraPP (�7.2 ± 2.5 kcal/mol) thanE. coli’s CraEC (�3.8 ± 1.1 kcal/mol). Such differences imply a differ-ence of six orders of magnitude in the affinity of CraPP for each ofthe effectors as compared to the 3 orders of magnitude in the caseof CraEC. These analyses both account for the extreme selectivity ofCraPP towards F1P and explain why the E. coli’s protein has, other-wise, a broader effector range in vivo that reaches out physiologicalfluctuations of FBP [13].
3. Conclusions
Inspection of the crystal structure of CraPP [16] along with thesuite of biochemical and biophysical tests presented in this workreveal without a doubt, that F1P is the one and only metabolic
Fig. 5. Metabolic control of PfruB activity. (a) FBP levels in P. putida growing on glycolytic (fructose and glucose) and gluconeogenic (succinate) substrates. Wild-type cells of P.putida KT2440 were grown in M9 media with the substrate indicated until the mid-exponential phase and then processed for measuring FBP levels by HPLC-MS as describedin the Section 4. The data shown correspond to three independent samples, the error bars representing the standard deviations of the mean. (b) PfruB activity in cells grown onsuccinate, glucose and fructose as the sole C source. A schematic diagram of the fruB0-0lacZ gene fusion borne by reporter plasmid pMCH1 is sketched on top. Note the veryhigh activity in cells grown on fructose in contrast with those in succinate or glucose. (c) Blowup of lacZ readout of P. putida (pMCH1) cells growing on succinate or glucose.
Fig. 6. Effect of DfruB on the activity of a fruB0-0lacZ fusion. PfruB activity in P. putida (pMCH1) cells lacking the fruB gene growing in (a) glucose with increasing concentrations(10 and 100 lM) of fructose and (b) succinate with increasing concentrations (10 and 100 lM) of fructose. (c) PfruB activity in wild type cells grown with succinate plusfructose. b-Galactosidase activity was measured with Galacton-Plus� as described in the Section 4. Note that lacZ levels of the DfruB strain remain unchanged regardless ofsuccinate or glucose, plausibly due to the inability of cells to internalize fructose and thus generate F1P.
382 M. Chavarría et al. / FEBS Open Bio 4 (2014) 377–386
Author's personal copy
physiological effector of the ortholog TF that is native of P. putida.This is in contrast with the situation for the enterobacterial coun-terpart where FBP is one of the physiological agonists of the regu-lator. Since FBP is a key metabolite of the standard Ebmden–Meyerhoff–Parnas (EMP) pathway, its levels are considered a proxyof the glycolytic course and CraEC a flux sensor [13]. In contrast, P.putida lacks the EMP route and intracellular FBP concentrations arenot sufficient to elicit de-repression of the PfruB promoter.Moreover, according to current metabolic models for thismicroorganism, F1P is formed in vivo only as a result of fructosephosphorylation by the PTSFru system (Supplementary Fig. S1;[15,17]). Since the P. putida’s genome contains P50 Cra boxes withthe potential to control a suite of cellular functions (Supplemen-tary Table S8), we suggest that fructose is an important environ-mental signal for this bacterium beyond its mere status of beinga C source, an issue that deserves further studies. In any case, itseems clear that Cra (i) is used in different bacteria for sensing dis-similar physiological conditions and that (ii) such functional re-assignment can be brought about by subtle modifications of itsbinding parameters to possible effectors. In our case, it is likely thatotherwise orthologous Cra versions have been co-opted in differenthosts to regulate target genes in response to unlike metabolicinputs. Such a regulatory exaptation [26] thus provides a rationaleof how both TFs and their cognate regulons can dramaticallydiversify in different bacteria.
4. Materials and methods
4.1. Bacterial strains, plasmids, culture media, and growth conditions
All P. putida strains were derived from P. putida KT2440 [27].DfruB strain was reported previously [17] and was constructedusing de protocol described by Martínez-García et al. [28]. P. putidaand E. coli strains were cultured at 30 �C and 37 �C, respectively, inan aerated orbital shaker at 170 rpm. The rich medium used togrow all strains of this study was Luria-Bertani (LB; [29]). Where
indicated, P. putida strains were also cultured in minimal mediumM9 [20], supplemented with 0.2% (w/v) fructose, glucose or succi-nate as the sole carbon and energy source added, if necessary with50 lg/ml kanamycin (Km). Broad host range pMCH1 plasmid con-taining a PfruB ? fruB0-0lacZ reporter translational fusion has beendescribed previously [17]. Both plasmids were separately trans-formed in P. putida KT2440 and its DfruB variant [17] as required.
4.2. Measurements of b-galactosidase activity
The extremely sensitive Galacton-Light PlusTM system (AppliedBiosystems) was employed for measuring b-galactosidase levels inlacZ+ P. putida cells. To this end, each strain under examination waspregrown in M9 with glucose or succinate in presence of Km toensure retention of the reporter plasmids and then diluted to anOD600 �0.05. Once bacteria had reached OD600 �0.3–0.6, the cellsof 0.5 ml of each culture were spun down (2 min, 14,000�g) andthe pellet resuspended in 200 ll of lysis buffer (100 mM potassiumphosphate pH 7.8, 0.2% Triton X-100). The mixtures were subjectedto two freeze-thaw cycles in liquid nitrogen and clarified by centri-fugation 1 min at 14,000�g. 20 ll of the supernatant were thendeposited in the wells of microtiter plates, added with 80 ll ofreaction buffer (100 mM sodium phosphate, pH 8.0, 1 mM MgCl2,
Fig. 7. Binding modes of F1P and FBP exposed by molecular docking of the effector molecules to the crystal structures of CraPP and CraEC. Predicted binding modes of F1P(cyan sticks) and FBP (yellow sticks) obtained from docking into (a) chain A of CraPP complexed with F1P (structure PDB: 3O75), (b) chain A of effector-free CraPP (structurePDB: 3O74), (c) chain A of effector-free CraEC (structure PDB: 2IKS), (d) chain B of CraPP complexed with F1P (structure PDB: 3O75), (e) chain B of effector-free CraPP (structurePDB: 3O74) and (f) chain B of effector-free CraEC (structure PDB: 2IKS). The experimentally determined conformation of F1P is shown with green sticks and the proteinstructures with green lines.
Table 1Properties of the calculated binding modes of metabolic effectors averaged over bothCra protein chains.
Effector Cra structure Mean dockedenergy (kcal/mol)
Occurrence ofbinding mode (%)
F1P 3O75 �8.29 393O74 �7.40 82IKS �5.65 2
FBP 3O75 �6.45 133O74 �5.35 112IKS �4.72 1
F1P, fructose 1-phosphate; FBP, fructose 1,6-bisphosphate; 2IKS, effector-free CraEC;3O74, effector-free CraPP; 3O75, CraPP complexed with F1P.
M. Chavarría et al. / FEBS Open Bio 4 (2014) 377–386 383

Author's personal copy
1X Galacton-Plus�) and incubated for 30 min. Samples were thenadded with 125 ll of Accelerator-II Sapphire-II™ and light emis-sion recorded for 30 s in a luminometer following the instructionsof the commercial supplier. All the enzymatic measurements pre-sented through this paper are the result of at least six biologicalreplicates.
4.3. Gel retardation assays
The PfruBPP probe used for these tests containing a single Cra bind-
ing site was amplified from plasmid pMCH1 with oligonucleotides50PfruB (50CGAATTTTCCTTGTTATTACCGGG30) and 30PfruB (50CGGAATTCGACCTTCTCCTTTTGCAGTTCCC30, an engineered EcoRI site isunderlined). The equivalent PfruB
EC probe with two Cra binding siteswas similarly amplified from the purified genomic DNA of E. coliW3110 by using oligonucleotides 50PfruBcoli (50 CTGA TA ACGGATTTTCCCATCAGC30) and 30PfruBcoli (50CGGAATTCGCCTCTTCTTTGTCTCCGGCC30; the EcoRI site underlined). In both cases,the amplified DNA was digested with EcoRI and the resulting290 bp fragments were 30-end labelled by filling-in the EcoRI-digested overhanging end of the fragment with [a-32P]dATP andthe Klenow fragment of E. coli DNA polymerase as reported previ-ously [30]. The retardation reactions were set in TRRG buffer(20 mM Tris/HCl, pH 7.5, 10% glycerol, 2 mM b-mercaptoethanoland 50 mM KCl) and contained 0.05 nM DNA probe, 250 lg/mlBSA, 50 nM purified His6-Cra protein (produced as described in[16]) and concentrations 1–15 mM of effectors in a final volumeof 9 ll. After incubation of the retardation mixtures for 20 min atroom temperature, the mixtures were analyzed by electrophoresisin 5% polyacrylamide gels buffered with 0.5X TBE (45 mM Tris/borate, 1 mM EDTA). The gels were dried on Whatman 3MM paperand exposed to X-Ray Film (Konica Minolta).
4.4. Isothermal titration microcalorimetry (ITC)
ITC experiments were performed on a VP microcalorimeter(MicroCal, Northampton, MA, USA) at 25 �C. Prior to experiments,Cra was thoroughly dialyzed in 25 mM Tris-HCl, 50 mM NaCl,1 mM DTT, pH 8.0. After the protein solution was then clarifiedtrough a 0.45 lm filter and its concentration was determined byUV absorption spectroscopy using and extinction coefficient of1.217 � 105 cm�1 M�1 at 280 nm [31]. Effectors were prepared bydiluting pure powdered products in filtered dialysis buffer so thatthe ligand and protein solvent were the same. Titration with F1P(positive control) involved 4.8 ll injections of 0.5 mM F1P into a12 lM protein solution. On the other hand, titration with FBPand G6P involved 14.4 ll injections of 1 mM FBP (or G6P) into a12 lM protein solution. For competition experiments a mixtureof 5 mM of FBP with 12 lM of Cra protein was titrated with a mix-ture of 0.45 lM of F1P and 5 mM of FBP. For all the experiments,the mean enthalpies measured from injection of the ligands intothe buffer were subtracted from raw titration data prior to data fit-ting using the One binding site model of the MicroCal version of theORIGIN software. From the curves thus fitted, the parameters DH(reaction enthalpy), KA (binding constant, KA = 1/KD), and n (reac-tion stoichiometry) were determined. From the values of KA andDH, the change in free energy (DG) and in entropy (DS) were cal-culated with the equation: DG = �RT lnKA = DH � TDS, where R isthe universal molar gas constant and T is the absolute temperature.
4.5. Determination of FBP concentrations by liquid chromatographymass spectrometry
For quantification of FBP, P. putida KT2440 were pregrown inM9 medium with 0.2% (w/v) fructose, glucose or succinate asrequired and then re-inoculated in the same media to a starting
OD600 = 0.05. Cultures were then let grow until exponential phase,at which point the biomass corresponding to 0.5–0.6 mg of cellulardry weight (CDW, 4 ml of culture to OD600 �0.5–0.6) of triplicatesamples was collected by fast centrifugation (13,000�g, 30 sec)and the bacterial pellets immediately frozen in liquid nitrogenuntil further processing. At that point, samples were extractedthree times with 0.5 ml 60% (v/v) ethanol buffered with 10 mMammonium acetate pH 7.2 at 78 �C for 1 min as described previ-ously [32,33]. After each extraction step, biomass was separatedby centrifugation for 1 min at 13,000�g. The three liquid extractsof each sample were pooled prior to drying at 120 lbar to com-plete dryness and then stored at �80 �C. Samples were then resus-pended in 20 ll of MilliQ water, sealed in 96-well plates, submittedto LC-MS and the data analyzed as described previously [33].
4.6. Molecular docking calculations
The molecular models of F1P and FBP were prepared andenergy-minimized in the Avogadro 1.0.2 package [34]. The proce-dure involved 500 steps of steepest descent followed by 500 stepsof conjugate gradient using the GAFF force field [35]. The crystalstructures were downloaded from RSCB PDB database under fol-lowing PDB codes: 2IKS (effector-free Cra from E. coli), 3O74 (effec-tor-free Cra from P. putida), and 3O75 (Cra from P. putidacomplexed with F1P). All crystallographic water molecules wereremoved and hydrogen atoms were added to the proteins by H++server at pH 8.0 using the default settings [36]. Gasteiger chargesand AutoDock 4.2 atom types were assigned to protein and ligandstructures by MGLTools [37]. During docking procedure, the recep-tor binding site was represented by the set of atomic and electro-static grid maps calculated by AutoGrid 4.2 [38,39]. Individualchains of Cra structures were aligned to the chain A of 3O74 struc-ture using Pymol 1.4.1 (http://pymol-molecular-graphics-sys-tem.soft112.com) and the grid maps were set to 80 � 80 � 80grid points with spacing 0.25 Å centered at the position of C2 atomof F1P bound to chain A of 3O75. This setting of the grid mapsallows full coverage of Cra binding site. Both ligands were thendocked separately into the binding sites of each chain of all struc-tures using AutoDock 4.2 [38,39]. 250 docking calculations wereperformed for each ligand employing the Lamarckian Genetic algo-rithm with the following parameters: initial population size 300,maximum of 30,000 generations, elitism value 1, mutation rate0.02, and cross-over rate 0.8. The maximum of energy evaluationswere set to 10,000,000. The local search was based on pseudo Solisand Wets algorithm with a maximum of 300 iterations per localsearch [40]. Energy of unbound system was estimated as the inter-nal energy of the unbound extended conformation determinedfrom Lamarckian Genetic Algorithm search. Final orientations fromevery docking run were clustered with a clustering tolerance forthe root-mean-square positional deviation of 1.5 Å.
4.7. Molecular dynamics simulations
The F1P-3O75, FBP-3O75, F1P-2IKS and FBP-2IKS complexesobtained by the molecular docking were used as the initial struc-tures for the molecular dynamics simulations. Crystallographicwaters were put back to their original positions with the exceptionof water molecules overlapping with the docked effectors. AM1-BCC atomic partial charges [41] and the force field parametersfor F1P and FBP were generated with the Antechamber moduleof AMBER11 [42,43] using the total charges of �2 e and �4 e forF1P and FBP, respectively. Using Tleap module of AMBER11, thesystems were neutralized by adding 8, 10, 16 and 18 Na+ ions toF1P-3O75, FBP-3O75, F1P-2IKS and FBP-2IKS complexes, respec-tively. Using the same module, an octahedral of TIP3P water mol-ecules [44] was added to the distance of 10 Å from any solute
384 M. Chavarría et al. / FEBS Open Bio 4 (2014) 377–386

Author's personal copy
atom in the systems. Energy minimization and molecular dynam-ics simulations were carried out in PMEMD module of AMBER11using ff99SB force field [45] for a protein and GAFF force field[35] for the ligands. Initially, the investigated systems wereminimized by 500 steps of steepest descent followed by 500steps of conjugate gradient in five rounds of decreasingharmonic restraints. The restraints were applied as follows:500 kcal mol�1 �2 on all heavy atoms of a protein, and then 500,125, 25 and 0 kcal mol�1 �2 on the backbone atoms only.Molecular dynamics simulations employed periodic boundaryconditions, the particle mesh Ewald method for treatment of theelectrostatic interactions [46,47], 10 Šcutoff for nonbondedinteractions, and 2 ft time step with the SHAKE algorithm to fixall bonds containing hydrogens [48]. Equilibration simulationsconsisted of two steps: (i) 20 ps of gradual heating from 0 to300 K under constant volume, using a Langevin thermostat withcollision frequency of 1.0 ps�1, and with harmonic restraints of5.0 kcal mol�1 �2 on the position of all protein and effector atoms,and (ii) 2000 ps of unrestrained molecular dynamics at 300 K usingthe Langevin thermostat, and constant pressure of 1.0 bar usingpressure coupling constant of 1.0 ps. Finally, production moleculardynamics simulations were run for 10 ns with the same settings asthe second step of equilibration simulations. Coordinates weresaved in 1 ps interval, and the trajectories were analyzed usingPtraj module of AMBER11, and visualized in Pymol 1.4.1 (seeabove) and VMD 1.8.9 [49].
4.8. Calculation of the binding free energy
The free energy for the binding of potential effectors to the indi-vidual proteins was calculated by the Molecular Mechanics/Pois-son Boltzmann Surface Area (MM-PBSA) method usingMMPBSA.py script of AMBER11 [50]. The polar solvation free energycontributions were determined by grid based finite-differencesolution of the Possion–Boltzmann equation using pbsa [51] pro-gram of AMBER11 The setting of the Possion–Boltzmann calcula-tions were following: ionic strength of 75 mM, grid spacing of0.5 Å, the internal and external dielectric constants of 1 and 80,respectively, and modified Bondi radii [52] for ligands. The nonpo-lar solvation free energy contribution was estimated as propor-tional to the solvent accessible surface area using the LCPOmethod [53]. The entropy change upon effector binding was eval-uated using the normal-mode analysis implemented in NAB mod-ule of AMBER11 using distance-dependent dielectric of 4rij. Theenergy was calculated over 10,000 snapshots extracted from a sin-gle production molecular dynamics simulation of a complex, andthe entropy contribution was calculated from 100 snapshotsevenly sampled from the snapshots employed in the energycalculation.
Acknowledgements
Authors are indebted to Tobias Führer and Uwe Sauer (ETHZürich) for help with measurements of central metabolites. Thisstudy was supported by the BIO and FEDER CONSOLIDER-INGENIOprogramme of the Spanish Ministry of Science and Innovation, theMICROME, ST-FLOW and ARISYS Contracts of the EU, the PROMTProject of the CAM, the European Regional DevelopmentFund (CZ.1.05/2.1.00/01.0001) and the Grant Agency of the CzechRepublic (P503/12/0572). CERIT-SC and MetaCentrum areacknowledged for providing access to their computing facilities(CZ.1.05/3.2.00/08.0144 and LM2010005). J.B. was supported bythe CZ1.07/2.3.00/30.0037 Program of the European Social Fundand the Czech Republic. Authors declare no conflict of interest.
Appendix A. Supplementary data
Supplementary data associated with this article can be found, inthe online version, at http://dx.doi.org/10.1016/j.fob.2014.03.013.
References
[1] Saier Jr., M.H. and Ramseier, T.M. (1996) The catabolite repressor/activator(Cra) protein of enteric bacteria. J. Bacteriol. 178, 3411–3417.
[2] Ramseier, T.M. (1996) Cra and the control of carbon flux via metabolicpathways. Res. Microbiol. 147, 489–493.
[3] Ow, D.S., Lee, R.M., Nissom, P.M., Philp, R., Oh, S.K. and Yap, M.G. (2007)Inactivating FruR global regulator in plasmid-bearing Escherichia coli altersmetabolic gene expression and improves growth rate. J. Biotechnol. 131, 261–269.
[4] Bledig, S.A., Ramseier, T.M. and Saier Jr., M.H. (1996) FruR mediates cataboliteactivation of pyruvate kinase (pykF) gene expression in Escherichia coli. J.Bacteriol. 178, 280–283.
[5] Sarkar, D., Siddiquee, K.A., Arauzo-Bravo, M.J., Oba, T. and Shimizu, K. (2008)Effect of cra gene knockout together with edd and iclR genes knockout on themetabolism in Escherichia coli. Arch. Microbiol. 190, 559–571.
[6] Geerse, R.H., van der Pluijm, J. and Postma, P.W. (1989) The repressor of thePEP:fructose phosphotransferase system is required for the transcription ofthe pps gene of Escherichia coli. Mol. Gen. Genet. 218, 348–352.
[7] Negre, D., Oudot, C., Prost, J.F., Murakami, K., Ishihama, A., Cozzone, A.J. andCortay, J.C. (1998) FruR-mediated transcriptional activation at the ppsApromoter of Escherichia coli. J. Mol. Biol. 276, 355–365.
[8] Cortay, J.C., Negre, D., Scarabel, M., Ramseier, T.M., Vartak, N.B., Reizer, J., SaierJr., M.H. and Cozzone, A.J. (1994) In vitro asymmetric binding of the pleiotropicregulatory protein, FruR, to the ace operator controlling glyoxylate shuntenzyme synthesis. J. Biol. Chem. 269, 14885–14891.
[9] Prost, J.F., Negre, D., Oudot, C., Murakami, K., Ishihama, A., Cozzone, A.J. andCortay, J.C. (1999) Cra-dependent transcriptional activation of the icd gene ofEscherichia coli. J. Bacteriol. 181, 893–898.
[10] Ramseier, T.M., Chien, S.Y. and Saier Jr., M.H. (1996) Cooperative interactionbetween Cra and Fnr in the regulation of the cydAB operon of Escherichia coli.Curr. Microbiol. 33, 270–274.
[11] Ramseier, T.M., Negre, D., Cortay, J.C., Scarabel, M., Cozzone, A.J. and Saier Jr.,M.H. (1993) In vitro binding of the pleiotropic transcriptional regulatoryprotein, FruR, to the fru, pps, ace, pts and icd operons of Escherichia coli andSalmonella typhimurium. J. Mol. Biol. 234, 28–44.
[12] Ramseier, T.M., Bledig, S., Michotey, V., Feghali, R. and Saier Jr., M.H. (1995)The global regulatory protein FruR modulates the direction of carbon flow inEscherichia coli. Mol. Microbiol. 16, 1157–1169.
[13] Kotte, O., Zaugg, J.B. and Heinemann, M. (2010) Bacterial adaptation throughdistributed sensing of metabolic fluxes. Mol. Sys. Biol. 6, 355.
[14] Kochanowski, K., Volkmer, B., Gerosa, L., Haverkorn van Rijsewijk, B.R.,Schmidt, A. and Heinemann, M. (2013) Functioning of a metabolic fluxsensor in Escherichia coli. Proc. Natl. Acad. Sci. USA 110, 1130–1135.
[15] Chavarria, M., Kleijn, R.J., Sauer, U., Pfluger-Grau, K., Casasnovas, J.M. and deLorenzo, V. (2012) Regulatory tasks of the phosphoenolpyruvate-phosphotransferase system of Pseudomonas putida in central carbonmetabolism. mBio 3. e00028–00012.
[16] Chavarria, M., Santiago, C., Platero, R., Krell, T., Casasnovas, J.M. and deLorenzo, V. (2011) Fructose 1-phosphate is the preferred effector of themetabolic regulator Cra of Pseudomonas putida. J. Biol. Chem. 286, 9351–9359.
[17] Chavarria, M., Fuhrer, T., Sauer, U., Pfluger-Grau, K. and de Lorenzo, V. (2013)Cra regulates the cross-talk between the two branches of thephosphoenolpyruvate: phosphotransferase system of Pseudomonas putida.Environ. Microbiol. 15, 121–132.
[18] Bennett, B.D., Kimball, E.H., Gao, M., Osterhout, R., Van Dien, S.J. andRabinowitz, J.D. (2009) Absolute metabolite concentrations and impliedenzyme active site occupancy in Escherichia coli. Nat. Chem. Biol. 5, 593–599.
[19] Silva-Rocha, R. and de Lorenzo, V. (2012) Broadening the signal specificity ofprokaryotic promoters by modifying cis-regulatory elements associated witha single transcription factor. Mol. BioSys. 8, 1950–1957.
[20] Miller, J.H. (1972) Experiments in molecular genetics, Cold Spring Harbor, N.Y.[21] Jain, V.K. and Magrath, I.T. (1991) A chemiluminescent assay for quantitation
of beta-galactosidase in the femtogram range: application to quantitation ofbeta-galactosidase in lacZ-transfected cells. Anal. Biochem. 199, 119–124.
[22] Nogales, J., Palsson, B.O. and Thiele, I. (2008) A genome-scale metabolicreconstruction of Pseudomonas putida KT2440: iJN746 as a cell factory. BMCSyst. Biol. 2, 79.
[23] Puchalka, J., Oberhardt, M.A., Godinho, M., Bielecka, A., Regenhardt, D., Timmis,K.N., Papin, J.A. and Martins dos Santos, V.A. (2008) Genome-scalereconstruction and analysis of the Pseudomonas putida KT2440 metabolicnetwork facilitates applications in biotechnology. PLoS Comput. Biol. 4,e1000210.
[24] McMurry, J.E. and Begley, T.P. (2005) The organic chemistry of biologicalpathways, Roberts and Company Publishers, Colorado.
[25] Wrolstad, R.E. (2012) Food Carbohydrate Chemistry, John Wiley & Sons Inc,West Sussex, UK.
M. Chavarría et al. / FEBS Open Bio 4 (2014) 377–386 385

Author's personal copy
[26] Milanesio, P., Arce-Rodriguez, A., Munoz, A., Calles, B. and de Lorenzo, V.(2011) Regulatory exaptation of the catabolite repression protein (Crp)-cAMPsystem in Pseudomonas putida. Environ. Microbiol. 13, 324–339.
[27] Nelson, K.E., Weinel, C., Paulsen, I.T., Dodson, R.J., Hilbert, H., Martins dosSantos, V.A., Fouts, D.E., Gill, S.R., Pop, M., Holmes, M., Brinkac, L., Beanan, M.,DeBoy, R.T., Daugherty, S., Kolonay, J., Madupu, R., Nelson, W., White, O.,Peterson, J., Khouri, H., Hance, I., Chris Lee, P., Holtzapple, E., Scanlan, D., Tran,K., Moazzez, A., Utterback, T., Rizzo, M., Lee, K., Kosack, D., Moestl, D., Wedler,H., Lauber, J., Stjepandic, D., Hoheisel, J., Straetz, M., Heim, S., Kiewitz, C., Eisen,J.A., Timmis, K.N., Dusterhoft, A., Tummler, B. and Fraser, C.M. (2002) Completegenome sequence and comparative analysis of the metabolically versatilePseudomonas putida KT2440. Environ. Microbiol. 4, 799–808.
[28] Martinez-Garcia, E. and de Lorenzo, V. (2011) Engineering multiple genomicdeletions in Gram-negative bacteria: analysis of the multi-resistant antibioticprofile of Pseudomonas putida KT2440. Environ. Microbiol. 13, 2702–2716.
[29] Sambrook, J., Maniatis, T. and Fritsch, T. (1989) Molecular cloning: a laboratorymanual, Cold Spring Harbor Laboratory Press, N.Y..
[30] Barragan, M.J., Blazquez, B., Zamarro, M.T., Mancheno, J.M., Garcia, J.L., Diaz, E.and Carmona, M. (2005) BzdR, a repressor that controls theanaerobic catabolism of benzoate in Azoarcus sp. CIB, is the first member ofa new subfamily of transcriptional regulators. J. Biol. Chem. 280, 10683–10694.
[31] Gasteiger, E., Hoogland, C., Gattiker, A., Duvaud, S., Wilkins, M.R., Appel, R.D.and Bairoch, A. (2005) Protein Identification and Analysis Tools on the ExPASyServer in: The Poteomics Protocols Handbook (Walker, J.M., Ed.), pp. 571–607,Humana Press.
[32] Fuhrer, T. and Sauer, U. (2009) Different biochemical mechanisms ensurenetwork-wide balancing of reducing equivalents in microbial metabolism. J.Bacteriol. 191, 2112–2121.
[33] Buescher, J.M., Moco, S., Sauer, U. and Zamboni, N. (2010) Ultrahighperformance liquid chromatography-tandem mass spectrometry method forfast and robust quantification of anionic and aromatic metabolites. Anal.Chem. 82, 4403–4412.
[34] Hanwell, M.D., Curtis, D.E., Lonie, D.C., Vandermeersch, T., Zurek, E. andHutchison, G.R. (2012) Avogadro: an advanced semantic chemical editor,visualization, and analysis platform. J. Cheminform. 4, 17.
[35] Wang, J., Wolf, R.M., Caldwell, J.W., Kollman, P.A. and Case, D.A. (2004)Development and testing of a general amber force field. J. Comput. Chem. 25,1157–1174.
[36] Gordon, J.C., Myers, J.B., Folta, T., Shoja, V., Heath, L.S. and Onufriev, A. (2005)H++: a server for estimating pKas and adding missing hydrogens tomacromolecules. Nucl. Acids Res. 33, W368–W371.
[37] Sanner, M.F. (1999) Python: a programming language for software integrationand development. J. Mol. Graph. Model. 17, 57–61.
[38] Morris, G.M., Goodsell, D.S., Halliday, R.S., Huey, R., Hart, W.E., Belew, R.K. andOlson, A.J. (1998) Automated docking using a Lamarckian genetic algorithm
and an emperical binding free energy function. J. Comput. Chem. 19, 1639–1662.
[39] Huey, R., Morris, G.M., Olson, A.J. and Goodsell, D.S. (2007) A semiempiricalfree energy force field with charge-based desolvation. J. Comput. Chem. 28,1145–1152.
[40] Solis, F.J. and Wets, R.J.B. (1981) Minimization by random search techniques.Math. Oper. Res. 6, 19–30.
[41] Jakalian, A., Bush, B.L., Jack, D.B. and Bayly, C.I. (2000) Fast, efficient generationof high-quality atomic charges. AM1-BCC model: I. Method. J. Comput. Chem.21, 132–146.
[42] Case, D.A., Darden, T.A., Cheatham, T.E., Simmerling, C.L., Wang, J., Duke, R.E.,Luo, R., Walker, R.C., Zhang, W., Merz, K.M., Roberts, B., Wang, B., Hayik, S.,Roitberg, A., Seabra, G., Kolossváry, I., Wong, K.F., Paesani, F., Vanicek, J., Wu,X., Brozell, S.R., Steinbrecher, T., Gohlke, H., Cai, Q., Ye, X., Wang, J., Hsieh, M.J.,Cui, G., Roe, D.R., Mathews, D.H., Seetin, M.G., Sagui, C., Babin, V., Luchko, T.,Gusarov, S., Kovalenko, A. and Kollman, P.A. (2010) AMBER 11 in, University ofCalifornia, San Francisco.
[43] Case, D.A., Cheatham, T.E., Darden, T., Gohlke, H., Luo, R., Merz, K.M., Onufriev,A., Simmerling, C., Wang, B. and Woods, R.J. (2005) The Amber biomolecularsimulation programs. J. Comput. Chem. 26, 1668–1688.
[44] Jorgensen, W.L., Chandrasekhar, J., Madura, J.D., Impey, R.W. and Klein, M.L.(1983) Comparison of simple potential functions for simulating liquid water. J.Chem. Phys. 79, 926–935.
[45] Hornak, V., Abel, R., Okur, A., Strockbine, B., Roitberg, A. and Simmerling, C.(2006) Comparison of multiple Amber force fields and development ofimproved protein backbone parameters. Proteins 65, 712–725.
[46] Darden, T., York, D. and Pedersen, L. (1993) Particle mesh Ewald: an Nlog(N)method for Ewald sums in large systems. J. Chem. Phys. 103, 8577–8593.
[47] Essmann, U., Perera, L., Berkowitz, M., Darden, T., Lee, H. and Pedersen, L.(1995) A smooth particle mesh Ewald method. J. Chem. Phys. 103, 8577–8593.
[48] Ryckaert, J.P., Ciccotto, G. and Berendsen, H.J.C. (1977) Numerical integrationof the cartesian equations of motion of a system with constraints: moleculardynamics of n-alkanes. J. Comput. Phys. 23, 327–341.
[49] Humphrey, W., Dalke, A. and Schulten, K. (1996) VMD: visual moleculardynamics. J. Mol. Graph. 14, 33–38.
[50] Srinivasan, J., Cheatham, T.E., Cieplak, P., Kollman, P.A. and Case, D.A. (1998)Continuum solvent studies of the stability of DNA, RNA, andphosphoramidate�DNA helices. J. Am. Chem. Soc. 120, 9401–9409.
[51] Luo, R., David, L. and Gilson, M.K. (2002) Accelerated Poisson–Boltzmanncalculations for static and dynamic systems. J. Comput. Chem. 23, 1244–1253.
[52] Onufriev, A., Bashford, D. and Case, D.A. (2004) Exploring protein native statesand large-scale conformational changes with a modified generalized bornmodel. Proteins 55, 383–394.
[53] Weiser, J., Shenkin, P. and Still, C. (1999) Approximate atomic surfaces fromlinear combinations of pairwise overlaps (LCPO). J. Comput. Chem. 20, 217–230.
386 M. Chavarría et al. / FEBS Open Bio 4 (2014) 377–386


![[Sucrose][Fructose] [H3P04= · quired fructose molecule could be produced from a second molecule of G-1-P by way of glucose-6-phos-phate (G-6-P) and fructose-6-phosphate (F-6-P) as](https://img.pdfslide.us/doc/110x75/5ec3bc19478bbc53f3182a8b/sucrosefructose-h3p04-quired-fructose-molecule-could-be-produced-from-a-second.jpg)