Embed Size (px)
Citation preview

The Cryosphere, 10, 977–993, 2016
www.the-cryosphere.net/10/977/2016/
doi:10.5194/tc-10-977-2016
© Author(s) 2016. CC Attribution 3.0 License.
Frozen debris lobe morphology and movement: an overview
of eight dynamic features, southern Brooks Range, Alaska
Margaret M. Darrow1, Nora L. Gyswyt1, Jocelyn M. Simpson1, Ronald P. Daanen2, and Trent D. Hubbard2
1Department of Mining and Geological Engineering, University of Alaska Fairbanks, Fairbanks, Alaska 99775, USA2Alaska Division of Geological & Geophysical Surveys, Fairbanks, Alaska 99709, USA
Correspondence to: Margaret M. Darrow ([email protected])
Received: 6 January 2016 – Published in The Cryosphere Discuss.: 9 February 2016
Revised: 8 April 2016 – Accepted: 26 April 2016 – Published: 12 May 2016
Abstract. Frozen debris lobes (FDLs) are elongated, lo-
bate permafrost features that mostly move through shear in
zones near their bases. We present a comprehensive overview
of eight FDLs within the Dalton Highway corridor (south-
ern Brooks Range, Alaska), including their catchment ge-
ology and rock strengths, lobe soil characteristics, surface
movement measurements collected between 2012 and 2015,
and analysis of historic and modern imagery from 1955 to
2014. Field mapping and rock strength data indicate that
the metasedimentary and metavolcanic bedrock forming the
majority of the lobe catchments has very low to medium
strength and is heavily fractured, thus easily contributing
to FDL formation. The eight investigated FDLs consist of
platy rocks typical of their catchments, organic debris, and an
ice-poor soil matrix; massive ice, however, is present within
FDLs as infiltration ice, concentrated within cracks open to
the surface. Exposure of infiltration ice in retrogressive thaw
slumps (RTSs) and associated debris flows leads to increased
movement and various stages of destabilization, resulting in
morphological differences among the lobes. Analysis of his-
toric imagery indicates that movement of the eight investi-
gated FDLs has been asynchronous over the study period,
and since 1955, there has been an overall increase in move-
ment rates of the investigated FDLs. The formation of sur-
face features, such as cracks, scarps, and RTSs, suggests that
the increased movement rates correlate to general instability,
and even at their current distances, FDLs are impacting in-
frastructure through increased sediment mobilization. FDL-
A is the largest of the investigated FDLs. As of August 2015,
FDL-A was 39.2 m from the toe of the Dalton Highway em-
bankment. Based on its current distance and rate of move-
ment, we predict that FDL-A will reach the Dalton Highway
alignment by 2023.
1 Introduction
An atmospheric temperature rise has been identified as
unequivocal by the Intergovernmental Panel on Climate
Change (IPCC), with greater and faster temperature increase
and an overall precipitation increase demonstrated at north-
ern latitudes (Stocker et al., 2013). Analysis of field data
collected throughout Arctic and subarctic areas corroborates
with IPCC’s findings, demonstrating an overall permafrost
temperature rise (Christiansen et al., 2010; Romanovsky et
al., 2010; Smith et al., 2010). Slopes in permafrost areas
are in danger of instability with rising temperatures. Increas-
ing temperatures lead to deeper active layer depths, resulting
in increased water infiltration; ice within the soil or debris
melts, causing loss of soil strength, accelerated movement,
and potential debris flows or total collapse (Deline et al.,
2015; Geertsema et al., 2006; Gude and Barsch, 2005; Har-
ris et al., 2008a, b; Lewkowicz and Harris, 2005; Swanger
and Marchant, 2007). Slope instability presents a risk to
adjacent infrastructure, especially where roads and utilities
pass through mountainous regions. An increase in infras-
tructure construction may occur in northern regions, includ-
ing Alaska, as Arctic countries focus on economic develop-
ment (EOP, 2014; Sevunts, 2013). Thus, recognizing areas of
slope instability and quantifying historic and potential move-
ment become progressively important as climate changes and
northern regions see increasing development.
Published by Copernicus Publications on behalf of the European Geosciences Union.
978 M. M. Darrow et al.: Frozen debris lobe morphology and movement: an overview of eight dynamic features
An example of previous development in the Alaskan Arc-
tic was the construction of the Trans Alaska Pipeline Sys-
tem (TAPS) and supporting infrastructure, including the Dal-
ton Highway, which opened a corridor within the Brooks
Range. In the late 1970s and early 1980s, those mapping
the geology and geologic hazards along the Dalton High-
way corridor noted the presence of elongated, lobate features
along slopes adjacent to the highway, thought to be inactive
at that time (Hamilton, 1978, 1979, 1981; Kreig and Reger,
1982; Brown and Kreig, 1983). These features were “redis-
covered” in 2008, partially due to the fact that they were in-
deed actively moving. When originally mapped, these fea-
tures were identified as flow slides or rock glaciers; however,
ongoing investigations indicate that they are different from
rock glaciers in their source, composition, rate and mecha-
nism of movement, and vegetation coverage (Daanen et al.,
2012; Simpson et al., 2016). Because of these differences,
these permafrost features were given the new name frozen
debris lobes (FDLs) (Daanen et al., 2012). As the resolution
of freely available satellite imagery improves, we continue to
identify additional FDLs, with nearly 160 FDLs located thus
far within the Brooks Range (Fig. S1 in the Supplement).
Field investigations of FDLs began in 2008 with prelimi-
nary differential global positioning system (DGPS) measure-
ments, soil pits, and field observations on FDL-A, with some
work on nearby FDL-B, FDL-C, and FDL-D (Daanen et al.,
2012). Field work continued with a 2012 subsurface inves-
tigation of FDL-A (Simpson et al., 2016), and we expanded
the area of interest (AOI) in 2013 to comprise eight FDLs
(Fig. 1). Since expanding the investigation, we have trav-
eled to the field two to three times a year to collect DGPS
measurements of the FDL surfaces, as well as samples of
soil, rock, water, and ice. Our field investigations and ob-
servations led us to the following questions. (1) How does
the bedrock source geology contribute to FDL morphology?
(2) Are the investigated FDLs consistent in composition and
morphology? (3) Has the movement of these FDLs been syn-
chronous? (4) Have their rates of movement changed over
time? (5) How can we describe the origin of these features?
(6) How are FDLs impacting infrastructure? In an effort
to answer these questions, in this paper we present for the
first time a comprehensive overview of eight different FDLs
within the Dalton Highway corridor. Within this overview,
we detail catchment geology, measured rock strengths, lobe
soil characteristics, and historic and current rates of move-
ment.
2 Study site and background
The AOI is located in the south-central Brooks Range, within
the Arctic Mountains physiographic division (Wahrhaftig,
1965). This area is underlain by continuous permafrost (Jor-
genson et al., 2008). Daanen et al. (2012) provided an
overview of the historic temperatures of the area, as well as
Figure 1. Map of the study area. (a) Location relative to communi-
ties along the Dalton Highway (shown in purple); blue rectangular
insets show locations of area of interest (AOI). The northern and
southern portions of the AOI (in red) are shown in (b) and (c), re-
spectively. The eight investigated FDLs are shown in yellow and la-
beled; other FDLs within the AOI are shown in lavender. The TAPS
alignment is indicated in green; within the AOI the infrastructure
parallels the Dietrich River. (Base map data from ASGDC, 2014
and GINA, 2001.)
initial descriptions of four FDLs and preliminary character-
ization of movement processes. FDL-A is the largest frozen
debris lobe within the AOI, and the closest to the Dalton
Highway (Fig. 2a). Due to its close proximity to infrastruc-
ture and thus greater potential risk, some of the authors con-
ducted a subsurface investigation of FDL-A jointly with the
Alaska Department of Transportation and Public Facilities in
September 2012 (Darrow et al., 2012, 2013). We drilled a to-
tal of eight boreholes, four on and four adjacent to FDL-A
to the south and west. The borings ranged between 3.0 and
30.5 m deep. In several of the borings, we installed slotted
casing for inclinometer measurements and thermistor strings;
in the 30.5 m deep boring within FDL-A, we installed an au-
tomated Micro-Electro-Mechanical Systems (MEMS)-based
in-place inclinometer (M-IPI), two vibrating-wire piezome-
The Cryosphere, 10, 977–993, 2016 www.the-cryosphere.net/10/977/2016/
M. M. Darrow et al.: Frozen debris lobe morphology and movement: an overview of eight dynamic features 979
(a)
(b)
(c)
(e) (d)
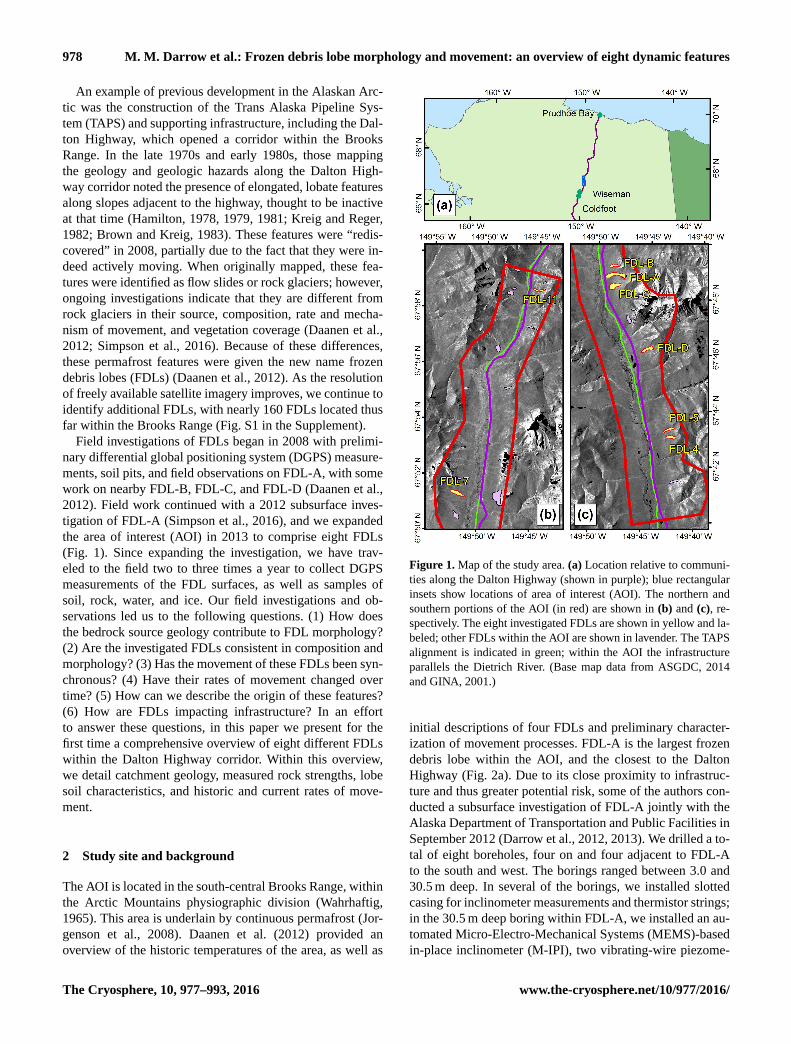
Figure 2. Typical FDL appearance, lobe, and catchment features. (a) FDL-A, originating from a cirque-like catchment; the Dalton Highway
is in the foreground (photograph taken in June 2013). Yellow arrows indicate locations of two retrogressive thaw slumps (RTSs), the blue
arrow indicates the location of the 2012 instrumented borehole, and the green dot is the location of the sampled organic layer. (b) FDL at
the base of a slope outside of the AOI that may have formed from a paleolandslide deposit. The Trans Alaska Pipeline is in the foreground.
(c) FDL-11 catchment, showing typical vegetation and recent scarp; two people stand above the scarp for scale. (d) Riser of smaller surface
lobe on FDL-C. (e) Trees near the right flank lean progressively towards the center of FDL-5.
ters, and a thermistor string (the location of this main in-
strumented borehole is indicated in Fig. 2a). Simpson et
al. (2016) summarized the geotechnical investigation, pre-
senting measured temperatures and slope movement data, the
results of strength testing of frozen soil samples, a slope sta-
bility analysis, and the initial results of a geographical infor-
mation system (GIS) protocol by which to examine FDLs.
Results from these investigations indicate that FDLs are
mainly composed of a fine-grained soil matrix, but also
contain rocks and organic debris. Subsurface measurements
within FDL-A indicate that this frozen debris lobe moves
predominantly through shear in a zone 20.6 to 22.8 m be-
low ground surface (bgs), with temperature-dependent inter-
nal flow as a secondary movement mechanism (Darrow et al.,
2015; Simpson et al., 2016). For example, between Septem-
ber 2012 and August 2015, FDL-A moved 13.8 m through
shear and only 1.9 m through internal flow, for a total dis-
placement of 15.7 m at the main borehole location. The sig-
nificant movement within the shear zone severed the instru-
mentation approximately 1 month after its installation; how-
ever, we are still able to collect subsurface temperature and
movement measurements from the upper 20.6 m of the M-
IPI. Temperatures measured from 15 to 20.6 m from Jan-
uary 2014 through August 2015 were stable at −0.85 ◦C,
whereas the temperature of the adjacent permafrost at 3 m
from the same time period was −2.1 ◦C.
3 Methods
3.1 Fieldwork and sample collection
We selected eight FDLs based on size, evidence of move-
ment, and proximity to the Dalton Highway to assess their
geohazard potential. We installed surface marker pins to
determine current rates and spatial variability of surface
movement, beginning with FDL-A in late October 2012. In
June 2013, we continued the installation on the other seven
investigated FDLs. On each lobe, the surface marker pins
www.the-cryosphere.net/10/977/2016/ The Cryosphere, 10, 977–993, 2016
980 M. M. Darrow et al.: Frozen debris lobe morphology and movement: an overview of eight dynamic features
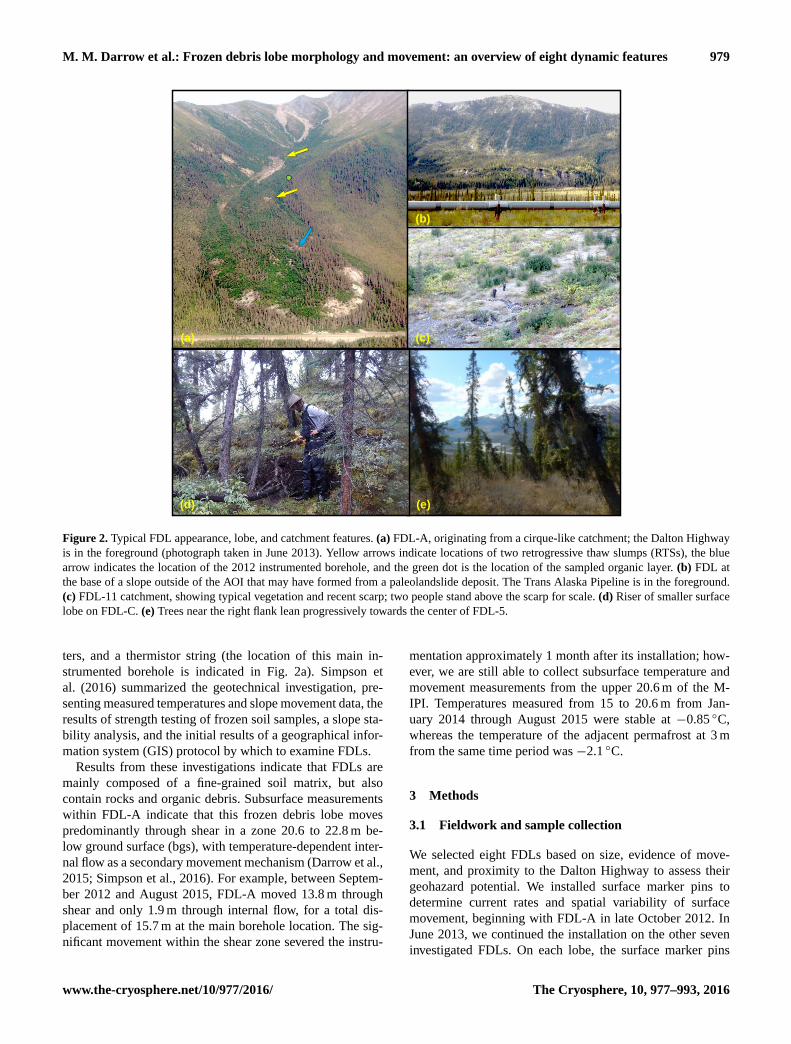
Table 1. Summary of available imagery used for historic analysis. USGS is the US Geological Survey, AHAP stands for Alaska High-
Altitude Photography, and DGGS is the Alaska Division of Geological & Geophysical Surveys. If all FDLs are covered by a given data set,
“none” is stated under limitations.
Year Source Resolution Limitations in
(m) FDL coverage
1955 USGS (aerial) 1.78 none
1970 AHAP (aerial) 2.0 none
1978 AHAP (aerial) 1.5 no FDL-5, FDL-4
1979 AHAP (aerial) 1.5 only FDL-11, FDL-7, FDL-B
1981 AHAP (aerial) 1.5 only FDL-D, FDL-5, FDL-4
1993 Quantum spatial (aerial) 0.3 none
2007 DigitalGlobe Ikonos (satellite) 1.5 only FDL-7, FDL-B
2009 DigitalGlobe WorldView (satellite) 0.5 no FDL-11
2011 DGGS (lidar) 1.0 none
2014 DigitalGlobe WorldView (satellite) 0.5 none
were positioned along a longitudinal profile from the catch-
ment to the lobe toe, and along at least one cross-sectional
transect. We made repeated measurements of all surface
marker pins in August 2013, June and August 2014, and May
and August 2015, with additional measurements of FDL-A
twice in November 2012 and in March or April of each year.
Measurements were made with a DGPS unit, having hori-
zontal and vertical accuracies of ±5 cm. We also located and
mapped easily visible scarps in the less-vegetated catchment
areas with a hand-held GPS. RTSs are present in several FDL
catchments and on the lobes; we repeatedly mapped their
head scarps to determine rates of regression.
We collected rock and soil samples (Fig. S2) to deter-
mine rock strengths and soil engineering index properties.
We sampled rocks from the catchment areas for strength test-
ing, while also updating the pre-existing geologic map of
the area (Spangler and Hubbard, 2016). Tests were made
with a hydraulic point load testing device to determine the
rocks’ point load strength indices, which were converted
to uniaxial compressive strengths. On each lobe, we dug
two 1 m deep soil pits, examining the near-surface soils
and collecting samples for standard engineering index prop-
erty testing, including moisture content (ASTM D2116), or-
ganic content (modified from AASHTO T267), grain size
distribution (AASHTO T27/T11, ASTM D422), and plastic-
ity (ASTM D4318) (AASHTO, 2009; ASTM, 1990, 1998,
2000). All soil classifications are based on the Unified Soil
Classification System (USCS).
Field observations and subsequent analysis of lidar data
indicated the presence of relatively flat benches along the
catchment slopes on either side of FDL-A. Hypothesizing
that the benches represented the paleosurface of FDL-A be-
fore its downslope movement began, in August 2015 we sam-
pled buried organic material from a trench in the active layer
on the south bench (see green dot in Fig. 2a). We submit-
ted the sampled organic soil to Beta Analytic, Inc. for radio-
carbon dating. This laboratory service calibrated the results
using databases associated with the 2013 INTCAL program
(Reimer et al., 2013); the resulting 2-sigma calendar calibra-
tion range is presented herein.
The summer of 2014 was the wettest on record for parts
of interior Alaska, with rainfall exposing massive ice in sev-
eral RTSs on FDL-7, FDL-A, and FDL-D. In August 2014
we collected samples of exposed ice on FDL-A in the lower
RTS near the left flank (see lower yellow arrow in Fig. 2a),
and water samples from the creek that drains FDL-A and
a puddle adjacent to the lobe during a major rain event;
in March 2015, we collected two samples of snow from
the lobe. These samples were submitted for analysis to the
Alaska Stable Isotope Facility at the University of Alaska
Fairbanks’ Water & Environmental Research Center. Stable
isotope data were obtained using continuous-flow isotope ra-
tio mass spectrometry. The δ2H and δ18O values were mea-
sured using a ThermoScientific high temperature elemental
analyzer (TC/EA) and Conflo IV interface with a DeltaVPlus
Mass Spectrometer. Stable isotope ratios were reported in δ
notation as parts per thousand (‰) deviation from the in-
ternational standards, V-SMOW (Standard Mean Ocean Wa-
ter). Typically, instrument precision is < 3.0 ‰ for hydrogen
and < 0.5 ‰ for oxygen. We compared the results obtained
against the Global Meteoric Water Line (GMWL) and iso-
tope values from massive ice bodies taken from the literature.
3.2 Historic image collection and analysis
We acquired aerial and satellite imagery for the AOI from
years between 1955 and 2014 (Table 1); images for each data
set were compiled into mosaics using the Agisoft Photoscan
and ENVI software. The mosaics were orthorectified accord-
ing to the American Society of Photogrammetry and Remote
Sensing’s (ASPRS) horizontal accuracy standards (ASPRS,
2015). In a GIS environment, we used contour lines derived
from digital elevation models (DEMs) produced from 2011
lidar and 2001 Interferometric Synthetic Aperture Radar (If-
The Cryosphere, 10, 977–993, 2016 www.the-cryosphere.net/10/977/2016/

M. M. Darrow et al.: Frozen debris lobe morphology and movement: an overview of eight dynamic features 981
SAR) data (1 and 5 m resolution, respectively), GPS mea-
surements, and field observations as references for determin-
ing catchment and 2011 lobe extents. Next, we determined
the extent of each lobe for each year of available imagery
(spatial limitations in imagery coverage are summarized in
Table 1). Because the FDLs demonstrate only minor lateral
spreading, longitudinal profile polylines oriented along the
center of each lobe served as the consistent reference from
which to measure changes. The distance between each pair
of toe locations measured along the longitudinal center line
for two data sets was divided by the time interval between
data years, resulting in an average movement rate for the time
interval. Each rate was assigned to the latter of the two data
years. Although not part of the rate analysis, we also include
assessment of 2001 and 2002 Google Earth images of the
AOI in the discussion.
4 Results
4.1 Catchments and rock data
Frozen debris lobes typically originate from catchments
(Fig. 2a), many of which may have supported small cirque
glaciers during early to mid-Pleistocene glacial advances
in the area (Hamilton, 1986). In some cases, FDLs have
formed at the base of a slope rather than a catchment, from
the accumulation of loose colluvium (e.g., FDL-C), or from
landslide deposits (Fig. 2b). The catchments of the eight
FDLs presented here range from 121 000 m2 (FDL-B) to
801 000 m2 (FDL-A), with an average size of 414 000 m2
(Table S1 in the Supplement).
The catchments of the investigated FDLs range from bowl-
like and well-defined (FDL-11, FDL-B, FDL-A, FDL-D,
FDL-5), to flatter with more open slopes (FDL-7, FDL-4).
The upper portions of the catchments consist of exposed
rock talus and solifluction lobes supporting shrubby vege-
tation (Fig. 2c). The major sources of debris coming into the
catchments are rockfall and solifluction (Daanen et al., 2012;
Spangler et al., 2013).
The bedrock contributing to the studied catchment ar-
eas consists of heavily fractured, metasedimentary and
metavolcanic rocks, including phyllite, slate, metasiltstone,
metasandstone, greywacke, and conglomerate, with mi-
nor amounts of limestone, marble, and igneous intrusions
(Fig. S2; see Table S2 for rock unit descriptions). The joint
spacing is typically less than 30 mm. The rocks tested had
strengths ranging from 14.0 to 77.3 MPa (Fig. S2, Table S1),
which covers the range from very low strength to medium
strength (Kehew, 2006). It should be noted that testing was
conducted on samples that were competent enough to be col-
lected and transported from the field, which suggests that
these strength values are an overestimate of the actual rock
strengths in the field area. While the bedrock in each catch-
ment consists of different units, the commonality among all
catchments is the predominance of heavily fractured, platy,
foliated rocks. Additionally, while some samples demon-
strated medium strength values, the test results and associ-
ated bedrock geology indicate that most of the catchment ar-
eas are underlain by very low- to low-strength rocks. The
combination of low strength and a high degree of fracturing
suggests that much of the bedrock can be treated as dense
coarse soil (Milligan et al., 2005), thus easily contributing to
the formation of mass movement features such as FDLs.
4.2 Frozen debris lobe composition and morphology
FDLs are elongated lobate features. The areas of the eight
FDLs presented here range from 83 000 m2 (FDL-11) to
286 000 m2 (FDL-A), with an average area of 149 000 m2.
Their length-to-width ratios typically range from 4 : 1 to 7 : 1
(Table S3). An exception is FDL-C, with a length-to-width
ratio of 2 : 1. The rounder appearance of this lobe is most
likely due to its origin at the base of a slope rather than in a
catchment, which limits both its supply of debris and water.
Most notable about the surface of FDL-C are the smaller,
superimposed surface lobes that form as the mass moves
downslope (Fig. 2d). These features are present on several
other lobes, including FDL-A. Analysis of subsurface data
suggests that the surface lobes form as faster internal flow
within the active layer becomes sandwiched between the
cooling surface and the rising permafrost table in the fall
(Darrow et al., 2015). Soil pits excavated into the top 1 m
of several of the lobes contained buried organic layers, pos-
sibly buried as the surface was overrun by uphill material in
a surface lobe.
A special case of buried organic material was manifested
on the south bench of FDL-A. The trench dug into the ac-
tive layer at this location exposed the transition of colluvium
(brown organic silt) into FDL-A lobe soil (gray silty sand
with gravel). Within the lobe soil, we intercepted a buried
organic layer that was submitted for radiocarbon dating; the
calibrated result (95 % probability) indicated a time of burial
between Cal AD 1220 to 1285.
FDLs are composed of platy rocks typical of their catch-
ments, organic debris such as trees and shrubs, and a soil ma-
trix composed of silty sand with varying amounts of gravel,
all of which is frozen (Table S3). Where sampled, the upper
1 m of tested FDL soils was moist to wet and slightly organic
to organic. Similar tests were conducted on the subsurface
samples obtained from the 2012 drilling on FDL-A. Samples
were collected from depths ranging from 2.9 to 24.8 m bgs,
and tested uniformly as wet (when thawed) silty sand with
gravel (Table S3), indicating a consistency in the soil grada-
tion and moisture content with depth that may occur for all
FDLs. Boreholes from the 2012 subsurface investigation in-
tercepted no massive ice, and all samples obtained from the
drilling were ice-poor (i.e., samples contained no excess ice
and volumetric moisture contents (averaging 31 %) were less
than the calculated porosity of the soil).
www.the-cryosphere.net/10/977/2016/ The Cryosphere, 10, 977–993, 2016

982 M. M. Darrow et al.: Frozen debris lobe morphology and movement: an overview of eight dynamic features
While the sampled soils were ice-poor, in striking contrast
massive ice does exist within the FDLs. Over several years,
we measured and observed the changes of two RTSs on FDL-
A’s surface (Fig. 2a). Figure 3 contains photographs of the
change in the upper RTS, which retreated up to 20 m between
2011 and 2015 due to the melting of massive ice.
There are several different origins of massive ice in
periglacial regions (Davis, 2001; Washburn, 1985; Williams
and Smith, 1989); we propose that the ice exposed in the
FDLs is infiltration ice, which forms when surface runoff
(from rain or snowmelt) enters into cracks in the ground and
quickly freezes. Tarussov (1992) used the term “infiltration
ice” to describe a similar phenomenon produced as summer
melt infiltrates glacial ice. The ice we observed in the RTS
head scarps was clear, consisting of large crystals, and con-
taining bubbles and strands of fungus (Fig. 4a, inset). Obser-
vations of the head scarp in the lower RTS further support the
infiltration ice origin. The exposed massive ice corresponded
with an open surface crack with a buried organic layer ver-
tically offset to its right and left, indicating extension and
downslope movement (Fig. 4a).
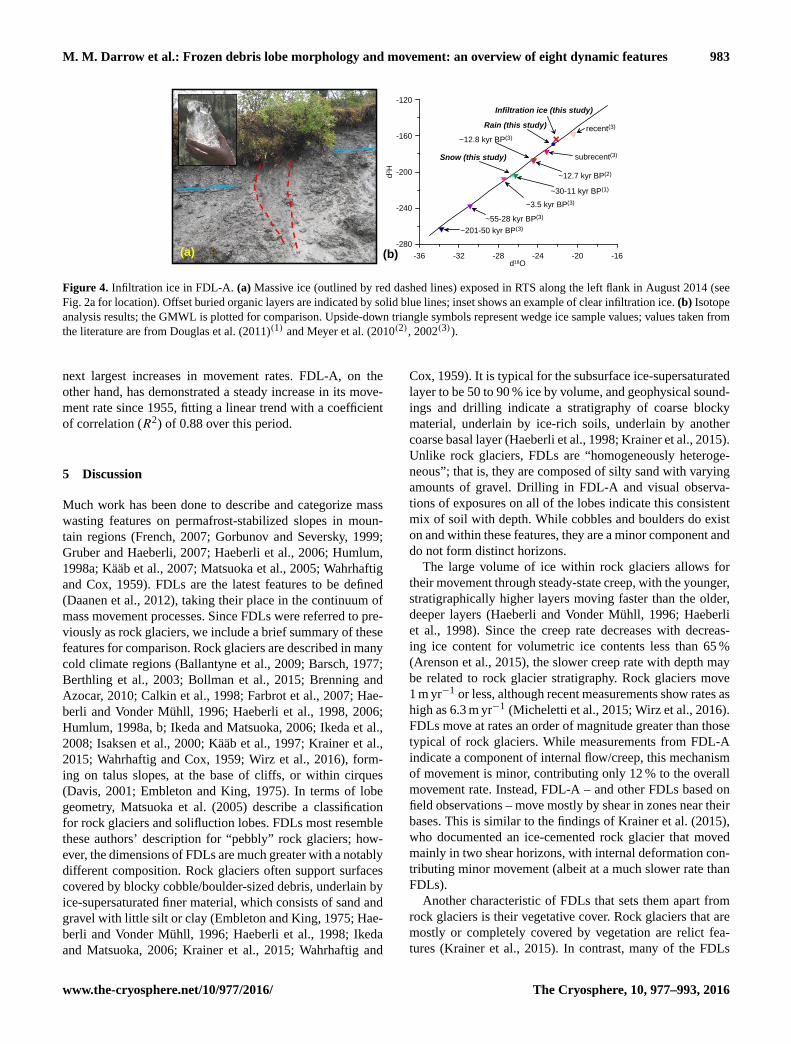
Figure 4b is a presentation of the isotope analysis results
with the GMWL and isotope values from massive ice bod-
ies taken from the literature, including Pleistocene wedge ice
near Fairbanks, Alaska (Douglas et al., 2011), late glacial
and Holocene wedge ice near Barrow, Alaska (Meyer et al.,
2010), and a suite of wedge ice samples ranging in age from
Pleistocene to recent from northern Siberia (Meyer et al.,
2002). This collection of data indicates that the oldest ice
has the lightest isotopic composition, which becomes heavier
with decreasing age. The infiltration ice sample from FDL-A
is bracketed by recent and subrecent wedge ice. The heavy
isotopic composition of the sampled ice and its similarity to
the creek and puddle samples supports the hypothesis that
infiltration ice forms predominantly from rain water entering
cracks open at the surface.
4.3 Frozen debris lobe movement rates
Figures 5 and 6 are vector maps, illustrating the amount of
movement measured on the lobe surfaces between June 2013
and August 2015, as well as RTS head scarp retreat. The
lobes were divided into those demonstrating between 6 and
45 m of movement (Fig. 5), and those demonstrating less than
6 m of movement (Fig. 6) during the measurement period.
Movement is generally parallel to each FDL’s longitudinal
profile. Levees that formed along the lobe flanks demonstrate
a component of movement away from the center line, indi-
cating some spreading of the lobe along its periphery (see
FDL-7, FDL-A, FDL-C, and FDL-4 as examples). Addition-
ally, the levees move more slowly than the rest of the lobe.
We observed a notable example of this differential movement
in August 2014 on FDL-7 when a recent debris flow along
the levee margin was sheared forming echelon cracks within
the young deposit. The average rates of movement for all
(b)
(a)
(c)
Figure 3. Retrogressive thaw slump (RTS) development on FDL-A:
(a) August 2008; (b) June 2013; (c) August 2015. Arrows and out-
lines indicate the same two trees in all three images for comparison.
FDLs for the 2013–2014 and 2014–2015 measurement peri-
ods are presented in Table S3. These values exclude measure-
ments taken on levees or above the lobes in their catchments.
The 2014–2015 rates range from 0.2 m yr−1 for FDL-11 to
13.3 m yr−1 for FDL-D, with FDL-A falling in between at
5.2 m yr−1.
4.4 Analysis of historic imagery
Figure 7 is a presentation of the change in extent of the eight
investigated FDLs from 1955 to 2014, and changes in move-
ment rates over this period are presented in Fig. 8 (see Ta-
ble S4 for a rate summary). The eight FDLs can be divided
into two general groups, those with increasing rate trends
(either steadily or rapidly increasing; Fig. 8a and b, respec-
tively), and those with decreasing rate trends (Fig. 8c). Only
two of the eight FDLs have decreasing rate trends.
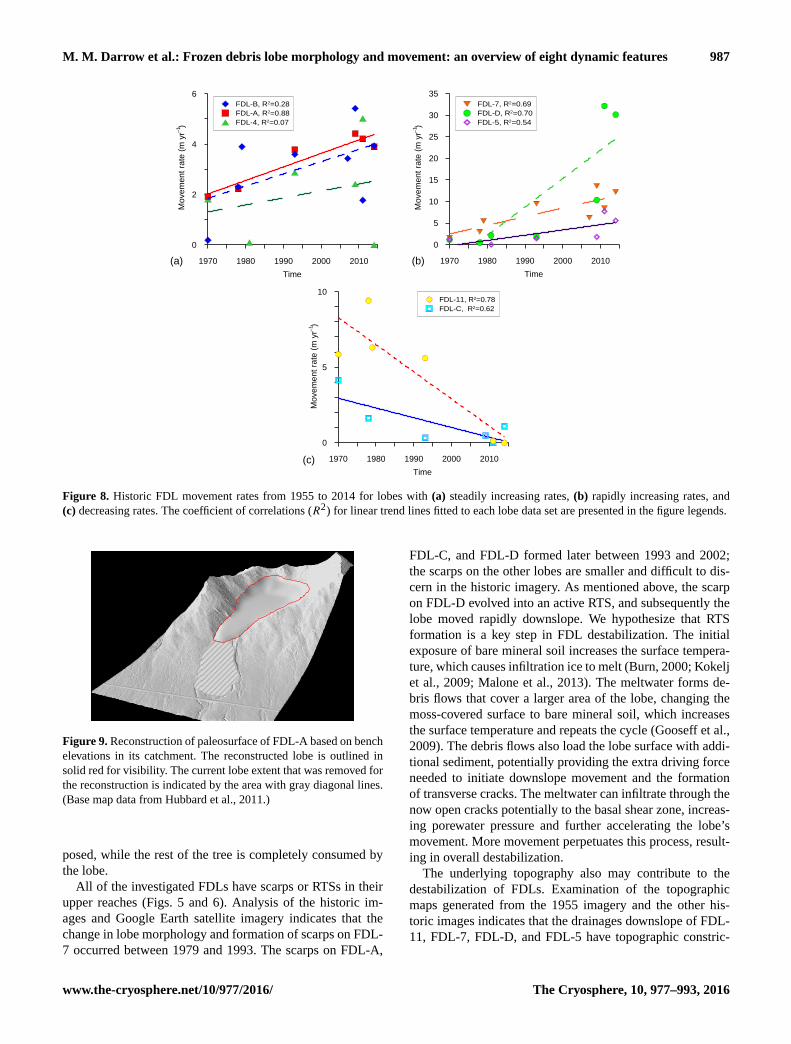
Analysis of the visual progression and rates indicates
that movement of these FDLs has been asynchronous over
the study period. For example, FDL-11 advanced nearly
10 m yr−1 in the 1970s, faster than any of the other FDLs
at that time; however, our surface marker measurements in-
dicate that FDL-11 is currently moving only 0.2 m yr−1. In
contrast, FDL-D experienced a rapid increase in movement
in recent years, moving an average 32.1 m yr−1 between
2009 and 2011, with FDL-7 and FDL-5 demonstrating the
The Cryosphere, 10, 977–993, 2016 www.the-cryosphere.net/10/977/2016/
M. M. Darrow et al.: Frozen debris lobe morphology and movement: an overview of eight dynamic features 983
-36 -32 -28 -24 -20 -16d18O
-280
-240
-200
-160
-120
d2H
recent(3)
Infiltration ice (this study)
Rain (this study)
subrecent(3)
~12.7 kyr BP(2)
~30-11 kyr BP(1)
~3.5 kyr BP(3)
~12.8 kyr BP(3)
Snow (this study)
~55-28 kyr BP(3)
~201-50 kyr BP(3)
(a) (b)
Figure 4. Infiltration ice in FDL-A. (a) Massive ice (outlined by red dashed lines) exposed in RTS along the left flank in August 2014 (see
Fig. 2a for location). Offset buried organic layers are indicated by solid blue lines; inset shows an example of clear infiltration ice. (b) Isotope
analysis results; the GMWL is plotted for comparison. Upside-down triangle symbols represent wedge ice sample values; values taken from
the literature are from Douglas et al. (2011)(1) and Meyer et al. (2010(2), 2002(3)).
next largest increases in movement rates. FDL-A, on the
other hand, has demonstrated a steady increase in its move-
ment rate since 1955, fitting a linear trend with a coefficient
of correlation (R2) of 0.88 over this period.
5 Discussion
Much work has been done to describe and categorize mass
wasting features on permafrost-stabilized slopes in moun-
tain regions (French, 2007; Gorbunov and Seversky, 1999;
Gruber and Haeberli, 2007; Haeberli et al., 2006; Humlum,
1998a; Kääb et al., 2007; Matsuoka et al., 2005; Wahrhaftig
and Cox, 1959). FDLs are the latest features to be defined
(Daanen et al., 2012), taking their place in the continuum of
mass movement processes. Since FDLs were referred to pre-
viously as rock glaciers, we include a brief summary of these
features for comparison. Rock glaciers are described in many
cold climate regions (Ballantyne et al., 2009; Barsch, 1977;
Berthling et al., 2003; Bollman et al., 2015; Brenning and
Azocar, 2010; Calkin et al., 1998; Farbrot et al., 2007; Hae-
berli and Vonder Mühll, 1996; Haeberli et al., 1998, 2006;
Humlum, 1998a, b; Ikeda and Matsuoka, 2006; Ikeda et al.,
2008; Isaksen et al., 2000; Kääb et al., 1997; Krainer et al.,
2015; Wahrhaftig and Cox, 1959; Wirz et al., 2016), form-
ing on talus slopes, at the base of cliffs, or within cirques
(Davis, 2001; Embleton and King, 1975). In terms of lobe
geometry, Matsuoka et al. (2005) describe a classification
for rock glaciers and solifluction lobes. FDLs most resemble
these authors’ description for “pebbly” rock glaciers; how-
ever, the dimensions of FDLs are much greater with a notably
different composition. Rock glaciers often support surfaces
covered by blocky cobble/boulder-sized debris, underlain by
ice-supersaturated finer material, which consists of sand and
gravel with little silt or clay (Embleton and King, 1975; Hae-
berli and Vonder Mühll, 1996; Haeberli et al., 1998; Ikeda
and Matsuoka, 2006; Krainer et al., 2015; Wahrhaftig and
Cox, 1959). It is typical for the subsurface ice-supersaturated
layer to be 50 to 90 % ice by volume, and geophysical sound-
ings and drilling indicate a stratigraphy of coarse blocky
material, underlain by ice-rich soils, underlain by another
coarse basal layer (Haeberli et al., 1998; Krainer et al., 2015).
Unlike rock glaciers, FDLs are “homogeneously heteroge-
neous”; that is, they are composed of silty sand with varying
amounts of gravel. Drilling in FDL-A and visual observa-
tions of exposures on all of the lobes indicate this consistent
mix of soil with depth. While cobbles and boulders do exist
on and within these features, they are a minor component and
do not form distinct horizons.
The large volume of ice within rock glaciers allows for
their movement through steady-state creep, with the younger,
stratigraphically higher layers moving faster than the older,
deeper layers (Haeberli and Vonder Mühll, 1996; Haeberli
et al., 1998). Since the creep rate decreases with decreas-
ing ice content for volumetric ice contents less than 65 %
(Arenson et al., 2015), the slower creep rate with depth may
be related to rock glacier stratigraphy. Rock glaciers move
1 m yr−1 or less, although recent measurements show rates as
high as 6.3 m yr−1 (Micheletti et al., 2015; Wirz et al., 2016).
FDLs move at rates an order of magnitude greater than those
typical of rock glaciers. While measurements from FDL-A
indicate a component of internal flow/creep, this mechanism
of movement is minor, contributing only 12 % to the overall
movement rate. Instead, FDL-A – and other FDLs based on
field observations – move mostly by shear in zones near their
bases. This is similar to the findings of Krainer et al. (2015),
who documented an ice-cemented rock glacier that moved
mainly in two shear horizons, with internal deformation con-
tributing minor movement (albeit at a much slower rate than
FDLs).
Another characteristic of FDLs that sets them apart from
rock glaciers is their vegetative cover. Rock glaciers that are
mostly or completely covered by vegetation are relict fea-
tures (Krainer et al., 2015). In contrast, many of the FDLs
www.the-cryosphere.net/10/977/2016/ The Cryosphere, 10, 977–993, 2016

984 M. M. Darrow et al.: Frozen debris lobe morphology and movement: an overview of eight dynamic features
Figure 5. Vector maps of (a) FDL-7, (b) FDL-A, and (c) FDL–D,
summarizing movement measured from June 2013 to August 2015,
and RTS development. The scale of each image is 1 : 10 000. Vectors
are scaled from the 40 m scale included in the legend. The arrow and
the green dot in (b) indicate the location of sampled organics for
radiocarbon dating, and the location of the 2012 borehole on FDL-
A is indicated by the white and black symbol. As the base maps are
from 2011 lidar data (Hubbard et al., 2011), the 2014 FDL extents
are also shown.
within the Dalton Highway corridor support mature white
spruce forests on their surfaces and all support brushy veg-
etation; the trees indicate movement of the underlying, ac-
tive FDL by their orientations away from vertical. Occasion-
ally, active forested rock glaciers do exist, such as Tien Shan
rock glaciers in central Asia (Sorg et al., 2015) and the Slims
River lobate rock glacier in Canada (Blumstengel and Harris,
1988); however, their slower rates of movement and compo-
sition differentiate these rock glaciers from FDLs.
Haeberli et al. (1998) presented a discussion of how the
multilayered structure of rock glaciers forms, and Haeberli
and Vonder Mühll (1996) suggested that many rock glaciers
in the European Alps have been in existence since the begin-
ning of the Holocene. Recent work by Krainer et al. (2015)
on a rock glacier in the Italian Alps verified its formation
nearly 10 300 years ago. Similar ages are suggested for rock
glaciers in Alaska’s northern and central Brooks Range, with
rock glaciers forming from increased rockfall from over-
steepened valleys and cirque walls after Pleistocene glacial
retreat (Calkin et al., 1987; Ellis and Calkin, 1984).
In the southern Brooks Range, the catchments within the
AOI supported cirque glaciers during the Itkillik I advance
(110–60 ka), but subsequent advances were not as extensive
(Hamilton, 1978, 1986); thus, these catchments may have
been ice-free longer than the Holocene. With the retreating
ice, debris accumulated in the catchment bottoms. The platy
and weak rocks typical of the area weathered to form the silty
sand with gravel soil matrix comprising FDLs. As the AOI
was propitious for the formation of permafrost, the debris
froze as it accumulated, providing rheological properties that
both countered erosional processes and allowed flow. Accu-
mulation continued until the debris reached a “critical mass”
and began to flow out of the catchment areas. The recharge
of the debris in the catchment areas is at a much slower rate
than the movement rates of the individual lobes; thus, this is
the first and only journey these specific features will make
downslope. As indicated by Daanen et al. (2012), the end
of this mass movement process is an alluvial fan that forms
when an FDL completely destabilizes or when it reaches the
river in the valley bottom, which removes the toe.
When did these FDLs begin to flow from their catchments?
The answer to this question is important to build a framework
from which to evaluate the risk these features pose to the ad-
jacent infrastructure, and here we focus on FDL-A. FDL-A
is farther downslope than any of the other lobes, which sug-
gests that it either began to flow out of its catchment ear-
lier or experienced rapid downslope movement. The benches
present on either side of its lower catchment may represent
its paleosurface before downslope movement began. Recre-
ating the lobe within the catchment at this level provides a
rough volume estimate of 1 450 000 m3 (Fig. 9). The sam-
pled organic layer from within the bench was buried (possi-
bly by debris flow deposits) as the lobe surface was actively
building. Based on the radiocarbon date, the bulk of the lobe
moved downslope around 730 to 795 years ago, leaving be-
hind the benches and the buried organic material at the lobe’s
original elevation. While this interpretation is based on only
one date from one site on FDL-A, it provides a general time
frame for this stage of lobe development.
Downslope movement of an FDL causes tension and
shearing, resulting in the formation of surface cracks. All
of the investigated FDLs support numerous transverse and
longitudinal cracks, and we suspect that these cracks con-
tain infiltration ice. As a crack opens due to movement, water
entering the crack freezes forming infiltration ice; the crack
cannot close again, nor fill with debris. Thus, infiltration ice
The Cryosphere, 10, 977–993, 2016 www.the-cryosphere.net/10/977/2016/
M. M. Darrow et al.: Frozen debris lobe morphology and movement: an overview of eight dynamic features 985
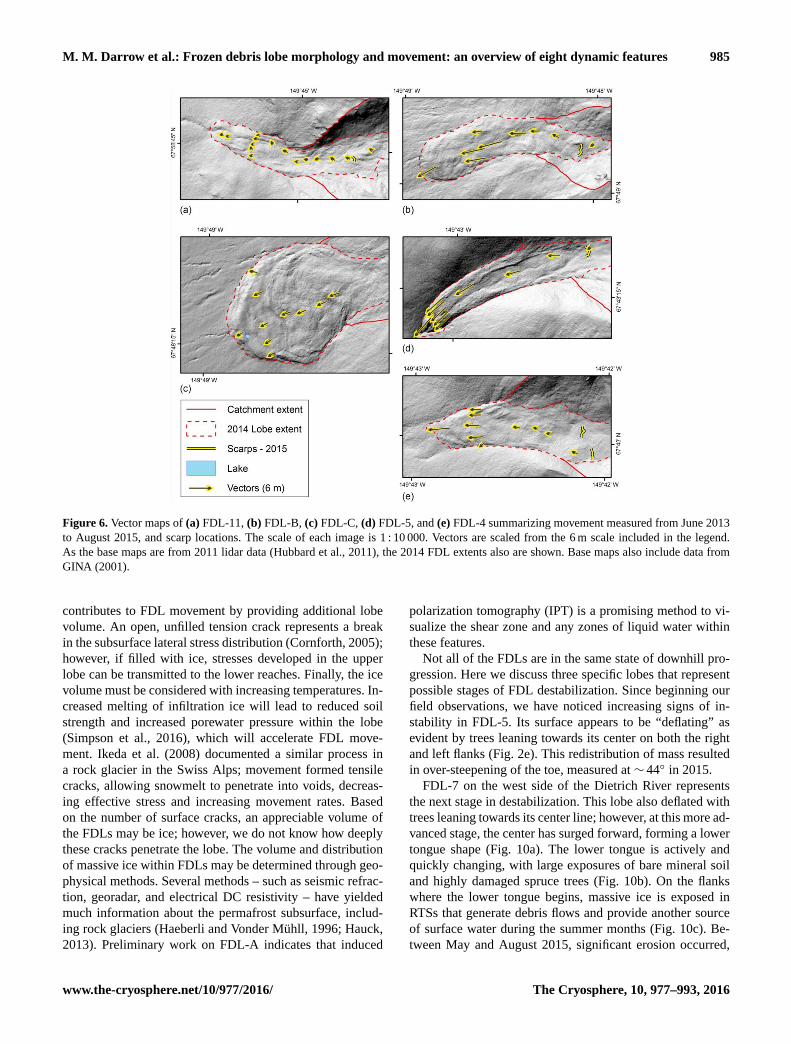
Figure 6. Vector maps of (a) FDL-11, (b) FDL-B, (c) FDL-C, (d) FDL-5, and (e) FDL-4 summarizing movement measured from June 2013
to August 2015, and scarp locations. The scale of each image is 1 : 10 000. Vectors are scaled from the 6 m scale included in the legend.
As the base maps are from 2011 lidar data (Hubbard et al., 2011), the 2014 FDL extents also are shown. Base maps also include data from
GINA (2001).
contributes to FDL movement by providing additional lobe
volume. An open, unfilled tension crack represents a break
in the subsurface lateral stress distribution (Cornforth, 2005);
however, if filled with ice, stresses developed in the upper
lobe can be transmitted to the lower reaches. Finally, the ice
volume must be considered with increasing temperatures. In-
creased melting of infiltration ice will lead to reduced soil
strength and increased porewater pressure within the lobe
(Simpson et al., 2016), which will accelerate FDL move-
ment. Ikeda et al. (2008) documented a similar process in
a rock glacier in the Swiss Alps; movement formed tensile
cracks, allowing snowmelt to penetrate into voids, decreas-
ing effective stress and increasing movement rates. Based
on the number of surface cracks, an appreciable volume of
the FDLs may be ice; however, we do not know how deeply
these cracks penetrate the lobe. The volume and distribution
of massive ice within FDLs may be determined through geo-
physical methods. Several methods – such as seismic refrac-
tion, georadar, and electrical DC resistivity – have yielded
much information about the permafrost subsurface, includ-
ing rock glaciers (Haeberli and Vonder Mühll, 1996; Hauck,
2013). Preliminary work on FDL-A indicates that induced
polarization tomography (IPT) is a promising method to vi-
sualize the shear zone and any zones of liquid water within
these features.
Not all of the FDLs are in the same state of downhill pro-
gression. Here we discuss three specific lobes that represent
possible stages of FDL destabilization. Since beginning our
field observations, we have noticed increasing signs of in-
stability in FDL-5. Its surface appears to be “deflating” as
evident by trees leaning towards its center on both the right
and left flanks (Fig. 2e). This redistribution of mass resulted
in over-steepening of the toe, measured at ∼ 44◦ in 2015.
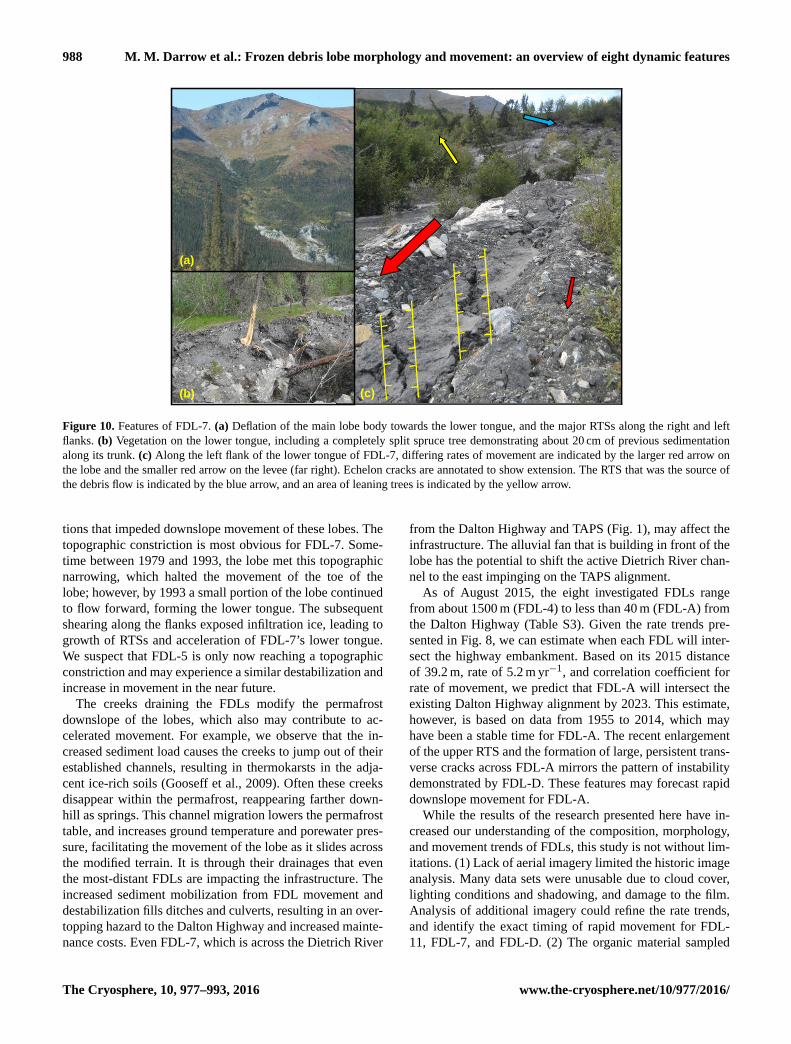
FDL-7 on the west side of the Dietrich River represents
the next stage in destabilization. This lobe also deflated with
trees leaning towards its center line; however, at this more ad-
vanced stage, the center has surged forward, forming a lower
tongue shape (Fig. 10a). The lower tongue is actively and
quickly changing, with large exposures of bare mineral soil
and highly damaged spruce trees (Fig. 10b). On the flanks
where the lower tongue begins, massive ice is exposed in
RTSs that generate debris flows and provide another source
of surface water during the summer months (Fig. 10c). Be-
tween May and August 2015, significant erosion occurred,
www.the-cryosphere.net/10/977/2016/ The Cryosphere, 10, 977–993, 2016
986 M. M. Darrow et al.: Frozen debris lobe morphology and movement: an overview of eight dynamic features
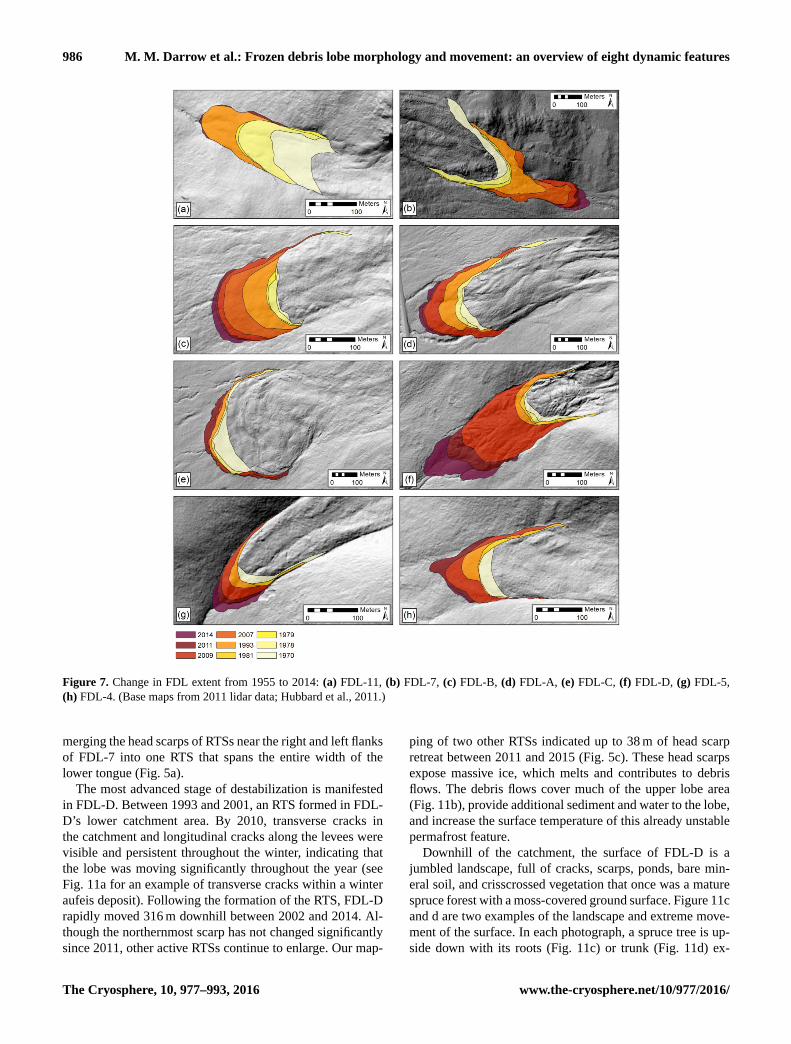
Figure 7. Change in FDL extent from 1955 to 2014: (a) FDL-11, (b) FDL-7, (c) FDL-B, (d) FDL-A, (e) FDL-C, (f) FDL-D, (g) FDL-5,
(h) FDL-4. (Base maps from 2011 lidar data; Hubbard et al., 2011.)
merging the head scarps of RTSs near the right and left flanks
of FDL-7 into one RTS that spans the entire width of the
lower tongue (Fig. 5a).
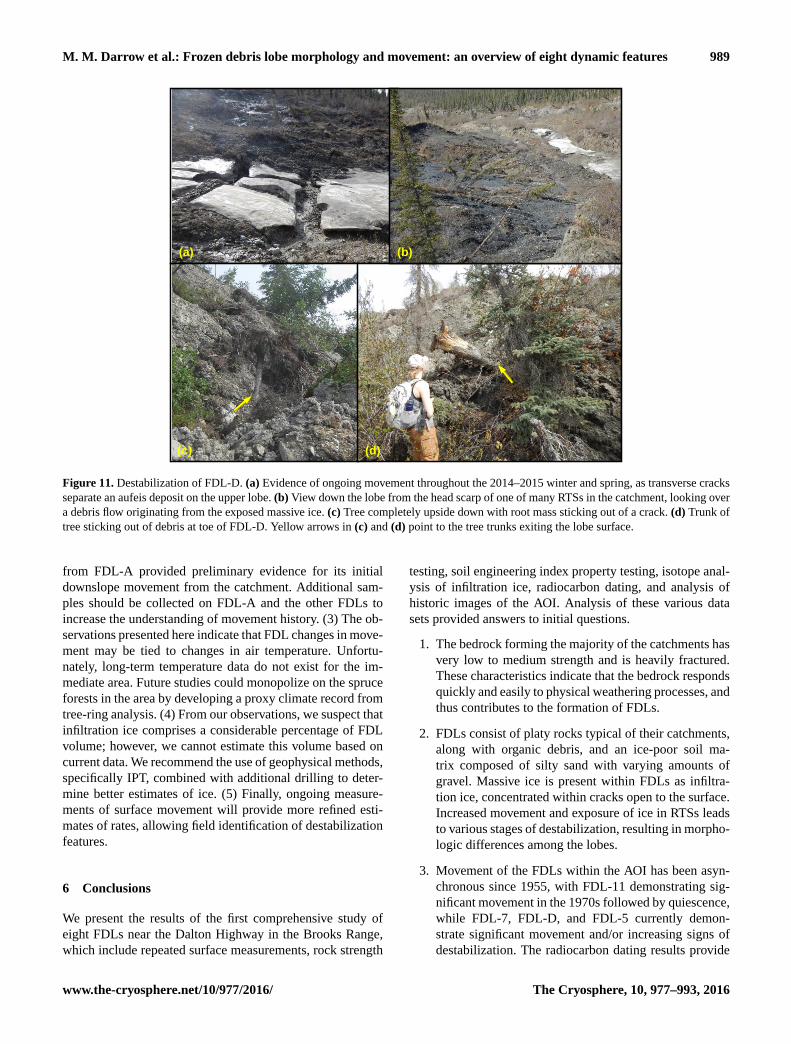
The most advanced stage of destabilization is manifested
in FDL-D. Between 1993 and 2001, an RTS formed in FDL-
D’s lower catchment area. By 2010, transverse cracks in
the catchment and longitudinal cracks along the levees were
visible and persistent throughout the winter, indicating that
the lobe was moving significantly throughout the year (see
Fig. 11a for an example of transverse cracks within a winter
aufeis deposit). Following the formation of the RTS, FDL-D
rapidly moved 316 m downhill between 2002 and 2014. Al-
though the northernmost scarp has not changed significantly
since 2011, other active RTSs continue to enlarge. Our map-
ping of two other RTSs indicated up to 38 m of head scarp
retreat between 2011 and 2015 (Fig. 5c). These head scarps
expose massive ice, which melts and contributes to debris
flows. The debris flows cover much of the upper lobe area
(Fig. 11b), provide additional sediment and water to the lobe,
and increase the surface temperature of this already unstable
permafrost feature.
Downhill of the catchment, the surface of FDL-D is a
jumbled landscape, full of cracks, scarps, ponds, bare min-
eral soil, and crisscrossed vegetation that once was a mature
spruce forest with a moss-covered ground surface. Figure 11c
and d are two examples of the landscape and extreme move-
ment of the surface. In each photograph, a spruce tree is up-
side down with its roots (Fig. 11c) or trunk (Fig. 11d) ex-
The Cryosphere, 10, 977–993, 2016 www.the-cryosphere.net/10/977/2016/
M. M. Darrow et al.: Frozen debris lobe morphology and movement: an overview of eight dynamic features 987
1970 1980 1990 2000 2010
Time
0
5
10
15
20
25
30
35
FDL-7, R2=0.69
FDL-D, R2=0.70
FDL-5, R2=0.54
1970 1980 1990 2000 2010
Time
0
5
10
Mov
emen
t rat
e (m
yr
)FDL-11, R2=0.78
FDL-C, R2=0.62
1970 1980 1990 2000 2010
Time
0
2
4
6
FDL-B, R2=0.28
FDL-A, R2=0.88
FDL-4, R2=0.07
(a) (b)
(c)
–1
Mov
emen
t rat
e (m
yr
)–1
Mov
emen
t rat
e (m
yr
)–1
Figure 8. Historic FDL movement rates from 1955 to 2014 for lobes with (a) steadily increasing rates, (b) rapidly increasing rates, and
(c) decreasing rates. The coefficient of correlations (R2) for linear trend lines fitted to each lobe data set are presented in the figure legends.
Figure 9. Reconstruction of paleosurface of FDL-A based on bench
elevations in its catchment. The reconstructed lobe is outlined in
solid red for visibility. The current lobe extent that was removed for
the reconstruction is indicated by the area with gray diagonal lines.
(Base map data from Hubbard et al., 2011.)
posed, while the rest of the tree is completely consumed by
the lobe.
All of the investigated FDLs have scarps or RTSs in their
upper reaches (Figs. 5 and 6). Analysis of the historic im-
ages and Google Earth satellite imagery indicates that the
change in lobe morphology and formation of scarps on FDL-
7 occurred between 1979 and 1993. The scarps on FDL-A,
FDL-C, and FDL-D formed later between 1993 and 2002;
the scarps on the other lobes are smaller and difficult to dis-
cern in the historic imagery. As mentioned above, the scarp
on FDL-D evolved into an active RTS, and subsequently the
lobe moved rapidly downslope. We hypothesize that RTS
formation is a key step in FDL destabilization. The initial
exposure of bare mineral soil increases the surface tempera-
ture, which causes infiltration ice to melt (Burn, 2000; Kokelj
et al., 2009; Malone et al., 2013). The meltwater forms de-
bris flows that cover a larger area of the lobe, changing the
moss-covered surface to bare mineral soil, which increases
the surface temperature and repeats the cycle (Gooseff et al.,
2009). The debris flows also load the lobe surface with addi-
tional sediment, potentially providing the extra driving force
needed to initiate downslope movement and the formation
of transverse cracks. The meltwater can infiltrate through the
now open cracks potentially to the basal shear zone, increas-
ing porewater pressure and further accelerating the lobe’s
movement. More movement perpetuates this process, result-
ing in overall destabilization.
The underlying topography also may contribute to the
destabilization of FDLs. Examination of the topographic
maps generated from the 1955 imagery and the other his-
toric images indicates that the drainages downslope of FDL-
11, FDL-7, FDL-D, and FDL-5 have topographic constric-
www.the-cryosphere.net/10/977/2016/ The Cryosphere, 10, 977–993, 2016
988 M. M. Darrow et al.: Frozen debris lobe morphology and movement: an overview of eight dynamic features
(a)
(b) (c)
Figure 10. Features of FDL-7. (a) Deflation of the main lobe body towards the lower tongue, and the major RTSs along the right and left
flanks. (b) Vegetation on the lower tongue, including a completely split spruce tree demonstrating about 20 cm of previous sedimentation
along its trunk. (c) Along the left flank of the lower tongue of FDL-7, differing rates of movement are indicated by the larger red arrow on
the lobe and the smaller red arrow on the levee (far right). Echelon cracks are annotated to show extension. The RTS that was the source of
the debris flow is indicated by the blue arrow, and an area of leaning trees is indicated by the yellow arrow.
tions that impeded downslope movement of these lobes. The
topographic constriction is most obvious for FDL-7. Some-
time between 1979 and 1993, the lobe met this topographic
narrowing, which halted the movement of the toe of the
lobe; however, by 1993 a small portion of the lobe continued
to flow forward, forming the lower tongue. The subsequent
shearing along the flanks exposed infiltration ice, leading to
growth of RTSs and acceleration of FDL-7’s lower tongue.
We suspect that FDL-5 is only now reaching a topographic
constriction and may experience a similar destabilization and
increase in movement in the near future.
The creeks draining the FDLs modify the permafrost
downslope of the lobes, which also may contribute to ac-
celerated movement. For example, we observe that the in-
creased sediment load causes the creeks to jump out of their
established channels, resulting in thermokarsts in the adja-
cent ice-rich soils (Gooseff et al., 2009). Often these creeks
disappear within the permafrost, reappearing farther down-
hill as springs. This channel migration lowers the permafrost
table, and increases ground temperature and porewater pres-
sure, facilitating the movement of the lobe as it slides across
the modified terrain. It is through their drainages that even
the most-distant FDLs are impacting the infrastructure. The
increased sediment mobilization from FDL movement and
destabilization fills ditches and culverts, resulting in an over-
topping hazard to the Dalton Highway and increased mainte-
nance costs. Even FDL-7, which is across the Dietrich River
from the Dalton Highway and TAPS (Fig. 1), may affect the
infrastructure. The alluvial fan that is building in front of the
lobe has the potential to shift the active Dietrich River chan-
nel to the east impinging on the TAPS alignment.
As of August 2015, the eight investigated FDLs range
from about 1500 m (FDL-4) to less than 40 m (FDL-A) from
the Dalton Highway (Table S3). Given the rate trends pre-
sented in Fig. 8, we can estimate when each FDL will inter-
sect the highway embankment. Based on its 2015 distance
of 39.2 m, rate of 5.2 m yr−1, and correlation coefficient for
rate of movement, we predict that FDL-A will intersect the
existing Dalton Highway alignment by 2023. This estimate,
however, is based on data from 1955 to 2014, which may
have been a stable time for FDL-A. The recent enlargement
of the upper RTS and the formation of large, persistent trans-
verse cracks across FDL-A mirrors the pattern of instability
demonstrated by FDL-D. These features may forecast rapid
downslope movement for FDL-A.
While the results of the research presented here have in-
creased our understanding of the composition, morphology,
and movement trends of FDLs, this study is not without lim-
itations. (1) Lack of aerial imagery limited the historic image
analysis. Many data sets were unusable due to cloud cover,
lighting conditions and shadowing, and damage to the film.
Analysis of additional imagery could refine the rate trends,
and identify the exact timing of rapid movement for FDL-
11, FDL-7, and FDL-D. (2) The organic material sampled
The Cryosphere, 10, 977–993, 2016 www.the-cryosphere.net/10/977/2016/
M. M. Darrow et al.: Frozen debris lobe morphology and movement: an overview of eight dynamic features 989
(a)
(c) (d)
(b)
Figure 11. Destabilization of FDL-D. (a) Evidence of ongoing movement throughout the 2014–2015 winter and spring, as transverse cracks
separate an aufeis deposit on the upper lobe. (b) View down the lobe from the head scarp of one of many RTSs in the catchment, looking over
a debris flow originating from the exposed massive ice. (c) Tree completely upside down with root mass sticking out of a crack. (d) Trunk of
tree sticking out of debris at toe of FDL-D. Yellow arrows in (c) and (d) point to the tree trunks exiting the lobe surface.
from FDL-A provided preliminary evidence for its initial
downslope movement from the catchment. Additional sam-
ples should be collected on FDL-A and the other FDLs to
increase the understanding of movement history. (3) The ob-
servations presented here indicate that FDL changes in move-
ment may be tied to changes in air temperature. Unfortu-
nately, long-term temperature data do not exist for the im-
mediate area. Future studies could monopolize on the spruce
forests in the area by developing a proxy climate record from
tree-ring analysis. (4) From our observations, we suspect that
infiltration ice comprises a considerable percentage of FDL
volume; however, we cannot estimate this volume based on
current data. We recommend the use of geophysical methods,
specifically IPT, combined with additional drilling to deter-
mine better estimates of ice. (5) Finally, ongoing measure-
ments of surface movement will provide more refined esti-
mates of rates, allowing field identification of destabilization
features.
6 Conclusions
We present the results of the first comprehensive study of
eight FDLs near the Dalton Highway in the Brooks Range,
which include repeated surface measurements, rock strength
testing, soil engineering index property testing, isotope anal-
ysis of infiltration ice, radiocarbon dating, and analysis of
historic images of the AOI. Analysis of these various data
sets provided answers to initial questions.
1. The bedrock forming the majority of the catchments has
very low to medium strength and is heavily fractured.
These characteristics indicate that the bedrock responds
quickly and easily to physical weathering processes, and
thus contributes to the formation of FDLs.
2. FDLs consist of platy rocks typical of their catchments,
along with organic debris, and an ice-poor soil ma-
trix composed of silty sand with varying amounts of
gravel. Massive ice is present within FDLs as infiltra-
tion ice, concentrated within cracks open to the surface.
Increased movement and exposure of ice in RTSs leads
to various stages of destabilization, resulting in morpho-
logic differences among the lobes.
3. Movement of the FDLs within the AOI has been asyn-
chronous since 1955, with FDL-11 demonstrating sig-
nificant movement in the 1970s followed by quiescence,
while FDL-7, FDL-D, and FDL-5 currently demon-
strate significant movement and/or increasing signs of
destabilization. The radiocarbon dating results provide
www.the-cryosphere.net/10/977/2016/ The Cryosphere, 10, 977–993, 2016
990 M. M. Darrow et al.: Frozen debris lobe morphology and movement: an overview of eight dynamic features
other preliminary evidence of asynchronous movement,
indicating that FDL-A began to move out of its catch-
ment over 700 years ago, demonstrating either greater
or earlier downslope movement than any of the other
FDLs.
4. Since 1955, six of the eight investigated lobes have
demonstrated an increase in movement rates. The for-
mation of surface features, such as cracks, scarps, and
RTSs, suggests that the increased movement rates cor-
relate to general instability.
5. We offer a formation scenario of the FDLs after
deglaciation of the area, as well as observations on con-
tributing factors to lobe movement and destabilization.
6. Even at a distance, FDLs are impacting infrastructure
through increased sediment mobilization. Based on its
current distance and rate of movement, we predict that
FDL-A will reach the Dalton Highway alignment by
2023; however, this estimate does not account for the
signs of increasing instability in the upper reaches of
FDL-A.
The Supplement related to this article is available online
at doi:10.5194/tc-10-977-2016-supplement.
Acknowledgements. This work was funded by grants from
the US Department of Transportation (OASRTRS-14-H-UAF-
Project B), the Alaska Department of Transportation and Public
Facilities (ADOT & PF) (T2-12-17), and through generous support
from the Alaska Division of Geological & Geophysical Surveys’
Capital Improvement Project and the Alyeska Pipeline Service
Company. The authors thank L. Southerland for her help in the
field and in the lab; L. Wirth and M. Slife for their expertise and
guidance with the historic imagery; A. Emond and R. Fortier for
their expertise in geophysics; Y. Shur, M. Kanevskiy, and S. Stuefer
for their valuable input; and numerous colleagues from ADOT & PF
and Alyeska. We thank W. Haeberli and an anonymous reviewer
for their valuable comments that helped to improve this manuscript.
Disclaimer. The views, opinions, findings, and conclusions
reflected in this paper are the responsibility of the authors only and
do not represent the official policy or position of the USDOT/OST-
R, or any state agency or entity.
Edited by: K. Isaksen
References
AASHTO – American Association of State Highway and Trans-
portation Officials: AASHTO Standard Specifications for Trans-
portation Materials and Methods of Sampling and Testing
(Part 2A – Tests), 29th Edn., AASHTO, Washington, D.C., T11-
1, T27-1, T267-1, 2009.
Arenson, L., Colgan, W., and Marshall, H. P.: Physical, thermal and
mechanical properties of snow, ice and permafrost, in: Snow and
Ice-Related Hazards, Risks, and Disasters, edited by: Haeberli,
W., Whiteman, C., and Shroder, J. F., Elsevier Science, Saint
Louis, 35–75, 2015.
ASGDC – Alaska State Geo-Spatial Data Clearinghouse: Geo-
spatial Data, http://www.asgdc.state.ak.us/ (last access: 9 De-
cember 2015), 2014.
ASPRS – American Society of Photogrammetry and Re-
mote Sensing: New standard for new era: overview of the
2015 ASPRS positional accuracy standards for digital geospa-
tial data, http://www.asprs.org/a/society/committees/standards/
PERS_March2015_Highlight.pdf (last access: 27 January 2016),
2015.
ASTM: D2216 Standard Test Methods for Laboratory Determina-
tion of Water (Moisture) Content of Soil and Rock by Mass,
ASTM International, West Conshohocken, 1990.
ASTM: D422 Standard Test Method for Particle-Size Analysis of
Soils, ASTM International, West Conshohocken, 1998.
ASTM: D4318 Standard Test Method for Liquid Limit, Plastic
Limit, and Plasticity Index of Soils, ASTM International, West
Conshohocken, 2000.
Ballantyne, C. K., Schnabel, C., and Xu, S.: Exposure dating and
reinterpretation of coarse debris accumulation (‘rock glaciers’)
in the Cairngorm Mountains, Scotland, J. Quaternary Sci., 24,
19–31, 2009.
Barsch, D.: Nature and importance of mass-wasting by rock glaciers
in alpine permafrost environments, Earth Surf. Proc., 2, 231–245,
1977.
Berthling, I., Etzelmüller, B., Eiken, T., and Sollid, J. L.: The rock
glaciers on Prins Karls Forland: corrections of surface displace-
ment rates, Permafrost Periglac. Process., 14, 291–293, 2003.
Blumstengel, W. and Harris, S. A.: Observations on an active lo-
bate rock glacier, Slims River Valley, St. Elias Range, Canada,
Permafrost, 5th International Conference on Permafrost, 2–5 Au-
gust 1988, Tronheim, Norway, 689–694, 1988.
Bollman, E., Girstmair, A., Mitterer, S., Krainer, K., Sailer, R., and
Stötter, J.: A rock glacier activity index based on rock glacier
thickness changes and displacement rates derived from airborne
laser scanning, Permafrost Periglac. Process., 26, 347–359, 2015.
Brenning, A. and Azocar, G. F.: Statistical analysis of topo-
graphic and climatic controls and multispectral signatures of
rock glaciers in the Dry Andes, Chile (27◦–33◦ S), Permafrost
Periglac. Process., 21, 54–66, 2010.
Brown, J. and Kreig, R. A.: Guidebook to Permafrost and Related
Features along the Elliott and Dalton Highways, Fox to Prudhoe
Bay, Alaska, Alaska Division of Geological & Geophysical Sur-
veys Guidebook, Fairbanks, 145–149, 1983.
Burn, C. R.: The thermal regime of a retrogressive thaw slump near
Mayo, Yukon Territory, Can. J. Earth Sci., 37, 967–981, 2000.
Calkin, P. E., Haworth, L. A., and Ellis, C. J.: Rock glacier of Cen-
tral Brooks Range, Alaska, U.S.A., Rock Glaciers, edited by: Gi-
The Cryosphere, 10, 977–993, 2016 www.the-cryosphere.net/10/977/2016/
M. M. Darrow et al.: Frozen debris lobe morphology and movement: an overview of eight dynamic features 991
ardino, J. R., Shroder, J. F., and Vitek, J. D., Allen and Unwin,
Boston, 65–82, 1987.
Calkin, P. E., Kaufman, D. S., Przybyl, B. J., Whitford, W. B., and
Peck, B. J.: Glacier regimes, periglacial landforms, and Holocene
climate change in the Kigluaik Mountains, Seward Peninsula,
Alaska, USA, Arct. Alp. Res., 30, 154–165, 1998.
Christiansen, H. H., Etzelmüller, B., Isaksen, K., Juliussen, H., Far-
brot, H., Humlum, O., Johansson, M., Ingeman-Nielsen, T., Kris-
tensen, L., Hjort, J., Holmlund, P., Sannel, A. B. K., Sigsgaard,
C., Åkerman, H. J., Foged, N., Blikra, L. H., Pernosky, M. A.,
and Ødegård, R. S.: The thermal state of permafrost in the Nordic
area during the international polar year 2007–2009, Permafrost
Periglac. Process., 21, 156–181, 2010.
Cornforth, D. H.: Landslides in Practice: Investigations, Analysis,
and Remedial/Preventative Options in Soils. John Wiley & Sons,
Inc., Hoboken, p. 176, 2005.
Daanen, R. P., Grosse, G., Darrow, M. M., Hamilton, T. D., and
Jones, B. M.: Rapid movement of frozen debris-lobes: impli-
cations for permafrost degradation and slope instability in the
south-central Brooks Range, Alaska, Nat. Hazards Earth Syst.
Sci., 12, 1521–1537, doi:10.5194/nhess-12-1521-2012, 2012.
Darrow, M. M., Daanen, R. P., and Simpson, J. M.: Monitoring and
Analysis of Frozen Debris Lobes, Phase I: FHWA-RD-AK-12,
INE/AUTC 12.25, UAF Institute of Northern Engineering, Fair-
banks, 63 pp., 2012.
Darrow, M. M., Daanen, R. P., and Simpson, J. M.: Analysis of a
frozen debris lobe: a first look inside an impending geohazard,
2–5 June 2013, ISCORD 2013, 139–148, 2013.
Darrow, M. M., Simpson, J. M., Daanen, R. P., and Hubbard, T.:
Characterizing a frozen debris lobe, Dalton Highway, Alaska,
19–22 July 2015, Cold Regions Engineering 2015: Developing
and Maintaining Resilient Infrastructure, 57–67, 2015.
Davis, N.: Permafrost: A Guide to Frozen Ground in Transition,
University of Alaska Press, Fairbanks, 95–97, 160–164, 2001.
Deline, P., Gruber, S., Delaloye, R., Fischer, L., Geertsema, M., Gi-
ardino, M., Hasler, A., Kirkbride, M., Krautblatter, M., Magnin,
F., McColl, S., Ravanel, L., and Schoeneich, P.: Ice loss and slope
stability in high-mountain regions, in: Snow and Ice-Related
Hazards, Risks, and Disasters, edited by: Haeberli, W., White-
man, C., and Shroder, J. F., Elsevier Science, Saint Louis, 521–
561, 2015.
Dillon, J. T., Harris, A. G., Dutro, Jr., J. T., Solie, D. N., Blum, J.
D., Jones, D. L., and Howell, D. G.: Preliminary Geologic Map
and Section of the Chandalar D-6 and Parts of the Chandalar C-6
and Wiseman C-1 and D-1 Quadrangles, Alaska, Alaska Divi-
sion of Geological & Geophysical Surveys Report of Investiga-
tion 88-5, 1 sheet, scale 1 : 63 360, Alaska Division of Geologi-
cal & Geophysical Surveys, Fairbanks, Alaska, 1988.
Douglas, T. A., Fortier, D., Shur, Y. L., Kanevskiy, M. Z., Guo,
L., Cai, Y., and Bray, M. T.: Biogeochemical and geocryologi-
cal characteristics of wedge and thermokarst-cave ice in the CR-
REL permafrost tunnel, Alaska, Permafrost Periglac. Process.,
22, 120–128, 2011.
Ellis, J. M. and Calkin, P. E.: Chronology of Holocene glaciation,
central Brooks Range, Alaska, Geol. Soc. Am. Bull., 95, 897–
912, 1984.
Embleton, C. and King, C. A. M.: Periglacial Geomorphology, John
Wiley & Sons, New York, p. 203, 1975.
EOP – Executive Office of the President: Implementation Plan for
the National Strategy for the Arctic Region, available at: http:
//www.whitehouse.gov/sites/default/files/docs/implementation_
plan_for_the_national_strategy_for_the_arctic_region-fi.pdf
(last access: 12 January 2015), 2014.
Farbrot, H., Etzelmüller, B., Guomundsson, A., Humlum, O.,
Kellerer-Pirklbauer, A., Eiken, T., and Wangensteen, B.: Rock
glaciers and permafrost in Trollaskagi, northern Iceland, Z. Geo-
morphol., 51, 1–16, 2007.
French, H. M.: The Periglacial Environment, 3rd Edn., Wiley,
Chichester, West Sussex, p. 458, 2007.
Geertsema, M., Clague, J. J., Schwab, J. W., and Evans, S. G.:
An overview of recent large catastrophic landslides in northern
British Columbia, Canada, Eng. Geol., 83, 120–143, 2006.
GINA – Geographic Information Network of Alaska: Interferomet-
ric Synthetic Aperture Radar (IfSAR), http://www.gina.alaska.
edu/data/ifsar (last access: 9 December 2015), 2001.
Gooseff, M. N., Balser, A., Bowden, W. B., and Jones, J. B.: Ef-
fects of hillslope thermokarst in northern Alaska, EOS, 90, 29–
30, 2009.
Gorbunov, A. P. and Seversky, E. V.: Solifluction in the mountains
of central Asia: distribution, morphology, processes, Permafrost
Periglac. Process., 10, 81–89, 1999.
Gruber, S. and Haeberli, W.: Permafrost in steep bedrock
slopes and its temperature-related destabilization follow-
ing climate change, J. Geophys. Res.-Earth, 112, F02S18,
doi:10.1029/2006JF000547, 2007.
Gude, M. and Barsch, D.: Assessment of geomorphic hazards in
connection with permafrost occurrence in the Zugspitze area
(Bavarian Alps, Germany), Geomorphology, 66, 85–93, 2005.
Haeberli, W. and Vonder Mühll, D.: On the characteristics and pos-
sible origins of ice in rock glacier permafrost, Z. Geomorphol.,
104, 43–57, 1996.
Haeberli, W., Hallet, B., Arenson, L., Elconin, R., Humlum, O.,
Kääb, A., Kaufmann, V., Ladanyi, B., Matsuoka, N., Springman,
S., and Mühll, D. V.: Permafrost creep and rock glacier dynam-
ics, Permafrost Periglac. Process., 17, 189–214, 2006.
Haeberli, W., Hoelzle, M., Kääb, A., Keller, F., Vonder Mühll,
D., and Wagner, S.: Ten years after drilling through the per-
mafrost of the active rock glacier Murtèl, eastern Swiss Alps:
answered questions and new perspectives, Permafrost – 7th Inter-
national Conference (Proceedings), Yellowknife, Canada, Col-
lection Nordicana, 55, 403–410, 1998.
Hamilton, T. D.: Surficial Geologic Map of the Chandalar Quadran-
gle, Alaska, US Geological Survey Miscellaneous Field Studies
Map MF-878A, scale 1 : 250 000, US Geological Survey, Reston,
VA, 1978.
Hamilton, T. D.: Surficial Geologic Map of the Wiseman Quadran-
gle, Alaska. USGeological Survey Miscellaneous Field Studies
Map MF-1122, scale 1 : 250 000, US Geological Survey, Reston,
VA, 1979.
Hamilton, T. D.: Surficial Geologic Map of the Survey Pass Quad-
rangle, Alaska, US Geological Survey Miscellaneous Field Stud-
ies Map MF-1320, scale 1 : 250 000, US Geological Survey, Re-
ston, VA, 1981.
Hamilton, T. D.: Late Cenozoic Glaciation of the Central Brooks
Range, in: Glaciation in Alaska: The Geologic Record, edited
by: Hamilton, T. D., Reed, K. M., and Thorson, R. M., Alaska
Geological Society, Anchorage, Alaska, 9–50, 1986.
www.the-cryosphere.net/10/977/2016/ The Cryosphere, 10, 977–993, 2016
992 M. M. Darrow et al.: Frozen debris lobe morphology and movement: an overview of eight dynamic features
Harris, C., Kern-Luetschg, M., Muron, J., Font, M., Davies, M.,
and Smith, F.: Solifluction processes on permafrost and non-
permafrost slopes: results of a large-scale laboratory simulation,
Permafrost Periglac. Process., 19, 359–379, 2008a.
Harris, C., Smith, J. S., Davies, M. C. R., and Rea, B.: An investi-
gation of periglacial slope stability in relation to soil properties
based on physical modelling in the geotechnical centrifuge, Ge-
omorphology, 93, 437–459, 2008b.
Hauck, C.: New concepts in geophysical surveying and data inter-
pretation for permafrost terrain, Permafrost Periglac. Process.,
24, 131–137, 2013.
Hubbard, T. D., Koehler, R. D., and Combellick, R. A.:
High-resolution lidar data for Alaska infrastructure corri-
dors, Lidar Datasets of Alaska, Alaska Division of Geologi-
cal & Geophysical Surveys Raw Data File 2011-3, Alaska Di-
vision of Geological & Geophysical Surveys, http://dggs.alaska.
gov/pubs/id/22722 (last access: 15 June 2013), 2011.
Humlum, O.: The climatic significance of rock glaciers, Permafrost
Periglac. Process., 9, 375–398, 1998a.
Humlum, O.: Rock glaciers on the Faeroe Islands, the north At-
lantic, J. Quaternary Sci., 13, 293–307, 1998b.
Ikeda, A. and Matsuoka, N.: Pebbly versus bouldery rock glaciers:
morphology, structure and processes, Geomorphology, 73, 279–
296, 2006.
Ikeda, A., Matsuoka, N., and Kääb, A.: Fast deformation of peren-
nially frozen debris in a warm rock glacier in the Swiss Alps:
An effect of liquid water, J. Geophys. Res., 113, F01021,
doi:10.1029/2007JF000859, 2008.
Isaksen, K., Ødegård, R. S., Eiken, T., and Sollid, J. L.: Composi-
tion, flow, and development of two tongue-shaped rock glaciers
in the permafrost of Svalbard, Permafrost Periglac. Process., 11,
241–248, 2000.
Jorgenson, M. T., Yoshikawa, K., Kanevskiy, M., Shur, Y. L.,
Romanovsky, V. E., Marchenko, S., Grosse, G., Brown, J.,
and Jones, B.: Permafrost characteristics of Alaska, Extended
Abstr., 9th International Conference on Permafrost, 28 June–
3 July 2008, Fairbanks, Alaska, 121–122, 2008.
Kääb, A., Haeberli, W., and Gudmundsson, G. H.: Analysing the
creep of mountain permafrost using high precision aerial pho-
togrammetry: 25 years of monitoring Gruben Rock Glacier,
Swiss Alps, Permafrost Periglac. Process., 8, 409–426, 1997.
Kääb, A., Frauenfelder, R., and Roer, I.: On the response of rock
glacier creep to surface temperature increase, Global Planet.
Change, 56, 172–187, 2007.
Kehew, A. E.: Geology for Engineers and Environmental Scientists,
3rd Edn., Pearson Prentice Hall, New Jersey, 214–250, 2006.
Kokelj, S. V., Lantz, T. C., Kanigan, J., Smith, S. L., and Coutts,
R.: Origin and polycyclic behaviour of tundra thaw slumps,
Mackenzie Delta region, Northwest Territories, Canada, Per-
mafrost Periglac. Process., 20, 173–184, 2009.
Krainer, K., Bressan, D., Dietre, B., Haas, J. N., Hajdas, I., Lang,
K., Mair, V., Nickus, U., Reidl, D., Thies, H., and Tonidandel, D.:
A 10,300-year-old permafrost core from the active rock glacier
Lazaun, southern Ötztal Alps (South Tyrol, northern Italy), Qua-
ternary Res., 83, 324–335, 2015.
Kreig, R. A. and Reger, R. D.: Air-photo Analysis and Summary
of Landform Soil Properties along the Route of the Trans-Alaska
Pipeline System, Alaska Division of Geological & Geophysical
Surveys, Anchorage, 74–75, 1982.
Lewkowicz, A. G. and Harris, C.: Morphology and geotechnique of
active-layer detachment failures in discontinuous and continu-
ous permafrost, northern Canada, Geomorphology, 69, 275–297,
2005.
Malone, L., Lacelle, D., Kokelj, S., and Clark, I. D.: Impacts of hill
slope thaw slumps on the geochemistry of permafrost catchments
(Stony Creek watershed, NWT, Canada), Chem. Geol., 356, 38–
49, 2013.
Matsuoka, N., Ikeda, A., and Date, T.: Morphometric analysis of
solifluction lobes and rock glaciers in the Swiss Alps, Permafrost
Periglac. Process., 16, 99–113, 2005.
Meyer, H., Dereviagin, A., Siegert, C., Schirrmeister, L., and Hub-
berten, H.-W.: Paleoclimate reconstruction on Big Lyakhovsky
Island, North Siberia – hydrogen and oxygen isotopes in ice
wedges, Permafrost Periglac. Process., 13, 91–105, 2002.
Meyer, H., Schirrmeister, L., Andreev, A., Wagner, D., Hubberten,
H.-W., Yoshikawa, K., Brobrov, A., Wetterich, S., Opel, T., Kan-
diano, E., and Brown, J.: Lateglacial and Holocene isotopic and
environmental history of northern coastal Alaska – results from
a buried ice-wedge system at Barrow, Quaternary Sci. Rev., 29,
37200-3735, 2010.
Micheletti, N., Lambiel, C., and Lane, S. N.: Investigating
decadal-scale geomorphic dynamics in an alpine moun-
tain setting, J. Geophys. Res.-Earth, 120, 2155–2175,
doi:10.1002/2015JF003656, 2015.
Milligan, G., Fookes, P. G., and Lee, E. M. (Eds.): Engineering be-
haviour of soils and rocks, in: Geomorphology for Engineers,
CRC Press, Boca Raton, 137–169, 2005.
Reimer, P. J., Bard, E., Bayliss, A., Beck, J. W., Blackwell, P.
G., Ramsey, C. B., Buck, C. E., Cheng, H., Edwards, R. L.,
Friedrich, M., Grootes, P. M., Guiderson, T. P., Haflidason, H.,
Hajdas, I., Hatté, C., Heaton, T. J., Hoffman, D. L., Hogg, A.
G., Hughen, K. A., Kaiser, K. F., Kromer, B., Manning, S. W.,
Niu, M., Reimer, R. W., Richards, D. A., Scott, E. M., Southon,
J. R., Staff, R. A., Turney, C. S. M., and van der Plicht, J.: INT-
CAL13 and MARINE13 radiocarbon age calibration curves 0–
50,000 years cal BP, Radiocarbon, 55, 1869–1887, 2013.
Romanovsky, V. E., Smith, S. L., and Christiansen, H. H.: Per-
mafrost thermal state in the polar northern hemisphere during
the International Polar Year 2007–2009: a synthesis, Permafrost
Periglac. Process., 21, 106–116, 2010.
Sevunts, L.: Canada and Russia stress Arc-
tic economic development, CBC News, avail-
able at: http://www.cbc.ca/news/canada/north/
canada-and-russia-stress-arctic-economic-development-1.
1407697 (last access: 12 January 2015), 2013.
Simpson, J. M., Darrow, M. M., Huang, S. L., Daanen, R. P., and
Hubbard, T. D.: Investigating movement and characteristics of a
frozen debris lobe, South-Central Brooks Range, Alaska, Envi-
ron. Eng. Geosci., doi:10.2113/EEG-1728, in press, 2016.
Smith, S. L., Romanovsky, V. E., Lewkowicz, A. G., Burn, C. R.,
Allard, M., Clow, G. D., Yoshikawa, K., and Throop, J.: Thermal
state of permafrost in North America: a contribution to the Inter-
national Polar Year, Permafrost Periglac. Process., 21, 117–135,
2010.
Sorg, A., Kääb, A., Roesch, A., Bigler, C., and Stoffel, M.: Contrast-
ing responses of Central Asian rock glaciers to global warming,
Scient. Rep., 5, 8228, doi:10.1038/srep08228, 2015.
The Cryosphere, 10, 977–993, 2016 www.the-cryosphere.net/10/977/2016/
M. M. Darrow et al.: Frozen debris lobe morphology and movement: an overview of eight dynamic features 993
Spangler, E. R. and Hubbard, T. D.: Geologic and geomorphic char-
acterization of frozen debris lobe source basins along the Dalton
Highway, southern Brooks Range, Alaska, Alaska Division of
Geological & Geophysical Surveys, Fairbanks, 34 pp., in review,
2016.
Spangler, E. R., Hubbard, T. D., Daanen, R. P., Darrow, M. M.,
Simpson, J. M., and Southerland, L. E.: Geologic and geomor-
phic characterization of frozen debris lobe catchments along
the Dalton Highway, southern Brooks Range, Alaska (poster),
GSA Annual Meeting, Abstracts with Programs (49-16), 45, 152,
2013.
Stocker, T. F., Qin, D., Plattner, G.-K., Tignor, M. M. B., Allen,
S. K., Boschung, J., Nauels, A., Xia, Y., Bex, V., and Midgley,
P. W. (Eds.): Climate Change 2013: The Physical Science Basis,
in: Working Group I Contribution to the Fifth Assessment Report
of the Intergovernmental Panel on Climate Change, Cambridge
University Press, Cambridge, 121–122, 2013.
Swanger, K. M. and Marchant, D. R.: Sensitivity of ice-cemented
Antarctic soils to greenhouse-induced thawing: are terrestrial
archives at risk?, Earth Planet. Sc. Lett., 259, 347–359, 2007.
Tarussov, A.: The Arctic from Svalbard to Severnaya Zemlya:
climatic reconstructions from ice cores, in: Climate Since
A.D. 1500, edited by: Bradley, R. S. and Jones, P. D., Routledge,
London, 505–516, 1992.
Wahrhaftig, C.: Physiographic Divisions of Alaska, USGS Profes-
sional Paper 482, USGS, Washington, D.C., 20–22, 1965.
Wahrhaftig, C. and Cox, A.: Rock glaciers in the Alaska Range,
Geol. Soc. Am. Bull., 70, 383–436, 1959.
Washburn, A. L.: Periglacial problems, in: Field and Theory: Lec-
tures in Geocryology, edited by: Church, M. and Slaymaker,
O., University of British Columbia Press, Vancouver, 166–202,
1985.
Williams, P. J. and Smith, M. W.: The Frozen Earth: Fundamentals
of Geocryology, Cambridge University Press, Cambridge, 27–
37, 1989.
Wirz, V., Gruber, S., Purves, R. S., Beutel, J., Gärtner-Roer, I.,
Gubler, S., and Vieli, A.: Short-term velocity variations at three
rock glaciers and their relationship with meteorological condi-
tions, Earth Surf. Dynam., 4, 103–123, doi:10.5194/esurf-4-103-
2016, 2016.
www.the-cryosphere.net/10/977/2016/ The Cryosphere, 10, 977–993, 2016