Embed Size (px)
Citation preview
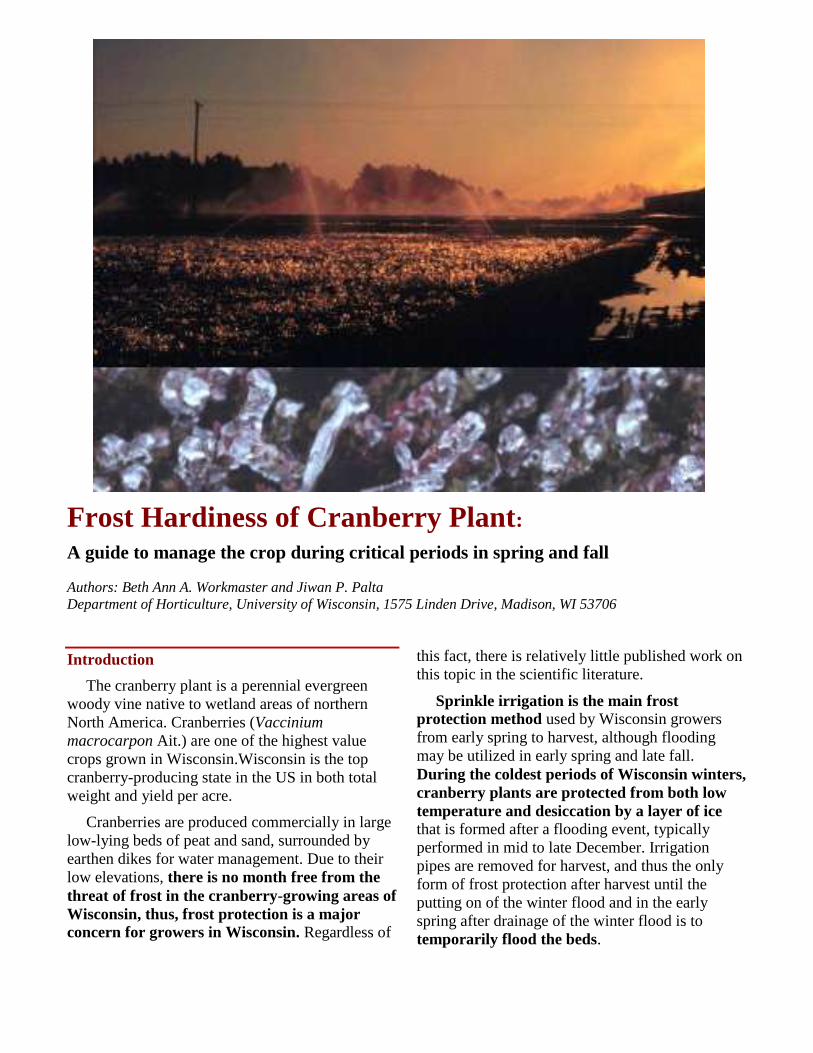
Frost Hardiness of Cranberry Plant:
A guide to manage the crop during critical periods in spring and fall
Authors: Beth Ann A. Workmaster and Jiwan P. Palta
Department of Horticulture, University of Wisconsin, 1575 Linden Drive, Madison, WI 53706
Introduction
The cranberry plant is a perennial evergreen
woody vine native to wetland areas of northern
North America. Cranberries (Vaccinium
macrocarpon Ait.) are one of the highest value
crops grown in Wisconsin.Wisconsin is the top
cranberry-producing state in the US in both total
weight and yield per acre.
Cranberries are produced commercially in large
low-lying beds of peat and sand, surrounded by
earthen dikes for water management. Due to their
low elevations, there is no month free from the
threat of frost in the cranberry-growing areas of
Wisconsin, thus, frost protection is a major
concern for growers in Wisconsin. Regardless of
this fact, there is relatively little published work on
this topic in the scientific literature.
Sprinkle irrigation is the main frost
protection method used by Wisconsin growers
from early spring to harvest, although flooding
may be utilized in early spring and late fall.
During the coldest periods of Wisconsin winters,
cranberry plants are protected from both low
temperature and desiccation by a layer of ice that is formed after a flooding event, typically
performed in mid to late December. Irrigation
pipes are removed for harvest, and thus the only
form of frost protection after harvest until the
putting on of the winter flood and in the early
spring after drainage of the winter flood is to
temporarily flood the beds.
P a g e | 2
Early spring is one of the most vulnerable
times of the year. After the winter flood ice has
melted, failure to initiate frost protection measures
can result in crop damage ranging from slowed
growth to complete crop loss. In contrast,
overprotection can lead to deacclimation of the
plants, as well as increased labor and fuel costs.
The objective of this publication is to help the
cranberry growers in the management of frost
protection of their crop at critical periods in spring
and fall. Some basic information on frost hardiness
is included to make the experimental data more
meaningful.
Basic Concepts In Frost Hardiness
Mechanisms of freezing stress survival
Freezing stress resistance is the ability of a plant
to survive subfreezing temperatures. Freezing
tolerance and freezing avoidance are the main
mechanisms by which plants mitigate the stress of
freezing temperatures (Levitt, 1980). During frost
episodes air temperature generally drops at a rate
of 1-3 °F per hour (Steffen et al., 1989). At these
rates ice is generally initiated (nucleation) in the
water outside of the plant cell (in the
extracellular spaces). Ice nucleation occurs in or
on plant tissues due to the presence of a nucleating
agent, such as dust, bacteria, fungi, or
wind/agitation that are present in the water outside
the plant cell or plant tissue.
Water inside the cell does not freeze for two
reasons: 1) The water inside the cell (the cell sap)
contains sugars, salts, and other solutes that depress
the freezing point of water. The freezing point of
water for a typical plant leaf cell is about 30 °F. 2)
Water inside a plant cell lacks the nucleating
agents described above.
Once initiated, ice spreads via the xylem
vessels. Ice can also form on the surface of plants,
such as from dew. The ice is “drier” than the
surrounding liquid water at the same temperature (a
lower vapor pressure). As the temperature drops,
this ice pulls water out of the cell, resulting in
both the further growth of the ice in between the
cells and an increase in the solute concentration
inside the cell (Levitt, 1980; Palta, 1990)). In this
way, freezing stress is actually like drought or
dehydration.
The ability to tolerate and (thereby survive)
these various stresses caused by the presence of ice
outside the cell is referred to as “freezing
tolerance.” Woody plant tissues, such as bark, bud
scales, and leaves, cannot avoid ice nucleation,
and so survive freezing stress by tolerating the
presence of extracellular ice in their tissues.
By extension then, “freezing avoidance” is a
plant tissue‟s ability to resist freezing stress by not
allowing ice to form. In these tissues, water
remains liquid at temperatures lower than 32
°F, or “supercools”. Supercooling can occur, at
least temporarily, in almost all tissues, yet
extracellular ice nucleation typically occurs by 28-
30 °F in nature (George et al., 1974). The tissues
that survive by supercooling are able to prevent ice
nucleation for long periods at freezing
temperatures. If this metastable condition is
terminated by the nucleation of very rapid ice,
damage is typically lethal because of ice formation
inside the cell (Levitt, 1980; Palta and Weiss,
1993). Ice formation inside the cell results in
faster and more severe injury due to the rupture
of organelles and cell membranes.
Mechanisms of freezing stress injury and
recovery
Common symptoms of freezing stress injury in
plant tissues are a water-soaked appearance
(darkening of the tissue) and the inability to
regain turgidity once the stress has been removed
(Levitt, 1980; Palta, 1990; Palta and Weiss, 1993).
These symptoms indicate that cell membranes
have been injured and sugars and salts start to
leak from the cell and tissue. This can result in
the growth of fungus and bacteria, thus resulting in
tissue rot as a secondary form of injury to freeze
damage. If cell membranes can heal from the
injury, plants can recover from freezing injury
(Palta et al., 1977).
P a g e | 3
Patterns of ice nucleation and propagation
Infrared (IR) video thermography has recently
been used to visualize ice nucleation and
propagation in plants (Wisniewski et al., 1997;
Workmaster et al., 1999). With this method,
freezing events are imaged as water freezes and
the heat is released, thus warming the plant tissue.
This rise in temperature in the tissue by the
formation of ice from water can be seen by an
infrared camera. By observing the occurrence of
freezing events as well as the extent of subsequent
ice propagation, low temperature survival
mechanisms (tolerance or avoidance of ice
formation) of various plant parts can be
determined.
Avenues to ice propagation require open areas
and pores large enough for ice crystals to grow.
Wounds, cracks in the cuticle and epicuticular
waxes, lenticels, and open stomata have all been
suggested as possible entry points for ice from
outside the plant, while extracellular spaces and
xylem vessels are thought to function as pathways
of internal ice propagation.
Seasonal changes in cold hardiness of plant parts
Cold acclimation (hardening) and
deacclimation (dehardening) of temperate zone
woody plants are induced in response to changes in
day length, air temperature, and soil water status
(Levitt, 1980). In fall the plant hardens, which in
turn results in an increase in frost hardiness either
by tolerance or avoidance mechanisms. The
opposite occurs in the spring. The timing of cold
acclimation and deacclimation, and the extent of
seasonal changes in freezing stress resistance vary
by genetic makeup and geographic origin (Levitt,
1980; Sakai and Larcher, 1987).
In spring, the frost hardiness of developing buds
of fruit species decreases with progression of
development. Dehardening and growth capability
of buds in spring corresponds with changes in
hormone levels in the tissue: a decrease in abscisic
acid and an increase in gibberellins, followed by
later increases in auxin and cytokinin (Levitt,
1980).
Leaves are known to survive freezing stress
by the mechanism of tolerance (Levitt, 1980;
Palta and Weiss, 1993). This is especially
important in evergreen, non-deciduous, species
where leaves remain in the plant as an over-
wintering structure. Desiccation injury, direct
freezing injury to roots, and direct freezing injury
to leaves have all been identified as factors that
contribute to winter injury in these species.
Desiccation and freezing of roots is limited in
cranberry, due to the protection provided by the
winter ice. Overwintering dormant buds are
known to survive frost by avoidance
mechanisms. Intact fruits of some species are
also known to have some frost avoidance ability.
Use of Growth Degree Days (GDD) to Predict
Spring Growth and Development of Woody
Plants
Air temperature is widely viewed as the single
most important factor driving spring growth and
development. Thermal time models (also called
growing degree days, GDD) have been developed
to chart the progression of the growth and
development of various plants (Anderson and
Seeley, 1992), animals, and insects. In studies of
orchard and forest trees, models have been
developed to predict the timing of bud break in
reference to the threat of spring frost damage and
the potential impact of global warming (Cannell
and Smith, 1986).
Other ecophysiological factors have been cited
as contributing to these phenological changes, such
as the degree of completion of rest and chilling
temperatures, photoperiod, relative rates of growth
in response to different temperatures, and soil
temperature. Photothermal models restrict the
influence of air temperatures until after the
attainment of a critical photoperiod, or daylength.
In cranberry, a photoperiod of 13 hours was found
to be necessary for normal bud break and flower
development (Lenhardt et al., 1976).
Thermal time models (GDD) require the
determination of threshold temperatures for
growth of the particular species or cultivar. The
P a g e | 4
base temperature, the minimum temperature for
plant growth and development, is the most
common threshold included in models of bud break
and flowering. Theoretically, the base temperature
is thought to correspond to the temperature below
which physiological processes resulting in crop
growth and development will cease. Some attempts
have been made to use thermal time to predict
developmental events in cranberry (DeMoranville
et al., 1996; Hawker and Stang, 1985; Wisconsin-
Minnesota Cooperative Extension Agricultural
Weather Page, 2001). These studies used arbitrary
base temperatures, ranging from 6.5 to 9 C (44 to
48 F), in their thermal time calculations. We used
a base temperature of 5 C (41 F) based on our
studies that showed that temperatures below this
did not contribute to growth of the plant.
Changes in frost hardiness of cranberry plant
parts during spring growth and development
Changes in the frost hardiness of the cranberry
plant are most pronounced in springtime as warmer
temperatures and longer days stimulate growth and
the emergence from dormancy (Workmaster and
Palta, 2006). With the receding of the winter ice
cover, cranberry buds can tolerate temperatures
below 5 F (–15 C). Significant frost hardiness is
lost as physiological and anatomical changes begin
to occur in the plant, resulting in the buds only
having tolerances ranging from 23 to 32 F (–5 to 0
C). All of our studies were conducted using
„Stevens‟ cranberry uprights collected from a farm
near Nekoosa, Wisconsin.
Stages of upright growth and development
We approached the challenge of documenting
these dramatic changes in frost hardiness by first
characterizing the stages of cranberry upright
growth and development. The current terminology
was determined through consultation with growers
and was published in Cranberries Magazine in
1997. Pictures depicting the defined stages, based
on this original publication, are presented in
Figure 1 (next page). A summary of the stages is
as follows presented in Table 1.
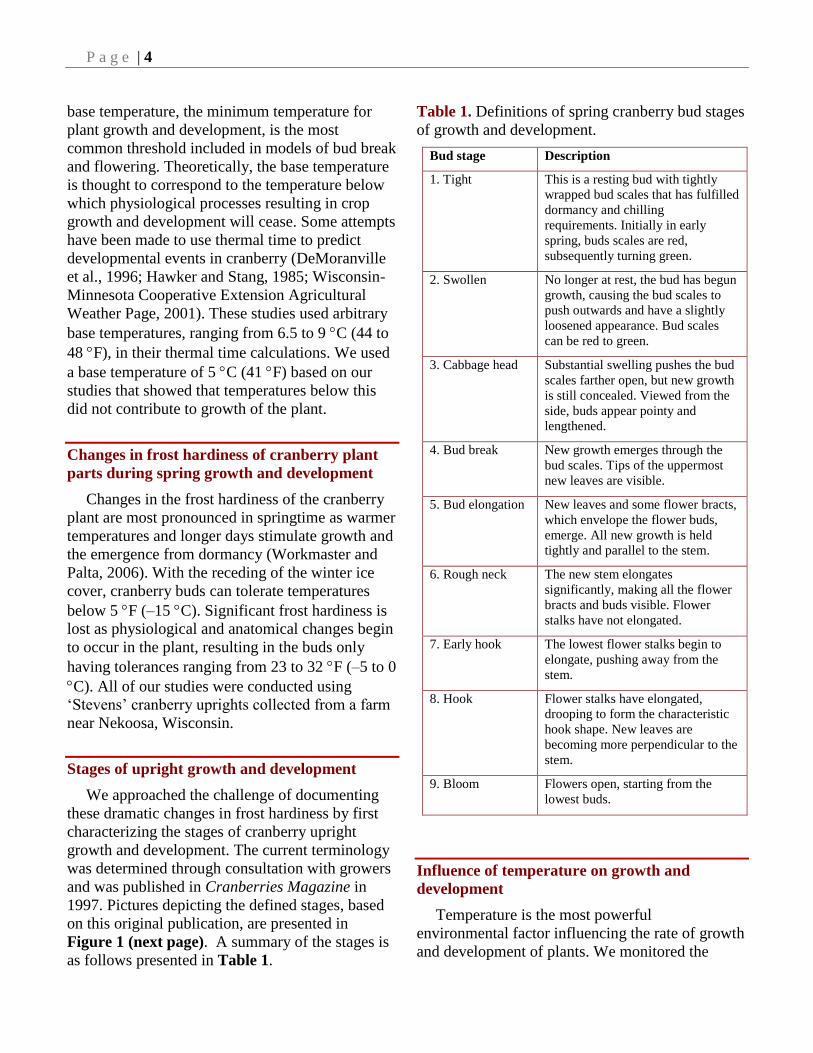
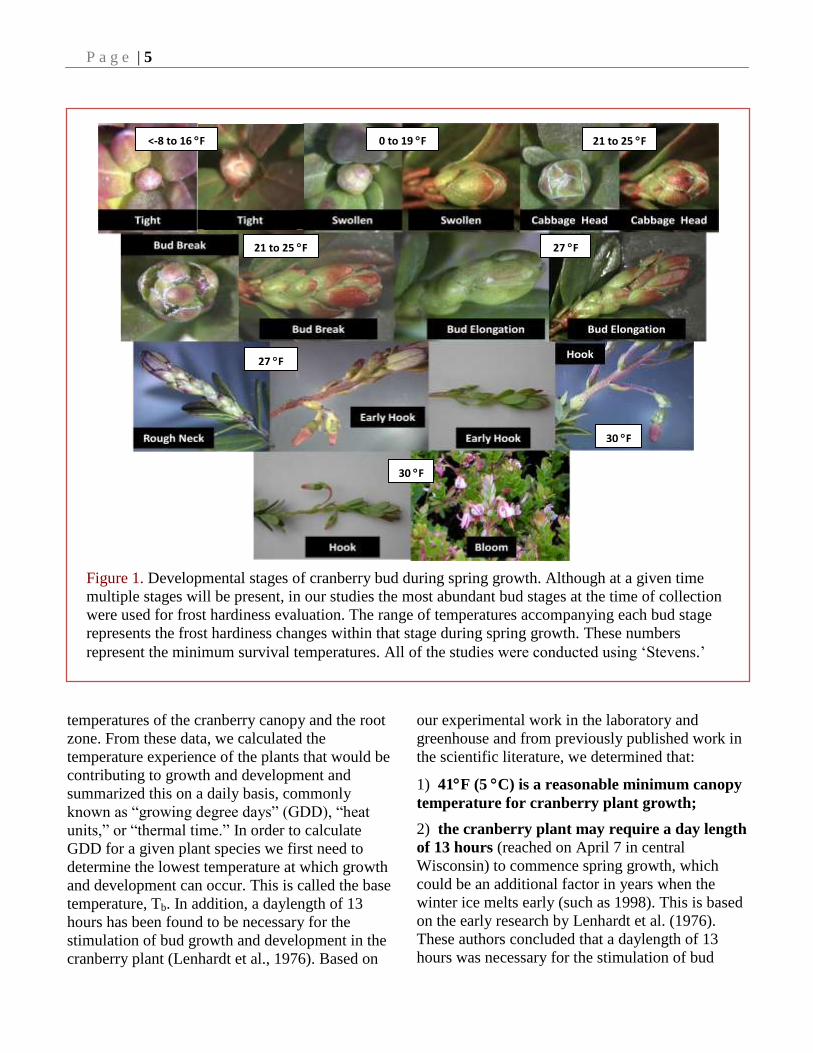
Table 1. Definitions of spring cranberry bud stages
of growth and development.
Bud stage Description
1. Tight This is a resting bud with tightly
wrapped bud scales that has fulfilled
dormancy and chilling
requirements. Initially in early
spring, buds scales are red,
subsequently turning green.
2. Swollen No longer at rest, the bud has begun
growth, causing the bud scales to
push outwards and have a slightly
loosened appearance. Bud scales
can be red to green.
3. Cabbage head Substantial swelling pushes the bud
scales farther open, but new growth
is still concealed. Viewed from the
side, buds appear pointy and
lengthened.
4. Bud break New growth emerges through the
bud scales. Tips of the uppermost
new leaves are visible.
5. Bud elongation New leaves and some flower bracts,
which envelope the flower buds,
emerge. All new growth is held
tightly and parallel to the stem.
6. Rough neck The new stem elongates
significantly, making all the flower
bracts and buds visible. Flower
stalks have not elongated.
7. Early hook The lowest flower stalks begin to
elongate, pushing away from the
stem.
8. Hook Flower stalks have elongated,
drooping to form the characteristic
hook shape. New leaves are
becoming more perpendicular to the
stem.
9. Bloom Flowers open, starting from the
lowest buds.
Influence of temperature on growth and
development
Temperature is the most powerful
environmental factor influencing the rate of growth
and development of plants. We monitored the
P a g e | 5
temperatures of the cranberry canopy and the root
zone. From these data, we calculated the
temperature experience of the plants that would be
contributing to growth and development and
summarized this on a daily basis, commonly
known as “growing degree days” (GDD), “heat
units,” or “thermal time.” In order to calculate
GDD for a given plant species we first need to
determine the lowest temperature at which growth
and development can occur. This is called the base
temperature, Tb. In addition, a daylength of 13
hours has been found to be necessary for the
stimulation of bud growth and development in the
cranberry plant (Lenhardt et al., 1976). Based on
our experimental work in the laboratory and
greenhouse and from previously published work in
the scientific literature, we determined that:
1) 41F (5 C) is a reasonable minimum canopy
temperature for cranberry plant growth;
2) the cranberry plant may require a day length
of 13 hours (reached on April 7 in central
Wisconsin) to commence spring growth, which
could be an additional factor in years when the
winter ice melts early (such as 1998). This is based
on the early research by Lenhardt et al. (1976).
These authors concluded that a daylength of 13
hours was necessary for the stimulation of bud
Figure 1. Developmental stages of cranberry bud during spring growth. Although at a given time
multiple stages will be present, in our studies the most abundant bud stages at the time of collection
were used for frost hardiness evaluation. The range of temperatures accompanying each bud stage
represents the frost hardiness changes within that stage during spring growth. These numbers
represent the minimum survival temperatures. All of the studies were conducted using „Stevens.‟
30 F
30 F
27 F
27 F
21 to 25 F
21 to 25 F
0 to 19 F
<-8 to 16 F
P a g e | 6
growth and acceleration of bud break if the
cranberry plant.
See the inset box to learn more about the
calculation of GDD.
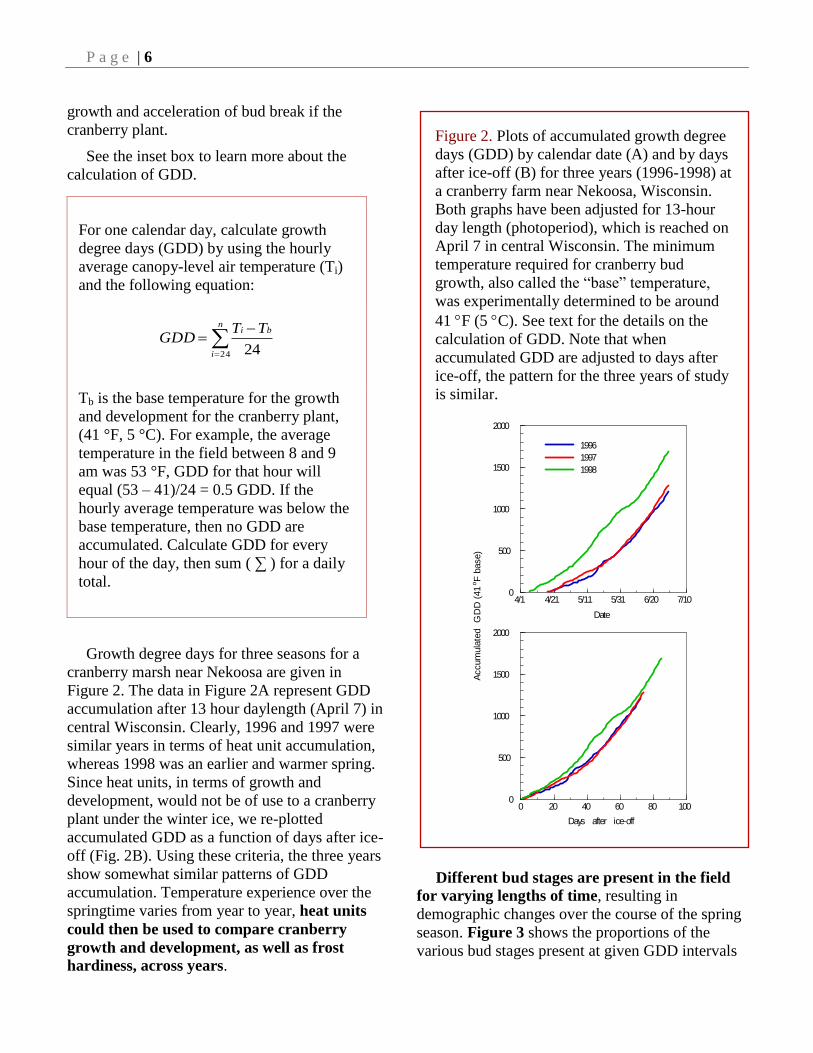
Growth degree days for three seasons for a
cranberry marsh near Nekoosa are given in
Figure 2. The data in Figure 2A represent GDD
accumulation after 13 hour daylength (April 7) in
central Wisconsin. Clearly, 1996 and 1997 were
similar years in terms of heat unit accumulation,
whereas 1998 was an earlier and warmer spring.
Since heat units, in terms of growth and
development, would not be of use to a cranberry
plant under the winter ice, we re-plotted
accumulated GDD as a function of days after ice-
off (Fig. 2B). Using these criteria, the three years
show somewhat similar patterns of GDD
accumulation. Temperature experience over the
springtime varies from year to year, heat units
could then be used to compare cranberry
growth and development, as well as frost
hardiness, across years.
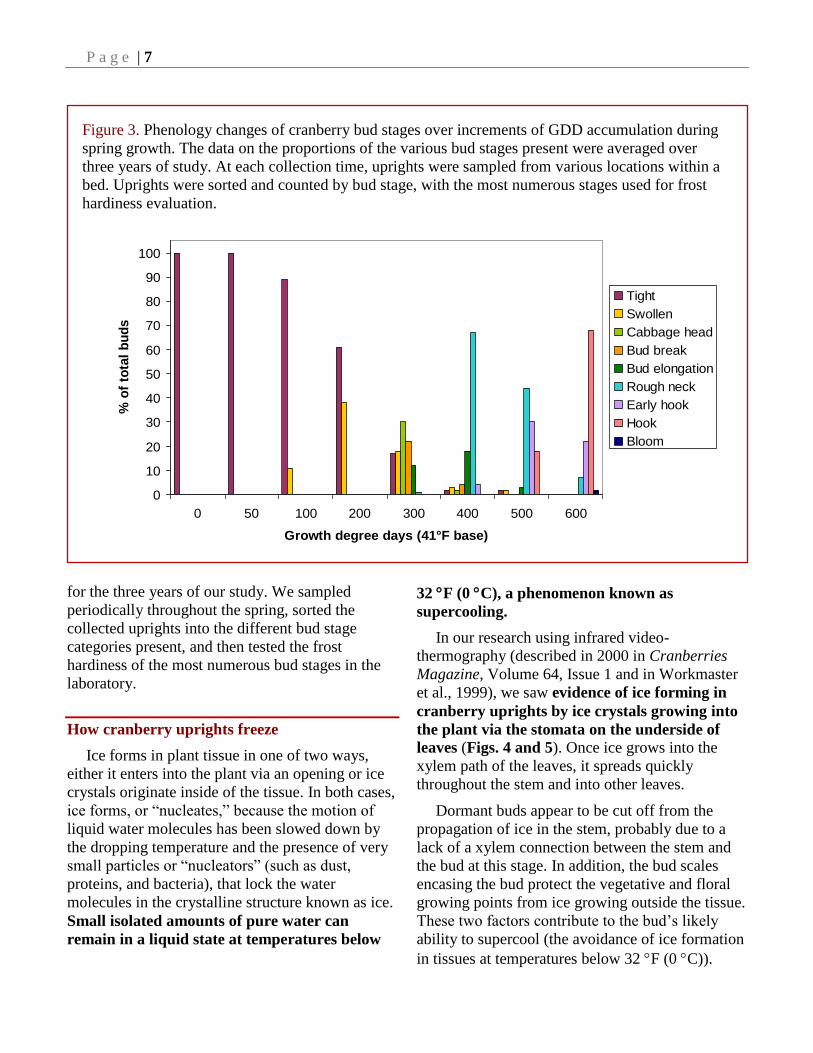
Different bud stages are present in the field
for varying lengths of time, resulting in
demographic changes over the course of the spring
season. Figure 3 shows the proportions of the
various bud stages present at given GDD intervals
For one calendar day, calculate growth
degree days (GDD) by using the hourly
average canopy-level air temperature (Ti)
and the following equation:
n
i
bi TTGDD
24 24
Tb is the base temperature for the growth
and development for the cranberry plant,
(41 °F, 5 °C). For example, the average
temperature in the field between 8 and 9
am was 53 °F, GDD for that hour will
equal (53 – 41)/24 = 0.5 GDD. If the
hourly average temperature was below the
base temperature, then no GDD are
accumulated. Calculate GDD for every
hour of the day, then sum ( ∑ ) for a daily
total.
Figure 2. Plots of accumulated growth degree
days (GDD) by calendar date (A) and by days
after ice-off (B) for three years (1996-1998) at
a cranberry farm near Nekoosa, Wisconsin.
Both graphs have been adjusted for 13-hour
day length (photoperiod), which is reached on
April 7 in central Wisconsin. The minimum
temperature required for cranberry bud
growth, also called the “base” temperature,
was experimentally determined to be around
41 F (5 C). See text for the details on the
calculation of GDD. Note that when
accumulated GDD are adjusted to days after
ice-off, the pattern for the three years of study
is similar.
4/1 4/21 5/11 5/31 6/20 7/100
500
1000
1500
2000
Date
1996
1997
1998
0 20 40 60 80 1000
500
1000
1500
2000
Days after ice-off
Accum
ula
ted
GD
D(4
1oF
base)
P a g e | 7
for the three years of our study. We sampled
periodically throughout the spring, sorted the
collected uprights into the different bud stage
categories present, and then tested the frost
hardiness of the most numerous bud stages in the
laboratory.
How cranberry uprights freeze
Ice forms in plant tissue in one of two ways,
either it enters into the plant via an opening or ice
crystals originate inside of the tissue. In both cases,
ice forms, or “nucleates,” because the motion of
liquid water molecules has been slowed down by
the dropping temperature and the presence of very
small particles or “nucleators” (such as dust,
proteins, and bacteria), that lock the water
molecules in the crystalline structure known as ice.
Small isolated amounts of pure water can
remain in a liquid state at temperatures below
32 F (0 C), a phenomenon known as
supercooling.
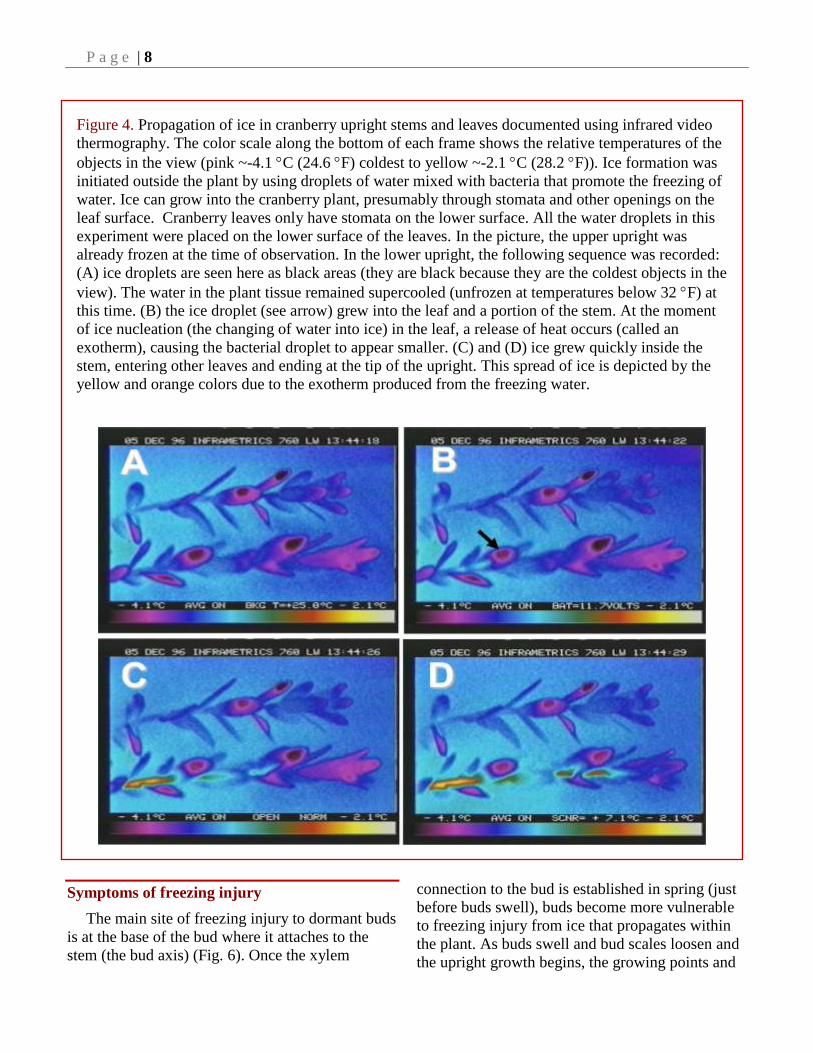
In our research using infrared video-
thermography (described in 2000 in Cranberries
Magazine, Volume 64, Issue 1 and in Workmaster
et al., 1999), we saw evidence of ice forming in
cranberry uprights by ice crystals growing into
the plant via the stomata on the underside of
leaves (Figs. 4 and 5). Once ice grows into the
xylem path of the leaves, it spreads quickly
throughout the stem and into other leaves.
Dormant buds appear to be cut off from the
propagation of ice in the stem, probably due to a
lack of a xylem connection between the stem and
the bud at this stage. In addition, the bud scales
encasing the bud protect the vegetative and floral
growing points from ice growing outside the tissue.
These two factors contribute to the bud‟s likely
ability to supercool (the avoidance of ice formation
in tissues at temperatures below 32 F (0 C)).
Figure 3. Phenology changes of cranberry bud stages over increments of GDD accumulation during
spring growth. The data on the proportions of the various bud stages present were averaged over
three years of study. At each collection time, uprights were sampled from various locations within a
bed. Uprights were sorted and counted by bud stage, with the most numerous stages used for frost
hardiness evaluation.
0
10
20
30
40
50
60
70
80
90
100
0 50 100 200 300 400 500 600
Growth degree days (41°F base)
% o
f to
tal
bu
ds
Tight
Swollen
Cabbage head
Bud break
Bud elongation
Rough neck
Early hook
Hook
Bloom
P a g e | 8
Symptoms of freezing injury
The main site of freezing injury to dormant buds
is at the base of the bud where it attaches to the
stem (the bud axis) (Fig. 6). Once the xylem
connection to the bud is established in spring (just
before buds swell), buds become more vulnerable
to freezing injury from ice that propagates within
the plant. As buds swell and bud scales loosen and
the upright growth begins, the growing points and
Figure 4. Propagation of ice in cranberry upright stems and leaves documented using infrared video
thermography. The color scale along the bottom of each frame shows the relative temperatures of the
objects in the view (pink ~-4.1 C (24.6 F) coldest to yellow ~-2.1 C (28.2 F)). Ice formation was
initiated outside the plant by using droplets of water mixed with bacteria that promote the freezing of
water. Ice can grow into the cranberry plant, presumably through stomata and other openings on the
leaf surface. Cranberry leaves only have stomata on the lower surface. All the water droplets in this
experiment were placed on the lower surface of the leaves. In the picture, the upper upright was
already frozen at the time of observation. In the lower upright, the following sequence was recorded:
(A) ice droplets are seen here as black areas (they are black because they are the coldest objects in the
view). The water in the plant tissue remained supercooled (unfrozen at temperatures below 32 F) at
this time. (B) the ice droplet (see arrow) grew into the leaf and a portion of the stem. At the moment
of ice nucleation (the changing of water into ice) in the leaf, a release of heat occurs (called an
exotherm), causing the bacterial droplet to appear smaller. (C) and (D) ice grew quickly inside the
stem, entering other leaves and ending at the tip of the upright. This spread of ice is depicted by the
yellow and orange colors due to the exotherm produced from the freezing water.
P a g e | 9
new tissues also become susceptible to ice and
freezing from outside of the plant. Once the base of
the bud is injured, the bud loses vascular
connection with the upright and is not able to draw
water, resulting in bud death.
Other injury symptoms have been noted
during spring growth and development of the
cranberry upright (Fig. 7). “Umbrella bloom”
occurs when the vegetative growing point dies, but
the flowers go on to bloom, resulting in the flowers
at hook stage forming an umbrella shape (Fig. 7A).
Furthermore, stunted and weak growth also can
occur when the freezing injury is sub-lethal. Bud
stage development can also be delayed as a result
of sub-lethal freezing injury (Fig. 8). Injury to the
terminal bud growing point can result in growth
from the buds at the leaf axil as shown in Fig. 7B.
Spring frost hardiness changes
Spring frost hardiness changes were precisely
determined using a controlled freezing test under
laboratory conditions (Workmaster and Palta,
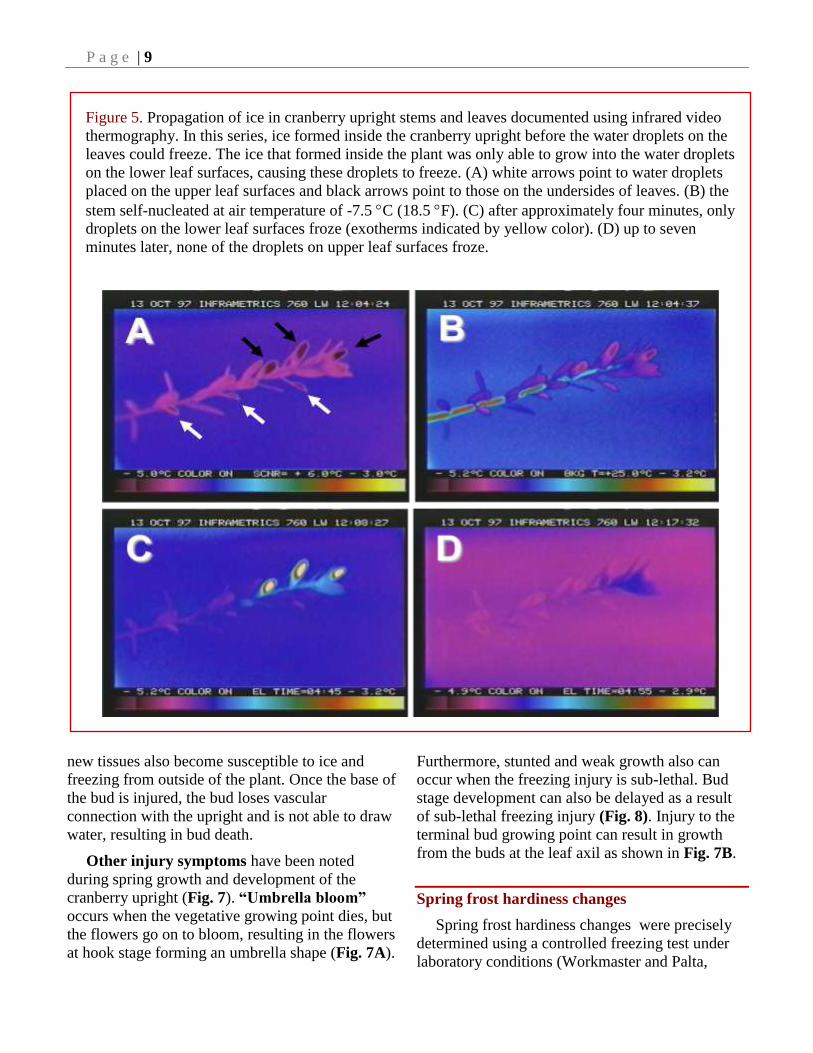
Figure 5. Propagation of ice in cranberry upright stems and leaves documented using infrared video
thermography. In this series, ice formed inside the cranberry upright before the water droplets on the
leaves could freeze. The ice that formed inside the plant was only able to grow into the water droplets
on the lower leaf surfaces, causing these droplets to freeze. (A) white arrows point to water droplets
placed on the upper leaf surfaces and black arrows point to those on the undersides of leaves. (B) the
stem self-nucleated at air temperature of -7.5 C (18.5 F). (C) after approximately four minutes, only
droplets on the lower leaf surfaces froze (exotherms indicated by yellow color). (D) up to seven
minutes later, none of the droplets on upper leaf surfaces froze.
P a g e | 10
2006). For this purpose, uprights were collected
from the field at various stages of development for
a period of three years. Each year the sampling
began when the ice cover was fully melted and
plants could be accessed. This date was called the
“ice-off” day”. The sampling period continued
from ice-off day until the beginning of bloom. On
each sampling date, uprights were taken from nine
separate locations in a given bed and sorted into the
different bud stages. These samples were
transferred to large glass test tubes and subjected to
a freeze stress using a large glycol bath in which
the temperature could be precisely controlled.
Following thawing of the samples, an initial
evaluation of upright health was performed after
two days. Uprights were then given supplemental
water and light, to allow for regrowth. Two weeks
after the imposition of the freeze-thaw stress,
leaves were evaluated for survival and buds were
rated for viability. The viability of the terminal
buds was evaluated by rating each upright for the
bud stage it had attained over the regrowth period
(Fig. 8). The frost hardiness values reported in
Figure 9 and Figure 10 (following page) are LT10
values (the temperature at which recovery and
growth of samples is impaired by 10 %) as
compared to unfrozen control samples.
Loss of hardiness occurs both within and
between bud stages (Figs. 9 and 10). The largest
hardiness changes occur in tight and swollen buds.
For example, the tight buds were hardy to about
-8 F in early spring, however, the tight buds
present in the late spring (May 25) were only hardy
to about 23 F (Fig. 9). Similarly, the hardiness of
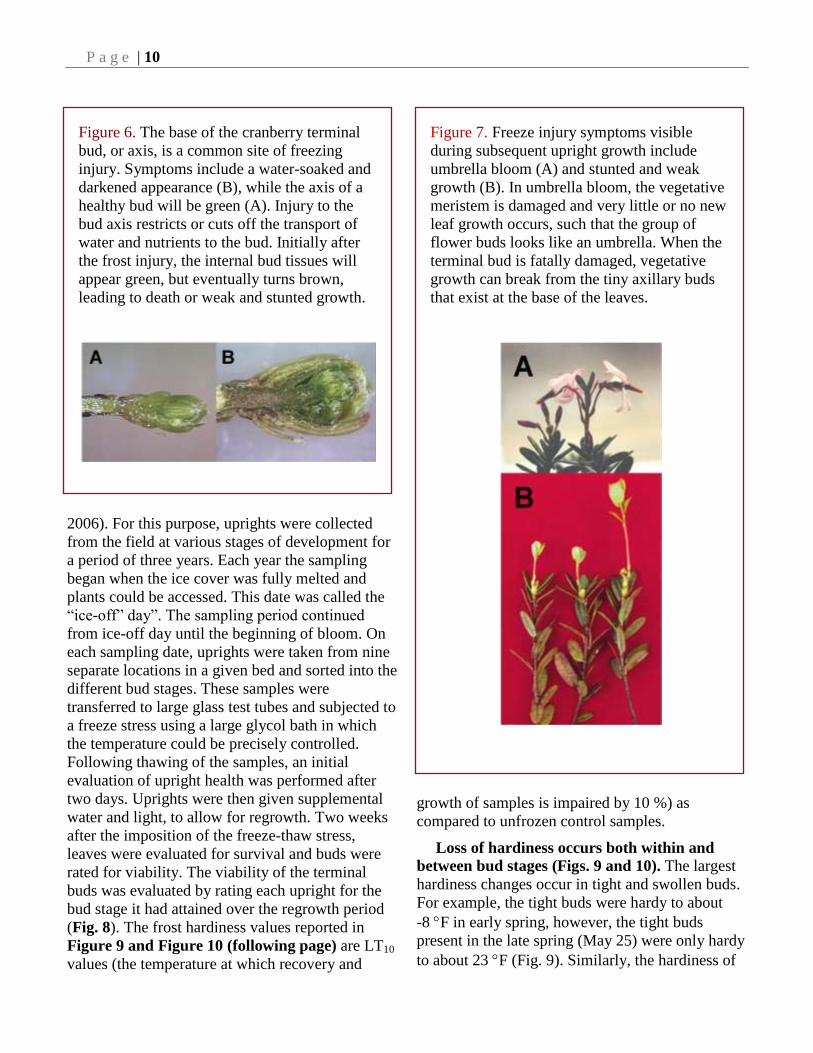
Figure 6. The base of the cranberry terminal
bud, or axis, is a common site of freezing
injury. Symptoms include a water-soaked and
darkened appearance (B), while the axis of a
healthy bud will be green (A). Injury to the
bud axis restricts or cuts off the transport of
water and nutrients to the bud. Initially after
the frost injury, the internal bud tissues will
appear green, but eventually turns brown,
leading to death or weak and stunted growth.
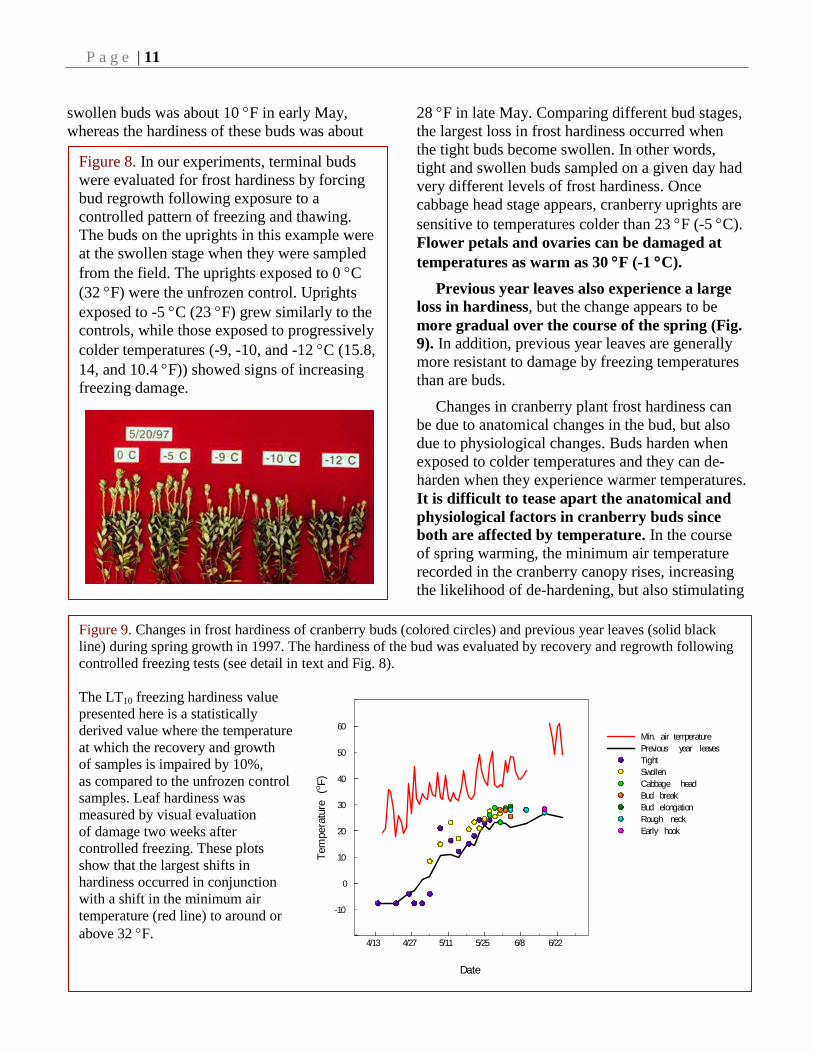
Figure 7. Freeze injury symptoms visible
during subsequent upright growth include
umbrella bloom (A) and stunted and weak
growth (B). In umbrella bloom, the vegetative
meristem is damaged and very little or no new
leaf growth occurs, such that the group of
flower buds looks like an umbrella. When the
terminal bud is fatally damaged, vegetative
growth can break from the tiny axillary buds
that exist at the base of the leaves.
P a g e | 11
swollen buds was about 10 F in early May,
whereas the hardiness of these buds was about
28 F in late May. Comparing different bud stages,
the largest loss in frost hardiness occurred when
the tight buds become swollen. In other words,
tight and swollen buds sampled on a given day had
very different levels of frost hardiness. Once
cabbage head stage appears, cranberry uprights are
sensitive to temperatures colder than 23 F (-5 C).
Flower petals and ovaries can be damaged at
temperatures as warm as 30 F (-1 C).
Previous year leaves also experience a large
loss in hardiness, but the change appears to be
more gradual over the course of the spring (Fig.
9). In addition, previous year leaves are generally
more resistant to damage by freezing temperatures
than are buds.
Changes in cranberry plant frost hardiness can
be due to anatomical changes in the bud, but also
due to physiological changes. Buds harden when
exposed to colder temperatures and they can de-
harden when they experience warmer temperatures.
It is difficult to tease apart the anatomical and
physiological factors in cranberry buds since
both are affected by temperature. In the course
of spring warming, the minimum air temperature
recorded in the cranberry canopy rises, increasing
the likelihood of de-hardening, but also stimulating
Figure 8. In our experiments, terminal buds
were evaluated for frost hardiness by forcing
bud regrowth following exposure to a
controlled pattern of freezing and thawing.
The buds on the uprights in this example were
at the swollen stage when they were sampled
from the field. The uprights exposed to 0 C
(32 F) were the unfrozen control. Uprights
exposed to -5 C (23 F) grew similarly to the
controls, while those exposed to progressively
colder temperatures (-9, -10, and -12 C (15.8,
14, and 10.4 F)) showed signs of increasing
freezing damage.
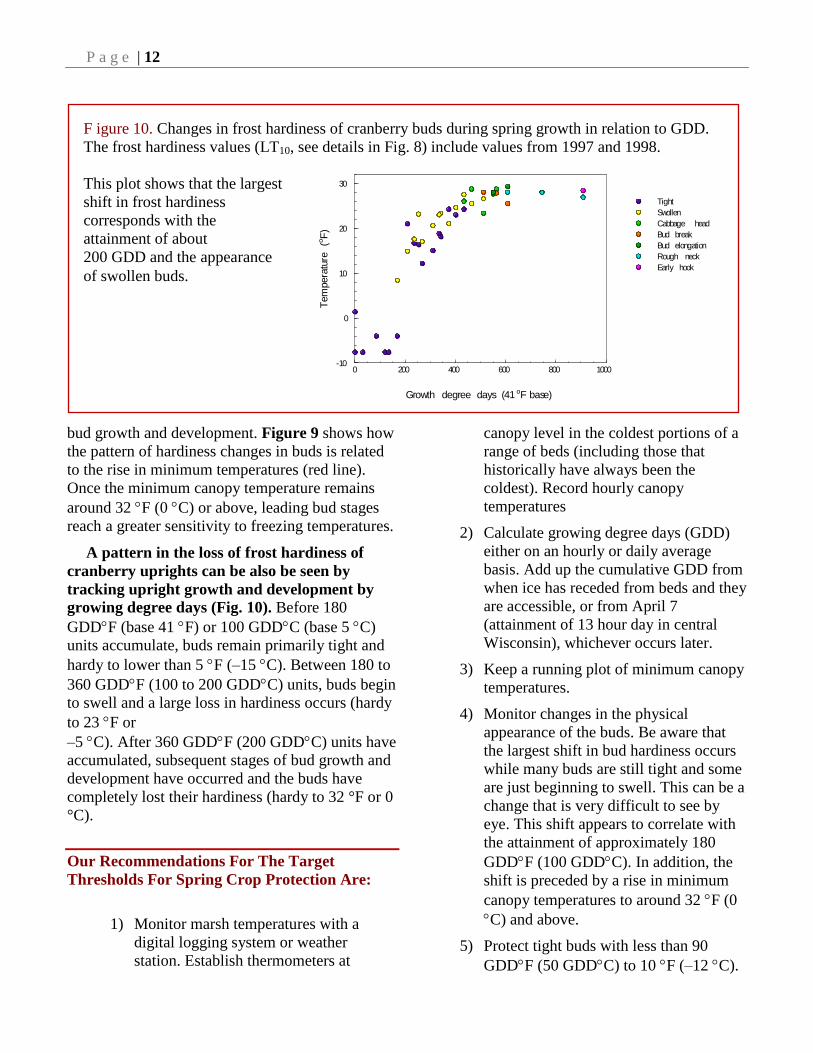
Figure 9. Changes in frost hardiness of cranberry buds (colored circles) and previous year leaves (solid black
line) during spring growth in 1997. The hardiness of the bud was evaluated by recovery and regrowth following
controlled freezing tests (see detail in text and Fig. 8).
The LT10 freezing hardiness value
presented here is a statistically
derived value where the temperature
at which the recovery and growth
of samples is impaired by 10%,
as compared to the unfrozen control
samples. Leaf hardiness was
measured by visual evaluation
of damage two weeks after
controlled freezing. These plots
show that the largest shifts in
hardiness occurred in conjunction
with a shift in the minimum air
temperature (red line) to around or
above 32 F.
4/13 4/27 5/11 5/25 6/8 6/22
-10
0
10
20
30
40
50
60
Date
Tem
pera
ture
(oF
)
Min. air temperature
Previous year leaves
Tight
Swollen
Cabbage head
Bud break
Bud elongation
Rough neck
Early hook
P a g e | 12
bud growth and development. Figure 9 shows how
the pattern of hardiness changes in buds is related
to the rise in minimum temperatures (red line).
Once the minimum canopy temperature remains
around 32 F (0 C) or above, leading bud stages
reach a greater sensitivity to freezing temperatures.
A pattern in the loss of frost hardiness of
cranberry uprights can be also be seen by
tracking upright growth and development by
growing degree days (Fig. 10). Before 180
GDDF (base 41 F) or 100 GDDC (base 5 C)
units accumulate, buds remain primarily tight and
hardy to lower than 5 F (–15 C). Between 180 to
360 GDDF (100 to 200 GDDC) units, buds begin
to swell and a large loss in hardiness occurs (hardy
to 23 F or
–5 C). After 360 GDDF (200 GDDC) units have
accumulated, subsequent stages of bud growth and
development have occurred and the buds have
completely lost their hardiness (hardy to 32 °F or 0
°C).
Our Recommendations For The Target
Thresholds For Spring Crop Protection Are:
1) Monitor marsh temperatures with a
digital logging system or weather
station. Establish thermometers at
canopy level in the coldest portions of a
range of beds (including those that
historically have always been the
coldest). Record hourly canopy
temperatures
2) Calculate growing degree days (GDD)
either on an hourly or daily average
basis. Add up the cumulative GDD from
when ice has receded from beds and they
are accessible, or from April 7
(attainment of 13 hour day in central
Wisconsin), whichever occurs later.
3) Keep a running plot of minimum canopy
temperatures.
4) Monitor changes in the physical
appearance of the buds. Be aware that
the largest shift in bud hardiness occurs
while many buds are still tight and some
are just beginning to swell. This can be a
change that is very difficult to see by
eye. This shift appears to correlate with
the attainment of approximately 180
GDDF (100 GDDC). In addition, the
shift is preceded by a rise in minimum
canopy temperatures to around 32 F (0
C) and above.
5) Protect tight buds with less than 90
GDDF (50 GDDC) to 10 F (–12 C).
F igure 10. Changes in frost hardiness of cranberry buds during spring growth in relation to GDD.
The frost hardiness values (LT10, see details in Fig. 8) include values from 1997 and 1998.
This plot shows that the largest
shift in frost hardiness
corresponds with the
attainment of about
200 GDD and the appearance
of swollen buds.
0 200 400 600 800 1000-10
0
10
20
30
Growth degree days (41 oF base)
Tem
pera
ture
(oF
)
Tight
Swollen
Cabbage head
Bud break
Bud elongation
Rough neck
Early hook
P a g e | 13
From 90 to 180 GDDF (50 to 100
GDDC), protect tight and swollen buds
to 23 F (–5 C). After 180 GDDF (100
GDDC) have accumulated, protect to
32 F (0 C). Buds will reach the
cabbage head stage after 360 GDDF
(200 GDDC) and maximum sensitivity
will be reached from that point forward.
6) Use the bud hardiness ranges shown in
Figure 1 as a general guide for bud
hardiness in spring.
Fall Frost hardiness changes
Fruit frost hardiness
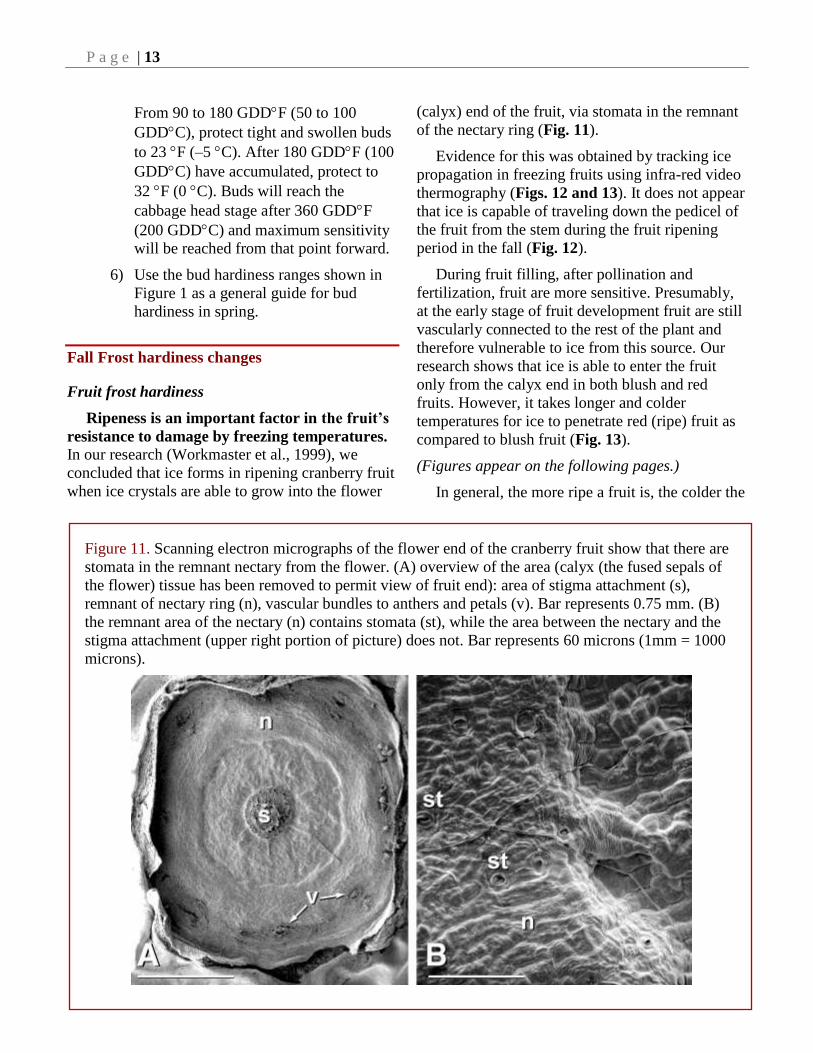
Ripeness is an important factor in the fruit’s
resistance to damage by freezing temperatures. In our research (Workmaster et al., 1999), we
concluded that ice forms in ripening cranberry fruit
when ice crystals are able to grow into the flower
(calyx) end of the fruit, via stomata in the remnant
of the nectary ring (Fig. 11).
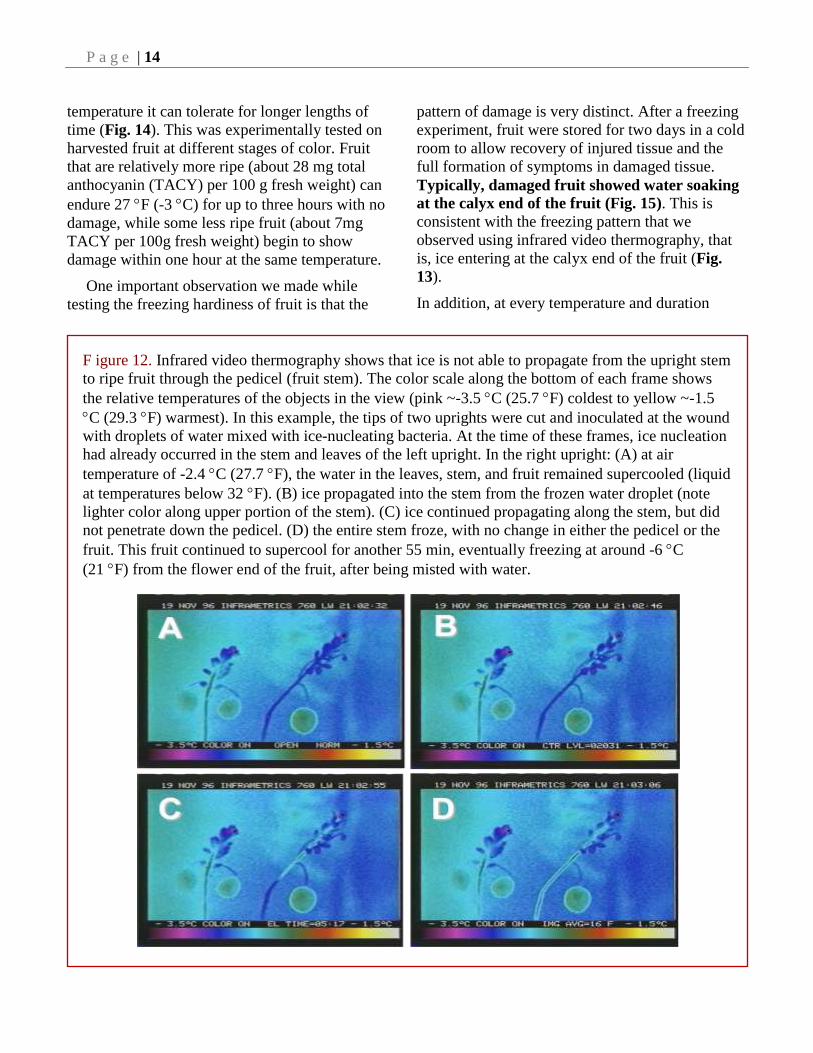
Evidence for this was obtained by tracking ice
propagation in freezing fruits using infra-red video
thermography (Figs. 12 and 13). It does not appear
that ice is capable of traveling down the pedicel of
the fruit from the stem during the fruit ripening
period in the fall (Fig. 12).
During fruit filling, after pollination and
fertilization, fruit are more sensitive. Presumably,
at the early stage of fruit development fruit are still
vascularly connected to the rest of the plant and
therefore vulnerable to ice from this source. Our
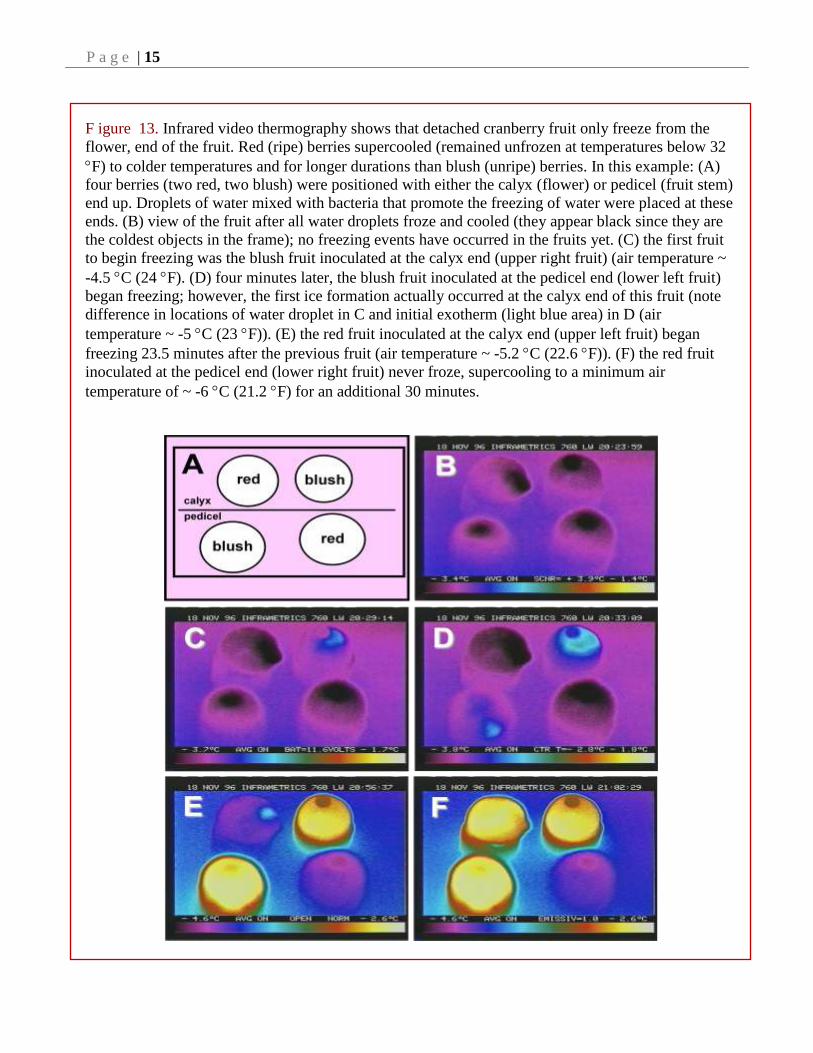
research shows that ice is able to enter the fruit
only from the calyx end in both blush and red
fruits. However, it takes longer and colder
temperatures for ice to penetrate red (ripe) fruit as
compared to blush fruit (Fig. 13).
(Figures appear on the following pages.)
In general, the more ripe a fruit is, the colder the
Figure 11. Scanning electron micrographs of the flower end of the cranberry fruit show that there are
stomata in the remnant nectary from the flower. (A) overview of the area (calyx (the fused sepals of
the flower) tissue has been removed to permit view of fruit end): area of stigma attachment (s),
remnant of nectary ring (n), vascular bundles to anthers and petals (v). Bar represents 0.75 mm. (B)
the remnant area of the nectary (n) contains stomata (st), while the area between the nectary and the
stigma attachment (upper right portion of picture) does not. Bar represents 60 microns (1mm = 1000
microns).
P a g e | 14
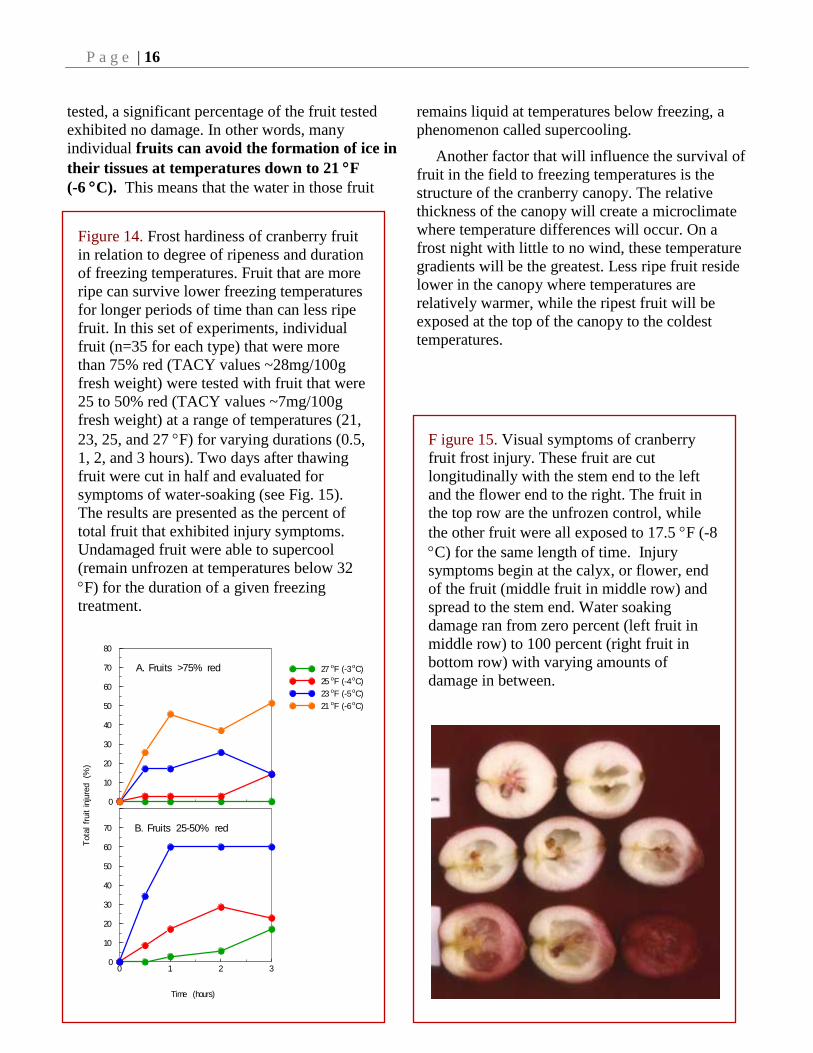
temperature it can tolerate for longer lengths of
time (Fig. 14). This was experimentally tested on
harvested fruit at different stages of color. Fruit
that are relatively more ripe (about 28 mg total
anthocyanin (TACY) per 100 g fresh weight) can
endure 27 F (-3 C) for up to three hours with no
damage, while some less ripe fruit (about 7mg
TACY per 100g fresh weight) begin to show
damage within one hour at the same temperature.
One important observation we made while
testing the freezing hardiness of fruit is that the
pattern of damage is very distinct. After a freezing
experiment, fruit were stored for two days in a cold
room to allow recovery of injured tissue and the
full formation of symptoms in damaged tissue.
Typically, damaged fruit showed water soaking
at the calyx end of the fruit (Fig. 15). This is
consistent with the freezing pattern that we
observed using infrared video thermography, that
is, ice entering at the calyx end of the fruit (Fig.
13).
In addition, at every temperature and duration
F igure 12. Infrared video thermography shows that ice is not able to propagate from the upright stem
to ripe fruit through the pedicel (fruit stem). The color scale along the bottom of each frame shows
the relative temperatures of the objects in the view (pink ~-3.5 C (25.7 F) coldest to yellow ~-1.5
C (29.3 F) warmest). In this example, the tips of two uprights were cut and inoculated at the wound
with droplets of water mixed with ice-nucleating bacteria. At the time of these frames, ice nucleation
had already occurred in the stem and leaves of the left upright. In the right upright: (A) at air
temperature of -2.4 C (27.7 F), the water in the leaves, stem, and fruit remained supercooled (liquid
at temperatures below 32 F). (B) ice propagated into the stem from the frozen water droplet (note
lighter color along upper portion of the stem). (C) ice continued propagating along the stem, but did
not penetrate down the pedicel. (D) the entire stem froze, with no change in either the pedicel or the
fruit. This fruit continued to supercool for another 55 min, eventually freezing at around -6 C
(21 F) from the flower end of the fruit, after being misted with water.
P a g e | 15
F igure 13. Infrared video thermography shows that detached cranberry fruit only freeze from the
flower, end of the fruit. Red (ripe) berries supercooled (remained unfrozen at temperatures below 32
F) to colder temperatures and for longer durations than blush (unripe) berries. In this example: (A)
four berries (two red, two blush) were positioned with either the calyx (flower) or pedicel (fruit stem)
end up. Droplets of water mixed with bacteria that promote the freezing of water were placed at these
ends. (B) view of the fruit after all water droplets froze and cooled (they appear black since they are
the coldest objects in the frame); no freezing events have occurred in the fruits yet. (C) the first fruit
to begin freezing was the blush fruit inoculated at the calyx end (upper right fruit) (air temperature ~
-4.5 C (24 F). (D) four minutes later, the blush fruit inoculated at the pedicel end (lower left fruit)
began freezing; however, the first ice formation actually occurred at the calyx end of this fruit (note
difference in locations of water droplet in C and initial exotherm (light blue area) in D (air
temperature ~ -5 C (23 F)). (E) the red fruit inoculated at the calyx end (upper left fruit) began
freezing 23.5 minutes after the previous fruit (air temperature ~ -5.2 C (22.6 F)). (F) the red fruit
inoculated at the pedicel end (lower right fruit) never froze, supercooling to a minimum air
temperature of ~ -6 C (21.2 F) for an additional 30 minutes.
P a g e | 16
tested, a significant percentage of the fruit tested
exhibited no damage. In other words, many
individual fruits can avoid the formation of ice in
their tissues at temperatures down to 21 F
(-6 C). This means that the water in those fruit
remains liquid at temperatures below freezing, a
phenomenon called supercooling.
Another factor that will influence the survival of
fruit in the field to freezing temperatures is the
structure of the cranberry canopy. The relative
thickness of the canopy will create a microclimate
where temperature differences will occur. On a
frost night with little to no wind, these temperature
gradients will be the greatest. Less ripe fruit reside
lower in the canopy where temperatures are
relatively warmer, while the ripest fruit will be
exposed at the top of the canopy to the coldest
temperatures.
Figure 14. Frost hardiness of cranberry fruit
in relation to degree of ripeness and duration
of freezing temperatures. Fruit that are more
ripe can survive lower freezing temperatures
for longer periods of time than can less ripe
fruit. In this set of experiments, individual
fruit (n=35 for each type) that were more
than 75% red (TACY values ~28mg/100g
fresh weight) were tested with fruit that were
25 to 50% red (TACY values ~7mg/100g
fresh weight) at a range of temperatures (21,
23, 25, and 27 F) for varying durations (0.5,
1, 2, and 3 hours). Two days after thawing
fruit were cut in half and evaluated for
symptoms of water-soaking (see Fig. 15).
The results are presented as the percent of
total fruit that exhibited injury symptoms.
Undamaged fruit were able to supercool
(remain unfrozen at temperatures below 32
F) for the duration of a given freezing
treatment.
0
10
20
30
40
50
60
70
80
27 oF (-3oC)
25 oF (-4oC)
23 oF (-5oC)
21 oF (-6oC)
0 1 2 30
10
20
30
40
50
60
70
Time (hours)
Tota
lfr
uit
inju
red
(%)
A. Fruits >75% red
B. Fruits 25-50% red
F igure 15. Visual symptoms of cranberry
fruit frost injury. These fruit are cut
longitudinally with the stem end to the left
and the flower end to the right. The fruit in
the top row are the unfrozen control, while
the other fruit were all exposed to 17.5 F (-8
C) for the same length of time. Injury
symptoms begin at the calyx, or flower, end
of the fruit (middle fruit in middle row) and
spread to the stem end. Water soaking
damage ran from zero percent (left fruit in
middle row) to 100 percent (right fruit in
bottom row) with varying amounts of
damage in between.
P a g e | 17
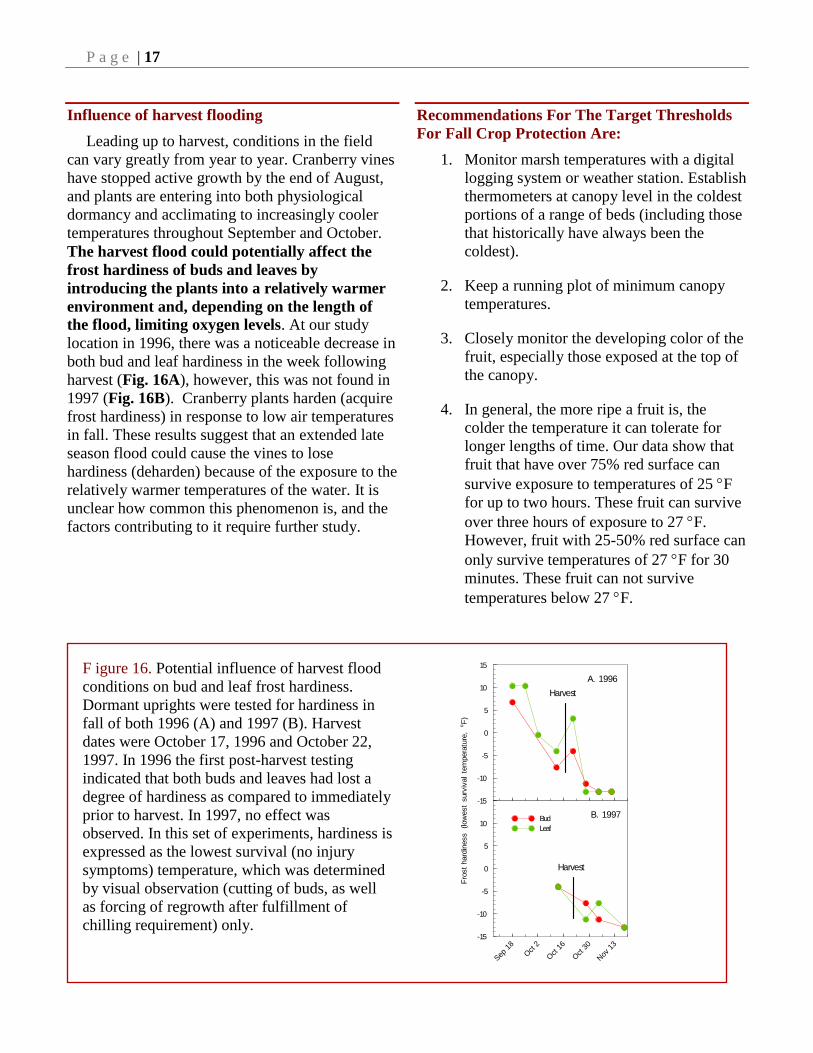
Influence of harvest flooding
Leading up to harvest, conditions in the field
can vary greatly from year to year. Cranberry vines
have stopped active growth by the end of August,
and plants are entering into both physiological
dormancy and acclimating to increasingly cooler
temperatures throughout September and October.
The harvest flood could potentially affect the
frost hardiness of buds and leaves by
introducing the plants into a relatively warmer
environment and, depending on the length of
the flood, limiting oxygen levels. At our study
location in 1996, there was a noticeable decrease in
both bud and leaf hardiness in the week following
harvest (Fig. 16A), however, this was not found in
1997 (Fig. 16B). Cranberry plants harden (acquire
frost hardiness) in response to low air temperatures
in fall. These results suggest that an extended late
season flood could cause the vines to lose
hardiness (deharden) because of the exposure to the
relatively warmer temperatures of the water. It is
unclear how common this phenomenon is, and the
factors contributing to it require further study.
Recommendations For The Target Thresholds
For Fall Crop Protection Are:
1. Monitor marsh temperatures with a digital
logging system or weather station. Establish
thermometers at canopy level in the coldest
portions of a range of beds (including those
that historically have always been the
coldest).
2. Keep a running plot of minimum canopy
temperatures.
3. Closely monitor the developing color of the
fruit, especially those exposed at the top of
the canopy.
4. In general, the more ripe a fruit is, the
colder the temperature it can tolerate for
longer lengths of time. Our data show that
fruit that have over 75% red surface can
survive exposure to temperatures of 25 F
for up to two hours. These fruit can survive
over three hours of exposure to 27 F.
However, fruit with 25-50% red surface can
only survive temperatures of 27 F for 30
minutes. These fruit can not survive
temperatures below 27 F.
F igure 16. Potential influence of harvest flood
conditions on bud and leaf frost hardiness.
Dormant uprights were tested for hardiness in
fall of both 1996 (A) and 1997 (B). Harvest
dates were October 17, 1996 and October 22,
1997. In 1996 the first post-harvest testing
indicated that both buds and leaves had lost a
degree of hardiness as compared to immediately
prior to harvest. In 1997, no effect was
observed. In this set of experiments, hardiness is
expressed as the lowest survival (no injury
symptoms) temperature, which was determined
by visual observation (cutting of buds, as well
as forcing of regrowth after fulfillment of
chilling requirement) only.
-15
-10
-5
0
5
10
15
Fro
st
hard
iness
(low
est
surv
ival
tem
pera
ture
,oF
)
Bud
Leaf
Sep
18
Oct
2
Oct
16
Oct
30
Nov
13-15
-10
-5
0
5
10B. 1997
A. 1996
Harvest
Harvest
P a g e | 18
5. In general, fruit color is known to develop
in response to low temperature and light.
Frost protection will tend to keep the beds
warmer, thus influencing both hardening
and color development. Furthermore, as
stated above, higher colored fruit can
survive lower temperatures for longer
durations. So, a grower‟s frost protection
strategy should take this aspect into
consideration.
6. There is a possibility that cranberry
uprights can lose hardiness following an
extended flood during harvest. Growers are
cautioned to limit the durations of harvest
floods.
Literature Cited
Anderson, J.L. and S.D. Seeley. 1992. Modeling
strategy in pomology: development of the Utah
models. Acta Hort. 313:297-306.
Cannell, M.G.R. and R.I. Smith. 1986. Climatic
warming, spring budburst and frost damage on trees.
J. Appl. Ecol. 23:177-191.
DeMoranville, C.J., J.R. Davenport, K. Patten, T.R.
Roper, B.C. Strik, N. Vorsa, and A.P. Poole. 1996.
Fruit mass development in three cranberry cultivars
and five production regions. J. Amer. Soc. Hort. Sci.
121:680-685.
George, M.F., M.J. Burke, H.M. Pellett, and A.G.
Johnson. 1974. Low temperature exotherms and
woody plant distribution. HortScience. 9:519-522.
Hawker, G.M. and E.J. Stang. 1985. Characterizing
vegetative growth and fruit development in
cranberry (Vaccinium macrocarpon Ait.) by thermal
summation. Acta Hort. 165:311-317.
Lenhardt, P.J., G.W. Eaton, and B. Mahrt. 1976. Effect
of photoperiod and SADH on cranberry growth and
flowering in the greenhouse. In Report of the Res.
Com. of Can. Hort. Coun. 252 (Abst.).
Levitt, J. 1980. Responses of plants to environmental
stresses. Vol. 1, Chilling, freezing, and high
temperature stresses. 2nd ed. Academic Press,
Orlando, Fla.
Palta, J.P. 1990. Stress interactions at the cellular and
membrane levels. HortScience. 25:1377-1381.
Palta, J.P., J. Levitt, and E.J. Stadelmann. 1977.
Freezing injury in onion bulb cells. II. Post-thawing
injury and recovery. Plant Physiol. 60:398-401.
Palta, J.P. and L.S. Weiss. 1993. Ice formation and
freezing injury: an overview on the survival
mechanisms and molecular aspects of injury and
cold acclimation in herbaceous plants, p. 144-176.
In: P.H. Li and L. Christersson (eds.). Advances in
plant cold hardiness. CRC Press, Boca Raton.
Sakai, A. and W. Larcher. 1987. Frost survival of
plants: responses and adaptation to freezing stress.
Springer-Verlag, Berlin.
Steffen, K.L., R. Arora, and J.P. Palta. 1989. Relative
sensitivity of photosynthesis and respiration to
freeze-thaw stress in herbaceous species: importance
of realistic freeze-thaw protocols. Plant Physiol.
89:1372-1379.
Wisconsin-Minnesota Cooperative Extension
Agricultural Weather Page. 2001. [Cranberry crop
development] Available from
<http://www.soils.wisc.edu/wimnext/cranberry/cran
dd.html> Accessed June 30, 2001.
Wisniewski, M., S.E. Lindow, and E.N. Ashworth.
1997. Observations of ice nucleation and
propagation in plants using infrared video
thermography. Plant Physiol. 113:327-334.
P a g e | 19
Workmaster, B.A., J.P. Palta, M. Wisniewski. 1999. Ice
nucleation and propagation in cranberry uprights and
fruit using infrared video thermography. J. Amer.
Soc. Hort. Sci. 124:619-625.
Workmaster, B.A. and Palta, J.P. 2006. Shifts in bud
and leaf hardiness during spring growth and
development of the cranberry upright: Regrowth
potential as an indicator of hardiness. J. Amer. Soc.
Hort. Sci. 131:327-337.
For more information, visit http://www.horticulture.wisc.edu/faculty/faculty_pages/Palta/palta.php
and click on “Cranberry publications.”
Acknowledgements
We wish to acknowledge the Wisconsin Cranberry Growers Association for providing funding, in part,
for this research and for the publication costs. Our sincere thanks to the Wisconsin growers for their
cooperation and contributions of research space, time, and insight to this effort. Thank you to Roger
Schmidt for his generous help with the layout and to Sandra Vega for editing assistance.

P a g e | 20

P a g e | 21