Embed Size (px)
Citation preview

Fronts

Definition (Glossary of Meteorology)
Front: …generally the interface or transition zone between two air masses of different density
Air Mass: …a widespread body of air that is approximately homogeneous in its horizontal extent, particularly with reference to temperature and moisture distribution…

Where’s the front? (easy question)
What kind of front is on this map? (tougher question)
How can you tell from the data what kind of front it is? (really tough question – or maybe not so tough)


This map has every major kind of front analyzed somewhere on it.
What are the frontal types and their symbols?

Example of a very powerful front. What makes it strong? (Use the data and the definition : a “transition zone between two air masses of different density”)

18Z map from last year. Where is the front?

Typical symbols on a weather map. Note the cross section goes through the cold front.
Viewed along the cross section, these are typical clouds and precip types.
At a station, this is the sequence you’d expect with this cold frontal passage (front moving east to west)

Similar to the cold front, this is a typical weather map for a warm front.
Warm front cross sections have stratoform clouds and steady precip.
Here’s a typical weather sequence if the front is moving from south to north.
(Show time lapse FromClrtoLowovcst

Doesn’t exist in the real atmosphere Much more realistic

All fronts are located in troughs of low pressure. This is because of the converging winds necessary to create the air mass change.

Because of their convergent winds, Lows will have fronts. Highs will not. You can have Lows without fronts and fronts without Lows.
The dashed orange lines are pressure troughs. They could become fronts if they strengthen.

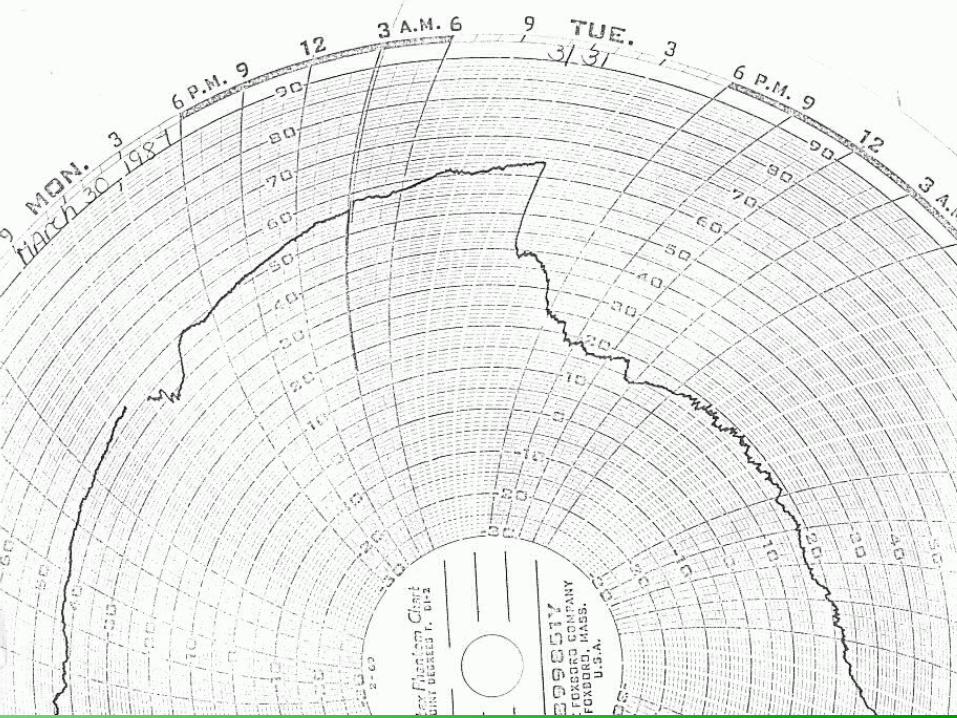
Spectacular front passes Oneonta 18Z on Mar 31, 1987.

Here’s the temperature trace.
At what time did that cold front reach Oneonta?
Dewpoint trace Same time, of course

Before you see the pressure trace, what do you expect to see, given what you know now about fronts?
Pressure falls before front arrives
Rapid pressure rise after front passes
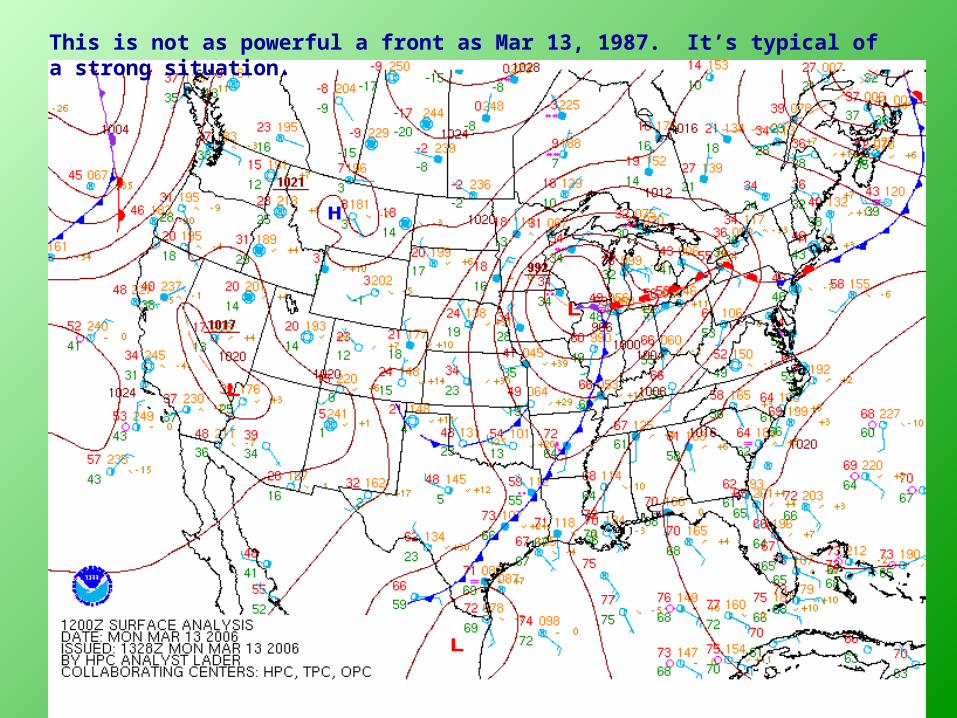
This is not as powerful a front as Mar 13, 1987. It’s typical of a strong situation.
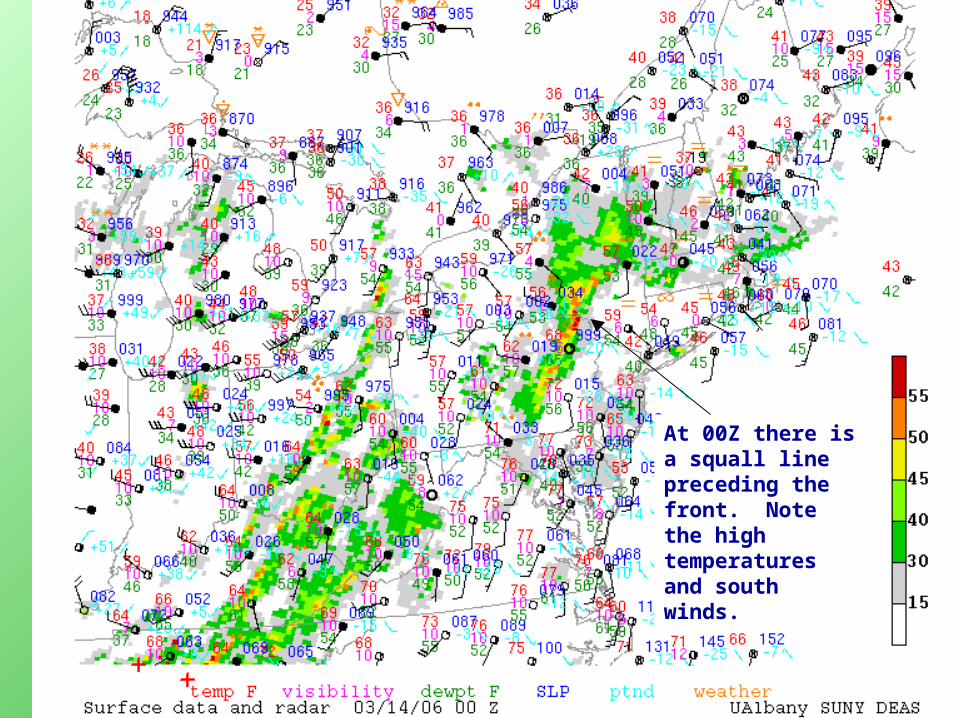
At 00Z there is a squall line preceding the front. Note the high temperatures and south winds.
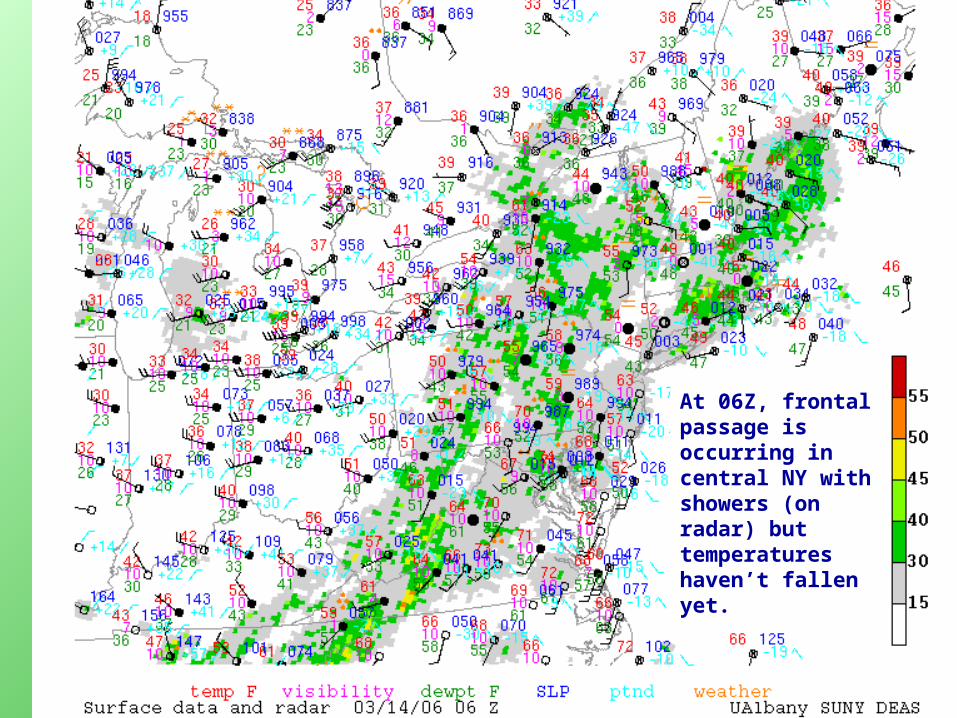
At 06Z, frontal passage is occurring in central NY with showers (on radar) but temperatures haven’t fallen yet.

By 12Z, winds have shifted and the temperature is falling.


Frontolysis as the front gets near the Gulf of Mexico. Step through this.


This front undergoes frontolysis and becomes a pressure trough.
The Norwegian Cyclone model didn’t account for this but it happens and has effects on the weather

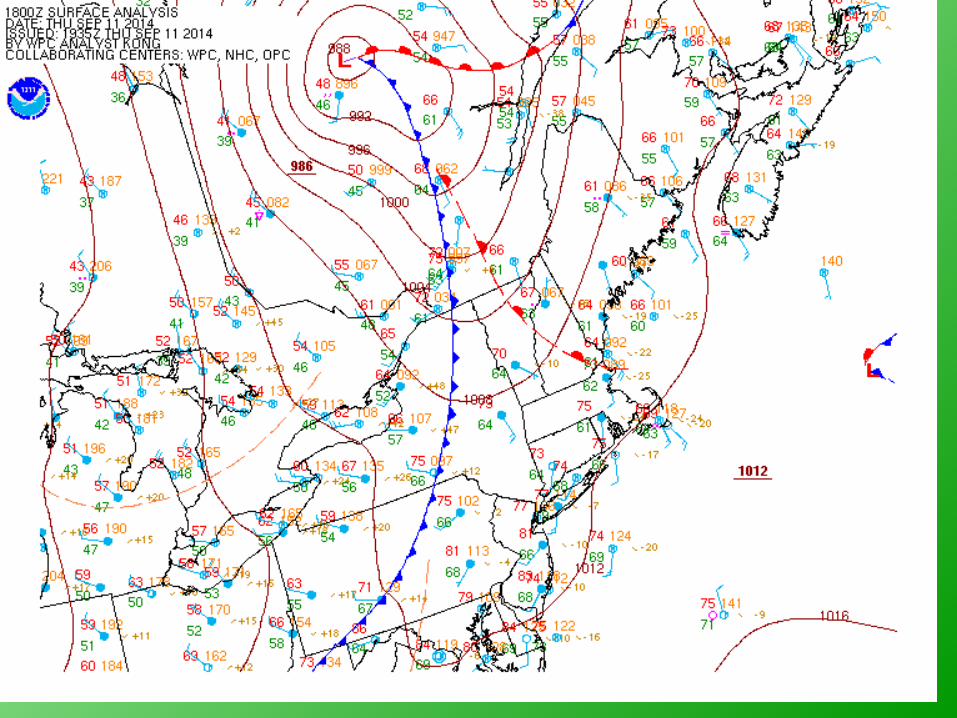
We can calculate the strength of the fronts using the logic of Margules. For that we need to look at the weather observations.

The slope of a front is one way to assess its strength

Frontal slope calculation. There is obviously a front here. How do you know?

Here’s a small part of the 18Z surface map from Sept 11, 2014. Consider Albany to be in the light air and Oneonta to be just across the front in the dense air.
Here is Margules’ formula:
Assume the mean latitude is 42.5 N and g = 9.8 m/s. Use the wind shown at Oneonta (4 kts) as an estimate of the Geostrophic wind normal to the front. Estimate anything else you need from the observations. Calculate the angle this front made with the ground. What could one do with that number?

(Based, in part, on Margules)