Embed Size (px)
Citation preview

adar provides an all-weather, day-and-night imaging capability for mapping the Earth’s surface. Through
interferometric synthetic aperture radar (InSAR) technique, radar imagery can be used to map Earth surface characteristics and measure land surface deformation at an unprecedented precision and spatial resolution. This article introduces the basics of radar and InSAR imaging, summarizes the revolution of InSAR technology on monitoring natural hazards and characterizing natural resources, and highlights emerging InSAR technologies in coming years.
Frontiers of Radar Remote Sensing
By Zhong Lu and Lei Zhang
R
L-band ALOS PALSAR InSAR im-
age shows water level changes over the swamp
forest in south-eastern Loui-siana between Jan 29 and Mar
16, 2007.
PHOTOGRAMMETRIC ENGINEERING & REMOTE SENSING J anuar y 2014 5

6 J anuar y 2014 PHOTOGRAMMETRIC ENGINEERING & REMOTE SENSING
Radar Traditional radar is essentially a tracking system that measures: 1.) the distance to an object based on the time for a radar pulse traveling at the speed of light to make a round trip from the transmitter to the object and back, and 2.) the object’s velocity based on the Doppler shift of the return signal. The distance to the object, strength of the backscattered signal, and Doppler shift are three fundamental parameters measured by tracking radars. Because of these capabilities, tracking radars are indispensable in modern air traffic control and weather monitoring. For example, tracking radars provide meteorologists with the ability to peer inside thunderstorms and determine if there is rotation in the cloud, often a precursor to the development of tornadoes.
SAR In the cross-track or range direction, SARs organize return signals based on their round-trip travel time. Returns from near-range scatterers arrive before returns from far-range scatterers. In the along-track or azimuth direction, the Doppler principle comes into play. Signal returns from scatterers that are ahead of the radar as it travels along its path are shifted to slightly higher frequencies, and returns from trailing areas are shifted to slightly lower frequencies. Imaging radars use the relationship between return-signal frequency and relative velocity between radar and target to organize return signals in the azimuth direction. In this way, each return signal is tagged with specific range and azimuth coordinates, and a sequence of signals is assembled into an image. Both intensity and phase of the signal backscattered from each ground resolution element
radar noun
derived from “radio detection and ranging”. A radar system makes use of the microwave portion of the electromagnetic spectrum to determine the range, altitude, direction, or speed of objects.
Artist rendition of TanDEM-X mission consisting of configu-rated X-band radar satellites (source: DLR).
Synthetic aperture radar (SAR) noun
that takes advantage of a radar antenna’s motion to simulate the performance of a much larger antenna. SAR systems exploit long-range propagation characteristics of radar signals and the complex information processing capability of modern digital electronics to provide high-resolution imagery.
can be calculated and portrayed as part of a SAR image. Intensity values are indicative of the radar reflective properties of the target (e.g., surface slope, moisture content) and phase values provide information about surface topography.
InSAR The antennas used to acquire SAR images can be displaced in the along-track or cross-track direction to produce an along-track or across-track InSAR image. An along-track interferogram formed from two SAR images acquired with a short time lag can be used to measure the velocity of targets moving toward or away from the radar. Applications include sea-ice drift, ocean currents, river discharge, and ocean wave parameters (e.g., Romeiser et al., 2013). For cross-track InSAR, two antennas can be mounted on a single
platform for simultaneous, single-pass InSAR observation. This is the ideal configuration for generating high-resolution, precise digital elevation models (DEMs) for large regions. Alternatively, repeat-pass InSAR images can be formed by using a single antenna on an airborne or spaceborne platform moving along repeating, nearly identical flight paths. In this case, even though successive observations of the target area are separated in time, the SAR images will be highly correlated if the backscattering properties of the surface did not change in the interim. In this way, InSAR is capable of imaging ground-surface deformation with sub-centimeter accuracy at a spatial resolution of meters to tens of meters over an image swath width of a few tens of kilometers to hundreds of kilometers. This is the typical implementation for past and present satellite SAR sensors (Table 1).
Typical InSAR processing includes precise registration of an interferometric SAR image pair,
PHOTOGRAMMETRIC ENGINEERING & REMOTE SENSING J anuar y 2014 7
interferogram generation, removal of curved Earth phase trend, adaptive filtering, phase unwrapping, precise estimation of interferometric baseline, generation of a digital elevation model or surface deformation image, estimation of interferometric correlation, and rectification of interferometric products (e.g., Lu, 2007). Using a single pair of SAR images as input, a typical InSAR processing chain outputs two SAR intensity images, a deformation map or DEM, and an interferometric correlation map (e.g., Lu et al., 2010):• The intensity of a SAR backscat-
tering image depends on the size, shape, roughness, orientation, dielectric constant (strongly influ-enced by moisture content), and terrain slope of the target. SAR in-tensity images can be used to char-acterize land cover types and their changes, and (with long wave-length SARs) to reveal structures buried by vegetation canopy.
• An InSAR coherence image is a cross-correlation product de-rived from two co-registered complex-valued SAR images, and depicts changes in backscattering
characteristics at the spectrum of the radar wavelength. Loss of InSAR coherence, often referred to as decorrelation, can result from: 1.) thermal decorrelation caused by uncorrelated noise sources in radar instruments, 2.) geometric decorrelation as a consequence of imaging a target from very dif-ferent looking angles, 3.) volume decorrelation caused by volume backscattering effects, and 4.) temporal decorrelation due to envi-ronmental changes over time (e.g., Zebker and Villasenor, 1992; Lu and Kwoun, 2008). Decorrelation makes an InSAR image useless for measuring ground surface deformation. On the other hand, the pattern of decorrelation can be used to characterize surface modifications caused by flooding, wildfire, volcanic activity, or earth-quake shaking.
• An InSAR deformation image is derived from phase components of two overlapping SAR images. The spatial distribution of surface deformation along the satellite line-of-sight (LOS) direction can be used to constrain numerical
models of subsurface deformation sources (e.g., Lu, 2007).
• The ideal SAR configuration for DEM production is a single-pass (simultaneous) two-antenna sys-tem (e.g., Shuttle Radar Topogra-phy Mission (SRTM)). However, repeat-pass single-antenna InSAR also can be used to produce DEMs to characterize and monitor nat-ural and man-made hazards that result in significant changes in to-pography (e.g., Lu et al., 2003).
Pol-InSARMost spaceborne SARs such as those onboard ERS-1, ERS-2, JERS-1, and RADARSAT-1 (Table 1) are single-po-larized radars (i.e., radar signals are both transmitted and received with either vertical or horizontal polarization). Sensors of this type only partially capture the scattering properties of targets on the surface. Data from a fully-polarized radar (i.e., a system in which signals are both transmitted and received with both vertical and horizontal polarizations), such as those onboard the Japanese ALOS and Canadian Radarsat-2 sat-ellites and future SAR satellites cur-rently being planned, can be related to the signatures of known elemental targets, making it possible to infer the type of scattering that is taking place (e.g., Lee and Pottier, 2009). For example, polarization signatures of the vegetation canopy, the bulk volume of vegetation, and the ground surface are different and can be sep-arated using polarimetric analysis. An optimization procedure can be employed to maximize interferometric coherence between two polarimetric radar images, thereby reducing the effect of baseline and temporal decor-relation in the resulting polarimetric InSAR (Pol-InSAR) image. Then, us-ing a coherent target decomposition approach that separates distinctive backscattering returns from the cano-PSInSAR analysis of Newport-Inglewood fault over Los Angeles, CA.
Interferometric SAR (InSAR) noun
uses two or more SAR images of the same area to extract the land surface topography and any deformation that might have occurred during the temporal interval spanned by the images.
PHOTOGRAMMETRIC ENGINEERING & REMOTE SENSING J anuar y 2014 9
py top, bulk volume of vegetation, and ground surface, one can derive height differences between physical scat-terers with differing scattering char-acteristics (Lee and Pottier, 2009). Physical radar backscattering models for different vegetation types can be developed to calculate the canopy height, bare-Earth topography, and other parameters based on measure-ments from Pol-InSAR images.
Technical Frontiers PSInSAR – Monitoring Time-series Deformation with mm-scale PrecisionWhen more than two SAR images of a study area are available, multiple InSAR images can be produced and multi-interferogram InSAR processing can be employed to improve the accuracy of deformation measurements (or other InSAR products) (Ferretti et al., 2001, 20011; Berardino et al., 2002; Hooper et al., 2007; Zhang et al., 2012). The goal of multi-interferogram InSAR processing is to characterize the spatial and temporal behaviors of the deformation signal, various artifacts, and noise sources (e.g., atmospheric anomalies including radar-frequency dependent ionospheric phase advance and non-dispersive tropospheric phase delay of the radar signals, orbit errors, DEM-induced artifacts) in individual interferograms, then to remove the artifacts and anomalies to retrieve time-series deformation measurements at the SAR pixel level.
Among several approaches to multi-interferogram analysis, per-sistent scatterer InSAR (PSInSAR) is one of the most promising for deriving time-series deformation images. PSInSAR uses the distinctive back-scattering characteristics of certain ground targets (PS) and unique characteristics of atmospheric delay anomalies to improve the accuracy of conventional InSAR deformation measurements (Ferretti et al., 2001). The SAR backscattering signal of a PS target has a broadband spectrum in the frequency domain. As a con-sequence, the radar phase of a PS target correlates over much longer time intervals and over much longer baselines than non-PS targets. If the backscatter signal from a given pixel is dominated by return from one or more PS scatterers, the pixel remains coherent and the limitation imposed by loss of coherence in conventional
InSAR analysis can be overcome. The atmospheric contribution to the back-scattered signal, DEM error, and orbit error can be identified and removed from the data using a multi-interfero-gram iterative approach, and displace-ment histories at PS pixels can be re-solved with millimeter-scale accuracy. If a sufficient number of PS pixels exist in a series of interferograms, relative displacements among them can provide a reasonably detailed approximation to the surface deformation field. The result is akin to conventional geodetic measurements made at a network of benchmarks, as opposed to the more complete spatial coverage provided by a coherent InSAR deformation image.
Multi-track PSInSAR – Fusion of Descending and Ascending PSInSAR TracksConventional PSInSAR can derive time-series surface displacements only in the satellite’s line-of-sight direction. However, if multiple SAR images of the same area from both descending and ascending tracks are available, PSInSAR analysis can be used to es-timate the 3-D positioning of PSs over time and to derive their displacement histories in both the east-west and ver-tical directions (by ignoring any dis-
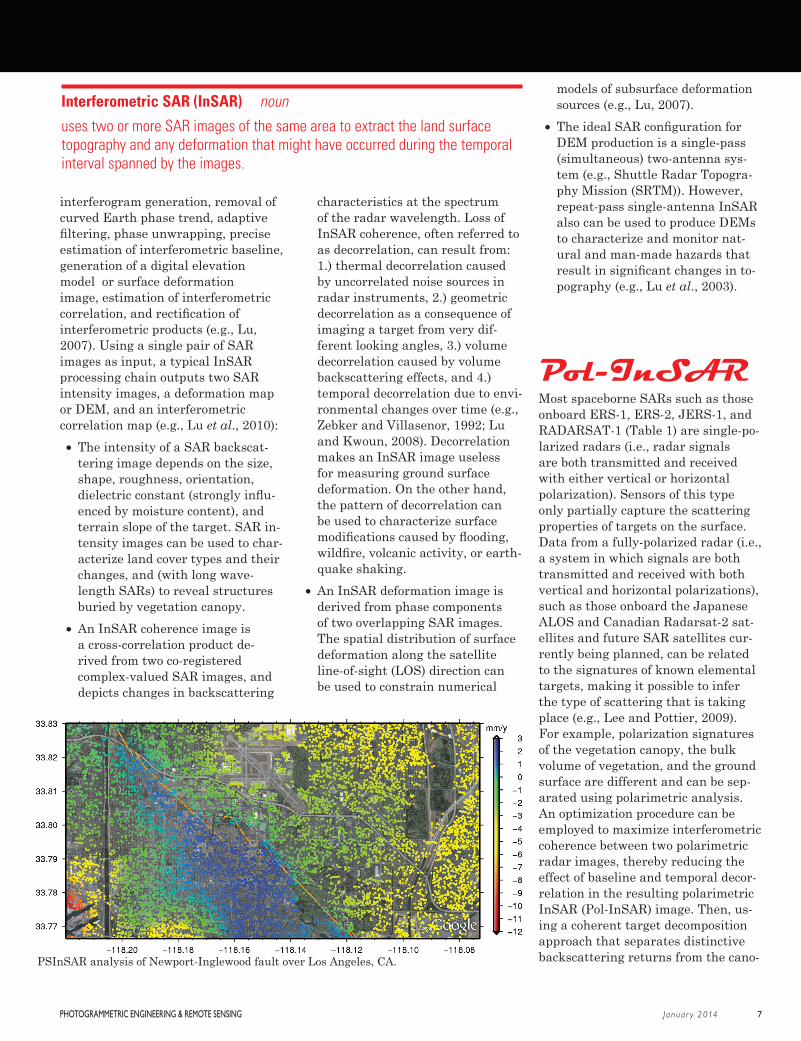
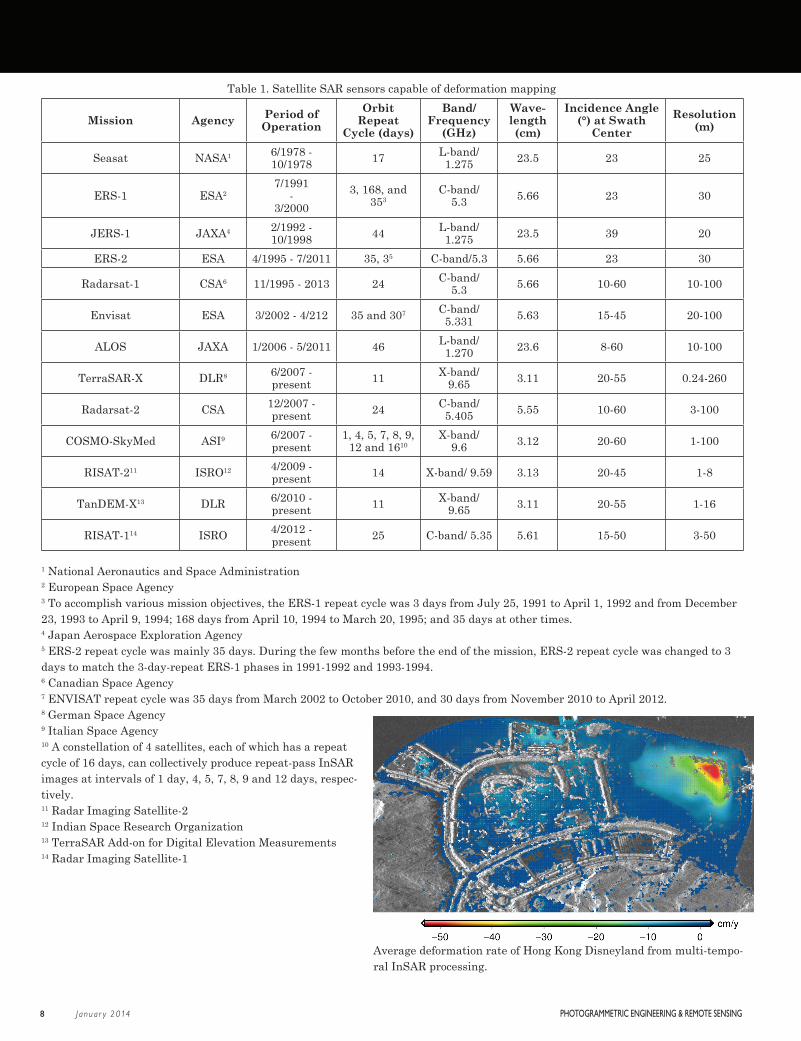
An example of multi-temporal InSAR pro-cessing over Hong Kong Disneyland and its surroundings where most lands were re-claimed from the sea. TerraSAR-X interfer-ograms (2008-2009) with different temporal intervals ranging from 11 to 77 days serve as the basic input to multi-temporal InSAR processing.
L-band radar image of Yunaska Island of the Aleutian arc acquired by NASA’s UAVSAR (uavsar.jpl.nasa.gov).
8 J anuar y 2014 PHOTOGRAMMETRIC ENGINEERING & REMOTE SENSING
Table 1. Satellite SAR sensors capable of deformation mapping
Mission Agency Period of Operation
Orbit Repeat
Cycle (days)
Band/Frequency
(GHz)
Wave-length (cm)
Incidence Angle (°) at Swath
CenterResolution
(m)
Seasat NASA1 6/1978 -10/1978 17 L-band/
1.275 23.5 23 25
ERS-1 ESA27/1991
-3/2000
3, 168, and 353
C-band/5.3 5.66 23 30
JERS-1 JAXA4 2/1992 - 10/1998 44 L-band/
1.275 23.5 39 20
ERS-2 ESA 4/1995 - 7/2011 35, 35 C-band/5.3 5.66 23 30
Radarsat-1 CSA6 11/1995 - 2013 24 C-band/5.3 5.66 10-60 10-100
Envisat ESA 3/2002 - 4/212 35 and 307 C-band/5.331 5.63 15-45 20-100
ALOS JAXA 1/2006 - 5/2011 46 L-band/1.270 23.6 8-60 10-100
TerraSAR-X DLR8 6/2007 - present 11 X-band/
9.65 3.11 20-55 0.24-260
Radarsat-2 CSA 12/2007 - present 24 C-band/
5.405 5.55 10-60 3-100
COSMO-SkyMed ASI9 6/2007 - present
1, 4, 5, 7, 8, 9, 12 and 1610
X-band/9.6 3.12 20-60 1-100
RISAT-211 ISRO12 4/2009 - present 14 X-band/ 9.59 3.13 20-45 1-8
TanDEM-X13 DLR 6/2010 - present 11 X-band/
9.65 3.11 20-55 1-16
RISAT-114 ISRO 4/2012 - present 25 C-band/ 5.35 5.61 15-50 3-50
1 National Aeronautics and Space Administration2 European Space Agency3 To accomplish various mission objectives, the ERS-1 repeat cycle was 3 days from July 25, 1991 to April 1, 1992 and from December 23, 1993 to April 9, 1994; 168 days from April 10, 1994 to March 20, 1995; and 35 days at other times. 4 Japan Aerospace Exploration Agency5 ERS-2 repeat cycle was mainly 35 days. During the few months before the end of the mission, ERS-2 repeat cycle was changed to 3 days to match the 3-day-repeat ERS-1 phases in 1991-1992 and 1993-1994.6 Canadian Space Agency7 ENVISAT repeat cycle was 35 days from March 2002 to October 2010, and 30 days from November 2010 to April 2012.8 German Space Agency9 Italian Space Agency10 A constellation of 4 satellites, each of which has a repeat cycle of 16 days, can collectively produce repeat-pass InSAR images at intervals of 1 day, 4, 5, 7, 8, 9 and 12 days, respec-tively.11 Radar Imaging Satellite-212 Indian Space Research Organization13 TerraSAR Add-on for Digital Elevation Measurements14 Radar Imaging Satellite-1
Average deformation rate of Hong Kong Disneyland from multi-tempo-ral InSAR processing.

10 J anuar y 2014 PHOTOGRAMMETRIC ENGINEERING & REMOTE SENSING
placements in the north-south direc-tion). The descending and ascending PSInSAR image stacks are processed separately, and then the resulting PS clouds are merged using data fu-sion procedures (e.g., Gernhard et al., 2012). Finally, PSInSAR line-of-sight displacements from both descending and ascending tracks are decomposed to measurements in the east-west and vertical directions. The resulting infor-mation can provide additional insights into the nature and cause(s) of the ob-served deformation.
Multi-aperture InSAR – Monitoring Along-track DeformationIt is nearly impossible to retrieve the along-track or north-south component of ground displacement from multi-track InSAR or PSInSAR images. This is a consequence of the polar orbits of current SAR satellites, which travel nearly from south to north along as-cending tracks or from north to south along descending tracks. Multi-aper-ture InSAR (MAI) exploits the phase difference between forward- and back-ward-looking interferograms produced from sub-aperture SAR images to map displacements in the along-track direc-tion (Becher and Zebker, 2006; Jung et al., 2009). For MAI analysis, each SAR image is divided into two images,
one forward-looking and one back-ward-looking, and two corresponding interferograms are produced. MAI mea-surements are sensitive to north-south displacement and, when combined with conventional InSAR measurements, can be used to map surface displace-ment in 3-D. MAI has been used to retrieve ground deformation associated with large earthquakes, volcanic erup-tions, and glacier movement (e.g., Jung et al., 2011). MAI applications currently are limited to large or abrupt ground displacements due to the technique’s greater susceptibility to decorrelation relative to conventional InSAR.
SqueeSAR — Integration of Distributed Scatterer and Persistent Scatterer TechniquesTo improve the spatial coverage of deformation estimates in non-urban areas, Ferretti and others (2011) proposed to jointly analyze persistent scatterers (PS) and distributed scatterers (DS), which are defined as statistically homogenous pixels. In contrast to PSs that typically are associated with man-made structures, boulders, and outcrops, DSs can be debris areas, non-cultivated land with short vegetation, desert areas, or other types of homogeneous surfaces. A spatially adaptive de-speckle filter can be applied to identity DSs.
Because phase values of PSs are generally deterministic and the phases of DSs are stochastic, phase triangulation can then be applied to estimate optimum phase values for DSs based on candidate pixels’
coherence properties and statistical characteristics. As the final step, DSs and PSs can be combined and processed using standard PSInSAR techniques to produce time-series deformation measurements at a spatial density higher than traditional PSInSAR measurements (Ferretti and others, 2011).
SAR Tomography — Looking into 3-D Structure of ScatterersAnother exciting line of investiga-tion involving the fusion of multiple SAR images is SAR tomography (e.g., Reigber and Moreira, 2000). A single SAR image maps 3-D characteristics of ground resolution elements into the 2-D SAR imaging plane (i.e., the slant range and azimuth directions). For vegetated terrain, the backscat-tering return at a SAR image pixel represents the projection of 3-D dis-tributed targets within each ground resolution element. Repeat-pass SAR images can be combined interferomet-rically to generate an InSAR image, which represents the average height of targets within each pixel. For vege-tated terrain, the InSAR height corre-sponds to the effective, average height of vegetation within the pixel, so the 3-D structure of scatterers in the pixel is lost. With the Pol-InSAR technique, various targets within each pixel can be separated if their polarimetric back-scattering signatures are sufficiently different. However, this is not possible when the polarimetric signatures of targets are similar. SAR tomography, on the other hand, utilizes the varia-tion of spatial baselines from multiple SAR images to construct a second synthetic aperture in the direction perpendicular to both the line-of-sight direction and the azimuth direction. In this way, the 3-D distribution of dominant scatters in a resolution ele-ment can be resolved (e.g., Reigber and Moreira, 2000). SAR tomography has the potential to dramatically improve estimates of vegetation structure, and even to alleviate geometric distortion (e.g., layover effect) that plagues tradi-tional SAR images of steep terrain.
InSAR image showing inflation of Mt. Peulik volcano (Alaska) during 1996-1998.
PHOTOGRAMMETRIC ENGINEERING & REMOTE SENSING J anuar y 2014 11
Application Frontiers Since the launch of ERS-1 by the European Space Agency (ESA), satellite InSAR images have been used to image surface deformation caused by various processes, including: • ground surface deformation at vol-
canoes both between and during eruptions, thereby providing in-sights into the volcano’s structure, magma plumbing system, and state of unrest, and enabling bet-ter assessment of volcanic hazards (e.g., Lu, 2007);
• ground surface displacements before, during, and after large seismic events, providing essential information for: 1) determining hypocenter location, fault geome-try, rupture dynamics, and inter-actions among neighboring faults, 2) inferring mechanical properties of Earth’s crust and upper mantle, and 3) mapping interseismic strain accumulation to assess long-term seismic hazards (e.g., Massonnet et al., 1993; Biggs et al., 2007);
• land surface subsidence associated with fluid withdrawal, mining, land reclamation, or slow-moving landslides, thereby improving the ability to assess and mitigate ad-verse consequences (e.g., Zhang et al., 2012; Zhao et al., 2012);
• movement of glaciers and ice fields, aiding the understanding of global warming effects and impacts on sea level change (e.g., Rignot and Thomas, 2002);
• water-level changes in wetlands to improve assessments of flood haz-ards (e.g., Lu and Kwoun, 2008); and,
• floods, wildfires, changes in soil moisture content, etc. Land cover characterization can be significant-ly enhanced when SAR imagery is fused with optical datasets (Zhang et al., 2010; Amarsaikhana et al., 2010; Datcu et al., 2112).
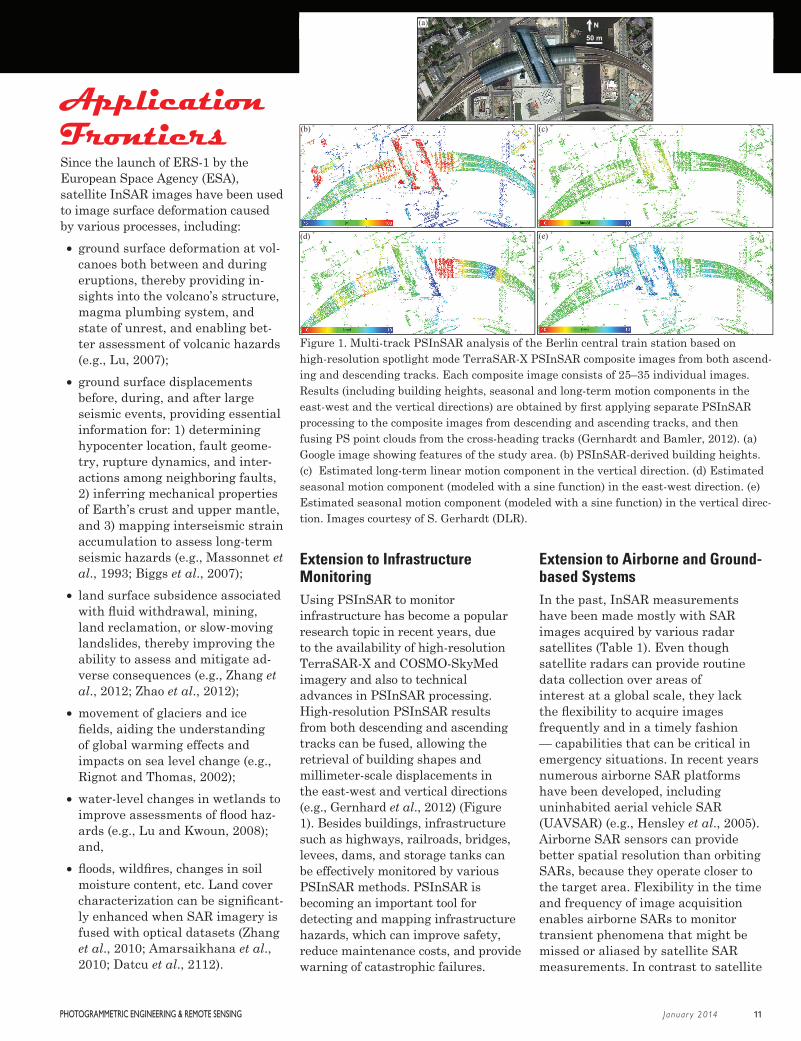
Extension to Infrastructure MonitoringUsing PSInSAR to monitor infrastructure has become a popular research topic in recent years, due to the availability of high-resolution TerraSAR-X and COSMO-SkyMed imagery and also to technical advances in PSInSAR processing. High-resolution PSInSAR results from both descending and ascending tracks can be fused, allowing the retrieval of building shapes and millimeter-scale displacements in the east-west and vertical directions (e.g., Gernhard et al., 2012) (Figure 1). Besides buildings, infrastructure such as highways, railroads, bridges, levees, dams, and storage tanks can be effectively monitored by various PSInSAR methods. PSInSAR is becoming an important tool for detecting and mapping infrastructure hazards, which can improve safety, reduce maintenance costs, and provide warning of catastrophic failures.
Extension to Airborne and Ground-based SystemsIn the past, InSAR measurements have been made mostly with SAR images acquired by various radar satellites (Table 1). Even though satellite radars can provide routine data collection over areas of interest at a global scale, they lack the flexibility to acquire images frequently and in a timely fashion — capabilities that can be critical in emergency situations. In recent years numerous airborne SAR platforms have been developed, including uninhabited aerial vehicle SAR (UAVSAR) (e.g., Hensley et al., 2005). Airborne SAR sensors can provide better spatial resolution than orbiting SARs, because they operate closer to the target area. Flexibility in the time and frequency of image acquisition enables airborne SARs to monitor transient phenomena that might be missed or aliased by satellite SAR measurements. In contrast to satellite
(e)
(b)
(d)
(c)
(a)
50 m
N
Figure 1. Multi-track PSInSAR analysis of the Berlin central train station based on high-resolution spotlight mode TerraSAR-X PSInSAR composite images from both ascend-ing and descending tracks. Each composite image consists of 25–35 individual images. Results (including building heights, seasonal and long-term motion components in the east-west and the vertical directions) are obtained by first applying separate PSInSAR processing to the composite images from descending and ascending tracks, and then fusing PS point clouds from the cross-heading tracks (Gernhardt and Bamler, 2012). (a) Google image showing features of the study area. (b) PSInSAR-derived building heights. (c) Estimated long-term linear motion component in the vertical direction. (d) Estimated seasonal motion component (modeled with a sine function) in the east-west direction. (e) Estimated seasonal motion component (modeled with a sine function) in the vertical direc-tion. Images courtesy of S. Gerhardt (DLR).

12 J anuar y 2014 PHOTOGRAMMETRIC ENGINEERING & REMOTE SENSING
sensors that are normally in polar orbits, airborne SARs can be used to image the target from versatile flight directions. This enables calculation of the 3-D surface displacement field and improves estimation of parameters that characterize the deformation source (e.g., depth, location, shape) (Jung et al., 2011; Lundgren et al., 2013).
The use of ground-based radar systems also has significantly increased in recent years (e.g., Luzi et al., 2006; Werner et al., 2012). Ground-based radar systems are becoming a reliable tool to map ground surface displacement with high spatial resolution of centimeters to meters and unprecedented temporal resolution of minutes. This capability promises to provide additional insights into processes responsible for rapid deformation during volcanic eruptions, landslides, dam failures, etc.
TanDEM-X — A Testbed for Innovative TechnologiesThe DLR TerraSAR-X tandem mission for DEM measurements (TanDEM-X) (Table 1) deserves special mention here. TanDEM-X is a new high resolution constellation InSAR mission that relies on an innovative flight formation of two X-band TerraSAR-X satellites to produce InSAR-derived DEMs on a global scale with an accuracy better than the SRTM flown in 2000 (Krieger et al., 2007). In addition, TanDEM-X enables precise mapping of ocean and river currents by fusing two SAR images steered in the along-track direction (e.g., Romeiser et al., 2013). The resulting product will be invaluable for monitoring extreme waves and ocean hazards. Furthermore, TanDEM-X will provide data to assess the utility of new methods for characterizing landscapes and monitoring their changes, including bi-static multi-angle SAR imaging, digital beam formation, and polarimetric InSAR.
Conclusion InSAR is one of the fastest growing fields in remote sensing and Earth sciences. Timely observations of precise land surface topography and time-transient surface changes from InSAR are accelerating the development of models for volcanic eruptions, earthquake displacements, landslides, and land subsidence, and also providing new tools to better characterize natural resources. Multi-interferogram techniques now allow monitoring of the safety and stability of critical infrastructure at fine resolution, and offer the capability to image the 3-D structure of vegetation on a global scale for improved resource management. With more operational SARs available in the near future, InSAR, coupled with state-of-the-art data fusion and data mining techniques, will continue to address and provide solutions to many scientific questions related to natural and man-made hazards and to natural resource management.
AcknowledgementsWe thank Stefan Gernhardt from DLR for providing imagery shown in Figure 1, USGS Volcano Hazards Program and NASA Earth Surface and Interior Program (11-DESSDT11-0024) and Research Grants Council of Hong Kong SAR (PolyU 5381/13E) for funding support, and Google Earth for Figure 1a. We are grateful for constructive review and editing by Dan Dzurisin from USGS and Jie Shan from Purdue University.
ReferencesAmarsaikhana, D., H.H. Blotevogelb,
J.L. van Genderenc, M. Ganzoriga, R. Gantuyaa, B. Nerguia, 2010. Fusing high-resolution SAR and optical imagery for improved urban land cover study and classification,
International Journal of Image and Data Fusion, 1, 83-97.
Bechor, N.B.D., and H.A. Zebker, 2006. Measuring two-dimensional movements using a single InSAR pair, Geophysical Research Letters, 33, doi: 10.1029/2006GL026883.
Berardino, P., G. Fornaro, R. Lanari, and E. Sansosti, 2002. A new algorithm for surface deformation monitoring based on small baseline differential SAR interferograms, IEEE Trans. Geosci. Remote Sens., 40, 2375–2383.
Biggs, J., Wright, T., Lu, Z., and Parsons, B., 2007. Multi-interferogram method for measuring interseismic deformation: Denali Fault, Alaska, Geophysical Journal International, 173, 1165-1179, 2007.
Datcu, M., M., R. King, L. Gueguen, P. Marchetti, 2012. Image information mining for EO applications, International Journal of Image and Data Fusion, 3, 199-201.
Ferretti, A., C. Prati, and F. Rocca, 2001. Permanent scatterers in SAR interferometry, IEEE Trans. Geosci. Remote Sensing, 39, 8-20.
Ferretti, A., A. Fumagalli, F. Novali, C. Prati, F. Rocca, and A., Rucci, 2011. A New Algorithm for Processing Interferometric Data-Stacks: SqueeSAR, IEEE Transactions on Geoscience and Remote Sensing, 49, 3460-3470.
Gernhardt, S., X. Cong, M. Eineder, S. Hinz and R. Bamler, 2012. Geometrical Fusion of Multitrack PS Point Clouds, IEEE Geoscience and Remote Sensing Letters, 9, 38-42.
Hensley, S., and others, 2005. Status of a UAVSAR Designed for Repeat Pass Interferometry for Deformation Measurements, IEEE MTT-S International Microwave Symposium Digest, 3, 1453-1456.
Hooper, A., P. Segall, and H. Zebker, 2007. Persistent scatterer interferometric synthetic aperture radar for crustal deformation

PHOTOGRAMMETRIC ENGINEERING & REMOTE SENSING J anuar y 2014 13
analysis, with application to Volca´n Alcedo, Gala´pagos, J. Geophys. Res., 112, B07407, doi:10.1029/2006JB004763.
Jung, H.S., J.S. Won, and S.W. Kim, 2009. An improvement of the performance of multiple-aperture SAR interferometry (MAI), IEEE Transactions on Geoscience and Remote Sensing, 47, 2859-2869.
Jung, H.S., Lu, Z., Won, J., Poland, M., and Miklius, A., 2011. Mapping three-dimensional surface deformation by combining multiple aperture interferometry and conventional interferometry: application to the June 2007 eruption of Kīlauea Volcano, Hawaii, IEEE Geoscience & Remote Sensing Letters, 8(1), 34-38, 10.1109/LGRS.2010.2051793.
Lundgren, P., M. Poland, A. Miklius, T. Orr, S.-H. Yun, E. Fielding, Z. Liu, A. Tanaka, W. Szeliga, S. Hensley, and S. Owen, 2013. Evolution of dike opening during the March 2011 Kamoamoa fissure eruption, Kı-lauea Volcano, Hawai`i, J. Geophys. Res., 118, 897–914.
Lee, J.S. and E. Pottier, 2009. Polarimetric Radar Imaging: From Basics to Applications, CRC Press, 398 pp.
Lu, Z., E. Fielding, M. Patrick, and C. Trautwein, 2003. Estimating lava volume by precision combination of multiple baseline spaceborne and airborne interferometric synthetic aperture radar: the 1997 eruption of Okmok volcano, Alaska, IEEE Trans. Geosci. Remote Sensing, 41, 1428-1436.
Lu, Z., 2007. InSAR imaging of volcanic deformation over cloud-prone areas—Aleutian Islands, Photogrammetric Engineering & Remote Sensing, 73, 245-257.
Lu, Z., and O. Kwoun, 2008. Radarsat-1 and ERS interferometric analysis over southeastern coastal Louisiana: Implication for mapping water-level changes beneath swamp forests, IEEE Transactions on
Geoscience and Remote Sensing, 46, 2167-2184.
Lu, Z., D. Dzurisin, H.S. Jung, J.X. Zhang, and Y.H. Zhang, 2010. Radar image and data fusion for natural hazards characterization, International Journal of Image and Data Fusion, vol. 1, p. 217-242.
Luzi, G., Pieraccini M., Mecatti D., Noferini L., Macaluso G., Galgaro A., and Atzeni C., 2006. Advances in ground based microwave interferometry for landslide survey: A case study, Int. J. Remote Sens., 27, 12, 2331–2350.
Massonnet, D., M. Rossi, C. Carmona, F. Adragna, G. Peltzer, K. Feigl, and T. Rabaute, 1993. The displacement field of the Landers earthquake mapped by radar interferometry, Nature, 364, 138–142.
Reigber, A., and A. Moreira, 2000. First demonstration of airborne SAR tomography using multibaseline L-band data, IEEE Trans. Geosci. Remote Sens., 38, 2142-2152.
Rignot, E., and Thomas, R., 2002. Mass Balance of Polar Ice Sheets, Science, 297, 1502 – 1506.
Romeiser, R., H. Runge, S. Suchandt, R. Kahle, C. Rossi, and P.S. Bell, 2013. Quality assessment of surface current fields from TerraSAR-X and TanDEM-X along-track interferometry and Doppler Centroid analysis, IEEE Trans. Geosci. Remote Sens., 51, doi:10.1109/TGRS.2013.2265659.
Werner, C., and others, 2012. The GPRI multi-mode differential interferometric radar for ground-based observations, Proceedings of EUSAR 2012, 304-307.
Zebker, H., and J., Villasenor, 1992. Decorrelation in interferometric radar echoes, IEEE Trans. Geosci. Remote Sensing, 30, 950-959.
Zhang, J.X., 2010. Multi-source remote sensing data fusion: status and trends, International Journal of Image and Data Fusion, vol. 1, p. 5-24.
Zhang, L., Lu, Z., Ding, X.L., Jung, H.S., Feng G., and Lee, C.W., 2012. Mapping ground surface deformation using temporarily coherent point SAR interferometry: Application to Los Angeles Basin, Remote Sensing of Environment, 117, 429-439.
Zhao, C.Y., Z. Lu, Q. Zhang, and J. de la Fuente, 2012. Large area landslide detection and monitoring with ALOS/PALSAR imagery data over Northern California and Southern Oregon, USA, Remote Sensing of Environment, 124, 348–359.
AuthorsZhong LuSouthern Methodist UniversityDallas, [email protected]
Lei ZhangThe Hong Kong Polytechnic UniversityHung Hom, KLN, Hong Kong
PE&RS is Looking for Articles!
Your project might make a great Highlight Article in PE&RS.
Highlight Articles are semi-technical or non-technical and meant to appeal to a broader range of readers. They should address topics of broader interests with greater impact to the geospatial community, and accommodate the interests of readers with a diverse level of geospatial knowledge.
For more information, contact Rae Kelley, [email protected] or visit http://www.asprs.org/PE-RS-Submissions-Policy-and-Guidelines/PE-RS-Instructions-for-Authors-of-Highlight-Articles.html for information about the submission process.


![L-Band InSAR Penetration Depth Experiment, North Slope … · strial Reference Frame with vertical accuracy and precision ... 5 m vertical accuracy [10]. The ALOS PALSAR operated](https://img.pdfslide.us/doc/110x75/5b34fbd47f8b9a3a6d8ca720/l-band-insar-penetration-depth-experiment-north-slope-strial-reference-frame.jpg)