Embed Size (px)
Citation preview
The accompanying notes are an integral part of these financial statements.
Frontiers Emerging Markets Equity Pool
Annual Financial Statementsfor the financial year ended August 31, 2015
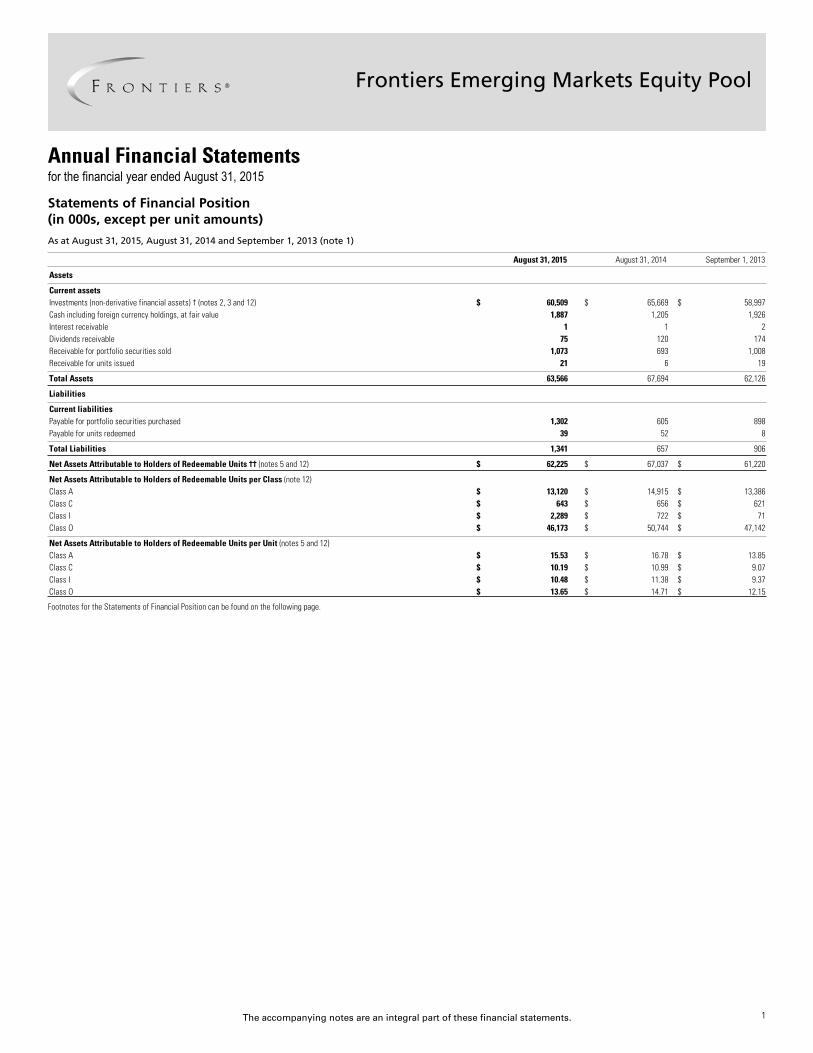
Statements of Financial Position(in 000s, except per unit amounts)
As at August 31, 2015, August 31, 2014 and September 1, 2013 (note 1)
August 31, 2015 August 31, 2014 September 1, 2013x
x
Assetsxxx
Current assetsx
Investments (non-derivative financial assets) † (notes 2, 3 and 12) $ 60,509 $ 65,669 $ 58,997x
Cash including foreign currency holdings, at fair value 1,887 1,205 1,926x
Interest receivable 1 1 2x
Dividends receivable 75 120 174x
Receivable for portfolio securities sold 1,073 693 1,008x
Receivable for units issued 21 6 19xxx
Total Assets 63,566 67,694 62,126xxx
Liabilitiesxxx
Current liabilitiesx
Payable for portfolio securities purchased 1,302 605 898x
Payable for units redeemed 39 52 8xxx
Total Liabilities 1,341 657 906xxx
Net Assets Attributable to Holders of Redeemable Units †† (notes 5 and 12) $ 62,225 $ 67,037 $ 61,220xxx
Net Assets Attributable to Holders of Redeemable Units per Class (note 12)x
Class A $ 13,120 $ 14,915 $ 13,386x
Class C $ 643 $ 656 $ 621x
Class I $ 2,289 $ 722 $ 71x
Class O $ 46,173 $ 50,744 $ 47,142xxx
Net Assets Attributable to Holders of Redeemable Units per Unit (notes 5 and 12)x
Class A $ 15.53 $ 16.78 $ 13.85x
Class C $ 10.19 $ 10.99 $ 9.07x
Class I $ 10.48 $ 11.38 $ 9.37x
Class O $ 13.65 $ 14.71 $ 12.15xx
Footnotes for the Statements of Financial Position can be found on the following page.
1
The accompanying notes are an integral part of these financial statements.
Frontiers Emerging Markets Equity Pool
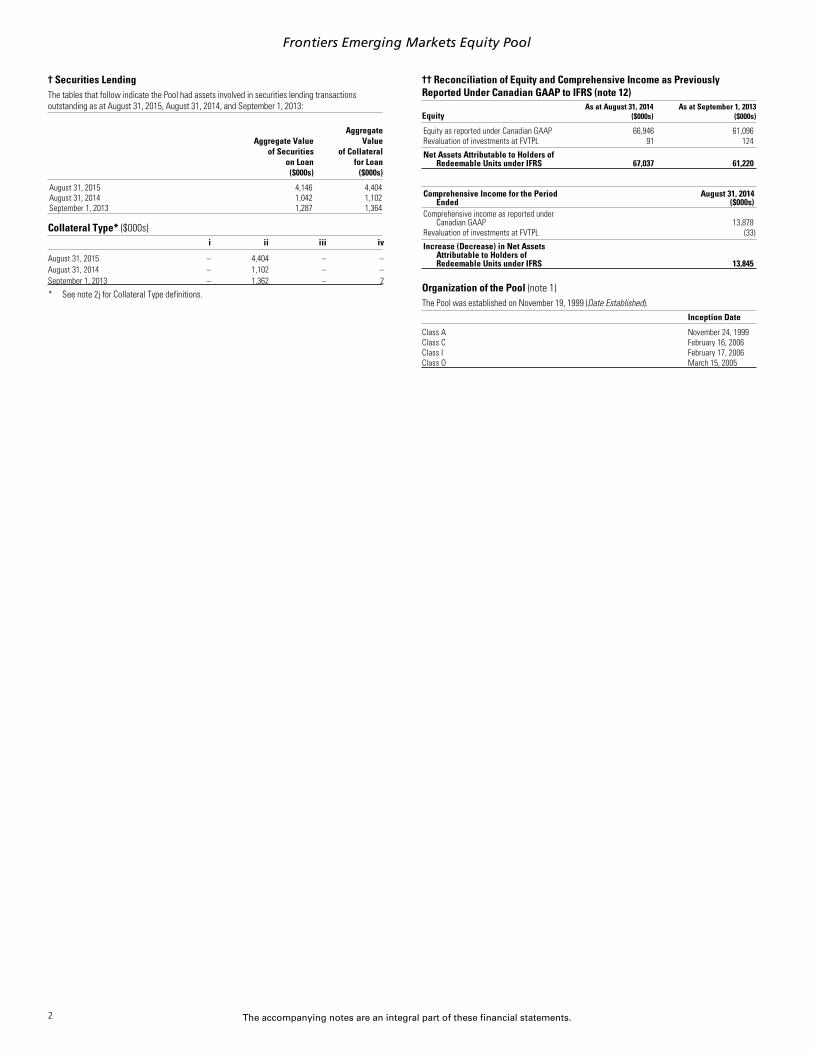
† Securities LendingThe tables that follow indicate the Pool had assets involved in securities lending transactionsoutstanding as at August 31, 2015, August 31, 2014, and September 1, 2013:
Aggregate Valueof Securities
on Loan($000s)
AggregateValue
of Collateralfor Loan
($000s)x
x
August 31, 2015 4,146 4,404x
August 31, 2014 1,042 1,102x
September 1, 2013 1,287 1,364x
Collateral Type* ($000s)i ii iii iv
xx
August 31, 2015 – 4,404 – –x
August 31, 2014 – 1,102 – –x
September 1, 2013 – 1,362 – 2x
x
* See note 2j for Collateral Type definitions.
†† Reconciliation of Equity and Comprehensive Income as PreviouslyReported Under Canadian GAAP to IFRS (note 12)
EquityAs at August 31, 2014
($000s)As at September 1, 2013
($000s)x
x
Equity as reported under Canadian GAAP 66,946 61,096x
Revaluation of investments at FVTPL 91 124xxx
Net Assets Attributable to Holders ofRedeemable Units under IFRS 67,037 61,220
xxx
x
Comprehensive Income for the PeriodEnded
August 31, 2014($000s)
x
Comprehensive income as reported underCanadian GAAP 13,878
x
Revaluation of investments at FVTPL (33)xxx
Increase (Decrease) in Net AssetsAttributable to Holders ofRedeemable Units under IFRS 13,845
xx
Organization of the Pool (note 1)The Pool was established on November 19, 1999 (Date Established).
Inception Datexx
Class A November 24, 1999x
Class C February 16, 2006x
Class I February 17, 2006x
Class O March 15, 2005xx
2
The accompanying notes are an integral part of these financial statements.
Frontiers Emerging Markets Equity Pool
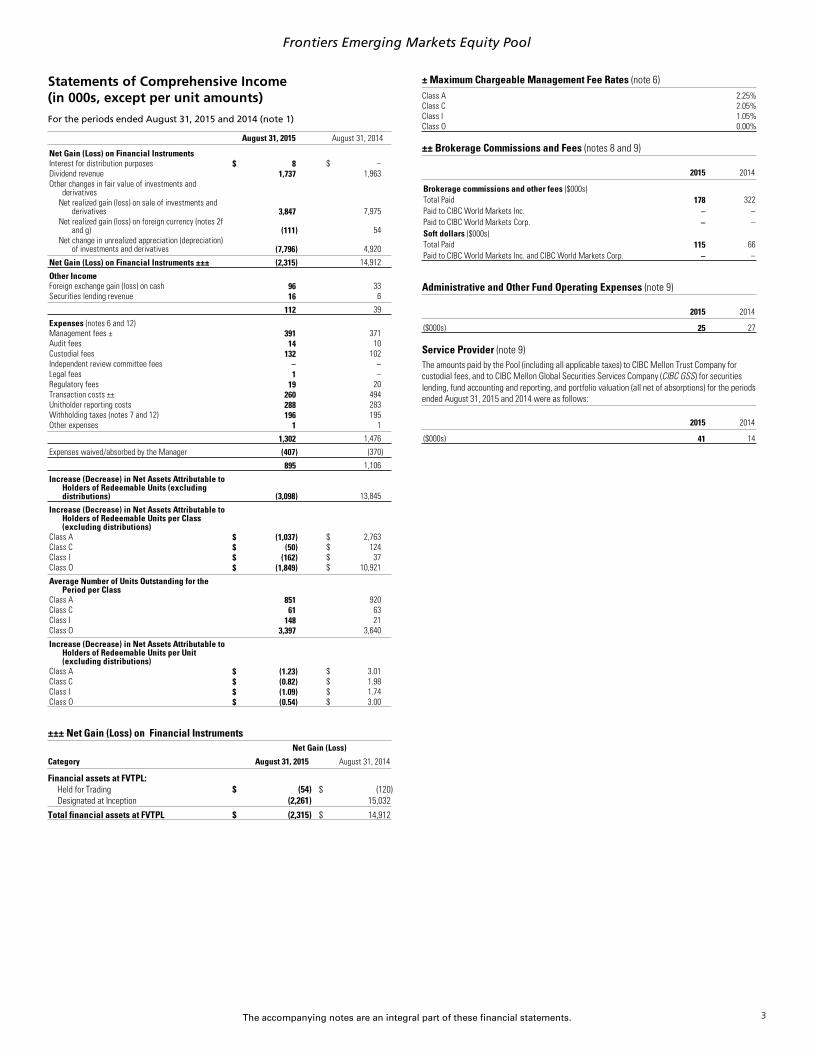
Statements of Comprehensive Income(in 000s, except per unit amounts)
For the periods ended August 31, 2015 and 2014 (note 1)
August 31, 2015 August 31, 2014x
x
Net Gain (Loss) on Financial Instrumentsx
Interest for distribution purposes $ 8 $ –x
Dividend revenue 1,737 1,963x
Other changes in fair value of investments andderivatives
x
Net realized gain (loss) on sale of investments andderivatives 3,847 7,975
x
Net realized gain (loss) on foreign currency (notes 2fand g) (111) 54
x
Net change in unrealized appreciation (depreciation)of investments and derivatives (7,796) 4,920
xxx
Net Gain (Loss) on Financial Instruments ±±± (2,315) 14,912xx
x
Other Incomex
Foreign exchange gain (loss) on cash 96 33x
Securities lending revenue 16 6xxx
112 39xx
x
Expenses (notes 6 and 12)x
Management fees ± 391 371x
Audit fees 14 10x
Custodial fees 132 102x
Independent review committee fees – –x
Legal fees 1 –x
Regulatory fees 19 20x
Transaction costs ±± 260 494x
Unitholder reporting costs 288 283x
Withholding taxes (notes 7 and 12) 196 195x
Other expenses 1 1xxx
1,302 1,476xx
x
Expenses waived/absorbed by the Manager (407) (370)xx
x
895 1,106xx
x
Increase (Decrease) in Net Assets Attributable toHolders of Redeemable Units (excludingdistributions) (3,098) 13,845
xx
x
Increase (Decrease) in Net Assets Attributable toHolders of Redeemable Units per Class(excluding distributions)
x
Class A $ (1,037) $ 2,763x
Class C $ (50) $ 124x
Class I $ (162) $ 37x
Class O $ (1,849) $ 10,921xxx
Average Number of Units Outstanding for thePeriod per Class
x
Class A 851 920x
Class C 61 63x
Class I 148 21x
Class O 3,397 3,640xxx
Increase (Decrease) in Net Assets Attributable toHolders of Redeemable Units per Unit(excluding distributions)
x
Class A $ (1.23) $ 3.01x
Class C $ (0.82) $ 1.98x
Class I $ (1.09) $ 1.74x
Class O $ (0.54) $ 3.00x
x
±±± Net Gain (Loss) on Financial InstrumentsNet Gain (Loss)
Category August 31, 2015 August 31, 2014x..
Financial assets at FVTPL:..
Held for Trading $ (54) $ (120)..
Designated at Inception (2,261) 15,032......
Total financial assets at FVTPL $ (2,315) $ 14,912..
± Maximum Chargeable Management Fee Rates (note 6)xx
Class A 2.25%x
Class C 2.05%x
Class I 1.05%x
Class O 0.00%xx
±± Brokerage Commissions and Fees (notes 8 and 9)
2015 2014x
x
Brokerage commissions and other fees ($000s)x
Total Paid 178 322x
Paid to CIBC World Markets Inc. – –x
Paid to CIBC World Markets Corp. – –x
Soft dollars ($000s)x
Total Paid 115 66x
Paid to CIBC World Markets Inc. and CIBC World Markets Corp. – –xx
Administrative and Other Fund Operating Expenses (note 9)
2015 2014x
x
($000s) 25 27xx
Service Provider (note 9)The amounts paid by the Pool (including all applicable taxes) to CIBC Mellon Trust Company forcustodial fees, and to CIBC Mellon Global Securities Services Company (CIBC GSS) for securitieslending, fund accounting and reporting, and portfolio valuation (all net of absorptions) for the periodsended August 31, 2015 and 2014 were as follows:
2015 2014x
x
($000s) 41 14xx
3
The accompanying notes are an integral part of these financial statements.
Frontiers Emerging Markets Equity Poolx
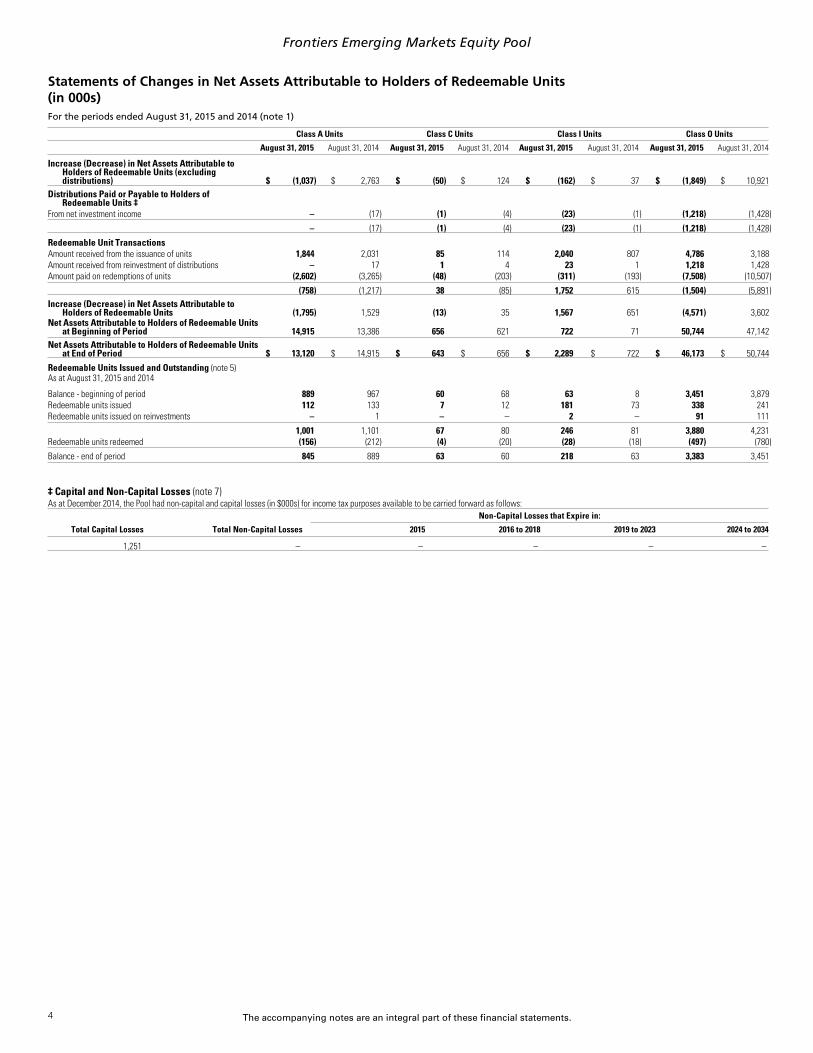
Statements of Changes in Net Assets Attributable to Holders of Redeemable Units(in 000s)For the periods ended August 31, 2015 and 2014 (note 1)
Class A Units Class C Units Class I Units Class O Units
August 31, 2015 August 31, 2014 August 31, 2015 August 31, 2014 August 31, 2015 August 31, 2014 August 31, 2015 August 31, 2014xx.
Increase (Decrease) in Net Assets Attributable toHolders of Redeemable Units (excludingdistributions) $ (1,037) $ 2,763 $ (50) $ 124 $ (162) $ 37 $ (1,849) $ 10,921
xxx.
Distributions Paid or Payable to Holders ofRedeemable Units ‡
x.
From net investment income – (17) (1) (4) (23) (1) (1,218) (1,428)x.xx
– (17) (1) (4) (23) (1) (1,218) (1,428)xxx.
Redeemable Unit Transactionsx.
Amount received from the issuance of units 1,844 2,031 85 114 2,040 807 4,786 3,188x.
Amount received from reinvestment of distributions – 17 1 4 23 1 1,218 1,428x.
Amount paid on redemptions of units (2,602) (3,265) (48) (203) (311) (193) (7,508) (10,507)x.xx
(758) (1,217) 38 (85) 1,752 615 (1,504) (5,891)xxx.
Increase (Decrease) in Net Assets Attributable toHolders of Redeemable Units (1,795) 1,529 (13) 35 1,567 651 (4,571) 3,602
x.
Net Assets Attributable to Holders of Redeemable Unitsat Beginning of Period 14,915 13,386 656 621 722 71 50,744 47,142
x.xx
Net Assets Attributable to Holders of Redeemable Unitsat End of Period $ 13,120 $ 14,915 $ 643 $ 656 $ 2,289 $ 722 $ 46,173 $ 50,744
xxx.
Redeemable Units Issued and Outstanding (note 5)x.
As at August 31, 2015 and 2014x.
Balance - beginning of period 889 967 60 68 63 8 3,451 3,879x.
Redeemable units issued 112 133 7 12 181 73 338 241x.
Redeemable units issued on reinvestments – 1 – – 2 – 91 111x.xx
1,001 1,101 67 80 246 81 3,880 4,231x.
Redeemable units redeemed (156) (212) (4) (20) (28) (18) (497) (780)x.xx
Balance - end of period 845 889 63 60 218 63 3,383 3,451x
x
‡ Capital and Non-Capital Losses (note 7)As at December 2014, the Pool had non-capital and capital losses (in $000s) for income tax purposes available to be carried forward as follows:
Non-Capital Losses that Expire in:
Total Capital Losses Total Non-Capital Losses 2015 2016 to 2018 2019 to 2023 2024 to 2034x..
1,251 – – – – –..
4
The accompanying notes are an integral part of these financial statements.
Frontiers Emerging Markets Equity Poolx
x
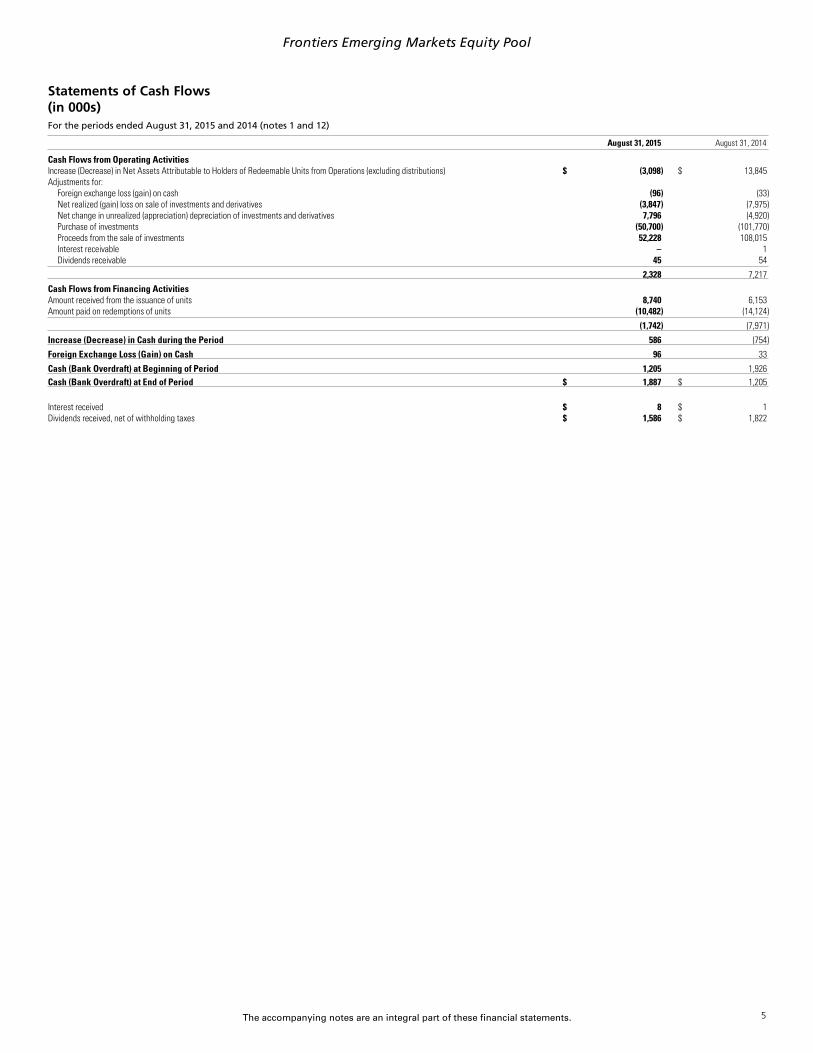
Statements of Cash Flows(in 000s)For the periods ended August 31, 2015 and 2014 (notes 1 and 12)
August 31, 2015 August 31, 2014xx.
Cash Flows from Operating Activitiesx.
Increase (Decrease) in Net Assets Attributable to Holders of Redeemable Units from Operations (excluding distributions) $ (3,098) $ 13,845x.
Adjustments for:x.
Foreign exchange loss (gain) on cash (96) (33)x.
Net realized (gain) loss on sale of investments and derivatives (3,847) (7,975)x.
Net change in unrealized (appreciation) depreciation of investments and derivatives 7,796 (4,920)x.
Purchase of investments (50,700) (101,770)x.
Proceeds from the sale of investments 52,228 108,015x.
Interest receivable – 1x.
Dividends receivable 45 54x.xx
2,328 7,217xxx.
Cash Flows from Financing Activitiesx.
Amount received from the issuance of units 8,740 6,153x.
Amount paid on redemptions of units (10,482) (14,124)x.xx
(1,742) (7,971)xxx.
Increase (Decrease) in Cash during the Period 586 (754)xxx.
Foreign Exchange Loss (Gain) on Cash 96 33xxx.
Cash (Bank Overdraft) at Beginning of Period 1,205 1,926xxx.
Cash (Bank Overdraft) at End of Period $ 1,887 $ 1,205x
x.
Interest received $ 8 $ 1x.
Dividends received, net of withholding taxes $ 1,586 $ 1,822
5
The accompanying notes are an integral part of these financial statements.
Frontiers Emerging Markets Equity Pool
x
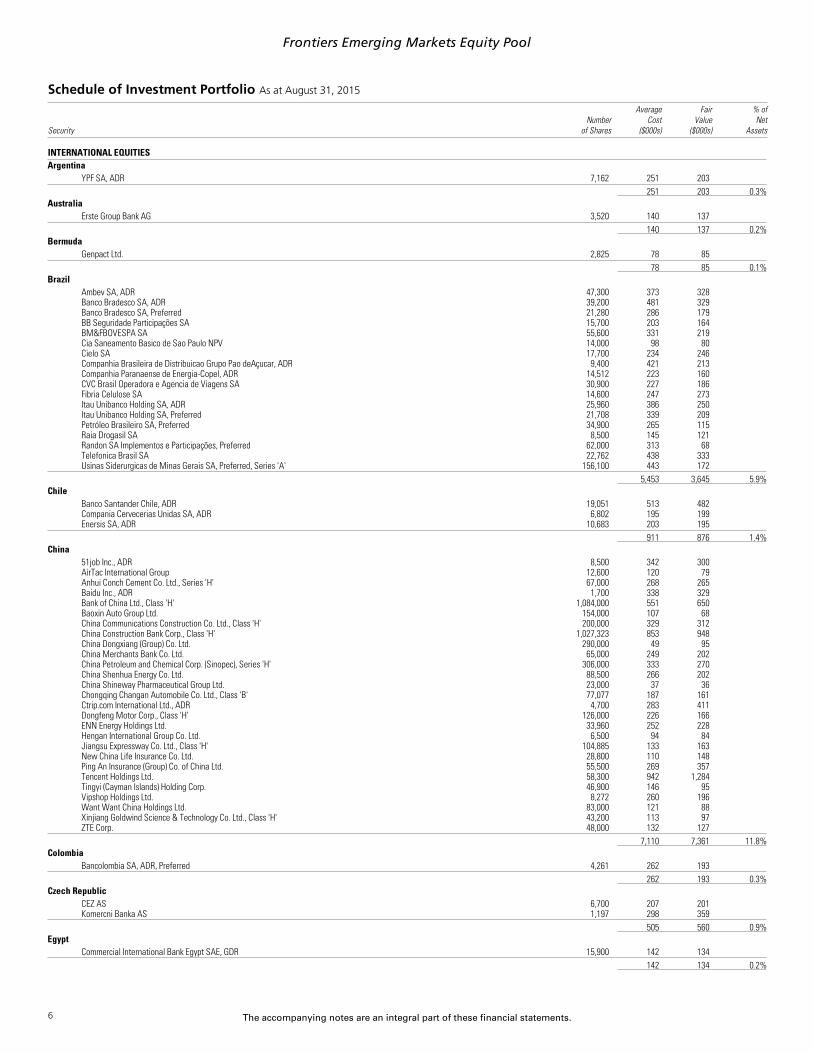
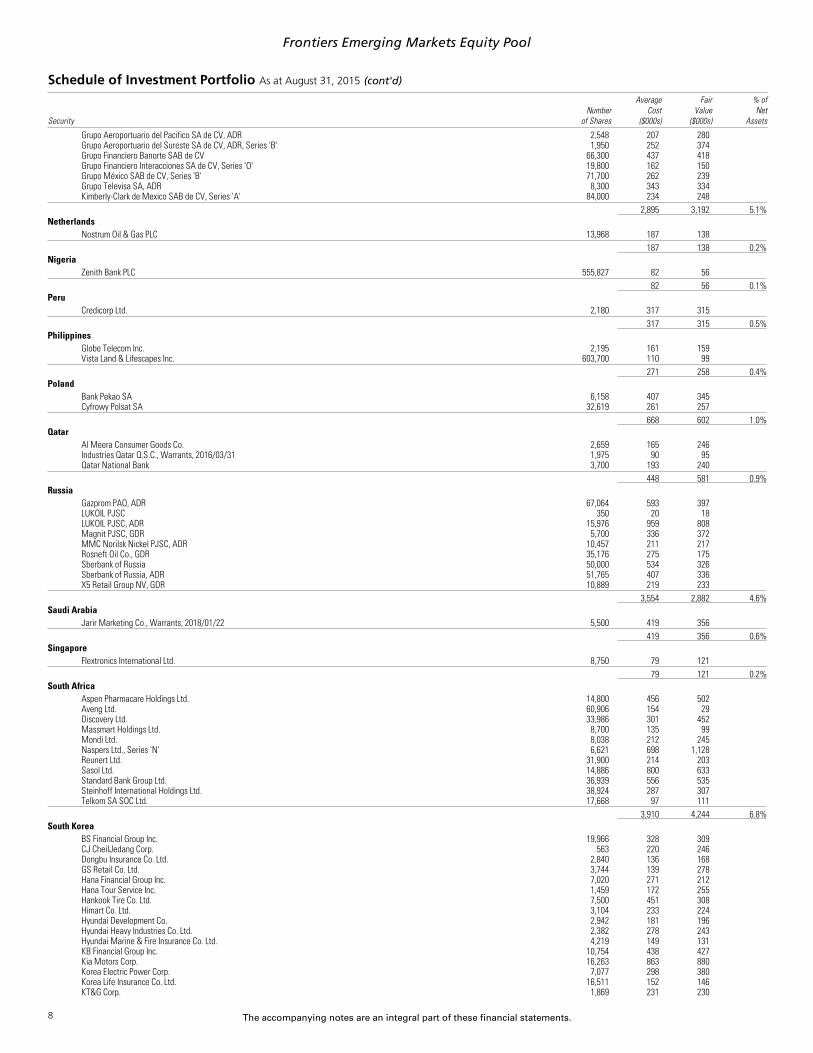
Schedule of Investment Portfolio As at August 31, 2015
SecurityNumber
of Shares
AverageCost
($000s)
FairValue
($000s)
% ofNet
Assets
INTERNATIONAL EQUITIESx
Argentina..
YPF SA, ADR 7,162 251 203..
....
251 203 0.3%..x
Australia..
Erste Group Bank AG 3,520 140 137..
....
140 137 0.2%..x
Bermuda..
Genpact Ltd. 2,825 78 85..
....
78 85 0.1%..x
Brazil..
Ambev SA, ADR 47,300 373 328..
Banco Bradesco SA, ADR 39,200 481 329..
Banco Bradesco SA, Preferred 21,280 286 179..
BB Seguridade Participações SA 15,700 203 164..
BM&FBOVESPA SA 55,600 331 219..
Cia Saneamento Basico de Sao Paulo NPV 14,000 98 80..
Cielo SA 17,700 234 246..
Companhia Brasileira de Distribuicao Grupo Pao deAçucar, ADR 9,400 421 213..
Companhia Paranaense de Energia-Copel, ADR 14,512 223 160..
CVC Brasil Operadora e Agencia de Viagens SA 30,900 227 186..
Fibria Celulose SA 14,600 247 273..
Itau Unibanco Holding SA, ADR 25,960 386 250..
Itau Unibanco Holding SA, Preferred 21,708 339 209..
Petróleo Brasileiro SA, Preferred 34,900 265 115..
Raia Drogasil SA 8,500 145 121..
Randon SA Implementos e Participações, Preferred 62,000 313 68..
Telefonica Brasil SA 22,762 438 333..
Usinas Siderurgicas de Minas Gerais SA, Preferred, Series 'A' 156,100 443 172..
....
5,453 3,645 5.9%..x
Chile..
Banco Santander Chile, ADR 19,051 513 482..
Compania Cervecerias Unidas SA, ADR 6,802 195 199..
Enersis SA, ADR 10,683 203 195..
....
911 876 1.4%..x
China..
51job Inc., ADR 8,500 342 300..
AirTac International Group 12,600 120 79..
Anhui Conch Cement Co. Ltd., Series 'H' 67,000 268 265..
Baidu Inc., ADR 1,700 338 329..
Bank of China Ltd., Class 'H' 1,084,000 551 650..
Baoxin Auto Group Ltd. 154,000 107 68..
China Communications Construction Co. Ltd., Class 'H' 200,000 329 312..
China Construction Bank Corp., Class 'H' 1,027,323 853 948..
China Dongxiang (Group) Co. Ltd. 290,000 49 95..
China Merchants Bank Co. Ltd. 65,000 249 202..
China Petroleum and Chemical Corp. (Sinopec), Series 'H' 306,000 333 270..
China Shenhua Energy Co. Ltd. 88,500 266 202..
China Shineway Pharmaceutical Group Ltd. 23,000 37 36..
Chongqing Changan Automobile Co. Ltd., Class 'B' 77,077 187 161..
Ctrip.com International Ltd., ADR 4,700 283 411..
Dongfeng Motor Corp., Class 'H' 126,000 226 166..
ENN Energy Holdings Ltd. 33,960 252 228..
Hengan International Group Co. Ltd. 6,500 94 84..
Jiangsu Expressway Co. Ltd., Class 'H' 104,885 133 163..
New China Life Insurance Co. Ltd. 28,800 110 148..
Ping An Insurance (Group) Co. of China Ltd. 55,500 269 357..
Tencent Holdings Ltd. 58,300 942 1,284..
Tingyi (Cayman Islands) Holding Corp. 46,900 146 95..
Vipshop Holdings Ltd. 8,272 260 196..
Want Want China Holdings Ltd. 83,000 121 88..
Xinjiang Goldwind Science & Technology Co. Ltd., Class 'H' 43,200 113 97..
ZTE Corp. 48,000 132 127..
....
7,110 7,361 11.8%..x
Colombia..
Bancolombia SA, ADR, Preferred 4,261 262 193..
....
262 193 0.3%..x
Czech Republic..
CEZ AS 6,700 207 201..
Komercni Banka AS 1,197 298 359..
....
505 560 0.9%..x
Egypt..
Commercial International Bank Egypt SAE, GDR 15,900 142 134..
....
142 134 0.2%..
6
The accompanying notes are an integral part of these financial statements.
Frontiers Emerging Markets Equity Pool
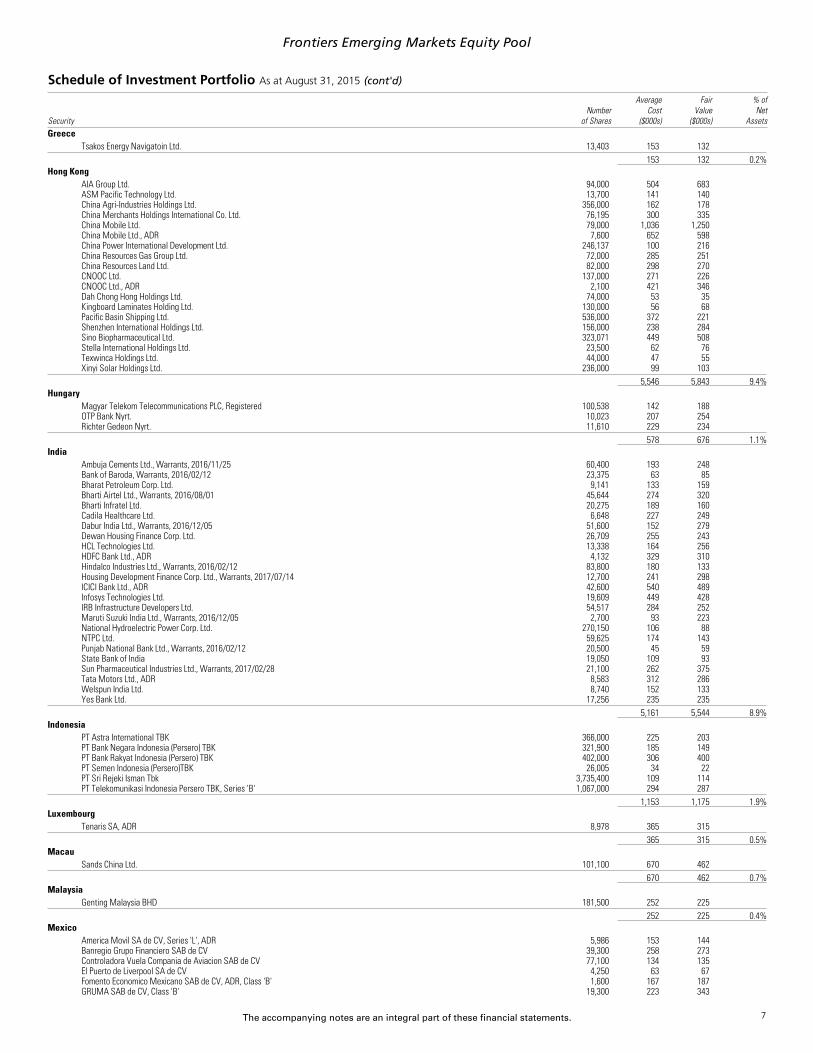
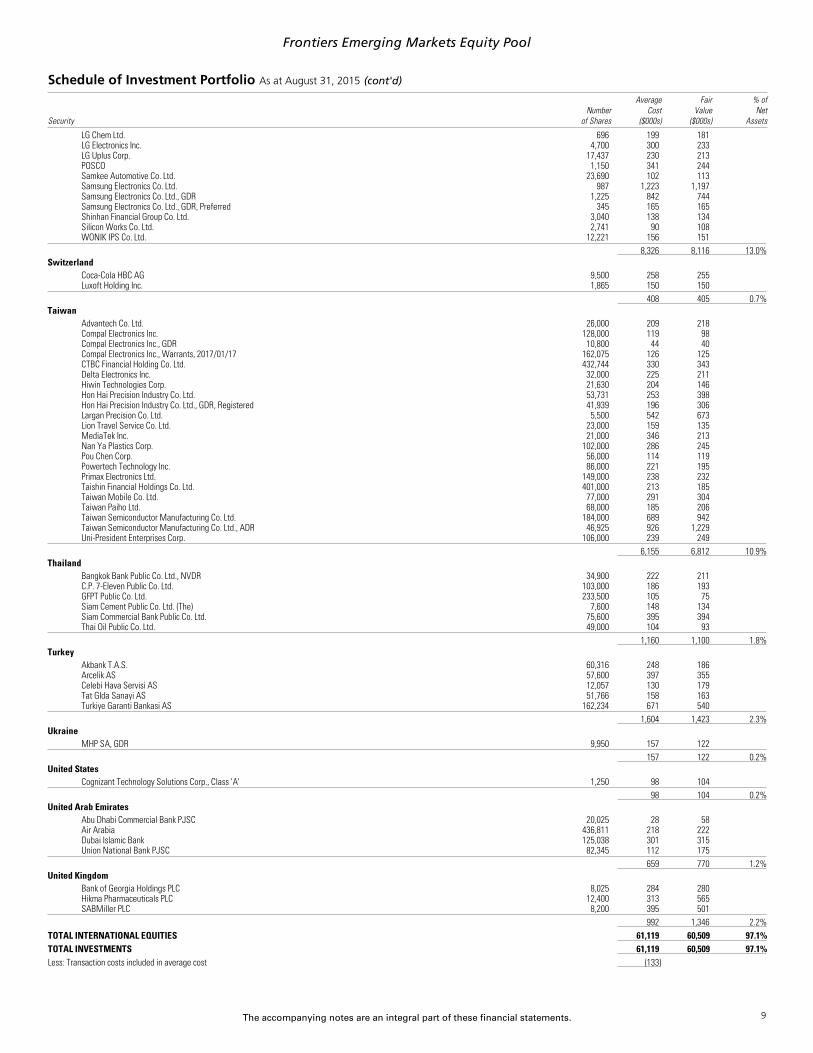
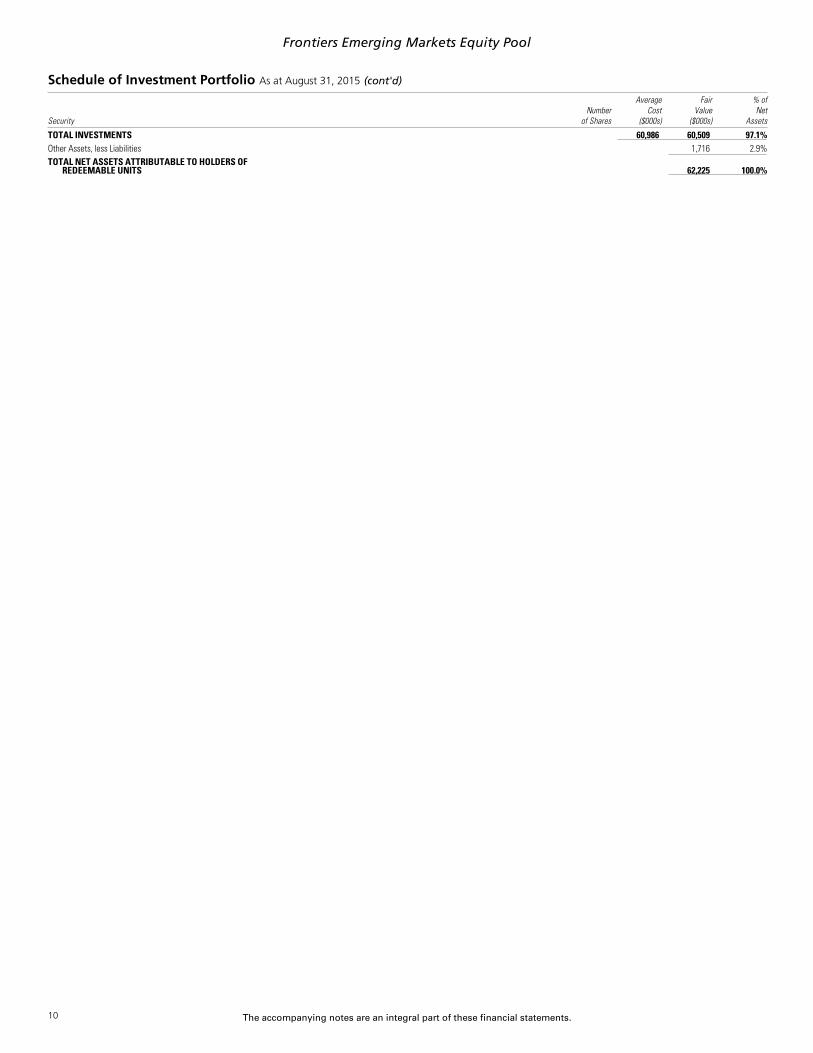
Schedule of Investment Portfolio As at August 31, 2015 (cont'd)
SecurityNumber
of Shares
AverageCost
($000s)
FairValue
($000s)
% ofNet
Assetsx
Greece..
Tsakos Energy Navigatoin Ltd. 13,403 153 132..
....
153 132 0.2%..x
Hong Kong..
AIA Group Ltd. 94,000 504 683..
ASM Pacific Technology Ltd. 13,700 141 140..
China Agri-Industries Holdings Ltd. 356,000 162 178..
China Merchants Holdings International Co. Ltd. 76,195 300 335..
China Mobile Ltd. 79,000 1,036 1,250..
China Mobile Ltd., ADR 7,600 652 598..
China Power International Development Ltd. 246,137 100 216..
China Resources Gas Group Ltd. 72,000 285 251..
China Resources Land Ltd. 82,000 298 270..
CNOOC Ltd. 137,000 271 226..
CNOOC Ltd., ADR 2,100 421 346..
Dah Chong Hong Holdings Ltd. 74,000 53 35..
Kingboard Laminates Holding Ltd. 130,000 56 68..
Pacific Basin Shipping Ltd. 536,000 372 221..
Shenzhen International Holdings Ltd. 156,000 238 284..
Sino Biopharmaceutical Ltd. 323,071 449 508..
Stella International Holdings Ltd. 23,500 62 76..
Texwinca Holdings Ltd. 44,000 47 55..
Xinyi Solar Holdings Ltd. 236,000 99 103..
....
5,546 5,843 9.4%..x
Hungary..
Magyar Telekom Telecommunications PLC, Registered 100,538 142 188..
OTP Bank Nyrt. 10,023 207 254..
Richter Gedeon Nyrt. 11,610 229 234..
....
578 676 1.1%..x
India..
Ambuja Cements Ltd., Warrants, 2016/11/25 60,400 193 248..
Bank of Baroda, Warrants, 2016/02/12 23,375 63 85..
Bharat Petroleum Corp. Ltd. 9,141 133 159..
Bharti Airtel Ltd., Warrants, 2016/08/01 45,644 274 320..
Bharti Infratel Ltd. 20,275 189 160..
Cadila Healthcare Ltd. 6,648 227 249..
Dabur India Ltd., Warrants, 2016/12/05 51,600 152 279..
Dewan Housing Finance Corp. Ltd. 26,709 255 243..
HCL Technologies Ltd. 13,338 164 256..
HDFC Bank Ltd., ADR 4,132 329 310..
Hindalco Industries Ltd., Warrants, 2016/02/12 83,800 180 133..
Housing Development Finance Corp. Ltd., Warrants, 2017/07/14 12,700 241 298..
ICICI Bank Ltd., ADR 42,600 540 489..
Infosys Technologies Ltd. 19,609 449 428..
IRB Infrastructure Developers Ltd. 54,517 284 252..
Maruti Suzuki India Ltd., Warrants, 2016/12/05 2,700 93 223..
National Hydroelectric Power Corp. Ltd. 270,150 106 88..
NTPC Ltd. 59,625 174 143..
Punjab National Bank Ltd., Warrants, 2016/02/12 20,500 45 59..
State Bank of India 19,050 109 93..
Sun Pharmaceutical Industries Ltd., Warrants, 2017/02/28 21,100 262 375..
Tata Motors Ltd., ADR 8,583 312 286..
Welspun India Ltd. 8,740 152 133..
Yes Bank Ltd. 17,256 235 235..
....
5,161 5,544 8.9%..x
Indonesia..
PT Astra International TBK 366,000 225 203..
PT Bank Negara Indonesia (Persero) TBK 321,900 185 149..
PT Bank Rakyat Indonesia (Persero) TBK 402,000 306 400..
PT Semen Indonesia (Persero)TBK 26,005 34 22..
PT Sri Rejeki Isman Tbk 3,735,400 109 114..
PT Telekomunikasi Indonesia Persero TBK, Series 'B' 1,067,000 294 287..
....
1,153 1,175 1.9%..x
Luxembourg..
Tenaris SA, ADR 8,978 365 315..
....
365 315 0.5%..x
Macau..
Sands China Ltd. 101,100 670 462..
....
670 462 0.7%..x
Malaysia..
Genting Malaysia BHD 181,500 252 225..
....
252 225 0.4%..x
Mexico..
America Movil SA de CV, Series 'L', ADR 5,986 153 144..
Banregio Grupo Financiero SAB de CV 39,300 258 273..
Controladora Vuela Compania de Aviacion SAB de CV 77,100 134 135..
El Puerto de Liverpool SA de CV 4,250 63 67..
Fomento Economico Mexicano SAB de CV, ADR, Class 'B' 1,600 167 187..
GRUMA SAB de CV, Class 'B' 19,300 223 343
7
The accompanying notes are an integral part of these financial statements.
Frontiers Emerging Markets Equity Pool
Schedule of Investment Portfolio As at August 31, 2015 (cont'd)
SecurityNumber
of Shares
AverageCost
($000s)
FairValue
($000s)
% ofNet
Assets..
Grupo Aeroportuario del Pacifico SA de CV, ADR 2,548 207 280..
Grupo Aeroportuario del Sureste SA de CV, ADR, Series 'B' 1,950 252 374..
Grupo Financiero Banorte SAB de CV 66,300 437 418..
Grupo Financiero Interacciones SA de CV, Series 'O' 19,800 162 150..
Grupo México SAB de CV, Series 'B' 71,700 262 239..
Grupo Televisa SA, ADR 8,300 343 334..
Kimberly-Clark de Mexico SAB de CV, Series 'A' 84,000 234 248..
....
2,895 3,192 5.1%..x
Netherlands..
Nostrum Oil & Gas PLC 13,968 187 138..
....
187 138 0.2%..x
Nigeria..
Zenith Bank PLC 555,827 82 56..
....
82 56 0.1%..x
Peru..
Credicorp Ltd. 2,180 317 315..
....
317 315 0.5%..x
Philippines..
Globe Telecom Inc. 2,195 161 159..
Vista Land & Lifescapes Inc. 603,700 110 99..
....
271 258 0.4%..x
Poland..
Bank Pekao SA 6,158 407 345..
Cyfrowy Polsat SA 32,619 261 257..
....
668 602 1.0%..x
Qatar..
Al Meera Consumer Goods Co. 2,659 165 246..
Industries Qatar Q.S.C., Warrants, 2016/03/31 1,975 90 95..
Qatar National Bank 3,700 193 240..
....
448 581 0.9%..x
Russia..
Gazprom PAO, ADR 67,064 593 397..
LUKOIL PJSC 350 20 18..
LUKOIL PJSC, ADR 15,976 959 808..
Magnit PJSC, GDR 5,700 336 372..
MMC Norilsk Nickel PJSC, ADR 10,457 211 217..
Rosneft Oil Co., GDR 35,176 275 175..
Sberbank of Russia 50,000 534 326..
Sberbank of Russia, ADR 51,765 407 336..
X5 Retail Group NV, GDR 10,889 219 233..
....
3,554 2,882 4.6%..x
Saudi Arabia..
Jarir Marketing Co., Warrants, 2018/01/22 5,500 419 356..
....
419 356 0.6%..x
Singapore..
Flextronics International Ltd. 8,750 79 121..
....
79 121 0.2%..x
South Africa..
Aspen Pharmacare Holdings Ltd. 14,800 456 502..
Aveng Ltd. 60,906 154 29..
Discovery Ltd. 33,986 301 452..
Massmart Holdings Ltd. 8,700 135 99..
Mondi Ltd. 8,038 212 245..
Naspers Ltd., Series 'N' 6,621 698 1,128..
Reunert Ltd. 31,900 214 203..
Sasol Ltd. 14,886 800 633..
Standard Bank Group Ltd. 36,939 556 535..
Steinhoff International Holdings Ltd. 38,924 287 307..
Telkom SA SOC Ltd. 17,668 97 111..
....
3,910 4,244 6.8%..x
South Korea..
BS Financial Group Inc. 19,966 328 309..
CJ CheilJedang Corp. 563 220 246..
Dongbu Insurance Co. Ltd. 2,840 136 168..
GS Retail Co. Ltd. 3,744 139 278..
Hana Financial Group Inc. 7,020 271 212..
Hana Tour Service Inc. 1,459 172 255..
Hankook Tire Co. Ltd. 7,500 451 308..
Himart Co. Ltd. 3,104 233 224..
Hyundai Development Co. 2,942 181 196..
Hyundai Heavy Industries Co. Ltd. 2,382 278 243..
Hyundai Marine & Fire Insurance Co. Ltd. 4,219 149 131..
KB Financial Group Inc. 10,754 438 427..
Kia Motors Corp. 16,263 863 880..
Korea Electric Power Corp. 7,077 298 380..
Korea Life Insurance Co. Ltd. 16,511 152 146..
KT&G Corp. 1,869 231 230
8
The accompanying notes are an integral part of these financial statements.
Frontiers Emerging Markets Equity Pool
Schedule of Investment Portfolio As at August 31, 2015 (cont'd)
SecurityNumber
of Shares
AverageCost
($000s)
FairValue
($000s)
% ofNet
Assets..
LG Chem Ltd. 696 199 181..
LG Electronics Inc. 4,700 300 233..
LG Uplus Corp. 17,437 230 213..
POSCO 1,150 341 244..
Samkee Automotive Co. Ltd. 23,690 102 113..
Samsung Electronics Co. Ltd. 987 1,223 1,197..
Samsung Electronics Co. Ltd., GDR 1,225 842 744..
Samsung Electronics Co. Ltd., GDR, Preferred 345 165 165..
Shinhan Financial Group Co. Ltd. 3,040 138 134..
Silicon Works Co. Ltd. 2,741 90 108..
WONIK IPS Co. Ltd. 12,221 156 151..
....
8,326 8,116 13.0%..x
Switzerland..
Coca-Cola HBC AG 9,500 258 255..
Luxoft Holding Inc. 1,865 150 150..
....
408 405 0.7%..x
Taiwan..
Advantech Co. Ltd. 26,000 209 218..
Compal Electronics Inc. 128,000 119 98..
Compal Electronics Inc., GDR 10,800 44 40..
Compal Electronics Inc., Warrants, 2017/01/17 162,075 126 125..
CTBC Financial Holding Co. Ltd. 432,744 330 343..
Delta Electronics Inc. 32,000 225 211..
Hiwin Technologies Corp. 21,630 204 146..
Hon Hai Precision Industry Co. Ltd. 53,731 253 398..
Hon Hai Precision Industry Co. Ltd., GDR, Registered 41,939 196 306..
Largan Precision Co. Ltd. 5,500 542 673..
Lion Travel Service Co. Ltd. 23,000 159 135..
MediaTek Inc. 21,000 346 213..
Nan Ya Plastics Corp. 102,000 286 245..
Pou Chen Corp. 56,000 114 119..
Powertech Technology Inc. 86,000 221 195..
Primax Electronics Ltd. 149,000 238 232..
Taishin Financial Holdings Co. Ltd. 401,000 213 185..
Taiwan Mobile Co. Ltd. 77,000 291 304..
Taiwan Paiho Ltd. 68,000 185 206..
Taiwan Semiconductor Manufacturing Co. Ltd. 184,000 689 942..
Taiwan Semiconductor Manufacturing Co. Ltd., ADR 46,925 926 1,229..
Uni-President Enterprises Corp. 106,000 239 249..
....
6,155 6,812 10.9%..x
Thailand..
Bangkok Bank Public Co. Ltd., NVDR 34,900 222 211..
C.P. 7-Eleven Public Co. Ltd. 103,000 186 193..
GFPT Public Co. Ltd. 233,500 105 75..
Siam Cement Public Co. Ltd. (The) 7,600 148 134..
Siam Commercial Bank Public Co. Ltd. 75,600 395 394..
Thai Oil Public Co. Ltd. 49,000 104 93..
....
1,160 1,100 1.8%..x
Turkey..
Akbank T.A.S. 60,316 248 186..
Arcelik AS 57,600 397 355..
Celebi Hava Servisi AS 12,057 130 179..
Tat GIda Sanayi AS 51,766 158 163..
Turkiye Garanti Bankasi AS 162,234 671 540..
....
1,604 1,423 2.3%..x
Ukraine..
MHP SA, GDR 9,950 157 122..
....
157 122 0.2%..x
United States..
Cognizant Technology Solutions Corp., Class 'A' 1,250 98 104..
....
98 104 0.2%..x
United Arab Emirates..
Abu Dhabi Commercial Bank PJSC 20,025 28 58..
Air Arabia 436,811 218 222..
Dubai Islamic Bank 125,038 301 315..
Union National Bank PJSC 82,345 112 175..
....
659 770 1.2%..x
United Kingdom..
Bank of Georgia Holdings PLC 8,025 284 280..
Hikma Pharmaceuticals PLC 12,400 313 565..
SABMiller PLC 8,200 395 501..
....
992 1,346 2.2%..
..
TOTAL INTERNATIONAL EQUITIES 61,119 60,509 97.1%..
..
TOTAL INVESTMENTS 61,119 60,509 97.1%..
..
Less: Transaction costs included in average cost (133).
..
9
The accompanying notes are an integral part of these financial statements.
Frontiers Emerging Markets Equity Pool
Schedule of Investment Portfolio As at August 31, 2015 (cont'd)
SecurityNumber
of Shares
AverageCost
($000s)
FairValue
($000s)
% ofNet
Assets..
TOTAL INVESTMENTS 60,986 60,509 97.1%..
..
Other Assets, less Liabilities 1,716 2.9%..
....
TOTAL NET ASSETS ATTRIBUTABLE TO HOLDERS OFREDEEMABLE UNITS 62,225 100.0%
.
.
x
10

The accompanying notes are an integral part of these financial statements.
Frontiers Emerging Markets Equity Pool
Supplemental Schedule to Schedule of Investment Portfolio
Offsetting Arrangements (note 2d)
The Pool may enter into various master netting arrangements or other similar agreements that do not meet the criteria for offsetting in the Statements of Financial Position but still allowfor the related amounts to be set off in certain circumstances, such as bankruptcy or the termination of the contracts.
As at August 31, 2015, August 31, 2014, and September 1, 2013, the Pool did not enter into any arrangements whereby the financial instruments were eligible for offset.
Interests in Underlying Funds (note 4)
As at August 31, 2015, August 31, 2014, and September 1, 2013, the Pool had no investments in underlying funds where the ownership exceeded 20% of each underlying Fund.
11
The accompanying notes are an integral part of these financial statements.
Frontiers Emerging Markets Equity Pool
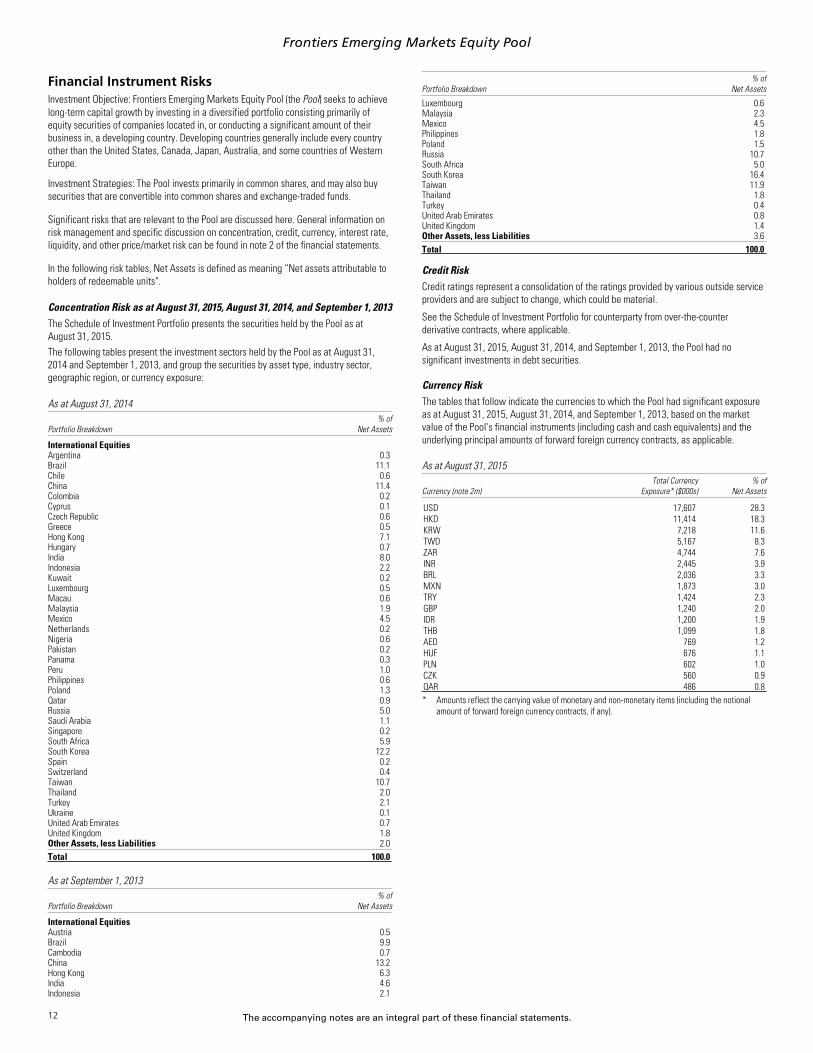
Financial Instrument RisksInvestment Objective: Frontiers Emerging Markets Equity Pool (the Pool) seeks to achievelong-term capital growth by investing in a diversified portfolio consisting primarily ofequity securities of companies located in, or conducting a significant amount of theirbusiness in, a developing country. Developing countries generally include every countryother than the United States, Canada, Japan, Australia, and some countries of WesternEurope.
Investment Strategies: The Pool invests primarily in common shares, and may also buysecurities that are convertible into common shares and exchange-traded funds.
Significant risks that are relevant to the Pool are discussed here. General information onrisk management and specific discussion on concentration, credit, currency, interest rate,liquidity, and other price/market risk can be found in note 2 of the financial statements.
In the following risk tables, Net Assets is defined as meaning “Net assets attributable toholders of redeemable units".
Concentration Risk as at August 31, 2015, August 31, 2014, and September 1, 2013The Schedule of Investment Portfolio presents the securities held by the Pool as atAugust 31, 2015.The following tables present the investment sectors held by the Pool as at August 31,2014 and September 1, 2013, and group the securities by asset type, industry sector,geographic region, or currency exposure:
As at August 31, 2014
Portfolio Breakdown% of
Net Assetsx
x
International Equitiesx
Argentina 0.3x
Brazil 11.1x
Chile 0.6x
China 11.4x
Colombia 0.2x
Cyprus 0.1x
Czech Republic 0.6x
Greece 0.5x
Hong Kong 7.1x
Hungary 0.7x
India 8.0x
Indonesia 2.2x
Kuwait 0.2x
Luxembourg 0.5x
Macau 0.6x
Malaysia 1.9x
Mexico 4.5x
Netherlands 0.2x
Nigeria 0.6x
Pakistan 0.2x
Panama 0.3x
Peru 1.0x
Philippines 0.6x
Poland 1.3x
Qatar 0.9x
Russia 5.0x
Saudi Arabia 1.1x
Singapore 0.2x
South Africa 5.9x
South Korea 12.2x
Spain 0.2x
Switzerland 0.4x
Taiwan 10.7x
Thailand 2.0x
Turkey 2.1x
Ukraine 0.1x
United Arab Emirates 0.7x
United Kingdom 1.8x
Other Assets, less Liabilities 2.0xxx
Total 100.0xx
As at September 1, 2013
Portfolio Breakdown% of
Net Assetsx
x
International Equitiesx
Austria 0.5x
Brazil 9.9x
Cambodia 0.7x
China 13.2x
Hong Kong 6.3x
India 4.6x
Indonesia 2.1
Portfolio Breakdown% of
Net Assetsx
Luxembourg 0.6x
Malaysia 2.3x
Mexico 4.5x
Philippines 1.8x
Poland 1.5x
Russia 10.7x
South Africa 5.0x
South Korea 16.4x
Taiwan 11.9x
Thailand 1.8x
Turkey 0.4x
United Arab Emirates 0.8x
United Kingdom 1.4x
Other Assets, less Liabilities 3.6xxx
Total 100.0xx
Credit RiskCredit ratings represent a consolidation of the ratings provided by various outside serviceproviders and are subject to change, which could be material.
See the Schedule of Investment Portfolio for counterparty from over-the-counterderivative contracts, where applicable.
As at August 31, 2015, August 31, 2014, and September 1, 2013, the Pool had nosignificant investments in debt securities.
Currency RiskThe tables that follow indicate the currencies to which the Pool had significant exposureas at August 31, 2015, August 31, 2014, and September 1, 2013, based on the marketvalue of the Pool's financial instruments (including cash and cash equivalents) and theunderlying principal amounts of forward foreign currency contracts, as applicable.
As at August 31, 2015
Currency (note 2m)Total Currency
Exposure* ($000s)% of
Net Assetsx
x
USD 17,607 28.3x
HKD 11,414 18.3x
KRW 7,218 11.6x
TWD 5,167 8.3x
ZAR 4,744 7.6x
INR 2,445 3.9x
BRL 2,036 3.3x
MXN 1,873 3.0x
TRY 1,424 2.3x
GBP 1,240 2.0x
IDR 1,200 1.9x
THB 1,099 1.8x
AED 769 1.2x
HUF 676 1.1x
PLN 602 1.0x
CZK 560 0.9x
QAR 486 0.8xxx
* Amounts reflect the carrying value of monetary and non-monetary items (including the notionalamount of forward foreign currency contracts, if any).
12
The accompanying notes are an integral part of these financial statements.
Frontiers Emerging Markets Equity Pool
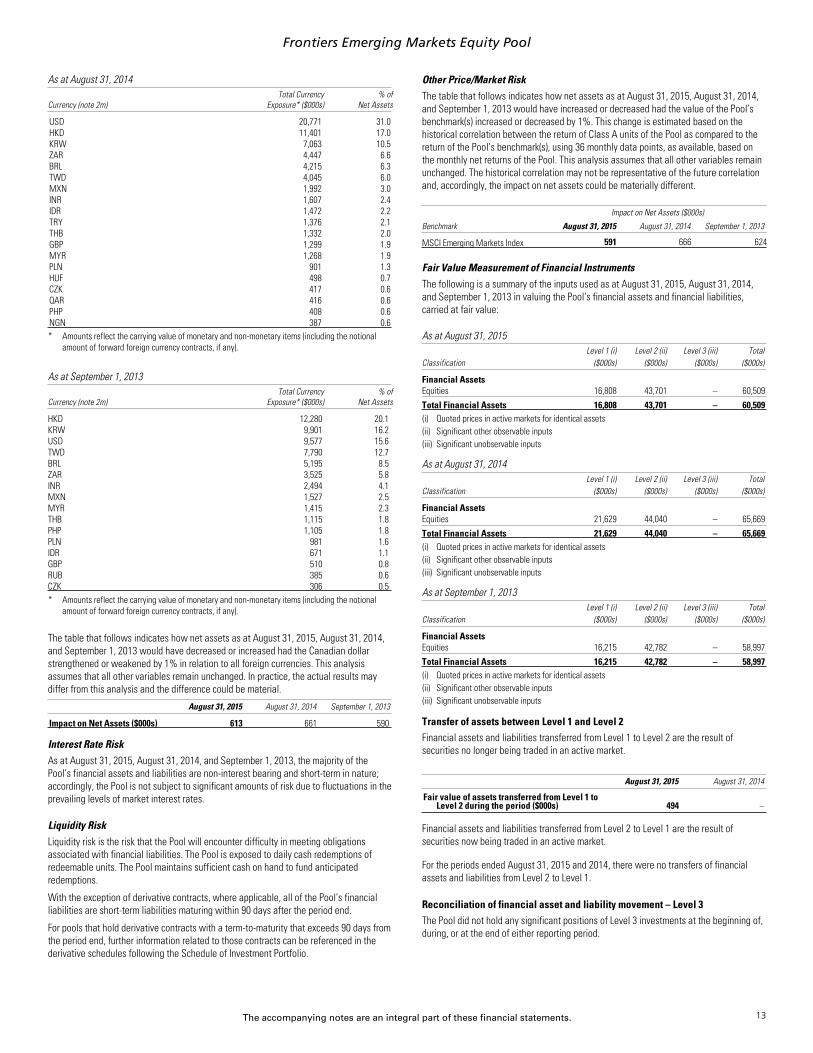
As at August 31, 2014
Currency (note 2m)Total Currency
Exposure* ($000s)% of
Net Assetsx
x
USD 20,771 31.0x
HKD 11,401 17.0x
KRW 7,063 10.5x
ZAR 4,447 6.6x
BRL 4,215 6.3x
TWD 4,045 6.0x
MXN 1,992 3.0x
INR 1,607 2.4x
IDR 1,472 2.2x
TRY 1,376 2.1x
THB 1,332 2.0x
GBP 1,299 1.9x
MYR 1,268 1.9x
PLN 901 1.3x
HUF 498 0.7x
CZK 417 0.6x
QAR 416 0.6x
PHP 408 0.6x
NGN 387 0.6xxx
* Amounts reflect the carrying value of monetary and non-monetary items (including the notionalamount of forward foreign currency contracts, if any).
As at September 1, 2013
Currency (note 2m)Total Currency
Exposure* ($000s)% of
Net Assetsx
x
HKD 12,280 20.1x
KRW 9,901 16.2x
USD 9,577 15.6x
TWD 7,790 12.7x
BRL 5,195 8.5x
ZAR 3,525 5.8x
INR 2,494 4.1x
MXN 1,527 2.5x
MYR 1,415 2.3x
THB 1,115 1.8x
PHP 1,105 1.8x
PLN 981 1.6x
IDR 671 1.1x
GBP 510 0.8x
RUB 385 0.6x
CZK 306 0.5xxx
* Amounts reflect the carrying value of monetary and non-monetary items (including the notionalamount of forward foreign currency contracts, if any).
The table that follows indicates how net assets as at August 31, 2015, August 31, 2014,and September 1, 2013 would have decreased or increased had the Canadian dollarstrengthened or weakened by 1% in relation to all foreign currencies. This analysisassumes that all other variables remain unchanged. In practice, the actual results maydiffer from this analysis and the difference could be material.
August 31, 2015 August 31, 2014 September 1, 2013x
x
Impact on Net Assets ($000s) 613 661 590xx
Interest Rate RiskAs at August 31, 2015, August 31, 2014, and September 1, 2013, the majority of thePool’s financial assets and liabilities are non-interest bearing and short-term in nature;accordingly, the Pool is not subject to significant amounts of risk due to fluctuations in theprevailing levels of market interest rates.
Liquidity RiskLiquidity risk is the risk that the Pool will encounter difficulty in meeting obligationsassociated with financial liabilities. The Pool is exposed to daily cash redemptions ofredeemable units. The Pool maintains sufficient cash on hand to fund anticipatedredemptions.
With the exception of derivative contracts, where applicable, all of the Pool’s financialliabilities are short-term liabilities maturing within 90 days after the period end.
For pools that hold derivative contracts with a term-to-maturity that exceeds 90 days fromthe period end, further information related to those contracts can be referenced in thederivative schedules following the Schedule of Investment Portfolio.
Other Price/Market RiskThe table that follows indicates how net assets as at August 31, 2015, August 31, 2014,and September 1, 2013 would have increased or decreased had the value of the Pool’sbenchmark(s) increased or decreased by 1%. This change is estimated based on thehistorical correlation between the return of Class A units of the Pool as compared to thereturn of the Pool’s benchmark(s), using 36 monthly data points, as available, based onthe monthly net returns of the Pool. This analysis assumes that all other variables remainunchanged. The historical correlation may not be representative of the future correlationand, accordingly, the impact on net assets could be materially different..
Impact on Net Assets ($000s)
Benchmark August 31, 2015 August 31, 2014 September 1, 2013x
x
MSCI Emerging Markets Index 591 666 624xx
Fair Value Measurement of Financial InstrumentsThe following is a summary of the inputs used as at August 31, 2015, August 31, 2014,and September 1, 2013 in valuing the Pool’s financial assets and financial liabilities,carried at fair value:
As at August 31, 2015Level 1 (i) Level 2 (ii) Level 3 (iii) Total
Classification ($000s) ($000s) ($000s) ($000s)xx
Financial Assetsx
Equities 16,808 43,701 – 60,509xxx
Total Financial Assets 16,808 43,701 – 60,509xx
x
(i) Quoted prices in active markets for identical assetsx
(ii) Significant other observable inputsx
(iii) Significant unobservable inputs
As at August 31, 2014Level 1 (i) Level 2 (ii) Level 3 (iii) Total
Classification ($000s) ($000s) ($000s) ($000s)xx
Financial Assetsx
Equities 21,629 44,040 – 65,669xxx
Total Financial Assets 21,629 44,040 – 65,669xx
x
(i) Quoted prices in active markets for identical assetsx
(ii) Significant other observable inputsx
(iii) Significant unobservable inputs
As at September 1, 2013Level 1 (i) Level 2 (ii) Level 3 (iii) Total
Classification ($000s) ($000s) ($000s) ($000s)xx
Financial Assetsx
Equities 16,215 42,782 – 58,997xxx
Total Financial Assets 16,215 42,782 – 58,997xx
x
(i) Quoted prices in active markets for identical assetsx
(ii) Significant other observable inputsx
(iii) Significant unobservable inputs
Transfer of assets between Level 1 and Level 2Financial assets and liabilities transferred from Level 1 to Level 2 are the result ofsecurities no longer being traded in an active market.
.
August 31, 2015 August 31, 2014x
x
Fair value of assets transferred from Level 1 toLevel 2 during the period ($000s) 494 –
x
x
Financial assets and liabilities transferred from Level 2 to Level 1 are the result ofsecurities now being traded in an active market.
For the periods ended August 31, 2015 and 2014, there were no transfers of financialassets and liabilities from Level 2 to Level 1.
Reconciliation of financial asset and liability movement – Level 3The Pool did not hold any significant positions of Level 3 investments at the beginning of,during, or at the end of either reporting period.
13
Notes to Financial Statements
x
As at and for the periods as disclosed in the financial statements (see note 1)
1. Frontiers Pools — Organization of the Pools and Financial Reporting Periods
The Frontiers Pools consist of Frontiers Canadian Short Term Income Pool, Frontiers Canadian Fixed Income Pool, Frontiers Equity Income Pool, Frontiers Canadian Equity Pool, Frontiers U.S. Equity Pool, Frontiers U.S.Equity Currency Neutral Pool, Frontiers International Equity Pool, Frontiers Emerging Markets Equity Pool, and Frontiers Global Bond Pool.
Each of the Frontiers Pools (individually, a Pool, and collectively, the Pools) is a mutual fund trust organized under the laws of Ontario and governed by a declaration of trust (Declaration of Trust). The address of thePools' registered office is 18 York Street, Suite 1300, Toronto, Ontario.
The Pools are managed by CIBC Asset Management Inc. (the Manager). The Manager is also the trustee, registrar, and transfer agent of the Pools.
Each Pool may issue an unlimited number of classes of units and an unlimited number of units of each class. Class A, C, I, and O units of each of the Pools are available for sale, except Frontiers Canadian Short TermIncome Pool which only offers Class A units, and Frontiers U.S. Equity Currency Neutral Pool, which only offers Class O units. In the future, the offering of any classes of a Pool may be terminated or additional classesmay be offered.
Each class of units may charge a different management fee. Operating expenses can either be common or class-specific. Class-specific expenses are allocated on a class-by-class basis. As a result, a separate netasset value per unit is calculated for each class of units.
Class A units are available only to investors participating in the Frontiers Program. This program will invest in a number of Pools, which will form a Frontiers Portfolio. Class A units are available on a no-load basis.Investors do not pay a sales commission when purchasing Class A units, nor are they charged a redemption fee if they redeem their Class A units. They may have to pay a short-term trading fee, if applicable.
Class C units are available to all investors on a no-load basis. Investors do not pay a sales commission when purchasing Class C units, nor are they charged a redemption fee if they redeem their Class C units. They mayhave to pay a short-term trading fee, if applicable.
Class I units are available to investors participating in programs that do not require the payment of sales charges by investors and do not require the payment of service or trailing commissions to dealers. For theseinvestors, the Manager “unbundles” the typical distribution costs and charges a lower management fee. Potential investors include clients of “fee-for-service” investment advisors, dealer-sponsored “wrap accounts”,and others who pay an annual fee to their dealer instead of transactional sales charges and where the dealer does not receive service fees or trailing commissions from the Manager.
Class O units are only available to selected investors who have been approved by and have entered into a Class O account agreement with the Manager or whose dealer or discretionary manager offers separatelymanaged accounts or similar programs and has entered into a Class O unit account agreement with the Manager. These investors are typically financial services companies, including the Manager, that will use ClassO units of the Pools to facilitate offering other products to investors. No management fees or operating expenses are charged to the Pools in respect of Class O units held; instead, a negotiated management fee ischarged by the Manager directly to, or as directed by, Class O unitholders or dealers or discretionary managers on behalf of unitholders.
The date upon which each Pool was established by Declaration of Trust (Date Established) and the date upon which each class of units of each Pool was first sold to the public (Inception Date) are reported in footnoteOrganization of the Pool on the Statements of Financial Position.
The Schedule of Investment Portfolio of each Pool is as at August 31, 2015. The Statements of Financial Position are as at August 31, 2015, August 31, 2014 and September 1, 2013, except for the Poolsestablished during either period, which are as at August 31, 2015, August 31, 2014 and each respective Inception Date. The Statements of Comprehensive Income, Statements of Changes in Net Assets Attributable toHolders of Redeemable Units and Statements of Cash Flows are for the years ended August 31, 2015 and 2014 except for Pools or classes established during either period, in which case the information presented isfrom the Date Established or the Inception Date to August 31, 2015 or 2014.
These financial statements were approved for issuance by the Manager on November 6, 2015.xx
2. Summary of Significant Accounting Policies
These financial statements have been prepared in accordance with International Financial Reporting Standards (IFRS) as published by the International Accounting Standards Board (IASB). The Pools adopted IFRS in2014 as required by Canadian securities legislation and the Canadian Accounting Standards Board. Previously, the Pools prepared their financial statements in accordance with Canadian generally accepted accountingprinciples (GAAP) as defined in Part V of the CPA Canada Handbook. The Pools have consistently applied the accounting policies used in the preparation of their opening IFRS statements of financial position as atSeptember 1, 2013 and throughout all periods presented, as if these policies had always been in effect.
Note 12 discloses the impact of the transition to IFRS on the Pools’ reported financial position, financial performance and cash flows, including the nature and effect of significant changes in accounting policies fromthose used in the Pools’ financial statements for the year ended August 31, 2014 prepared under Canadian GAAP.
The financial statements have been prepared on a going concern basis using the historical-cost convention. However, each Pool is an investment entity and primarily all financial assets and financial liabilities aremeasured at fair value in accordance with IFRS. Accordingly, the Pools’ accounting policies for measuring the fair value of investments and derivatives are consistent with those used in measuring the Net Asset valuefor transactions with unitholders. In applying IFRS, these financial statements include estimates and assumptions made by management that affect the reported amounts of assets, liabilities, income, and expensesduring the reporting periods. However, existing circumstances and assumptions may change due to market changes or circumstances arising beyond the control of the Pools. Such changes are reflected in theassumptions when they occur.
These financial statements have been presented in Canadian dollars, which is the Pools’ functional currency (unless otherwise noted).
a) Financial Instruments
Classification and recognition of financial instruments
In accordance with IAS 39 Financial Instruments: Recognition and Measurement, financial assets and financial liabilities are classified at initial recognition into the following categories:
Financial assets and liabilities at fair value through profit or loss (“FVTPL”)
This category is sub-divided into:
l Financial instruments classified as Held For Trading: Financial assets and liabilities are classified as Held For Trading if they are acquired for the purpose of selling and/or repurchasing in the near term, andare acquired principally for the purpose of generating a profit from short-term fluctuations in price. Derivatives and securities sold short held by the Pools are classified as Held For Trading and do not meetthe definition of effective hedging instruments as defined by IAS 39.
l Financial instruments designated as FVTPL through inception: All investments held by the Pools, excluding those classified as Held For Trading (discussed above), are designated as fair value through profitor loss upon initial recognition. These financial assets are designated upon initial recognition on the basis that they are part of a group of financial assets that are managed and have their performanceevaluated on a fair value basis, in accordance with risk management and investment strategies of the Pools, as set out in the Pools’ prospectus.
Loans and receivables
The Pools include in this category receivable balances relating to portfolio investments and other short-term receivables such as receivable for units issued.
Other financial liabilities
This category includes all financial liabilities, other than those classified as fair value through profit or loss. The Pools include in this category amounts relating to payables for portfolio securities purchased and otheraccrued liabilities such as payable for units redeemed and distributions payable to holders of redeemable units.
All Pools have contractual obligations to distribute cash to the unitholders. As a result, the Pools’ obligation for net assets attributable to holders of redeemable units represents a financial liability and is presented atthe redemption amount.
b) Risk Management
The Pools’ overall risk management approach includes formal guidelines that govern the extent of exposure to various types of risk, including diversification within asset classes and limits on the exposure to individualinvestments and counterparties. In addition, derivative financial instruments may be used to manage certain risk exposures. The Manager also has various internal controls to oversee the Pools’ investment activities,
14
p / 2 Notes to Financial Statements
including monitoring compliance with the investment objectives and strategies, internal guidelines, and securities regulations. Please refer to each Pool’s Supplemental Schedule to Schedule of Investment Portfolio forspecific risk disclosures.
Fair value of financial instruments
Financial instruments are valued at their fair value, which is defined as the price that would be received to sell an asset or paid to transfer a liability in an orderly transaction between market participants at themeasurement date. Refer to notes 3a to 3f for valuation of each specific type of financial instruments held by the Pools. The fair value of financial assets and liabilities traded in active markets are based on quotedmarket prices at the close of trading on the reporting date. The Pools use the last traded market price for both financial assets and financial liabilities where the last traded price falls within that day’s bid-ask spread. Incircumstances where the last traded price is not within the bid-ask spread, the Manager determines the point within the bid-ask spread that is most representative of fair value based on the specific facts andcircumstances.
For financial assets and financial liabilities that are not traded in an active market, fair value is determined using valuation techniques.
The Pools classify fair value measurement within a hierarchy which gives the highest priority to unadjusted quoted prices in active markets for identical assets or liabilities (Level 1) and the lowest priority tounobservable inputs (Level 3). The three levels of the fair value hierarchy are:
Level 1: Quoted prices (unadjusted) in active markets for identical assets or liabilities that the entity can access at the measurement date;
Level 2: Inputs other than quoted prices included within Level 1 that are observable for the asset or liability, either directly or indirectly; and
Level 3: Inputs are unobservable for the asset or liability.
If inputs are used to measure an asset’s or liability’s fair value, the classification within the hierarchy is based on the lowest level input that is significant to the fair value measurement. Each Pool’s fair value hierarchyclassification of its assets and liabilities is included in the Supplemental Schedule to Schedule of Investment Portfolio.
The carrying values of all non-investment assets and liabilities approximate their fair values due to their short-term nature. Fair values are classified as Level 1 when the related security or derivative is actively tradedand a quoted price is available. If an instrument classified as Level 1 subsequently ceases to be actively traded, it is transferred out of Level 1. In such cases, instruments are reclassified into Level 2, unless themeasurement of its fair value requires the use of significant unobservable inputs, in which case it is classified as Level 3.
The Manager is responsible for performing the fair value measurements included in the financial statements of a Pool, including the Level 3 measurements. The Manager obtains pricing from third-party pricing vendorsand the pricing is reviewed daily. At each financial reporting date, the Manager reviews and approves all Level 3 fair value measurements. The Pools also have a Valuation Committee which meets quarterly to performdetailed reviews of the valuations of investments held by the Pools, which includes discussion on Level 3 measurements.
Credit risk
Credit risk is the risk that a counterparty to a financial instrument, such as a fixed income security or a derivative contract, will fail to discharge an obligation or commitment that it has entered into with the Pools. Thevalue of fixed income securities and derivatives as presented on the Schedule of Investment Portfolio includes consideration of the creditworthiness of the issuer and, accordingly, represents the maximum credit riskexposure of the Pools.
Certain Pools may invest in short-term fixed income securities issued or guaranteed primarily by the Government of Canada or any Canadian provincial government, obligations of Canadian chartered banks or trustcompanies, and commercial paper with approved credit ratings. The risk of default on these short-term fixed income securities is considered low and these securities primarily have credit ratings of ‘A-1 (Low)’ or higher(as rated by Standard & Poor’s, a division of The McGraw-Hill Financial, Inc., or equivalent rating from another rating service).
The Pools may engage in securities lending transactions. The credit risk related to securities lending transactions is limited by the fact that the value of cash or securities held as collateral by the Pools in connectionwith these transactions is at least 102% of the fair value of the securities loaned. The collateral and loaned securities are marked to market on each business day. Further information regarding the collateral andsecurities on loan can be found in the footnotes to the Statements of Financial Position and in note 2j.
Currency risk
Currency risk is the risk that the value of an investment will fluctuate due to changes in foreign exchange rates. This is because the Pools may invest in securities denominated or traded in currencies other than a Pool’sreporting currency.
Interest rate risk
Prices of fixed income securities generally increase when interest rates decline and decrease when interest rates rise. This risk is known as interest rate risk. Prices of longer-term fixed income securities will generallyfluctuate more in response to interest rate changes than would shorter-term securities. Due to the nature of short-term fixed income securities with a remaining term-to-maturity of less than one year, theseinvestments are not generally exposed to a significant risk that their value will fluctuate in response to changes in the prevailing levels of market interest rates.
Liquidity risk
The Pools are exposed to daily cash redemptions of redeemable units. Generally, the Pools retain sufficient cash and cash equivalent positions to maintain adequate liquidity. However, liquidity risk also involves theability to sell an asset for cash easily and at a fair price. Some securities are illiquid due to legal restrictions on their resale, the nature of the investment, or simply a lack of interested buyers for a particular security orsecurity type. Certain securities may become less liquid due to changes in market conditions, such as interest rate changes or market volatility, which could impair the ability of a Pool to sell such securities quickly or ata fair price. Difficulty in selling securities could result in a loss or lower return for a Pool.
Other price/market risk
Other price/market risk is the risk that the value of investments will fluctuate as a result of changes in market conditions. Several factors can influence market trends, such as economic developments, changes ininterest rates, political changes, and catastrophic events. All investments are exposed to other price/market risk.
c) Investment Transactions, Income Recognition, and Recognition of Realized and Unrealized Gains and Losses
i) Each transaction of purchase or sale of a portfolio asset by a Pool is reflected in the net assets no later than the first computation of net assets made after the date on which the transaction becomesbinding upon the Pool.
ii) Interest for distribution purposes shown on the Statements of Comprehensive Income represents the coupon interest received by the Pool accounted for on an accrual basis. The Pools do not amortizepremiums paid or discounts received on the purchase of fixed income securities except for zero coupon bonds which are amortized on a straight-line basis.
iii) Dividend income is recorded on the ex-dividend date.
iv) Securities that are exchange-traded are recorded at fair value established by the last traded market price when that price falls within that day’s bid-ask spread. Debt securities are recorded at fair value,established by the last traded price on the Over-the-Counter market (OTC) when that price falls within that day’s bid-ask spread. In circumstances where the last traded price is not within the bid-ask spread,the Manager determines the point within the bid-ask spread that is most representative of fair value based on the specific facts and circumstances. Unlisted securities are recorded at fair value using fairvaluation techniques established by the Manager in establishing a fair value.
v) Realized gains and losses on investments and unrealized appreciation or depreciation of investments are calculated using the average cost, excluding transaction costs, of the related investments.
vi) Investment income is the sum of income paid to the Pool that is generated from a Pool’s investment fund holdings.
vii) Other income is the sum of income, excluding transaction costs, other than that which is separately classified on the Statements of Comprehensive Income.
d) Offsetting
Financial assets and liabilities are offset and the net amount reported in the Statements of Financial Position if there is a currently enforceable legal right to offset the recognized amounts and there is an intention tosettle on a net basis, or to realize the asset and settle the liability simultaneously.
Where applicable, additional information can be found in the table Offsetting Arrangements as part of the Supplemental Schedule to Schedule of Investment Portfolio. This supplemental schedule discloses the OTCderivatives which are subject to offsetting.
15
Notes to Financial Statements p / 3
e) Portfolio Securities
The cost of securities of the Pools is determined in the following manner. Securities are purchased and sold at a market-traded price to arrive at a value for the position traded. The total purchased value represents thetotal cost of the security to the Pool. When additional units of the same security are purchased, the cost of those additional units is added to the total security cost. When units of the same security are sold, theproportionate cost of the units of the security sold is deducted from the total security cost. If there is a return of capital paid by a security, the amount of this return of capital is deducted from the total security cost.This method of tracking security cost is known as “average cost” and the current total for any one security is referred to as the adjusted cost base or “ACB” of the security. Transaction costs incurred in portfoliotransactions are excluded from the average cost of investments and are recognized immediately in Increase (Decrease) in Net Assets Attributable to Holders of Redeemable Units and are presented as a separateexpense item in the financial statements.
The difference between the fair value of securities and their average cost, excluding transaction costs, represents the unrealized appreciation (depreciation) in value of the portfolio investments. The applicable periodchange in unrealized appreciation (depreciation) of investments is included on the Statements of Comprehensive Income.
Short-term investments on the Schedule of Investment Portfolio are presented at their amortized cost which approximates their fair value. Accrued interest for bonds is disclosed separately on the Statements ofFinancial Position.
f) Foreign Exchange
The value of investments and other assets and liabilities denominated in foreign currencies is translated into Canadian dollars, which is the Pools’ functional and presentation currency at the current rates prevailing oneach Valuation Date.
Purchases and sales of investments, income, and expenses are translated into Canadian dollars, which is the Pools' functional and presentation currency at the foreign exchange rates prevailing on the dates of suchtransactions. Foreign currency translation gains (losses) on investments and income transactions are included in Net realized gain (loss) on foreign currency and in Income, respectively, on the Statements ofComprehensive Income.
g) Forward Foreign Currency Contracts
The Pools may enter into forward foreign currency contracts for either hedging or non-hedging purposes where such activity is consistent with their investment objectives and as permitted by the Canadian securitiesregulatory authorities.
Changes in the fair value of forward foreign currency contracts are included in derivative assets or derivative liabilities on the Statements of Financial Position and are recorded as an Increase (decrease) in unrealizedappreciation (depreciation) of investments and derivatives during the applicable period on the Statements of Comprehensive Income.
The gain or loss arising from the difference between the value of the original forward foreign currency contract and the value of such contract at close or delivery is realized and recorded as Net realized gain (loss) onforeign currency for Pools that use the forward foreign currency contracts for hedging, or as Derivative income (loss) for Pools that do not use the forward foreign currency contracts for hedging.
h) Futures Contracts
The margin deposits with brokers relating to futures contracts are included in Margin on the Statements of Financial Position. Any change in the margin requirement is settled daily and included in Receivable forportfolio securities sold or Payable for portfolio securities purchased on the Statements of Financial Position.
Any difference between the settlement value at the close of business on each Valuation Date and the settlement value at the close of business on the previous Valuation Date is recorded as Derivative Income (loss) onthe Statements of Comprehensive Income.
i) Options
Premiums paid for purchased call and put options are included in derivative assets and subsequently measured at fair value on the Statements of Financial Position. When a purchased option expires, the Pool willrealize a loss in the amount of the cost of the option. For a closing transaction, the Pool will realize a gain or loss depending on whether the proceeds are greater or less than the premium paid at the time of purchase.
When a purchased call option is exercised, the cost of the security purchased is increased by the premium paid at the time of purchase.
Premiums received from writing options are included in derivative liabilities and subsequently measured at fair value on the Statements of Financial Position as initial reductions in the value of investments. Premiumsreceived from writing options that expire unexercised are recorded as realized gains and reported as Net gain (loss) on sale of investments and derivatives on the Statements of Comprehensive Income. For a closingtransaction, if the cost of closing the transaction exceeds the premium received, the Pool will record a realized loss or, if the premium received at the time the option was written is greater than the amount paid, thePool will record a realized gain and are reported as Net gain (loss) on sale of investments and derivatives. If a written put option is exercised, the cost for the security delivered is reduced by the premiums received atthe time the option was written.
j) Securities Lending
A Pool may lend portfolio securities in order to earn additional revenue, which is disclosed on the Statements of Comprehensive Income. The loaned assets of any one Pool are not permitted to exceed 50% of the fairvalue of the assets of that Pool (excluding collateral debt for the loaned securities). The minimum allowable collateral is 102% of the market value of the loaned securities as per the requirements of NationalInstrument 81-102-Mutual Funds. Collateral can consist of the following:
i) Cash;
ii) Qualified securities;
iii) Irrevocable letters of credit issued by a Canadian financial institution that is not the counterparty, or an affiliate counterparty, of the fund in the transaction, if evidences of indebtedness of the Canadianfinancial institution that are rated as short-term debt by an approved credit rating organization have an approved credit rating.
iv) Securities that are immediately convertible into securities of the same issuer, class, or type, and the same term, as the securities loaned.
The market value of the loaned securities is determined on the close of any valuation date and any additional required collateral is delivered to the Pool on the next business day. The securities on loan continue to beincluded on the Schedule of Investment Portfolio and are included in the total value on the Statements of Financial Position in Investments (non-derivative financial assets) at fair value. Where applicable, a Pool’ssecurities lending transactions are reported in footnote Securities Lending on the Statements of Financial Position.
k) Multi-Class Structured Pools
The realized and unrealized capital gains or capital losses, income, and common expenses (other than class-specific operating expenses and management fees) of the Pool are allocated on each Valuation Date to theunitholders in proportion to the respective prior day’s net asset value, which includes unitholder trade(s) dated for that day, of each class of units at the date on which the allocation is made. Class-specific operatingexpenses and management fees do not require allocation. All class-specific operating expenses are paid by the Manager and are collected from the Pools on a recoverable basis.
l) Loans and Receivables, Other Assets and Liabilities
Loans and receivables, other assets and liabilities (other than those classified as FVTPL) are recorded at cost, which approximates their fair value with the exception of net assets attributable to holders of redeemableunits, which are presented at the redemption value.
m) Legend for Abbreviations
The following is a list of abbreviations (foreign currency translation and others) that may be used in the Statements of Investment Portfolio:
x
x..x
16
p / 4 Notes to Financial Statements
x
Currency Abbreviations
x..
AUD – Australian Dollar KRW – South Korean Won..
BRL – Brazilian Real MXN – Mexican Peso..
CAD – Canadian Dollar MYR – Malaysian Ringgit..
CHF – Swiss Franc NOK – Norwegian Krone..
CLP – Chilean Peso NZD – New Zealand Dollar..
CZK – Czech Koruna PHP – Philippine Peso..
DKK – Danish Krone PLN – Polish Zloty..
EUR – Euro RUB – Russian Ruble..
GBP – British Pound SEK – Swedish Krona..
HKD – Hong Kong Dollar SGD – Singapore Dollar..
HUF – Hungarian Forint THB – Thai Baht..
IDR – Indonesian Rupiah TRY – New Turkish Lira..
ILS – Israeli Shekel TWD – Taiwan Dollar..
INR – Indian Rupee USD – United States Dollar..
JPY – Japanese Yen ZAR – South African Rand..
Other Abbreviations
..
ADR – American Depositary Receipt iUnits – Index Units Securities..
ADC – Austrian Depositary Certificates LEPOs – Low Exercise Price Options..
CVO – Contingent Value Obligations International MSCI – Morgan Stanley Capital Index..
ETF – Exchange-Traded Fund OPALS – Optimized Portfolios as Listed..
GDR – Global Depositary Receipt Securities PERLES – Performance Linked to Equity..
IPN – International Participation Note REIT – Real Estate Investment Trust..
iShares – Index Shares SDR – Swedish Depositary Receiptxx
x..
xxxxxxxx
n) Standards Issued but not yet Effective
Standards issued but not yet effective up to the date of issuance of the Pools’ financial statements are listed below. The Pools intend to adopt applicable standards when they become effective.
IFRS 9, Financial Instruments - Classification and Measurement
In July 2014, the IASB issued the final version of IFRS 9 Financial Instruments which reflects all phases of the financial instruments project and replaces IAS 39 Financial Instruments: Recognition and Measurementand all previous versions of IFRS 9. The standard introduces new requirements for classification and measurement, impairment, and hedge accounting. IFRS 9 is effective for annual periods beginning on or afterJanuary 1, 2018, with early application permitted. The Pools are in the process of assessing the impact of IFRS 9.
o) Increase (Decrease) in Net Assets Attributable to Holders of Redeemable Units per Unit
Increase (decrease) in net assets attributable to holders of redeemable units per unit of each class is calculated by dividing the Increase (decrease) in net assets attributable to holders of redeemable units (excludingdistributions), as reported in the Statements of Comprehensive Income, by the weighted average number of units in issue during the related period.
3. Valuation of Investments
The valuation date for a Pool is any day when the Manager’s head office is open for business (Valuation Date). The Trustee may, at its discretion, establish other Valuation Dates. The value of the investments or assetsof a Pool is determined as follows:
a) Cash and Other Assets
Cash, accounts receivable, dividends receivable, distributions receivable, and interest receivable are valued at fair value or at their recorded cost, plus or minus any foreign exchange between recognition of the assetby the Pool and the current Valuation Date, which approximates fair value.
Short-term investments (money market instruments) are valued at fair value.
b) Bonds, Debentures, and Other Debt Obligations
Bonds, debentures, and other debt obligations are fair valued using the last traded price provided by a recognized vendor upon the close of trading on a Valuation Date, whereby the last traded price falls within thatday’s bid-ask spread. If the last traded price does not fall within that day’s bid-ask spread, then the Manager will determine the point within the bid-ask spread that is most representative of fair value based on thespecific facts and circumstances.
c) Listed Securities, Unlisted Securities, and Fair Value Pricing of Foreign Securities
Any security that is listed or traded on a securities exchange is fair valued using the last traded price, whereby the last traded price falls within that day’s bid-ask spread or, if there is no traded price on that exchangeor the last traded price does not fall within that day’s bid-ask spread and in the case of securities traded on an OTC market, at the fair value as determined by the Manager as an appropriate basis for valuation. In suchsituations, a fair value will be determined by the Manager to establish current value. If any securities are inter-listed or traded on more than one exchange or market, the Manager will use the principal exchange ormarket for the fair value of such securities.
Units of each mutual fund in which a Pool invests will be valued at fair value using the most recent net asset value quoted by the Trustee or Manager of the mutual fund on the Valuation Date.
Unlisted securities are fair valued using the last traded price quoted by a recognized dealer, or the Manager may determine a price that more accurately reflects the fair value of these securities if the Manager feelsthe last traded price does not reflect fair value.
Fair value pricing is designed to avoid stale prices and to provide a more accurate fair value, and may assist in the deterrence of harmful short-term or excessive trading in the Pool. When securities listed or traded onmarkets or exchanges that close prior to North or South American markets or exchanges are valued by the Manager at their fair market value, instead of using quoted or published prices, the prices of such securitiesused to calculate the Pool's net assets or net asset value may differ from quoted or published prices of such securities.
d) Derivatives
Long positions in options, debt-like securities, and listed warrants are fair valued using the last traded price as established on either their principal trading exchange or by a recognized dealer in such securities,whereby the last traded price falls within that day’s bid-ask spread and the credit rating of each counterparty (as rated by Standard & Poor’s, a division of The McGraw-Hill Financial, Inc.) meets or exceeds theminimum approved credit rating.
When any option is written by any Pool, the premium received by the Pool will be reflected as a liability that will be valued at an amount equal to the current value of the option that would have the effect of closing theposition. Any difference resulting from revaluation shall be treated as an unrealized gain or loss on investment; the liability shall be deducted in arriving at the net assets attributable to holders of redeemable units ofthe Pool. The securities that are the subject of a written option, if any, will be valued in the manner described above for listed securities.
17
Notes to Financial Statements p / 5
Futures contracts, forward contracts, or swaps will be valued at fair value of the gain or loss, if any, that would be realized on the Valuation Date if the position in the futures contracts, forward contracts, or swapswere to be closed out.
Margin paid or deposited in respect of futures contracts and forward contracts will be reflected as an account receivable and margin consisting of assets other than cash will be noted as held as collateral.
Other derivatives and margin are fair valued in a manner that the Manager determines to represent their fair value.
e) Restricted Securities
Restricted securities purchased by any Pool will be fair valued in a manner that the Manager determines to represent their fair value.
f) Other Securities
All other investments of the Pools will be valued at fair value in accordance with the laws of the Canadian securities regulatory authorities where applicable.
The value of any security or other property of a Pool for which a market quotation is not readily available or where the market quotations do not properly reflect the fair value of such securities will be determined bythe Manager by valuing the securities at their fair value. In such situations, fair value will be determined using fair valuation techniques that most accurately reflect their fair value as established by the Manager.
4. Interest in Underlying Funds
The Pools may invest in other investment funds ("Underlying Funds”). Each Underlying Fund invests in a portfolio of assets to generate returns in the form of investment income and capital appreciation for itsunitholders. Each Underlying Fund finances its operations primarily through the issuance of redeemable units, which are puttable at the unitholder’s option and entitle the unitholder to a proportionate share of theUnderlying Fund’s net assets. The Pools’ interests in Underlying Funds held in the form of redeemable units, are reported in its Schedule of Investments at fair value, which represents the Pools’ maximum exposure onthose investments. The Pools’ interests in Underlying Funds as at the prior year-end periods are presented in the Financial Instrument Risks – Concentration Risks section in the Supplemental Schedule to the Scheduleof Investment Portfolio. Distributions earned from Underlying Funds are included in “Investment Income” in the Statements of Comprehensive Income. The total realized and change in unrealized gains (losses) arisingfrom Underlying Funds are also included in the Statement of Comprehensive Income. The Pools do not provide any additional significant financial or other support to Underlying Funds.
Where applicable, the table “Interests in Underlying Funds” is presented as part of the Supplemental Schedule to Schedule of Investment Portfolio which provides additional information on the Pools’ investments inUnderlying Funds where the ownership interest exceeds 20% of each Underlying Fund.
5. Redeemable Units Issued and Outstanding
Each Pool is permitted to have an unlimited number of classes of units and may issue an unlimited number of units of each class. The outstanding units represent the net assets attributable to holders of redeemableunits of the Pools. Each unit has no par value and the value of each unit is the net asset value as determined on each valuation date. Settlement of the cost for units issued is completed as per laws of the Canadiansecurities regulatory authorities in place at the time of issue. Distributions made by the Pools and reinvested by unitholders in additional units also constitute issued redeemable units of the Pools.
Units are redeemed at the net assets attributable to holders of redeemable units per unit of each class of units of the Pool. A right to redeem units of a Pool may be suspended with the approval of the Canadiansecurities regulatory authorities or when normal trading is suspended on a stock, options, or futures exchange within Canada or outside of Canada on which securities or derivatives that make up more than 50% of thevalue or underlying exposure of the total assets of the Pool, not including any liabilities of the Pool, are traded and when those securities or derivatives are not traded on any other exchange that represents areasonably practical alternative for the Pool. The Pools are not subject to any externally imposed capital requirements.
The capital received by a Pool is utilized within the respective investment mandate of a Pool. For all Pools, this includes the ability to make liquidity available to satisfy unitholder unit redemption requirements upon theunitholder’s request.
Changes in issued and outstanding units for the periods ended August 31, 2015 and 2014 can be found on the Statements of Changes in Net Assets Attributable to Holders of Redeemable Units.x
6. Management Fees and Operating Expenses
Management fees are based on the net asset value of the Pools and are calculated daily and paid monthly. Management fees are paid to the Manager in consideration for providing, or arranging for the provision of,management, distribution, and portfolio advisory services. Advertising and promotional expenses, office overhead expenses related to the Manager’s activities, trailing commissions and the fees of the portfoliosub-advisors are paid by the Manager out of the management fees received from the Pools. The maximum annual management fee expressed as a percentage of the average net asset value for each class of units ofthe Pool is reported in footnote Maximum Chargeable Management Fee Rates on the Statements of Comprehensive Income. For Class O units, management fees are negotiated with and paid by, or as directed by,unitholders, or dealers and discretionary managers on behalf of unitholders.
In addition to the management fees, the Pools are responsible for all expenses relating to the operation and conduct of the business of the Pools, including interest, operating, and administrative costs (other thanadvertising and promotional expenses, which are the responsibility of the Manager), brokerage fees, commissions, spreads, regulatory fees (including the portion of the regulatory fees paid by the Manager that areattributable to the Pools), Independent Review Committee fees, taxes, audit and legal fees and expenses, trustee fees, safekeeping fees, custodial fees, any agency fees, securities lending, repurchase, and reverserepurchase fees, investor servicing costs, and costs of unitholder reports, prospectuses, fund facts, and other reports. All class-specific operating expenses are paid by the Manager and recovered from the Pools. ThePools do not pay a fee to the trustee.
The Manager may recover from a Pool less than the actual class-specific operating expenses paid by the Manager, resulting in the Manager absorbing class-specific expenses. The Manager may also charge to a Poolless than the maximum management fee noted in footnote Maximum Chargeable Management Fee Rates on the Statements of Comprehensive Income, resulting in the Manager waiving management fees.
At its sole discretion, the Manager may stop absorbing class-specific operating expenses and/or waiving management fees at any time. Class-specific operating expenses absorbed and/or management fees waivedby the Manager are disclosed on the Statements of Comprehensive Income.
In some cases, the Manager may charge management fees to a Pool that are less than the management fees the Manager is entitled to charge in respect of certain investors in a Pool. The difference in the amount ofthe management fees will be paid out by the Pool to the applicable investors as a distribution of additional units of the Pool (Management Fee Distributions).
Management Fee Distributions are negotiable between the Manager and the investor and are dependent primarily on the size of the investor’s investment in the Pool. Management Fee Distributions paid to qualifiedinvestors do not adversely impact the Pool or any of the Pool’s other investors. The Manager may increase or decrease the amount of Management Fee Distributions to certain investors from time to time.
7. Income Taxes and Withholding Taxes
All of the Pools (except Frontiers Equity Income Pool and Frontiers U.S. Equity Currency Neutral Pool) qualify as mutual fund trusts under the Income Tax Act (Canada). No income tax is payable by the Pools on netincome and/or net realized capital gains that are distributed to unitholders. In addition, for all of the Pools (except those that do not qualify as mutual fund trusts under the Income Tax Act (Canada)), income taxespayable on undistributed net realized capital gains are refundable on a formula basis when units of the Pools are redeemed. Sufficient net income and realized capital gains of the Pools have been, or will be,distributed to the unitholders such that no tax is payable by the Pools and accordingly, no provision for income taxes has been made in the financial statements. Occasionally, a Pool may pay distributions in excess ofnet income and net realized capital gains of the Pool. This excess distribution is called a return of capital and is non-taxable to the unitholder. However, a return of capital reduces the average cost of the unitholder’sunits for tax purposes.
Non-capital losses that arose in 2005 are available to be carried forward for 10 years. Non-capital losses that arose in 2006 and after are available to be carried forward for 20 years.
Capital losses for income tax purposes may be carried forward indefinitely and applied against capital gains realized in future years. Where applicable, a Pool’s net capital and non-capital losses are reported infootnote Capital and Non-Capital Losses on the Statements of Changes in Net Assets Attributable to Holders of Redeemable Units.
Frontiers Equity Income Pool and Frontiers U.S. Equity Currency Neutral Pool have a taxation year-end of December 31. All other Pools have a taxation year-end of December 15.
The Pools currently incur withholding taxes imposed by certain countries on investment income and capital gains. Such income and gains are recorded on a gross basis and the related withholding taxes are shown as aseparate expense in the Statements of Comprehensive Income.
8. Brokerage Commissions and Fees
The total commissions paid by the Pools to brokers in connection with portfolio transactions are reported in footnote Brokerage Commissions and Fees on the Statements of Comprehensive Income of each Pool. Inallocating brokerage business to a dealer, consideration may be given by the portfolio sub-advisors of the Pools to the provision of goods and services by the dealer or a third party, other than order execution (referredto in the industry as “soft dollar” arrangements). These goods and services are paid for with a portion of brokerage commissions and assist the portfolio sub-advisors with their investment decision-making services tothe Pools or relate directly to the execution of portfolio transactions on behalf of the Pools. The services are supplied by the dealer executing the trade or by a third party and paid for by that dealer. The total soft dollar
18
p / 6 Notes to Financial Statements
payments paid by the Pools to brokers are reported in footnote Brokerage Commissions and Fees on the Statements of Comprehensive Income of each Pool. In addition, the Manager may enter into commissionrecapture arrangements with certain dealers with respect to the Pool. Any commission recaptured will be paid to the applicable Pool.
Fixed income, other securities, and certain derivative products (including forwards) are transacted in an over-the-counter market, where participants are dealing as principals. Such securities are generally traded on anet basis and do not normally involve brokerage commissions, but will typically include a “spread” (being the difference between the bid and the offer prices on the security of the applicable marketplace).
Spreads associated with fixed income securities trading and certain derivative products (including forwards) are not ascertainable and, for that reason, are not included in the dollar amounts. In addition, the soft dollaramounts only include the value of research and other services supplied by a third party to the portfolio sub-advisors, as the value of the services supplied to the portfolio sub-advisors by the dealer is not ascertainable.When these services benefit more than one Pool, the costs are allocated among the Pools based on transaction activity or some other fair basis as determined by the portfolio sub-advisors.x
9. Related Party Transactions
Canadian Imperial Bank of Commerce (CIBC) and its affiliates have the following roles and responsibilities with respect to the Pools and receive the fees described below in connection with their roles andresponsibilities. The Pools may hold securities of CIBC. CIBC and its affiliates may also be involved in underwriting or lending to issuers that may be held by the Pools, have purchased or sold securities from or to thePools while acting as principal, have purchased or sold securities from or to the Pools on behalf of another investment fund managed by CIBC or an affiliate, or have been involved as a counterparty to derivativetransactions. Management fees payable and other accrued expenses on the Statements of Financial Position are amounts generally payable to a related party of the Pool.
Manager, Trustee, Portfolio Advisor, and Portfolio Sub-Advisor of the Pools
CIBC Asset Management Inc. (CAMI), a wholly owned subsidiary of CIBC, is the Manager, trustee, and portfolio advisor of each of the Pools.
The Manager also arranges for fund administrative services (other than advertising and promotional services, which are the responsibility of the Manager), legal, investor servicing, and costs of unitholder reports,prospectuses, and other reports. The Manager is the registrar and transfer agent for the Pools and provides, or arranges for the provision of, all other administrative services required by the Pools. The dollar amount(including all applicable taxes) of all fund administrative expenses (net of absorptions) that the Manager recovers from the Pool is reported in footnote Administrative and Other Fund Operating Expenses on theStatements of Comprehensive Income.
Brokerage Arrangements and Soft Dollars
The portfolio sub-advisors make decisions, including the selection of markets and dealers and the negotiation of commissions, with respect to the purchase and sale of portfolio securities, certain derivative products(including futures), and the execution of portfolio transactions. Brokerage business may be allocated by portfolio sub-advisors, to CIBC World Markets Inc. and CIBC World Markets Corp., each a subsidiary of CIBC. Thetotal commissions paid to related brokers in connection with portfolio transactions are reported in footnote Brokerage Commissions and Fees on the Statements of Comprehensive Income of each Pool.
CIBC World Markets Inc. and CIBC World Markets Corp. may also earn spreads on the sale of fixed income, other securities, and certain derivative products (including forwards) to the Pools. Dealers, including CIBCWorld Markets Inc. and CIBC World Markets Corp., may furnish goods and services, other than order execution, to portfolio sub-advisors, that process trades through them (referred to in the industry as “soft-dollar”arrangements). These goods and services are paid for with a portion of brokerage commissions and assist the portfolio sub-advisors with their investment decision-making services to the Pools or relate directly toexecuting portfolio transactions on behalf the Pools. They are supplied by the dealer executing the trade or by a third party and paid for by that dealer. As per the terms of the portfolio sub-advisory agreements, suchsoft dollar arrangements are in compliance with applicable laws. The Manager has entered into an expense reimbursement agreement with CAMI which provides that custodial fees directly related to portfoliotransactions incurred by a Pool, or a portion of a Pool, for which CAMI acts as advisor, shall be paid by CAMI and/or dealer(s) directed by CAMI up to the amount of the credits generated under soft dollar arrangementsfrom trading on behalf of the Pool, or portion of the Pool, during the month. The total soft dollar payments paid by the Pool to related brokers are reported in footnote Brokerage Commissions and Fees on theStatements of Comprehensive Income of each Pool. In addition, the Manager may enter into commission recapture arrangements with certain dealers with respect to the Pools. Any commission recaptured will be paidto the relevant Pool.
Spreads associated with fixed income securities trading and certain derivative products (including forwards) are not ascertainable and, for that reason, are not included in the dollar amounts. In addition, the soft dollaramounts only include the value of research and other services supplied by a third party to the portfolio sub-advisors, as the value of the services supplied to the portfolio sub-advisors by the dealer is not ascertainable.When these services benefit more than one Pool, the costs are allocated among the Pools based on transaction activity or some other fair basis as determined by the portfolio sub-advisors.
Custodian
The custodian holds all cash and securities for the Pools and ensures that those assets are kept separate from any other cash or securities that the custodian might be holding. The custodian also provides otherservices to the Pool including record keeping and processing of foreign exchange transactions. CIBC Mellon Trust Company is the custodian of the Pools (the Custodian). The fees and spreads for services of theCustodian directly related to the execution of portfolio transactions by a Pool, or a portion of a Pool, for which CAMI acts as portfolio advisor are paid by CAMI and/or dealer(s) directed by CAMI up to the amount of thecredits generated under soft dollar arrangements from trading on behalf of the Pool, or portion of the Pool, during that month. All other fees and spreads for the services of the Custodian are borne as an operatingexpense by the Pools. CIBC owns a 50 percent interest in the Custodian.
Service Provider
CIBC Mellon Global Securities Services Company (CIBC GSS) provides certain services to the Pools, including securities lending, fund accounting and reporting, and portfolio valuation. CIBC indirectly owns a 50percent interest in CIBC GSS. The dollar amount paid by the Pools (including all applicable taxes) to CIBC Mellon Trust Company for custodian fees (net of absorptions) and to CIBC GSS for securities lending, fundaccounting, reporting, and fund valuation (all net of absorptions) for the periods ended August 31, 2015 and 2014 is reported in footnote Service Provider on the Statements of Comprehensive Income.
10. Hedging
Certain foreign currency denominated positions have been hedged, or partially hedged, by forward foreign currency contracts as part of the investment strategies of the Pool. These hedges are indicated by a hedgingreference number on the Schedule of Investment Portfolio and a corresponding hedging reference number on the Forward Foreign Currency Contracts Schedule for the Pools.
11. Collateral on Specified Derivatives
Short-term investments may be used as collateral for futures contracts outstanding with brokers.
12. Transition to IFRS
The effect of the Pools’ transition to IFRS is summarized in this note as follows:
Transition Elections
The only voluntary exemption adopted by the Pools upon transition was the ability to designate a financial asset or financial liability at fair value through profit and loss upon transition to IFRS. All financial assetsdesignated at FVTPL upon transition (see Supplemental Schedule to Schedule of Investment Portfolio) were previously carried at fair value under Canadian GAAP as required by Accounting Guideline 18, InvestmentCompanies.
Statement of Cash Flows
Under Canadian GAAP, the Pools were exempt from providing a statement of cash flows. IAS 1 requires that a complete set of financial statements include Statements of Cash Flows for the current period andcomparative periods, without exception.
Classification of Redeemable Units Issued by the Pools
Under Canadian GAAP, the Pools accounted for their redeemable units as equity. Under IFRS, IAS 32 requires that units or shares of equity which include a contractual obligation for the issuer to repurchase or redeemthem for cash or another financial asset be classified as financial liability. The Pools’ units do not meet the criteria in IAS 32 for classification as equity and therefore, have been reclassified as financial liabilities ontransition to IFRS.
Revaluation of Investments at Fair Value Through Profit or Loss (FVTPL)
Under Canadian GAAP, the Pools measured the fair values of their investments in accordance with Section 3855, Financial Instruments – Recognition and Measurement, which required the use of bid prices for longpositions and ask prices for short positions; to the extent such prices are available. Under IFRS, the Pools measure the fair value of its investments using the guidance in IFRS 13, Fair Value Measurement (IFRS 13),which requires that if an asset or a liability has a bid price or an ask price, then its fair value is to be based on a price within the bid-ask spread that is most representative of fair value. It also allows the use ofmid-market pricing or other pricing conventions that are used by market participants as a practical expedient for fair value measurements within a bid-ask spread. As a result, upon adoption of IFRS an adjustment was
19

Notes to Financial Statements p / 7
recognized to increase the carrying amount of the Pools’ investments. The impact of this adjustment was to increase the Pools’ increase (decrease) in net assets attributable to holders of redeemable units fromoperations (excluding distributions). Further information regarding the revaluation adjustments is reported in footnote Reconciliation of Equity and Comprehensive Income as Previously Reported Under Canadian GAAPto IFRS on the Statements of Financial Position.
Reclassification Adjustments
Under IFRS, withholding taxes which were previously netted against foreign interest, foreign dividend and foreign securities lending income under Canadian GAAP have been reclassified and presented separately asexpense.x
20
INDEPENDENT AUDITORS’ REPORT
x
To the Unitholders ofxxxxxxxxx
xx
x..
Frontiers Canadian Short Term Income Pool..
Frontiers Canadian Fixed Income Pool..
Frontiers Equity Income Pool..
Frontiers Canadian Equity Pool..
Frontiers U.S. Equity Pool..
Frontiers U.S. Equity Currency Neutral Pool..
Frontiers International Equity Pool..
Frontiers Emerging Markets Equity Pool..
Frontiers Global Bond Pool..
..
(The “Pools”)xx
We have audited the accompanying financial statements of the Pools, which comprise the statements of financial position as at August 31, 2015 and 2014, and September 1, 2013, and the statements ofcomprehensive income, changes in net assets attributable to holders of redeemable units and cash flows for the years ended August 31, 2015 and 2014, and a summary of significant accounting policies and otherexplanatory information.
Management's responsibility for the financial statementsManagement is responsible for the preparation and fair presentation of these financial statements in accordance with International Financial Reporting Standards, and for such internal control as managementdetermines is necessary to enable the preparation of financial statements that are free from material misstatement, whether due to fraud or error.
Auditors’ responsibilityOur responsibility is to express an opinion on these financial statements based on our audits. We conducted our audits in accordance with Canadian generally accepted auditing standards. Those standards requirethat we comply with ethical requirements and plan and perform the audit to obtain reasonable assurance about whether the financial statements are free from material misstatement.
An audit involves performing procedures to obtain audit evidence about the amounts and disclosures in the financial statements. The procedures selected depend on the auditors’ judgment, including the assessmentof the risks of material misstatement of the financial statements, whether due to fraud or error. In making those risk assessments, the auditors consider internal control relevant to the Pools’ preparation and fairpresentation of the financial statements in order to design audit procedures that are appropriate in the circumstances, but not for the purpose of expressing an opinion on the effectiveness of the Pools’ internalcontrol. An audit also includes evaluating the appropriateness of accounting policies used and the reasonableness of accounting estimates made by management, as well as evaluating the overall presentation of thefinancial statements.
We believe that the audit evidence we have obtained in our audits is sufficient and appropriate to provide a basis for our audit opinion.
OpinionIn our opinion, the financial statements present fairly, in all material respects, the financial position of the Pools as at August 31, 2015 and 2014, and September 1, 2013, and their financial performance and their cashflows for the years ended August 31, 2015 and 2014 in accordance with International Financial Reporting Standards.
xxxxxxxx
Toronto, CanadaNovember 9, 2015
21
Renaissance Investments
1500 Robert-Bourassa Boulevard, Suite 800Montreal, Quebec
H3A 3S61-888-888-3863
Websiterenaissanceinvestments.ca
CIBC Asset Management Inc., the manager and trustee of the Frontiers Pools, is a wholly-owned subsidiary of Canadian Imperial Bank of Commerce. Please read the Frontiers Poolssimplified prospectus before investing. To obtain a copy of the simplified prospectus, call 1-888-888-3863, email us at [email protected], or ask your advisor.
® Frontiers is a registered trademark of Canadian Imperial Bank of Commerce.® Renaissance Investments is a registered trademark of CIBC Asset Management Inc.Renaissance Investments is offered by CIBC Asset Management Inc.
55-142 (201508)