Embed Size (px)
Citation preview
Frontier Oil Sands Mine Project
Responses to Fort McMurray Métis Local 1935 Statements of Concern Regarding the Project Update (Received January 2016)
April 2016
FRONTIER OIL SANDS MINE PROJECT TABLE OF CONTENTS
RESPONSES TO FMM SOCS – APRIL 2016 Page i
Table of Contents
List of Tables ................................................................................................................................ vii List of Figures ............................................................................................................................... vii List of Appendices ........................................................................................................................ vii Abbreviations ................................................................................................................................. ix 1 Introduction ............................................................................................................................... 1
1.1 Overview ..............................................................................................................................1 1.2 Approach and Format of SOC Responses ............................................................................2 1.3 FMM Technical Issues Table ...............................................................................................2
2 Key Themes ............................................................................................................................... 5 2.1 Adequacy of the Environmental Impact Assessment ...........................................................5
2.1.1 Assessment Methods and Completeness ................................................................6 2.1.2 Additional Baseline Data ........................................................................................8 2.1.3 Assessment Methodology .......................................................................................8 2.1.4 Conservatism...........................................................................................................9 2.1.5 Reversibility Criteria .............................................................................................10 2.1.6 Modelling Methods ...............................................................................................10 2.1.7 Additional Assessment Work ...............................................................................11 2.1.8 Appropriate Stage of Engineering ........................................................................11
2.2 Management, Mitigation and Monitoring ..........................................................................12 2.2.1 Project Definition Phase .......................................................................................14 2.2.2 Project Execution Planning Phase ........................................................................19 2.2.3 Implementation, Monitoring and Adaptive Management Phase ..........................20
2.3 Climate Change ..................................................................................................................22 2.3.1 Project Greenhouse Gas Emissions ......................................................................23 2.3.2 Potential Climate Change Effects on the Project ..................................................24 2.3.3 Incorporating Future Climate Scenarios ...............................................................24
2.4 Agreement and Regulator Requests ...................................................................................27 2.4.1 Agreement Requests .............................................................................................27 2.4.2 Regulator Requests ...............................................................................................28
3 SOC Responses ........................................................................................................................ 29 3.1 Introduction ........................................................................................................................29
SOC 1 ..............................................................................................................................29 SOC 2 ..............................................................................................................................30
3.2 Project Overview ................................................................................................................31 SOC 3 ..............................................................................................................................31 SOC 4 ..............................................................................................................................31 SOC 5 ..............................................................................................................................32 SOC 6 ..............................................................................................................................32 SOC 7 ..............................................................................................................................33

FRONTIER OIL SANDS MINE PROJECT TABLE OF CONTENTS
RESPONSES TO FMM SOCS – APRIL 2016 Page ii
SOC 8 ..............................................................................................................................33 3.3 Air .......................................................................................................................................37
SOC 9 ..............................................................................................................................37 SOC 10 ............................................................................................................................37 SOC 11 ............................................................................................................................38 SOC 12 ............................................................................................................................39 SOC 13 ............................................................................................................................40 SOC 14 ............................................................................................................................40 SOC 15 ............................................................................................................................41 SOC 16 ............................................................................................................................41 SOC 17 ............................................................................................................................42 SOC 18 ............................................................................................................................42 SOC 19 ............................................................................................................................43 SOC 20 ............................................................................................................................44 SOC 21 ............................................................................................................................44 SOC 22 ............................................................................................................................45 SOC 23 ............................................................................................................................45
3.4 Hydrogeology .....................................................................................................................46 SOC 24 ............................................................................................................................46 SOC 25 ............................................................................................................................47 SOC 26 ............................................................................................................................47 SOC 27 ............................................................................................................................48
3.5 Water Quality, Aquatics and Fish Habitat Offsetting Plans ...............................................49 SOC 28 ............................................................................................................................49 SOC 29 ............................................................................................................................50 SOC 30 ............................................................................................................................51 SOC 31 ............................................................................................................................52 SOC 32 ............................................................................................................................53 SOC 33 ............................................................................................................................53 SOC 34 ............................................................................................................................57 SOC 35 ............................................................................................................................57 SOC 36 ............................................................................................................................59 SOC 37 ............................................................................................................................61 SOC 38 ............................................................................................................................64 SOC 39 ............................................................................................................................65 SOC 40 ............................................................................................................................66 SOC 41 ............................................................................................................................66 SOC 42 ............................................................................................................................67 SOC 43 ............................................................................................................................67 SOC 44 ............................................................................................................................69 SOC 45 ............................................................................................................................72 SOC 46 ............................................................................................................................73

FRONTIER OIL SANDS MINE PROJECT TABLE OF CONTENTS
RESPONSES TO FMM SOCS – APRIL 2016 Page iii
SOC 47 ............................................................................................................................74 SOC 48 ............................................................................................................................74 SOC 49 ............................................................................................................................76 SOC 50 ............................................................................................................................76 SOC 51 ............................................................................................................................77 SOC 52 ............................................................................................................................78 SOC 53 ............................................................................................................................78 SOC 54 ............................................................................................................................79
3.6 Vegetation ..........................................................................................................................80 SOC 55 ............................................................................................................................80 SOC 56 ............................................................................................................................80 SOC 57 ............................................................................................................................81 SOC 58 ............................................................................................................................82 SOC 59 ............................................................................................................................82 SOC 60 ............................................................................................................................83 SOC 61 ............................................................................................................................83 SOC 62 ............................................................................................................................84 SOC 63 ............................................................................................................................84 SOC 64 ............................................................................................................................85 SOC 65 ............................................................................................................................85 SOC 66 ............................................................................................................................86 SOC 67 ............................................................................................................................86 SOC 68 ............................................................................................................................87 SOC 69 ............................................................................................................................87 SOC 70 ............................................................................................................................88 SOC 71 ............................................................................................................................88
3.7 Wildlife ...............................................................................................................................89 SOC 72 ............................................................................................................................89 SOC 73 ............................................................................................................................89 SOC 74 ............................................................................................................................90 SOC 75 ............................................................................................................................90 SOC 76 ............................................................................................................................91 SOC 77 ............................................................................................................................91 SOC 78 ............................................................................................................................92 SOC 79 ............................................................................................................................92 SOC 80 ............................................................................................................................93 SOC 81 ............................................................................................................................93 SOC 82 ............................................................................................................................94 SOC 83 ............................................................................................................................94 SOC 84 ............................................................................................................................95 SOC 85 ............................................................................................................................96 SOC 86 ............................................................................................................................96
FRONTIER OIL SANDS MINE PROJECT TABLE OF CONTENTS
RESPONSES TO FMM SOCS – APRIL 2016 Page iv
SOC 87 ............................................................................................................................97 SOC 88 ............................................................................................................................97 SOC 89 ............................................................................................................................98 SOC 90 ............................................................................................................................98 SOC 91 ............................................................................................................................99 SOC 92 ............................................................................................................................99 SOC 93 ..........................................................................................................................100 SOC 94 ..........................................................................................................................100 SOC 95 ..........................................................................................................................101 SOC 96 ..........................................................................................................................101 SOC 97 ..........................................................................................................................102 SOC 98 ..........................................................................................................................102 SOC 99 ..........................................................................................................................103 SOC 100 ........................................................................................................................103 SOC 101 ........................................................................................................................104 SOC 102 ........................................................................................................................104 SOC 103 ........................................................................................................................105 SOC 104 ........................................................................................................................105 SOC 105 ........................................................................................................................106 SOC 106 ........................................................................................................................107 SOC 107 ........................................................................................................................108 SOC 108 ........................................................................................................................108 SOC 109 ........................................................................................................................109 SOC 110 ........................................................................................................................110 SOC 111 ........................................................................................................................110 SOC 112 ........................................................................................................................111 SOC 113 ........................................................................................................................112
3.8 Biodiversity ......................................................................................................................113 SOC 114 ........................................................................................................................113 SOC 115 ........................................................................................................................113 SOC 116 ........................................................................................................................114 SOC 117 ........................................................................................................................114 SOC 118 ........................................................................................................................115 SOC 119 ........................................................................................................................116 SOC 120 ........................................................................................................................116 SOC 121 ........................................................................................................................117 SOC 122 ........................................................................................................................117 SOC 123 ........................................................................................................................118 SOC 124 ........................................................................................................................118 SOC 125 ........................................................................................................................119 SOC 126 ........................................................................................................................119 SOC 127 ........................................................................................................................120
FRONTIER OIL SANDS MINE PROJECT TABLE OF CONTENTS
RESPONSES TO FMM SOCS – APRIL 2016 Page v
3.9 Closure, Conservation and Reclamation Plan ..................................................................121 SOC 128 ........................................................................................................................121 SOC 129 ........................................................................................................................122 SOC 130 ........................................................................................................................122 SOC 131 ........................................................................................................................123 SOC 132 ........................................................................................................................123 SOC 133 ........................................................................................................................124 SOC 134 ........................................................................................................................125 SOC 135 ........................................................................................................................127 SOC 136 ........................................................................................................................127 SOC 137 ........................................................................................................................128 SOC 138 ........................................................................................................................128 SOC 139 ........................................................................................................................129 SOC 140 ........................................................................................................................129 SOC 141 ........................................................................................................................130 SOC 142 ........................................................................................................................130 SOC 143 ........................................................................................................................131 SOC 144 ........................................................................................................................131 SOC 145 ........................................................................................................................132 SOC 146 ........................................................................................................................132 SOC 147 ........................................................................................................................133 SOC 148 ........................................................................................................................133 SOC 149 ........................................................................................................................134
3.10 Traditional Land Use and Knowledge ............................................................................135 SOC 150 ........................................................................................................................135 SOC 151 ........................................................................................................................135 SOC 152 ........................................................................................................................136 SOC 153 ........................................................................................................................136 SOC 154 ........................................................................................................................137 SOC 155 ........................................................................................................................137 SOC 156 ........................................................................................................................138 SOC 157 ........................................................................................................................138 SOC 158 ........................................................................................................................139 SOC 159 ........................................................................................................................139 SOC 160 ........................................................................................................................140 SOC 161 ........................................................................................................................140 SOC 162 ........................................................................................................................141 SOC 163 ........................................................................................................................142 SOC 164 ........................................................................................................................142 SOC 165 ........................................................................................................................143 SOC 166 ........................................................................................................................143

FRONTIER OIL SANDS MINE PROJECT TABLE OF CONTENTS
RESPONSES TO FMM SOCS – APRIL 2016 Page vi
3.11 Historical Resources .......................................................................................................144 SOC 167 ........................................................................................................................144 SOC 168 ........................................................................................................................144
3.12 Socio-economic Impacts ................................................................................................146 SOC 169 ........................................................................................................................146 SOC 170 ........................................................................................................................146 SOC 171 ........................................................................................................................147 SOC 172 ........................................................................................................................147 SOC 173 ........................................................................................................................148 SOC 174 ........................................................................................................................148 SOC 175 ........................................................................................................................149 SOC 176 ........................................................................................................................149 SOC 177 ........................................................................................................................150 SOC 178 ........................................................................................................................150 SOC 179 ........................................................................................................................151 SOC 180 ........................................................................................................................151 SOC 181 ........................................................................................................................152 SOC 182 ........................................................................................................................152 SOC 183 ........................................................................................................................153 SOC 184 ........................................................................................................................153 SOC 185 ........................................................................................................................154 SOC 186 ........................................................................................................................154 SOC 187 ........................................................................................................................155
3.13 Métis Consultation .........................................................................................................156 SOC 188 ........................................................................................................................156 SOC 189 ........................................................................................................................156
3.14 Cumulative Effects Analysis and Access Management .................................................157 SOC 190 ........................................................................................................................157 SOC 191 ........................................................................................................................157 SOC 192 ........................................................................................................................158 SOC 193 ........................................................................................................................158 SOC 194 ........................................................................................................................159 SOC 195 ........................................................................................................................159 SOC 196 ........................................................................................................................160 SOC 197 ........................................................................................................................160 SOC 198 ........................................................................................................................161 SOC 199 ........................................................................................................................161 SOC 200 ........................................................................................................................162
4 Closing .................................................................................................................................... 163
FRONTIER OIL SANDS MINE PROJECT TABLE OF CONTENTS
RESPONSES TO FMM SOCS – APRIL 2016 Page vii
List of Tables
Table 1-1 FMM Technical Issues Table – Structure and Content Description .....................3 Table 2-1 Key Themes ..........................................................................................................5 Table 2-2 Phased Development of Project Management, Mitigation and
Monitoring Plans and Programs..........................................................................13 Table 2-3 Influence of Regulatory and Community Engagement Processes on
Project Plans to Date ...........................................................................................16 Table 8-1 Management, Mitigation and Monitoring for Community Effects .....................34 Table 8-2 Processes, Policies and Programs to Increase Local Labour ..............................35 Table 33-1 Reach Characteristics of Lower Redclay Creek .................................................55 Table 132-1 Reclamation Material Salvage Depth ...............................................................124
List of Figures
Figure 2-1 Planning Schedule for the Frontier Oil Sands Mine Project ...............................15 Figure 33-1 Cross-Section of the Diversion Channel .............................................................56 Figure 48-1 General Site Layout with Waterways, Diversions and FHCL ............................75
List of Appendices
Appendix 136.1 Requested Reference – CONRAD and DFO (2008)

FRONTIER OIL SANDS MINE PROJECT TABLE OF CONTENTS
RESPONSES TO FMM SOCS – APRIL 2016 Page viii
FRONTIER OIL SANDS MINE PROJECT ABBREVIATIONS
RESPONSES TO FMM SOCS – APRIL 2016 Page ix
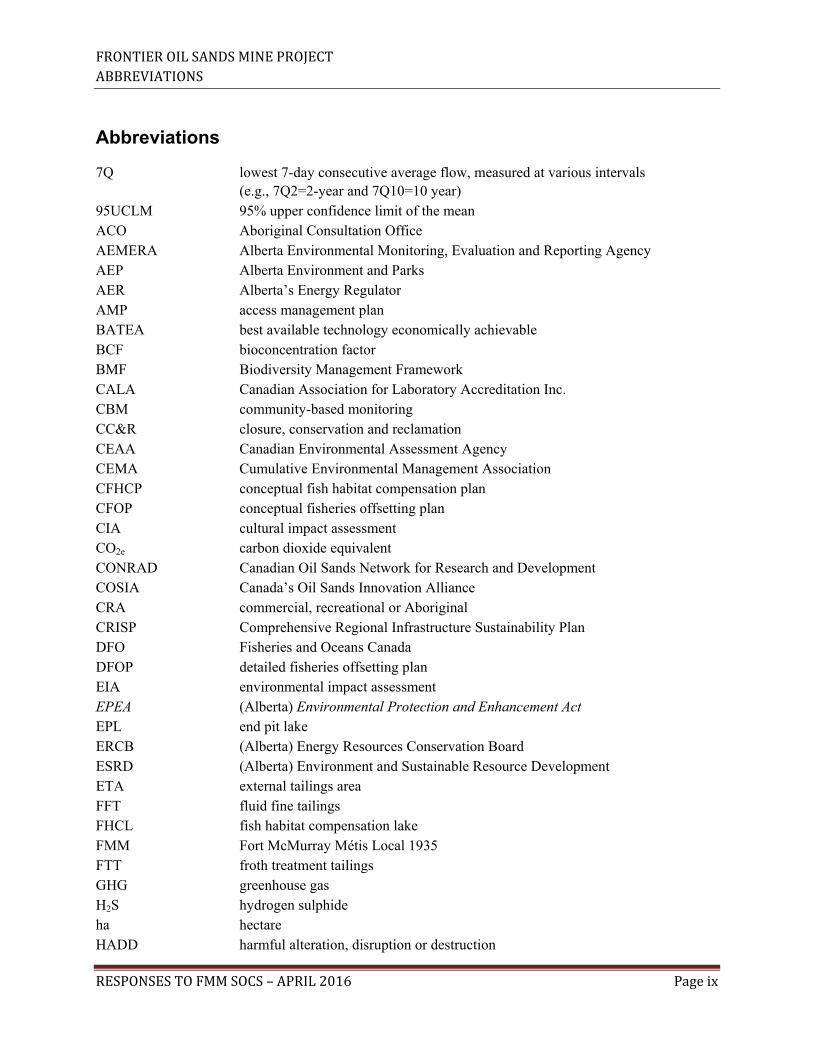
Abbreviations
7Q lowest 7-day consecutive average flow, measured at various intervals (e.g., 7Q2=2-year and 7Q10=10 year)
95UCLM 95% upper confidence limit of the mean ACO Aboriginal Consultation Office AEMERA Alberta Environmental Monitoring, Evaluation and Reporting Agency AEP Alberta Environment and Parks AER Alberta’s Energy Regulator AMP access management plan BATEA best available technology economically achievable BCF bioconcentration factor BMF Biodiversity Management Framework CALA Canadian Association for Laboratory Accreditation Inc. CBM community-based monitoring CC&R closure, conservation and reclamation CEAA Canadian Environmental Assessment Agency CEMA Cumulative Environmental Management Association CFHCP conceptual fish habitat compensation plan CFOP conceptual fisheries offsetting plan CIA cultural impact assessment CO2e carbon dioxide equivalent CONRAD Canadian Oil Sands Network for Research and Development COSIA Canada’s Oil Sands Innovation Alliance CRA commercial, recreational or Aboriginal CRISP Comprehensive Regional Infrastructure Sustainability Plan DFO Fisheries and Oceans Canada DFOP detailed fisheries offsetting plan EIA environmental impact assessment EPEA (Alberta) Environmental Protection and Enhancement Act EPL end pit lake ERCB (Alberta) Energy Resources Conservation Board ESRD (Alberta) Environment and Sustainable Resource Development ETA external tailings area FFT fluid fine tailings FHCL fish habitat compensation lake FMM Fort McMurray Métis Local 1935 FTT froth treatment tailings GHG greenhouse gas H2S hydrogen sulphide ha hectare HADD harmful alteration, disruption or destruction
FRONTIER OIL SANDS MINE PROJECT ABBREVIATIONS
RESPONSES TO FMM SOCS – APRIL 2016 Page x
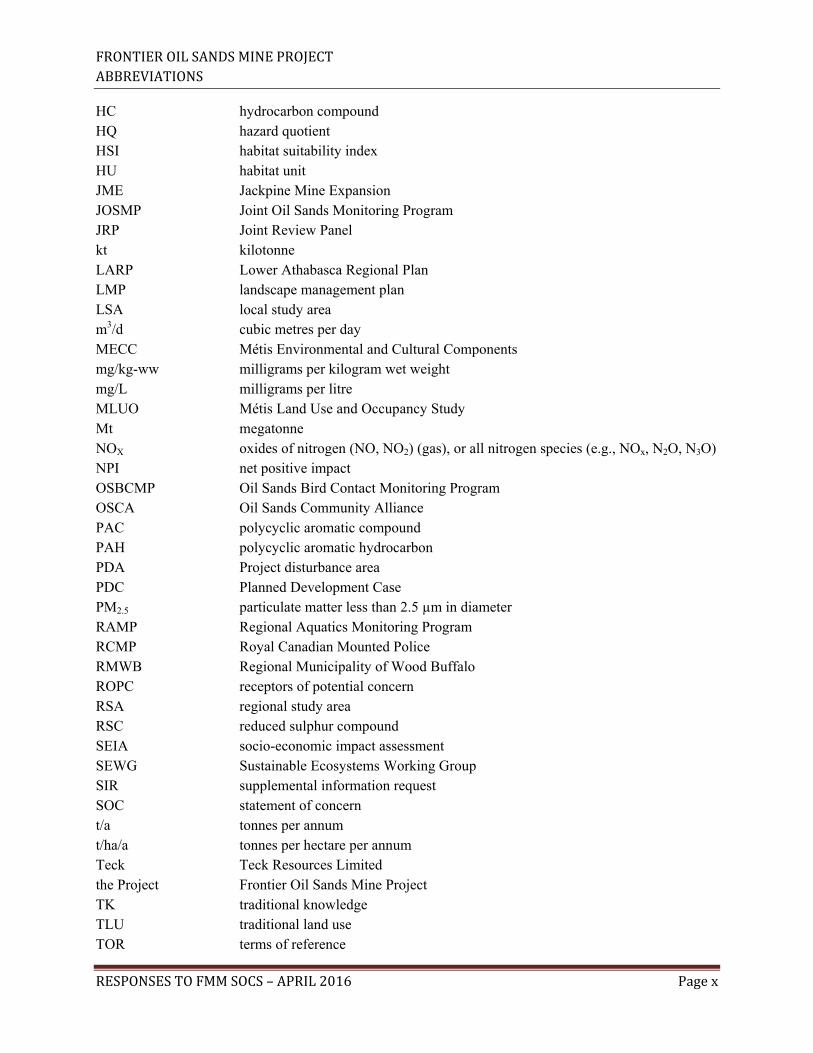
HC hydrocarbon compound HQ hazard quotient HSI habitat suitability index HU habitat unit JME Jackpine Mine Expansion JOSMP Joint Oil Sands Monitoring Program JRP Joint Review Panel kt kilotonne LARP Lower Athabasca Regional Plan LMP landscape management plan LSA local study area m3/d cubic metres per day MECC Métis Environmental and Cultural Components mg/kg-ww milligrams per kilogram wet weight mg/L milligrams per litre MLUO Métis Land Use and Occupancy Study Mt megatonne NOX oxides of nitrogen (NO, NO2) (gas), or all nitrogen species (e.g., NOx, N2O, N3O) NPI net positive impact OSBCMP Oil Sands Bird Contact Monitoring Program OSCA Oil Sands Community Alliance PAC polycyclic aromatic compound PAH polycyclic aromatic hydrocarbon PDA Project disturbance area PDC Planned Development Case PM2.5 particulate matter less than 2.5 µm in diameter RAMP Regional Aquatics Monitoring Program RCMP Royal Canadian Mounted Police RMWB Regional Municipality of Wood Buffalo ROPC receptors of potential concern RSA regional study area RSC reduced sulphur compound SEIA socio-economic impact assessment SEWG Sustainable Ecosystems Working Group SIR supplemental information request SOC statement of concern t/a tonnes per annum t/ha/a tonnes per hectare per annum Teck Teck Resources Limited the Project Frontier Oil Sands Mine Project TK traditional knowledge TLU traditional land use TOR terms of reference

FRONTIER OIL SANDS MINE PROJECT ABBREVIATIONS
RESPONSES TO FMM SOCS – APRIL 2016 Page xi
TRG tissue residue guideline TRS total reduced sulphur VOC volatile organic compound WBEA Wood Buffalo Environmental Association WHEC Wildlife Habitat Effectiveness and Connectivity WHRA wildlife health risk assessment WMMP wildlife mitigation and monitoring plan ZOI zone of influence

FRONTIER OIL SANDS MINE PROJECT 1 INTRODUCTION
RESPONSES TO FMM SOCS – APRIL 2016 Page 1
1 Introduction
1.1 Overview
In 2011, Teck Resources Limited (Teck) submitted an Integrated Application to the
Energy Resources Conservation Board (ERCB) and Alberta Environment and
Sustainable Resource Development (ESRD) for the Frontier Oil Sands Mine Project (the
Project). The Project was referred to a federal review panel in 2012. Federal and
provincial reviewers subsequently provided four rounds of supplemental information
requests (SIRs) prior to Teck filing a Project Update in June 2015.
Fort McMurray Métis Local 1935 (FMM) provided Alberta Environment and Sustainable
Resources Development a statement of concern regarding the Project in April 2013. Teck
responded to the April 2013 SOC on May 3, 2013. Subsequently, FMM provided
comments on Teck’s response to Round 2 SIRs (December 16, 2013), to which Teck
responded on February 11, 2014. Similarly, FMM provided comments on Teck’s
response to Round 3 SIRs (November 24, 2014), to which Teck responded on January 16,
2015. Most recently, at the request of FMM, Teck funded a technical review of the
Project Update. This latest review, dated December 2015, was received by Teck in
January 2016 and is responded to here. Technical reviews, concerns and requests for
information submitted by FMM are collectively referred to here as statements of concern
(SOCs).
Teck recognizes that responding to a concern is not the same as addressing or resolving
it. As stated throughout the regulatory process, Teck has carefully considered and
incorporated feedback from FMM into Project planning and into the environmental
impact assessment (EIA). This was done within Project needs and constraints and while
meeting the provincial terms of reference and federal requirements for the Project. Teck
remains committed to continue working through outstanding issues with FMM.
Teck is confident that this response package is complete and provides an appropriate
level of detail in response to the FMM December 2015 SOCs (see Section 3). As part of
this submission, Teck has also provided a technical issues table (see Section 1.3). The
approach and format of Teck’s responses, and the key elements of this submission, are
summarized below.
FRONTIER OIL SANDS MINE PROJECT 1 INTRODUCTION
RESPONSES TO FMM SOCS – APRIL 2016 Page 2
1.2 Approach and Format of SOC Responses
During its review of the December 2015 SOCs, Teck identified overarching themes.
These ‘key themes’ are described in Section 2 and provide an opportunity to discuss
related concerns. The key theme responses provide a basis from which to facilitate and
focus future discussions with FMM. Where an issue does not align with a key theme, or
requires a technical explanation, a separate and specific response to the SOC is provided
in Section 3.
Teck’s responses to the December 2015 SOCs are compiled and summarized in a FMM
technical issues table, which uses the same format as the technical issues table provided
in Volume 1, Appendix 17A of the Project Update. The technical issues table can be
sorted and filtered by discipline and theme and concords similar issues. Teck’s intent in
providing this table is to work through these SOCs with FMM to reach mutually
satisfying outcomes. Teck trusts that providing responses in this manner will best support
efforts to resolve SOCs.
1.3 FMM Technical Issues Table
The technical issues table is an Excel workbook that has two worksheets:
• Legend and User Guide – Provides information to assist users in navigating the
table and sorting information in a manner that meets specific needs and interests.
• 2015 SOCs – Identifies SOCs in the December 2015 SOC package and cross-
references Teck’s responses.
The workbook has a format that is largely consistent with the format of the technical
issues table provided in Volume 1, Appendix 17A of the Project Update. The only
exception is that the updated table includes two additional columns that make it easier to
locate FMM concerns and the corresponding SOC responses. Table 1-1 illustrates the
format of the technical issues table with the new columns and titles highlighted
in bold text.

FRONTIER OIL SANDS MINE PROJECT 1 INTRODUCTION
RESPONSES TO FMM SOCS – APRIL 2016 Page 3
Table 1-1 FMM Technical Issues Table – Structure and Content Description
COLUMN A COLUMN B COLUMN C COLUMN D COLUMN E COLUMN F COLUMN G COLUMN H COLUMN I
SOC Date Source Document or Consultant
TECK Assigned SOC No.
Discipline Theme(s) Type of Concern
Relates to SIR (Round and #) and SOC from 2012
SOC Text Location of Teck Response
Month and Year of SOC (e.g., F2013 = February 2013)1
Source of FMM SOC1
Teck sequential numbering of SOCs
Primary technical discipline
Themes are used to describe and categorize issues. These are different than Key Themes
Types of concern include: information requests, methodology, mitigation, monitoring, and impacts
SIRs that correspond with an SOC are provided here, if identified
Copied from the FMM submission
Location of Teck’s response to the SOC
NOTE: 1 See legend and user guide in the FMM technical issues table for all SOC abbreviations.
To manage the size and usability of the technical issues table, the table references the location of Teck’s response but does not
include the response. Column I (“Location of Teck Response”) directs the reader to one of the following:
• Section 2 of this document, which includes all key theme responses to SOCs
• Section 3 of this document, which includes all individual responses to SOCs

FRONTIER OIL SANDS MINE PROJECT 1 INTRODUCTION
RESPONSES TO FMM SOCS – APRIL 2016 Page 4
FRONTIER OIL SANDS MINE PROJECT 2 KEY THEMES
RESPONSES TO FMM SOCS – APRIL 2016 Page 5
2 Key Themes
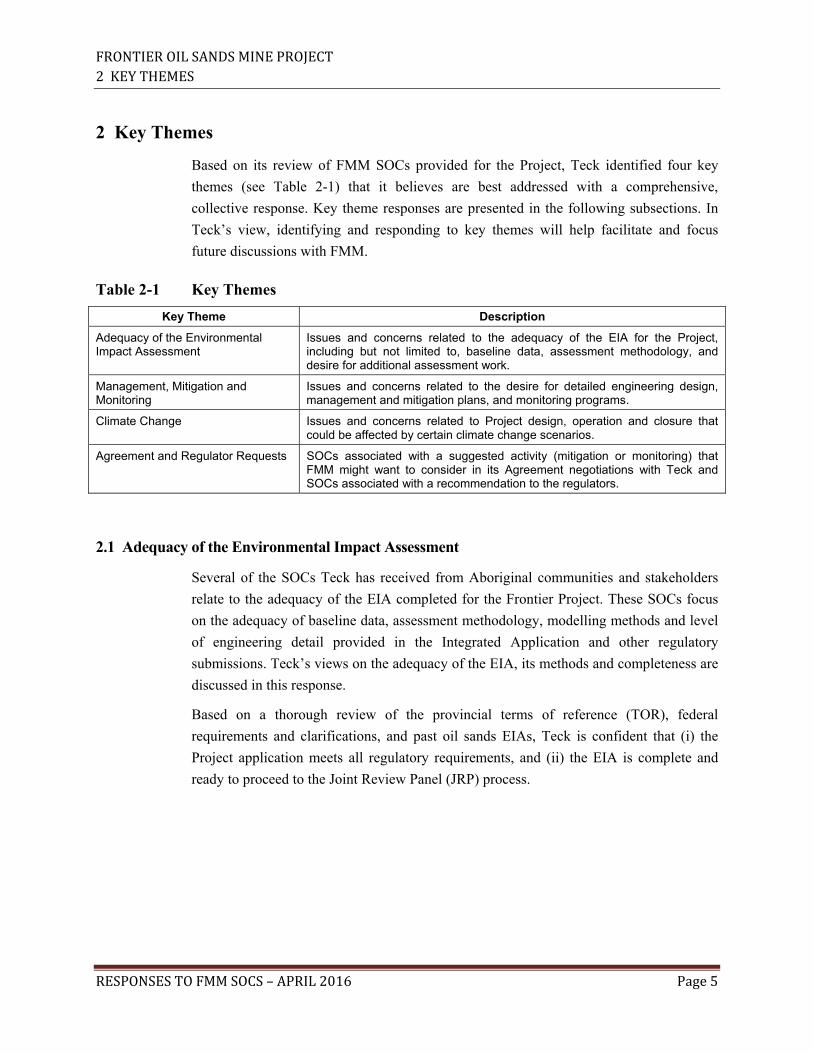
Based on its review of FMM SOCs provided for the Project, Teck identified four key
themes (see Table 2-1) that it believes are best addressed with a comprehensive,
collective response. Key theme responses are presented in the following subsections. In
Teck’s view, identifying and responding to key themes will help facilitate and focus
future discussions with FMM.
Table 2-1 Key Themes
Key Theme Description
Adequacy of the Environmental Impact Assessment
Issues and concerns related to the adequacy of the EIA for the Project, including but not limited to, baseline data, assessment methodology, and desire for additional assessment work.
Management, Mitigation and Monitoring
Issues and concerns related to the desire for detailed engineering design, management and mitigation plans, and monitoring programs.
Climate Change Issues and concerns related to Project design, operation and closure that could be affected by certain climate change scenarios.
Agreement and Regulator Requests SOCs associated with a suggested activity (mitigation or monitoring) that FMM might want to consider in its Agreement negotiations with Teck and SOCs associated with a recommendation to the regulators.
2.1 Adequacy of the Environmental Impact Assessment
Several of the SOCs Teck has received from Aboriginal communities and stakeholders
relate to the adequacy of the EIA completed for the Frontier Project. These SOCs focus
on the adequacy of baseline data, assessment methodology, modelling methods and level
of engineering detail provided in the Integrated Application and other regulatory
submissions. Teck’s views on the adequacy of the EIA, its methods and completeness are
discussed in this response.
Based on a thorough review of the provincial terms of reference (TOR), federal
requirements and clarifications, and past oil sands EIAs, Teck is confident that (i) the
Project application meets all regulatory requirements, and (ii) the EIA is complete and
ready to proceed to the Joint Review Panel (JRP) process.

FRONTIER OIL SANDS MINE PROJECT 2 KEY THEMES
RESPONSES TO FMM SOCS – APRIL 2016 Page 6
Teck’s application for the Project is based on an appropriate level of engineering at this
stage of the development, and it reflects relevant regulations and reference documents. In
preparing its application, Teck:
• adhered to the provincial TOR, the federal requirements and clarifications, relevant
legislation, policies, regulations and directives
• considered technical guidance documents, applicable environmental criteria
(including guidelines, thresholds and objectives), industry best practice documents,
regional environmental frameworks, past oil sands applications, and information and
preferences gathered through consultation with potentially affected Aboriginal
communities and stakeholders
Teck is confident that the quantity and quality of baseline data collected to inform the
Integrated Application and Project Update is sufficient to meet provincial TOR
requirements, support the EIA, and provide regulators, Aboriginal communities and
stakeholders with adequate and appropriate information about current and expected
environmental and socio-economic conditions in the Project area and region.
The assessment methods used in the Integrated Application and Project Update provide
appropriate and robust EIA findings. Further assessment work beyond what has been
included in the Integrated Application, Project Update, five rounds of SIRs and these
current SOC responses would not substantially assist or improve the assessment or
understanding of the Project, nor would it yield substantially different conclusions. Any
remaining differences of opinion about assessment methods, the scope or adequacy of
data collected in support of the Project, or other concerns about the assessment’s
completeness should be discussed within the JRP process.
2.1.1 Assessment Methods and Completeness
As indicated, many of the SOCs Teck has received relate to the adequacy of the EIA
conducted for the Project and the completeness of Teck’s responses to SIRs. Where
possible and appropriate, Teck has provided clarification and additional information in its
response to specific concerns and information requests (see Section 3). However, some
SOCs that question the adequacy of the EIA reflect differences of professional opinion or
preferred assessment methods. Other SOCs are inconsistent with regulatory guidance or
standard practice for oil sands EIAs. Teck will continue to work with Aboriginal
communities and stakeholders to better understand their perspectives; however, Teck is
confident that all TOR requirements have been adequately met and that the EIA is
complete.
FRONTIER OIL SANDS MINE PROJECT 2 KEY THEMES
RESPONSES TO FMM SOCS – APRIL 2016 Page 7
Teck considered a large quantity of reference documents in developing its EIA approach.
It also incorporated important information from local and diverse sources such as:
• traditional knowledge
• environmental data from the oil sands region
• recent and relevant scientific literature
• input and advice from initial and ongoing engagement with regulators, Aboriginal
communities and stakeholders
The Project Update further enhanced the thoroughness of the assessment because it
incorporated additional baseline data, emerging science, new regulations, and additional
traditional knowledge. For a complete list of reference documents considered in
developing the EIA approach and methods, see the list of references provided at the end
of each assessment section in the Project Update.
Among the many reference documents Teck reviewed and considered were regulatory
applications and hearing transcripts for other developments in the region. Previous EIAs
and JRP decision reports provided valuable insight into the type of information needed
and the level of effects analysis regulators require to be able to determine whether the
Project is likely to cause significant adverse environmental effects, understand the
benefits of the Project, and ultimately decide whether it is in the public interest. Teck also
sought early federal involvement in the review process to provide federal regulators with
the opportunity to participate in the review process from the first Project filing.
Since detailed, project-specific guidance is not available for all aspects of an EIA,
practitioners must apply judgement based on best available information and professional
opinion. Teck has assembled a credible and experienced technical team that has
completed an appropriate and robust EIA for the Project. Teck’s team of consulting
professionals has been involved in nearly every oil sands mine application approved in
Alberta in the past 15 years, which brings a depth of experience and knowledge on key
issues and regional concerns. This level of consultant expertise is supported by Teck’s
more than 100 years mining history and global experience completing EIAs for mining
developments in various jurisdictions and environmental settings since this type of
assessment has been required. Based on all these factors, Teck’s technical team is
eminently qualified to provide professional judgement as needed to support the effects
analysis and conclusions provided in the Integrated Application and Project Update.
FRONTIER OIL SANDS MINE PROJECT 2 KEY THEMES
RESPONSES TO FMM SOCS – APRIL 2016 Page 8
2.1.2 Additional Baseline Data
Teck has received a number of requests for additional (or different) baseline data,
including toxicity data, snow survey data, soil inspection points, noise monitoring, socio-
economic data, and invertebrate data. Teck has carefully evaluated each of these requests
and considered the benefit of gathering additional information against the effort, cost and
perceived value of this information. At this stage of the process, additional data gathering
is warranted only if it would improve the application or add environmental value.
Based on this evaluation, additional baseline surveys were conducted after the Integrated
Application was filed and this information was used to inform the Project Update. The
Project Update also incorporated, where possible, information from traditional land use
and knowledge studies that were provided to Teck after the Integrated Application was
filed.
Overall, the body of site-specific environmental data collected since 2008 to support
Teck’s Application for the Project is more than what has been done for other approved
applications in the oil sands region. The quantity and quality of baseline data collected to
inform the EIA for the Project (as submitted in the Integrated Application and Project
Update) meets or exceeds the TOR requirements. Accordingly, Teck’s view is that
additional baseline data is not required to complete the EIA.
Teck understands that some reviewers have an alternate opinion about the adequacy of
the baseline data collected for the EIA, and Teck respects the right of reviewers to offer
opinion on scope and methodology of baseline data collection. Teck will discuss
opportunities for preconstruction baseline monitoring with Aboriginal communities and
stakeholders and will consider monitoring activities that are important to them. However,
it is ultimately the responsibility of Alberta’s Energy Regulator (AER) to determine
whether the EIA is complete, and the role of the JRP to determine, on the basis of the
evidence and argument, whether the assessment methods used by Teck are appropriate.
2.1.3 Assessment Methodology
Some SOCs regarding the Project Update and Teck’s SIR responses express concern
about conservatism and how it relates to the assessment, concerns about reversibility, and
differences of opinion related to assessment assumptions, modelling, issue screening,
statistical analysis and parameter selection. It is Teck’s position that the assessment
methods selected for the Integrated Application and Project Update are appropriate and
provide robust EIA conclusions that regulators can rely on to make decisions, and that
support consultation and engagement with Aboriginal communities about potential
Project effects.

FRONTIER OIL SANDS MINE PROJECT 2 KEY THEMES
RESPONSES TO FMM SOCS – APRIL 2016 Page 9
As indicated, the EIA methods were selected to meet the TOR for the Project and
considered relevant reference documents. Since detailed, project-specific guidance is not
available for all aspects of an EIA, practitioners applied judgement based on available
science and professional opinion as is common practice. When selecting assessment
methods, the practitioners balance a number of factors to make a final selection,
including regulatory requirements, scientific rigor, regulator acceptance, stakeholder
input, data availability, practicality and regulatory precedence. It is ultimately the
responsibility of AER to determine whether the EIA is complete, and the role of the JRP
to determine, on the basis of the evidence and argument, whether the assessment methods
used by Teck are appropriate.
2.1.4 Conservatism
Teck has received SOCs that request that modelling methods be revised to remove
excessive conservatism. These requests are based on Teck occasionally identifying that
predicted guideline exceedances are due to conservativeness inherent in the assessment
that can be verified as being conservative by operational monitoring. On this basis, Teck
justifies that the exceedance is not a concern requiring mitigation. Teck recognizes that
there are some disadvantages in overpredicting potential environmental effects; however,
it believes that these consequences are outweighed by the benefits—so long as
assumptions and reasons for the conservatism are clearly stated and understood. Teck has
identified where the EIA is conservative and has provided the appropriate rationale. The
level of conservatism built into each aspect of the EIA was set according to the certainty
in the modelling approach and input data used in the assessment, so that predictions were
not underestimated.
Conversely, several SOCs request that modelling methods be revised to increase
conservativeness. These requests stem from concerns that Teck has not adequately
considered possible adverse outcomes because (i) generic criteria have not been
considered, or (ii) insufficient safety factors have been applied. It is Teck’s position that
the EIA is appropriately conservative because it was informed by guidance documents
and the opinion of experienced professionals (see Section 2.1.1). On balance, some SOCs
request that Teck remove conservativeness and others add conservativeness. Teck
believes the assessment achieved the right balance between the two.
Teck believes that the EIA provides an appropriately conservative assessment of possible
effects and does not intend to reassess conservatism built into models. However, as part
of planning for post-approval monitoring, Teck will identify opportunities to verify and
refine predictions. For additional information about management, mitigation and
monitoring plans for the Project, see Key Theme – Management, Mitigation and
Monitoring (Section 2.2).
FRONTIER OIL SANDS MINE PROJECT 2 KEY THEMES
RESPONSES TO FMM SOCS – APRIL 2016 Page 10
2.1.5 Reversibility Criteria
Reversibility is a key criterion required under federal EIA guidance, and several SOCs
focus on reversibility criteria for the effects classification. The approach to reversibility
used in the EIA is similar to proven methods used in previous EIAs in the region,
including those used for existing oil sands mines approved through a JRP process.
Concerns about reversibility tend to focus on (i) whether environmental components are
truly reversible, and (ii) whether effects are likely to be reversed in the timelines
considered by the EIA.
Teck has acknowledged these concerns by conservatively considering a predevelopment
reference condition and by not considering reclamation in prediction outcomes in the
traditional land use assessment. Although Teck considers this approach overly
conservative (see Section 2.1.4), it opted to use this approach in the effects assessment
because it reflects Aboriginal community preferences.
Teck has a successful track record and has received widespread recognition regarding its
ability to reverse the effects of mining at historic and operating properties. As such, Teck
is confident that equivalent land capability will be established when mining is complete.
Through its adaptive management process, Teck will monitor mitigation success and the
progress of reversible components. This process will enable Teck to adjust mitigation
based on observed conditions and evolving societal preferences. For more information
about Teck’s adaptive management process, see Section 2.2.
2.1.6 Modelling Methods
Several SOCs focus on modelling approaches for the EIA and request changes such as:
• additional modifications to model assumptions
• further model validation
• revised screening procedures
• additional statistical analysis
• inclusion of more chemical parameters beyond that provided in the Project Update
Teck considers these SOCs differences of professional opinion regarding assessment
methods. Nonetheless, it has carefully reviewed each request and maintains that the
assessment methods selected for the EIA are the appropriate technical approach to
address the requirements of the TOR.
Teck understands that some reviewers have an alternate opinion, and Teck respects the
right of reviewers to offer opinion on methodology. It is ultimately the responsibility of
AER to determine whether the EIA is complete, and the role of the JRP to determine, on
FRONTIER OIL SANDS MINE PROJECT 2 KEY THEMES
RESPONSES TO FMM SOCS – APRIL 2016 Page 11
the basis of the evidence and argument, whether the assessment methods used by Teck
are appropriate. Based on the outcome of past JRP hearings, Teck anticipates that model
validation may be a condition of approval in instances where uncertainty remains.
2.1.7 Additional Assessment Work
Generally, requests for additional assessment work seek further assessment of specific
technical areas or additional geographic areas. Teck’s view is that the EIA and additional
supporting information provided for the Project application are adequate, and that further
assessment work beyond what has been included in the Integrated Application, Project
Update, five rounds of SIRs and these current SOCs is not required.
Teck recognizes that discussion and debate are important part of the regulatory process,
and has considered input and advice provided through ongoing engagement with
regulators, Aboriginal communities and stakeholders. Based on this and the extensive
information included in EIA and Teck’s regulatory application for the Project, Teck is of
the opinion that all contentious items have been identified, discussed and assessed to an
appropriate extent. There is a practical need for any remaining discussion to proceed via
the JRP process where it can be explored and decided upon in a timely manner.
Teck has received several SOCs that request additional or alternate assessment work
related to predevelopment or existing conditions. Examples include:
• further discussion and definition of these conditions
• development of a socio-economic predevelopment condition
• requests for additional health risk assessment work related to these conditions
Teck notes that the TOR does not require assessment of predevelopment and existing
conditions. These temporal snapshots were included to provide context for the mandatory
assessment cases (i.e., Base Case, Application Case and Planned Development Case) and
in response to community preferences. Teck’s view is that adequate and appropriate
information for predevelopment and existing conditions is included in the existing
assessment work for the Project.
2.1.8 Appropriate Stage of Engineering
Some SOCs request information that is typically and most logically provided during
future stages of engineering. Examples include groundwater seepage control system
design, detailed tailings pond emission profiles, expected changes in solvent quality over
time, aircraft flight schedules and bridge design details. The EIA is based on two full
cycles of prefeasibility engineering (i.e., one for the Integrated Application and one for
the Project Update), which is greater than what has typically been done for other oil sands
FRONTIER OIL SANDS MINE PROJECT 2 KEY THEMES
RESPONSES TO FMM SOCS – APRIL 2016 Page 12
mine applications in Alberta. Teck intends to complete additional engineering studies;
however, this work should be done after the Project receives the anticipated regulatory
approvals.
Similarly, several SOCs request more detailed modelling of mitigation systems and their
performance. Examples include the groundwater interception system, mitigation for karst
features, drawdown effects, and dyke failure scenarios. Teck has reviewed these requests
and concluded that more detailed modelling will not provide better or different results
than what is presented in the Project Update. EIA predictions reasonably represent what
future conditions will be. Future monitoring requirements are expected to be a condition
of the anticipated approval for the Project, and will test the effectiveness of planned
mitigation. In the unlikely event that monitoring identifies that a particular mitigation
measure is not as effective as predicted, Teck’s adaptive management plan will guide
appropriate action. For details on Teck’s monitoring and adaptive management plans, see
Key Theme – Management, Mitigation and Monitoring (Section 2.2).
2.2 Management, Mitigation and Monitoring
Several of the SOCs Teck has received from Aboriginal communities and stakeholders
relate to management, mitigation and monitoring identified for the Project. Some SOCs
request additional Project detail, primarily detailed engineering designs, management and
mitigation plans and monitoring programs. Teck’s view on these requests and the
proposed evolution of these plans and programs throughout the development and
operation of the Project are discussed in this response.
Based on a thorough review of the provincial TOR, federal requirements and
clarifications, and past oil sands EIAs, Teck is confident that the Project application
meets all regulatory requirements and the Project EIA is complete and ready to proceed
to the JRP process (see Section 2.1). Teck understands and appreciates the interest in
detailed engineering designs, management and mitigation plans and monitoring
programs; however, Teck’s view is that the Project Application is based on an
appropriate level of engineering that describes a project that can realistically be built (see
Volume 1, Section 12.3 of the Project Update). The information provided to date is
appropriate for proposed development projects seeking regulatory approval.
Although the need for various management (e.g., emissions management, water
management, tailings management) and mitigation (e.g., conceptual closure, conservation
and reclamation plan, conceptual fisheries offsetting plan, wildlife mitigation and
monitoring plan) plans and monitoring programs has been identified within the Project
Application, detailed plans and programs need not be finalized at this stage of the Project.
These plans and programs will be developed in further detail, subject to further

FRONTIER OIL SANDS MINE PROJECT 2 KEY THEMES
RESPONSES TO FMM SOCS – APRIL 2016 Page 13
engagement with Aboriginal communities, regulators and government agencies, in future
phases of the Project.
Teck recognizes and appreciates the desire to review detailed designs, plans and
programs but has had to balance Project information available at this stage of engineering
with the level of information required to develop detailed designs, plans and programs.
An important part of developing these items is the input and feedback received from
regulators, Aboriginal communities and stakeholders. Further, Teck has had to balance
the desire and willingness of some Aboriginal communities with the expressed reluctance
of other communities to engage on the development of plans and programs before a
Project has received approvals and authorizations. Teck understands that these latter
communities are concerned that participation could be misinterpreted to imply consent,
which Teck understands is not the case. Teck has made best efforts to balance these
viewpoints when advancing plans and programs at this stage of the Project.
Teck recognizes three key phases of development for management and mitigation plans
and monitoring programs aligned with development of the Project (see Table 2-2):
(1) project definition phase
(2) project execution planning phase
(3) implementation and adaptive management phase
Teck will continue to engage Aboriginal communities, listen, consider and respond to
their interests throughout these three key phases of development.
Table 2-2 Phased Development of Project Management, Mitigation and Monitoring Plans and Programs
Phase Description
Project Definition • Conceptualization of management, mitigation and monitoring plans and programs early in the Project timeline
• Based on a prefeasibility study level of engineering • Influenced by engagement with Aboriginal communities, regulatory and government
agencies and stakeholders • Incorporated into the EIA • Meets the provincial TOR and federal requirements and clarifications for the Project • Project definition influenced throughout the regulatory process
Project Execution Planning
• Formalization of management, mitigation and monitoring plans and programs following regulatory approval and sanction of the Project
• Meets conditions of the regulatory approval • Influenced by more advanced engineering • Influenced by engagement with Aboriginal communities, regulatory and government
agencies and stakeholders • Informed by collaboration with existing oil sands developments and regional research
consortia • Influenced by preconstruction monitoring results
FRONTIER OIL SANDS MINE PROJECT 2 KEY THEMES
RESPONSES TO FMM SOCS – APRIL 2016 Page 14
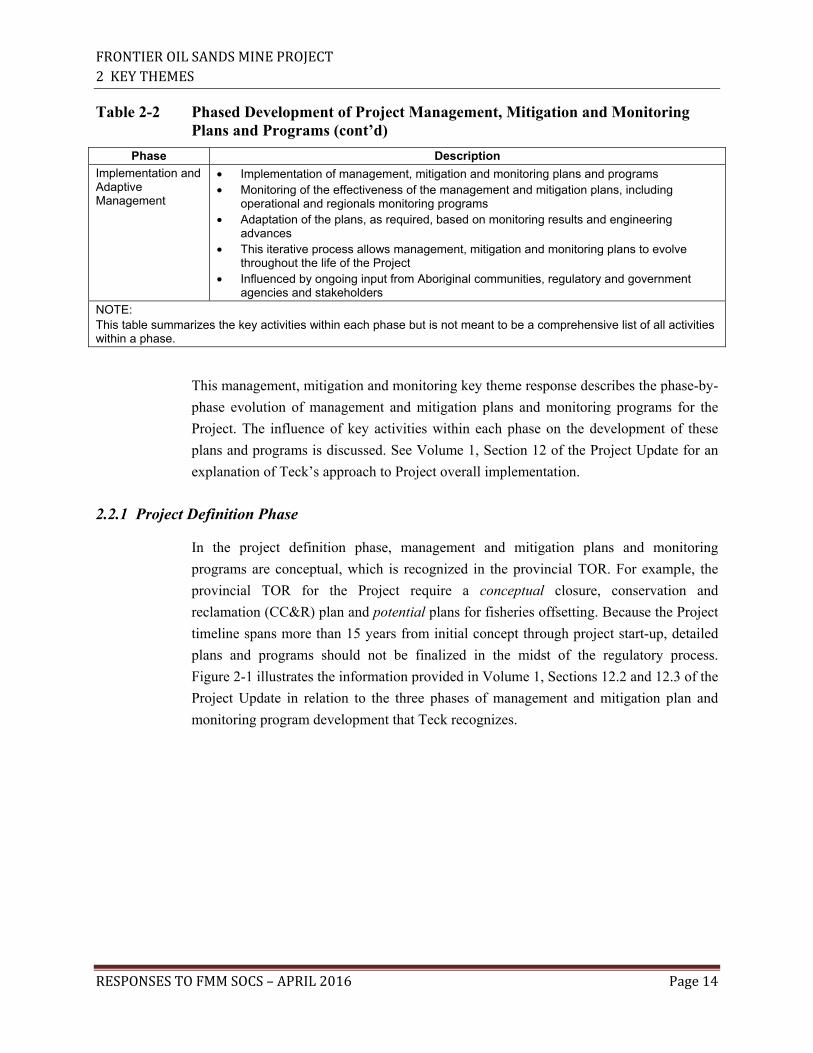
Table 2-2 Phased Development of Project Management, Mitigation and Monitoring Plans and Programs (cont’d)
Phase Description
Implementation and Adaptive Management
• Implementation of management, mitigation and monitoring plans and programs • Monitoring of the effectiveness of the management and mitigation plans, including
operational and regionals monitoring programs • Adaptation of the plans, as required, based on monitoring results and engineering
advances • This iterative process allows management, mitigation and monitoring plans to evolve
throughout the life of the Project • Influenced by ongoing input from Aboriginal communities, regulatory and government
agencies and stakeholders NOTE: This table summarizes the key activities within each phase but is not meant to be a comprehensive list of all activities within a phase.
This management, mitigation and monitoring key theme response describes the phase-by-
phase evolution of management and mitigation plans and monitoring programs for the
Project. The influence of key activities within each phase on the development of these
plans and programs is discussed. See Volume 1, Section 12 of the Project Update for an
explanation of Teck’s approach to Project overall implementation.
2.2.1 Project Definition Phase
In the project definition phase, management and mitigation plans and monitoring
programs are conceptual, which is recognized in the provincial TOR. For example, the
provincial TOR for the Project require a conceptual closure, conservation and
reclamation (CC&R) plan and potential plans for fisheries offsetting. Because the Project
timeline spans more than 15 years from initial concept through project start-up, detailed
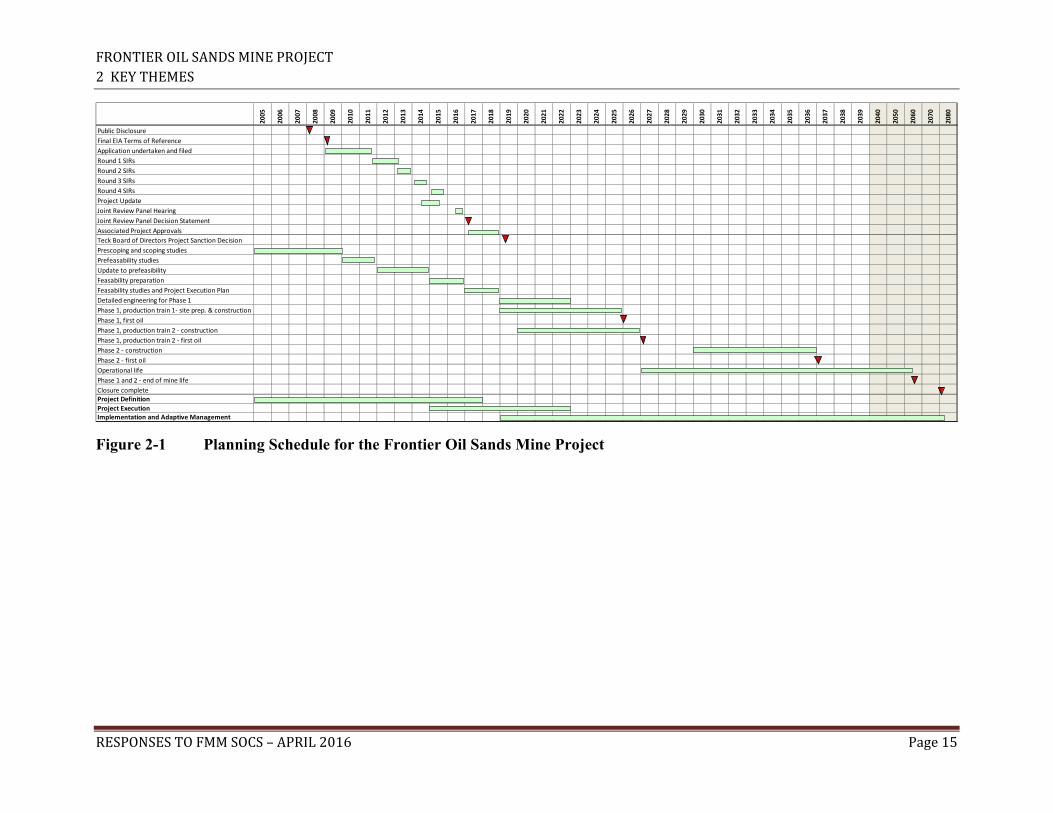
plans and programs should not be finalized in the midst of the regulatory process.
Figure 2-1 illustrates the information provided in Volume 1, Sections 12.2 and 12.3 of the
Project Update in relation to the three phases of management and mitigation plan and
monitoring program development that Teck recognizes.
FRONTIER OIL SANDS MINE PROJECT 2 KEY THEMES
RESPONSES TO FMM SOCS – APRIL 2016 Page 15
Figure 2-1 Planning Schedule for the Frontier Oil Sands Mine Project
2005
2006
2007
2008
2009
2010
2011
2012
2013
2014
2015
2016
2017
2018
2019
2020
2021
2022
2023
2024
2025
2026
2027
2028
2029
2030
2031
2032
2033
2034
2035
2036
2037
2038
2039
2040
2050
2060
2070
2080
Public DisclosureFinal EIA Terms of ReferenceApplication undertaken and filedRound 1 SIRsRound 2 SIRsRound 3 SIRsRound 4 SIRsProject UpdateJoint Review Panel HearingJoint Review Panel Decision StatementAssociated Project ApprovalsTeck Board of Directors Project Sanction DecisionPrescoping and scoping studiesPrefeasability studiesUpdate to prefeasibilityFeasability preparationFeasability studies and Project Execution PlanDetailed engineering for Phase 1Phase 1, production train 1- site prep. & constructionPhase 1, first oilPhase 1, production train 2 - constructionPhase 1, production train 2 - first oilPhase 2 - constructionPhase 2 - first oil Operational lifePhase 1 and 2 - end of mine lifeClosure completeProject DefinitionProject ExecutionImplementation and Adaptive Management
FRONTIER OIL SANDS MINE PROJECT 2 KEY THEMES
RESPONSES TO FMM SOCS – APRIL 2016 Page 16
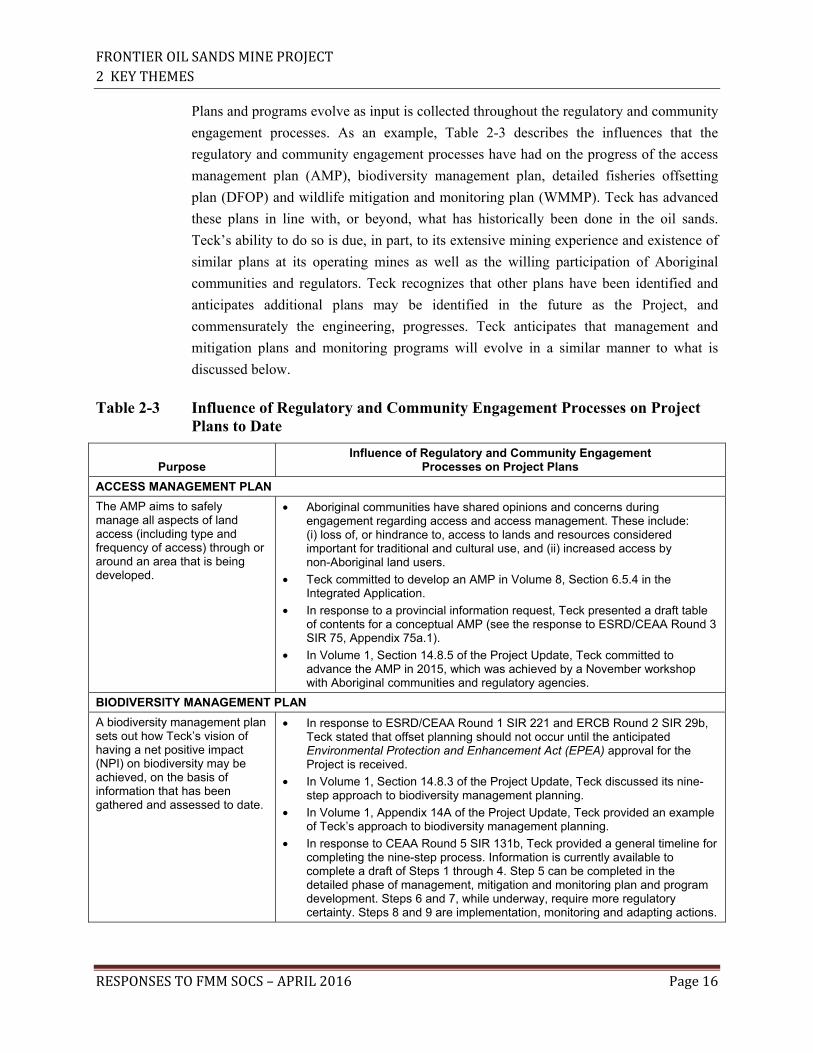
Plans and programs evolve as input is collected throughout the regulatory and community
engagement processes. As an example, Table 2-3 describes the influences that the
regulatory and community engagement processes have had on the progress of the access
management plan (AMP), biodiversity management plan, detailed fisheries offsetting
plan (DFOP) and wildlife mitigation and monitoring plan (WMMP). Teck has advanced
these plans in line with, or beyond, what has historically been done in the oil sands.
Teck’s ability to do so is due, in part, to its extensive mining experience and existence of
similar plans at its operating mines as well as the willing participation of Aboriginal
communities and regulators. Teck recognizes that other plans have been identified and
anticipates additional plans may be identified in the future as the Project, and
commensurately the engineering, progresses. Teck anticipates that management and
mitigation plans and monitoring programs will evolve in a similar manner to what is
discussed below.
Table 2-3 Influence of Regulatory and Community Engagement Processes on Project Plans to Date
Purpose Influence of Regulatory and Community Engagement
Processes on Project Plans
ACCESS MANAGEMENT PLAN
The AMP aims to safely manage all aspects of land access (including type and frequency of access) through or around an area that is being developed.
• Aboriginal communities have shared opinions and concerns during engagement regarding access and access management. These include: (i) loss of, or hindrance to, access to lands and resources considered important for traditional and cultural use, and (ii) increased access by non-Aboriginal land users.
• Teck committed to develop an AMP in Volume 8, Section 6.5.4 in the Integrated Application.
• In response to a provincial information request, Teck presented a draft table of contents for a conceptual AMP (see the response to ESRD/CEAA Round 3 SIR 75, Appendix 75a.1).
• In Volume 1, Section 14.8.5 of the Project Update, Teck committed to advance the AMP in 2015, which was achieved by a November workshop with Aboriginal communities and regulatory agencies.
BIODIVERSITY MANAGEMENT PLAN
A biodiversity management plan sets out how Teck’s vision of having a net positive impact (NPI) on biodiversity may be achieved, on the basis of information that has been gathered and assessed to date.
• In response to ESRD/CEAA Round 1 SIR 221 and ERCB Round 2 SIR 29b, Teck stated that offset planning should not occur until the anticipated Environmental Protection and Enhancement Act (EPEA) approval for the Project is received.
• In Volume 1, Section 14.8.3 of the Project Update, Teck discussed its nine-step approach to biodiversity management planning.
• In Volume 1, Appendix 14A of the Project Update, Teck provided an example of Teck’s approach to biodiversity management planning.
• In response to CEAA Round 5 SIR 131b, Teck provided a general timeline for completing the nine-step process. Information is currently available to complete a draft of Steps 1 through 4. Step 5 can be completed in the detailed phase of management, mitigation and monitoring plan and program development. Steps 6 and 7, while underway, require more regulatory certainty. Steps 8 and 9 are implementation, monitoring and adapting actions.

FRONTIER OIL SANDS MINE PROJECT 2 KEY THEMES
RESPONSES TO FMM SOCS – APRIL 2016 Page 17
Table 2-3 Influence of Regulatory and Community Engagement Processes on Project Plans to Date (cont’d)
Purpose Influence of Regulatory and Community Engagement
Processes on Project Plans
DETAILED FISHERIES OFFSETTING PLAN
A DFOP is a required component of an application for authorization under the Fisheries Act.
• Teck developed a conceptual fish habitat compensation plan which was included in Volume 1, Section 15 of the Integrated Application.
• The conceptual fish habitat compensation plan was revised in 2013, based on engagement with DFO regarding affected fish populations. The conceptual plan was resubmitted in response to ESRD/CEAA Round 2 SIR 30 (see Appendix 30j.1).
• In 2013, the Frontier Fisheries Offsetting Framework, an agreement between Teck and DFO, was developed because of several uncertainties that were external to the proposed fish habitat compensation lake’s function to offset losses in fisheries productivity associated with the Project.
• In July 2014, Teck engaged Aboriginal communities and regulatory and government agencies on the Frontier Fisheries Offsetting Framework.
• Teck included a conceptual fisheries offsetting plan as part of the Project Update (see Volume 1, Section 15.4), which included the Frontier Fisheries Offsetting Framework.
• In April 2015, Teck held a workshop to receive feedback on the fisheries offsetting options included in the Frontier Fisheries Offsetting Framework. Feedback received from Aboriginal communities will be considered in the draft DFOP.
• In response to CEAA Round 5 SIR 164b, Teck describes how feedback from the April 2015 workshop was considered and how decisions were made.
• In November 2015, Teck held a workshop to present decisions regarding fisheries offsetting measures. Teck also identified three opportunities for continued input into the DFOP: (i) identifying a potential fish species assemblage for the proposed fish habitat compensation lake (ii) discussing community interest in the design and execution of fish and fish habitat monitoring (iii) discussing community interest in developing regional Aboriginal fisheries offsetting objectives as a complimentary measure that includes a list of potential offsetting options in the oil sands region that meet regional Aboriginal community desires
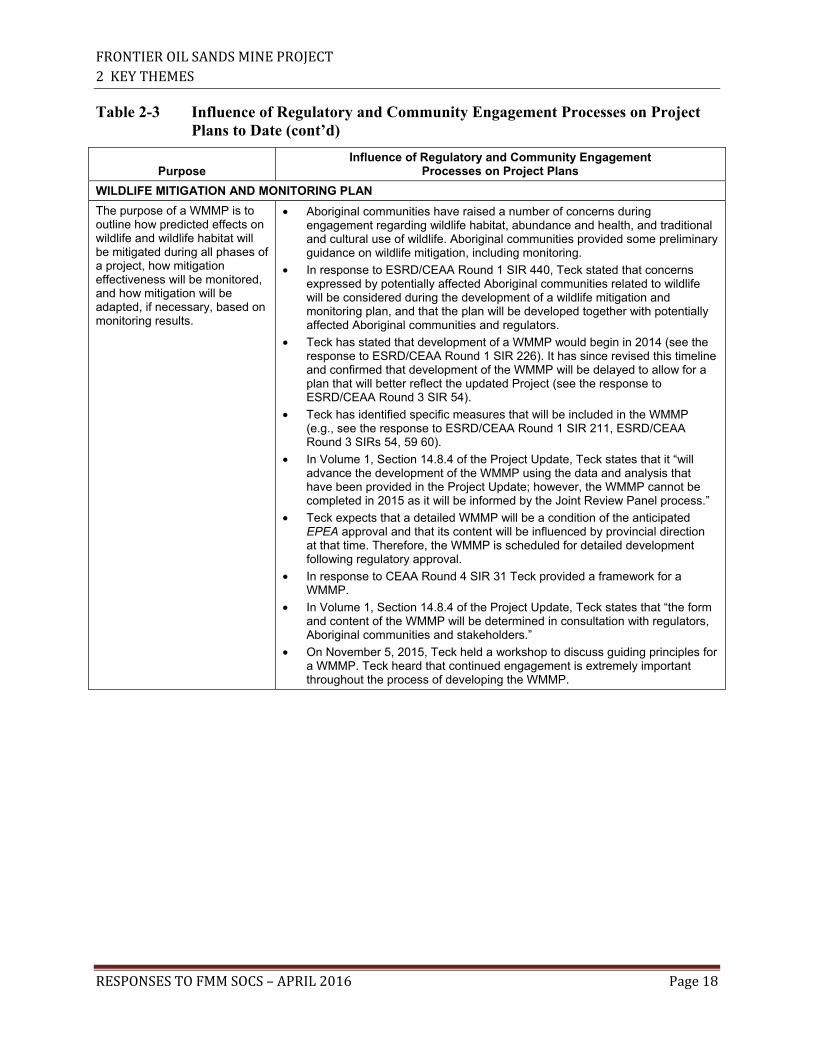
FRONTIER OIL SANDS MINE PROJECT 2 KEY THEMES
RESPONSES TO FMM SOCS – APRIL 2016 Page 18
Table 2-3 Influence of Regulatory and Community Engagement Processes on Project Plans to Date (cont’d)
Purpose Influence of Regulatory and Community Engagement
Processes on Project Plans
WILDLIFE MITIGATION AND MONITORING PLAN
The purpose of a WMMP is to outline how predicted effects on wildlife and wildlife habitat will be mitigated during all phases of a project, how mitigation effectiveness will be monitored, and how mitigation will be adapted, if necessary, based on monitoring results.
• Aboriginal communities have raised a number of concerns during engagement regarding wildlife habitat, abundance and health, and traditional and cultural use of wildlife. Aboriginal communities provided some preliminary guidance on wildlife mitigation, including monitoring.
• In response to ESRD/CEAA Round 1 SIR 440, Teck stated that concerns expressed by potentially affected Aboriginal communities related to wildlife will be considered during the development of a wildlife mitigation and monitoring plan, and that the plan will be developed together with potentially affected Aboriginal communities and regulators.
• Teck has stated that development of a WMMP would begin in 2014 (see the response to ESRD/CEAA Round 1 SIR 226). It has since revised this timeline and confirmed that development of the WMMP will be delayed to allow for a plan that will better reflect the updated Project (see the response to ESRD/CEAA Round 3 SIR 54).
• Teck has identified specific measures that will be included in the WMMP (e.g., see the response to ESRD/CEAA Round 1 SIR 211, ESRD/CEAA Round 3 SIRs 54, 59 60).
• In Volume 1, Section 14.8.4 of the Project Update, Teck states that it “will advance the development of the WMMP using the data and analysis that have been provided in the Project Update; however, the WMMP cannot be completed in 2015 as it will be informed by the Joint Review Panel process.”
• Teck expects that a detailed WMMP will be a condition of the anticipated EPEA approval and that its content will be influenced by provincial direction at that time. Therefore, the WMMP is scheduled for detailed development following regulatory approval.
• In response to CEAA Round 4 SIR 31 Teck provided a framework for a WMMP.
• In Volume 1, Section 14.8.4 of the Project Update, Teck states that “the form and content of the WMMP will be determined in consultation with regulators, Aboriginal communities and stakeholders.”
• On November 5, 2015, Teck held a workshop to discuss guiding principles for a WMMP. Teck heard that continued engagement is extremely important throughout the process of developing the WMMP.

FRONTIER OIL SANDS MINE PROJECT 2 KEY THEMES
RESPONSES TO FMM SOCS – APRIL 2016 Page 19
2.2.2 Project Execution Planning Phase
In the project execution planning phase, management and mitigation plans and
monitoring programs will be advanced as their development will be informed by
regulatory approvals, detailed engineering, additional input from Aboriginal
communities, regulatory and government agencies and stakeholders and, preconstruction
monitoring results.
• Regulatory Approvals – The AER decides whether an EPEA approval will be
issued and under what conditions. Management and mitigation plan and monitoring
programs must take into account applicable conditions.
• Detailed Engineering – Once approved and sanctioned by Teck’s Board of
Directors, project engineering and environmental management designs can advance
to a higher level of definition as required to enable tendering for construction.
Engineering and environmental management designs are studied in greater depth and
consider additional geologic and processability test work. The increased level of
understanding gained by continued investment during this phase fully defines a
project (definitive technical, environmental and commercial details). Detailed
management and mitigation plans and monitoring programs that are aligned with the
project execution plan can be produced during this phase. Accordingly, clear
management, mitigation and monitoring actions, and procedures for execution of the
actions, can be determined.
• Additional Input from Aboriginal Communities, Regulatory and Government
Agencies and Stakeholders – Engagement with Aboriginal communities, regulatory
and government agencies and stakeholders is the primary means through which Teck
understands expectations and identifies opportunities to reduce impacts and enhance
potential benefits from Project activities. This engagement will occur early enough to
inform Teck’s engineering and environmental management designs. Continued
engagement during this phase will reveal new detail, improve understanding and
enable refinement of designs and plans.
• Preconstruction Monitoring – The purpose of preconstruction monitoring is to
further develop the baseline of environmental reference conditions as required to
support operational monitoring (discussed in the implementation, monitoring and
adaptive management phase). While much of the preconstruction monitoring takes
place in preparation for and during the regulatory process, the dataset is refined and
becomes more detailed after approval has been granted. With site preparation being
planned to start two years after Project approval, ample time exists to refine the
environmental and socio-economic baseline dataset, as appropriate. In some cases,
preconstruction monitoring results may be required to finalize a mitigation plan.
FRONTIER OIL SANDS MINE PROJECT 2 KEY THEMES
RESPONSES TO FMM SOCS – APRIL 2016 Page 20
2.2.3 Implementation, Monitoring and Adaptive Management Phase
In the implementation, monitoring and adaptive management phase, management and
mitigation plans and monitoring programs will be evaluated for effectiveness and adapted
as needed on an ongoing basis. Management and mitigation plans and monitoring
programs are subject to refinement throughout the life of a project as lessons are learned
and circumstances change and technologies advance. As a global mining company with
over 100 years of experience, Teck has been recognized for its commitment to effective
environmental management, mitigation, monitoring and adaptive management (for more
information, see http://www.teck.com/about/awards/).
Project-specific and regional monitoring will be part of Teck’s ongoing operations, as
monitoring is a critical learning and adaptive management tool. Regional, multi-
stakeholder organizations provide data, perspective, knowledge and experience that help
identify environmental and socio-economic challenges and solutions. Collaborative
monitoring with Aboriginal communities and regulators, whether through operational or
regional monitoring initiatives, is an area of interest for Teck. Approaches that involve
Aboriginal communities provide key advantages, namely:
• They improve trust and confidence in the data and in management decisions.
• They enable Teck to develop monitoring programs that answer the questions posed
by Aboriginal communities.
• They provide an opportunity to integrate traditional knowledge into the monitoring
program.
• They provide an opportunity for Teck to implement adaptive management solutions
that consider Aboriginal community interests.
Two examples of Teck’s involvement in collaborative monitoring are:
• Teck and Aboriginal communities have had early discussions about Aboriginal
community involvement in the design and execution of a fish and fish habitat
monitoring program, a component of a detailed fisheries offsetting plan (for details,
see the response to CEAA Round 5 SIR 164b).
• Under the Wood Buffalo Environmental Association (WBEA), a Traditional
Knowledge Committee has designed a community-based project to share Fort
McKay traditional knowledge and concerns about local berry populations. Teck will
consider these findings alongside scientific monitoring of berry populations.
Additional themes for future study have been identified, including wetland, medicinal
plant and animal tissue monitoring.
FRONTIER OIL SANDS MINE PROJECT 2 KEY THEMES
RESPONSES TO FMM SOCS – APRIL 2016 Page 21
Participation in relevant regional initiatives is important to Teck and will be a
requirement of the anticipated EPEA approval for the Project. Teck acknowledges that
support for multi-stakeholder organizations that include Aboriginal communities, like
WBEA and Ronald Lake Bison Herd Technical Team, is important. Therefore, Teck will
consider and respond to Aboriginal community views on multi-stakeholder organizations
now and in the future. Currently, Teck is a member of the following organizations:
• the Alberta Environmental Monitoring, Evaluation and Reporting Agency
• Canada’s Oil Sand Innovation Alliance
• the Wood Buffalo Environmental Association
• the Ronald Lake Bison Herd Technical Team (see CEAA Round 5 SIR 134 for an
update on the teams activities)
Adaptive management is a key part of environmental management for the Project and
will allow management and mitigation plans to evolve in step with changing
circumstances, local and regional monitoring results, and advances in science. Teck will
develop an adaptive management plan to enable appropriate response to trends detected
through accrued operational, regional and collaborative monitoring initiatives. See
Volume 1, Section 13.3.4 for a description of Teck’s approach to adaptive management.
Teck has committed to including Aboriginal communities in the development of
mitigation plans and their implementation. For example:
• As part of the CC&R plan, and through a Reclamation Working Group, Teck will
develop and implement a program to salvage and relocate known occurrences of rare
(vascular) species to areas outside the Project footprint. Traditional resource
harvesters will be invited to harvest traditional plants before disturbance. With the
involvement of local Aboriginal communities, Teck will harvest and collect seeds
and individuals (as relevant) of rare and culturally important species for use in
propagation and revegetation efforts.
• As part of the historical resources management plan, Teck will invite members of
local Aboriginal communities to participate in future historical resources assessments
and mitigations where logistically feasible.
In summary, Teck’s view is that the Project application is complete and ready to proceed
to the JRP process. The Project application is based on an appropriate level of
engineering and sufficient mitigation has been identified at this stage of the Application.
Detailed management and mitigation plans and monitoring programs should not be
finalized at this stage of the Project as they need to be informed by the outcome of the
JRP process and additional Aboriginal community and stakeholder input. Teck will
continue to listen and respond to the interests of, and engage with, Aboriginal
FRONTIER OIL SANDS MINE PROJECT 2 KEY THEMES
RESPONSES TO FMM SOCS – APRIL 2016 Page 22
communities and stakeholders throughout the three key phases of development:
(1) project definition, (2) project execution planning phase, and (3) implementation and
adaptive management phase. Management and mitigation plans and monitoring programs
cannot be fully detailed until the Project execution and planning phase because detailed
plans rely on a complete regulatory process, advanced engineering designs and additional
input from regulatory and government agencies, Aboriginal communities and
stakeholders. In the implementation, monitoring and adaptive management phase,
management and mitigation plans and monitoring programs will be evaluated for
effectiveness and adapted as needed on an ongoing basis.
2.3 Climate Change
Climate change, the potential effects of future climate change on the Project design and
operation, and requests for additional climate change analysis are themes that exist in
several SOCs received from Aboriginal communities and stakeholders. This response
discusses the general implications of climate change on the Project and explains how
climate change has been considered in the Project’s design, assessment and management
plans.
Teck has considered potential effects of climate change in its regulatory submissions for
the Project, including the Integrated Application, responses to SIRs and the Project
Update. In doing so, Teck has met the requirements of (i) the provincial terms of
reference issued for the Project (AENV 2009), and (ii) the federal guidance document
Incorporating Climate Change Considerations in Environmental Assessment: General
Guidance for Practitioners (The Federal-Provincial-Territorial Committee on Climate
Change and Environmental Assessment 2003). The latter recommends that proponents:
• discuss their project’s contribution to greenhouse gas (GHG) emissions on both a
provincial and national scale
• consider how climate change could affect the project
As part of the EIA completed for the Project, Teck assessed a range of future climate
change scenarios to evaluate potential effects of future climate conditions (see Volume 5,
Appendix 3C of the Integrated Application). In the Project Update, climate change was
considered quantitatively and qualitatively; for example:
• the updated hydrology assessment quantitatively evaluates several climate change
scenarios (see Volume 3, Section 6 of the Project Update)
FRONTIER OIL SANDS MINE PROJECT 2 KEY THEMES
RESPONSES TO FMM SOCS – APRIL 2016 Page 23
• the updated air quality assessment considers climate change in quantifying GHG
emissions (see Volume 3, Section 4 of the Project Update)
• for several disciplines, the discussion of prediction confidence considers climate
change (e.g., see Volume 3, Sections 4.6.11, 6.4.7, 6.5.7 and 6.6.5 of the Project
Update)
The breadth and depth of climate change analysis completed for the Project meets
regulatory requirements and is considered appropriate in the context of an EIA.
Additional climate change analysis is not required at this time; however, Teck will keep
abreast of emerging research, regulations and guidelines for managing GHG emissions
from the Project and will look for opportunities to further reduce GHG emissions during
future stages of engineering. For details of Teck’s greenhouse gas management plan for
the Project, see the response to AER Round 5 SIR 39.
2.3.1 Project Greenhouse Gas Emissions
Teck takes its commitment to sustainability seriously and has established short term goals
to implement projects that reduce GHG emissions by 275 kt (kilotonnes) of CO2-
equivalent (CO2e) across its operations by 2020, and long term goals to reduce GHG
emissions by 450 kt of CO2e by 2030. The Project has been designed to operate in an
efficient manner using technically proven and commercially available technology. The
updated Project design incorporates several improvements and mitigation measures that
are expected to:
• reduce the Project’s overall (direct and indirect) GHG emission rate by 21%, and
• reduce the Project’s GHG emission intensity by 12% compared to the Integrated
Application
For a more detailed comparison and discussion of these improvements, see Volume 1,
Section 14.4.2.5 of the Project Update.
Overall, GHG emissions (direct and indirect) from the Project are expected to contribute
approximately 4 Mt (megatonnes) per year. Teck expects that these emissions will not
exceed the 100 Mt annual emission cap established by the provincial government.
Further, with a direct emissions intensity of 38.4 kg of CO2e per barrel, Teck believes that
the Project represents best-in-class for oil sands GHG emissions.
Teck remains active in the area of research and development into commercially and
economically viable technologies to reduce GHG emissions, particularly those that are
applicable to oil sands mining and extraction. This includes methane emissions, which
Canada intends to regulate by 2017. Teck’s involvement in oil sands-related research and
development is largely through its membership in Canada’s Oil Sands Innovation

FRONTIER OIL SANDS MINE PROJECT 2 KEY THEMES
RESPONSES TO FMM SOCS – APRIL 2016 Page 24
Alliance and its GHG Environmental Priority Area. Teck anticipates that the Project’s
GHG emission rate and GHG emission intensity will be further reduced during future
stages of engineering, which will consider the Alberta Government’s Climate Leadership
Plan and associated regulations, when available.
2.3.2 Potential Climate Change Effects on the Project
Teck has designed the Project with future climate change in mind and will adaptively
manage the construction, operation and closure of the Project within a potentially
changing climate. The current and final Project design, and its associated management
plans, will consider climate change and its effects. For example:
• Teck’s water management plans, including off-stream storage requirements, comply
with the Surface Water Quantity Management Framework for the Lower Athabasca
River (GOA 2015), which considers future climate change scenarios.
• Operational diversion channel design will consider climate change during future
stages of engineering.
• Potential climate change effects are considered as part of the detailed fisheries
offsetting plan (DFOP).
• The closure plan and planned land capability and vegetation prescriptions for the
Project consider climate change and will be modified based on emerging conditions
and forecasts during operations.
Climate change predictions have inherent uncertainty. As such, adaptive management is a
key aspect of the environmental management for the Project and will be important for
managing potential effects of climate change on the Project. For an overview of Teck’s
adaptive management strategy, see Volume 1, Section 13.3.4 of the Project Update. See
Key Theme – Management, Mitigation and Monitoring (Section 2.2) for additional
discussion about the importance of adaptive management.
2.3.3 Incorporating Future Climate Scenarios
As mentioned, Teck considered multiple climate change scenarios in assessing potential
effects of the Project. These scenarios were assessed as part of the Integrated Application
(see Volume 5, Appendix 3C), and updated scenarios were assessed in the Project Update
consistent with the approach outlined in the response to ESRD/CEAA Round 2 SIR 28,
Appendix 28a.1. In total, 37 different climate scenarios have been considered as part of
the Project assessment work to date (13 in the Integrated Application and 24 in the
Round 2 SIRs and Project Update). These scenarios consider median and extremes of wet
or dry and cool or warm conditions.
FRONTIER OIL SANDS MINE PROJECT 2 KEY THEMES
RESPONSES TO FMM SOCS – APRIL 2016 Page 25
Most requests for additional climate change analysis focus on the hydrology assessment,
and it is through the hydrology assessment that Teck has considered the 37 climate
change scenarios referenced above. Although Teck understands the desire of some
reviewers to have additional climate scenarios or datasets assessed, Teck considers the
approach used in the Integrated Application and Project Update to be appropriate and
robust. Further assessment, including refinement of methods used to incorporate climate
change effects in the hydrology assessment, will not meaningfully change the conclusions
of the assessment or its associated prediction confidence. As such, Teck will consider
additional climate change scenarios as part of adaptive management, following Project
approval and as the Project develops over time.
Some SOCs request more information about the effects of climate change on other
modelled assessments, such as the air quality assessment. Teck has considered the effects
of future climate scenarios on other environmental components (i.e., those with potential
to be measurably affected by climate change) by assessing effects on aquatic and
terrestrial resources. Climate change is expected to have a negligible effect on other
environmental components assessed in the Project Update (e.g., air quality, vegetation).
Should future research and monitoring suggest adverse effects from climate change, these
effects will be adaptively managed.
Teck is currently participating in research on extreme climate variability, which some
climate change scenarios indicate could increase in the future. The work is related to the
tree ring study for the Athabasca River completed by the University of Regina
(Sauchyn et al. 2015). Teck has engaged with Dr. Sauchyn through Canada’s Oil Sands
Innovation Alliance (COSIA) to understand the implications of this study on Athabasca
River flows at Fort McMurray. The tree ring study looks at multi-century, historical data
showing the range of climate variability for the Athabasca River. Teck is reviewing this
study and, if appropriate, will determine how it may be incorporated into future stages of
engineering to help prepare for climatic extremes.
In summary, the Integrated Application and the Project Update have appropriately
covered, both quantitatively and qualitatively, climate change and the potential effects of
future climate change related to the Project design and potential Project effects.
Additional assessment at this stage of the Project will not provide meaningfully different
findings. Adaptive management is a key aspect of environmental management for the
Project and provides confidence that Teck is committed to change and adapt as the
Project develops over time. Learning from experience and modifying subsequent actions
in light of that experience will enable the Project to evolve in step with changing
regulations, circumstances, local and regional monitoring results, and scientific advances.
For example, Alberta’s Climate Leadership Plan was released in November 2015, and
Teck expects more details on how this plan will be implemented throughout 2016. Teck
FRONTIER OIL SANDS MINE PROJECT 2 KEY THEMES
RESPONSES TO FMM SOCS – APRIL 2016 Page 26
has already identified a number of actions that it will take to prepare for anticipated
regulatory changes. These actions relate to Project design, research and development,
continuous improvement, additional emission studies and continued evaluation and
investment in green-energy initiatives (for details, see Volume 1, Section 14.4.2.5 of the
Project Update).
Teck will continue to monitor potential regulatory changes related to GHG emissions as
they evolve and will comply with applicable requirements for the Project. Because the
timing, extent and implementation details for potential regulatory changes are not fully
known at this time, Teck considers additional focus on GHG reductions is premature at
this stage of Project development. However, Teck will continue to focus on research and
strategies to reduce GHG emissions and will seek opportunities to incorporate
improvements into the Project design during future stages of engineering to support
Teck’s short-term and long-term GHG emission reduction goals.
References
AENV (Alberta Environment). 2009. Final Terms of Reference Environmental Impact Assessment Report
for the Proposed UTS Energy Corporation/Teck Cominco Limited Frontier Oil Sands Mine
Project. Edmonton, Alberta.
GOA (Government of Alberta). 2015. Surface Water Quantity Management Framework for the Lower
Athabasca River (SWQMF). March 2015. Available at: http://esrd.alberta.ca/focus/cumulative-
effects/cumulative-effects-management/management-frameworks/documents/LARP-
SurfaceWaterQuantityMgmt-Feb2015.pdf. Accessed March 2015.
Sauchyn, D.J., J-M. St-Jacques and B.H. Luckman. 2015. Long-term reliability of the Athabasca River
(Alberta, Canada) as the water source for oil sands mining. Proceedings of the National Academy
of Sciences of the United States of America (PNAS) 112(41): 12621–12626. October 13, 2015.
The Federal-Provincial-Territorial Committee on Climate Change and Environmental Assessment. 2003.
Incorporating Climate Change Considerations in Environmental Assessment: General Guidance
for Practitioners. November 2003. Cat. No. En106-50/2003E-PDF. Available at:
https://www.ceaa-acee.gc.ca/default.asp?lang=En&n=A41F45C5-1. Accessed February 2016.
FRONTIER OIL SANDS MINE PROJECT 2 KEY THEMES
RESPONSES TO FMM SOCS – APRIL 2016 Page 27
2.4 Agreement and Regulator Requests
In December 2015, Fort McMurray Métis Local 1935 (FMM) provided Teck and
regulators a SOC regarding the Frontier Project Update. As part of this SOC, FMM
categorized a potential path forward to address each of its concerns. The categories used
by FMM are:
• Agreement – A suggested activity (mitigation, monitoring) that McMurray Métis
might want to consider in its Agreement negotiations with Teck.
• Regulatory – McMurray Métis’ recommendation to the regulators, including
information requests, regulatory requirements and approval conditions (if the project
is ultimately approved).
This key theme response constitutes Teck’s response to all concerns that FMM has
indicated are directed to regulators or an agreement negotiation with Teck. At the time of
drafting this response, Teck is actively negotiating with FMM and hopes to reach a long-
term agreement with the community. Such an agreement would formalize Teck’s
relationship with the community, including how Teck and the community will work
together to manage potential effects of the Project on FMM.
The balance of this key theme response articulates Teck’s specific views regarding
agreement and regulatory requests, including potential next steps.
2.4.1 Agreement Requests
In some cases, the SOCs that FMM has identified as best discussed within a long-term
agreement have been contemplated and spoken to by Teck through the regulatory and
consultation process to date (see examples listed below). Nonetheless, Teck would like to
further discuss these and other requests with FMM to reach an understanding on how to
address the SOC in a mutually satisfactory manner.
• Volume 3, Section 4.8.2 of the Project Update – In addition to focusing on
minimizing odour sources, Teck’s odour management plan will include working with
neighbouring Aboriginal communities to report, identify and manage detectable
odours at identified receptor locations.
• Volume 1, Section 14.4.2.6 of the Project Update – Teck will control dust from
construction, mining and tailings operations using a variety of methods that will be
identified in a dust management plan.
• Volume 3, Section 4.7.1.1 of the Project Update – Participation in relevant regional
initiatives is important to Teck and will be a requirement of the anticipated
Environmental Protection and Enhancement Act (EPEA) approval for the Project.
Teck recognizes that support for multi-stakeholder organizations that include
FRONTIER OIL SANDS MINE PROJECT 2 KEY THEMES
RESPONSES TO FMM SOCS – APRIL 2016 Page 28
Aboriginal communities (e.g., the Wood Buffalo Environmental Association and
Ronald Lake Bison Herd Technical Team), is important to Aboriginal communities.
As such, Teck will consider Aboriginal community views on multi-stakeholder
organizations now and in the future.
• Volume 5, Section 3.5.9 of the Integrated Application – An adaptive strategy will
be adopted to manage the potential effects associated with predicted flow changes in
receiving watercourses. This strategy will involve continuing and expanding
hydrologic and geomorphic monitoring. Should the monitoring data indicate
unacceptable hydrologic effects (e.g., increased channel erosion), mitigation options
(e.g., reduced flow releases) will be considered and implemented. Teck will continue
to discuss watershed management strategies with potentially affected Aboriginal
communities.
• Volume 1, Section 14.8.5 of the Project Update – Teck has committed to begin
developing an access management plan in cooperation with regulators, potentially
affected Aboriginal communities and stakeholders. Its objective will be to minimize
effects on hunting, fishing, gathering and trapping while maintaining public safety,
site development and mining operations.
• Volume 1, Section 18.6.4.2 of the Project Update – Teck will develop and
implement a weed management plan throughout the life of the Project, including
during reclamation and at closure.
2.4.2 Regulator Requests
As part of its December 2015 SOC, FMM included requests directed to regulators. Teck
has not provided a response to requests that were specifically directed to regulators.
Given Teck’s ongoing discussions with FMM, some of these requests may be addressed
prior to the JRP hearing for the Project.
Teck asks that regulatory and government agencies reviewing the Frontier Project
application refrain from making any decisions on regulatory approval conditions at this
time. Teck is of the view that decisions about specific regulator requests should be made
only after the JRP hearing, when all parties’ submissions and evidence can be properly
considered. This will ensure that the implications of these requests to the Project can be
properly considered prior to a decision being made.
FRONTIER OIL SANDS MINE PROJECT 3 SOC RESPONSES 3.1 INTRODUCTION
RESPONSES TO FMM SOCS – APRIL 2016 Page 29
3 SOC Responses
3.1 Introduction
SOC 1
FMM Reference and Topic:
FMM [1], Section 1.9 Requests to the Crown
Requests to the Crowns
Requests for Alberta
McMurray Métis requests that Alberta:
i. develops a comprehensive and inclusive Métis consultation policy, in collaboration with
McMurray Métis and other Métis groups;
ii. directs proponents, including Teck, to consult with McMurray Métis on existing and planned
projects occurring or potentially influencing McMurray Métis’ Traditional Territory;
iii. directs the Aboriginal Consultation Office (ACO) and the Alberta Energy Regulatory (AER) to
grant standing to and consult with McMurray Métis regarding the Teck Frontier Project and
other projects within McMurray Métis’ Traditional Territory;
iv. involves McMurray Métis and other Métis organizations in a meaningful way in regional
planning, cumulative effects management and monitoring; and
v. negotiates a mitigation and accommodation agreement with McMurray Métis to address
existing impacts on McMurray Metis’ rights.
Teck Response:
i. See Key Theme – Agreement and Regulator Requests (Section 2.4).
ii. See Key Theme – Agreement and Regulator Requests (Section 2.4).
iii. See Key Theme – Agreement and Regulator Requests (Section 2.4).
iv. See Key Theme – Agreement and Regulator Requests (Section 2.4).
v. See Key Theme – Agreement and Regulator Requests (Section 2.4).
FRONTIER OIL SANDS MINE PROJECT 3 SOC RESPONSES 3.1 INTRODUCTION
RESPONSES TO FMM SOCS – APRIL 2016 Page 30
SOC 2
FMM Reference and Topic:
FMM [2], Section 1.9 Requests to the Crown
Requests to the Crowns
Requests for Canada
McMurray Métis requests that:
i. CEAA and other federal departments continue to consult with McMurray Métis regarding the
Teck Frontier Project, and that these consultations are meaningful and that an appropriate
level of capacity funding is made available for these consultations; and
ii. Canada negotiates with McMurray Métis a mitigation and accommodation agreement to
address existing impacts on McMurray Metis’ rights.
Teck Response:
i. See Key Theme – Agreement and Regulator Requests (Section 2.4).
ii. See Key Theme – Agreement and Regulator Requests (Section 2.4).
FRONTIER OIL SANDS MINE PROJECT 3 SOC RESPONSES 3.2 PROJECT OVERVIEW
RESPONSES TO FMM SOCS – APRIL 2016 Page 31
3.2 Project Overview
SOC 3
FMM Reference and Topic:
FMM [3], Section 2.3 Timing
Project Schedule – Delays, Risks and Uncertainties
McMurray Métis requests that AER requires Teck, before the application is deemed complete, to
provide a risk management plan describing how Teck will modify mitigation, monitoring and
reclamation schedules should there be any delays in the project’s construction and operation and to
address risks associated with bankruptcy and economic uncertainties.
Teck Response:
See Key Theme – Agreement and Regulator Requests (Section 2.4).
SOC 4
FMM Reference and Topic:
FMM [4], Section 2.4 Location, Access and Traffic
Managing Access
McMurray Métis requests that the Government of Alberta identifies how it plans to address access
management in this area to avoid impacting or infringing on Aboriginal rights or access to
Aboriginal resources use.
Teck Response:
See Key Theme – Agreement and Regulator Requests (Section 2.4).

FRONTIER OIL SANDS MINE PROJECT 3 SOC RESPONSES 3.2 PROJECT OVERVIEW
RESPONSES TO FMM SOCS – APRIL 2016 Page 32
SOC 5
FMM Reference and Topic:
FMM [5], Section 2.4 Location, Access and Traffic
Managing Access
McMurray Métis requests that Teck continues to engage McMurray Métis in matters related to
access management and safety, road upgrades and maintenance, traffic safety and management,
and spill prevention. McMurray Métis also requests that Teck provides an opportunity for
McMurray Métis’ review and comment on these plans. Also, see recommendations [191] to [193]
and associated discussion.
Teck Response:
See Key Theme – Agreement and Regulator Requests (Section 2.4).
SOC 6
FMM Reference and Topic:
FMM [5], Section 2.4 Location, Access and Traffic
Managing Access
McMurray Métis requests that Teck and the Government of Alberta provide opportunities for
consultation and engagement on the permanence of the proposed bridge and that a decision for the
final decommissioning of the bridge includes input from McMurray Métis.
Teck Response:
See Key Theme – Agreement and Regulator Requests (Section 2.4).
FRONTIER OIL SANDS MINE PROJECT 3 SOC RESPONSES 3.2 PROJECT OVERVIEW
RESPONSES TO FMM SOCS – APRIL 2016 Page 33
SOC 7
FMM Reference and Topic:
FMM [7], Section 2.4 Location, Access and Traffic
Managing Access
McMurray Métis requests that Teck provides business opportunities to McMurray Métis-owned
businesses during construction and decommissioning of the bridge.
Teck Response:
See Key Theme – Agreement and Regulator Requests (Section 2.4).
SOC 8
FMM Reference and Topic:
FMM [8], Section 2.6 Workforce and Camps
Camp Workforce
McMurray Métis requests that Teck outlines its plans to maximize the use of local labour and limit
the negative effects that its workforce can have on infrastructure, services and traditional land use.
Also, see recommendations in Sections 10 and 12.
Teck Response:
Teck’s management, mitigation and monitoring initiatives with respect to community effects are
identified in Volume 1, Section 16.7.10.2 of the Integrated Application. For ease of reference, these are
summarized in Table 8-1.

FRONTIER OIL SANDS MINE PROJECT 3 SOC RESPONSES 3.2 PROJECT OVERVIEW
RESPONSES TO FMM SOCS – APRIL 2016 Page 34
Table 8-1 Management, Mitigation and Monitoring for Community Effects
Social Infrastructure Area Management, Mitigation and Monitoring
Housing • Make use of lodge-based accommodations during construction and operations to reduce the Project’s effect on the resident population and associated effects on social infrastructure and housing in the region.
Policing and emergency services
• Maintain explicit and enforced lodge, workplace, and flight policies with regards to the use of alcohol, drugs, and illegal activities
• Make available on-site security services, including controlled gates, check-in procedures, perimeter security fencing, and lodge-based security officers on duty 24 hours.
• Offer in-house security services to assist the RCMP within, and sometimes outside, the Project lease boundaries (e.g., securing accident scenes, assisting with highway closures).
• Develop and implement an emergency response plan that identifies the required personnel, procedures, and equipment resources (e.g., vehicles, fire response, medical response, and rescue).
• Develop required mitigation measures for areas adjacent to the Project based on the FireSmart Wildfire Assessment System and implement in the emergency response plan.
• Enter into mutual aid agreements with the Regional Municipality of Wood Buffalo (RMWB) and other oil sands companies that include: • responding to motor vehicle accidents on Highway 63 • responding to forest fire threats to Fort McKay • responding to regional spills
• Participate in the management of regional emergencies at the RMWB’s Regional Emergency Operations Centre.
Health services • Make available on-site health services, including an on-site medical facility staffed by qualified health professionals that provides 24-hour on-site primary, emergency, and occupational health services.
• Consider financial and in-kind contributions to the Northern Lights Health Foundation, where appropriate, to support the efforts of Alberta Health Services to meet the needs of Wood Buffalo residents. Recognizing some of the health concerns in the region (see Volume 1, Section 16.7.4.2 of the Integrated Application), Teck is prepared to make health promotion and disease prevention initiatives a focus of its community investment policy.
• Provide helicopter or fixed-wing aircraft access via the on-site aerodrome for injured workers requiring rapid evacuation for off-site medical care.
• Discuss with other industrial proponents near the Project options for coordinating on-site health facilities and resources.
Education • Assess and support school events and education initiatives identified by rural schools in the study area, as appropriate.
Social services • Provide employees with access to the company’s confidential employee assistance plan, which provides support for families and individuals who might experience difficulty dealing with personal, family, or work-life issues that can affect one’s health and well-being.
• Consider support for community level initiatives including social groups providing assistance to those in need.
Recreation infrastructure and services
• Offer shift schedules that provide workers with sufficient time off to enjoy leisure activities in their home communities.
• Make available on-site recreational opportunities and facilities.

FRONTIER OIL SANDS MINE PROJECT 3 SOC RESPONSES 3.2 PROJECT OVERVIEW
RESPONSES TO FMM SOCS – APRIL 2016 Page 35
Table 8-1 Management, Mitigation and Monitoring for Community Effects (cont’d)
Social Infrastructure Area Management, Mitigation and Monitoring
Transportation • Construct and operate an aerodrome near the Project site. • Use on-site as well as regional lodge accommodations during both construction and
operations to reduce worker commutes. • Use bus service for transporting construction and operations workers. • Limit private vehicles brought to the Project site. • Schedule truck traffic, including oversized loads, to off-peak hours. • Use an on-site concrete batch plant and attempt to source aggregates from pits near
to site. • Enforce lodge, workplace and flight policies with regards to the use of alcohol, drugs
and illegal activities. • Work with the local RCMP to communicate local effects. • Support the efforts of RMWB and the Oil Sands Community Alliance (OSCA) to work
with the provincial government to progress improvements to highway infrastructure in a timely way.
• Keep responsible regional and provincial planners informed of the Project’s development plans and their timing.
• Consult and cooperate with other operators regarding shift scheduling with a view to reduce overlap in commuter traffic.
Municipal infrastructure • Provide water and sewer services for the different mining areas and the associated processing facilities and infrastructure, including on-site lodges.
In the Project Update (see Volume 1, Section 16.4.2.2), Teck states that “the company will develop
policies and standards to guide local labour force development and hiring initiatives to increase the
potential number of qualified local residents.” Volume 1, Section 16.5.7 of the Project Update identifies
the types of processes, policies and programs that Teck is considering implementing (see Table 8-2).
Table 8-2 Processes, Policies and Programs to Increase Local Labour
Social Infrastructure Area Options under Consideration for the Project
Local procurement and employment
• Establish mechanisms to enhance employment prospects of local residents, including preferential consideration.
• Use procurement processes that regard local ownership and prevalence of workers residing locally as positive criteria in goods and services vendor selection competitions.
• Establish monitoring programs that measure local involvement, gather feedback and work with interested parties on how to improve results.
• Proactively engage with regional communities and identify ways of contributing to community growth, development and well-being.
Aboriginal community employment and procurement
• Develop substantial opportunities for local Aboriginal businesses to supply services and products in support of Project construction and operations.
• Hire qualified Aboriginal people from the communities surrounding the Project. • Support education, training and investment initiatives in local Aboriginal communities,
where appropriate.

FRONTIER OIL SANDS MINE PROJECT 3 SOC RESPONSES 3.2 PROJECT OVERVIEW
RESPONSES TO FMM SOCS – APRIL 2016 Page 36
For further discussion regarding Aboriginal employment and participation in the Project, see the response
to AER Round 5 SIR 43.
Teck is committed to proactively engaging with regional communities to identify ways of contributing to
community growth, development and well-being, and minimizing and mitigating adverse effects. Teck
will monitor the Project’s ongoing effects through its engagement with regional and provincial
stakeholders, Aboriginal communities, and other industry operators in the region.
FRONTIER OIL SANDS MINE PROJECT 3 SOC RESPONSES 3.3 AIR
RESPONSES TO FMM SOCS – APRIL 2016 Page 37
3.3 Air
SOC 9
FMM Reference and Topic:
FMM [9], Section 3.3 Air Quality Assessment and Modelling
Ambient Air Quality Predictions
Regional PM2.5 Management
McMurray Métis recommends that the regulator, in developing a response for PM2.5 management
in the Lower Athabasca air zone and in the subsequent development of a management plan,
consults the McMurray Métis as a stakeholder and provides its members an opportunity to provide
input into policy-making.
Teck Response:
See Key Theme – Agreement and Regulator Requests (Section 2.4).
SOC 10
FMM Reference and Topic:
FMM [10], Section 3.3 Air Quality Assessment and Modelling
Ambient Air Quality Predictions
Air Emissions Management
McMurray Métis recommends that Teck commits to identifying and evaluating all possible air
emission control options for major emission sources, ensuring that the “best in class” controls and
management practices are selected.
Teck Response:
See Key Theme – Agreement and Regulator Requests (Section 2.4).
FRONTIER OIL SANDS MINE PROJECT 3 SOC RESPONSES 3.3 AIR
RESPONSES TO FMM SOCS – APRIL 2016 Page 38
SOC 11
FMM Reference and Topic:
FMM [11], Section 3.3 Air Quality Assessment and Modelling
Tailings Inventory and Emissions
Emissions Related to Increased FFT Storage Volume
McMurray Métis recommends that Teck provides additional information on how the significant
increase in FFT storage volumes associated with the updated project will impact VOC, Total
Reduced Sulphur (TRS), polycyclic aromatic compound (PAC), and GHG emissions.
Teck Response:
The Project’s increased subsurface storage volume of fluid fine tailings (FFT) is not expected to affect
tailings pond emissions of volatile organic compounds (VOCs), total reduced sulphur (TRS) or polycyclic
aromatic hydrocarbons (PACs). This opinion is based on a review of the 2013 emission flux
measurements from regional ponds (see Volume 3, Appendix 4A, Table 4A-103 of the Project Update).
Conclusions from this review are summarized as follows:
• High VOC emission rates (indicated as hydrocarbon compound [HC] in Table 4A-103) are associated
only with ponds that receive froth treatment tailings (FTT), which is not related to the amount of FFT
in a pond.
• The relationship between TRS (indicated as reduced sulphur compounds [RSC] in Table 4A-103) and
ponds that receive FFT is not as clear; however, TRS emissions from FFT are expected to be low.
This is largely because the FFT do not contain much carbon in a form appropriate to support
microbial activity that produces H2S (Foght 2015).
• Ponds are not considered a source of PAC emissions because there is no mechanism for the ponds to
release PAC emissions. PAC emissions have not been confirmed by direct measurements of pond
surfaces.
• Elevated methane emissions are associated with the two oldest ponds that receive FTT. There is
potential for the FFT to produce methane that could be proportional to the volume of FFT in the pond.
However, methane formation is often delayed (e.g., 15 years for bubbling and 35 years for intensive
bubbling) (Burkus et al. 2014).
Although the 2013 regional emission measurements include some inherent variability, they are consistent
with the 2011 and 2012 measurements presented in Small et al. (2015).
Teck recognizes that each tailings pond is unique. The company will monitor potential fugitive tailings
pond emissions during operations to understand the emission profiles associated with the Project’s
tailings ponds.
FRONTIER OIL SANDS MINE PROJECT 3 SOC RESPONSES 3.3 AIR
RESPONSES TO FMM SOCS – APRIL 2016 Page 39
References
Burkus, Z., J. Wheler and S. Pletcher. 2014. GHG Emissions from Oil Sands Tailings Ponds. Part I:
Review of the Tailings Ponds Facts and Practices. Prepared by Alberta Environment and
Sustainable Resource Development, Edmonton, Alberta.
Foght, J. 2015. Microbial metagenomics of oil sands tailings ponds: small bugs, big data. Genome 58:
507–510.
Small, C., S. Cho, Z. Hashiso, and A. Ulrich. 2015. Emissions from oil sands tailings ponds: Review of
tailings pond parameters and emission estimates. Journal of Petroleum Science and Engineering
127: 490–501 Available at: http://dx.doi.org/10.1016/j.petrol.2014.11.020.
SOC 12
FMM Reference and Topic:
FMM [12], Section 3.3 Air Quality Assessment and Modelling
Acid Deposition
Dust Emissions and Acidification Mitigation
McMurray Métis recommends that Teck applies best practices in minimizing dust emissions and
does not rely on base cation deposition for mitigating risks associated with acidification in the
region.
Teck Response:
See Key Theme – Agreement and Regulator Requests (Section 2.4).
FRONTIER OIL SANDS MINE PROJECT 3 SOC RESPONSES 3.3 AIR
RESPONSES TO FMM SOCS – APRIL 2016 Page 40
SOC 13
FMM Reference and Topic:
FMM [13], Section 3.3 Air Quality Assessment and Modelling
Acid Deposition
Dust Emissions and Soil Alkalization
McMurray Métis recommends that Teck assesses the potential for dust-related soil alkalization
impacts.
Teck Response:
See Key Theme – Adequacy of the Environmental Impact Assessment (Section 2.1).
SOC 14
FMM Reference and Topic:
FMM [14], Section 3.6 Mitigations Measures
Mine Fleet Emissions
Mine Fleet NOX Emissions
McMurray Métis recommends that Teck commits to exploring options to reduce mine fleet NOX
emissions. These options, at a minimum, should include requesting that manufacturers
commercially produce lower NOX-emitting hauler units and evaluating retrofit NOX emission
controls for controlling emissions from existing or new hauler units.
Teck Response:
See Key Theme – Agreement and Regulator Requests (Section 2.4).
FRONTIER OIL SANDS MINE PROJECT 3 SOC RESPONSES 3.3 AIR
RESPONSES TO FMM SOCS – APRIL 2016 Page 41
SOC 15
FMM Reference and Topic:
FMM [15], Section 3.6 Mitigations Measures
Cogeneration Units Emissions
Cogeneration NOX Emissions
McMurray Métis recommends that Teck considers selective catalytic reduction as BATEA for its
co-generation units.
Teck Response:
See Key Theme – Agreement and Regulator Requests (Section 2.4) and the response to AER Round 5
SIR 48.
SOC 16
FMM Reference and Topic:
FMM [16], Section 3.6 Mitigations Measures
Cogeneration Units Emissions
Cogeneration NOX Emissions
McMurray Métis recommends that regulators defer establishing NOX limits for the co-generations
units so that emission limits can be established based on regulations current at the time of detailed
design and equipment procurement.
Teck Response:
See Key Theme – Agreement and Regulator Requests (Section 2.4).
FRONTIER OIL SANDS MINE PROJECT 3 SOC RESPONSES 3.3 AIR
RESPONSES TO FMM SOCS – APRIL 2016 Page 42
SOC 17
FMM Reference and Topic:
FMM [13], Section 3.3 Air Quality Assessment and Modelling
Mine and Tailings Emissions
Mine Emissions
McMurray Métis recommends that Teck adopts best practices in phasing mine operations to
minimize exposed bituminous surfaces and to minimize mine face emissions.
Teck Response:
See Key Theme – Agreement and Regulator Requests (Section 2.4).
SOC 18
FMM Reference and Topic:
FMM [18], Section 3.6 Mitigations Measures
Mine and Tailings Emissions
Tailings Emissions
McMurray Métis recommends that Teck minimize tailings pond water surface area where possible
as a measure to minimize tailings emissions.
Teck Response:
The areal extent of a pond’s design is determined by considerations such as:
• the volume required to contain the tailings and water
• the availability and quality of the containment material
• the slopes of the internal and external containment walls (i.e., dykes)
Operational considerations and constraints associated with the ponds relate to:
• the amount of construction materials and distance that those materials have to be transported
• the distance that tailings have to be transported during operation and reclamation activities
For end pit disposal, the areal extent is also influenced by the size and depth of the mine pit.
FRONTIER OIL SANDS MINE PROJECT 3 SOC RESPONSES 3.3 AIR
RESPONSES TO FMM SOCS – APRIL 2016 Page 43
Teck has addressed these considerations in designing tailings areas for the Project (for details, see
Volume 1, Section 6 of the Project Update).
Although the Project will have several ponds, the external tailings areas (ETA 1 and ETA 2) that receive
froth treatment tailings (FTT) will be the main fugitive emission sources. Fugitive emissions from these
tailings areas appear to be related to unrecovered diluent in the froth that is directed to the ETAs.
Measurements of fugitive gaseous emissions from these types of ponds are often expressed as a flux
(i.e., tonnes per hectare per annum [t/ha/a]). An emission measurement expressed as a flux needs to be
multiplied by the representative area (i.e., hectares) to determine the emission rate (i.e., tonnes per
annum [t/a]); however, there are no known studies that indicate fugitive emission rates are physically
dependent on the surface area. Therefore, a reduction in the area of tailings ponds is not considered
proven mitigation.
SOC 19
FMM Reference and Topic:
FMM [19], Section 3.6 Mitigations Measures
Mine and Tailings Emissions
Diluent Loss Target
McMurray Métis recommends that Teck commits to establishing a diluent loss target of 3
volumes/1000 barrels of production.
Teck Response:
See Key Theme – Agreement and Regulator Requests (Section 2.4).

FRONTIER OIL SANDS MINE PROJECT 3 SOC RESPONSES 3.3 AIR
RESPONSES TO FMM SOCS – APRIL 2016 Page 44
SOC 20
FMM Reference and Topic:
FMM [20], Section 3.7 Community Engagement and Regional Initiatives
Odour Management Plan
Odour Management and Notification Plan
McMurray Métis recommends that Teck works with McMurray Métis throughout the life of the
Frontier Mine Project to develop, adopt and apply an odour management and notification plan to
address odour issues associated with the Frontier Project.
Teck Response:
See Key Theme – Agreement and Regulator Requests (Section 2.4).
SOC 21
FMM Reference and Topic:
FMM [21], Section 3.7 Community Engagement and Regional Initiatives
Haze, Visibility, and Light Pollution
Visibility and Light Notification and Management Plan
McMurray Métis recommends that Teck works with McMurray Métis throughout the life of the
Frontier Mine Project to develop and apply a protocol for receiving and following-up on complaints
or concerns related to visibility or light issues associated with the Frontier Project.
Teck Response:
See Key Theme – Agreement and Regulator Requests (Section 2.4).
FRONTIER OIL SANDS MINE PROJECT 3 SOC RESPONSES 3.3 AIR
RESPONSES TO FMM SOCS – APRIL 2016 Page 45
SOC 22
FMM Reference and Topic:
FMM [22], Section 3.7 Community Engagement and Regional Initiatives
Regional Initiatives
McMurray Métis recommends that Teck continues to support, participate in, and financially fund
regional multi-stakeholder organizations. McMurray Métis also requests that Teck provides
support for the community to meaningfully participate in these organizations as well as in other
forums such as AEMERA or LARP.
Teck Response:
See Key Theme – Agreement and Regulator Requests (Section 2.4).
SOC 23
FMM Reference and Topic:
FMM [23], Section 3.7 Community Engagement and Regional Initiatives
Sharing Information
McMurray Métis recommends that Teck regularly shares ambient air monitoring and emissions
monitoring data to provide the opportunity for McMurray Métis to observe trends in the Frontier
Project’s environmental performance.
Teck Response:
See Key Theme – Agreement and Regulator Requests (Section 2.4).
FRONTIER OIL SANDS MINE PROJECT 3 SOC RESPONSES 3.4 HYDROGEOLOGY
RESPONSES TO FMM SOCS – APRIL 2016 Page 46
3.4 Hydrogeology
SOC 24
FMM Reference and Topic:
FMM [24], Section 4.6 Groundwater Assessment
Seepage Control System
With regard to the seepage control system, McMurray Métis recommends that Teck provides the
opportunity for McMurray Métis to review the proposed seepage or groundwater monitoring plan
submitted to government. McMurray Métis also requests that Teck regularly (i.e., annually) briefs
McMurray Métis on or technically reviews the project’s performance reports on the seepage
control wells, including total volumes captured, and estimates of the percent of process-affected
seepage captured by the wells.
Overall, the seepage-control system design appears to be adequate but there is a greater likelihood
that process-affected seepage could migrate away from the site and so for this reason, McMurray
Métis would like to continue to be consulted on operations and monitoring of the seepage control
system. This is critical; monitoring groundwater and nearby connected surface waters should be
conducted and reported on in a coordinated and transparent manner and findings outside those
predicted in the EIA and Project Update should be promptly reported to the community.
Teck Response:
See Key Theme – Agreement and Regulator Requests (Section 2.4).
FRONTIER OIL SANDS MINE PROJECT 3 SOC RESPONSES 3.4 HYDROGEOLOGY
RESPONSES TO FMM SOCS – APRIL 2016 Page 47
SOC 25
FMM Reference and Topic:
FMM [25], Section 4.6 Groundwater Assessment
Seepage Control System
McMurray Métis recommends that Teck consults with the community on whether or not it is
considered feasible to install the interceptor trench earlier, i.e., before operations cease, if there are
indications of process-affected seepage flowing downgradient of the interceptor wells that might
travel beyond the proposed location of the interceptor trench by the time of closure.
Teck Response:
See Key Theme – Agreement and Regulator Requests (Section 2.4).
SOC 26
FMM Reference and Topic:
FMM [26], Section 4.6 Groundwater Assessment
Seepage Control System
Additionally, since far-future seepage modelling suggests the potential for off-site migration to the
southeast of the ETAs, McMurray Métis recommends that Teck considers the alternative of
potentially continuing to operate the active hydraulic control system (i.e., with pumping wells) for a
longer period of time beyond operations while the cut-off ditch is phased in and monitoring
indicates that the pumping wells are redundant and can be decommissioned.
Teck Response:
See Key Theme – Agreement and Regulator Requests (Section 2.4).
FRONTIER OIL SANDS MINE PROJECT 3 SOC RESPONSES 3.4 HYDROGEOLOGY
RESPONSES TO FMM SOCS – APRIL 2016 Page 48
SOC 27
FMM Reference and Topic:
FMM [27], Section 4.6 Groundwater Assessment
Support Regional Initiatives
McMurray Métis recommends that Teck helps fund completion of groundwater-related CEMA
project initiatives so that recommendations can be forwarded to government that have had multi-
stakeholder involvement and consensus on potential frameworks.
Teck Response:
See Key Theme – Agreement and Regulator Requests (Section 2.4).

FRONTIER OIL SANDS MINE PROJECT 3 SOC RESPONSES 3.5 WATER QUALITY, AQUATICS AND FISH HABITAT OFFSETTING PLANS
RESPONSES TO FMM SOCS – APRIL 2016 Page 49
3.5 Water Quality, Aquatics and Fish Habitat Offsetting Plans
SOC 28
FMM Reference and Topic:
FMM [28], Section 5.3 Water Quality, Aquatics and Fish Habitat Offsetting Plans Key Concerns and Recommendations
Tailings Impoundment Failure and Seepage
McMurray Métis recommends that Teck:
i. provides a full assessment of the impacts to the FHCL, Redclay Creek watershed, Athabasca
River and downstream areas should an External Tailings Area suffer massive structural failure
for any reason;
ii. provides contingency plans and potential mitigation if the barrier walls and seepage capture of
the External Tailings Areas do not perform as anticipated in preventing seepage from
contaminating groundwater and surface waters; and
iii. assesses the potential impacts of discharging up to 40 L/s (3500 m³/d; Figure 7-13) of process-
affected seepage to the fish habitat compensation lake.
Teck Response:
i. See Key Theme – Adequacy of the Environmental Impact Assessment (Section 2.1).
ii. See Key Theme – Management, Mitigation and Monitoring (Section 2.2).
iii. See the response to CEAA Round 5 SIR 167b.
FRONTIER OIL SANDS MINE PROJECT 3 SOC RESPONSES 3.5 WATER QUALITY, AQUATICS AND FISH HABITAT OFFSETTING PLANS
RESPONSES TO FMM SOCS – APRIL 2016 Page 50
SOC 29
FMM Reference and Topic:
FMM [29], Section 5.3 Water Quality, Aquatics and Fish Habitat Offsetting Plans Key Concerns and Recommendations
Downstream Water and Sediment Quality
McMurray Métis recommends that Teck:
i. adds total and alkylated forms of dibenzothiophene in sediments to the list of monitored
substances for any watercourses or lakes (i.e., FHCL) downstream of the project; and
ii. ensures that the analytical laboratories contracted for water and sediment analyses are capable
of achieving detection limits at criteria intended to protect aquatic life.
Teck Response:
i. See Key Theme – Management, Mitigation and Monitoring (Section 2.2).
ii. Analytical laboratories contracted for Project water and sediment analyses are accredited by the
Canadian Association for Laboratory Accreditation Inc. (CALA). Under CALA’s accreditation
program, performance evaluation assessments are conducted annually for laboratory procedures,
methods and internal quality control. Where achievable, the detection limit for each substance
analyzed is less than the corresponding water or sediment quality guideline. Detection limits less than
water and sediment quality guidelines may not be achievable for all samples (e.g., where dilutions are
required because of high dissolved solids or other matrix effects). Teck will continue to confirm that
appropriate detection limits (i.e., less than water or sediment quality guidelines) are used for all water
and sediment analyses conducted for the Project.
In some cases, laboratories that are not CALA-accredited (e.g., university laboratories) may be used
for water and sediment analyses. Non-accredited laboratories would be used only in rare cases where
they provide a specialized service that is not available at an accredited laboratory.

FRONTIER OIL SANDS MINE PROJECT 3 SOC RESPONSES 3.5 WATER QUALITY, AQUATICS AND FISH HABITAT OFFSETTING PLANS
RESPONSES TO FMM SOCS – APRIL 2016 Page 51
SOC 30
FMM Reference and Topic:
FMM [30], Section 5.3 Water Quality, Aquatics and Fish Habitat Offsetting Plans Key Concerns and Recommendations
Muskeg and Overburden Drainage – Mercury
McMurray Métis recommends that Teck models mercury and methylmercury loadings to the
FHCL and any downstream waters, including the Athabasca River, considering uptake by
piscivorous fish and waterbirds. Models should consider the potential methylmercury production,
augmentation of mercury export and bioaccumulation under both the Application and Planned
Development (cumulative impact) cases.
Teck Response:
Mercury and methyl mercury loadings to the fish habitat compensation lake (FHCL) will be addressed in
the detailed fisheries offsetting plan (DFOP) for the Project. Similar to the work completed for the Shell
Jackpine Mine Expansion (JME), Teck will use regional data to describe mercury and methyl mercury
concentrations in water, benthic invertebrates, plankton, zooplankton and fish, and will rely on literature
values for anticipated rates of increase. Literature values will be drawn mainly from flooded hydroelectric
reservoirs in northern Canada and Europe. Similar to the work completed for the JME, a conservative
approach will be adopted whereby the highest rates of increase in mercury concentrations (in water and
biota) observed in flooded reservoirs will be applied to the FHCL. This estimate will provide a reasonable
“worst-case” prediction of mercury concentrations and an anticipated timeline to return to baseline
conditions.
FRONTIER OIL SANDS MINE PROJECT 3 SOC RESPONSES 3.5 WATER QUALITY, AQUATICS AND FISH HABITAT OFFSETTING PLANS
RESPONSES TO FMM SOCS – APRIL 2016 Page 52
SOC 31
FMM Reference and Topic:
FMM [31], Section 5.3 Water Quality, Aquatics and Fish Habitat Offsetting Plans Key Concerns and Recommendations
Pit Lake Residual Toxicity and Research
McMurray Métis recommends that Teck:
i. commits to ongoing participation in pit lake research, including studies of bottom sediments
and possible transfer of contaminants through the aquatic food chain, as well as bioturbation
and wind-induced resuspension of sediments;
ii. provides to McMurray Métis results or reports on any studies into pit lake sediments and
transfer of contaminants to aquatic food webs;
iii. updates its assessment to include the fate and transport of naphthenic acids and PAHs over
time in its pit lakes, and reports on those substances that are expected to exceed effects
benchmarks, notably in sediments; and
iv. develops and provides a hydrological model that predicts the time to fill its pit lakes, and water
losses from source waters such as wetlands and streams, including built-in mitigation to protect
against excessive water drawdown and dry-out of these systems.
Teck Response:
i. See Key Theme – Agreement and Regulator Requests (Section 2.4).
ii. See Key Theme – Agreement and Regulator Requests (Section 2.4).
iii. See the response to CEAA Round 5 SIR 141e.
iv. Teck has prepared a conceptual closure drainage plan for the Project that estimates the total duration
for developing the closure landscape and drainage system (see Volume 1, Section 13.6.4 of the
Project Update). The level of conceptual design and planning for the Project is comparable to other
regulatory applications and approvals for existing oil sands mines, and is consistent with the terms of
reference for the Project (AENV 2009). The timing of specific activities and drainage features will be
strongly influenced by operational implementation of the mine plan. Teck will continue to refine and
update this plan as part of more detailed future engineering. For this reason, it is not possible to
forecast and provide an accurate, detailed timeline for specific reclamation activities.
FRONTIER OIL SANDS MINE PROJECT 3 SOC RESPONSES 3.5 WATER QUALITY, AQUATICS AND FISH HABITAT OFFSETTING PLANS
RESPONSES TO FMM SOCS – APRIL 2016 Page 53
References
AENV (Alberta Environment). 2009. Final Terms of Reference Environmental Impact Assessment Report
for the Proposed UTS Energy Corporation/Teck Cominco Limited Frontier Oil Sands Mine
Project. Edmonton, Alberta.
SOC 32
FMM Reference and Topic:
FMM [32], Section 5.3 Water Quality, Aquatics and Fish Habitat Offsetting Plans Key Concerns and Recommendations
Aerial Emissions and Snowmelt Concentrations of Contaminants
McMurray Métis recommends that Teck:
i. provides an update of the cumulative impacts of aerial emissions in surface waters, including
any further snow survey results; and
ii. commits to sharing snowmelt data that exceed water quality guidelines, as soon as possible, not
just upon request.
Teck Response:
i. See Key Theme – Adequacy of the Environmental Impact Assessment (Section 2.1).
ii. See Key Theme – Agreement and Regulator Requests (Section 2.4).
SOC 33
FMM Reference and Topic:
FMM [33], Section 5.3 Water Quality, Aquatics and Fish Habitat Offsetting Plans Key Concerns and Recommendations
Loss of Traditionally Significant Surface Waters

FRONTIER OIL SANDS MINE PROJECT 3 SOC RESPONSES 3.5 WATER QUALITY, AQUATICS AND FISH HABITAT OFFSETTING PLANS
RESPONSES TO FMM SOCS – APRIL 2016 Page 54
McMurray Métis recommends that Teck:
i. meets with McMurray Métis to discuss how it might support the community with access to and
preservation of special places, including but not limited to, habitation sites in the Frontier
Project lease;
ii. provides details about the evaluation of the size and length of Red Clay Creek to determine if
the watershed can support connecting the proposed compensation lake to the Athabasca River;
and
iii. provides more information about the hydrogeological and surface water connections between
wetlands in the Red Clay Creek diversion area.
Teck Response:
i. See Key Theme – Agreement and Regulator Requests (Section 2.4).
ii. The fish habitat compensation lake (FHCL) outlet channel will connect the lake to the lower Redclay
Creek channel downstream of the PDA. The lower Redclay Creek channel, which connects to the
Athabasca River, is sinuous, unconfined and divided longitudinally into three reaches based on
differences in channel characteristics (see Table 33-1). The upper Redclay Creek watershed will be
connected to the Athabasca River through the FHCL.
Flow statistics for the lower Redclay Creek downstream of the FHCL are provided in Volume 3,
Section 6.4.5.3, Table 6-10 of the Project Update. The data suggest that flows in the lower Redclay
Creek will:
• be maintained for all seasons
• increase at the start of operation because of release from muskeg drainage and runoff from
cleared areas
• decrease at end of mining due to closed-circuit areas
• increase at closure (except flood flows) from the predevelopment conditions
iii. The diversion channel layout is shown in Volume 1, Section 7.7.2, Figure 7.7-3 of the Project Update.
Figure 33-1 shows a typical cross-section of the diversion channel and illustrates the connections
between water levels in the diversion channel and groundwater in lowland areas (e.g., wetlands)
adjacent to the diversion channel.
The normal operating water level in the diversion channel will be approximately 2 m below the
original ground surface. This will cause local groundwater drawdown during normal-flow conditions.
The drawdown influence is estimated to occur in the area within about 200 m of the diversion channel
banks.
During high flows such as floods, local groundwater tables adjacent to the diversion channel will rise
to the ground surface, and the surficial aquifer will be recharged during such flow events.
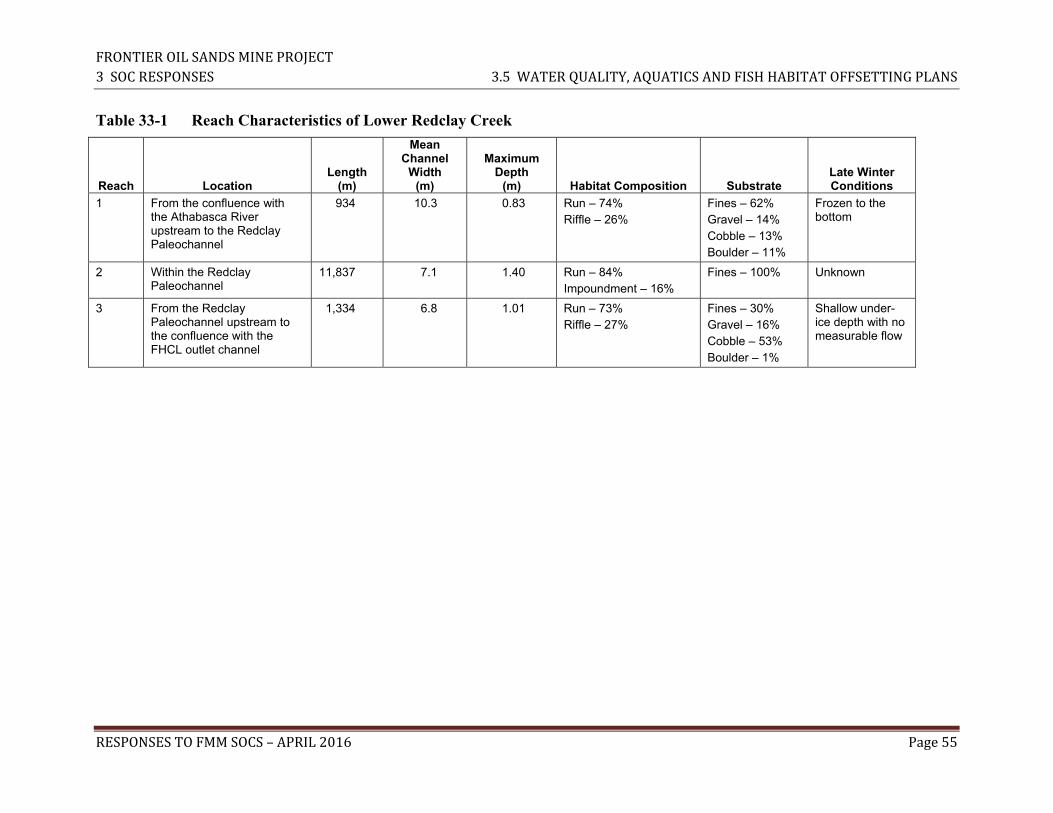
FRONTIER OIL SANDS MINE PROJECT 3 SOC RESPONSES 3.5 WATER QUALITY, AQUATICS AND FISH HABITAT OFFSETTING PLANS
RESPONSES TO FMM SOCS – APRIL 2016 Page 55
Table 33-1 Reach Characteristics of Lower Redclay Creek
Reach Location Length
(m)
Mean Channel
Width (m)
Maximum Depth
(m) Habitat Composition Substrate Late Winter Conditions
1 From the confluence with the Athabasca River upstream to the Redclay Paleochannel
934 10.3 0.83 Run – 74% Riffle – 26%
Fines – 62% Gravel – 14% Cobble – 13% Boulder – 11%
Frozen to the bottom
2 Within the Redclay Paleochannel
11,837 7.1 1.40 Run – 84% Impoundment – 16%
Fines – 100% Unknown
3 From the Redclay Paleochannel upstream to the confluence with the FHCL outlet channel
1,334 6.8 1.01 Run – 73% Riffle – 27%
Fines – 30% Gravel – 16% Cobble – 53% Boulder – 1%
Shallow under-ice depth with no measurable flow

FRONTIER OIL SANDS MINE PROJECT 3 SOC RESPONSES 3.5 WATER QUALITY, AQUATICS AND FISH HABITAT OFFSETTING PLANS
RESPONSES TO FMM SOCS – APRIL 2016 Page 56
Figure 33-1 Cross-Section of the Diversion Channel
FRONTIER OIL SANDS MINE PROJECT 3 SOC RESPONSES 3.5 WATER QUALITY, AQUATICS AND FISH HABITAT OFFSETTING PLANS
RESPONSES TO FMM SOCS – APRIL 2016 Page 57
SOC 34
FMM Reference and Topic:
FMM [34], Section 5.4 Fish and Aquatic Habitat Key Concerns and Requests
Fish Rescue from Destroyed or Diverted Streams and Lakes
McMurray Métis recommends that Teck confirms that it will rescue all fish species from all aquatic
habitats that will be destroyed, diverted or isolated, including those that support fish during any
season, and will not limit the rescue operations to those waters that support large-bodied fish
species. McMurray Métis requests the opportunity to be involved in fish rescue and fish habitat
compensation monitoring.
Teck Response:
See Key Theme – Agreement and Regulator Requests (Section 2.4).
SOC 35
FMM Reference and Topic:
FMM [35], Section 5.4 Fish and Aquatic Habitat Key Concerns and Requests
Tissue Residue Guideline – Mercury in Fish
McMurray Métis recommends that Teck provides justification and details about the sources of
information, mercury concentrations, species and size of fish that were used to develop the fish
tissue concentration estimates for the Pre-development and Application cases.
Teck Response:
The estimated predevelopment and Application Case mercury fish tissue concentrations were calculated
using a mercury bioconcentration factor (BCF) that was based on the central tendency (95% upper
confidence limit of the mean [95UCLM]) of observed fish tissue concentrations (see additional detail
provided below). The 95UCLM was considered appropriate because (i) it represents a reasonable worst-
case average accumulation of mercury (i.e., highest 95UCLM of multiple years, based on fish species
with the highest observed mercury accumulation) for fish in the receiving environment, and (ii) it is
consistent with the methods applied for estimating mercury exposure in people consuming fish. Although
individual fish tissue concentrations identified as part of regional monitoring might exceed this 95UCLM,
these individual fish would not represent exposure in the fish population as a whole. Furthermore, the
FRONTIER OIL SANDS MINE PROJECT 3 SOC RESPONSES 3.5 WATER QUALITY, AQUATICS AND FISH HABITAT OFFSETTING PLANS
RESPONSES TO FMM SOCS – APRIL 2016 Page 58
estimated predevelopment mercury fish tissue concentration does not represent an estimate of the existing
or current mercury fish tissue concentrations in the region; the Application Case estimate (which is almost
seven times higher than the predevelopment estimate) is anticipated to be more consistent with the current
average mercury fish tissue concentrations in the region.
Predevelopment and Application Case fish tissue estimates were based on water quality predictions for
predevelopment and Application Case, respectively, and the estimated mercury BCF. As presented in
Volume 3, Section 7.11.5, Table 7-46 of the Project Update:
• The estimated mercury fish tissue concentration (i.e., 0.058 mg/kg wet weight) for predevelopment
conditions was calculated by multiplying the predevelopment median concentration in water
(0.0000004 mg/L) by the mercury BCF (145,673 L/kg).
• The estimated mercury fish tissue concentration (i.e., 0.39 mg/kg wet weight) for the Application
Case was calculated by multiplying the predicted Application Case maximum median concentration
in water (0.0000027 mg/L) by the mercury BCF (145,673 L/kg).
Volume 3, Appendix 12B, Section 12B.9 of the Project Update describes the method for calculating
BCFs for fish. The mercury BCF was calculated based on the predicted predevelopment surface water
quality in the Athabasca River (downstream of Redclay Creek) and the fish mercury exposure point
concentration used in the human health risk assessment for this location.
For additional information on mercury concentrations in fish tissues based on monitoring data, see
Volume 3, Appendix 12B, Section 12B.7 of the Project Update. These data were used to derive the
mercury BCF. As described in Section 12B.7, the most recent fish tissue quality data are available from
the Regional Aquatics Monitoring Program (RAMP 2015) and focus on mercury concentrations in
specific fish species (e.g., lake whitefish, northern pike and walleye). Baseline data used in the Project
Update were entirely based on the most recent three years of available data from RAMP (i.e., 2005, 2008
and 2011) and focus on the Athabasca and Muskeg rivers given their proximity to the Project. The
maximum 95UCLM for walleye (based on the most recent three years of available mercury data) was
used to characterize baseline mercury concentrations in fish tissue. Mercury concentrations in walleye
were selected because they represented the highest mercury concentrations of the three fish species. The
RAMP fish tissue data for mercury were collected from walleye measuring 212 mm to 635 mm fork
length and 91 g to 3,060 g total weight.
The site-specific mercury BCF estimated for the Project Update (145,673 L/kg) is substantially higher
than the recommended values for mercuric chloric (3,530 L/kg) and methylmercury (11,168 L/kg)
(U.S. EPA 1999). Therefore, the site-specific value adds conservatism to the assessment because it results
in higher predicted mercury tissue concentrations than these recommended values.
FRONTIER OIL SANDS MINE PROJECT 3 SOC RESPONSES 3.5 WATER QUALITY, AQUATICS AND FISH HABITAT OFFSETTING PLANS
RESPONSES TO FMM SOCS – APRIL 2016 Page 59
References
RAMP (Regional Aquatics Monitoring Program). 2015. Fish Tissue Program Data. Available at:
http://www.ramp-alberta.org/data/Fisheries/Tissue/Tissue.aspx. Accessed December 2015.
U.S. EPA (United States Environmental Protection Agency). 1999. Screening Level Ecological Risk
Assessment Protocol. Appendix C: Media-To-Receptor BCF Values. U.S. EPA Office of Solid
Waste, Multimedia Planning and Permitting Division, Center for Combustion Science and
Engineering.
SOC 36
FMM Reference and Topic:
FMM [36], Section 5.4 Fish and Aquatic Habitat Key Concerns and Requests
Tissue Residue Guideline – Mercury in Fish
Given that Teck’s calculation of future fish tissue residue for mercury under the Application Case
is close to seven times higher than the current level (and ten times higher than the TRG for wildlife
that consume aquatic biota), McMurray Métis requests that Teck addresses potential impacts to
wildlife that consume fish, including waterbirds.
Teck Response:
The updated surface water quality assessment uses a methyl mercury concentration of 0.058 mg/kg-ww as
an estimate of predevelopment fish tissue concentrations (see Volume 3, Section 7.11.5, Table 7-46 and
Section 7.11.6, Table 7-57 of the Project Update). This value does not represent the actual (or existing)
concentrations of methyl mercury in large predatory fish that were used to describe the potential effects of
the Project on wildlife consumers of fish (piscivorous wildlife) in the wildlife health risk assessment
(WHRA). Those details are provided in Volume 3, Section 13 of the Project Update:
• See Tables 13-22, 13-23 and 13-31 for fish methyl mercury concentrations used to assess potential
effects on piscivorous wildlife (horned grebe, whooping crane and river otter)
• See Section 13.5.1.3 for a list of piscivorous wildlife species identified as receptors of potential
concern (ROPC) and included in the WHRA
• See Section 13.7.2 for results and discussion of the wildlife effects analysis related to the methyl
mercury concentrations.
The existing methyl mercury fish concentration used in the WHRA is 0.44 mg/kg-ww.
FRONTIER OIL SANDS MINE PROJECT 3 SOC RESPONSES 3.5 WATER QUALITY, AQUATICS AND FISH HABITAT OFFSETTING PLANS
RESPONSES TO FMM SOCS – APRIL 2016 Page 60
Results of the WHRA as it relates to methyl mercury are summarized as follows:
River Otter: Predicted methyl mercury hazard quotients (HQs) for river otter exceeded 1.0 for the
existing condition, Base Case, Application Case, PDC, pit lakes and fish habitat compensation lake
(FHCL) scenarios. Fish consumption accounts for 99% of this species’ exposure to methyl mercury.
However, HQ values greater than 1.0 are due, in part, to conservative assumptions applied in the WHRA.
For example:
• Measured mercury concentrations were based on large-bodied sport fish (i.e., walleye) ranging in
length from 200 mm to 600 mm. However, river otters generally prefer fish ranging from 150 mm to
170 mm (Erlinge 1968).
• River otters are expected to consume a variety of herbivorous and piscivorous fish species that would
accumulate various levels of mercury. The WHRA conservatively assumes they eat only walleye, a
predatory fish that tends to accumulate higher levels of mercury compared to smaller fish such as lake
whitefish.
Based on a more realistic set of exposure parameters, the HQs did not exceed 1.0 for the river otter (see
Volume 3, Section 13.7.2.3 of the Project Update).
Horned Grebe and Whooping Crane: Predicted methyl mercury HQs for the horned grebe and
whooping crane exceeded the benchmark of 1.0 in several scenarios. These risks were also based on the
assumption that the horned grebe and whooping crane would exclusively eat large-bodied sport fish
(i.e., walleye) ranging in length from 200 mm to 600 mm. In reality, these fish would be too large for the
horned grebe and whooping crane to eat. Typically the grebe preys on fish that are between 20 mm and
120 mm in length (Piersma 2009), while the whooping crane tends to prey upon minnows that are less
than 20 mm in length (Sonnenblick et al. 2012). As such, the fish size and mercury concentrations
assumed for these two birds are probably unrealistic. With more realistic exposure parameters
(e.g., smaller fish sizes), total mercury concentrations in fish consumed by horned grebe and whooping
crane are expected to be below 0.1 mg/kg-ww. Assuming that existing fish mercury concentrations were
0.1 mg/kg-ww, methyl mercury HQs would not exceed the benchmark of 1.0 for the horned grebe and
whooping crane (see Volume 3, Section 13.7.2.2 of the Project Update).
References
Erlinge, S. 1968. Food studies on captive otters Lutra lutra L. Oikos 19: 259–270.
Piersma, T. 2009. Body size, nutrient reserves and diet of Red-necked and Slavonian Grebes Podiceps
grisegena and P. auritus on Lake Usselmeer, The Netherlands. Bird Study 35: 1, 13–24.
Sonnenblick, K., S. Klosiewski and B.B. Kienbaum. 2012. A Closer Look at Whooping Cranes:
Whooping Crane Education in Wisconsin and Eastern North America. Wisconsin Department of
Natural Resources. PUB-ER-661.
FRONTIER OIL SANDS MINE PROJECT 3 SOC RESPONSES 3.5 WATER QUALITY, AQUATICS AND FISH HABITAT OFFSETTING PLANS
RESPONSES TO FMM SOCS – APRIL 2016 Page 61
SOC 37
FMM Reference and Topic:
FMM [37], Section 5.4 Fish and Aquatic Habitat Key Concerns and Requests
Accounting for Residual Impacts on Fish Abundance and Productivity
McMurray Métis recommends that Teck:
i. clarifies statements that indicate effects on fish abundance are not anticipated in the aquatics
LSA (when it is known that the compensation lake will not account for all losses in the LSA);
ii. since fish might occur in the lower reaches of Big and Redclay creeks during any open water
season, provides values and percent reduction of low flows (e.g., 7Q2, 7Q10) in addition to a
reduction in mean annual flows, including whether there might be occasions when there is no
flow in these watercourses compared to the current scenario, and then translate this into fish
habitat or productivity losses;
iii. identifies which fish species will lose habitat in Big Creek, Redclay Creek and other waters in
the LSA that will not benefit from the compensation lake;
iv. justifies ranking residual effects to fish as ‘reversible’ and ‘medium duration’ considering
biologically relevant timespans, including the fact that the duration of effects will extend for
several generations of most fish species; and
v. given that the cause of lost aquatic habitat in lower Big and Redclay creeks is lack of flow (due
to withheld or re-directed water), evaluates and considers possible mitigative solutions that
would provide additional instream flow to these watercourses rather than gradually
diminishing flows over the course of operations.
Teck Response:
i. The conceptual fisheries offsetting plan (CFOP) includes a 60 ha fish habitat compensation lake
(FHCL), which would be located in the aquatics LSA and provide a portion of the required offset for
habitat losses associated with the Project. The CFOP also identifies additional offsetting options that
could be used, in whole or in combination, to provide the full offset (see Volume 1, Section 15.4 of
the Project Update). These additional offsetting options include options both within and outside of the
LSA.
Consultation with stakeholders and regulators regarding these offsetting options is part of the ongoing
development of the offsetting plan. Following consultation, Teck will develop a draft detailed
fisheries offsetting plan (DFOP). This plan will include offsetting measures that are located in the
FRONTIER OIL SANDS MINE PROJECT 3 SOC RESPONSES 3.5 WATER QUALITY, AQUATICS AND FISH HABITAT OFFSETTING PLANS
RESPONSES TO FMM SOCS – APRIL 2016 Page 62
aquatics LSA to account for all habitat losses in the LSA and maintain habitat productivity and fish
abundance in the LSA.
ii. Predicted changes in low flows (i.e., 7Q10 low flow discharge) for Athabasca River tributaries in the
aquatics LSA are provided in the updated hydrology assessment (see Volume 3, Section 6.4.5.3,
Tables 6-9 to 6-11 of the Project Update). These changes range from no change to small increases in
7Q10 flows for Big Creek and Redclay Creek. Because the predicted changes in low flows are small
and consist of flow increases, these changes are considered to have no potential for adverse effects on
fish or fish habitat.
iii. Some fish species may be affected by predicted habitat changes in lower Redclay Creek and lower
Big Creek, but not benefit from the FHCL. This would include species present in affected habitats but
that are not included in the FHCL’s target fish community (and do not otherwise naturally colonize
the lake).
The target fish community for the FHCL is being developed for the draft DFOP as part of the ongoing
refinement of the offsetting plan, based on consultation with regulators and potentially affected
Aboriginal communities. At present, it is known that the FHCL will include some (but not all) of the
affected fish species since the total number of fish species for the FHCL is less than the number of
species present in the two natural watercourses. However, the FHCL system will be designed to allow
for some level of use by all species that use the Big Creek and Redclay Creek watersheds, should they
choose to access the new habitats.
Fish species documented or assumed to be present in lower Big Creek and lower Redclay Creek
include a number of sport fish, sucker and forage fish species (see Volume 1, Section 15.3.2,
Table 15.3-2 of the Project Update). The FHCL (located in the Redclay Creek watershed) will be
designed to provide a variety of habitats that meet all life stage requirements (i.e., spawning, nursery,
rearing, feeding, overwintering) of the various species of the target fish community. In addition, as
part of the development of the draft DFOP, the FHCL outlet channel will be designed to have a
naturalized, geomorphic channel that will be an analogue of the existing Redclay Creek channel at the
location of the FHCL. This design will provide (i) two-way passage for fish species that use the
natural habitats in Redclay Creek, and (ii) useable channel habitats such as riffle/run sequences and
associated diversity of substrates currently present in Redclay Creek. In combination, the FHCL and
outlet channel will provide a variety of new lake habitats as well as riverine habitats similar to the
adjacent Redclay Creek channel. The design will allow all species that use Redclay Creek to use the
FHCL outlet channel as habitat, and to access the FHCL to use the available lake habitats.
Several of the sucker and forage fish species present in lower Redclay Creek or Big Creek are also
present at the FHCL location, indicating these species can be expected to colonize the FHCL and
outlet channel soon after construction. Migratory fish species from the Athabasca River that use
tributary habitats in either Big Creek or Redclay Creek on a seasonal basis will also be able to access
the newly constructed habitats, should they choose to do so.
FRONTIER OIL SANDS MINE PROJECT 3 SOC RESPONSES 3.5 WATER QUALITY, AQUATICS AND FISH HABITAT OFFSETTING PLANS
RESPONSES TO FMM SOCS – APRIL 2016 Page 63
Most fish species that occur in lower Redclay Creek or lower Big Creek are either already present at
the planned FHCL location (e.g., longnose sucker, white sucker, brook stickleback, fathead minnow,
finescale dace, lake chub, longnose dace, northern redbelly dace, pearl dace, slimy sculpin and trout-
perch), or are migratory species capable of accessing the new habitats in the FHCL system
(e.g., Arctic grayling, burbot, northern pike and walleye). Species that use the lower natural creeks
and are unlikely to access the FHCL or outlet channel include yellow perch, flathead chub and
spottail shiner, three species that are generally known to be associated with the Athabasca River and
to have limited distributions in small tributary watersheds (RAMP 2004).
iv. The updated fish and fish habitat assessment (see Volume 3, Section 8 of the Project Update) rates the
predicted effects of habitat changes on fish habitat productivity and fish abundance in the aquatics
LSA as long duration and reversible. The duration scale is based on the duration of the changes
themselves, some of which are permanent. Effects were considered reversible in light of productive
compensation habitats, as described in the CFOP.
Although some time will be required for the newly constructed offsetting habitats to develop to their
full level of habitat productivity, current monitoring data for existing fish habitat compensation lakes
in the oil sands region indicate that initial habitat productivity develops rapidly, with fish populations
colonizing the new habitats as soon as they are available for use. This rapid colonization occurred in
cases where the new habitats were directly connected to natural fish-bearing habitats, as is the case
for the Project’s FHCL. Colonization also occurred most rapidly for species with the shortest
generational time-span (i.e., small-bodied forage fish species).
The full amount of offsetting habitat for the Frontier Project will be provided during construction,
whereas some of the effects of the Project on fish habitat productivity (e.g., effects on lower Redclay
Creek and lower Big Creek) do not occur at the construction snapshot, but rather, 25 years or later
during the diversion, maximum build-out or closure snapshots. This schedule limits the effects of the
delay in the full development of habitat productivity in the offsetting habitats.
v. Teck does not plan to implement further mitigation strategies that would provide additional flows to
Big Creek and Redclay Creek during operations. The current plan already includes appropriate
mitigation measures to reduce flow changes in lower Big Creek and lower Redclay Creek. However,
potential mitigation options may include pumping water within the release water drainage system
(i.e., to redistribute flow releases between the lower Big Creek and lower Redclay Creek) or using a
portion of the water withdrawn from the Athabasca River to supplement the flows in these two
creeks. Appropriate evaluation and consultation of these options would need to be conducted prior to
any changes to the water management plan described in Volume 1, Section 7 of the Project Update.

FRONTIER OIL SANDS MINE PROJECT 3 SOC RESPONSES 3.5 WATER QUALITY, AQUATICS AND FISH HABITAT OFFSETTING PLANS
RESPONSES TO FMM SOCS – APRIL 2016 Page 64
References
RAMP (Regional Aquatics Monitoring Program). 2004. Oil Sands Regional Aquatics Monitoring
Program (RAMP) 2004: Review of Historical Fisheries Information for Tributaries of the
Athabasca River in the Oil Sands Region. Prepared by Golder Associates Limited for the
Regional Aquatics Monitoring Program (RAMP) Steering Committee. February 2004.
SOC 38
FMM Reference and Topic:
FMM [38], Section 5.4 Fish and Aquatic Habitat Key Concerns and Requests
Pit Lakes as Fish Habitat
McMurray Métis recommends that Teck:
i. further explains the functionality as fish habitat and planned incorporation into local
ecosystems of its large end pit lakes that will be located far from fish that might naturally
colonize them; and,
ii. evaluates and discusses the timing and management of fish colonization of EPLs that ensures
fish are excluded until habitat quality (water, sediments, food) are confirmed to be non-toxic.
Teck Response:
i. The pit lakes are designed primarily as mine closure features. Shallow littoral habitats incorporated
into the lake design provide diverse aquatic habitat for promoting biological productivity. Unlike the
fish habitats that are part of the conceptual fisheries offsetting plan (CFOP), the pit lakes are not part
of the plan to offset the effects of the Project on productive fish habitats. The pit lakes are expected to
provide productive aquatic habitat on the closure landscape in addition to the habitats included in the
CFOP.
As described in the responses to AER Round 4 SIRs 19, 20, 21 and 27, the pit lakes closure drainage
system has naturalized geomorphic watercourse channels that will drain the lakes to downstream
natural watercourses where fish-bearing habitats are present. This will allow fish from downstream
habitats to access upstream portions of the closure drainage system and the pit lakes. The central pit
lake will be connected to the fish habitat compensation lake (FHCL) and lower Redclay Creek, and
the south pit lake will connect to fish-bearing habitat in lower Big Creek. The north pit lake will
connect to Unnamed Creek 18, which is not known to be fish-bearing; however, there are fish-bearing
habitats farther downstream (see the response to AER Round 4 SIR 20).
FRONTIER OIL SANDS MINE PROJECT 3 SOC RESPONSES 3.5 WATER QUALITY, AQUATICS AND FISH HABITAT OFFSETTING PLANS
RESPONSES TO FMM SOCS – APRIL 2016 Page 65
The fish species with the potential to naturally colonize the pit lakes will be those present in the
connected natural fish-bearing watercourses. The central and south pit lakes are connected to
tributaries of the Athabasca River, so it will be possible for additional fish species to access the lakes
from the Athabasca River.
Presence of fish species in the pit lakes would be through colonization from connected downstream
natural habitats, and these will be species that are able to use the geomorphic closure channels
(e.g., the channels are suitable habitat for migration). Although a number of fish species could
colonize the pit lakes, it is likely that fish distribution in the closure drainage system will be similar to
the natural tributaries of the Athabasca River. Regional fish distribution data show that, in most
natural Athabasca River tributaries, the number of fish species present declines upstream away from
the Athabasca River. This observation suggests that not all species in the natural habitats downstream
of the pit lakes would necessarily access the lakes.
Fish populations would likely become naturally established for species whose life stage requirements
are provided by the habitats in the pit lakes, or in combination with the habitats in the adjacent
connected closure channels. The productivity achieved in the pit lakes for each colonizing species
will depend on the species-specific suitability of the habitats that are present.
ii. Closure monitoring of water quality will determine when the lakes will be ready for colonization and
release to the downstream natural environment. As discussed, colonization will be possible once the
lakes are connected to fish-bearing habitats (as described in response to part [i]). Until then, water
from the Athabasca River will be pumped into the lakes, and there will be no connectivity to
downstream fish-bearing habitats.
SOC 39
FMM Reference and Topic:
FMM [39], Section 5.4 Fish and Aquatic Habitat Key Concerns and Requests
Access Management Plans
McMurray Métis recommends that Teck consults with the community about how access to lands
and waters in and near the project area can be facilitated, considering their historical, current and
future-intended traditional uses and the asserted, constitutionally-protected right of community
members to harvest as defined under R v. Powley (2003).

FRONTIER OIL SANDS MINE PROJECT 3 SOC RESPONSES 3.5 WATER QUALITY, AQUATICS AND FISH HABITAT OFFSETTING PLANS
RESPONSES TO FMM SOCS – APRIL 2016 Page 66
Teck Response:
See Key Theme – Agreement and Regulator Requests (Section 2.4) and the response to CEAA Round 5
SIR 162.
SOC 40
FMM Reference and Topic:
FMM [40], Section 5.4 Fish and Aquatic Habitat Key Concerns and Requests
Climate Change Impacts to Project
McMurray Métis recommends that Teck specifically evaluates and considers how climate change in
addition to all industrial demands might reduce or affect water availability for its project and for
fisheries and aquatic resources in the Athabasca River mainstem and its tributaries on its lease,
considering all other water uses and losses.
Teck Response:
See Key Theme – Climate Change (Section 2.3) and the response to AER Round 5 SIR 66 and
CEAA Round 5 SIR 142.
SOC 41
FMM Reference and Topic:
FMM [41], Section 5.4 Fish and Aquatic Habitat Key Concerns and Requests
Consultation – Proposed Bridge over the Athabasca
McMurray Métis recommends that Teck consults with the community on navigation and fisheries
concerns and offsets related to the Athabasca Bridge.
Teck Response:
See Key Theme – Agreement and Regulator Requests (Section 2.4).
FRONTIER OIL SANDS MINE PROJECT 3 SOC RESPONSES 3.5 WATER QUALITY, AQUATICS AND FISH HABITAT OFFSETTING PLANS
RESPONSES TO FMM SOCS – APRIL 2016 Page 67
SOC 42
FMM Reference and Topic:
FMM [42], Section 5.4 Fish and Aquatic Habitat Key Concerns and Requests
Future Monitoring
McMurray Métis recommends that Teck:
i. consults on all project-specific aquatic monitoring plans, including community-based
monitoring (CBM); and
ii. indicates the responsible government agency and requirements for inspecting culverts to
ensure the required monitoring and maintenance of culverts is conducted.
Teck Response:
i. See Key Theme – Agreement and Regulator Requests (Section 2.4).
ii. See Key Theme – Management, Mitigation, and Monitoring (Section 2.2).
SOC 43
FMM Reference and Topic:
FMM [43], Section 5.5 Fish Habitat Offsetting Plans Key Concerns and Requests
Habitat Calculations and Fish Rescue
McMurray Métis recommends that Teck:
i. explains the basis for assumed fish distributions, such as whether Commercial, Recreational or
Aboriginal (CRA) species are assumed to be present if there is access and suitable habitat at
any time of year (e.g., middle Redclay Creek, Big Creek, tributaries of these creeks);
ii. confirms that fish rescue or salvage efforts would include both forage fish and large-bodied fish
species;
iii. indicates whether it considered that fish must occur during all seasons in a watercourse in
order to be included in habitat unit (HU) calculations—for example, if a habitat is temporarily
unsuitable (winter), but is suitable during most of the year, ensure and confirm that this habitat
is accounted for in the offsetting plans; and

FRONTIER OIL SANDS MINE PROJECT 3 SOC RESPONSES 3.5 WATER QUALITY, AQUATICS AND FISH HABITAT OFFSETTING PLANS
RESPONSES TO FMM SOCS – APRIL 2016 Page 68
iv. provides discussion and side-by-side tabulated values of its HSI or habitat unit calculations for
the Project Update from both before and after the 2013 changes to the Fisheries Act (i.e., how
did the regulatory changes alter the calculations?)
Teck Response:
i. As described in the conceptual fisheries offsetting plan (CFOP) (see Volume 1, Section 15.3.2 of the
Project Update), the fish distribution information used in habitat suitability index (HSI) modelling for
the affected habitats included all documented distribution data, from historical to current, as well as
assumed distributions, which included species not documented to be present but considered likely to
occur. Species not documented in a given habitat were considered likely to occur (i) if habitat
conditions were generally suitable, and (ii) if the species was documented as present in connected,
adjacent habitats. Assumed distributions were developed in this manner for all fish species, including
commercial, recreational and Aboriginal (CRA) species.
As described in the CFOP and Frontier Fisheries Offsetting Framework (see Volume 1,
Section 15.4.3 of the Project Update), additional consultation with potentially affected Aboriginal
communities is part of the process of developing the detailed fisheries offsetting plan for the Project.
This will include consultation on (i) the appropriate fish assemblage for the fish habitat compensation
lake (FHCL); (ii) monitoring the effectiveness of the offsetting measures and the level of fish habitat
productivity; and (iii) the additional offsetting options discussed in the fisheries offsetting framework
(see Volume 1, Section 15.4.4 of the Project Update).
ii. See Key Theme – Agreement and Regulator Requests (Section 2.4) and the response to AER Round 5
SIR 90.
iii. Fish species need not occur in all seasons in a given habitat (watercourse or waterbody) to be
included in HSI modelling and habitat unit (HU) calculations. For example, the HSI models
developed for use in the oil sands region (Golder 2008) assign a suitability value to habitats that have
little or no overwintering potential, such as winter dissolved oxygen levels less than 1 mg/L, or frozen
to the bottom. Further, where no spawning habitat is present for some species, the relevant HSI model
assigns a suitability value to account for potential use by other life stages. All HSI values are used in
the calculation of the cumulative HUs for affected habitats that were accounted for in the CFOP.
iv. There have been no changes in the way habitat losses or alterations (formerly referred to as harmful
alteration, disruption or destruction [HADD]) have been calculated or identified in the Project Update
compared to the Integrated Application. As described in both the conceptual fish habitat
compensation plan (see Volume 1, Section 15.3.2 of the Integrated Application) and the CFOP (see
Volume 1, Section 15.3.2 of the Project Update), habitat losses and alterations were calculated based
on the number of affected HUs.

FRONTIER OIL SANDS MINE PROJECT 3 SOC RESPONSES 3.5 WATER QUALITY, AQUATICS AND FISH HABITAT OFFSETTING PLANS
RESPONSES TO FMM SOCS – APRIL 2016 Page 69
As in the Integrated Application, productive fish habitats in waterbodies or watercourse segments
were identified as part of the updated fish and fish habitat assessment (see Volume 3, Section 8.4,
Table 8-5 of the Project Update), and all habitats identified as being affected by the Project were
included in HU calculations. This includes habitats that will be lost (i.e., eliminated) or altered
(e.g., flow changes) due to Project development. Permanent and temporary alterations (e.g., during
some operational periods) were both included in the HU calculations. In identifying affected habitats,
no specific consideration was given to whether the affected habitats and associated fish populations
are part of, or support, a commercial, recreational or Aboriginal fishery.
Differences in the results of the calculations of HU losses or alterations in the Project Update relative
to the Integrated Application are the result of changes to the Project disturbance area (PDA) and
drainage plan, incorporation of additional baseline data, and incorporation of assumed fish
distributions in the affected habitats. These changes are described in the CFOP (see Volume 1,
Section 15.4.1 of the Project Update), and are not the result of the Fisheries Act amendments.
References
Golder (Golder Associates Ltd.). 2008. Fish Species Habitat Suitability Index Models for the Oil Sands
Region. Version 2.0. October 2008.
SOC 44
FMM Reference and Topic:
FMM [44], Section 5.5 Fish Habitat Offsetting Plans Key Concerns and Requests
Regulatory
McMurray Métis recommends that Teck:
i. provides a summary of the content of any discussions with DFO concerning the Project
Update’s regulatory requirements;
ii. summarizes any substantive fish habitat loss calculations, compensation or offsetting plan
changes that might have resulted from exclusive meetings with DFO;
iii. consults with McMurray Métis about any water- or fisheries-related regulatory application
materials and draft DFO Authorizations; and
iv. indicates the approximate timeline for providing the draft detailed Fisheries Offsetting Plan.

FRONTIER OIL SANDS MINE PROJECT 3 SOC RESPONSES 3.5 WATER QUALITY, AQUATICS AND FISH HABITAT OFFSETTING PLANS
RESPONSES TO FMM SOCS – APRIL 2016 Page 70
Teck Response:
i. Teck engages Fisheries and Oceans Canada (DFO) to ensure that Project effects on commercial,
recreational and Aboriginal fisheries and the proposed fisheries offsets adhere to DFO’s Fisheries
Protection Policy (DFO 2013a), Fisheries Productivity Investment Policy: A Proponent's Guide to
Offsetting (DFO 2013b) and the Fisheries Act.
Since the Integrated Application, two events have taken place that resulted in the changes presented
in the Project Update:
• On June 6, 2013, Teck received Round 2 SIRs from provincial and federal reviewers. In
ESRD/CEAA Round 2 SIR 42, Teck was requested to reassess the typical number of fish species
in Alberta waterbodies less than 100 ha. In its response to SIR 42, Teck acknowledged that the
actual number of fish species present would likely be higher. Teck has subsequently updated
(i) the fish and fish habitat assessment (see the response to ESRD/CEAA Round 2 SIR 30,
Appendix 30a.1 and Volume 3, Section 8 of the Project Update) and (ii) the conceptual fish
habitat compensation plan (CFHCP) for the Project (see the response to ESRD/CEAA Round 2
SIR 30, Appendix 30j.1). The conceptual fisheries offsetting plan (CFOP) (see Volume 1,
Section 15 of the Project Update) is a further revision of the CFHCP that reflects changes to the
Project and to the regulatory requirements since filing the Integrated Application.
• On December 16, 2013, Teck met with representatives from DFO and the Canadian
Environmental Assessment Agency (CEAA) to discuss the CFHCP that was submitted as part of
the Integrated Application (see Volume 1, Section 15). During the discussion, participants
identified several uncertainties that were external to the fish habitat compensation lake (FHCL)
and its ability to offset losses in fisheries productivity associated with the Project. Given these
uncertainties, participants recognized that a framework between Teck and DFO would help define
a path forward and aid in the development of suitable fisheries offsets for the Project. Teck
agreed to develop a framework for fisheries offsetting that would:
• recognize the need for offsets in addition to the 60 ha FHCL
• confirm Teck’s intention to continue with the current plan for the FHCL as the company
moves toward a regulatory hearing for the Project
• offer some alternative offsetting solutions that could be pursued in parallel
• state Teck’s commitment to continue to progress towards an appropriate outcome whereby
appropriate offsets for losses in fisheries productivity are achieved
FRONTIER OIL SANDS MINE PROJECT 3 SOC RESPONSES 3.5 WATER QUALITY, AQUATICS AND FISH HABITAT OFFSETTING PLANS
RESPONSES TO FMM SOCS – APRIL 2016 Page 71
ii. As a result of these events (see the response to part [1xxii]), neither of which was an “exclusive
meeting with DFO,” there have been substantive changes to fish habitat loss calculations and the
fisheries offsetting plan for the Project. These changes are summarized as follows:
• Habitat units (HUs) required to offset effects of the Project on productive fish habitats increased
from 1,730,000 in the Integrated Application to 3,599,900. This update was carried forward to the
Project Update1.
• As a result of the Frontier Fisheries Offsetting Framework, five fisheries offsetting options were
identified that could be used in whole or in combination to offset planned losses of productive
fish habitat. These options are presented in the CFOP (see Volume 1, Section 15.4.4 of the
Project Update).
In July 2014, the Fisheries Offsetting Framework was introduced to Aboriginal communities, and in
April 2015 a workshop was held to collect feedback on the five fisheries offsetting options that were
set forth. In its response to CEAA Round 5 SIR 164b, Teck describes how the April 2015 feedback
was considered and how decisions were made.
In November 2015, a second workshop was held where Teck:
• explained that the draft detailed fisheries offsetting plan (DFOP) will include increasing the size
of the FHCL, pursing Grayling Creek watershed restoration, and advancing a community-led
initiative under complementary measures
• identified three opportunities for continued Aboriginal community input into the plan and
gathered feedback that Teck will consider throughout the development of the DFOP. These
opportunities potentially include:
• community input into the fish species assemblage for the FHCL
• community involvement in the design and execution of fish and fish habitat monitoring
• community interest in developing regional Aboriginal fisheries offsetting objectives and
options in the oil sands region
iii. See Key Theme – Agreement and Regulator Requests (Section 2.4).
iv. Teck plans to provide the draft DFOP in advance of the Joint Review Panel hearing for the Project.
References
DFO (Fisheries and Oceans Canada). 2013a. Fisheries Protection Policy Statement. October 2013.
DFO (Fisheries and Oceans Canada). 2013b. Fisheries Productivity Investment Policy: A Proponent's
Guide to Offsetting. November 2013.
1 Offsetting needs have further increased from 3,599,900 HUs to 5,957,961 HUs. The additional increase in offsetting needs occurred as a result of updates to the lost habitat areas and updated fish species distribution information (see Volume 1, Section 15.3.2 of the Project Update).
FRONTIER OIL SANDS MINE PROJECT 3 SOC RESPONSES 3.5 WATER QUALITY, AQUATICS AND FISH HABITAT OFFSETTING PLANS
RESPONSES TO FMM SOCS – APRIL 2016 Page 72
SOC 45
FMM Reference and Topic:
FMM [45], Section 5.5 Fish Habitat Offsetting Plans Key Concerns and Requests
Remaining Prior Requests by McMurray Métis – July 2015
McMurray Métis requests responses to the following questions:
i. Do compensatory measures for the offsetting plan need to be determined at the beginning of the
project or are there opportunities to identify compensatory measures throughout the life of the
proposed Frontier Mine?
ii. Could an offsetting measure be developed specific to the McMurray Métis community or is
there a requirement for inclusion of all regional communities?
iii. Could a fish farm (off lease) be considered an offsetting measure?
Teck Response:
i. Measures for the fisheries offsetting plan will be determined at the beginning of the Project.
Subsection 35(1) of the Fisheries Act prohibits the carrying on of “any work, undertaking or activity
that results in serious harm to fish that are part of a commercial, recreational or Aboriginal fishery or
to fish that support such a fishery.” Because there is potential for the Project to cause residual serious
harm to fish, an offsetting plan is required under Paragraph 35(2)(b) of the Fisheries Act. According
to Fisheries and Oceans Canada (DFO), the offsetting plan must include the following information:
a) a description of the measures that will be implemented to offset the serious harm to
fish
b) an analysis of how those measures will offset the serious harm to fish
c) a description and analysis of the measures and standards that will be put in place
during the implementation of the offsetting plan to avoid or mitigate any adverse
effects on fish and fish habitat
For more information, see An Applicant’s Guide to Submitting an Application for Authorization under
Paragraph 35(2)(b) of the Fisheries Act (DFO 2013).
ii. Teck proposed complementary measures as part of the conceptual fisheries offsetting plan (CFOP) for
the Project (see Volume 1, Section 15.4.4 of the Project Update). Potential exists for these to include
offsetting measures that are specific to the McMurray Métis Community (or other Aboriginal
communities) and support community-specific fisheries offsetting objectives. Teck’s vision for
complementary measures was presented to Aboriginal communities and regulatory agencies at a
FRONTIER OIL SANDS MINE PROJECT 3 SOC RESPONSES 3.5 WATER QUALITY, AQUATICS AND FISH HABITAT OFFSETTING PLANS
RESPONSES TO FMM SOCS – APRIL 2016 Page 73
fisheries offsetting workshop on November 6, 2015. Information from the November 2015 workshop
is provided with the response to CEAA Round 5 SIR 164b, Appendix 164a.2.
iii. It is unknown whether DFO would consider an off-lease fish farm an acceptable offsetting measure.
In the Fisheries Productivity Investment Policy: A Proponent’s Guide to Offsetting (DFO 2013), DFO
identifies various types of offsetting measures and states that measures “must support and enhance the
sustainability and ongoing productivity of fish that are part of or support a commercial, recreational
or Aboriginal fishery.” DFO also outlines four guiding principles for applying offsetting measures for
fisheries protection:
• Principle 1: Offsetting measures must support fisheries management objectives or
local restoration priorities.
• Principle 2: Benefits from offsetting measures must balance project impacts.
• Principle 3: Offsetting measures must provide additional benefits to the fishery.
• Principle 4: Offsetting measures must generate self-sustaining benefits over the long
term.
References
DFO (Fisheries and Oceans Canada). 2013. Fisheries Productivity Investment Policy: A Proponent’s
Guide to Offsetting. November 2013. Available at: http://www.dfo-mpo.gc.ca/pnw-
ppe/offsetting-guide-compensation/index-eng.html. Accessed April 2016.
SOC 46
FMM Reference and Topic:
FMM [46], Section 5.5 Fish Habitat Offsetting Plans Key Concerns and Requests
Remaining Prior Requests by McMurray Métis – July 2015
Furthermore, McMurray Métis recommends that Teck provides opportunities for land users and
Elders to share traditional knowledge on proposed offsetting locations to provide seasonal
observations and assist in predicting water quality issues associated with the proposed offsetting
options.
McMurray Métis has an interest in identifying regional spawning areas for culturally important
fish species and evaluating the habitat quality of these areas to determine if Teck could implement
ecological restoration activities at these locations as an offsetting option.
FRONTIER OIL SANDS MINE PROJECT 3 SOC RESPONSES 3.5 WATER QUALITY, AQUATICS AND FISH HABITAT OFFSETTING PLANS
RESPONSES TO FMM SOCS – APRIL 2016 Page 74
Teck Response:
See Key Theme – Agreement and Regulator Requests (Section 2.4).
SOC 47
FMM Reference and Topic:
FMM [47], Section 5.5 Fish Habitat Offsetting Plans Key Concerns and Requests
Teck – Aboriginal Community Symposium
McMurray Métis recommends that: “Teck sponsor a symposium for Aboriginal communities in the
Fort McMurray area to meet with service providers conducting the monitoring for the Oil Sands
Monitoring program or other monitoring initiatives to hear presentations on the program designs and
results relating to mercury content in water and fish tissues, reference condition for mercury levels,
testing for water quality by mines and the province, and baseline information for bugs, fish, birds and
wildlife observed in existing compensation lakes”.
Teck Response:
See Key Theme – Agreement and Regulator Requests (Section 2.4).
SOC 48
FMM Reference and Topic:
FMM [48], Section 5.6 Concerns Arising from Teck’s Responses to Regulators’ SIR4
SIR4 Question 2 – EDA #2 causing the Loss of Oakley and Small Sandy lakes
McMurray Métis requests that Teck provides one or more appropriate maps that show project
components (not just a gray outline) along with (or superimposed upon) any lost waterbodies,
watercourses, diversions and the compensation lake.
Teck Response:
Figure 48-1 shows the general site layout for the Project, including affected waterbodies, watercourses
and diversions, and the fish habitat compensation lake.
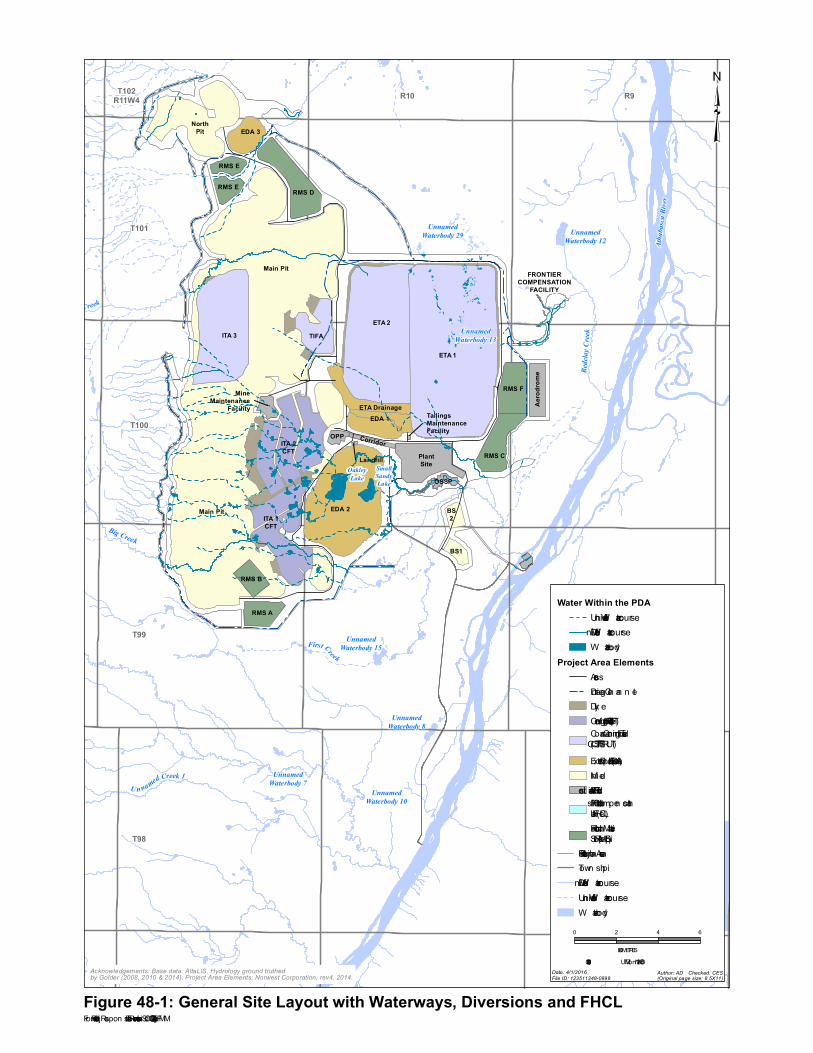
Figure 48-1: General Site Layout with Waterways, Diversions and FHCL
BS1
BS2
Main Pit
NorthPit
RMS E
RMS A
RMS C
RMS F
RMS E RMS D
RMS B
ETA 2
ETA 1
PlantSite
OSSP
Corridor
Landfill
OPP
EDA 2
EDA 1
EDA 3
ETA Drainage Aero
drom
e
ITA 3
ITA 1CFT
ITA 2CFT
Fish HabitatCompensationLake
TIFA
MineMaintenance
Facility
River W aterIn tak e Site
TailingsMaintenanceFacility
Main Pit
RW I Pipelin e
Main Access
RW IAcce
ssRoad
UnnamedWaterbody 12
UnnamedWaterbody 15
UnnamedWaterbody 13
First Creek
U n named Creek 1Unnamed
Waterbody 10
UnnamedWaterbody 7
Athab
asca R
iver
UnnamedWaterbody 8
Big Creek
UnnamedWaterbody 29
Redc
lay C
reek
Redclay Creek
T101
T100
T99
T98
R10 R9T102R11W4
SmallSandyLake
FRONTIERCOMPENSATION
FACILITY
OakleyLake
Acknowledgements: Base data: AltaLIS, Hydrology ground truthed by Golder (2008, 2010 & 2014). Project Area Elements: Norwest Corporation, rev4, 2014.
Fron tier Project – Respon se to Tech n ical Reviews an d SOCs (Dec 2015) – FMM
Water Within the PDAUn defin ed W atercourse Defin ed W atercourse W aterbody
Project Area ElementsAccess Drain ag e Chan n el Dyke Cen trifug ed Fin e Tailin g s (CFT) Coarse Combin ed Tailin g s(CCT/SFT/TSRUT) Extern al Disposal Area (EDA) Min ed Plan t Site an d Facilities Fish Habitat Compen sationLak e (FHCL) Reclamation MaterialStock pile (RMS)
Project Disturban ce AreaTown sh ipDefin ed W atercourseUn defin ed W atercourseW aterbody0 2 4 6
KILOMETRESUTM Zon e 12 NAD 831:180,000
Date: 4/1/2016File ID: 123511248-0898 (Original page size: 8.5X11)
Author: AD Checked: CES
FRONTIER OIL SANDS MINE PROJECT 3 SOC RESPONSES 3.5 WATER QUALITY, AQUATICS AND FISH HABITAT OFFSETTING PLANS
RESPONSES TO FMM SOCS – APRIL 2016 Page 76
SOC 49
FMM Reference and Topic:
FMM [49], Section 5.6 Concerns Arising from Teck’s Responses to Regulators’ SIR4
SIR4 Question 4 – Lost Flows to Redclay Creek
McMurray Métis requests that Teck evaluates how changes or reductions in flows in tributaries
would impact fish use of those tributaries, specifically in Redclay Creek.
Teck Response:
The fish and fish habitat assessment (see Volume 3, Section 8.5.5.3 of the Project Update) evaluates how
predicted changes in flows would affect fish habitat productivity and fish use of tributaries to the
Athabasca River, including Redclay Creek, Big Creek and Unnamed Creek 19. The changes were
considered negligible with no potential for adverse effects on fish or fish habitat. This is because baseline
data indicate the tributaries do not flow in winter under existing conditions (e.g., frozen-to-the-bottom),
and predicted winter flow changes generally consist of flow increases. For a discussion of the knowledge
gaps and uncertainties associated with the predicted effects, see the conceptual fish and fish habitat
monitoring plan in Volume 1, Section 15.5 of the Project Update.
For an evaluation of changes in flows, including increases and reductions in flow discharge (i.e., mean
annual discharge, mean open-water discharge, and mean 10-year flood peak discharge), as well as
predictions of changes in winter flows (mean ice-cover discharge and 7Q10 low-flow discharge), see the
updated hydrology assessment (Volume 3, Section 6.4 of the Project Update).
SOC 50
FMM Reference and Topic:
FMM [50], Section 5.6 Concerns Arising from Teck’s Responses to Regulators’ SIR4
SIR4 Question 7 – Cumulative Effects to the Athabasca River
McMurray Métis requests that Teck fully assesses cumulative impacts caused by all industrial
projects in the region to fish populations in the Athabasca River.
Teck Response:
See Key Theme – Adequacy of the Environmental Impact Assessment (Section 2.1).
FRONTIER OIL SANDS MINE PROJECT 3 SOC RESPONSES 3.5 WATER QUALITY, AQUATICS AND FISH HABITAT OFFSETTING PLANS
RESPONSES TO FMM SOCS – APRIL 2016 Page 77
SOC 51
FMM Reference and Topic:
FMM [51], Section 5.6 Concerns Arising from Teck’s Responses to Regulators’ SIR4
SIR4 Question 9 – Fish Use of Upper Redclay Creek
McMurray Métis requests that Teck provides more informative figures (imagery) depicting all of
Redclay Creek and associated wetlands or ponds in relation to planned project footprint
components, and provides details of fish surveys completed in the middle and upper reaches.
Teck Response:
A figure showing Redclay Creek, associated waterways, ponds and planned Project components is
provided in the response to FMM SOC 48 (see Figure 48-1).
Baseline data on fish and fish habitat in the aquatics LSA includes results of field surveys conducted for
the Project and from other relevant surveys (e.g., baseline studies collected for the Shell Pierre River
Mine project and regional monitoring). Details of fish and fish habitat surveys completed in the upper and
lower reaches of Redclay Creek (i.e., upstream and downstream of the forested wetland complex) are
provided in Volume 2, Section 6 of the Project Update. For example, see:
• Volume 2, Section 6.2, Figure 6-3 for a map of survey locations
• Volume 2, Section 6.2.4 Table 6-2 for an overview of seasonal field sampling
• Volume 2, Section 6.3.4.2 and Appendix 6B for results of recent and historical surveys of Redclay
Creek
Fish and fish habitat data from the Shell Pierre River Mine baseline study suggest that the portion of
Redclay Creek that is in the PDA is fish-bearing. Because of this, potential changes to the portion of
Redclay Creek in the fish habitat compensation lake (FHCL) footprint were assessed, and potential
offsetting measures were included in the conceptual fisheries offsetting plan (CFOP) (see Volume 1,
Section 15.4 of the Project Update). This portion of Redclay Creek was also included in the 2015 Frontier
Aquatics Monitoring Program to collect additional data on fish and fish habitat. Field data from 2015 will
be added to the existing dataset and used in developing a draft detailed fisheries offsetting plan (DFOP)
for the Project (for details, see the response to FMM SOC 44).
FRONTIER OIL SANDS MINE PROJECT 3 SOC RESPONSES 3.5 WATER QUALITY, AQUATICS AND FISH HABITAT OFFSETTING PLANS
RESPONSES TO FMM SOCS – APRIL 2016 Page 78
SOC 52
FMM Reference and Topic:
FMM [52], Section 5.6 Concerns Arising from Teck’s Responses to Regulators’ SIR4
SI4R Question 12 – Fish in Unnamed Creek 2 (drains Oakley Lake)
McMurray Métis requests that Teck assesses and considers the possibility that Unnamed Creek 2 is
fish bearing during times of higher water levels, and if there is any chance of fish presence at any
time, includes the habitat in offsetting plans.
Teck Response:
In the preamble to this request, FMM expressed concerns regarding Teck’s response to AER Round 4
SIR 12 where the reviewer requested an assessment of an unnamed tributary to Unnamed Creek 2, not
Unnamed Creek 2. Teck’s response correctly indicated that the tributary to Unnamed Creek 2 does not
provide aquatic habitat.
Teck notes that Unnamed Creek 2 (from its origin at the Unnamed Lake 1 outlet to its terminus at the Big
Creek confluence) was assessed as providing productive fish-bearing aquatic habitat (see Volume 2,
Section 6.3.4.3 and Volume 3, Section 8.5.5.3 of the Project Update). Therefore, Unnamed Creek 2 is
included in the conceptual fisheries offsetting plan for the Project (see Volume 1, Section 15.3.2 of the
Project Update).
SOC 53
FMM Reference and Topic:
FMM [53], Section 5.6 Concerns Arising from Teck’s Responses to Regulators’ SIR4
SIR4 Questions 16 and 21 – End Pit Lakes
McMurray Métis requests that Teck commits to supporting holistic studies of all reclamation
habitats, and discusses alternative options to end pit lakes for water-related reclamation.
Teck Response:
See Key Theme – Agreement and Regulator Requests (Section 2.4).

FRONTIER OIL SANDS MINE PROJECT 3 SOC RESPONSES 3.5 WATER QUALITY, AQUATICS AND FISH HABITAT OFFSETTING PLANS
RESPONSES TO FMM SOCS – APRIL 2016 Page 79
SOC 54
FMM Reference and Topic:
FMM [54], Section 5.6 Concerns Arising from Teck’s Responses to Regulators’ SIR4
SIR4 Question 25 – Fish Selected for the Compensation Lake
McMurray Métis requests that Teck continues to consult on fisheries offset plans including species
in the compensation lake and other offset options that may be desired by the community.
Teck Response:
See Key Theme – Agreement and Regulator Requests (Section 2.4).
FRONTIER OIL SANDS MINE PROJECT 3 SOC RESPONSES 3.6 VEGETATION
RESPONSES TO FMM SOCS – APRIL 2016 Page 80
3.6 Vegetation
SOC 55
FMM Reference and Topic:
FMM [55], Section 6.2 Study Areas
Temporal Scope
McMurray Métis recommends that Teck provides support (financial and data) to McMurray Métis
to define baseline (i.e., pre-development) and existing conditions for Métis Environmental and
Cultural Components identified in the Cultural Impact Assessment, specifically to determine
baseline and existing conditions for measures of the Traditional Land Use Métis Environmental
and Cultural Component.
Teck Response:
See Key Theme – Agreement and Regulator Requests (Section 2.4).
SOC 56
FMM Reference and Topic:
FMM [56], Section 6.2 Study Areas
Temporal Scope
McMurray Métis recommends that Teck rewrites the assessment conclusions to include conclusions
based on the worst-case scenario. As discussed further in the Closure, Conservation and
Reclamation Plan review section, confidence in reclamation outcomes remains low for
re-establishing equivalent capability to support Traditional Land Uses on reclaimed lands.
McMurray Métis requests that the worst-case scenario assessment is completed prior to the Project
Update being deemed complete by the regulators.

FRONTIER OIL SANDS MINE PROJECT 3 SOC RESPONSES 3.6 VEGETATION
RESPONSES TO FMM SOCS – APRIL 2016 Page 81
Teck Response:
The updated traditional land use assessment (see Volume 3, Section 17 of the Project Update) is based on
the worst-case scenario as it assumed that all developments were at maximum build-out without
progressive reclamation (see Volume 3, Section 17.3.3.2 of the Project Update). As requested through the
SIR process, information on the worst-case scenario was also provided for the vegetation and wildlife
assessments (see Volume 3, Section 10.3.3.3 and Section 11.3.4 of the Project Update); however, given
that reclamation is a legal requirement under the Alberta Environmental Protection and Enhancement Act
(EPEA), the environmental consequence conclusions for these disciplines assume that reclamation occurs.
Teck acknowledges that confidence in reclamation outcomes remains low for re-establishing equivalent
capability to support traditional land uses on reclaimed lands. In response to Aboriginal community
concerns, Teck has outlined specific commitments regarding community involvement in planning and
undertaking Project reclamation (see Volume 1, Section 13.9 of the Project Update). For example, Teck
has confirmed its commitment to co-create a Reclamation Working Group with potentially affected
Aboriginal communities to guide more detailed reclamation planning and monitoring to determine
reclamation success. Teck anticipates that species of traditional importance will be identified by the
Reclamation Working Group(s) and incorporated into reclamation planning as feasible.
SOC 57
FMM Reference and Topic:
FMM [57], Section 6.5 Residual Effects and Mitigation Measures Identified by Teck
Ecosite Phases and Old-growth Forests
McMurray Métis recommends that AER requires, as a condition any approval issued for the
Frontier Project application, that Teck uses the wetlands and uplands state-and-transition
simulation models to support revegetation planning and closure plan validation.
Teck Response:
See Key Theme – Agreement and Regulator Requests (Section 2.4).
FRONTIER OIL SANDS MINE PROJECT 3 SOC RESPONSES 3.6 VEGETATION
RESPONSES TO FMM SOCS – APRIL 2016 Page 82
SOC 58
FMM Reference and Topic:
FMM [58], Section 6.5 Residual Effects and Mitigation Measures Identified by Teck
Ecosite Phases and Old-growth Forests
McMurray Métis recommends that Teck provides capacity funding to the community to
parameterize the wetlands and uplands state-and-transition simulation models to assess how
reclamation outcomes support re-establishing traditional land uses.
Teck Response:
See Key Theme – Agreement and Regulator Requests (Section 2.4).
SOC 59
FMM Reference and Topic:
FMM [59], Section 6.5 Residual Effects and Mitigation Measures Identified by Teck
Ecosite Phases and Old-growth Forests
McMurray Métis recommends that Teck provides funding to the community to assess the cultural
impacts of the loss of old-growth forests in the RSA with respect to inter-generational knowledge
transfer, traditional resources only found in old-growth forests and potential effects of climate
change on re-establishing old-growth forests into the future.
Teck Response:
See Key Theme – Agreement and Regulator Requests (Section 2.4).
FRONTIER OIL SANDS MINE PROJECT 3 SOC RESPONSES 3.6 VEGETATION
RESPONSES TO FMM SOCS – APRIL 2016 Page 83
SOC 60
FMM Reference and Topic:
FMM [60], Section 6.5 Residual Effects and Mitigation Measures Identified by Teck
Rare Ecological Community and Rare Plants
McMurray Métis recommends that AER requires, as a condition of any approval issued for the
project, that Teck provides support to AEP to fund annual validation of rare plant community and
species data, tracking and watchlists, and monitoring and research programs.
Teck Response:
See Key Theme – Agreement and Regulator Requests (Section 2.4).
SOC 61
FMM Reference and Topic:
FMM [61], Section 6.5 Residual Effects and Mitigation Measures Identified by Teck
Rare Ecological Community and Rare Plants
McMurray Métis recommends that Teck, as part of the adaptive management program, establishes
a rare species research and monitoring program in co-operation with members of the community.
The purpose of the program would be to evaluate the effectiveness of rare plant mitigation
strategies and test alternate strategies.
Teck Response:
See Key Theme – Agreement and Regulator Requests (Section 2.4).
FRONTIER OIL SANDS MINE PROJECT 3 SOC RESPONSES 3.6 VEGETATION
RESPONSES TO FMM SOCS – APRIL 2016 Page 84
SOC 62
FMM Reference and Topic:
FMM [62], Section 6.5 Residual Effects and Mitigation Measures Identified by Teck
Species Diversity
McMurray Métis recommends that AER requires, as a condition of any approval issued for the
proposed project, that Teck participates in and funds CEMA’s Reclamation Working Group and
specifically contributes to research and monitoring budget items to re-establish species diversity on
reclaimed land, including developing reclamation guidance to plan for species diversity on
reclaimed lands.
Teck Response:
See Key Theme – Agreement and Regulator Requests (Section 2.4).
SOC 63
FMM Reference and Topic:
FMM [63], Section 6.5 Residual Effects and Mitigation Measures Identified by Teck
Species Diversity
McMurray Métis recommends that Teck provides employment opportunities to the community as
part of the seed harvesting program and revegetation program.
Teck Response:
See Key Theme – Agreement and Regulator Requests (Section 2.4).

FRONTIER OIL SANDS MINE PROJECT 3 SOC RESPONSES 3.6 VEGETATION
RESPONSES TO FMM SOCS – APRIL 2016 Page 85
SOC 64
FMM Reference and Topic:
FMM [64], Section 6.5 Residual Effects and Mitigation Measures Identified by Teck
Cumulative Air Emissions
McMurray Métis recommends that Teck provides a summary of the potential effects of dust and
other air emissions deposition on traditional use species (e.g., berries) and describes how Teck will
develop a mitigation plan in collaboration with McMurray Métis and requests that this is
completed prior to the Application being deemed complete by the regulators.
Teck Response:
See the response to CEAA Round 5 SIR 151b.
SOC 65
FMM Reference and Topic:
FMM [65], Section 6.5 Residual Effects and Mitigation Measures Identified by Teck
Cumulative Air Emissions
McMurray Métis recommends that Teck provides capacity funding to support McMurray Métis’
participation and technical representation at WBEA and the AEMERA Air Component Advisory
Committee.
Teck Response:
See Key Theme – Agreement and Regulator Requests (Section 2.4).
FRONTIER OIL SANDS MINE PROJECT 3 SOC RESPONSES 3.6 VEGETATION
RESPONSES TO FMM SOCS – APRIL 2016 Page 86
SOC 66
FMM Reference and Topic:
FMM [66], Section 6.5 Residual Effects and Mitigation Measures Identified by Teck
Wetlands Reclamation
McMurray Métis recommends that Teck summarizes the information currently available relating
to peatland reclamation and indicates if and how it will implement any of this research in the
closure landscape.
Teck Response:
See the response to CEAA Round 5 SIR 145.
SOC 67
FMM Reference and Topic:
FMM [67], Section 6.5 Residual Effects and Mitigation Measures Identified by Teck
Wetlands Reclamation
McMurray Métis recommends that Teck initiates and supports developing a swamp-reclamation
research program to produce swamp reclamation guidance. McMurray Métis requests that Teck
provides opportunities for the community to participate in such a program and guidance document
development.
Teck Response:
See Key Theme – Agreement and Regulator Requests (Section 2.4).

FRONTIER OIL SANDS MINE PROJECT 3 SOC RESPONSES 3.6 VEGETATION
RESPONSES TO FMM SOCS – APRIL 2016 Page 87
SOC 68
FMM Reference and Topic:
FMM [68], Section 6.5 Residual Effects and Mitigation Measures Identified by Teck
Weed Management Plan
McMurray Métis recommends that Teck avoids applying herbicides in the vicinity of lands used for
traditional land uses by the community.
Teck Response:
See Key Theme – Agreement and Regulator Requests (Section 2.4).
SOC 69
FMM Reference and Topic:
FMM [69], Section 6.5 Residual Effects and Mitigation Measures Identified by Teck
Weed Management Plan
In the event that herbicides will be used, McMurray Métis recommends that Teck provides
notification to the community of intent to apply herbicides in lands used by the community for
traditional land uses.
Teck Response:
See Key Theme – Agreement and Regulator Requests (Section 2.4).
FRONTIER OIL SANDS MINE PROJECT 3 SOC RESPONSES 3.6 VEGETATION
RESPONSES TO FMM SOCS – APRIL 2016 Page 88
SOC 70
FMM Reference and Topic:
FMM [70], Section 6.5 Residual Effects and Mitigation Measures Identified by Teck
Weed Management Plan
McMurray Métis recommends that Teck specifically avoids removing vegetation or using
herbicides near watercourses and waterbodies.
Teck Response:
See Key Theme – Agreement and Regulator Requests (Section 2.4).
SOC 71
FMM Reference and Topic:
FMM [71], Section 6.5 Residual Effects and Mitigation Measures Identified by Teck
Weed Management Plan
McMurray Métis recommends that Teck implements a monitoring program to identify occurrences
of non-native and invasive species in the vegetation LSA and to evaluate the effectiveness of weed
management techniques. McMurray Métis requests that opportunities for community members to
participate in the monitoring are developed and that monitoring results are shared with the
community.
Teck Response:
Teck is committed to effective environmental management, mitigation and monitoring of non-native and
invasive vegetation species. Following Project approval, a weed management plan will be developed and
implemented to limit weeds across the PDA. Teck will evaluate the plan’s effectiveness and adapt it as
needed on an ongoing basis. For additional discussion, see the response to CEAA Round 5 SIR 146 and
Key Themes – Management, Mitigation and Monitoring (Section 2.2) and Agreement and Regulator
Requests (Section 2.4).
FRONTIER OIL SANDS MINE PROJECT 3 SOC RESPONSES 3.7 WILDLIFE
RESPONSES TO FMM SOCS – APRIL 2016 Page 89
3.7 Wildlife
SOC 72
FMM Reference and Topic:
FMM [72], Section 7.2 Difference in Scope between Integrated Application and Project Update
Ronald Lake Bison Herd Indigenous Knowledge Research Parallel Process
McMurray Métis recommends that AEP, Teck and other proponents active in the Ronald Lake
bison herd range provide financial support to initiate the Indigenous Knowledge Research Parallel
Process as soon as possible and that this initiative is provided time and capacity to complete its
work prior to any approvals being issued for the proposed project.
Teck Response:
See Key Theme – Agreement and Regulator Requests (Section 2.4).
SOC 73
FMM Reference and Topic:
FMM [73], Section 7.3 Study Areas
Bison Study Areas
McMurray Métis requests continued involvement in identifying critical habitat for the Ronald
Lake bison herd, particularly if the herd’s status under the Wildlife Act is updated.
Teck Response:
See Key Theme – Agreement and Regulator Requests (Section 2.4).
FRONTIER OIL SANDS MINE PROJECT 3 SOC RESPONSES 3.7 WILDLIFE
RESPONSES TO FMM SOCS – APRIL 2016 Page 90
SOC 74
FMM Reference and Topic:
FMM [74], Section 7.3 Study Areas
Bison Study Areas
McMurray Métis recommends that Teck provides a plan outlining how Teck will work with other
Aboriginal groups, including McMurray Métis to identify critical habitat for the Ronald Lake
bison herd.
Teck Response:
See Key Theme – Agreement and Regulator Requests (Section 2.4).
SOC 75
FMM Reference and Topic:
FMM [75], Section 7.3 Study Areas
Caribou Range Study Area
McMurray Métis recommends that Teck provides opportunities through participation and
development of the Wildlife Mitigation and Monitoring Plan, for McMurray Métis land users and
knowledge holders to assess the bison and caribou study areas delineated by Teck and to
incorporate local knowledge regarding the range of both bison and caribou to validate the study
area boundaries.
Teck Response:
See Key Theme – Agreement and Regulator Requests (Section 2.4).
FRONTIER OIL SANDS MINE PROJECT 3 SOC RESPONSES 3.7 WILDLIFE
RESPONSES TO FMM SOCS – APRIL 2016 Page 91
SOC 76
FMM Reference and Topic:
FMM [76], Section 7.3 Study Areas
Temporal Scope
McMurray Métis recommends that Teck provides support (financial and data) to McMurray Métis
to define reference conditions for Métis Environmental and Cultural Components (MECC)
identified in the Cultural Impact Assessment, specifically to determine reference conditions for
measures of the Traditional Land Use MECC.
Teck Response:
See Key Theme – Agreement and Regulator Requests (Section 2.4).
SOC 77
FMM Reference and Topic:
FMM [77], Section 7.3 Study Areas
Temporal Scope
McMurray Métis recommends that Teck revises the assessment conclusions to include conclusions
based on the worst-case scenario. As discussed further in the Closure, Conservation and
Reclamation Plan review section, confidence in reclamation outcomes remains low for re-
establishing equivalent capability to support Traditional Land Uses on reclaimed lands. McMurray
Métis requests that the worst-case scenario assessment is completed prior to the Project Update
being deemed complete by the regulators.
Teck Response:
See the response to FMM SOC 56.

FRONTIER OIL SANDS MINE PROJECT 3 SOC RESPONSES 3.7 WILDLIFE
RESPONSES TO FMM SOCS – APRIL 2016 Page 92
SOC 78
FMM Reference and Topic:
FMM [78], Section 7.4 Key Issues Identified by Teck
Wildlife Mitigation and Monitoring Plan
McMurray Métis recommends that the Government of Alberta requires Métis consultation on the
Wildlife Mitigation and Monitoring Plan including consultation with McMurray Métis.
Teck Response:
See Key Theme – Agreement and Regulator Requests (Section 2.4).
SOC 79
FMM Reference and Topic:
FMM [79], Section 7.4 Key Issues Identified by Teck
Wildlife Mitigation and Monitoring Plan
McMurray Métis recommends that Teck acknowledges and includes Métis in the development and
implementation of the Wildlife Mitigation and Monitoring Plan.
Teck Response:
See Key Theme – Agreement and Regulator Requests (Section 2.4).
FRONTIER OIL SANDS MINE PROJECT 3 SOC RESPONSES 3.7 WILDLIFE
RESPONSES TO FMM SOCS – APRIL 2016 Page 93
SOC 80
FMM Reference and Topic:
FMM [80], Section 7.4 Key Issues Identified by Teck
Wildlife Mitigation and Monitoring Plan
McMurray Métis recommends that Teck provides capacity (financial and data) to McMurray
Métis to conduct Métis environmental knowledge studies to research and develop specific targets or
benchmarks of performance over time of wildlife habitat on reclaimed lands and undisturbed lands
included in the Wildlife Mitigation and Monitoring Plan study areas.
Teck Response:
See Key Theme – Agreement and Regulator Requests (Section 2.4).
SOC 81
FMM Reference and Topic:
FMM [81], Section 7.5 Key Indicator Resources Assessed by Teck
Ronald Lake Bison Herd
McMurray Métis recommends that AEP expedites the change in regulatory status of the Ronald
Lake bison herd to Subject Animal under section 7 of the Wildlife Regulations as soon as possible.
Teck Response:
The status of the Ronald Lake bison herd has been elevated to “a subject animal” by the Alberta Energy
Regulator (The Alberta Gazette, March 31, 2016 [GOA 2016]). With this change in status, Teck
anticipates that development of a management plan for the Ronald Lake herd will be a priority for the
Government of Alberta.
References
GOA (Government of Alberta). 2016. Wildlife (2016 Bison Management – Ministerial) Amendment
Regulation 20/2016. Published in The Alberta Gazette, Part II, March 31, 2016. Volume 112(6).
Alberta Queen’s Printer, Edmonton, Alberta.
FRONTIER OIL SANDS MINE PROJECT 3 SOC RESPONSES 3.7 WILDLIFE
RESPONSES TO FMM SOCS – APRIL 2016 Page 94
SOC 82
FMM Reference and Topic:
FMM [82], Section 7.5 Key Indicator Resources Assessed by Teck
Ronald Lake Bison Herd
McMurray Métis recommends that no further industrial activity is permitted in the Ronald Lake
bison herd range until the change in regulation status to Subject Animal has been completed,
including no oil sands exploration activity, no forestry and no ice bridge access across the
Athabasca River.
Teck Response:
The status of the Ronald Lake bison herd has been elevated to “a subject animal” by the Alberta Energy
Regulator (The Alberta Gazette, March 31, 2016 [GOA 2016]). With this change in status, Teck
anticipates that development of a management plan for the Ronald Lake herd will be a priority for the
Government of Alberta.
References
GOA (Government of Alberta). 2016. Wildlife (2016 Bison Management – Ministerial) Amendment
Regulation 20/2016. Published in The Alberta Gazette, Part II, March 31, 2016. Volume 112(6).
Alberta Queen’s Printer, Edmonton, Alberta.
SOC 83
FMM Reference and Topic:
FMM [83], Section 7.5 Key Indicator Resources Assessed by Teck
Ronald Lake Bison Herd
McMurray Métis recommends that AEP establishes a co-management board to research and
preserve the Ronald Lake bison herd and that McMurray Métis is provided capacity funding to
participate on such a board.
FRONTIER OIL SANDS MINE PROJECT 3 SOC RESPONSES 3.7 WILDLIFE
RESPONSES TO FMM SOCS – APRIL 2016 Page 95
Teck Response:
The status of the Ronald Lake bison herd has been elevated to “a subject animal” by the Alberta Energy
Regulator (The Alberta Gazette, March 31, 2016 [GOA 2016]). With this change in status, Teck
anticipates that development of a management plan for the Ronald Lake herd will be a priority for the
Government of Alberta.
References
GOA (Government of Alberta). 2016. Wildlife (2016 Bison Management – Ministerial) Amendment
Regulation 20/2016. Published in The Alberta Gazette, Part II, March 31, 2016. Volume 112(6).
Alberta Queen’s Printer, Edmonton, Alberta.
SOC 84
FMM Reference and Topic:
FMM [84], Section 7.5 Key Indicator Resources Assessed by Teck
Boreal Caribou
McMurray Métis recommends that Teck, through the Wildlife Mitigation and Monitoring Plan,
provides opportunities for McMurray Métis land users and knowledge holders to document Métis
Environmental Knowledge of caribou populations in the terrestrial LSA and to contribute to the
design of a monitoring program to assess effectiveness of caribou mitigation and management
strategies for caribou.
Teck Response:
See Key Theme – Agreement and Regulator Requests (Section 2.4).
FRONTIER OIL SANDS MINE PROJECT 3 SOC RESPONSES 3.7 WILDLIFE
RESPONSES TO FMM SOCS – APRIL 2016 Page 96
SOC 85
FMM Reference and Topic:
FMM [85], Section 7.6 Residual Effects Identified by Teck
Vegetation and Habitat
McMurray Métis recommends that Teck provides capacity funding to support a community-based
project to assess and validate Teck’s worst-case and best-case scenario predictions for project-
specific and cumulative effects to Ronald Lake bison, moose and small mammal habitat using state-
and-transition simulation models developed by CEMA’s Reclamation Working Group. Through
this project, McMurray Métis would develop mitigation, monitoring and research strategies for the
bison herd, moose and small mammals to inform Teck’s Wildlife Mitigation and Monitoring Plan
and identify reclamation targets for input into the Closure, Conservation and Reclamation Plan.
Teck Response:
See Key Theme – Agreement and Regulator Requests (Section 2.4).
SOC 86
FMM Reference and Topic:
FMM [86], Section 7.6 Residual Effects Identified by Teck
Ronald Lake Bison
McMurray Métis recommends that AEP restricts use of the linear disturbances and new roads in
the Teck leases until such time as the regulation status of the Ronald Lake bison herd has been
changed to prohibit non-Aboriginal hunting.
Teck Response:
See Key Theme – Agreement and Regulator Requests (Section 2.4).

FRONTIER OIL SANDS MINE PROJECT 3 SOC RESPONSES 3.7 WILDLIFE
RESPONSES TO FMM SOCS – APRIL 2016 Page 97
SOC 87
FMM Reference and Topic:
FMM [87], Section 7.6 Residual Effects Identified by Teck
Ronald Lake Bison
McMurray Métis recommends that Teck completes further studies of the landscape in the northern
range of the Ronald Lake bison herd and the southern extent of the Wood Buffalo National Park
herd to predict the potential for interaction of the two herds and to develop management strategies
to prevent their interaction and that these studies are completed prior to the application being
deemed complete by the regulators.
Teck Response:
See the response to CEAA Round 5 SIR 130.
SOC 88
FMM Reference and Topic:
FMM [88], Section 7.6 Residual Effects Identified by Teck
Moose
McMurray Métis recommends that Teck provides capacity funding to McMurray Métis to conduct
a cumulative effects analysis of oil sands development on moose population and abundance
supporting Métis Rights-based activities and to validate Teck’s assumption that moose abundance
should remain unchanged due to the presence of suitable habitat and progressive reclamation
elsewhere in the vegetation and wildlife RSA. This would include an analysis of closure,
conservation reclamation plans for operations in the RSA, measuring moose habitat attributes on
reclaimed lands in the RSA and developing a state-and-transition simulation model coupled to a
moose habitat model to evaluate if the reclamation planning assumptions for re-establishing moose
habitat are achieving the regional habitat outcomes assumed by Teck.
Teck Response:
See Key Theme – Agreement and Regulator Requests (Section 2.4).
FRONTIER OIL SANDS MINE PROJECT 3 SOC RESPONSES 3.7 WILDLIFE
RESPONSES TO FMM SOCS – APRIL 2016 Page 98
SOC 89
FMM Reference and Topic:
FMM [89], Section 7.6 Residual Effects Identified by Teck
Boreal Caribou
McMurray Métis recommends that Teck provides opportunities for McMurray Métis land users
and knowledge holders to participate in caribou research initiatives occurring under COSIA.
Teck Response:
See Key Theme – Agreement and Regulator Requests (Section 2.4).
SOC 90
FMM Reference and Topic:
FMM [90], Section 7.6 Residual Effects Identified by Teck
Boreal Caribou
McMurray Métis recommends that the Government of Alberta and Teck consult with the
McMurray Métis community to identify and delineate critical caribou range and habitat to help
Teck identify opportunities for avoidance and mitigation in its road planning. Consultation can also
inform planning and implementation of the Government of Alberta’s caribou range and action
plans.
Teck Response:
See Key Theme – Agreement and Regulator Requests (Section 2.4).
FRONTIER OIL SANDS MINE PROJECT 3 SOC RESPONSES 3.7 WILDLIFE
RESPONSES TO FMM SOCS – APRIL 2016 Page 99
SOC 91
FMM Reference and Topic:
FMM [91], Section 7.6 Residual Effects Identified by Teck
Boreal Caribou
McMurray Métis recommends that Teck makes a commitment to provide capacity funding to
McMurray Métis to participate in a multi-stakeholder process to develop the LMP and caribou
range planning; furthermore, Teck should support and encourage the multi-stakeholder approach.
Teck Response:
See Key Theme – Agreement and Regulator Requests (Section 2.4).
SOC 92
FMM Reference and Topic:
FMM [92], Section 7.6 Residual Effects Identified by Teck
Black Bear
McMurray Métis recommends that Teck provides capacity funding to McMurray Métis to conduct
a cumulative effects analysis of oil sands development on black bear population and abundance
supporting Métis’ Rights-based activities and to validate Teck’s assumption that black bear
abundance should remain unchanged due to the presence of suitable habitat and progressive
reclamation elsewhere in the vegetation and wildlife RSA.
This would include an analysis of closure, conservation and reclamation plans for operations in the
RSA, measuring bear habitat attributes on reclaimed lands in the RSA and developing a state-and-
transition simulation model coupled to a black bear habitat model to evaluate if the reclamation
planning assumptions for re-establishing black bear habitat are achieving the regional habitat
outcomes assumed by Teck.
Teck Response:
See Key Theme – Agreement and Regulator Requests (Section 2.4).
FRONTIER OIL SANDS MINE PROJECT 3 SOC RESPONSES 3.7 WILDLIFE
RESPONSES TO FMM SOCS – APRIL 2016 Page 100
SOC 93
FMM Reference and Topic:
FMM [93], Section 7.7 Teck’s Mitigation Measures for Residual Effects
Conservation Agreement
McMurray Métis recommends that Teck provides more information regarding the intent and
details of the proposed conservation agreement and describes how McMurray Métis will be
consulted in the development and implementation of the proposed conservation agreement.
Teck Response:
A Conservation Agreement ties the development of resources to a commitment for conservation action.
Volume 1, Section 14.8.3 of the Project Update and the response to CEAA Round 5 SIR 131 provide
information on Teck’s biodiversity management plan and Conservation Agreement. Teck has stated in the
Project Update (see Volume 1, Section 18.6.4.2) and numerous regulatory filings that it “will work with
the governments of Alberta and Canada and look to their guidance on the development of a Conservation
Agreement.” Teck believes that mitigation measures that could form the basis of a Conservation
Agreement should be developed once the anticipated Environmental Protection and Enhancement Act
(EPEA) approval for the Project is received, and involve consultation with regulators, potentially affected
Aboriginal communities and stakeholders.
SOC 94
FMM Reference and Topic:
FMM [94], Section 7.7 Teck’s Mitigation Measures for Residual Effects
Wildlife Mitigation and Monitoring Plan
McMurray Métis recommends that Teck continues to include McMurray Métis community
members in the development and implementation of the WMMP.
Teck Response:
See Key Theme – Agreement and Regulator Requests (Section 2.4).
FRONTIER OIL SANDS MINE PROJECT 3 SOC RESPONSES 3.7 WILDLIFE
RESPONSES TO FMM SOCS – APRIL 2016 Page 101
SOC 95
FMM Reference and Topic:
FMM [95], Section 7.7 Teck’s Mitigation Measures for Residual Effects
Wildlife Mitigation and Monitoring Plan
McMurray Métis requests that Teck communicates technical information about the project’s
impacts on the environment and watershed, wildlife, and humans to Elders and younger
community members in plain language documents and verbally through presentations.
Teck Response:
See Key Theme – Agreement and Regulator Requests (Section 2.4).
SOC 96
FMM Reference and Topic:
FMM [96], Section 7.7 Teck’s Mitigation Measures for Residual Effects
Wildlife Mitigation and Monitoring Plan
McMurray Métis recommends that project-related documents are presented in plain-language and
oral presentations; specifically, Teck should present the Wildlife Mitigation and Monitoring Plan in
a manner that is easily understandable by those without scientific training.
Teck Response:
See Key Theme – Agreement and Regulator Requests (Section 2.4).

FRONTIER OIL SANDS MINE PROJECT 3 SOC RESPONSES 3.7 WILDLIFE
RESPONSES TO FMM SOCS – APRIL 2016 Page 102
SOC 97
FMM Reference and Topic:
FMM [97], Section 7.7 Teck’s Mitigation Measures for Residual Effects
Climate Change Adaptation Decision Support Tool
McMurray Métis recommends that AER requires Teck as a condition of any approval issued for
the proposed project to use the Climate Change Adaptation Decision Support Tool developed by
CEMA’s Reclamation Working Group and co-funded by Natural Resources Canada.
Teck Response:
See Key Theme – Agreement and Regulator Requests (Section 2.4).
SOC 98
FMM Reference and Topic:
FMM [98], Section 7.7 Teck’s Mitigation Measures for Residual Effects
Climate Change Adaptation Decision Support Tool
McMurray Métis recommends that Teck provides capacity funding for McMurray Métis
community members to participate in the parameterization of the Climate Change Adaptation
Decision Support Tool to adequately characterize the climate change observed by land users and
knowledge holders from pre-development conditions.
Teck Response:
See Key Theme – Agreement and Regulator Requests (Section 2.4).
FRONTIER OIL SANDS MINE PROJECT 3 SOC RESPONSES 3.7 WILDLIFE
RESPONSES TO FMM SOCS – APRIL 2016 Page 103
SOC 99
FMM Reference and Topic:
FMM [99], Section 7.7 Teck’s Mitigation Measures for Residual Effects
Conceptual Models to Support Monitoring Plans
McMurray Métis recommends that Teck provides capacity funding to develop a conceptual model
to support monitoring plans for assessing effectiveness of mitigation measures and evaluating
reclamation performance. This conceptual model should be informed by Métis environmental
knowledge as well as expert opinion from scientists.
Teck Response:
See Key Theme – Agreement and Regulator Requests (Section 2.4).
SOC 100
FMM Reference and Topic:
FMM [100], Section 7.7 Teck’s Mitigation Measures for Residual Effects
Regional Group Participation
McMurray Métis recommends that Teck advocates for and participates in multi-stakeholder
groups that require capacity for members of the general public, academics, environmental groups,
scientists and Aboriginal groups, where all members have equal opportunities to engage with
government and industry in monitoring programs and policy bodies.
Teck Response:
See Key Theme – Agreement and Regulator Requests (Section 2.4).
FRONTIER OIL SANDS MINE PROJECT 3 SOC RESPONSES 3.7 WILDLIFE
RESPONSES TO FMM SOCS – APRIL 2016 Page 104
SOC 101
FMM Reference and Topic:
FMM [101], Section 7.7 Teck’s Mitigation Measures for Residual Effects
Animal Awareness on Lease
McMurray Métis recommends that Teck provides a summary of how it will work with McMurray
Métis community members to develop Animal Management Programs.
Teck Response:
See Key Theme – Agreement and Regulator Requests (Section 2.4).
SOC 102
FMM Reference and Topic:
FMM [102], Section 7.7 Teck’s Mitigation Measures for Residual Effects
Bridge Crossing Mitigation
McMurray Métis recommends that Teck provides a description of how McMurray Métis members
were engaged in bridge design and specifies how Métis environmental knowledge of animal
crossings was incorporated into the bridge design.
Teck Response:
Design of the wildlife passage under the Athabasca River bridge will be finalized during future stages of
engineering and following regulatory approval for the Project. The design and mitigation strategies for
animal crossings will be developed in consultation with Aboriginal communities, regulators and
stakeholders, including Fort McMurray Métis.
FRONTIER OIL SANDS MINE PROJECT 3 SOC RESPONSES 3.7 WILDLIFE
RESPONSES TO FMM SOCS – APRIL 2016 Page 105
SOC 103
FMM Reference and Topic:
FMM [103], Section 7.7 Teck’s Mitigation Measures for Residual Effects
Bridge Crossing Mitigation
McMurray Métis recommends that Teck describes how engaging McMurray Métis members
influenced the development of mitigation strategies for reducing potential impacts of bridge design
on animal crossings on the Athabasca River.
Teck Response:
See the response to FMM SOC 102.
SOC 104
FMM Reference and Topic:
FMM [104], Section 7.7 Teck’s Mitigation Measures for Residual Effects
Bridge Crossing Mitigation
McMurray Métis recommends that Teck engages McMurray Métis members in providing Métis
environmental knowledge on animal crossings on the Athabasca River to incorporate in the bridge
design and associated mitigations.
Teck Response:
See Key Theme – Agreement and Regulator Requests (Section 2.4).
FRONTIER OIL SANDS MINE PROJECT 3 SOC RESPONSES 3.7 WILDLIFE
RESPONSES TO FMM SOCS – APRIL 2016 Page 106
SOC 105
FMM Reference and Topic:
FMM [105], Section 7.7 Teck’s Mitigation Measures for Residual Effects
Bird Deterrent Systems
McMurray Métis recommends that Teck provides a summary of how data collected through the
Joint Oil Sands Monitoring Program were used to evaluate effects on migratory birds and
associated mitigations.
Teck Response:
Teck is aware of four studies investigating the effects of oil sands on migratory birds that are supported
by the Joint Oil Sands Monitoring Program (JOSMP) or the Alberta Environmental Monitoring,
Evaluation and Reporting Agency (AEMERA):
• Status and trend monitoring of listed, rare, and difficult-to-monitor landbirds, led by Dr. S. Song,
Environment Canada
• Cause effects assessment of oil sands activity on migratory landbirds, Part 1 and Part 2, led by
Dr. C. L. Mahon, Environment Canada
• Cause-effects monitoring: waterfowl monitoring, led by S. Slattery, Ducks Unlimited Canada and
J. Ingram, Environment Canada
• Cause-effects monitoring: whooping crane monitoring, led by M. Bidwell, Environment Canada
Abstracts of these studies are available from AEMERA (2016); however, reports detailing results have
not been published. Teck will continue to monitor these and future studies undertaken as part of the
JOSMP, and will incorporate findings from these studies into the Project’s wildlife mitigation and
monitoring plan as appropriate.
References
AEMERA (Alberta Environmental Monitoring, Evaluation and Reporting Agency). 2016. Projects
Summary. Available at: http://aemera.org/our-activities/projects-summary/. Accessed February
2016.
FRONTIER OIL SANDS MINE PROJECT 3 SOC RESPONSES 3.7 WILDLIFE
RESPONSES TO FMM SOCS – APRIL 2016 Page 107
SOC 106
FMM Reference and Topic:
FMM [106], Section 7.7 Teck’s Mitigation Measures for Residual Effects
Bird Deterrent Systems
McMurray Métis recommends that Teck provides a summary of the data collected through JOSMP
describing migratory bird patterns; specifically, Teck should discuss any potential for the project’s
external tailings areas (i.e., tailings ponds) to be located within migratory bird routes or potentially
shifting routes. Furthermore, Teck should provide a summary of the data collected through
JOSMP that were used by Teck to evaluate bird deterrent options.
Teck Response:
Recent literature and data on migratory bird patterns and interactions with tailings areas are summarized
in Teck’s response to CEAA Round 5 SIRs 135, 138 and 139. The Joint Oil Sands Monitoring Program
(JOSMP) and the Alberta Environmental Monitoring, Evaluation and Reporting Agency (AEMERA) are
currently studying whooping crane migratory patterns and routes in the oil sands region (Nason 2016,
pers. comm.). In addition, the Oil Sands Bird Contact Monitoring Program (OSBCMP) is a regional
program that monitors bird interactions with tailings areas (see the response to CEAA Round 5 SIR 138).
Should additional data or reports become available (e.g., from JOSMP, AEMERA or OSBCMP) that
relate to bird interactions with tailings areas or the migration patterns of migratory birds, Teck will
evaluate the data and determine whether the waterfowl protection plan for the Project needs to be
updated.
References
Nason, T. 2016. Personal communication with Ted Nason, Team Lead, Biodiversity and Land,
AEMERA. Telephone conversation on February 24, 2016.
FRONTIER OIL SANDS MINE PROJECT 3 SOC RESPONSES 3.7 WILDLIFE
RESPONSES TO FMM SOCS – APRIL 2016 Page 108
SOC 107
FMM Reference and Topic:
FMM [107], Section 7.7 Teck’s Mitigation Measures for Residual Effects
Access Management Planning
McMurray Métis recommends that Teck funds an Access Management Strategy, including capacity
funding to support McMurray Métis’ participation in the development of the Access Management
Strategy. The strategy should address issues related to fragmentation and predator access to
caribou.
Teck Response:
See Key Theme – Agreement and Regulator Requests (Section 2.4).
SOC 108
FMM Reference and Topic:
FMM [108], Section 7.7 Teck’s Mitigation Measures for Residual Effects
Access Management Planning
McMurray Métis recommends that Teck allocates funds to support a Teck Frontier project-specific
Métis Environmental Knowledge Assessment, under the Access Management Strategy, which will
determine the pre-development baseline for terrain suitability for subsistence harvesting of fish,
large animals, and fur-bearers and support quantifying measures of the Traditional Land Use
Métis Environmental and Cultural Component (MECC) assessed in the Cultural Impact
Assessment.
Teck Response:
See Key Theme – Agreement and Regulator Requests (Section 2.4).
FRONTIER OIL SANDS MINE PROJECT 3 SOC RESPONSES 3.7 WILDLIFE
RESPONSES TO FMM SOCS – APRIL 2016 Page 109
SOC 109
FMM Reference and Topic:
FMM [109], Section 7.7 Teck’s Mitigation Measures for Residual Effects
Noise Mitigation
McMurray Métis recommends that Teck considers what impact construction- and operation-
related noise might have on wildlife, particularly sensitive and threatened species.
Teck Response:
The effect of noise (sensory disturbance) associated with human disturbance on key indicators (including
species at risk) was assessed using zones of influence (ZOI) as part of the habitat capability and suitability
models. Model ratings for habitat suitability within the ZOI were typically reduced based on factors such
as noise level. The extent of the ZOI and the magnitude of the effect (i.e., rating reduction) are species-
specific and vary depending on the type of disturbance feature, but in some cases can modify the habitat
suitability up to 400 m from the disturbance (see Volume 3, Section 11.4 and Appendix 11D of the
Project Update).
In the updated wildlife assessment, model ratings were based on information published in peer-reviewed
and technical literature and expert opinion. As an example, within 100 m of a winter road, habitat
suitability for boreal caribou was reduced by three ratings, based on information presented in Polfus et al.
(2011). This means that high value habitat (i.e., rated as 1) within 100 m of a winter road would be
reduced to no or very low habitat value (i.e., rated as 4). Rating adjustments and ZOI size for key
indicators are provided in Volume 3, Appendix 11D of the Project Update. For additional discussion, see
the response to AER Round 5 SIR 121 and CEAA Round 5 SIR 139a.
References
Polfus, J.L., M. Hebblewhite and K. Heinemeyer. 2011. Identifying indirect habitat loss and avoidance of
human infrastructure by northern mountain woodland caribou. Biological Conservation 144:
2637–2646.

FRONTIER OIL SANDS MINE PROJECT 3 SOC RESPONSES 3.7 WILDLIFE
RESPONSES TO FMM SOCS – APRIL 2016 Page 110
SOC 110
FMM Reference and Topic:
FMM [110], Section 7.7 Teck’s Mitigation Measures for Residual Effects
Noise Mitigation
McMurray Métis recommends that Teck assesses the potential impacts of noise from traffic and
heavy machinery on wildlife during construction and operation, including consultation with
McMurray Métis community members.
Teck Response:
As described in the response to FMM SOC 109, the effect of noise (sensory disturbance) associated with
human disturbance on key indicators (including species at risk) was assessed using zones of influence as
part of the habitat capability and suitability models. The assessment considered various noise sources
associated with construction and operation of oil sands projects in the vegetation and wildlife RSA.
Teck will continue to engage Aboriginal communities, including Fort McMurray Métis, in developing a
wildlife mitigation and monitoring plan for the Project.
SOC 111
FMM Reference and Topic:
FMM [111], Section 7.7 Teck’s Mitigation Measures for Residual Effects
Access to Information and Participation in Research
McMurray Métis recommends that AER requires that Teck provides direct access to all sources of
information it wishes to reference in relation to the project, especially where they are not accessible
in the public domain; specifically, McMurray Métis requests access to the following publications
referenced in the Project Update:
i. Bohm, H., E. Neilson, B. Thomas, S. Boutin and C. De La Mare. 2012. Wildlife Habitat
Effectiveness and Connectivity Program Annual Report 2012. University of Alberta, Edmonton,
Alberta.
ii. Boreal Caribou Research Program. 1999. Caribou conservation in working landscapes.
Unpublished report. Boreal Caribou Research Program, Edmonton, Alberta.
FRONTIER OIL SANDS MINE PROJECT 3 SOC RESPONSES 3.7 WILDLIFE
RESPONSES TO FMM SOCS – APRIL 2016 Page 111
iii. Carbyn, L.N., D. Huisman, E. Street and D. Anions. 1989. An Analysis of the Decline of Bison
in Wood Buffalo National Park from 1971 to 1981 and a Review of the Status to 1989. Canadian
Wildlife Services. Unpublished manuscript.
iv. Keith, L.B. 1972. Snowshare hare populations and forest regeneration in Northern Alberta.
Unpublished. University of Wisconsin, Madison, Wisconsin.
v. Kindopp, Rhona and Vassal, Michael, 2010. Wood Buffalo National Park Bison Survey,
February 2009. Unpublished Parks Canada Report.
vi. Nexen (Nexen Energy ULC). 2013. Algar Caribou Habitat Restoration Program 2012/2013
Phase 2 and 3 Areas. Field Operations Report.
vii. Nexen. 2014. Algar Caribou Habitat Restoration Program 2013/2014 Phase 2 and 3 Areas. Field
Operations Report.
viii. OSLI (Oil Sands Leadership Initiative). 2012. Algar Caribou Habitat Restoration Program Field
Operations: Phase 1 Area.
ix. Ruff, R.L. 1978. A study of the natural regulatory mechanisms acting on an unhunted population
of black bears near Cold Lake, Alberta. Unpublished. Department of Wildlife Ecology.
University of Wisconsin, Madison.
x. Stantec. 2014. Ronald Lake Bison Herd - 2014 Bison Wallow Aerial Survey. Memo to Teck,
October 1, 2014.
Teck Response:
Teck has requested permission from the respective authors to distribute the references and will provide
them as a single submission under separate cover once permission has been granted.
SOC 112
FMM Reference and Topic:
FMM [112], Section 7.7 Teck’s Mitigation Measures for Residual Effects
Access to Information and Participation in Research
McMurray Métis recommends that Teck supports (through capacity funding and advocacy)
McMurray Métis’ participation on research committees cited in the Project Update, as well as
future research endeavours, including, but not limited to, the following:
i. COSIA Wildlife Habitat Effectiveness and Connectivity (WHEC)
FRONTIER OIL SANDS MINE PROJECT 3 SOC RESPONSES 3.7 WILDLIFE
RESPONSES TO FMM SOCS – APRIL 2016 Page 112
ii. Alberta Association for Conservation Offsets
iii. Algar Historic Restoration Program
Teck Response:
i. See Key Theme – Agreement and Regulator Requests (Section 2.4).
ii. See Key Theme – Agreement and Regulator Requests (Section 2.4).
iii. See Key Theme – Agreement and Regulator Requests (Section 2.4).
SOC 113
FMM Reference and Topic:
FMM [113], Section 7.7 Teck’s Mitigation Measures for Residual Effects
Access to Information and Participation in Research
McMurray Métis recommends that Teck supports and advocates for the participation of
McMurray Métis members in research projects cited in the Project Update and, at minimum,
provides access to all publications created from research cited in the Project Update.
Teck Response:
See Key Theme – Agreement and Regulator Requests (Section 2.4).
FRONTIER OIL SANDS MINE PROJECT 3 SOC RESPONSES 3.8 BIODIVERSITY
RESPONSES TO FMM SOCS – APRIL 2016 Page 113
3.8 Biodiversity
SOC 114
FMM Reference and Topic:
FMM [114], Section 8.3 Deficiencies of Biodiversity Assessment in the Project Update
United Nations Convention on Biodiversity Article 8(j)
McMurray Métis recommends that Teck works with the McMurray Métis community to follow up
on the Cultural Impact Assessment to incorporate the intent of the UN Convention on Biodiversity
Article 8(j) and provide capacity for McMurray Métis to understand how the project’s impacts to
biodiversity affects Métis Environmental and Cultural Components and the community’s
opportunities to exercise Métis Rights within their Traditional Territory.
Teck Response:
See Key Theme – Agreement and Regulator Requests (Section 2.4).
SOC 115
FMM Reference and Topic:
FMM [115], Section 8.3 Deficiencies of Biodiversity Assessment in the Project Update
United Nations Convention on Biodiversity Article 8(j)
McMurray Métis recommends that Terms of Reference for the Biodiversity Assessment of Project
Applications include a requirement to meet the intent of the UN Convention on Biodiversity Article
8(j) and the objective of Canada’s Biodiversity Strategy to “…identify mechanisms to use traditional
knowledge, innovations and practices with the involvement of the holders of such knowledge,
innovations and practices, and encourage the equitable sharing of benefits arising from the utilization
of such knowledge, innovations and practices”.
Teck Response:
See Key Theme – Agreement and Regulator Requests (Section 2.4).
FRONTIER OIL SANDS MINE PROJECT 3 SOC RESPONSES 3.8 BIODIVERSITY
RESPONSES TO FMM SOCS – APRIL 2016 Page 114
SOC 116
FMM Reference and Topic:
FMM [116], Section 8.3 Deficiencies of Biodiversity Assessment in the Project Update
Alberta’s Draft Biodiversity Policy
McMurray Métis recommends that the Government of Alberta establishes a multi-stakeholder
committee that includes representation from McMurray Métis to develop policy recommendations
for actual involvement of Métis communities in decision making regarding biodiversity
conservation and management at sufficient levels to exercise constitutionally protected rights to
hunt, fish and trap within reasonable proximity to Métis communities and to support Métis rights
related to cultural and spiritual practices.
Teck Response:
See Key Theme – Agreement and Regulator Requests (Section 2.4).
SOC 117
FMM Reference and Topic:
FMM [117], Section 8.3 Deficiencies of Biodiversity Assessment in the Project Update
Alberta’s Draft Biodiversity Policy
McMurray Métis recommends that the Government of Alberta includes capacity funding as part of
the multi-stakeholder committee requested in Recommendation [116] for a Métis knowledge
research project to develop goals, management considerations, policy principles, strategic
directions, indicators and thresholds, monitoring programs and proactive management actions and
management responses specific to conserving biodiversity at sufficient levels to exercise
constitutionally protected rights to hunt, fish and trap within reasonable proximity to Métis
communities and to support Métis rights related to cultural and spiritual practices.
Teck Response:
See Key Theme – Agreement and Regulator Requests (Section 2.4).
FRONTIER OIL SANDS MINE PROJECT 3 SOC RESPONSES 3.8 BIODIVERSITY
RESPONSES TO FMM SOCS – APRIL 2016 Page 115
SOC 118
FMM Reference and Topic:
FMM [118], Section 8.3 Deficiencies of Biodiversity Assessment in the Project Update
Lower Athabasca Draft Biodiversity Management Framework
McMurray Métis recommends that the Government of Alberta establishes a multi-stakeholder
committee that provides capacity funding for participation of McMurray Métis and other
Aboriginal communities in the Lower Athabasca Region to complete at a minimum:
i. developing a scope of work and be provided capacity to conduct a collaborative, participatory
research process to gather traditional knowledge to support finalizing the BMF;
ii. defining “within a reasonable proximity of” First Nations and Métis population centres;
iii. identifying key biodiversity areas relevant to First Nations and Métis organizations;
iv. defining a pre-industrial baseline;
v. identifying indicators to measure First Nations and Métis peoples’ continued ability to exercise
constitutionally protected rights to hunt, fish and trap for food and to engage in traditional
land uses and cultural practices associated with these rights;
vi. developing monitoring protocols to evaluate the indicators identified in (v);
vii. deriving thresholds for indicators identified in (v);
viii. deriving management actions and responses when indicator thresholds defined in (vii) are
exceeded; and
ix. defining an adaptive management loop to contribute to improvements in practice based on the
results of monitoring the indicators defined by the communities.
Teck Response:
i. See Key Theme – Agreement and Regulator Requests (Section 2.4).
ii. See Key Theme – Agreement and Regulator Requests (Section 2.4).
iii. See Key Theme – Agreement and Regulator Requests (Section 2.4).
iv. See Key Theme – Agreement and Regulator Requests (Section 2.4).
v. See Key Theme – Agreement and Regulator Requests (Section 2.4).
vi. See Key Theme – Agreement and Regulator Requests (Section 2.4).
vii. See Key Theme – Agreement and Regulator Requests (Section 2.4).
FRONTIER OIL SANDS MINE PROJECT 3 SOC RESPONSES 3.8 BIODIVERSITY
RESPONSES TO FMM SOCS – APRIL 2016 Page 116
viii. See Key Theme – Agreement and Regulator Requests (Section 2.4).
ix. See Key Theme – Agreement and Regulator Requests (Section 2.4).
SOC 119
FMM Reference and Topic:
FMM [119], Section 8.3 Deficiencies of Biodiversity Assessment in the Project Update
Lower Athabasca Draft Biodiversity Management Framework
McMurray Métis recommends that Teck is required as a condition of any approval issued for the
proposed project to participate and provide funding for the multi-stakeholder committee referred
to in Recommendation [118].
Teck Response:
See Key Theme – Agreement and Regulator Requests (Section 2.4).
SOC 120
FMM Reference and Topic:
FMM [120], Section 8.7 Residual Effects Identified by Teck
Old-growth Forest
McMurray Métis recommends that Teck supports further investigation by McMurray Métis of the
Métis Environmental and Cultural Components (MECCs) defined in the Cultural Impact
Assessment to identify the potential stressors to biodiversity key indicators supporting MECCs and
their subsequent cascading effects and feedback loops on the MECCs. Through this process,
McMurray Métis will be in a position to contribute to developing Teck’s Biodiversity Management
Plan.
Teck Response:
See Key Theme – Agreement and Regulator Requests (Section 2.4).

FRONTIER OIL SANDS MINE PROJECT 3 SOC RESPONSES 3.8 BIODIVERSITY
RESPONSES TO FMM SOCS – APRIL 2016 Page 117
SOC 121
FMM Reference and Topic:
FMM [121], Section 8.7 Residual Effects Identified by Teck
Landscape Biodiversity
McMurray Métis recommends that Teck provides support to McMurray Métis to conduct further
landscape biodiversity analysis to define how the potential project impacts on Métis space and
cascading effects on Métis Environmental and Cultural Components dependent on Métis space
associated with landscape biodiversity.
Teck Response:
See Key Theme – Agreement and Regulator Requests (Section 2.4).
SOC 122
FMM Reference and Topic:
FMM [122], Section 8.7 Residual Effects Identified by Teck
Landscape Biodiversity
McMurray Métis recommends that Teck includes Métis knowledge holders and land users in life-
of-mine closure planning to guide the re-establishment of landscape diversity to support
reclamation of Métis spaces and provide capability for Métis Environmental and Cultural
Components.
Teck Response:
See Key Theme – Agreement and Regulator Requests (Section 2.4).
FRONTIER OIL SANDS MINE PROJECT 3 SOC RESPONSES 3.8 BIODIVERSITY
RESPONSES TO FMM SOCS – APRIL 2016 Page 118
SOC 123
FMM Reference and Topic:
FMM [123], Section 8.7 Residual Effects Identified by Teck
Wildlife Biodiversity
McMurray Métis recommends that Teck supports further development of the state-and-transition
simulation model developed by CEMA’s Reclamation Working Group to validate the reclamation
planning assumptions that existing biodiversity for the RMWB will be sustained and will provide a
source of recolonizing wildlife populations for the mineable oil sands area, once mine reclamation
and closure has occurred.
Teck Response:
See Key Theme – Agreement and Regulator Requests (Section 2.4).
SOC 124
FMM Reference and Topic:
FMM [124], Section 8.8 Teck’s Mitigation Measures for Residual Effects
Teck’s Biodiversity Management Plan
McMurray Métis recommends that AER requires Teck, as a condition of any approval for the
proposed project, to develop a Biodiversity Management Plan for its project.
Teck Response:
See Key Theme – Agreement and Regulator Requests (Section 2.4).
FRONTIER OIL SANDS MINE PROJECT 3 SOC RESPONSES 3.8 BIODIVERSITY
RESPONSES TO FMM SOCS – APRIL 2016 Page 119
SOC 125
FMM Reference and Topic:
FMM [125], Section 8.8 Teck’s Mitigation Measures for Residual Effects
Teck’s Biodiversity Management Plan
McMurray Métis recommends that AER modifies all existing oil sands mine approvals to include a
requirement for the operators to develop a Biodiversity Management Plan for its projects.
Teck Response:
See Key Theme – Agreement and Regulator Requests (Section 2.4).
SOC 126
FMM Reference and Topic:
FMM [126], Section 8.8 Teck’s Mitigation Measures for Residual Effects
Teck’s Biodiversity Management Plan
McMurray Métis recommends that the Government of Alberta provides support and capacity
funding to McMurray Métis to participate in a multi-stakeholder organization mandated to
complete the unfinished biodiversity workplan of CEMA’s Reclamation Working Group and that
AER makes it a condition of all oil sands mine EPEA approvals that the operator participates and
funds such a multi-stakeholder organization.
Teck Response:
See Key Theme – Agreement and Regulator Requests (Section 2.4).
FRONTIER OIL SANDS MINE PROJECT 3 SOC RESPONSES 3.8 BIODIVERSITY
RESPONSES TO FMM SOCS – APRIL 2016 Page 120
SOC 127
FMM Reference and Topic:
FMM [127], Section 8.8 Teck’s Mitigation Measures for Residual Effects
Habitat Connectivity
McMurray Métis recommends that Teck commits to including Métis knowledge holders and land
users in wildlife habitat reclamation planning to discuss and plan habitat connectivity strategies.
Teck Response:
See Key Theme – Agreement and Regulator Requests (Section 2.4).
FRONTIER OIL SANDS MINE PROJECT 3 SOC RESPONSES 3.9 CLOSURE, CONSERVATION AND RECLAMATION PLAN
RESPONSES TO FMM SOCS – APRIL 2016 Page 121
3.9 Closure, Conservation and Reclamation Plan
SOC 128
FMM Reference and Topic:
FMM [128], Section 9.5 Project Schedule
Principles for Reclamation Planning
McMurray Métis recommends that Teck provides a summary of forestry activity in the lease:
i. prior to Teck’s and the previous proponents’ commenced winter drilling activities (pre-2006);
and
ii. each year since 2006.
McMurray Métis requests that Teck provides this information prior to the Application being
deemed complete by the regulators.
Teck Response:
i. Teck does not have information about pre-2006 forestry activities on the lease. Forestry activities are
managed by Alberta Environment and Parks through Forest Management Agreements and timber
licenses. Alberta–Pacific Forest Industries Inc. and Northland Forest Products Ltd. currently operate,
harvest and manage the forests in the PDA.
ii. See the response to part (i).
FRONTIER OIL SANDS MINE PROJECT 3 SOC RESPONSES 3.9 CLOSURE, CONSERVATION AND RECLAMATION PLAN
RESPONSES TO FMM SOCS – APRIL 2016 Page 122
SOC 129
FMM Reference and Topic:
FMM [129], Section 9.5 Project Schedule
Principles for Reclamation Planning
McMurray Métis recommends that AER requires, as a condition of any approval issued for the
proposed project, that Teck uses the Climate Change Adaptation Decision Support Tool in
reclamation planning and that climate change uncertainties are identified and mitigated.
Teck Response:
See Key Theme – Agreement and Regulator Requests (Section 2.4).
SOC 130
FMM Reference and Topic:
FMM [130], Section 9.5 Project Schedule
Principles for Reclamation Planning
McMurray Métis recommends that Teck provides capacity for the community to assess the risk of
climate change to Métis Environmental and Cultural Components using the Climate Change
Adaptation Decision Support Tool.
Teck Response:
See Key Theme – Agreement and Regulator Requests (Section 2.4).
FRONTIER OIL SANDS MINE PROJECT 3 SOC RESPONSES 3.9 CLOSURE, CONSERVATION AND RECLAMATION PLAN
RESPONSES TO FMM SOCS – APRIL 2016 Page 123
SOC 131
FMM Reference and Topic:
FMM [131], Section 9.5 Project Schedule
Adaptive Management Approach
McMurray Métis recommends that AER requires that, as a condition of any approval issued for
the project, Teck provides funding for and participates in CEMA’s Reclamation Working Group to
further develop the Adaptive Management Framework by incorporating Métis knowledge.
Teck Response:
See Key Theme – Agreement and Regulator Requests (Section 2.4).
SOC 132
FMM Reference and Topic:
FMM [132], Section 9.5 Project Schedule
Soil Characteristics
McMurray Métis recommends that Teck provides more information regarding how poor
reclamation suitability ratings for the upper and lower lifts might affect reclamation outcomes and
how reclamation practices were adjusted to account for poor reclamation suitability. McMurray
Métis requests that this information is provided prior to the Application being deemed complete by
the regulators.
Teck Response:
Reclamation suitability ratings are not directly considered in the reclamation practices for the Project.
Recent Environmental Protection and Enhancement Act (EPEA) approvals for similar oil sands mine
projects (e.g., TOTAL Joslyn North, Approval No. 228044-00-00) specify upland soil salvage by depth
increment (and associated with particular ecosites) and soil texture (but not based on soil quality).
Accordingly, upper and lower lift salvage prescriptions do not consider reclamation suitability because
reclamation material is stockpiled based on lift (upper or lower) and texture (coarse, medium to fine).
From a practical standpoint, once materials are incorporated into the stockpiles and later removed for
reclamation purposes, some mixing is expected, which would alter the suitability of a given sample.
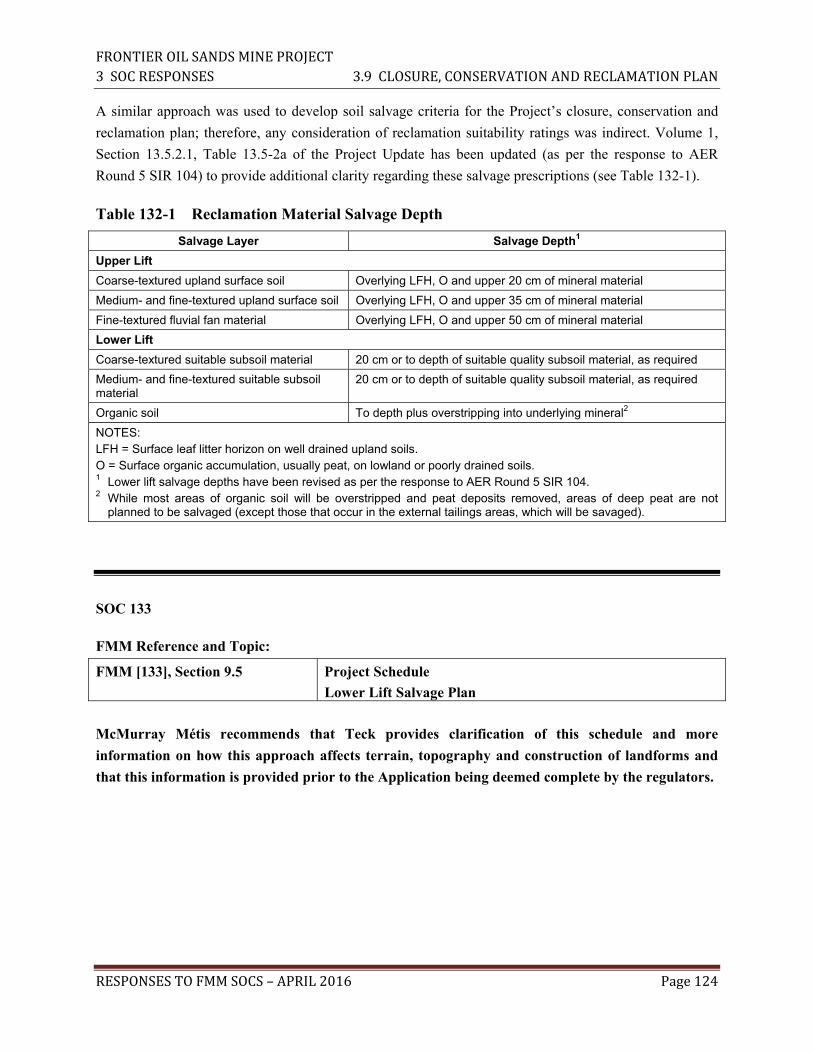
FRONTIER OIL SANDS MINE PROJECT 3 SOC RESPONSES 3.9 CLOSURE, CONSERVATION AND RECLAMATION PLAN
RESPONSES TO FMM SOCS – APRIL 2016 Page 124
A similar approach was used to develop soil salvage criteria for the Project’s closure, conservation and
reclamation plan; therefore, any consideration of reclamation suitability ratings was indirect. Volume 1,
Section 13.5.2.1, Table 13.5-2a of the Project Update has been updated (as per the response to AER
Round 5 SIR 104) to provide additional clarity regarding these salvage prescriptions (see Table 132-1).
Table 132-1 Reclamation Material Salvage Depth
Salvage Layer Salvage Depth1 Upper Lift
Coarse-textured upland surface soil Overlying LFH, O and upper 20 cm of mineral material Medium- and fine-textured upland surface soil Overlying LFH, O and upper 35 cm of mineral material Fine-textured fluvial fan material Overlying LFH, O and upper 50 cm of mineral material Lower Lift Coarse-textured suitable subsoil material 20 cm or to depth of suitable quality subsoil material, as required Medium- and fine-textured suitable subsoil material
20 cm or to depth of suitable quality subsoil material, as required
Organic soil To depth plus overstripping into underlying mineral2 NOTES: LFH = Surface leaf litter horizon on well drained upland soils. O = Surface organic accumulation, usually peat, on lowland or poorly drained soils. 1 Lower lift salvage depths have been revised as per the response to AER Round 5 SIR 104. 2 While most areas of organic soil will be overstripped and peat deposits removed, areas of deep peat are not
planned to be salvaged (except those that occur in the external tailings areas, which will be savaged).
SOC 133
FMM Reference and Topic:
FMM [133], Section 9.5 Project Schedule
Lower Lift Salvage Plan
McMurray Métis recommends that Teck provides clarification of this schedule and more
information on how this approach affects terrain, topography and construction of landforms and
that this information is provided prior to the Application being deemed complete by the regulators.

FRONTIER OIL SANDS MINE PROJECT 3 SOC RESPONSES 3.9 CLOSURE, CONSERVATION AND RECLAMATION PLAN
RESPONSES TO FMM SOCS – APRIL 2016 Page 125
Teck Response:
The closure terrain, topography, and landform construction are not affected by the soil salvage plan.
Closure landform size, shape, and location are driven by mine planning and environmental factors that
include (but are not limited to):
• the mine sequence, which determines the timing and volumes of overburden materials that are
removed to access the orebody
• original topography and pre-existing drainage patterns, which influence the size (i.e., height and area)
and shape of landforms and how final drainage patterns fit into the closure landscape
• geotechnical considerations, including pre-existing ground conditions, allowable height, side slopes,
and offset distances from key infrastructure such as pit walls and drainage channels
• the relative location of process infrastructure, which is important for landforms such as external
tailings areas that must be close to the plant site
• efficiencies such as minimizing the haul distance from excavation locations to disposal or storage
areas
• sustainability of the closure system, including ground subsidence, geomorphic landforms, pit lakes
and drainage system
For additional clarification regarding the lower lift salvage plan, see the response to AER Round 5
SIR 104e, including Table 104e-1.
SOC 134
FMM Reference and Topic:
FMM [134], Section 9.9 Closure Vegetation
Wetland Communities
McMurray Métis recommends that Teck provides a summary of why the ecosite mapping for the
PDA did not distinguish between the Central Mixedwood and Athabasca Plain Natural sub-regions
and comments on how the revegetation prescriptions for the east side of the PDA were developed to
re-establish vegetation common to the Athabasca Plain Natural Subregion given that the guidelines
apply to the Central Mixedwood Natural Subregion. McMurray Métis requests that this summary
is provided prior to the Application being deemed complete by the regulators.
FRONTIER OIL SANDS MINE PROJECT 3 SOC RESPONSES 3.9 CLOSURE, CONSERVATION AND RECLAMATION PLAN
RESPONSES TO FMM SOCS – APRIL 2016 Page 126
Teck Response:
According to Downing and Pettapiece (2006), both the Central Mixedwood and Athabasca Plain Natural
subregions are part of the Boreal Forest Natural Region. As such, upland communities in the PDA were
appropriately mapped according to the Boreal Mixedwood ecological area described in Beckingham and
Archibald (1996).
In addition, Teck’s revegetation prescriptions reflect the site type approach described in The Guidelines
for Reclamation to Forest Vegetation in the Athabasca Oil Sands Region, 2nd Edition (AENV 2010) (see
Volume 1, Section 13.6.2.3 of the Project Update). Site types provide a system of classifying vegetation
communities that is more broadly defined than ecosites and that reflects a broader range of moisture and
nutrient regimes. Using site types to develop revegetation prescriptions:
• reflects species overlap between ecosite phases
• allows for greater flexibility in revegetation prescriptions in recognition of uncertainty in edaphic
conditions on newly reclaimed landscapes
References
AENV (Alberta Environment). 2010. Guidelines for Reclamation to Forest Vegetation in the Athabasca
Oil Sands Region, 2nd Edition. Prepared by the Terrestrial Subgroup of the Reclamation Working
Group of the Cumulative Environmental Management Association, December 2009. Fort
McMurray, Alberta.
Beckingham, J.D. and J.H. Archibald. 1996. Field Guide to Ecosites of Northern Alberta. Special
Report 5, Canadian Forest Service, Northwest Region. UBC Press. Vancouver, British Columbia.
Downing, D.J. and W.W. Pettapiece. 2006. Natural Regions and Subregions of Alberta. Compiled for the
Natural Regions Committee, Government of Alberta. Pub. No. T/852. Edmonton, Alberta.

FRONTIER OIL SANDS MINE PROJECT 3 SOC RESPONSES 3.9 CLOSURE, CONSERVATION AND RECLAMATION PLAN
RESPONSES TO FMM SOCS – APRIL 2016 Page 127
SOC 135
FMM Reference and Topic:
FMM [135], Section 9.9 Closure Vegetation
Closure Drainage
McMurray Métis recommends that Teck supports further development of the wetlands land units’
state-and-transition simulation models developed by CEMA’s Reclamation Working Group to link
the state-and-transition simulation models to a hydrological model.
Teck Response:
See Key Theme – Agreement and Regulator Requests (Section 2.4).
SOC 136
FMM Reference and Topic:
FMM [136], Section 9.9 Closure Vegetation
Access to References
McMurray Métis requests that Teck provides copies of the following documents to McMurray
Métis:
i. CONRAD and DFO (Canadian Oil Sands Network for Research and Development and
Department of Fisheries and Oceans). 2008. Geomorphic Characterization and Design of
Alluvial Channels in the Athabasca Oil Sands Region. Prepared by Golder Associates Ltd.,
Calgary, Alberta.
ii. Golder (Golder Associates Ltd.). 2004. Vegetated waterways design guidelines. Prepared for
Syncrude Canada Ltd. Calgary, Alberta.
Teck Response:
i. This report is publicly available and provided as Appendix 136.1.
ii. This report is not publicly available. It was referenced to demonstrate that this type of design
experience is used in the oil sands industry and that it was incorporated into the conceptual design of
the closure drainage systems for the Frontier Project.
FRONTIER OIL SANDS MINE PROJECT 3 SOC RESPONSES 3.9 CLOSURE, CONSERVATION AND RECLAMATION PLAN
RESPONSES TO FMM SOCS – APRIL 2016 Page 128
SOC 137
FMM Reference and Topic:
FMM [137], Section 9.9 Closure Vegetation
Closure Drainage Case Studies
McMurray Métis requests that Teck provides the citations and copies of the publications for the
case studies used and the examples referred to in the Project Update to McMurray Métis and that
this information is provided prior to the Application being deemed complete by the regulators.
Teck Response:
Although the closure drainage case studies and examples referred to in the Project Update are not
published, they summarize relevant oil sands mining industry experience and information that can be used
in preparing the conceptual closure drainage plan and design for the Project.
SOC 138
FMM Reference and Topic:
FMM [138], Section 9.9 Closure Vegetation
Regional Collaborative Initiatives
McMurray Métis recommends that Teck facilitates participation of community members and
technical representatives of McMurray Métis in regional collaborative initiatives undertaken by
COSIA.
Teck Response:
See Key Theme – Agreement and Regulator Requests (Section 2.4).

FRONTIER OIL SANDS MINE PROJECT 3 SOC RESPONSES 3.9 CLOSURE, CONSERVATION AND RECLAMATION PLAN
RESPONSES TO FMM SOCS – APRIL 2016 Page 129
SOC 139
FMM Reference and Topic:
FMM [139], Section 9.9 Closure Vegetation
Regional Collaborative Initiatives
McMurray Métis recommends that Teck facilitates a workshop with community members and
technical representatives of McMurray Métis to review the fluvial geomorphic design approach
with the community.
Teck Response:
See Key Theme – Agreement and Regulator Requests (Section 2.4).
SOC 140
FMM Reference and Topic:
FMM [140], Section 9.9 Closure Vegetation
Conceptual Closure Drainage Plan
McMurray Métis recommends that the Government of Alberta establishes a multi-stakeholder
organization and provides capacity for McMurray Métis to participate in such a committee to
develop a guidance document for construction of treatment wetlands in the oil sands region.
Teck Response:
See Key Theme – Agreement and Regulator Requests (Section 2.4).

FRONTIER OIL SANDS MINE PROJECT 3 SOC RESPONSES 3.9 CLOSURE, CONSERVATION AND RECLAMATION PLAN
RESPONSES TO FMM SOCS – APRIL 2016 Page 130
SOC 141
FMM Reference and Topic:
FMM [141], Section 9.9 Closure Vegetation
Conceptual Closure Drainage Plan
McMurray Métis recommends that Teck facilitates participation of community members and
technical representatives of McMurray Métis in development of a guidance document for
construction of treatment wetlands in the oil sands region.
Teck Response:
See Key Theme – Agreement and Regulator Requests (Section 2.4).
SOC 142
FMM Reference and Topic:
FMM [142], Section 9.9 Closure Vegetation
Monitoring
McMurray Métis recommends that AER, as a requirement of any approval issued for the project,
includes a condition for Teck to share monitoring data and site inspection reports annually with
McMurray Métis.
Teck Response:
See Key Theme – Agreement and Regulator Requests (Section 2.4).

FRONTIER OIL SANDS MINE PROJECT 3 SOC RESPONSES 3.9 CLOSURE, CONSERVATION AND RECLAMATION PLAN
RESPONSES TO FMM SOCS – APRIL 2016 Page 131
SOC 143
FMM Reference and Topic:
FMM [143], Section 9.9 Closure Vegetation
Monitoring
McMurray Métis recommends that Teck provides opportunities for members of McMurray Métis
to acquire training and conduct annual monitoring of the closure drainage systems.
Teck Response:
See Key Theme – Agreement and Regulator Requests (Section 2.4).
SOC 144
FMM Reference and Topic:
FMM [144], Section 9.9 Closure Vegetation
Seepage
McMurray Métis recommends that AER, as a requirement of any approval issued for the project,
includes a condition for Teck to share seepage management data and reports annually with
McMurray Métis.
Teck Response:
See Key Theme – Agreement and Regulator Requests (Section 2.4).
FRONTIER OIL SANDS MINE PROJECT 3 SOC RESPONSES 3.9 CLOSURE, CONSERVATION AND RECLAMATION PLAN
RESPONSES TO FMM SOCS – APRIL 2016 Page 132
SOC 145
FMM Reference and Topic:
FMM [145], Section 9.10 Biodiversity Management Plan
Post-mining Traditional Land Uses
McMurray Métis recommends that Teck includes and provides capacity funding for members and
technical representatives of McMurray Métis on the Reclamation Working Group(s) to be created
by Teck.
Teck Response:
See Key Theme – Agreement and Regulator Requests (Section 2.4).
SOC 146
FMM Reference and Topic:
FMM [146], Section 9.10 Biodiversity Management Plan
Uncertainty
McMurray Métis recommends that Teck evaluates mountain pine beetle modelling options and
considers how these models could be linked to the Climate Change Adaptation Decision Support
Tool developed by CEMA’s Reclamation Working Group. McMurray Métis requests that Teck
shares the results of this evaluation with McMurray Métis or includes McMurray Métis in a plan to
proceed with linking the mountain-pine beetle models to the Climate Change Adaptation Decision
Support Tool.
Teck Response:
See Key Theme – Adequacy of the Environmental Impact Assessment (Section 2.1).
FRONTIER OIL SANDS MINE PROJECT 3 SOC RESPONSES 3.9 CLOSURE, CONSERVATION AND RECLAMATION PLAN
RESPONSES TO FMM SOCS – APRIL 2016 Page 133
SOC 147
FMM Reference and Topic:
FMM [147], Section 9.10 Biodiversity Management Plan
Returning Lands to the Crown
McMurray Métis recommends that Teck provides capacity for McMurray Métis to complete
unfinished work of CEMA’s Reclamation Working Group to develop criteria and indicators for oil
sands mine reclamation to evaluate the capability of reclaimed lands to support traditional end
land uses.
Teck Response:
See Key Theme – Agreement and Regulator Requests (Section 2.4).
SOC 148
FMM Reference and Topic:
FMM [148], Section 9.10 Biodiversity Management Plan
Returning Lands to the Crown
McMurray Métis recommends that AER requires Teck, as a condition of any approval issued for
the project, to include McMurray Métis in the evaluation of any reclaimed lands for reclamation
certification to declare that reclaimed lands provide capability to support traditional end lands
uses.
Teck Response:
See Key Theme – Agreement and Regulator Requests (Section 2.4).
FRONTIER OIL SANDS MINE PROJECT 3 SOC RESPONSES 3.9 CLOSURE, CONSERVATION AND RECLAMATION PLAN
RESPONSES TO FMM SOCS – APRIL 2016 Page 134
SOC 149
FMM Reference and Topic:
FMM [149], Section 9.11 Business Opportunities
Business Opportunities in Reclamation
McMurray Métis requests that Teck commits to providing contracts to Métis-owned businesses for
conducting reclamation activities.
Teck Response:
See Key Theme – Agreement and Regulator Requests (Section 2.4).

FRONTIER OIL SANDS MINE PROJECT 3 SOC RESPONSES 3.10 TRADITIONAL LAND USE AND KNOWLEDGE
RESPONSES TO FMM SOCS – APRIL 2016 Page 135
3.10 Traditional Land Use and Knowledge
SOC 150
FMM Reference and Topic:
FMM [150], Section 10.2 Assessment Framing
Narrow Framing of Assessment
McMurray Métis recommends that Teck frames its assessment of impacts to traditional land use in
terms of how (and not simply whether) the project, incrementally and cumulatively, might impact
traditional land use and how impacts to traditional land use reverberate throughout the socio-
economic and cultural systems of the McMurray Métis community.
Teck Response:
See Key Theme – Adequacy of the Environmental Impact Assessment (Section 2.1).
SOC 151
FMM Reference and Topic:
FMM [151], Section 10.3 Definition of Traditional Knowledge
Unduly Restrictive Definition of Traditional Knowledge
McMurray Métis recommends that Teck provides a rationale for its limited definition of
Traditional Knowledge, in comparison with CEAA’s definition. The explanation should refer to the
relevant and up-to-date impact assessment literature and best practices within the impact-
assessment community.
Teck Response:
See Key Theme – Adequacy of the Environmental Impact Assessment (Section 2.1).
FRONTIER OIL SANDS MINE PROJECT 3 SOC RESPONSES 3.10 TRADITIONAL LAND USE AND KNOWLEDGE
RESPONSES TO FMM SOCS – APRIL 2016 Page 136
SOC 152
FMM Reference and Topic:
FMM [152], Section 10.3 Definition of Traditional Knowledge
Unduly Restrictive Definition of Traditional Knowledge
McMurray Métis recommends that Teck revises its definition of Traditional Knowledge in
alignment with the CEAA definition used in the McMurray Métis CIA. Teck should revise the
impact assessment to reflect a broader definition of TK and incorporate the baseline information
provided by the McMurray Métis CIA.
Teck Response:
See Key Theme – Adequacy of the Environmental Impact Assessment (Section 2.1).
SOC 153
FMM Reference and Topic:
FMM [153], Section 10.4 Study Areas
Inadequate Traditional Land Use Local Study Areas
McMurray Métis recommends that Teck revises its LSA for TLU to incorporate the LSAs for
Acoustics and Air Quality in order to capture more completely the spatial dimensions of potential
project impacts to TLU and that this is completed before the Application is deemed complete.
Teck Response:
See Key Theme – Adequacy of the Environmental Impact Assessment (Section 2.1).

FRONTIER OIL SANDS MINE PROJECT 3 SOC RESPONSES 3.10 TRADITIONAL LAND USE AND KNOWLEDGE
RESPONSES TO FMM SOCS – APRIL 2016 Page 137
SOC 154
FMM Reference and Topic:
FMM [154], Section 10.4 Study Areas
Inappropriate “Preferred Use Area”
McMurray Métis recommends that Teck provides capacity funding to McMurray Métis to
determine a more appropriate and factually grounded “preferred use area” for the purposes of the
assessing potential impacts to McMurray Métis’ traditional land use.
Teck Response:
See Key Theme – Agreement and Regulator Requests (Section 2.4).
SOC 155
FMM Reference and Topic:
FMM [155], Section 10.5 Assessment Criteria
Inadequate Rationale for the Exclusion of Frequency
McMurray Métis recommends that Teck provides a more robust and substantiated rationale for its
decision to exclude “Frequency” from its effects classification and determination of consequence for
TLU. The rationale should refer to the relevant and up-to-date impact assessment literature and
best practices within the impact assessment community.
Teck Response:
See Key Theme – Adequacy of the Environmental Impact Assessment (Section 2.1).
FRONTIER OIL SANDS MINE PROJECT 3 SOC RESPONSES 3.10 TRADITIONAL LAND USE AND KNOWLEDGE
RESPONSES TO FMM SOCS – APRIL 2016 Page 138
SOC 156
FMM Reference and Topic:
FMM [156], Section 10.5 Assessment Criteria
Inadequate Rationale for the Exclusion of Frequency
McMurray Métis recommends that Teck includes “Frequency” as a factor in its effects
classification and determination of consequence for TLU. The “Frequency” of impacts to TLU and
culture should be included in the discussion of potential impacts, the classification table and the
sections on the determination of consequence.
Teck Response:
See Key Theme – Adequacy of the Environmental Impact Assessment (Section 2.1).
SOC 157
FMM Reference and Topic:
FMM [157], Section 10.6 Determination of Consequence
Inadequate Criteria for the Determination of Consequence
McMurray Métis recommends that Teck provides a more substantial explanation for selecting the
criteria for the determination of consequence, and in particular for the exclusion of “Frequency”
and “Reversibility”. The explanation should refer to the relevant and current impact assessment
literature and best practices within the impact assessment community.
Teck Response:
See Key Theme – Adequacy of the Environmental Impact Assessment (Section 2.1).
FRONTIER OIL SANDS MINE PROJECT 3 SOC RESPONSES 3.10 TRADITIONAL LAND USE AND KNOWLEDGE
RESPONSES TO FMM SOCS – APRIL 2016 Page 139
SOC 158
FMM Reference and Topic:
FMM [158], Section 10.6 Determination of Consequence
Inadequate Criteria for the Determination of Consequence
McMurray Métis recommends that Teck revises its determination of consequence to include
“Frequency” and “Reversibility” in its discussion and rating of the consequence of potential project
impacts to TLU.
Teck Response:
See Key Theme – Adequacy of the Environmental Impact Assessment (Section 2.1).
SOC 159
FMM Reference and Topic:
FMM [159], Section 10.6 Determination of Consequence
Inadequate Definition of Effects-Classification Criteria
McMurray Métis recommends that Teck provides a more precise and robust definition of
“Geographic Extent.” The explanation should refer to relevant and current impact assessment
literature and best practices within the impact assessment community.
Teck Response:
See Key Theme – Adequacy of the Environmental Impact Assessment (Section 2.1).
FRONTIER OIL SANDS MINE PROJECT 3 SOC RESPONSES 3.10 TRADITIONAL LAND USE AND KNOWLEDGE
RESPONSES TO FMM SOCS – APRIL 2016 Page 140
SOC 160
FMM Reference and Topic:
FMM [160], Section 10.6 Determination of Consequence
Inadequate Definition of Effects-Classification Criteria
McMurray Métis recommends that Teck provides a more precise and robust definition of
“Magnitude”. The explanation should refer to relevant and current impact assessment literature
and best practices within the impact assessment community.
Teck Response:
See Key Theme – Adequacy of the Environmental Impact Assessment (Section 2.1).
SOC 161
FMM Reference and Topic:
FMM [161], Section 10.6 Determination of Consequence
Inadequate Consequence Ratings Explanation
McMurray Métis recommends that Teck provides a more detailed and rigourous explanation for
how consequence ratings were determined, with reference to each of the criteria used to make the
determination. These explanations should be based, where possible, on the relevant impact
assessment literature and best practices within the impact assessment community.
Teck Response:
See Key Theme – Adequacy of the Environmental Impact Assessment (Section 2.1).
FRONTIER OIL SANDS MINE PROJECT 3 SOC RESPONSES 3.10 TRADITIONAL LAND USE AND KNOWLEDGE
RESPONSES TO FMM SOCS – APRIL 2016 Page 141
SOC 162
FMM Reference and Topic:
FMM [162], Section 10.7 Mitigation, Management, and Monitoring
Lack of Specificity for Traditional Land Use Mitigation Measures
McMurray Métis recommends that Teck negotiates binding and McMurray-Métis-specific
mitigation measures for TLU prior to completion of the Hearing process. Mitigations measures
should include/consider but not be limited to the following:
i. Cultural Sustainability Mitigation Plan;
ii. Community-Based Monitoring Program;
iii. Cumulative Effects Management Strategy;
iv. Community Development Plan;
v. Business Development Plan;
vi. Conservation offsets that address traditional use, wildlife, and other ecological and cultural
objectives;
vii. Protection of historic resources and specific TLU sites;
viii. Community participation in the reclamation plan, access management plan, wildlife mitigation
and monitoring plan, fish habitat offsetting plan, noise mitigation, traffic management plan,
wetlands monitoring, water and tailings management plan and other mitigation and
monitoring plans; and
ix. Capacity funding and participation in multi-stakeholder groups and regional initiatives.
Also, see the recommendations listed in the Cultural Impact Assessment (Clark, 2015, pages 155 to
158) and the TLU Study (Willow Springs Strategic Solutions, 2014, Section 6.4, Pages 47 to 49).
Teck Response:
i. See Key Theme – Agreement and Regulator Requests (Section 2.4).
ii. See Key Theme – Agreement and Regulator Requests (Section 2.4).
iii. See Key Theme – Agreement and Regulator Requests (Section 2.4).
iv. See Key Theme – Agreement and Regulator Requests (Section 2.4).
v. See Key Theme – Agreement and Regulator Requests (Section 2.4).
FRONTIER OIL SANDS MINE PROJECT 3 SOC RESPONSES 3.10 TRADITIONAL LAND USE AND KNOWLEDGE
RESPONSES TO FMM SOCS – APRIL 2016 Page 142
vi. See Key Theme – Agreement and Regulator Requests (Section 2.4).
vii. See Key Theme – Agreement and Regulator Requests (Section 2.4).
viii. See Key Theme – Agreement and Regulator Requests (Section 2.4).
ix. See Key Theme – Agreement and Regulator Requests (Section 2.4).
SOC 163
FMM Reference and Topic:
FMM [163], Section 10.7 Mitigation, Management, and Monitoring
Lack of Traditional Land Use Follow-Up and Monitoring Program
McMurray Métis recommends that Teck commits to designing and implementing a TLU Follow-Up
and Monitoring Program. The program should describe what additional mitigation measures will
be implemented if the proposed measures prove unsuccessful.
Teck Response:
See Key Theme – Agreement and Regulator Requests (Section 2.4).
SOC 164
FMM Reference and Topic:
FMM [164], Section 10.7 Mitigation, Management, and Monitoring
Lack of Traditional Land Use Follow-Up and Monitoring Program
McMurray Métis recommends that Teck negotiates with McMurray Métis regarding the role of the
community in the design and implementation of a TLU Follow-Up and Monitoring Program.
Teck Response:
See Key Theme – Agreement and Regulator Requests (Section 2.4).
FRONTIER OIL SANDS MINE PROJECT 3 SOC RESPONSES 3.10 TRADITIONAL LAND USE AND KNOWLEDGE
RESPONSES TO FMM SOCS – APRIL 2016 Page 143
SOC 165
FMM Reference and Topic:
FMM [165], Section 10.7 Mitigation, Management, and Monitoring
Lack of Traditional Land Use Follow-Up and Monitoring Program
McMurray Métis recommends that Teck reaches an agreement with McMurray Métis regarding
the role of the community in the design and implementation of a TLU Follow-Up and Monitoring
Program, the completion and implementation of this program should be a condition of project
approval.
Teck Response:
See Key Theme – Agreement and Regulator Requests (Section 2.4).
SOC 166
FMM Reference and Topic:
FMM [166], Section 10.8 CEMA’s Indigenous Traditional Knowledge Framework
Funding to Develop Practitioner’s Guide for Indigenous Traditional Knowledge Framework
McMurray Métis requests that Teck and the Government of Alberta commit to providing funds to
CEMA or another organization agreeable to McMurray Métis, to complete the Practitioner’s
Guide to Implementing the Indigenous Traditional Knowledge Framework as part of CEMA’s
Traditional Knowledge Working Group’s 2016 workplan.
Teck Response:
See Key Theme – Agreement and Regulator Requests (Section 2.4).
FRONTIER OIL SANDS MINE PROJECT 3 SOC RESPONSES 3.11 HISTORICAL RESOURCES
RESPONSES TO FMM SOCS – APRIL 2016 Page 144
3.11 Historical Resources
SOC 167
FMM Reference and Topic:
FMM [167], Section 11.2 Métis-specific Historical Resource Information
Lack of a Métis-specific Historical Resource Impact Assessment and Baseline Study
McMurray Métis recommends that Teck consults with McMurray Métis regarding historical
resources and ensures that McMurray Métis has opportunities to participate in ongoing historical
resources baseline field studies.
Teck Response:
See Key Theme – Agreement and Regulator Requests (Section 2.4).
SOC 168
FMM Reference and Topic:
FMM [168], Section 11.2 Métis-specific Historical Resource Information
Lack of a Métis-specific Historical Resource Impact Assessment and Baseline Study
McMurray Métis recommends that Teck:
i. presents a brief summary of some of the historical context for how and where Métis
archaeological material would be located in northern Alberta;
ii. reviews previous research on Métis archaeological sites in Alberta and in neighbouring
provinces;
iii. defines the types of archaeological sites that are associated with Métis land use and occupancy;
and
iv. presents management recommendations for mitigating potential impacts of the project to Métis
heritage resources.

FRONTIER OIL SANDS MINE PROJECT 3 SOC RESPONSES 3.11 HISTORICAL RESOURCES
RESPONSES TO FMM SOCS – APRIL 2016 Page 145
Teck Response:
i. See Key Theme – Adequacy of the Environmental Impact Assessment (Section 2.1).
ii. See Key Theme – Adequacy of the Environmental Impact Assessment (Section 2.1).
iii. See Key Theme – Adequacy of the Environmental Impact Assessment (Section 2.1).
iv. See Key Theme – Adequacy of the Environmental Impact Assessment (Section 2.1).
FRONTIER OIL SANDS MINE PROJECT 3 SOC RESPONSES 3.12 SOCIO-ECONOMIC IMPACTS
RESPONSES TO FMM SOCS – APRIL 2016 Page 146
3.12 Socio-economic Impacts
SOC 169
FMM Reference and Topic:
FMM [169], Section 12.2 Scoping and Framing
Inadequate Scoping Effort
McMurray Métis recommends that Teck submits a socio-economic assessment that addresses the
concerns raised in this review in relation to the McMurray Métis community.
Teck Response:
See Key Theme – Agreement and Regulator Requests (Section 2.4).
SOC 170
FMM Reference and Topic:
FMM [170], Section 12.2 Scoping and Framing
Inadequate Scoping Effort
McMurray Métis recommends that Teck consults with McMurray Métis regarding the scoping of a
socio-economic assessment that addresses the concerns and interests of the McMurray Métis
community and ensures that potential socio-economic impacts to the McMurray Métis are properly
considered and characterized.
Teck Response:
See Key Theme – Agreement and Regulator Requests (Section 2.4).
FRONTIER OIL SANDS MINE PROJECT 3 SOC RESPONSES 3.12 SOCIO-ECONOMIC IMPACTS
RESPONSES TO FMM SOCS – APRIL 2016 Page 147
SOC 171
FMM Reference and Topic:
FMM [171], Section 12.3 McMurray Métis-specific Socio-economic Information
Lack of McMurray Métis-Specific Socio-economic Assessment
McMurray Métis recommends that the Joint Review Panel considers the SEIA inadequate and
incomplete with respect to the assessment of cumulative socio-economic effects on McMurray Métis
and requests that Teck addresses this issue prior to any hearing.
Teck Response:
See Key Theme – Agreement and Regulator Requests (Section 2.4).
SOC 172
FMM Reference and Topic:
FMM [172], Section 12.3 McMurray Métis-specific Socio-economic Information
Lack of McMurray Métis-Specific Socio-economic Assessment
McMurray Métis recommends that Teck provides financial support to McMurray Metis to conduct
a community-led socio-economic community baseline and impact assessment. This report should
provide an adequate pre-development socio-economic baseline, assess potential incremental and
cumulative socio-economic effects, propose appropriate mitigation measures, provide a proper
effects characterization and determination of significance, and recommend mitigation,
compensation, monitoring and follow-up strategies. A community-led socio-economic study would
be complementary to and could build on the community-led Métis Land Use and Occupancy Study
(MLUO, Willow Springs Strategic Solutions, 2014) and Cultural Impact Assessment (CIA; Clark,
2015) studies.
Teck Response:
See Key Theme – Agreement and Regulator Requests (Section 2.4).

FRONTIER OIL SANDS MINE PROJECT 3 SOC RESPONSES 3.12 SOCIO-ECONOMIC IMPACTS
RESPONSES TO FMM SOCS – APRIL 2016 Page 148
SOC 173
FMM Reference and Topic:
FMM [173], Section 12.4 Baseline Information
Inadequate Socio-Economic Baseline
McMurray Métis recommends that the Joint Review Panel requires Teck to address the issue of an
inadequate and incomplete socio-economic impacts assessment prior to convening a hearing.
Teck Response:
See Key Theme – Agreement and Regulator Requests (Section 2.4).
SOC 174
FMM Reference and Topic:
FMM [174], Section 12.4 Baseline Information
Inadequate Socio-Economic Baseline
McMurray Métis recommends that Teck consults with McMurray Métis regarding the gathering of
pre-development and pre-current-conditions baseline socio-economic information for the
community. This could be done as part of the community-led socio-economic baseline and
assessment requested in [173].
Teck Response:
See Key Theme – Agreement and Regulator Requests (Section 2.4).

FRONTIER OIL SANDS MINE PROJECT 3 SOC RESPONSES 3.12 SOCIO-ECONOMIC IMPACTS
RESPONSES TO FMM SOCS – APRIL 2016 Page 149
SOC 175
FMM Reference and Topic:
FMM [175], Section 12.5 Residual Effects Characterization
Lack of Residual Effects Characterization
McMurray Métis recommends that the Joint Review Panel considers the SEIA submitted by Teck
as inadequate and incomplete with respect to the lack of residual effects characterization of effects
on McMurray Métis and requests that Teck addresses this issue prior to any hearing.
Teck Response:
See Key Theme – Agreement and Regulator Requests (Section 2.4).
SOC 176
FMM Reference and Topic:
FMM [176], Section 12.5 Residual Effects Characterization
Lack of Residual Effects Characterization
McMurray Métis recommends that Teck consults with McMurray Métis regarding the
determination of criteria for the classification of residual project effects on the McMurray Métis
community.
Teck Response:
See Key Theme – Agreement and Regulator Requests (Section 2.4).

FRONTIER OIL SANDS MINE PROJECT 3 SOC RESPONSES 3.12 SOCIO-ECONOMIC IMPACTS
RESPONSES TO FMM SOCS – APRIL 2016 Page 150
SOC 177
FMM Reference and Topic:
FMM [177], Section 12.6 Impact Significance or Consequence
Lack of Significance or Consequence Determination
McMurray Métis recommends that the Joint Review Panel considers the SEIA inadequate and
incomplete with respect to the lack of significance or consequence determination of the effects on
McMurray Métis and requests that Teck addresses this issue prior to any hearing.
Teck Response:
See Key Theme – Agreement and Regulator Requests (Section 2.4).
SOC 178
FMM Reference and Topic:
FMM [178], Section 12.6 Impact Significance or Consequence
Lack of Significance or Consequence Determination
McMurray Métis recommends that Teck consults with McMurray Métis regarding the
determination of criteria for the classification of residual project socio-economic effects on the
McMurray Métis community. McMurray Metis has developed criteria, informed by guidance from
CEAA, for assessing residual impacts on Métis Environmental and Cultural Components (MECCs)
(page 25 to 33, Clark, 2015) that may be applicable or adaptable to assessing socio-economic effects.
Teck Response:
See Key Theme – Agreement and Regulator Requests (Section 2.4).
FRONTIER OIL SANDS MINE PROJECT 3 SOC RESPONSES 3.12 SOCIO-ECONOMIC IMPACTS
RESPONSES TO FMM SOCS – APRIL 2016 Page 151
SOC 179
FMM Reference and Topic:
FMM [179], Section 12.7 Cumulative Effects
Inadequate Cumulative Effects Assessment
McMurray Métis recommends that the Joint Review Panel considers the SEIA inadequate and
incomplete with respect to the assessment of cumulative socio-economic effects on McMurray Métis
and requests that Teck addresses this issue prior to any hearing.
Teck Response:
See Key Theme – Agreement and Regulator Requests (Section 2.4).
SOC 180
FMM Reference and Topic:
FMM [180], Section 12.7 Cumulative Effects
Inadequate Cumulative Effects Assessment
McMurray Métis recommends that Teck consults with McMurray Métis regarding designing and
executing a proper cumulative effects assessment of the project’s potential socio-economic effects on
the McMurray Métis community and provides capacity funding to McMurray Métis to undertake a
socio-economic cumulative effects assessment.
Teck Response:
See Key Theme – Agreement and Regulator Requests (Section 2.4).
FRONTIER OIL SANDS MINE PROJECT 3 SOC RESPONSES 3.12 SOCIO-ECONOMIC IMPACTS
RESPONSES TO FMM SOCS – APRIL 2016 Page 152
SOC 181
FMM Reference and Topic:
FMM [181], Section 12.8 Economics and Employment
Non-Binding Commitments on Economic Benefits
McMurray Métis recommends that Teck consults with McMurray Métis regarding establishing
project employment targets and fly-in/fly-out schedules. Employment targets should be set across
various employment categories and should emphasize long-term permanent positions, so that global
targets are not simply met by hiring community members into the lowest-paying or temporary
positions. Targets should prioritize young people and women and should be enforceable with
penalties for non-compliance.
Teck Response:
See Key Theme – Agreement and Regulator Requests (Section 2.4).
SOC 182
FMM Reference and Topic:
FMM [182], Section 12.8 Economics and Employment
Non-Binding Commitments on Economic Benefits
McMurray Métis recommends that Teck consults with McMurray Métis regarding negotiating
targets for Direct-Negotiated Contracts with McMurray Métis-owned businesses. Targets should be
enforceable with penalties for non-compliance.
Teck Response:
See Key Theme – Agreement and Regulator Requests (Section 2.4).

FRONTIER OIL SANDS MINE PROJECT 3 SOC RESPONSES 3.12 SOCIO-ECONOMIC IMPACTS
RESPONSES TO FMM SOCS – APRIL 2016 Page 153
SOC 183
FMM Reference and Topic:
FMM [183], Section 12.8 Economics and Employment
Non-Binding Commitments on Economic Benefits
McMurray Métis recommends that Teck consults with McMurray Métis regarding establishing a
project recruitment and employment training program that specifically targets McMurray Métis
youth and women.
Teck Response:
See Key Theme – Agreement and Regulator Requests (Section 2.4).
SOC 184
FMM Reference and Topic:
FMM [184], Section 12.8 Economics and Employment
Non-Binding Commitments on Economic Benefits
McMurray Métis recommends that Teck consults with McMurray Métis regarding gathering
information on labour-market-readiness gaps for community members.
Teck Response:
See Key Theme – Agreement and Regulator Requests (Section 2.4).
FRONTIER OIL SANDS MINE PROJECT 3 SOC RESPONSES 3.12 SOCIO-ECONOMIC IMPACTS
RESPONSES TO FMM SOCS – APRIL 2016 Page 154
SOC 185
FMM Reference and Topic:
FMM [185], Section 12.9 Mitigation, Monitoring, and Follow-Up
Insufficient Mitigation, Monitoring, and Follow-Up Programs
McMurray Métis recommends that Teck consults with McMurray Métis to establish McMurray
Métis mitigation measures. This can only be done, however, once the potential and cumulative
socio-economic impacts to the community have been properly assessed. The development of
mitigation measures should also take into account the Cultural Impact Assessment and its
recommendations (Clark, 2015).
Teck Response:
See Key Theme – Agreement and Regulator Requests (Section 2.4).
SOC 186
FMM Reference and Topic:
FMM [186], Section 12.9 Mitigation, Monitoring, and Follow-Up
Insufficient Mitigation, Monitoring, and Follow-Up Programs
McMurray Métis recommends that Teck provides capacity funding to McMurray Métis to develop
a socio-economic monitoring program to ensure the mitigation and compensatory measures agreed
to by Teck are implemented in full and a timely fashion and are effective. This could be done in
conjunction with monitoring and follow-up related to the Cultural Impact Assessment.
Teck Response:
See Key Theme – Agreement and Regulator Requests (Section 2.4).
FRONTIER OIL SANDS MINE PROJECT 3 SOC RESPONSES 3.12 SOCIO-ECONOMIC IMPACTS
RESPONSES TO FMM SOCS – APRIL 2016 Page 155
SOC 187
FMM Reference and Topic:
FMM [187], Section 12.9 Mitigation, Monitoring, and Follow-Up
Insufficient Mitigation, Monitoring, and Follow-Up Programs
McMurray Métis recommends that Teck consults with McMurray Métis regarding developing a
socio-economic follow-up and adaptive management program, as per CEAA guidance, to determine
the effectiveness of mitigation measures and to adapt as necessary.
Teck Response:
See Key Theme – Agreement and Regulator Requests (Section 2.4).
FRONTIER OIL SANDS MINE PROJECT 3 SOC RESPONSES 3.13 MÉTIS CONSULTATION
RESPONSES TO FMM SOCS – APRIL 2016 Page 156
3.13 Métis Consultation
SOC 188
FMM Reference and Topic:
FMM [188], Section 13.2 Additional Métis-focused Studies
Lack of Full Consultation for Socio-economic Impact Assessment
McMurray Métis recommends that Teck provides capacity funding to McMurray Métis to conduct
a socio-economic baseline study and project-specific and cumulative effects socio-economic
assessment.
Teck Response:
See Key Theme – Agreement and Regulator Requests (Section 2.4).
SOC 189
FMM Reference and Topic:
FMM [189], Section 13.3 Additional Consultation on Mitigation, Management and Monitoring
Lack of Full Consultation for Mitigation, Management and Monitoring
McMurray Métis recommends that Teck includes McMurray Métis in the AMP and WMMP
before project approval. This should include ongoing consultation with land users or harvesters
regarding project development.
Teck Response:
See Key Theme – Agreement and Regulator Requests (Section 2.4).

FRONTIER OIL SANDS MINE PROJECT 3 SOC RESPONSES 3.14 CUMULATIVE EFFECTS ANALYSIS AND ACCESS MANAGEMENT
RESPONSES TO FMM SOCS – APRIL 2016 Page 157
3.14 Cumulative Effects Analysis and Access Management
SOC 190
FMM Reference and Topic:
FMM [190], Section 14.1 Introduction
Cumulative Effects on McMurray Métis’ Traditional Territory
Cumulative Effects Analysis
McMurray Métis recommends that Teck provides financial support for the Community to
complete an in-depth cumulative effects analysis of the Frontier Project. This cumulative
assessment would expand the Métis Environmental and Cultural Components (MECCs) identified
in the Cultural Impact Assessment and would include defining clear indicators for each MECC and
describing the pre-development, existing and future conditions for each MECC. The results of the
cumulative effects analysis would assist McMurray Métis and Teck in defining environmentally
and culturally based thresholds and establishing an Adaptive Management Framework to ensure
the sustainability of MECCs as the Frontier Mine is developed.
Teck Response:
See Key Theme – Agreement and Regulator Requests (Section 2.4).
SOC 191
FMM Reference and Topic:
FMM [191], Section 14.3 Access Key Concerns and Recommendations
Land and Access Loss
McMurray Métis recommends that the governments of Alberta and Canada develop and
implement, in cooperation with McMurray Métis, a Cumulative Effects Management Strategy
based on Métis Environmental and Cultural Components and embodying the principles of socio-
cultural impact assessment including Indigenous participation and knowledge, interdependence
and cumulativeness, sustainability, uncertainty and precaution, and equity. This system would
include an Adaptive Management Framework that defines research, monitoring and modelling to

FRONTIER OIL SANDS MINE PROJECT 3 SOC RESPONSES 3.14 CUMULATIVE EFFECTS ANALYSIS AND ACCESS MANAGEMENT
RESPONSES TO FMM SOCS – APRIL 2016 Page 158
evaluate the assumptions applied by the Government of Alberta to manage cumulative effects in
McMurray Métis’ Traditional Territory. Active Adaptive Management would be applied as part of
the Adaptive Management Framework by project proponents to assist in validating the
assumptions for mitigation success in the project applications approved by the regulators.
Teck Response:
See Key Theme – Agreement and Regulator Requests (Section 2.4).
SOC 192
FMM Reference and Topic:
FMM [192], Section 14.3 Access Key Concerns and Recommendations
Land and Access Loss
McMurray Métis recommends that the Government of Alberta conducts (or provides sufficient
funding for McMurray Métis to conduct) a cumulative effects assessment of all existing, approved
and likely development in McMurray Métis’ Traditional Territory and an assessment of
cumulative impacts to McMurray Métis’ rights.
Teck Response:
See Key Theme – Agreement and Regulator Requests (Section 2.4).
SOC 193
FMM Reference and Topic:
FMM [193], Section 14.3 Access Key Concerns and Recommendations
Land and Access Loss
McMurray Métis recommends that Teck provides support (financial and informational) to projects
initiated by McMurray Métis to conduct independent assessments of the cumulative effects of
industrial development on McMurray Métis’ Traditional Territory and land uses in comparison to
regional pre-disturbance reference conditions (i.e., pre-1960).
Teck Response:
See Key Theme – Agreement and Regulator Requests (Section 2.4).
FRONTIER OIL SANDS MINE PROJECT 3 SOC RESPONSES 3.14 CUMULATIVE EFFECTS ANALYSIS AND ACCESS MANAGEMENT
RESPONSES TO FMM SOCS – APRIL 2016 Page 159
SOC 194
FMM Reference and Topic:
FMM [194], Section 14.3 Access Key Concerns and Recommendations
Increased Access to McMurray Métis’ Traditional Territory
McMurray Métis recommends that Teck completes a quantitative assessment (e.g., using landscape
modelling similar to SEWG and LARP) of the effects of increased access on wildlife, including
bison, and fish populations and that the application is not deemed complete by AER until this
assessment is complete.
Teck Response:
See Key Theme – Adequacy of the Environmental Impact Assessment (Section 2.1).
SOC 195
FMM Reference and Topic:
FMM [195], Section 14.3 Access Key Concerns and Recommendations
Increased Access to McMurray Métis’ Traditional Territory
McMurray Métis recommends that:
i. the governments of Alberta and Canada negotiate consultation and accommodation agreements
with McMurray Métis to address and limit cumulative impacts in McMurray Métis’
Traditional Territory, and to accommodate McMurray Métis’ rights and interests;
ii. the Government of Alberta collaborates with McMurray Métis in developing a regional access
management plan; and
iii. McMurray Métis is meaningfully consulted on the implementation of the Comprehensive
Regional Infrastructure Sustainability Plan (CRISP) or any other regional road planning.
Teck Response:
i. See Key Theme – Agreement and Regulator Requests (Section 2.4).
ii. See Key Theme – Agreement and Regulator Requests (Section 2.4).
iii. See Key Theme – Agreement and Regulator Requests (Section 2.4).
FRONTIER OIL SANDS MINE PROJECT 3 SOC RESPONSES 3.14 CUMULATIVE EFFECTS ANALYSIS AND ACCESS MANAGEMENT
RESPONSES TO FMM SOCS – APRIL 2016 Page 160
SOC 196
FMM Reference and Topic:
FMM [196], Section 14.3 Access Key Concerns and Recommendations
Increased Access to McMurray Métis’ Traditional Territory
McMurray Métis recommends that Teck continues to consult with McMurray Métis on its project-
specific access management plan, including providing input by McMurray Métis members and
developing mitigative measures to minimize impacts from increased access created by the project.
Teck Response:
See Key Theme – Agreement and Regulator Requests (Section 2.4) and Teck’s response to AER Round 5
SIR 102 and CEAA Round 5 SIR 162.
SOC 197
FMM Reference and Topic:
FMM [197], Section 14.3 Access Key Concerns and Recommendations
Increased Access to McMurray Métis’ Traditional Territory
McMurray Métis recommends that Teck develops an access management plan for roads and other
linear access features within McMurray Métis’ Traditional Territory. Until an access management
plan is in place that McMurray Métis supports, McMurray Métis requests that continued road
access is not permitted in this part of McMurray Métis’ Traditional Territory.
Teck Response:
See Key Themes – Management, Mitigation and Monitoring (Section 2.2) and Agreement and Regulator
Requests (Section 2.4).
FRONTIER OIL SANDS MINE PROJECT 3 SOC RESPONSES 3.14 CUMULATIVE EFFECTS ANALYSIS AND ACCESS MANAGEMENT
RESPONSES TO FMM SOCS – APRIL 2016 Page 161
SOC 198
FMM Reference and Topic:
FMM [198], Section 14.3 Access Key Concerns and Recommendations
Participating in Regional Multi-stakeholder Groups
Mandatory Industry Funding of CEMA
McMurray Métis recommends that the Minister of Alberta Environment and Parks re-instates
mandatory industry funding of CEMA in 2016 and until the knowledge gaps have been addressed.
Teck Response:
See Key Theme – Agreement and Regulator Requests (Section 2.4).
SOC 199
FMM Reference and Topic:
FMM [199], Section 14.3 Access Key Concerns and Recommendations
Participating in Regional Multi-stakeholder Groups
Mandatory Industry Participation in CEMA
McMurray Métis recommends that AER includes conditions in any EPEA approval issued for the
Frontier Oil Sands Mine requiring Teck to participate in CEMA.
Teck Response:
See Key Theme – Agreement and Regulator Requests (Section 2.4).
FRONTIER OIL SANDS MINE PROJECT 3 SOC RESPONSES 3.14 CUMULATIVE EFFECTS ANALYSIS AND ACCESS MANAGEMENT
RESPONSES TO FMM SOCS – APRIL 2016 Page 162
SOC 200
FMM Reference and Topic:
FMM [200], Section 14.3 Access Key Concerns and Recommendations
Participating in Regional Multi-stakeholder Groups
Capacity Funding to Support McMurray Métis’ Participation in Cumulative Environmental Management Association
McMurray Métis recommends that Teck provides financial support to McMurray Métis to have a
technical representative participate in CEMA or any other regional initiatives established to
replace CEMA.
Teck Response:
See Key Theme – Agreement and Regulator Requests (Section 2.4).

FRONTIER OIL SANDS MINE PROJECT 4 CLOSING
RESPONSES TO FMM SOCS – APRIL 2016 Page 163
4 Closing
FMM input into Teck’s submissions for the Project has enabled Teck to better understand
FMM concerns and perspectives regarding development of the Project and industrial
development in the Athabasca Oil Sands Region. The FMM technical review, traditional
use study, community-led cultural impact assessment and consultation efforts with Teck
have positively contributed to Project planning and the environmental impact assessment,
including development of mitigation measures.
Teck is committed to continuing to work through concerns with FMM to achieve a full
resolution. Teck looks forward to continuing to work with FMM as the Project continues
to move through the regulatory review process and future stages of project planning.
FRONTIER OIL SANDS MINE PROJECT APPENDIX 136.1: REQUESTED REFERENCE –CONRAD AND DFO (2008)
RESPONSES TO FMM SOCS – APRIL 2016
Appendix 136.1 Requested Reference – CONRAD and DFO (2008)
REPORT ON
GEOMORPHIC CHARACTERIZATION AND DESIGN OF ALLUVIAL CHANNELS IN
THE ATHABASCA OIL SANDS REGION
Submitted to:
Canadian Oil Sands Network for Research and Development
and Department of Fisheries and Oceans
December 2008 05-1326-031
102, 2535 - 3rd Avenue S.E., Calgary, Alberta, Canada T2A 7W5 Tel: +1 (403) 299 5600 Fax: +1 (403) 299 5606 www.golder.com
Golder Associates: Operations in Africa, Asia, Australasia, Europe, North America and South America

Canadian Oil Sands Network for Research and Development December 2008 Department of Fisheries and Oceans - i - 05-1326-031
Golder Associates
EXECUTIVE SUMMARY
This report and the associated alluvial channel design manual (Golder, 2008) present the results of a study intended to characterize natural alluvial channels in the Athabasca Oil Sands Region (OSR) so that they can be replicated for closure drainage plans based on geomorphic approach.
This study commenced in fall 2005 upon receipt of a research fellowship award from the Natural Sciences and Engineering Research Council (NSERC). Further funding was provided by the Canadian Oil Sands Network for Research and Development (CONRAD) and the Department of Fisheries and Oceans (DFO).
The collection of geomorphic data in the OSR took place during two field seasons in fall 2005 and fall 2006. Data collection involved detailed geomorphic surveys to obtain channel bankfull dimensions, bed material composition, channel slope and instantaneous discharge. Maps were used to determine the valley slope, representative surficial geology, sinuosity, drainage basin area and meander wavelength. Hydraulic models were used to determine the two-year peak discharge (assumed equal to bankfull discharge), mean annual discharge and channel roughness.
Geomorphic data were collected using standardized methods and augmented with available data collected during various Environmental Impact Assessments (EIAs) of oil sands developments. This process resulted in geomorphic database for the OSR. Future Geomorphic data collection in the OSR may be collected using the same methods to augment the database.
The geomorphic database was used to develop regime relationships for mean and maximum bankfull depths, bankfull width and sinuosity. The regime relationships are expressed as power equations with the independent parameter represented by the channel parameter and the dependent parameter represented by the bankfull discharge. The coefficients and exponents of the OSR regime relationships are comparable to those in the literature; however, channels in the OSR are observed to be wider and deeper than those elsewhere for which regime relationships have been developed. Region-specific regime relationships were developed for channel slope, meander wavelength and meander belt width.
Roughness caused by large woody debris and other obstructions such as active and inactive beaver dams was determined to have a significant effect on OSR channel hydraulics and results in unique natural channel morphology. An effective way of mimicking the channel flow conditions is to place roughness elements (obstructions made of naturally-occurring debris) in the constructed channel at intervals determined using a design tool developed for this purpose. The primary function of
Canadian Oil Sands Network for Research and Development December 2008 Department of Fisheries and Oceans - ii - 05-1326-031
Golder Associates
the design tool is to provide roughness element size and spacing based on bankfull discharge, channel dimensions, channel slope and grain roughness on the channel bed.
An alluvial channel design manual accompanies this report to provide a procedure for designing channels in OSR mine closure landscapes and recommendations for its use (Golder, 2008). The design procedure is presented as a flow chart to guide a channel designer. The flow chart is divided into sections for ease of use and is accompanied by detailed descriptions of each section and step. The design manual includes design examples to illustrate the process. The examples are intended to show the designer the step-by-step alluvial channel design procedure including the calculations required for four possible channel design scenarios.
The regime relationships and channel design recommendations in the accompanying design manual should only be used by qualified river engineers and fluvial geomorphologists who have an understanding of and experience with the fluvial geomorphology, hydrology and field conditions in the OSR.
Canadian Oil Sands Network for Research and Development December 2008 Department of Fisheries and Oceans - iii - 05-1326-031
Golder Associates
TABLE OF CONTENTS
SECTION PAGE
1 INTRODUCTION ......................................................................................................... 1 1.1 OIL SANDS MINE CLOSURE DRAINAGE PLANNING NEEDS .................................... 1 1.2 SUSTAINABLE DRAINAGE FACILITIES ........................................................................ 3 1.3 GEOMORPHIC APPROACH .......................................................................................... 5 1.4 STUDY OF BASELINE FLUVIAL GEOMORPHOLOGY ................................................. 9 1.5 REPLICATION OF NATURAL CHANNELS IN A CONSTRUCTED LANDSCAPE ...... 10 1.6 GOALS AND OBJECTIVES .......................................................................................... 11 1.7 PROJECT OWNERS ..................................................................................................... 11 1.8 REPORT CONTENTS ................................................................................................... 12
2 LITERATURE REVIEW ............................................................................................. 13 2.1 GEOMORPHIC APPROACH ........................................................................................ 13 2.2 CHANNEL REGIME RELATIONSHIPS ........................................................................ 14 2.3 GEOMORPHIC CHANNEL DESIGN METHODS ......................................................... 15 2.4 AVAILABLE GEOMORPHIC DATA ............................................................................... 17 2.5 CONCLUSIONS ............................................................................................................ 18
3 PHYSICAL SETTING OF THE ATHABASCA OIL SANDS REGION ........................ 19 3.1 CLIMATE ....................................................................................................................... 19 3.2 GEOLOGY ..................................................................................................................... 19 3.3 GEOMORPHOLOGICAL HISTORY .............................................................................. 20 3.4 HYDROLOGY ................................................................................................................ 20 3.5 VEGETATION ................................................................................................................ 22 3.6 ALLUVIAL CHANNELS ................................................................................................. 22
4 ADOPTED METHODOLOGY ................................................................................... 28 4.1 OVERVIEW ................................................................................................................... 28 4.2 SITE SELECTION ......................................................................................................... 29 4.3 FIELD PROGRAMS ....................................................................................................... 30
4.3.1 Fall 2005 Field Program ................................................................................. 30 4.3.2 Fall 2006 Field Program ................................................................................. 30
4.4 WATERSHED CHARACTERISTICS ............................................................................. 32 4.4.1 Drainage Basin Area (km2) ............................................................................ 32 4.4.2 Drainage Basin Slope (m/m) .......................................................................... 32 4.4.3 Lowland or Upland Drainage Basin ............................................................... 32 4.4.4 Total Stream Length (m) ................................................................................ 33 4.4.5 Drainage Density (m-1) ................................................................................... 33 4.4.6 Drainage Basin Bedrock Geology .................................................................. 33 4.4.7 Drainage Basin Surficial Geology .................................................................. 33
4.5 STREAM CHANNEL CHARACTERISTICS .................................................................. 34 4.5.1 Bankfull Width (m) .......................................................................................... 34 4.5.2 Mean Bankfull Depth (m) ............................................................................... 36 4.5.3 Maximum Bankfull Depth (m) ......................................................................... 36 4.5.4 Bankfull Width-Depth Ratio ............................................................................ 36 4.5.5 Channel Slope (m/m) ..................................................................................... 36 4.5.6 Sinuosity/Irregularity (m/m) ............................................................................ 37 4.5.7 Meander Belt Width (m) ................................................................................. 39 4.5.8 Fine Particle Composition of Bed Material ..................................................... 39 4.5.9 Median Bed-Material Size (mm) .................................................................... 39
Canadian Oil Sands Network for Research and Development December 2008 Department of Fisheries and Oceans - iv - 05-1326-031
Golder Associates
4.5.10 Flow Resistance ............................................................................................. 40 4.5.11 Channel Surficial Geology ............................................................................. 41 4.5.12 Deviations from Reach-Averaged Channel Parameter Values ..................... 42
4.6 FLOW CHARACTERISTICS ......................................................................................... 43 4.6.1 Mean Annual Discharge (m3/s) ...................................................................... 43 4.6.2 Bankfull Discharge (m3/s) ............................................................................... 43
5 RESULTS OF ANALYSIS ......................................................................................... 45 5.1 DATABASE DEVELOPMENT AND ANALYSIS ............................................................ 45 5.2 EXISTING REGIME RELATIONSHIPS ......................................................................... 45 5.3 OSR REGIME EQUATIONS ......................................................................................... 48
5.3.1 Bankfull Width ................................................................................................ 49 5.3.2 Maximum Bankfull Depth ............................................................................... 59 5.3.3 Mean Bankfull Depth ...................................................................................... 66 5.3.4 Channel Slope................................................................................................ 73 5.3.5 Sinuosity/Irregularity ...................................................................................... 76 5.3.6 Meander Wavelength ..................................................................................... 80 5.3.7 Meander Belt Width ....................................................................................... 82
5.4 FLOW RESISTANCE .................................................................................................... 82
6 CONCLUSIONS AND RECOMMENDATIONS ......................................................... 86
7 CLOSURE ................................................................................................................. 89
8 THIRD PARTY DISCLAIMER ................................................................................... 90
9 REFERENCES .......................................................................................................... 91
LIST OF TABLES
Table 3.1 Flood Peak Discharges of Large Gauged Basins in the OSR ............................... 21 Table 5.1 Regime Equations Present in the Literature .......................................................... 47 Table 5.2 Ranges of Coefficient and Exponent Values for Existing Regime
Relationships. ........................................................................................................ 48 Table 5.3 OSR-Specific Regime Equations for Bankfull Width and Depth ............................ 73 Table 5.4 HEC-RAS Model Simulation Results for Reaches Surveyed in 2005 ................... 84 Table 5.5 HEC-RAS Model Simulation Results for Reaches Surveyed in 2006 ................... 85
LIST OF FIGURES
Figure 1.1 Alberta Oil Sands Distribution .................................................................................. 2 Figure 1.2 Structurally-Designed Channel Lined with Rip Rap for Erosion Protection. ............ 4 Figure 1.3 Terraced Slope on a waste dump. ........................................................................... 5 Figure 1.4 Geomorphic Landform Design of a Vegetated Waterway ....................................... 8 Figure 3.1 Upland channel with cobble-sized bed material in the riffle section and large
woody debris in the channel .................................................................................. 23 Figure 3.2 A lowland channel with low sediment load, a beaver dam and grassy
vegetation on the floodplain ................................................................................... 24 Figure 3.3 Aerial view of lowland channel flowing through muskeg ....................................... 25 Figure 3.4 Lowland channel flowing through muskeg ............................................................. 25 Figure 3.5 Large woody debris in a forested, lowland channel ............................................... 26 Figure 3.6 Forest abutting channel banks in a lowland channel ............................................. 27

Canadian Oil Sands Network for Research and Development December 2008 Department of Fisheries and Oceans - v - 05-1326-031
Golder Associates
Figure 4.1 Study Reach Selection .......................................................................................... 30 Figure 4.2 2005 and 2006 Survey and Sinuosity Sites ........................................................... 31 Figure 4.3 Channel Parameters .............................................................................................. 35 Figure 4.4 Schematic Examples of Sinuosity .......................................................................... 38 Figure 5.1 Reach-Averaged Bankfull Width versus Bankfull Discharge ................................. 50 Figure 5.2 Cross-Sectional Bankfull Width Versus Bankfull Discharge .................................. 52 Figure 5.3 Relationship Between Coefficient of Variation and Bankfull Discharge ................ 54 Figure 5.4 Exceedance Curve for Deviations From Reach-Averaged Bankfull Width............ 56 Figure 5.5 The Effect of Channel Slope on the Relationship Between Reach-Averaged
Bankfull Width and Bankfull Discharge .................................................................. 57 Figure 5.6 The Effect of Drainage Basin Surficial Geology on the Relationship Between
Reach-Averaged Bankfull Width and Bankfull Discharge ..................................... 58 Figure 5.7 Reach-Averaged Maximum Bankfull Depth Versus Bankfull Discharge ............... 60 Figure 5.8 Cross-Sectional Maximum Bankfull Depth Versus Bankfull Discharge ................. 61 Figure 5.9 Exceedance Curve for Deviations From Reach-Averaged Maximum Bankfull
Depth ..................................................................................................................... 63 Figure 5.10 The Effect of Channel Slope on the Relationship Between Reach-Averaged
Maximum Bankfull Depth and Bankfull Discharge ................................................. 64 Figure 5.11 The Effect of Drainage Basin Surficial Geology on the Relationship between
Reach-Averaged Maximum Bankfull Depth and Bankfull Discharge .................... 65 Figure 5.12 Reach-Averaged Mean Bankfull Depth Versus Bankfull Discharge ...................... 67 Figure 5.13 Cross-Sectional Mean Bankfull Depth Versus Bankfull Discharge ....................... 68 Figure 5.14 Exceedance Curve for Deviations from Reach-Averaged Mean Bankfull Depth .. 70 Figure 5.15 The Effect of Channel Slope on the Relationship between Reach-Averaged
Mean Bankfull Depth and Bankfull Discharge ....................................................... 71 Figure 5.16 The Effect of Drainage Basin Surficial Geology on the Relationship between
Reach-Averaged Mean Bankfull Depth and Bankfull Discharge ........................... 72 Figure 5.17 Threshold Relationship between Channel Slope and Bankfull Discharge
Showing Bed Material Size. ................................................................................... 75 Figure 5.18 Regime Relationship between Sinuosity and Bankfull Discharge Based on
Data Collection Date. ............................................................................................. 78 Figure 5.19 Regime Relationship between Sinuosity and Bankfull Discharge Based on
Drainage Basin Area. ............................................................................................. 79 Figure 5.20 Exceedance Curve for Deviations from Reach-Averaged Sinuosity ..................... 81
LIST OF APPENDICES
APPENDIX I Glossary Of Terms APPENDIX II Technical Procedures For Geomorphic Survey APPENDIX III OSR Fluvial Geomorphic Database APPENDIX IV Fluvial Geomorphic Data Summary Sheets APPENDIX V Fluvial Geomorphic Field Survey Data APPENDIX VI Results of HEC-RAS Analysis for Channel Roughness R:\Active\_2005\1326\05-1326-031 NSERC\Final Reporting\Final Report\Main Report\Final Report_Alluvial Channels_Dec 08_05-1326-031.doc
CONRAD December 2008 DFO - 1 - 05-1326-031
Golder Associates
1 INTRODUCTION
1.1 OIL SANDS MINE CLOSURE DRAINAGE PLANNING NEEDS
Alberta’s Athabasca Oil Sands Region (OSR) is the largest of three oil sands regions in the province and is the focus of this project. The three regions together - Athabasca, Peace River and Cold Lake - contain an estimated 1.6 trillion barrels of bitumen, which represents approximately one third of the world’s known oil reserves (Figure 1.1). Accessing the resource requires regulatory agreements between First Nations, federal and provincial government and industry members. Some of the bitumen reserves are close to the surface and are extracted from open pit oil sands mine operations that involve large land disturbances typically exceeding 50 km2. The large extent of excavations and fill placement often requires diversion of major watercourses and disturbance to the landscape and surficial geology of large tracts of land. This results in new topography and drainage patterns. Consequently, oil sands mine closure facilities will include suitable landscape, stream diversions, new drainage networks, erosion control systems, infrastructure protection and stable landforms.
Provincial government regulations require oil sands mine operators to prepare mine closure diversion and drainage plans that are able to accommodate a wide range of hydroclimatic events and provide suitable aquatic and riparian habitat (AENV, 1999). Failure of the diversion and drainage systems following closure certification is not acceptable because of associated erosion, increased sediment yield, ecosystem damage and alteration or destruction of fish habitat. Diversion and drainage systems must maintain their functionality in the long term after mine operators and government agencies have ceased maintenance and monitoring.
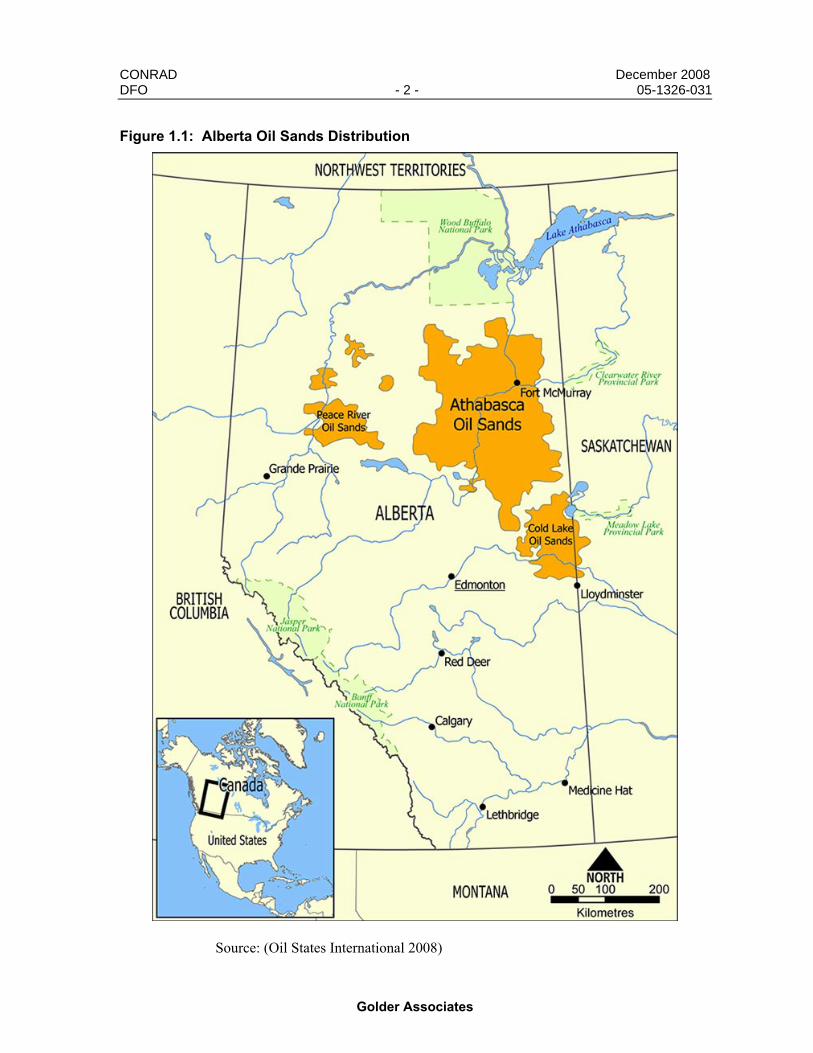
CONRAD December 2008 DFO - 2 - 05-1326-031
Golder Associates
Figure 1.1: Alberta Oil Sands Distribution
Source: (Oil States International 2008)
CONRAD December 2008 DFO - 3 - 05-1326-031
Golder Associates
Natural drainage systems have performed effectively for hundreds or thousands of years but new channels that have been designed and constructed to replace natural systems have not had the opportunity to develop an equilibrium condition with the landscape in a similar manner. In contrast to natural systems, some man-made drainage works have resulted in significant and expensive failures (e.g., Bradley and McNearny 2000). This study illustrates that there is significant uncertainty regarding the long-term performance of man-made channels. Mine developers are concerned about long-term liability and legal obligations related to traditional mine closure drainage plans. Stakeholders and regulators are concerned with future deterioration of the reclaimed landscape that may require ongoing maintenance and result in inferior ecological productivity. The uncertainty surrounding the longevity of mine closure facilities coupled with increasing environmental concern has led to increased scrutiny of oil sands mine closure drainage plans by regulators, stakeholders and mining companies.
As part of the application requirements through Alberta Environment (AENV) and the Energy Resources Conservation Board (ERCB, formerly the Energy and Utilities Board), mine closure diversion and drainage systems are conceptually planned and designed well before commencement of mining activities, with updates required every five or ten years. Mine closure designs have, in the past, been prepared based on the best estimates and predictions of mine planners and drainage designers. With increasing scrutiny of their closure plans, oil sands firms are investing increased effort into future performance of the reclaimed mine areas. The current study on natural analogues for geomorphic design of permanent drainage systems reflects the oil sands industry’s commitment to improving the design basis for closure of oil sands mines.
1.2 SUSTAINABLE DRAINAGE FACILITIES
Until recently, mine closure designers have applied structural methods of managing surface drainage and erosion control. Traditional structural methods are typically designed based on probabilistic criteria that are referenced to a specific flood recurrence interval. Accordingly, partial or complete failure would be deemed inevitable during extreme events that exceed the design criteria. Conventional design of closure drainage facilities often include unsustainable features such as uniform slopes, minimal vegetation cover, dams, benches or terraces on earthfill structures, straight channels that are inconsistent with fluvial geomorphic characteristics of natural channels and uniform bed and banks of channels that result in inferior aquatic habitat.
In contrast to natural landscape and drainage systems, traditional designs of these facilities may resemble immature landscape and drainage networks that may be subject to accelerated erosion and catastrophic events. Such facilities require perpetual maintenance since the structures are designed to suit a specific set of calculated flow criteria conditions (e.g. 100-year design flood). Failure may be caused by design flood exceedance or unanticipated physical process that reflect the
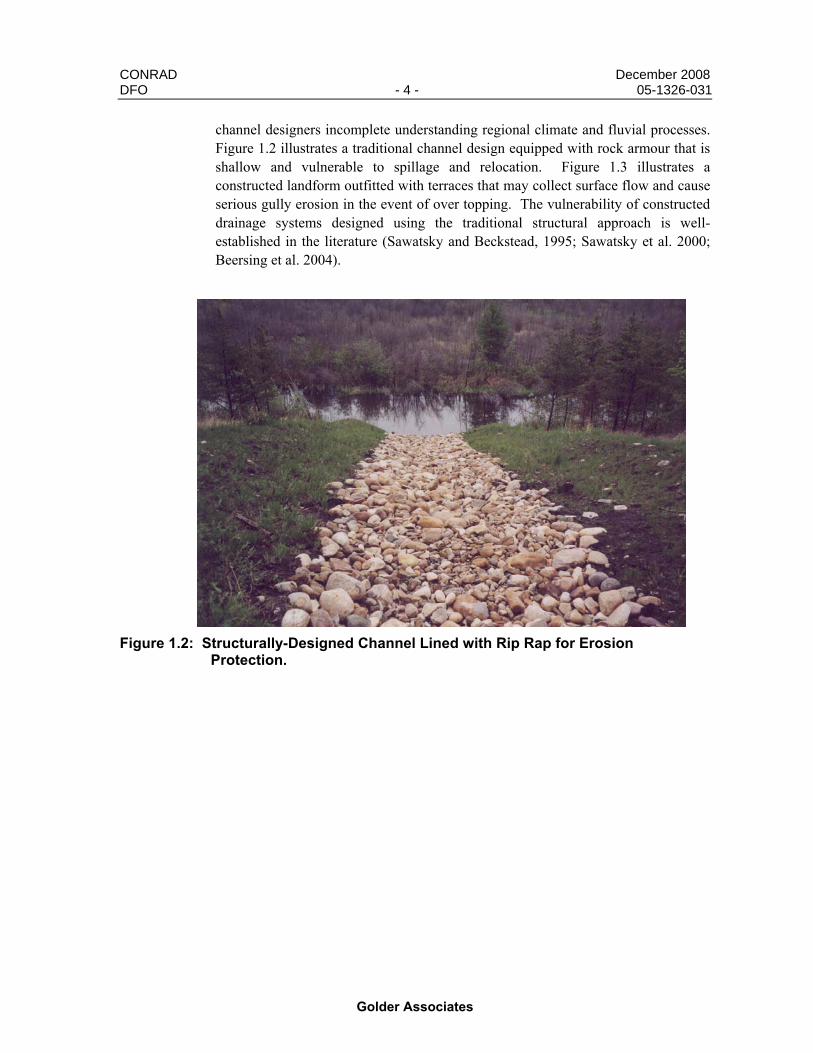
CONRAD December 2008 DFO - 4 - 05-1326-031
Golder Associates
channel designers incomplete understanding regional climate and fluvial processes. Figure 1.2 illustrates a traditional channel design equipped with rock armour that is shallow and vulnerable to spillage and relocation. Figure 1.3 illustrates a constructed landform outfitted with terraces that may collect surface flow and cause serious gully erosion in the event of over topping. The vulnerability of constructed drainage systems designed using the traditional structural approach is well-established in the literature (Sawatsky and Beckstead, 1995; Sawatsky et al. 2000; Beersing et al. 2004).
Figure 1.2: Structurally-Designed Channel Lined with Rip Rap for Erosion Protection.
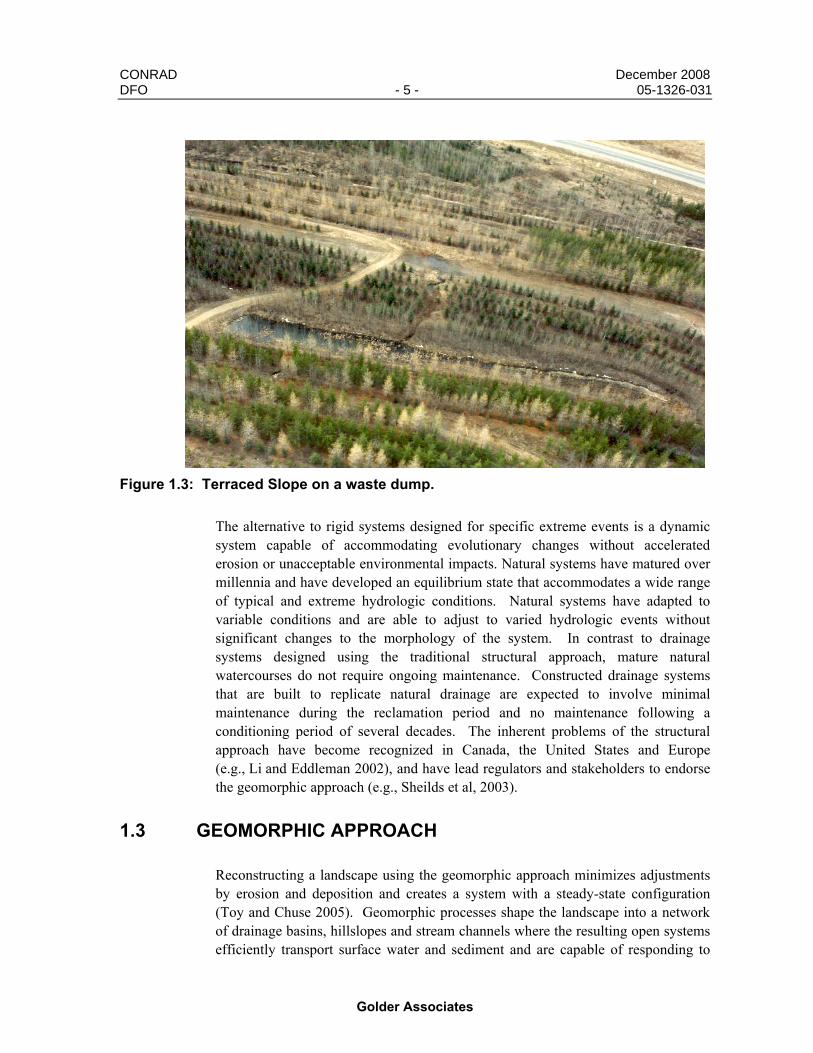
CONRAD December 2008 DFO - 5 - 05-1326-031
Golder Associates
Figure 1.3: Terraced Slope on a waste dump.
The alternative to rigid systems designed for specific extreme events is a dynamic system capable of accommodating evolutionary changes without accelerated erosion or unacceptable environmental impacts. Natural systems have matured over millennia and have developed an equilibrium state that accommodates a wide range of typical and extreme hydrologic conditions. Natural systems have adapted to variable conditions and are able to adjust to varied hydrologic events without significant changes to the morphology of the system. In contrast to drainage systems designed using the traditional structural approach, mature natural watercourses do not require ongoing maintenance. Constructed drainage systems that are built to replicate natural drainage are expected to involve minimal maintenance during the reclamation period and no maintenance following a conditioning period of several decades. The inherent problems of the structural approach have become recognized in Canada, the United States and Europe (e.g., Li and Eddleman 2002), and have lead regulators and stakeholders to endorse the geomorphic approach (e.g., Sheilds et al, 2003).
1.3 GEOMORPHIC APPROACH
Reconstructing a landscape using the geomorphic approach minimizes adjustments by erosion and deposition and creates a system with a steady-state configuration (Toy and Chuse 2005). Geomorphic processes shape the landscape into a network of drainage basins, hillslopes and stream channels where the resulting open systems efficiently transport surface water and sediment and are capable of responding to
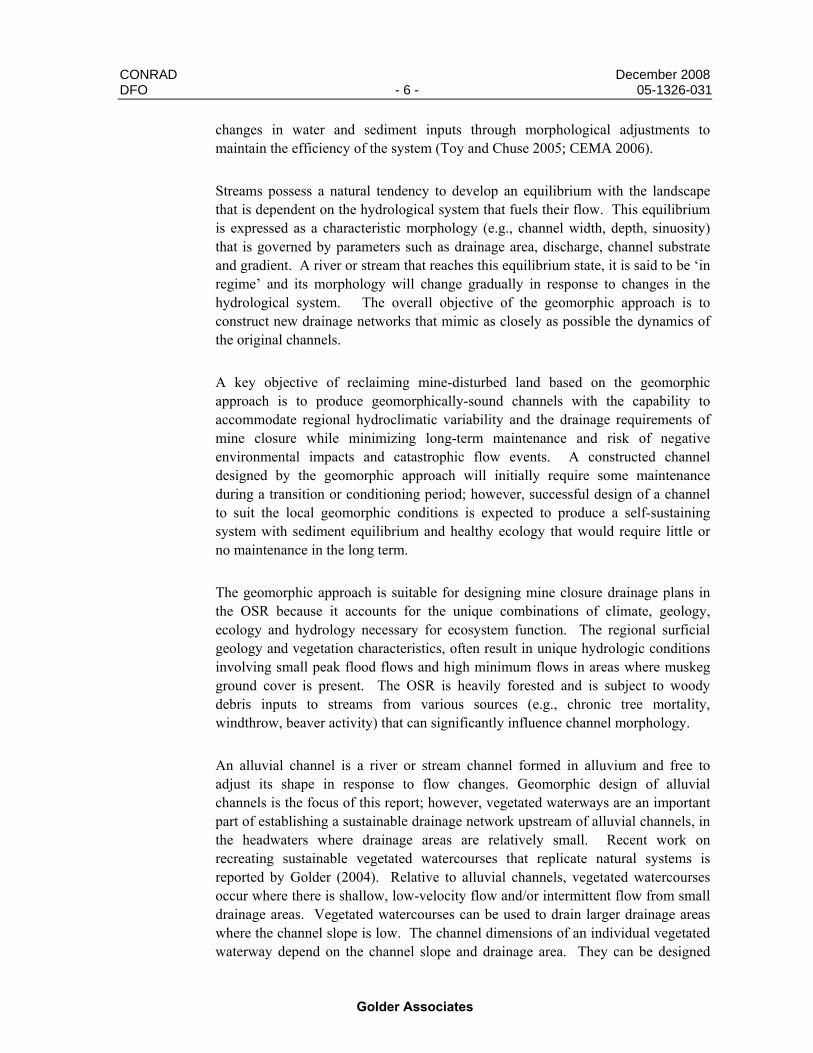
CONRAD December 2008 DFO - 6 - 05-1326-031
Golder Associates
changes in water and sediment inputs through morphological adjustments to maintain the efficiency of the system (Toy and Chuse 2005; CEMA 2006).
Streams possess a natural tendency to develop an equilibrium with the landscape that is dependent on the hydrological system that fuels their flow. This equilibrium is expressed as a characteristic morphology (e.g., channel width, depth, sinuosity) that is governed by parameters such as drainage area, discharge, channel substrate and gradient. A river or stream that reaches this equilibrium state, it is said to be ‘in regime’ and its morphology will change gradually in response to changes in the hydrological system. The overall objective of the geomorphic approach is to construct new drainage networks that mimic as closely as possible the dynamics of the original channels.
A key objective of reclaiming mine-disturbed land based on the geomorphic approach is to produce geomorphically-sound channels with the capability to accommodate regional hydroclimatic variability and the drainage requirements of mine closure while minimizing long-term maintenance and risk of negative environmental impacts and catastrophic flow events. A constructed channel designed by the geomorphic approach will initially require some maintenance during a transition or conditioning period; however, successful design of a channel to suit the local geomorphic conditions is expected to produce a self-sustaining system with sediment equilibrium and healthy ecology that would require little or no maintenance in the long term.
The geomorphic approach is suitable for designing mine closure drainage plans in the OSR because it accounts for the unique combinations of climate, geology, ecology and hydrology necessary for ecosystem function. The regional surficial geology and vegetation characteristics, often result in unique hydrologic conditions involving small peak flood flows and high minimum flows in areas where muskeg ground cover is present. The OSR is heavily forested and is subject to woody debris inputs to streams from various sources (e.g., chronic tree mortality, windthrow, beaver activity) that can significantly influence channel morphology.
An alluvial channel is a river or stream channel formed in alluvium and free to adjust its shape in response to flow changes. Geomorphic design of alluvial channels is the focus of this report; however, vegetated waterways are an important part of establishing a sustainable drainage network upstream of alluvial channels, in the headwaters where drainage areas are relatively small. Recent work on recreating sustainable vegetated watercourses that replicate natural systems is reported by Golder (2004). Relative to alluvial channels, vegetated watercourses occur where there is shallow, low-velocity flow and/or intermittent flow from small drainage areas. Vegetated watercourses can be used to drain larger drainage areas where the channel slope is low. The channel dimensions of an individual vegetated waterway depend on the channel slope and drainage area. They can be designed

CONRAD December 2008 DFO - 7 - 05-1326-031
Golder Associates
based on regional drainage area-slope relationships (Golder 2004). The shallow, low-velocity flow of typical vegetated waterways allows vegetation to establish on the bed and banks and protect the soil from erosion. Together, vegetated waterways and alluvial channels make up a complete and sustainable drainage basin that can be replicated using the geomorphic approach. To date, the application of alluvial channel design in the OSR is limited, but a number of vegetated waterways have been constructed successfully in OSR mine closure environments. Figure 1.4 shows a natural vegetated watercourse with dense vegetation in the flow path area.
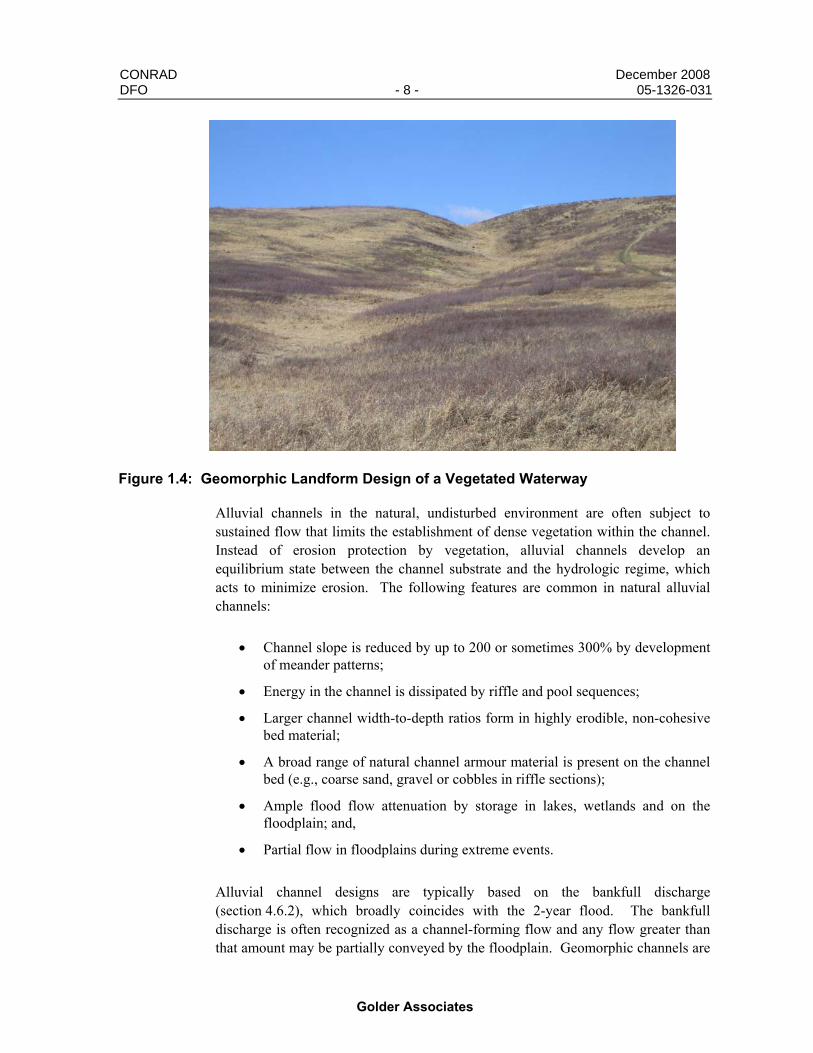
CONRAD December 2008 DFO - 8 - 05-1326-031
Golder Associates
Figure 1.4: Geomorphic Landform Design of a Vegetated Waterway
Alluvial channels in the natural, undisturbed environment are often subject to sustained flow that limits the establishment of dense vegetation within the channel. Instead of erosion protection by vegetation, alluvial channels develop an equilibrium state between the channel substrate and the hydrologic regime, which acts to minimize erosion. The following features are common in natural alluvial channels:
• Channel slope is reduced by up to 200 or sometimes 300% by development of meander patterns;
• Energy in the channel is dissipated by riffle and pool sequences;
• Larger channel width-to-depth ratios form in highly erodible, non-cohesive bed material;
• A broad range of natural channel armour material is present on the channel bed (e.g., coarse sand, gravel or cobbles in riffle sections);
• Ample flood flow attenuation by storage in lakes, wetlands and on the floodplain; and,
• Partial flow in floodplains during extreme events.
Alluvial channel designs are typically based on the bankfull discharge (section 4.6.2), which broadly coincides with the 2-year flood. The bankfull discharge is often recognized as a channel-forming flow and any flow greater than that amount may be partially conveyed by the floodplain. Geomorphic channels are
CONRAD December 2008 DFO - 9 - 05-1326-031
Golder Associates
designed to adjust to increased flows without catastrophic failure or erosion that could be harmful to the channel morphology or flora and fauna in the ecosystem.
To apply the geomorphic approach, detailed baseline data are collected and analyzed to produce region-specific regime relationships. These relationships typically relate dependent channel parameters for width, depth and channel slope to controlling discharge and channel roughness parameters. Once derived, the regime equations are used as guidelines in the design of channel systems with variations in width and depth, sinuosity and other natural characteristics.
1.4 STUDY OF BASELINE FLUVIAL GEOMORPHOLOGY
Physical stream data has been collected in the OSR for several decades and includes over 50 reports and databases spanning 40 years of research (Mountain Station Consultants and North/South Consultants 2005). This report, submitted to the OSR’s Cumulative Environmental Management Association (CEMA), reviews all physical stream data available in the OSR and concludes that much of the physical data was collected without knowledge of specific requirements for stream design. These data are useful for describing the natural variability of physical stream characteristics in the OSR, but data gaps and the lack of standardized data have limited their usefulness. The deficiency of the available data lead to the establishment of this study and intensive data collection during the 2005 and 2006 field programs to obtain data suitable for developing regime equations for stream design.
Alluvial channel design should account for the unique physical characteristics of the OSR. Existing regime relationships available in the literature are based on different climatic, geologic, physiographic and hydrologic conditions and are not applicable to the OSR. A distinguishing feature of the OSR is the predominance of muskeg terrain that has a significant effect on hydrological conditions. Rainfall that infiltrates into muskeg material can be stored temporarily and subsequently released to receiving streams at a slower rate than mineral soils. This can result in a prolonged and muted hydrologic response that exceeds response times for equivalent events in areas without muskeg accumulations (i.e. response times may be up to an order of magnitude greater) (Golder 2003b). Consequently, when stream flows are influenced by muskeg they can be characterized by relatively smaller flood peaks than other comparably-sized watersheds in other areas that are subject to equivalent hydrologic inputs (i.e., rainfall, snowmelt).
Significant research on regime relationships has been conducted in North America on sand- and gravel-bed channels (e.g., Lacey 1929, 1933; Blench 1941; Kellerhals 1967). A regime analysis of Alberta rivers was completed by Bray (1972), although the majority of the streams are outside of the OSR. While valuable for comparative purposes, such equations are not applicable to OSR streams due to the unique
CONRAD December 2008 DFO - 10 - 05-1326-031
Golder Associates
surficial geology and vegetation of alluvial and muskeg-influenced streams of the OSR.
An intensive data collection and analysis effort was required to develop a comprehensive fluvial geomorphic dataset to provide appropriate data for the development of the regime relationships that account for the unique climate and hydrology of the OSR.
Golder Associates (Golder) advocated a research program to support the geomorphic design of alluvial channels in the OSR. Investigation of existing alluvial streams is believed to provide a sound basis on which streams can be designed for mine closure.
1.5 REPLICATION OF NATURAL CHANNELS IN A MINE-DISTURBED LANDSCAPE
OSR hydrology is strongly influenced by upland and lowland areas that have distinctive effects on channel form and response to hydrological events. The small relief, dense vegetation, muskeg terrain, large quantity of woody debris in the streams and beaver activity contribute to the unique hydrologic conditions.
Mine development results in loss of natural muskeg cover and mature vegetation, reduced organic soil cover and elimination of wetlands, lakes, channels and other natural watershed features. The elimination of natural watersheds and replacement with constructed watersheds requires the closure drainage designer to apply the results of this study judiciously. Guidance on the application of study findings are provided in the Design Manual (Golder 2008). Replication of natural channels in the OSR is be applicable to the majority of the constructed alluvial channels in the mine closure landscapes of the OSR. These include the majority of diversion channels routed around mine-disturbed areas through natural terrain as well as many constructed channels in mine-disturbed lowland areas that are expected to develop mature vegetation cover and be subject to the progressive development of muskeg conditions. Replication of natural channels in the OSR may not be applicable to some well-drained upland areas and to high gradient streams that are not well represented in the natural environment of the OSR.
Replication of natural channels is expected to provide the aforementioned benefits of the geomorphic approach if mine-disturbed areas are reclaimed in such a way that they can promote a mature, self-perpetuating vegetation cover within several decades of construction (i.e. 20 to 30 years). Details of reclamation requirements are discussed in the Design Manual (Golder 2008).

CONRAD December 2008 DFO - 11 - 05-1326-031
Golder Associates
1.6 GOALS AND OBJECTIVES
Golder was commissioned in 2005 to derive regime relationships for constructed alluvial channels based on local conditions in the OSR for the emulation of natural streams. The goal was to develop a procedure for geomorphic design of alluvial stream channels in the OSR that would result in constructed channels exhibiting the following characteristics:
• Long-term, self-sustaining conveyance of surface water with little or no maintenance;
• Preservation of the built landforms of the mine closure landscape;
• Low rates of chronic erosion similar to the natural environment;
• Suitable aquatic habitat to achieve targeted ecological productivity; and,
• Suitable aesthetics to replicate the appearance of a natural channel.
Four primary objectives were established for the investigation:
• Development of rigorous fluvial geomorphic data collection procedures;
• Development of a database of baseline fluvial geomorphic;
• Development of regime channel relationships for the OSR; and,
• Development of a comprehensive design manual and its subsequent application.
The first objective comprised an extensive review of methods and techniques for fluvial geomorphic data collection and the application of appropriate methods during the 2005 and 2006 field programs. The second objective included an exhaustive search of all existing fluvial geomorphic data from existing OSR baseline reports and verification of the quality and accuracy of the data. Data from existing sources was compiled with data from the project-specific field programs to form the database. The third objective involved a comprehensive data analysis for the determination of regime channel relationships specific to the OSR, but comparable in form and utility to other relationships in the literature. The fourth objective was achieved by compiling the above-mentioned findings into a manual detailing the steps required to design dynamic, sustainable geomorphic channels based on recommendations and guidelines specific to the OSR.
1.7 PROJECT OWNERS
The logistical and financial requirements of this study required significant contributions from numerous stakeholders including Golder. Research funding was provided by the Canadian Oil Sands Network for Research and Development
CONRAD December 2008 DFO - 12 - 05-1326-031
Golder Associates
(CONRAD), the Department of Fisheries and Oceans Canada (DFO), the Natural Sciences and Engineering Research Council (NSERC) and the Golder Innovation Award. CONRAD members that provided financial support or support in-kind include Canadian Natural Resources Ltd., Albian Sands, Suncor Energy Inc., Syncrude Canada Ltd., Petro-Canada, Imperial Oil Ltd. and Total E&P Canada Ltd.
1.8 REPORT CONTENTS
This report presents the results of data collection and analysis. It follows the outline of a typical research thesis with descriptions of the study area and methods, discussions of results and their application to channel design, and concluding remarks and recommendations for further research. Six appendices are included:
• Appendix I: Glossary of Terms;
• Appendix II: Technical Procedures for Geomorphic Survey;
• Appendix III: OSR Fluvial Geomorphic Database;
• Appendix IV: Fluvial Geomorphic Data Summary Sheets;
• Appendix V: Fluvial Geomorphic Field Survey Data; and,
• Appendix VI: Results of HEC-RAS Analysis for Channel Roughness.
The observations, data and conclusions compiled in this report have been used to develop a comprehensive alluvial channel design manual for the OSR (Golder, 2008). The manual is a stand-alone document that is intended to provide direction for alluvial channel design for reclamation and mine closure in the OSR. Included in the design manual are descriptions of landscape and channel design considerations specific to mine environments in the OSR, design recommendations and a detailed design procedure applicable across a number of channel environments characteristic to the OSR. Additionally, the design manual includes a comprehensive design example illustrating several scenarios that may arise during channel design.
CONRAD December 2008 DFO - 13 - 05-1326-031
Golder Associates
2 LITERATURE REVIEW
2.1 GEOMORPHIC APPROACH
Dating back to the early 20th century, researchers have investigated the characteristics of natural channels for the purpose of replicating them in constructed channels (e.g., Lacey 1929; Leopold and Maddock 1953; Bray 1972; Schumm 1979; Nunnally 1985; Rosgen 1994; Leopold et al 1998; Carlson 2005; USDA 2007; Golder 2008) The oldest investigations of fluvial geomorphology were conducted to assist in the design of irrigation channels in India and Pakistan (Knighton, 1998)).
The planning, design and construction of a new drainage network based on the geomorphic approach requires an understanding of the regional geomorphology (e.g., Sawatsky and Beckstead 1995), and the processes that create and modify natural watercourses and water bodies. Although fluvial geomorphology is a mature topic of investigation (Lacey 1929, 1933; Leopold and Maddock 1953; Leopold et al 1964; Blench 1969), many processes and aspects of natural variability have yet to be explained. There are a large number of geomorphic, ecologic and hydrologic factors associated with stream channel function resulting in complexity that is often related to local phenomena (Knighton 1998, p.177).
Through research and experience with failed systems that were designed based on the traditional structural approach, it has become clear that rigid, structural channel systems often used in engineered drainage networks are inferior to naturally-functioning geomorphically designed channels that have the capability to adapt to hydrological change. A study of 57 reclaimed mines in North America illustrates that deficient drainage design is a common reason for failure of mine reclamation landscapes (McKenna and Dawson 1997)
The geomorphic approach to natural stream design is becoming increasingly valued by researchers, engineers and regulators as they become more familiar with the method and its benefits (e.g., AENV 2004; Hey 2006). A combination of geomorphology, hydrology and engineering is required for the application of the geomorphic approach to channel design. The designer must also be cognisant of the fisheries and vegetation aspects of the ecosystem to develop a naturally functioning reclamation landscape and drainage network (Rosgen 2006). Rosgen (2006) has recommended the geomorphic approach for stream design and indicated that one of its merits is the application of a combination of analog, empirical and analytical methods for assessment of existing channels and design of restoration channels. Application of the geomorphic approach uses regionally-specific data to characterize the natural morphology of channels that will be mimicked in channel design.
CONRAD December 2008 DFO - 14 - 05-1326-031
Golder Associates
The geomorphic approach involves detailed examination of existing stream morphology including hydrological inputs, channel dimensions and drainage basin characteristics (USDA 2007). Application of the geomorphic approach and replication of reference reaches (e.g., Rosgen 2001), rather than the traditional regime approach, is appropriate in the OSR because the hydrology of this area is unique and channel design of reclaimed drainage systems will require a sound understanding of the local natural fluvial geomorphic processes.
2.2 CHANNEL REGIME RELATIONSHIPS
Regime equations are used to relate channel parameters such as bankfull width, bankfull depth, sinuosity, meander wavelength and channel slope (e.g., Shields et al., 2003) to independent variables such as bankfull discharge, sediment transport, bed and bank material and valley slope. Developing regime relationships for geomorphic alluvial channel design requires data from channels that have reached a mature state and do not exhibit chronic erosion.
The regime theory for alluvial channels was developed by Lindley in 1919 and furthered by Lacey in 1930. The original regime theory by Lindley and Lacey was used mainly for design of irrigation canals (e.g., Knighton 1998) and other structurally rigid channels that are intended to function under a particular set of discharge and sediment transport conditions.
A significant number of regime relationships describing the stable width, depth and slope at a given median bed material size have been compiled by Yalin (1992). The majority of these equations present the dependent variable as a direct function of discharge or a multi-variate function of discharge and median bed material size. In the literature, relationships for width, depth and slope are expressed as power equations (e.g., Yalin 1992; Section 5.2). Relationships for meander wavelength (Williams 1986; Section 4.4.7) and meander belt width (Williams 1986; Section 4.4.8) are expressed as linear functions of bankfull width. A number of these equations have been developed using flume data, field data or a combination of the two and should be considered specific to the conditions for which they were derived.
Regime theory as applied to natural channels assumes that channel geometry is defined in terms of variables such as width, depth, slope and meander wavelength that adjust in response to changes in external controls (e.g., flood discharges, precipitation).
Basic concepts regarding regime channels and applicable regime equations, are still studied and are leading to a more detailed understanding of regional regime relationships (e.g., Leopold and Maddock 1953; Gill 1968; Mao and Flook 1971; Mahmood and Shen 1971; Tarar and Choudri 1979; Bray 1982; Blench 1986; Hey
CONRAD December 2008 DFO - 15 - 05-1326-031
Golder Associates
and Thorne 1986; Hey and Heritage 1988; Nouh 1988; da Silva 2003). The strength of the regime approach lies in its continued use and extensive study that improves and adds detail to the method. One recent study examines how a river reach restoration project could be improved, and notes the importance of considering the hydraulic and geomorphic processes at the watershed and reach scales relative to simple classification or analytical approaches for channel design (Kondolf et al. 2001). Site- and region-specific hydraulic and geomorphic assessments of stream restoration sites can ensure that the governing hydraulics and geomorphology in a watershed are considered in channel design and prevent oversights that can lead to channel failure (Smith and Prestegaard 2005).
Some of the most significant research on regime equations for Canadian rivers was conducted by Lacey (e.g., 1929) and Blench (1951), both supporters of the regime method. In 1957, Blench further modified Lacey’s theory and remedied objections raised against it, asserting that regime equations are expressions of the actual form and function of stream channels. Regime relationships have been developed for specific conditions of slope and bed and bank material. For example, relationships developed by Schumm (1977) are intended to be used in the design of channels with shallow slopes and sandy soil in Canada, including Alberta. In contrast, Kellerhals’ regime equations were developed for relatively steep slopes in gravel-bed rivers (Bray 1972). Despite early research on Canadian rivers, there is a significant lack of geomorphic data in the OSR, where hydrological patterns of alluvial channels are significantly influenced by muskeg and dense vegetation.
2.3 GEOMORPHIC CHANNEL DESIGN METHODS
Natural stream characteristics are a reflection of the geology, topography, soils, vegetation and precipitation in a watershed (Nunnally 1985). Mine operations can significantly alter the original landscape, changing surface material composition, hydrological responses, channel pathways and patterns, and sediment load. For mine sites where these watershed characteristics have changed, it is important to consider the original channel morphology for predictions of channel form and dimensions that will be suitable for the altered conditions (Kondolf et al. 2001).
It is commonly understood that the measured bankfull discharge represents the channel-forming flow, that flows below bankfull are ineffective at significantly altering the channel form and that flows greater than bankfull are too infrequent to dominate channel form (Smith and Prestegaard 2005). Bankfull channel elevations are also subject to uncertainty and should be determined during field-based geomorphic surveys by assessing the elevation of depositional features, vegetation changes, topographic breaks, bank material transitions, erosive features and water stains (Harrelson et al. 1994) and used to determine the bankfull conditions for a particular reach. Bankfull discharge can be used as an independent variable for channel design, but the recurrence interval should be carefully considered so that
CONRAD December 2008 DFO - 16 - 05-1326-031
Golder Associates
the floodplain can accommodate infrequent large flows without causing significant morphological changes or failure (Kondolf et al. 2001; Smith and Prestegaard 2005).
During development of regime channel design methodologies, some designers have moved from simple empirical equations to complex mathematical, analytical and numerical methods. These methods can be questionable due to various assumptions and boundary conditions and do not necessarily result in improved designs. Design engineers and field researchers have generally found empirical methods, like the geomorphic approach, more practical than predictive methods that are based on advanced fluid mechanics and laboratory data (e.g., Ettema and Mutel 2004).
Sheilds et al. (2003) describes a method for stream rehabilitation involving a combination of hydraulic engineering, one-dimensional flow and sediment transport computations for the assessment of watershed geomorphology and channel-forming discharge. Sheilds et al. (2003) presents a summary of other available simple and complex models that may be used for channel design and construction including a method that involves characterizing channel hydraulic geometry and establishing planform predictors that can be applied to disturbed channels with extensive associated data sets (e.g., van den Berg 1995; Allen et al. 1994). Also included is a channel classification method that can be applied to channels exhibiting incision or aggradation (e.g. Simon and Downs 1995; Kondolf et al. 2001).
Shields et al. (2003) suggested that many reconstruction projects are prone to failure due to erosion and sedimentation problems. This highlights the importance of erosion and sedimentation control and the weakness of existing structural methods, which, without maintenance, are susceptible to significant channel migration and eventual failure. The OSR has muskeg-dominated areas that contribute to its unique hydrology, which has not been studied extensively like some other systems, so the methods developed and applied in areas with dissimilar topography and vegetation may not be entirely comparable with methods that should be applied in the OSR.
Reclamation of streams after mine closure is required to re-establish the natural equilibrium of an ecosystem (Palmer et al. 2005). Various types of mine water management facilities designed to function solely during mine operation include dams, diversion channels and drainage ditches. Such features are typically designed to meet operational requirements and are not designed for closure. Features such as vegetated waterways (Golder 2004), permanent alluvial channels and compensation lakes should be designed based on the geomorphic approach (e.g., Golder 1999, 2005a). The methods used to design these features in other environments have varied from geomorphic relationships to empirical and theoretical one-, two- or three-dimensional models (e.g., Shields et al. 2003). The OSR represents a unique climate and hydrology compared to other areas that have been used to develop regime relationships (e.g., Ackers 1964; Bray 1972; Hey and Thorne 1986), namely

CONRAD December 2008 DFO - 17 - 05-1326-031
Golder Associates
as a result of muskeg soil accumulations and their influence on stream flow and morphology.
Researchers continue to find variability in regime equation form (e.g., exponent and coefficient values), even within similar bed material and climate conditions. This further supports continued study in regions already examined and particularly other areas that are less well understood and will be the focus of reclamation activities, like the OSR.
The application of the geomorphic approach to landscape and channel design is included in mine and reclamation plans that have been accepted by regulators, stakeholders and a number of mine operators. Understanding of the geomorphic approach is further developed by this project. By considering the existing regime and other morphological features of channels in the OSR it is possible to develop design guidelines and recommendations for design of geomorphic closure channels that will be self-sustaining in the long-term.
2.4 AVAILABLE GEOMORPHIC DATA
Understanding of hydrology and fluvial geomorphology in the OSR region was initially enabled by permit applications that required baseline hydrology studies in support of Environmental Impact Assessments (EIAs) for planned projects in the OSR. These studies have resulted in a compilation of geomorphic data for a number of streams and rivers in the region.
The development of robust regime relationships requires detailed regional geomorphic data. Geomorphic data includes watershed, stream flow and sediment data and may be defined by variables such as basin area, basin slope, drainage density, lowland area to upland area ratio, bankfull depth and width, sinuosity, channel slope, meander wavelength, sediment particle size and sediment material size distribution.
The most recently collected baseline geomorphic data in the OSR, not including the data collected for this study, pertain to isolated sections of selected streams and therefore do not allow for a complete analysis of stream reach or drainage basin morphology and hydrology (Mountain Station Consultants and North/South Consultants 2005).
The limited geomorphic data available in the OSR provide a good indication of general stream morphology in the region, but lacks the consistency necessary for the derivation of region-specific regime relationships (Mountain Station Consultants and North/South Consultants 2005). Additionally, it was recommended that to develop a comprehensive understanding of stream morphology in the OSR, it would
CONRAD December 2008 DFO - 18 - 05-1326-031
Golder Associates
be necessary to undertake a project-specific, detailed data collection program (Mountain Station Consultants and North/South Consultants 2005). Another concern reported is that the primary source of data for the OSR comes from industry reports and environmental impact studies undertaken during the 1990s. Among the main data sources cited in industry reports are reports prepared by Golder (Golder 2002, 2003a, b). From these reports it is evident that published geomorphic data are adequate for their intended purpose, but not sufficient for developing reliable design equations.
2.5 CONCLUSIONS
The geomorphic approach to channel design requires an understanding of the natural function of hydrological systems such that the channel form, substrate and ecology can be replicated to recreate hydraulic conditions that resemble those found in undisturbed environments. Regime equations from the literature can be used to design channel width, depth, slope and other variables for regions with similar geomorphological and hydrological characteristics; the resulting equations are not necessarily transferable to other conditions. Detailed geomorphic data for a particular region are required to characterize the channel morphology and recreate hydraulic conditions representative of a mature natural channel.
CONRAD December 2008 DFO - 19 - 05-1326-031
Golder Associates
3 PHYSICAL SETTING OF THE ATHABASCA OIL SANDS REGION
The Athabasca Oil Sands Region is the largest of Alberta’s four oil sands regions and encompasses approximately 90,000 km2 on Alberta’s eastern border, south of Wood Buffalo National Park. The Athabasca River flows through the centre of the OSR and through the city of Fort McMurray, which is the major hub within the region (Figure 1.1). The region is characterized by dense boreal forest, muskeg, wetlands and an abundance of lakes and rivers. Approximately two thirds of the Athabasca oil sands have been leased for eventual development and extraction of bitumen. Only about 4,000 km2 of the Athabasca OSR, located in the northeast portion of the region and abutted by the Birch Mountains on the west, can be surface mined and represent a large portion of mining development in the area to date (Figure 1.1).
3.1 CLIMATE
The regional climate of the OSR varies between humid continental and sub-arctic with long, very cold winters and short, warm summers. Environment Canada climate data dating to 1950 indicates that average temperatures at Fort McMurray range from -18.8º C in January to +16.8º C in July although winter minimums have reached as low as -50.6º C and summer maximums have reached as high as +37.0º C. Total annual precipitation is approximately 456 mm, of which 342 mm falls as rain in the summer and 156 cm falls as snow (snow water equivalent reported in the total annual precipitation) in winter (Environment Canada National Climate Archive 2008).
3.2 GEOLOGY
The underlying bedrock geology is predominantly sedimentary and metamorphosed-sedimentary rock including shale, sandstone, and siltstone from the Cretaceous and Devonian Periods. The far northwest quadrant of the OSR is primarily underlain by plutonic granite and some sandstone from the Precambrian Eon (ARC 1974a, b).
The OSR’s surficial geology was altered during the most recent glaciation, which ended approximately 10,000 years ago. Geomorphic and fluvial activity during the subsequent Holocene Epoch (approximately 10,000 years ago to present) significantly modified the glacial deposits left behind. Deposits include glacial till plains and moraines, glaciofluvial sands and gravels and glaciolacustrine clay and silt. Holocene deposits include aeolian sand and loess, alluvial fans and stream deposits, erosional slumps and gullies and, lacustrine silts and clays. An abundance of organic material has formed in lake, wetlands and stream environments, in addition the accumulation of organic material into bogs and fens.

CONRAD December 2008 DFO - 20 - 05-1326-031
Golder Associates
3.3 GEOMORPHOLOGICAL HISTORY
Glaciofluvial activity during the transition between glaciation and the Holocene had a significant influence on the hydrology of the OSR. Morphological and sedimentological analyses suggest that a catastrophic flood discharged down the lower Athabasca and Clearwater River valleys approximately 9,900 years before present (Smith and Fisher 1993; Fisher and Smith 1994). This paleoflood event occurred following the avulsion of glacial Lake Agassiz through the Beaver River Moraine along the Alberta-Saskatchewan border and provided a northwest outlet for Lake Agassiz, which produced the 233 km long Clearwater-lower Athabasca spillway extending from northwest Saskatchewan into northeast Alberta through which the present-day lower Athabasca and Clearwater rivers flow. Consequently, significant glacial, glaciofluvial and glaciolacustrine deposits and geomorphic features are present throughout the OSR (Smith and Fisher 1993; Fisher and Smith 1994). Glacial deposits ranging in size from fine sand to coarse cobble gravel represent ice-contact deltas the formed as the ice sheet retreated and are generally about 5 m thick in the OSR (Catto 1995). Glaciolacustrine deposits are composed of silt and clay material and are generally less than 4 m in the OSR (Catto 1995).
3.4 HYDROLOGY
The Athabasca River flows northeast across the northern half of Alberta from its origins in the Columbia Icefield. The Athabasca is joined by the Clearwater River just north of Fort McMurray where it bends to flow predominantly northward through the centre of the OSR. The Athabasca is joined by the Peace River before joining the Slave River at the far western end of Lake Athabasca at the Alberta-Saskatchewan border (Figure 1.1).
There are a significant number of large alluvial tributaries of the Athabasca River within the OSR. Major rivers include the McKay, Ells, Steepbank, Muskeg and Firebag rivers as well as a number of smaller alluvial rivers and watercourses flowing through muskeg terrain (Figure 1.1). Streams are present in the highlands (e.g., the Birch Mountains) and the lowlands and have features characteristic to their respective locations. There are a number of relatively large lakes within the OSR, including McClelland and Kearl lakes that are located within the area of the OSR that is currently leased for mining activity. There are a number of other lakes of various sizes outside of the OSR area that significantly influence regional and local hydrology.
Well-drained (i.e. upland) areas generally have a basin and/or channel slope greater than 0.5 %. Poorly-drained (i.e. lowland) areas have a basin and/or channel slope of less than 0.5 %. Poor drainage is a result of shallow slopes that are associated with a low sub-surface hydraulic gradient and the presence of an underlying layer of relatively impermeable material such as compact organic material or glacial and
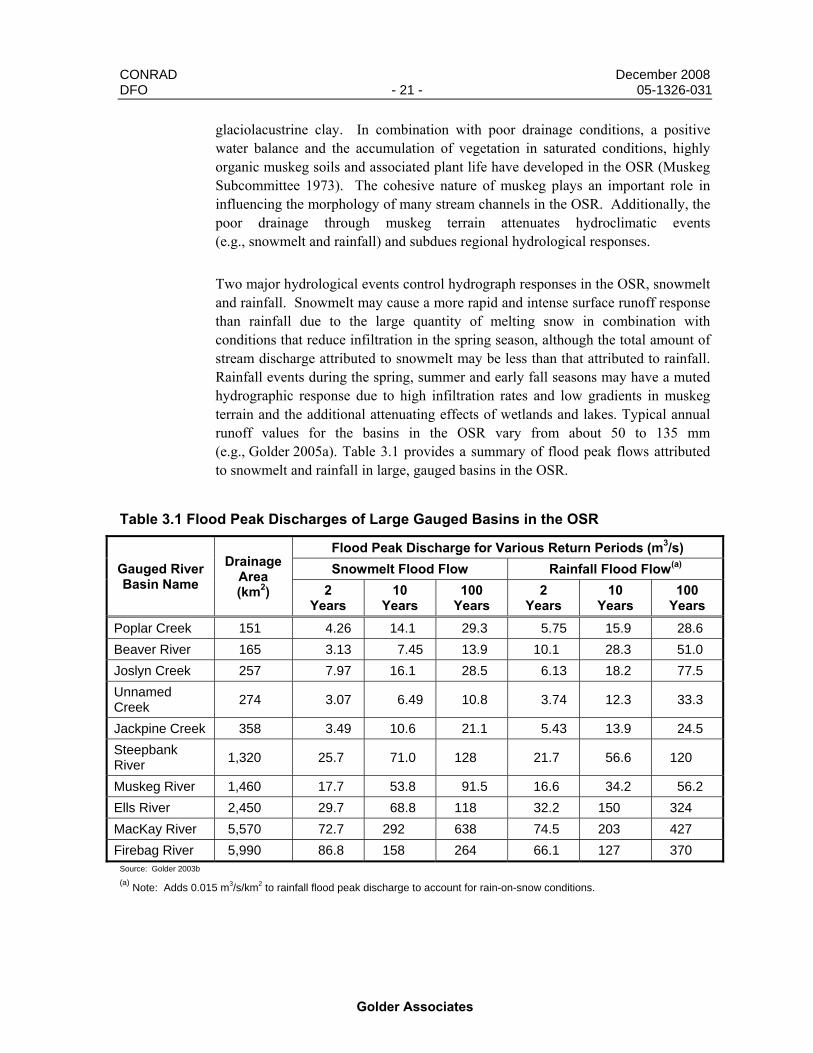
CONRAD December 2008 DFO - 21 - 05-1326-031
Golder Associates
glaciolacustrine clay. In combination with poor drainage conditions, a positive water balance and the accumulation of vegetation in saturated conditions, highly organic muskeg soils and associated plant life have developed in the OSR (Muskeg Subcommittee 1973). The cohesive nature of muskeg plays an important role in influencing the morphology of many stream channels in the OSR. Additionally, the poor drainage through muskeg terrain attenuates hydroclimatic events (e.g., snowmelt and rainfall) and subdues regional hydrological responses.
Two major hydrological events control hydrograph responses in the OSR, snowmelt and rainfall. Snowmelt may cause a more rapid and intense surface runoff response than rainfall due to the large quantity of melting snow in combination with conditions that reduce infiltration in the spring season, although the total amount of stream discharge attributed to snowmelt may be less than that attributed to rainfall. Rainfall events during the spring, summer and early fall seasons may have a muted hydrographic response due to high infiltration rates and low gradients in muskeg terrain and the additional attenuating effects of wetlands and lakes. Typical annual runoff values for the basins in the OSR vary from about 50 to 135 mm (e.g., Golder 2005a). Table 3.1 provides a summary of flood peak flows attributed to snowmelt and rainfall in large, gauged basins in the OSR.
Table 3.1 Flood Peak Discharges of Large Gauged Basins in the OSR
Gauged River Basin Name
Drainage Area (km2)
Flood Peak Discharge for Various Return Periods (m3/s) Snowmelt Flood Flow Rainfall Flood Flow(a)
2 Years
10 Years
100 Years
2 Years
10 Years
100 Years
Poplar Creek 151 4.26 14.1 29.3 5.75 15.9 28.6 Beaver River 165 3.13 7.45 13.9 10.1 28.3 51.0 Joslyn Creek 257 7.97 16.1 28.5 6.13 18.2 77.5 Unnamed Creek 274 3.07 6.49 10.8 3.74 12.3 33.3
Jackpine Creek 358 3.49 10.6 21.1 5.43 13.9 24.5 Steepbank River 1,320 25.7 71.0 128 21.7 56.6 120
Muskeg River 1,460 17.7 53.8 91.5 16.6 34.2 56.2 Ells River 2,450 29.7 68.8 118 32.2 150 324 MacKay River 5,570 72.7 292 638 74.5 203 427 Firebag River 5,990 86.8 158 264 66.1 127 370
Source: Golder 2003b
(a) Note: Adds 0.015 m3/s/km2 to rainfall flood peak discharge to account for rain-on-snow conditions.
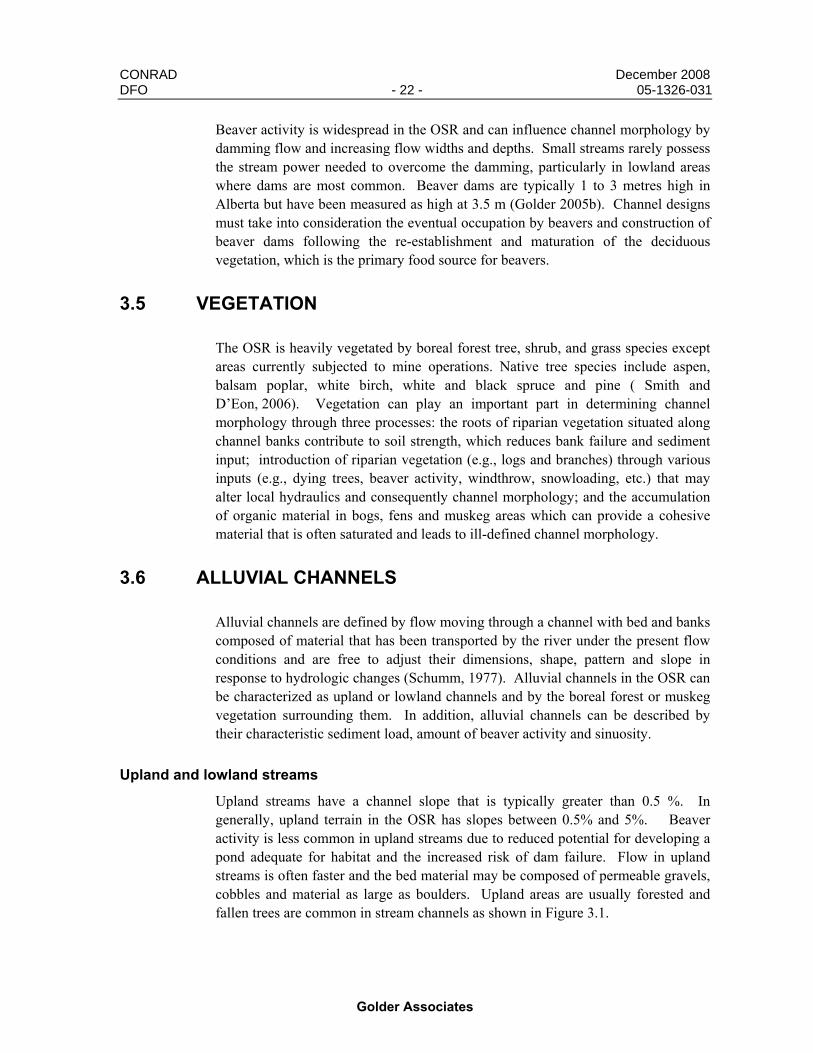
CONRAD December 2008 DFO - 22 - 05-1326-031
Golder Associates
Beaver activity is widespread in the OSR and can influence channel morphology by damming flow and increasing flow widths and depths. Small streams rarely possess the stream power needed to overcome the damming, particularly in lowland areas where dams are most common. Beaver dams are typically 1 to 3 metres high in Alberta but have been measured as high at 3.5 m (Golder 2005b). Channel designs must take into consideration the eventual occupation by beavers and construction of beaver dams following the re-establishment and maturation of the deciduous vegetation, which is the primary food source for beavers.
3.5 VEGETATION
The OSR is heavily vegetated by boreal forest tree, shrub, and grass species except areas currently subjected to mine operations. Native tree species include aspen, balsam poplar, white birch, white and black spruce and pine ( Smith and D’Eon, 2006). Vegetation can play an important part in determining channel morphology through three processes: the roots of riparian vegetation situated along channel banks contribute to soil strength, which reduces bank failure and sediment input; introduction of riparian vegetation (e.g., logs and branches) through various inputs (e.g., dying trees, beaver activity, windthrow, snowloading, etc.) that may alter local hydraulics and consequently channel morphology; and the accumulation of organic material in bogs, fens and muskeg areas which can provide a cohesive material that is often saturated and leads to ill-defined channel morphology.
3.6 ALLUVIAL CHANNELS
Alluvial channels are defined by flow moving through a channel with bed and banks composed of material that has been transported by the river under the present flow conditions and are free to adjust their dimensions, shape, pattern and slope in response to hydrologic changes (Schumm, 1977). Alluvial channels in the OSR can be characterized as upland or lowland channels and by the boreal forest or muskeg vegetation surrounding them. In addition, alluvial channels can be described by their characteristic sediment load, amount of beaver activity and sinuosity.
Upland and lowland streams
Upland streams have a channel slope that is typically greater than 0.5 %. In generally, upland terrain in the OSR has slopes between 0.5% and 5%. Beaver activity is less common in upland streams due to reduced potential for developing a pond adequate for habitat and the increased risk of dam failure. Flow in upland streams is often faster and the bed material may be composed of permeable gravels, cobbles and material as large as boulders. Upland areas are usually forested and fallen trees are common in stream channels as shown in Figure 3.1.
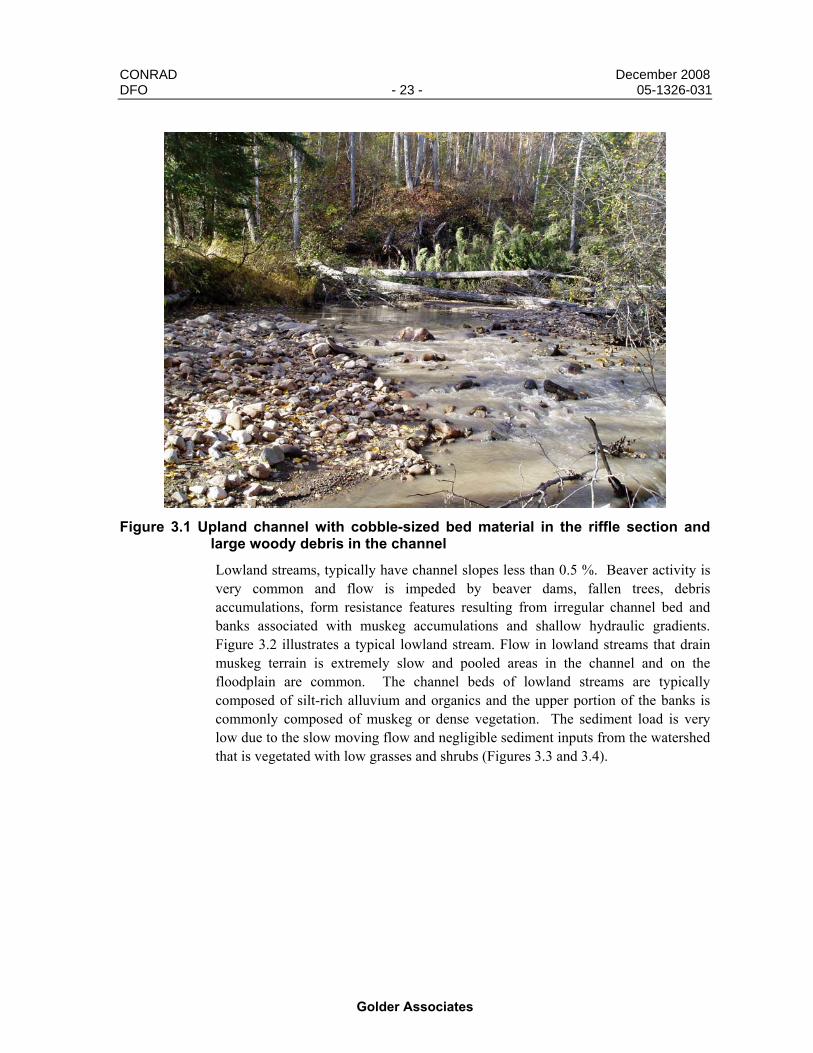
CONRAD December 2008 DFO - 23 - 05-1326-031
Golder Associates
Figure 3.1 Upland channel with cobble-sized bed material in the riffle section and large woody debris in the channel
Lowland streams, typically have channel slopes less than 0.5 %. Beaver activity is very common and flow is impeded by beaver dams, fallen trees, debris accumulations, form resistance features resulting from irregular channel bed and banks associated with muskeg accumulations and shallow hydraulic gradients. Figure 3.2 illustrates a typical lowland stream. Flow in lowland streams that drain muskeg terrain is extremely slow and pooled areas in the channel and on the floodplain are common. The channel beds of lowland streams are typically composed of silt-rich alluvium and organics and the upper portion of the banks is commonly composed of muskeg or dense vegetation. The sediment load is very low due to the slow moving flow and negligible sediment inputs from the watershed that is vegetated with low grasses and shrubs (Figures 3.3 and 3.4).
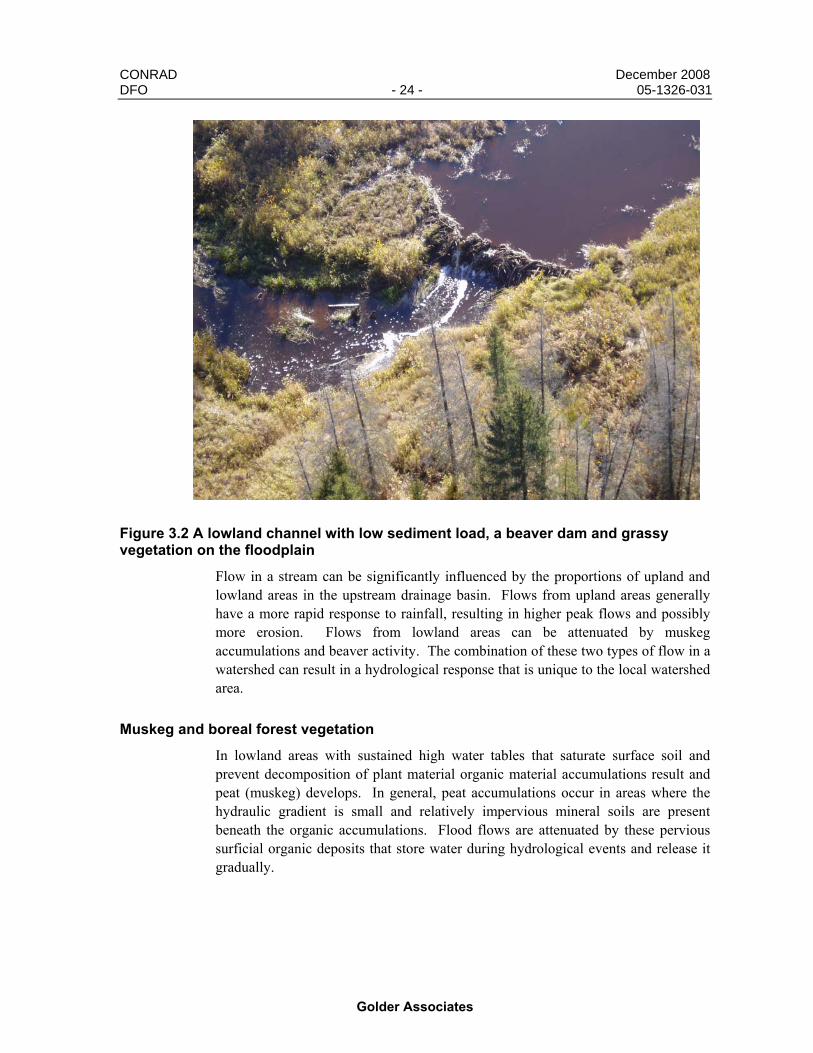
CONRAD December 2008 DFO - 24 - 05-1326-031
Golder Associates
Figure 3.2 A lowland channel with low sediment load, a beaver dam and grassy vegetation on the floodplain
Flow in a stream can be significantly influenced by the proportions of upland and lowland areas in the upstream drainage basin. Flows from upland areas generally have a more rapid response to rainfall, resulting in higher peak flows and possibly more erosion. Flows from lowland areas can be attenuated by muskeg accumulations and beaver activity. The combination of these two types of flow in a watershed can result in a hydrological response that is unique to the local watershed area.
Muskeg and boreal forest vegetation
In lowland areas with sustained high water tables that saturate surface soil and prevent decomposition of plant material organic material accumulations result and peat (muskeg) develops. In general, peat accumulations occur in areas where the hydraulic gradient is small and relatively impervious mineral soils are present beneath the organic accumulations. Flood flows are attenuated by these pervious surficial organic deposits that store water during hydrological events and release it gradually.
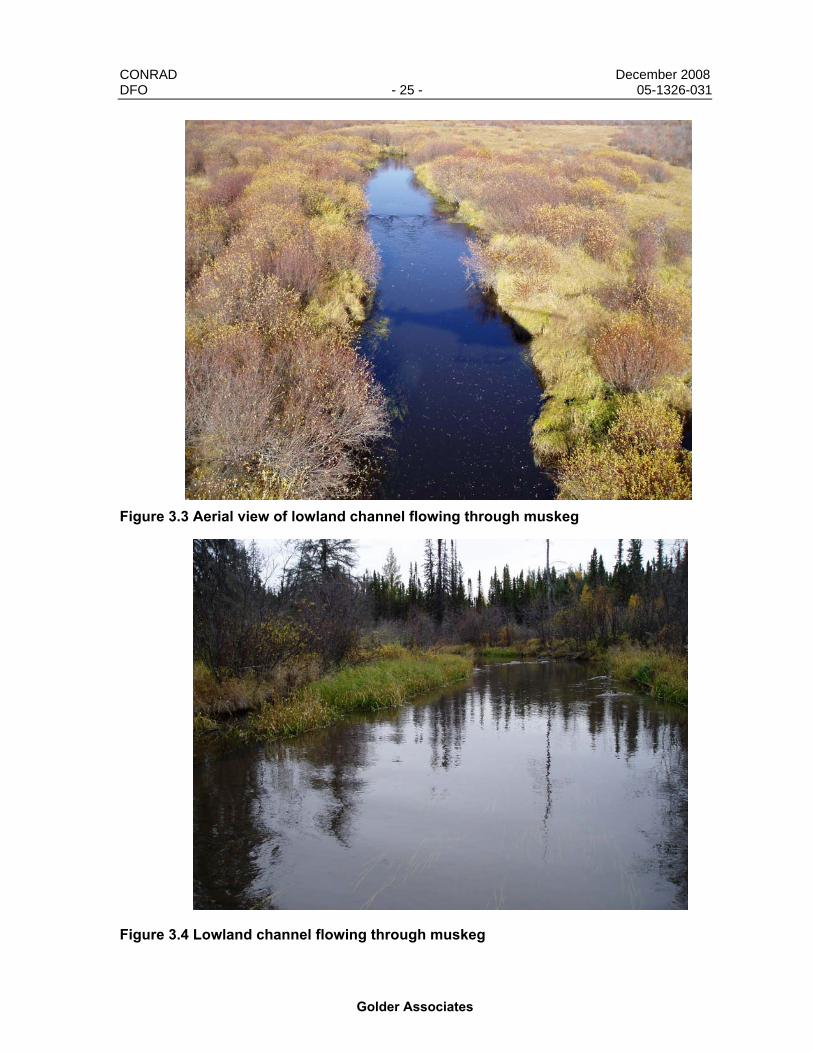
CONRAD December 2008 DFO - 25 - 05-1326-031
Golder Associates
Figure 3.3 Aerial view of lowland channel flowing through muskeg
Figure 3.4 Lowland channel flowing through muskeg
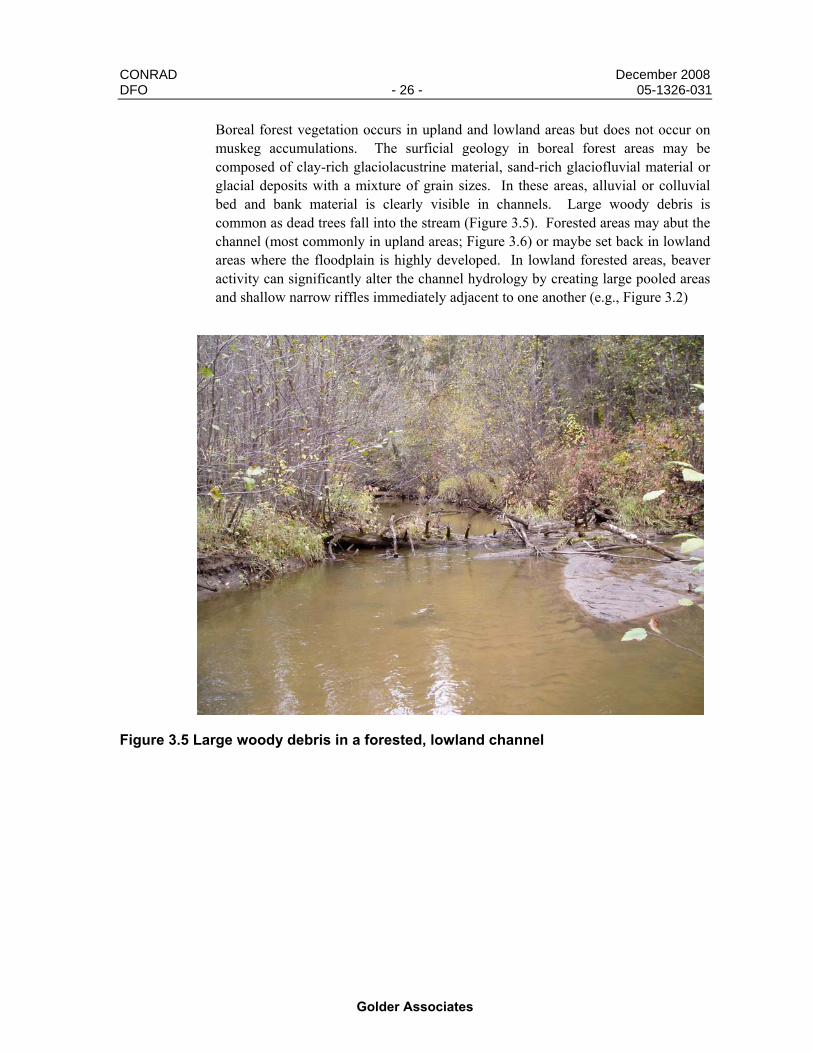
CONRAD December 2008 DFO - 26 - 05-1326-031
Golder Associates
Boreal forest vegetation occurs in upland and lowland areas but does not occur on muskeg accumulations. The surficial geology in boreal forest areas may be composed of clay-rich glaciolacustrine material, sand-rich glaciofluvial material or glacial deposits with a mixture of grain sizes. In these areas, alluvial or colluvial bed and bank material is clearly visible in channels. Large woody debris is common as dead trees fall into the stream (Figure 3.5). Forested areas may abut the channel (most commonly in upland areas; Figure 3.6) or maybe set back in lowland areas where the floodplain is highly developed. In lowland forested areas, beaver activity can significantly alter the channel hydrology by creating large pooled areas and shallow narrow riffles immediately adjacent to one another (e.g., Figure 3.2)
Figure 3.5 Large woody debris in a forested, lowland channel

CONRAD December 2008 DFO - 27 - 05-1326-031
Golder Associates
Figure 3.6 Forest abutting channel banks in a lowland channel
Riffles and Pools
Riffle and pool sequences occur in straight, meandering and braided channels (Leopold and Wolman 1957). Riffles are generally observed to be shallower with larger bed material and exhibit higher flow velocities than pools that tend to have greater flow depths and smaller bed material (Leopold and Wolman 1957). During periods of high flow, riffles and pools are less distinct from one another and observed flow velocities become less differentiated (e.g., Richards 1978). The majority of the channels on which this study was focussed are low-gradient with fine bed material. Channel boundaries on similar low-gradient channels are observed to be less resistant than high-gradient channels with large bed and bank material and may therefore be subject to deep pools as a result of scour during flood periods (e.g., Wohl et al. 1993).
In the OSR, the influence of beaver activity and substantial accumulations of woody debris in channels has an impact on channel morphology. Riffle-pool sequences are apparent, although they are often influenced by backwater and flooding effects of downstream blockages. In the OSR, pools that form behind beaver dams or debris accumulations are often significantly wider than adjacent riffles or other pools.
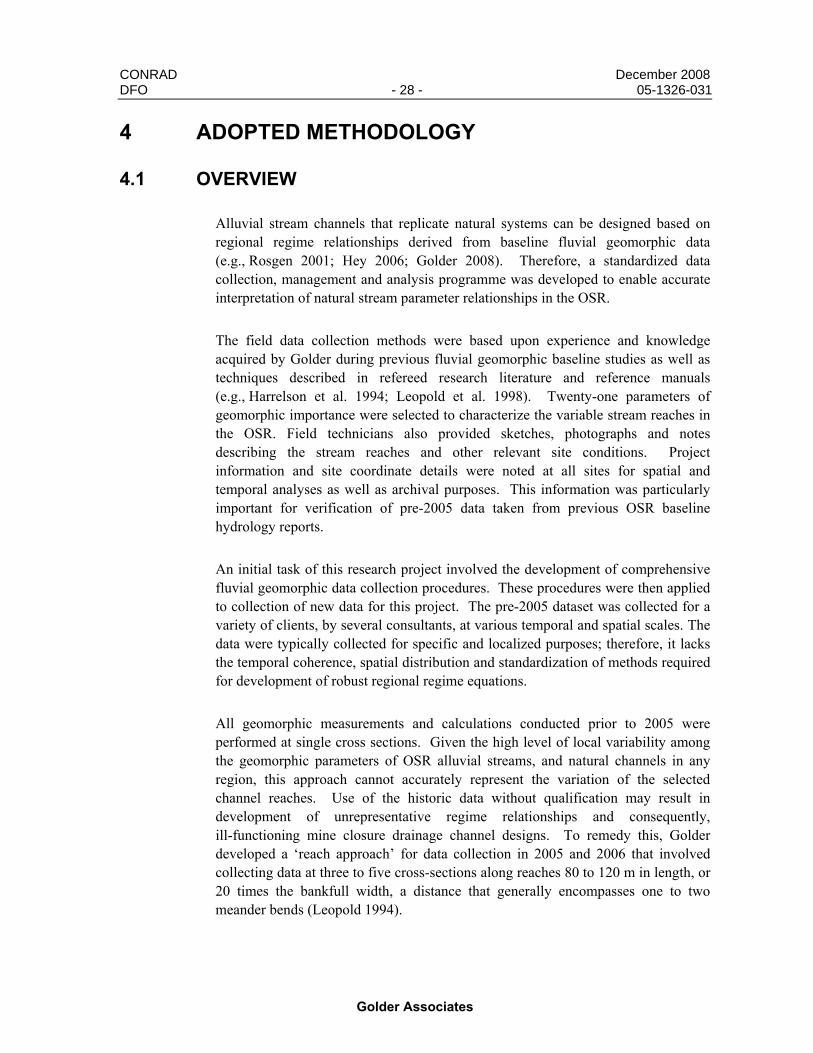
CONRAD December 2008 DFO - 28 - 05-1326-031
Golder Associates
4 ADOPTED METHODOLOGY
4.1 OVERVIEW
Alluvial stream channels that replicate natural systems can be designed based on regional regime relationships derived from baseline fluvial geomorphic data (e.g., Rosgen 2001; Hey 2006; Golder 2008). Therefore, a standardized data collection, management and analysis programme was developed to enable accurate interpretation of natural stream parameter relationships in the OSR.
The field data collection methods were based upon experience and knowledge acquired by Golder during previous fluvial geomorphic baseline studies as well as techniques described in refereed research literature and reference manuals (e.g., Harrelson et al. 1994; Leopold et al. 1998). Twenty-one parameters of geomorphic importance were selected to characterize the variable stream reaches in the OSR. Field technicians also provided sketches, photographs and notes describing the stream reaches and other relevant site conditions. Project information and site coordinate details were noted at all sites for spatial and temporal analyses as well as archival purposes. This information was particularly important for verification of pre-2005 data taken from previous OSR baseline hydrology reports.
An initial task of this research project involved the development of comprehensive fluvial geomorphic data collection procedures. These procedures were then applied to collection of new data for this project. The pre-2005 dataset was collected for a variety of clients, by several consultants, at various temporal and spatial scales. The data were typically collected for specific and localized purposes; therefore, it lacks the temporal coherence, spatial distribution and standardization of methods required for development of robust regional regime equations.
All geomorphic measurements and calculations conducted prior to 2005 were performed at single cross sections. Given the high level of local variability among the geomorphic parameters of OSR alluvial streams, and natural channels in any region, this approach cannot accurately represent the variation of the selected channel reaches. Use of the historic data without qualification may result in development of unrepresentative regime relationships and consequently, ill-functioning mine closure drainage channel designs. To remedy this, Golder developed a ‘reach approach’ for data collection in 2005 and 2006 that involved collecting data at three to five cross-sections along reaches 80 to 120 m in length, or 20 times the bankfull width, a distance that generally encompasses one to two meander bends (Leopold 1994).

CONRAD December 2008 DFO - 29 - 05-1326-031
Golder Associates
4.2 SITE SELECTION
Selection of candidate streams for incorporation into the study was based on various considerations:
1. What information is required to replicate a given stream and its drainage basin?
2. What watershed characteristics (e.g., geology, drainage basin area, basin slope, elevation, etc.) should be represented in the study?
3. How can the most useful comparisons be made with the fewest sites?
4. What types of streams need to be replicated in mine closure plans?
5. How much can be accomplished with available project resources?
A variety of study reaches were chosen to encompass the entire spectrum of alluvial streams present in the OSR. Three important considerations in terms of drainage basin characteristics were:
1. The channel slope of study reaches including upland (high-gradient) and lowland (low-gradient) streams. The majority of stream reaches are in lowland streams, but a broad selection including upland streams was required to provide a basis for replicating both types of streams in the mine closure plans;
2. Drainage area of the potential study reaches. A spatially uniform sampling of sites was taken throughout the OSR in 2005 that accounted for typical variations surficial geology, channel slope and drainage basin size. The 2005 field season allowed a thorough characterization of the baseline conditions and geomorphology of natural streams in the OSR. Additional sites were selected in 2006, to further characterize the spatial variability while targeting smaller watersheds to provide more data that would be analogous to similarly-sized closure drainage basin designs; and
3. Surficial geology of study reaches. The complex surficial geology of the OSR was simplified by broadly classifying the surficial geology of the potential study reaches into three categories; (a) glacial (till, sand, clay); (b) glaciofluvial (sand); and (c) glaciolacustrine (clay, silt). Study reaches were selected to represent all three terrain types.
A broad and relatively even spatial distribution of study reaches were selected across the OSR to account for intra-regional variations in climate and hydrology as well as variations in basin slope, drainage basin size and changes in surficial geology as illustrated in Figure 4.1. This process was used to select study sites prior to the field programs, but field personnel were occasionally required to alter the precise location of study reaches to accommodate access to the site and to selection of representative study reaches.
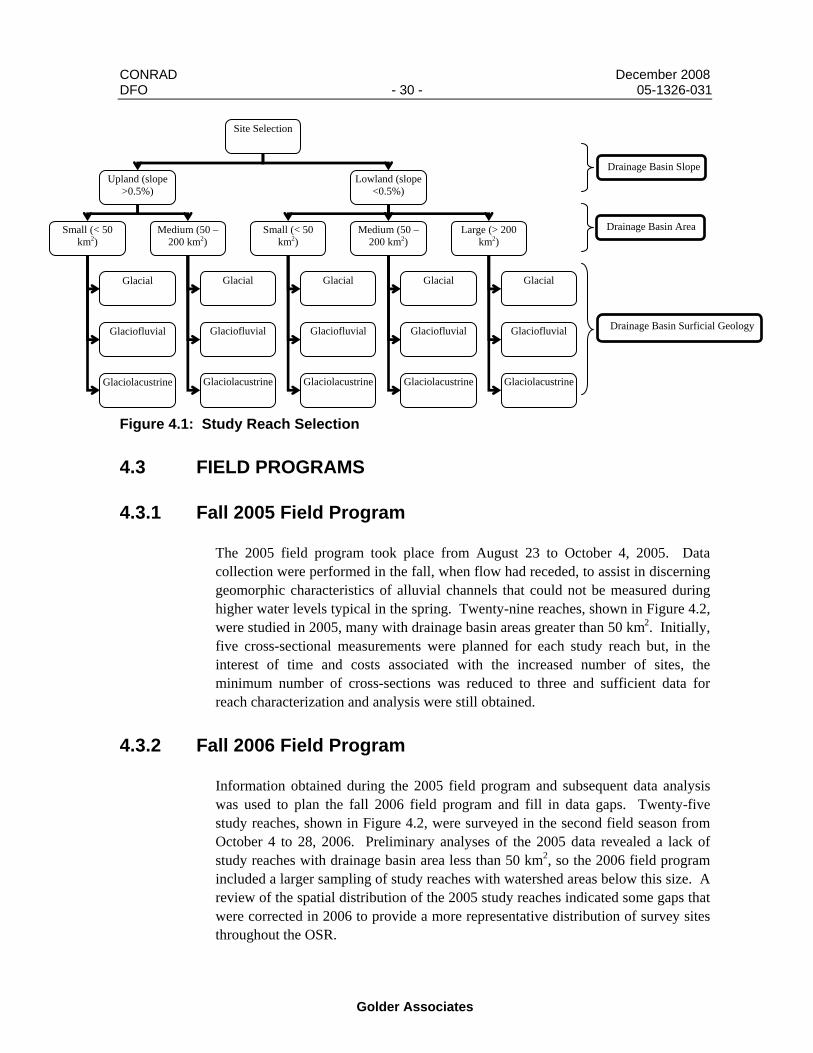
CONRAD December 2008 DFO - 30 - 05-1326-031
Golder Associates
Figure 4.1: Study Reach Selection
4.3 FIELD PROGRAMS
4.3.1 Fall 2005 Field Program
The 2005 field program took place from August 23 to October 4, 2005. Data collection were performed in the fall, when flow had receded, to assist in discerning geomorphic characteristics of alluvial channels that could not be measured during higher water levels typical in the spring. Twenty-nine reaches, shown in Figure 4.2, were studied in 2005, many with drainage basin areas greater than 50 km2. Initially, five cross-sectional measurements were planned for each study reach but, in the interest of time and costs associated with the increased number of sites, the minimum number of cross-sections was reduced to three and sufficient data for reach characterization and analysis were still obtained.
4.3.2 Fall 2006 Field Program
Information obtained during the 2005 field program and subsequent data analysis was used to plan the fall 2006 field program and fill in data gaps. Twenty-five study reaches, shown in Figure 4.2, were surveyed in the second field season from October 4 to 28, 2006. Preliminary analyses of the 2005 data revealed a lack of study reaches with drainage basin area less than 50 km2, so the 2006 field program included a larger sampling of study reaches with watershed areas below this size. A review of the spatial distribution of the 2005 study reaches indicated some gaps that were corrected in 2006 to provide a more representative distribution of survey sites throughout the OSR.
Site Selection
Upland (slope >0.5%)
Lowland (slope <0.5%)
Small (< 50 km2)
Medium (50 – 200 km2)
Small (< 50 km2)
Medium (50 – 200 km2)
Large (> 200 km2)
Glacial
Glaciofluvial
Glacial
Glaciofluvial
Glaciolacustrine Glaciolacustrine
Glacial
Glaciofluvial
Glaciolacustrine
Glacial
Glaciofluvial
Glaciolacustrine
Glacial
Glaciofluvial
Glaciolacustrine
Drainage Basin Slope
Drainage Basin Area
Drainage Basin Surficial Geology
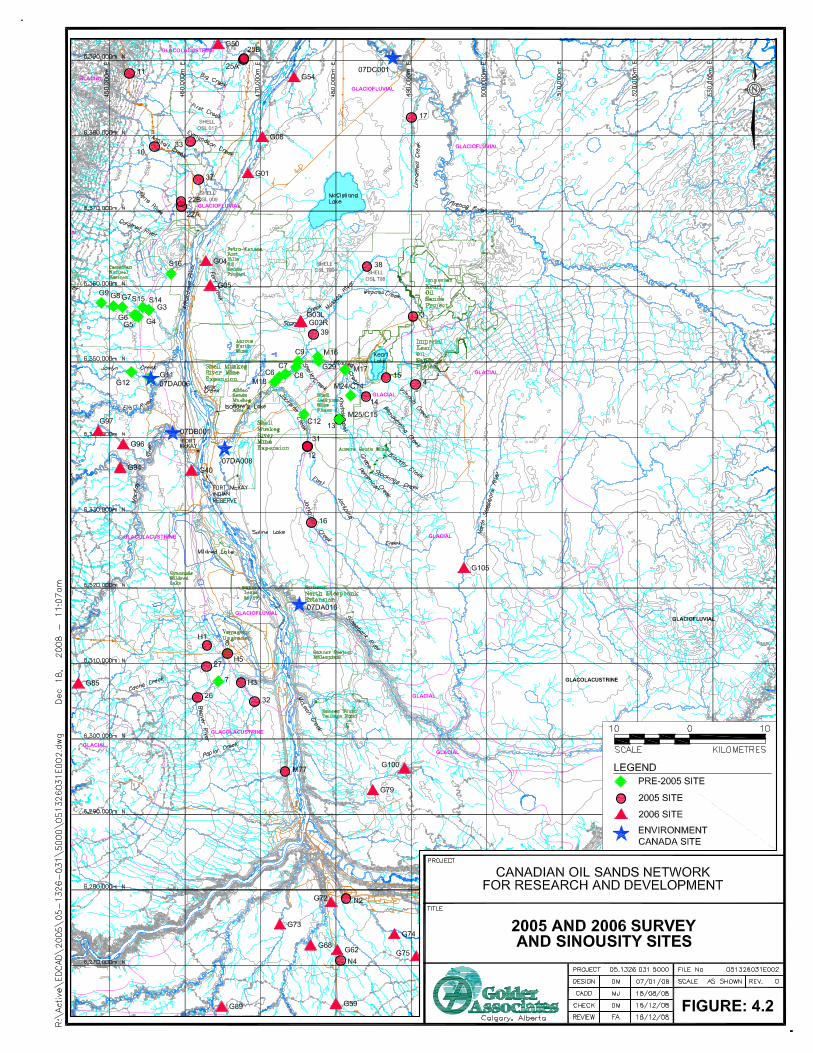
CONRAD December 2008 DFO - 32 - 05-1326-031
Golder Associates
4.4 WATERSHED CHARACTERISTICS
Watershed characteristics of selected study reaches are important because the watershed upstream of a study reach governs the flow variability and character within the study reach. Watershed parameters are used to analyze the flow regime of study reaches and were obtained from geological and topographic maps.
4.4.1 Drainage Basin Area (km2)
Drainage basin area is the geographic area drained by a stream upstream of the study reach. Drainage basin area is an independent basin control that affects independent channel controls such as valley slope and stream discharge (Knighton 1998). Drainage basin area was determined by planimeter from the AltaLIS Stream Layer with National Topographic Data Base (NTDB) 20 m contour map or Light Detection and Ranging (LIDAR) survey (0.5 to 2.0 m contour interval) maps.
4.4.2 Drainage Basin Slope (m/m)
Drainage basin slope is the change in elevation divided by the distance from the top of the drainage basin to the study reach (Knighton 1998). Drainage basin slope was determined via manual measurement using a digital plan measure tool and 20 m contour lines from NTDB or National Topographic Series (NTS) maps.
4.4.3 Lowland or Upland Drainage Basin
Drainage basins in the OSR are often described as lowland or upland basins. In some cases, drainage basins include a combination of lowland and upland areas. Classification of a drainage basin as lowland or upland was based upon drainage basin slope. In the literature, threshold values for dividing lowland from upland areas range from 0.002 m/m (Wohl 2000) to 0.01 m/m (Grant 1997). Based on marked differences between channel morphology and hydrologic characteristics the threshold channel slope value of 0.005 m/m (0.5%) was chosen for the OSR. For the purposes of this study, watersheds with typical slopes less than 0.005 m/m were classified as lowland and those with typical slopes greater than 0.005 m/m were classified as upland.
Basin slopes greater than 0.005 m/m are not conducive to the development of muskeg-type wetlands because the relatively steep gradient promotes drainage that prevents a sufficiently high water table to keep organic material saturated. Basin slopes less than 0.005 m/m are often characterized by muskeg accumulations. Consequently, slope and classification as lowland or upland, may serve as a useful indicator of muskeg conditions that influence fluvial geomorphologic forms and processes.
CONRAD December 2008 DFO - 33 - 05-1326-031
Golder Associates
4.4.4 Total Stream Length (m)
Total stream length is defined as the summation of stream lengths from the headwaters to the study reach. Total stream length is an important parameter in determining drainage density. Total stream length was determined using Geographic Information System (GIS) and/or manual measurement techniques using a digital plan measure tool on NTDB or NTS maps.
4.4.5 Drainage Density (m-1)
Drainage density is the ratio of total stream length within a basin to basin area and is defined as:
AreaDrainageLengthChannelTotal
DensityDrainage =
This parameter is useful for establishing the hydrological character of a watershed and determining the spacing and layout of a mine closure drainage system.
4.4.6 Drainage Basin Bedrock Geology
Drainage basin bedrock geology is the predominant parent material of a watershed. The bedrock geology of a drainage basin can play an important role as the source of material composing the watershed’s surficial geology (Knighton 1998). The bedrock geology of each study reach was determined by examining the bedrock geology inset maps on the surficial geology maps (ARC 1974a, b) and noting the bedrock type.
4.4.7 Drainage Basin Surficial Geology
Drainage basin surficial geology is the near-surface material that has been developed through weathering of the parent material or eroded and deposited during glaciation. This material may be present along stream banks, but may be subject to significant erosion through incision. Drainage basin surficial geology controls local vegetation and soils which in turn influence stream discharge, sediment yield, and bank material composition and strength (Knighton, 1998). Surficial geology maps were used to identify the surficial geology of each study reach (ARC 1974a, b).

CONRAD December 2008 DFO - 34 - 05-1326-031
Golder Associates
4.5 STREAM CHANNEL CHARACTERISTICS
Stream channel characteristics are the features of a natural stream that are essential to replicate in constructed channels that are subject to equivalent flow conditions. Channel parameters were obtained from maps and geomorphic surveys of stream cross-sections and reaches as illustrated in Figure 4.3. These characteristics include bankfull width, bankfull depth, channel slope, sinuosity/irregularity, bed and bank material and channel roughness.
4.5.1 Bankfull Width (m)
Bankfull width is defined as the width at which a stream first begins to overflow its natural banks. This generally occurs during the bankfull discharge flow event, a discharge level largely responsible for the form of alluvial channels.
Bankfull width is a dependent parameter that is primarily governed by stream discharge, channel depth, bed material size and is related to meander wavelength and is inversely related to bank material composition and strength (Knighton 1998). It is, therefore, a critical component of natural channel design and one of the most important parameters studied in this project. It is easily replicated in the design and construction of new drainage systems.
Bankfull channel elevations on each side of the channel were determined based upon geomorphic and ecological indicators including: (1) elevation of depositional features (e.g., point bars); (2) vegetation changes (e.g., lower limit of perennial species); (3) topographic breaks along the channel banks (i.e., break of slope); (4) bank material transitions (e.g. boundary between coarse cobble or gravel and fine-grained sand or silt); (5) erosive features (e.g., undercut banks); and (6) water stains (Harrelson et al. 1994). In a number of instances, bankfull channel elevations on each bank were equivalent with the top of the channel banks.
Co-ordinates of the right and left bankfull channel elevations on each bank were noted during total station surveys of channel cross sections. During data processing, the horizontal distance between right and left bankfull channel elevations on each bank was calculated to determine bankfull width.
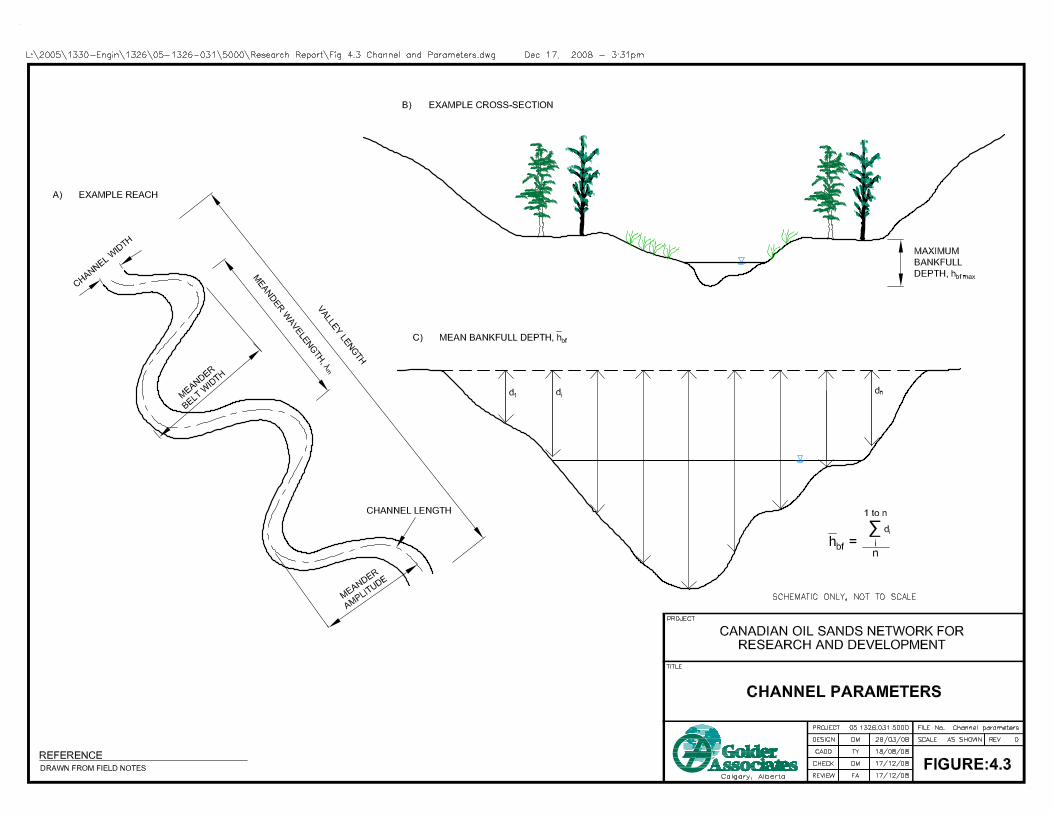
CONRAD December 2008 DFO - 36 - 05-1326-031
Golder Associates
4.5.2 Mean Bankfull Depth (m)
Bankfull depth is the depth at which a stream first begins to overflow it banks as shown in Figure 4.3c. Like channel width, channel depth is primarily governed by stream discharge, channel slope and bed material. It is related to channel width and has an inverse relationship with frictional resistance. Depth is also related to sediment transport rates, bedform geometry, and stream velocity (Knighton 1998). Bankfull channel elevations on each bank were determined by the methods described in Section 4.5.1. Elevations of the channel bed, recorded during total station surveys of the channel cross sections, were subtracted from the bankfull elevation and averaged to determine the mean bankfull depth.
4.5.3 Maximum Bankfull Depth (m)
Maximum bankfull depth at a cross-section was determined by subtracting the minimum elevation of the channel bed recorded during total station surveys from the bankfull elevation.
4.5.4 Bankfull Width-Depth Ratio
Bankfull width-depth ratio is determined by dividing bankfull width by mean bankfull depth. It is a non-dimensional characterization of a channel’s shape and relative incision and is inversely controlled by bank material composition and strength (Knighton 1998).
4.5.5 Channel Slope (m/m)
Channel slope is the change in water surface or average stream bed elevation per unit channel length within a river reach. Channel slope is significantly related to valley slope and bed material size and inversely related to stream discharge and sinuosity. In turn, channel slope has a direct influence on stream power and velocity (Knighton 1998). Channel slope was determined by conducting a total station survey of the longitudinal profile of each stream reach. The long profile of the channel bed surface was surveyed at several reaches. For the remaining reaches, the slope of the water surface profile was used to estimate to the channel bed slope. The slope of water surface was more consistent and provided a more accurate estimation of the representative bed slope. Significant variations in elevation of the channel bed profile due to clasts, vegetation and other debris were observed.
Channel reaches were classified as upland or lowland based on channel slope. Upland reaches have channel slopes greater than 0.5% and lowland channel reaches have channel slopes less than 0.5%.
CONRAD December 2008 DFO - 37 - 05-1326-031
Golder Associates
4.5.6 Sinuosity/Irregularity (m/m)
Channel sinuosity/irregularity is the ratio of channel length to valley length, for a stream reach as shown in Figure 4.3a. Sinuosity is affected by a combination of factors including stream discharge, bed material size, bank material composition and strength, valley slope and channel slope. Sinuosity introduces significant form roughness to streams thus controlling flow resistance values such as Manning’s n (Knighton 1998). In the OSR, stream power plays an integral role in determining the sinuosity of a stream. For example, small streams with drainage area less than about 50 km2 that often flow in muskeg material do not possess enough stream power to overcome the cohesiveness of alluvium, muskeg and other debris in the channel, resulting in irregular meander patterns. In contrast, larger streams with drainage area greater than about 50 km2 often possess the stream power to overcome the cohesiveness of the material through which they flow and develop recognizable patterns of sinuosity. Sinuosity and/or irregularity may be determined in a variety of ways including measurement of thalweg and valley lengths from maps and aerial photographs using Geographic Information Systems (GIS), photogrammetry, and/or cartographic techniques. Typical patterns of sinuosity and their corresponding values are shown in Figure 4.4. Sinuosity measurements used for analysis were obtained from sites shown in Figure 4.2.
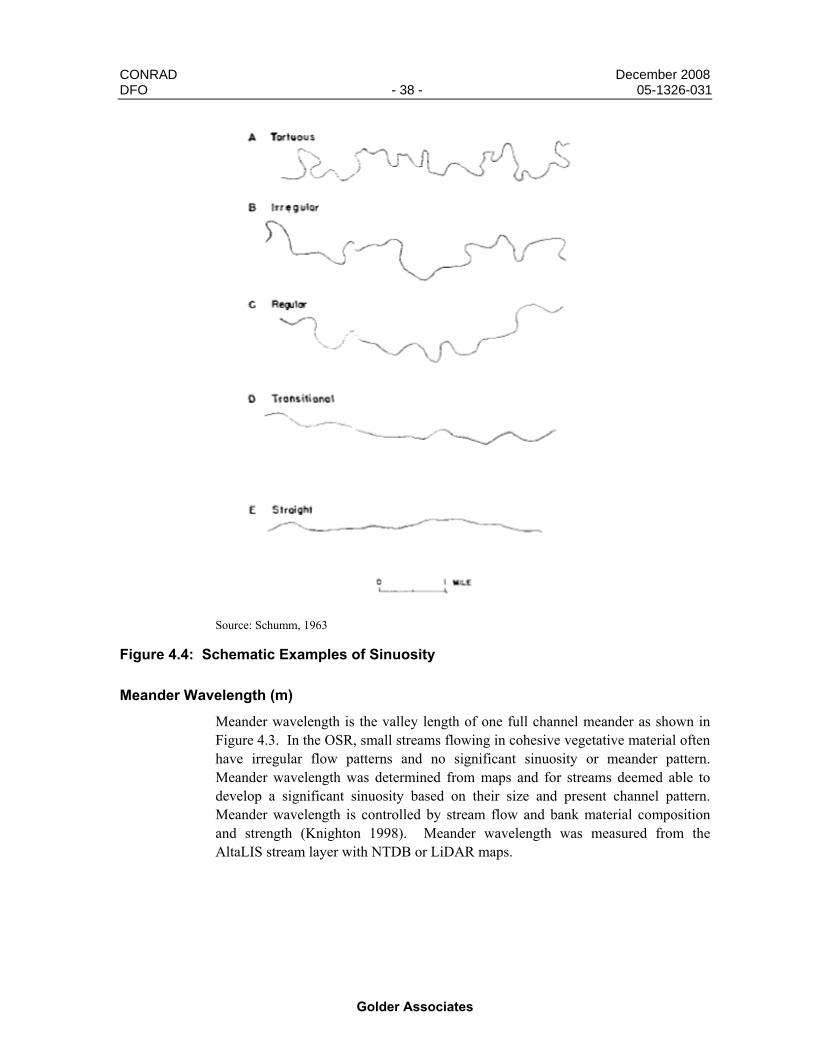
CONRAD December 2008 DFO - 38 - 05-1326-031
Golder Associates
Source: Schumm, 1963
Figure 4.4: Schematic Examples of Sinuosity
Meander Wavelength (m)
Meander wavelength is the valley length of one full channel meander as shown in Figure 4.3. In the OSR, small streams flowing in cohesive vegetative material often have irregular flow patterns and no significant sinuosity or meander pattern. Meander wavelength was determined from maps and for streams deemed able to develop a significant sinuosity based on their size and present channel pattern. Meander wavelength is controlled by stream flow and bank material composition and strength (Knighton 1998). Meander wavelength was measured from the AltaLIS stream layer with NTDB or LiDAR maps.
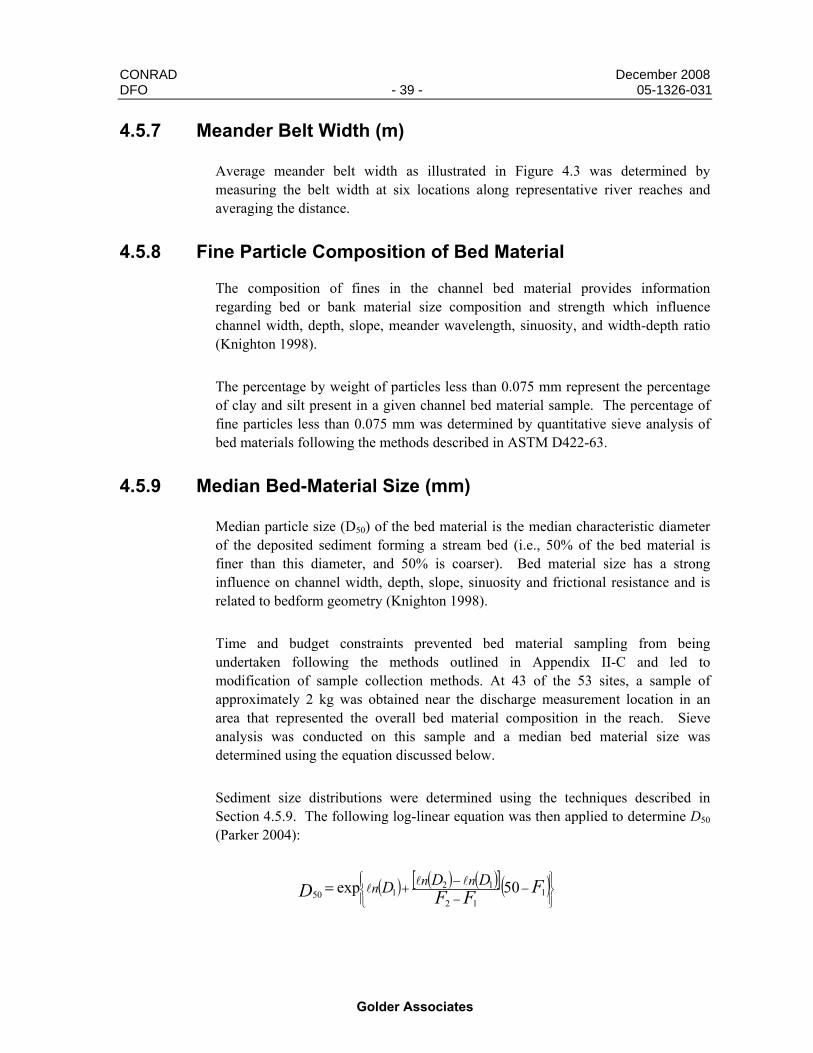
CONRAD December 2008 DFO - 39 - 05-1326-031
Golder Associates
4.5.7 Meander Belt Width (m)
Average meander belt width as illustrated in Figure 4.3 was determined by measuring the belt width at six locations along representative river reaches and averaging the distance.
4.5.8 Fine Particle Composition of Bed Material
The composition of fines in the channel bed material provides information regarding bed or bank material size composition and strength which influence channel width, depth, slope, meander wavelength, sinuosity, and width-depth ratio (Knighton 1998).
The percentage by weight of particles less than 0.075 mm represent the percentage of clay and silt present in a given channel bed material sample. The percentage of fine particles less than 0.075 mm was determined by quantitative sieve analysis of bed materials following the methods described in ASTM D422-63.
4.5.9 Median Bed-Material Size (mm)
Median particle size (D50) of the bed material is the median characteristic diameter of the deposited sediment forming a stream bed (i.e., 50% of the bed material is finer than this diameter, and 50% is coarser). Bed material size has a strong influence on channel width, depth, slope, sinuosity and frictional resistance and is related to bedform geometry (Knighton 1998).
Time and budget constraints prevented bed material sampling from being undertaken following the methods outlined in Appendix II-C and led to modification of sample collection methods. At 43 of the 53 sites, a sample of approximately 2 kg was obtained near the discharge measurement location in an area that represented the overall bed material composition in the reach. Sieve analysis was conducted on this sample and a median bed material size was determined using the equation discussed below.
Sediment size distributions were determined using the techniques described in Section 4.5.9. The following log-linear equation was then applied to determine D50 (Parker 2004):
( ) ( ) ( )[ ]( )⎪⎭
⎪⎬⎫
⎪⎩
⎪⎨⎧
−−−+= 1
12
12150 50exp FFFD DDD nnn ll
l
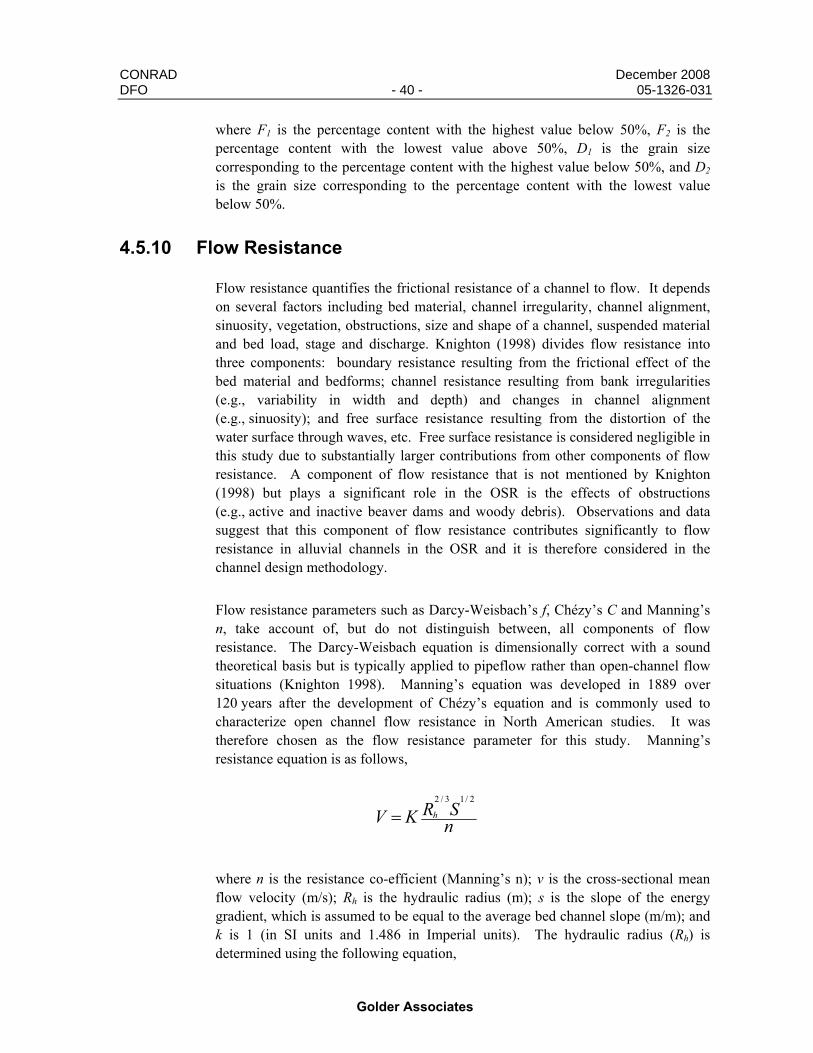
CONRAD December 2008 DFO - 40 - 05-1326-031
Golder Associates
where F1 is the percentage content with the highest value below 50%, F2 is the percentage content with the lowest value above 50%, D1 is the grain size corresponding to the percentage content with the highest value below 50%, and D2 is the grain size corresponding to the percentage content with the lowest value below 50%.
4.5.10 Flow Resistance
Flow resistance quantifies the frictional resistance of a channel to flow. It depends on several factors including bed material, channel irregularity, channel alignment, sinuosity, vegetation, obstructions, size and shape of a channel, suspended material and bed load, stage and discharge. Knighton (1998) divides flow resistance into three components: boundary resistance resulting from the frictional effect of the bed material and bedforms; channel resistance resulting from bank irregularities (e.g., variability in width and depth) and changes in channel alignment (e.g., sinuosity); and free surface resistance resulting from the distortion of the water surface through waves, etc. Free surface resistance is considered negligible in this study due to substantially larger contributions from other components of flow resistance. A component of flow resistance that is not mentioned by Knighton (1998) but plays a significant role in the OSR is the effects of obstructions (e.g., active and inactive beaver dams and woody debris). Observations and data suggest that this component of flow resistance contributes significantly to flow resistance in alluvial channels in the OSR and it is therefore considered in the channel design methodology.
Flow resistance parameters such as Darcy-Weisbach’s f, Chézy’s C and Manning’s n, take account of, but do not distinguish between, all components of flow resistance. The Darcy-Weisbach equation is dimensionally correct with a sound theoretical basis but is typically applied to pipeflow rather than open-channel flow situations (Knighton 1998). Manning’s equation was developed in 1889 over 120 years after the development of Chézy’s equation and is commonly used to characterize open channel flow resistance in North American studies. It was therefore chosen as the flow resistance parameter for this study. Manning’s resistance equation is as follows,
nSRKV h
2/13/2
=
where n is the resistance co-efficient (Manning’s n); v is the cross-sectional mean flow velocity (m/s); Rh is the hydraulic radius (m); s is the slope of the energy gradient, which is assumed to be equal to the average bed channel slope (m/m); and k is 1 (in SI units and 1.486 in Imperial units). The hydraulic radius (Rh) is determined using the following equation,

CONRAD December 2008 DFO - 41 - 05-1326-031
Golder Associates
PARh =
where A is the cross sectional area of flow (m2) and P is the wetted perimeter (m).
Cross-sectional mean velocity (v) and Manning’s ‘n’ were determined by modelling the measured flow conditions using the United States Army Corps of Engineers’ Hydrologic Engineering Center River Analysis System (HEC-RAS) model.
Determination of Manning’s Roughness Coefficient
The HEC-RAS model is a one-dimensional river hydraulic model that has been applied extensively in North America. The software has a graphical user interface (GUI), hydraulic analysis modules, data storage and management capabilities, and graphics and reporting facilities. The model is capable of performing steady and unsteady flow analysis. In this study, the steady state mode was used to perform the hydraulic simulation. The HEC-RAS model outputs include water surface profile, flow velocities, flow area and other hydraulic parameters within the study reach.
The input data required for the HEC-RAS model include geometry data, flow data and roughness coefficient. The geometry data include cross-section data, the bank locations and reach length between cross-sections. The flow data include upstream and downstream boundary conditions, which, in this study, are the inflow discharge and the average measured water surface slope respectively.
The HEC-RAS model was calibrated by adjusting the value of the Manning’s roughness coefficient until the average simulated water surface slope matched the average measured water surface slope. The Manning’s roughness coefficient was determined for the reaches surveyed in 2005 and 2006. Details of the calibration results are presented in Appendix VI.
4.5.11 Channel Surficial Geology
Channel surficial geology refers to the surficial material within the channel banks. Material present in the channel bed is generally material from within the drainage basin that has been replaced by the flow. Channel surficial geology may also coincide with the bedrock geology if the channel is incised to the depth of the parent material. Surficial geology maps of the area were used to determine the channel material (ARC 1974a, b).
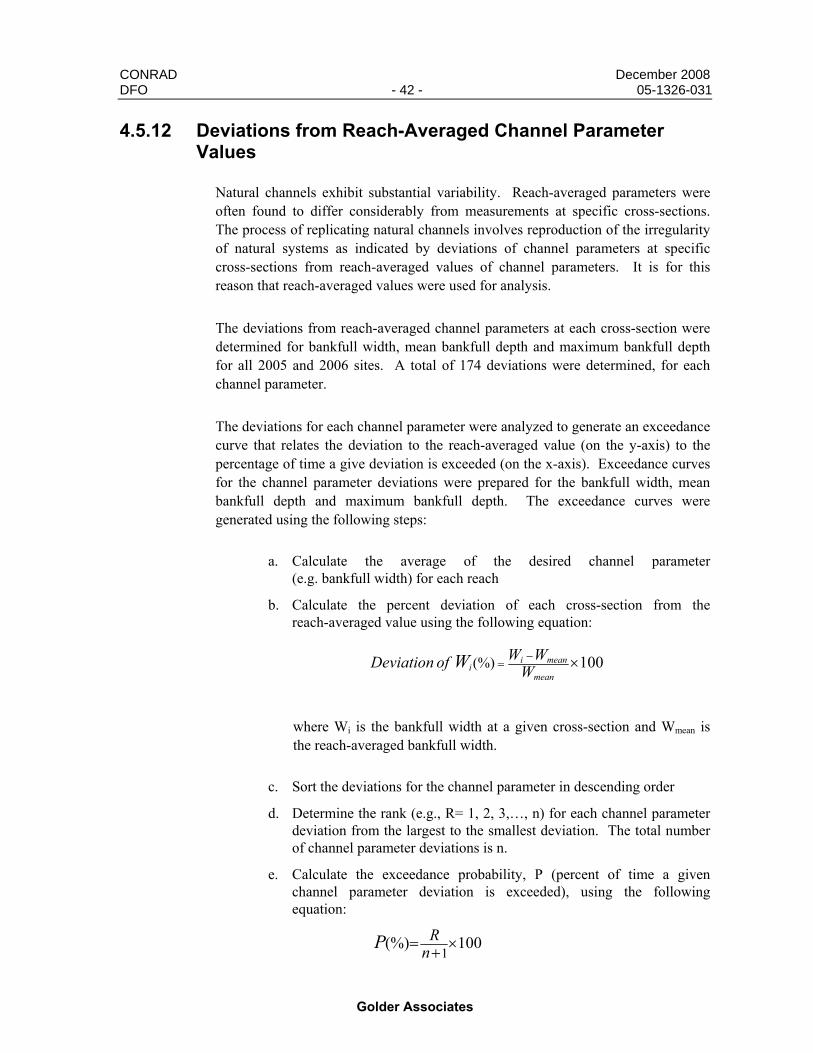
CONRAD December 2008 DFO - 42 - 05-1326-031
Golder Associates
4.5.12 Deviations from Reach-Averaged Channel Parameter Values
Natural channels exhibit substantial variability. Reach-averaged parameters were often found to differ considerably from measurements at specific cross-sections. The process of replicating natural channels involves reproduction of the irregularity of natural systems as indicated by deviations of channel parameters at specific cross-sections from reach-averaged values of channel parameters. It is for this reason that reach-averaged values were used for analysis.
The deviations from reach-averaged channel parameters at each cross-section were determined for bankfull width, mean bankfull depth and maximum bankfull depth for all 2005 and 2006 sites. A total of 174 deviations were determined, for each channel parameter.
The deviations for each channel parameter were analyzed to generate an exceedance curve that relates the deviation to the reach-averaged value (on the y-axis) to the percentage of time a give deviation is exceeded (on the x-axis). Exceedance curves for the channel parameter deviations were prepared for the bankfull width, mean bankfull depth and maximum bankfull depth. The exceedance curves were generated using the following steps:
a. Calculate the average of the desired channel parameter (e.g. bankfull width) for each reach
b. Calculate the percent deviation of each cross-section from the reach-averaged value using the following equation:
100(%) ×−=
mean
meanii W
WWofDeviation W
where Wi is the bankfull width at a given cross-section and Wmean is the reach-averaged bankfull width.
c. Sort the deviations for the channel parameter in descending order
d. Determine the rank (e.g., R= 1, 2, 3,…, n) for each channel parameter deviation from the largest to the smallest deviation. The total number of channel parameter deviations is n.
e. Calculate the exceedance probability, P (percent of time a given channel parameter deviation is exceeded), using the following equation:
100(%)1×+= n
RP

CONRAD December 2008 DFO - 43 - 05-1326-031
Golder Associates
f. Plot the percent channel parameter deviations against the exceedance probabilities to generate an exceedance curve.
Exceedance curves can be used to determine the variability from the reach-averaged channel parameter value at a desired confidence limit as shown in section 5.3.
4.6 FLOW CHARACTERISTICS
Flow characteristics were used to describe stream flow and were derived by simulating flows using the United States Geological Survey’s Hydrological Simulation Program – Fortran (HSPF). The HSPF model was last calibrated and validated in 2003 using updated climatic and hydrologic data and surficial geology and surface cover information from the OSR (Golder 2003).
4.6.1 Mean Annual Discharge (m3/s)
Annual discharge is the average of recorded or simulated daily flow rates that pass through a location on a river channel over a one year period. The mean annual discharge is determined by averaging the annual discharges over a period typically greater than 10 years. Stream discharge is governed by drainage basin area, physiography, vegetation, soils, land use and regional climate and geology. Stream discharge, as well as channel width and depth, is a component of stream power and meander wavelength (Knighton 1998). The lack of long-term flow measurements for the variety of streams in the OSR precluded the use of measured flows and required simulation of stream flows using the HSPF model.
4.6.2 Bankfull Discharge (m3/s)
Bankfull discharge is the flow rate corresponding to bankfull conditions that occur when river stage exceeds the stream’s natural banks and overflows onto the active floodplain. The active floodplain is the flat area adjacent to the channel developed by the stream and utilized by flood flows at a recurrence interval of two years or less (Wolman and Leopold 1957). Bankfull discharge is often characterized by a 1.5-year recurrence interval (Leopold 1964; Rosgen 1994); however, this value may not be constant, even within a single basin (Pickup and Warner 1976; Andrews 1980). In a study of 36 stations, Williams (1978) found an average recurrence interval of 1.5 years, although actual values ranged from 1.01 to 32 years and only 62 % of the recurrence intervals lay between one and two years. The bankfull discharge may have a constant recurrence interval in an individual stream, but the literature suggests that the variability can be high even within a drainage basin. Therefore, hydrological analyses should be conducted before assigning a recurrence interval to a bankfull discharge for a stream.

CONRAD December 2008 DFO - 44 - 05-1326-031
Golder Associates
Bankfull discharge is a particularly important geomorphic flow parameter as it corresponds quite closely with the effective discharge. Effective discharge is the flow that transports the greatest volume of sediment over long temporal scales under current climatic conditions. Effective discharge is the flow parameter responsible for determining and maintaining the physical form of alluvial channels (Harrelson et al. 1994). For this study, it is assumed that the bankfull discharge corresponds to the two-year flood.
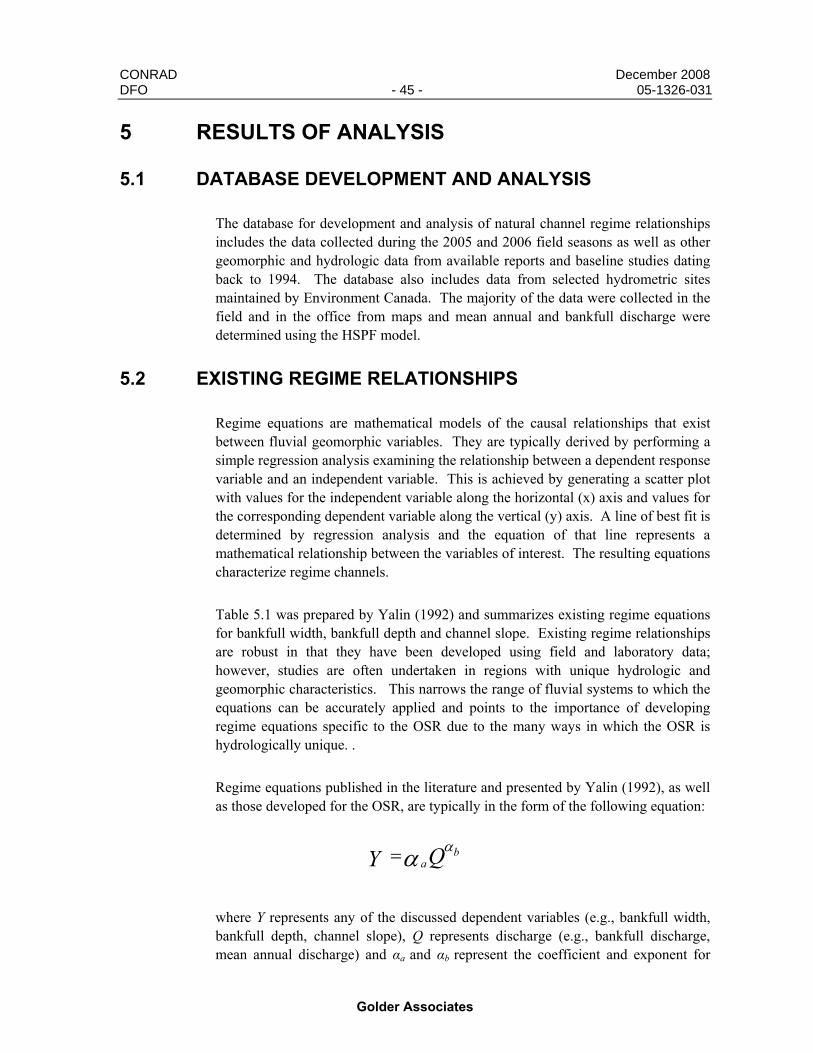
CONRAD December 2008 DFO - 45 - 05-1326-031
Golder Associates
5 RESULTS OF ANALYSIS
5.1 DATABASE DEVELOPMENT AND ANALYSIS
The database for development and analysis of natural channel regime relationships includes the data collected during the 2005 and 2006 field seasons as well as other geomorphic and hydrologic data from available reports and baseline studies dating back to 1994. The database also includes data from selected hydrometric sites maintained by Environment Canada. The majority of the data were collected in the field and in the office from maps and mean annual and bankfull discharge were determined using the HSPF model.
5.2 EXISTING REGIME RELATIONSHIPS
Regime equations are mathematical models of the causal relationships that exist between fluvial geomorphic variables. They are typically derived by performing a simple regression analysis examining the relationship between a dependent response variable and an independent variable. This is achieved by generating a scatter plot with values for the independent variable along the horizontal (x) axis and values for the corresponding dependent variable along the vertical (y) axis. A line of best fit is determined by regression analysis and the equation of that line represents a mathematical relationship between the variables of interest. The resulting equations characterize regime channels.
Table 5.1 was prepared by Yalin (1992) and summarizes existing regime equations for bankfull width, bankfull depth and channel slope. Existing regime relationships are robust in that they have been developed using field and laboratory data; however, studies are often undertaken in regions with unique hydrologic and geomorphic characteristics. This narrows the range of fluvial systems to which the equations can be accurately applied and points to the importance of developing regime equations specific to the OSR due to the many ways in which the OSR is hydrologically unique. .
Regime equations published in the literature and presented by Yalin (1992), as well as those developed for the OSR, are typically in the form of the following equation:
QY ba
αα=
where Y represents any of the discussed dependent variables (e.g., bankfull width, bankfull depth, channel slope), Q represents discharge (e.g., bankfull discharge, mean annual discharge) and αa and αb represent the coefficient and exponent for

CONRAD December 2008 DFO - 46 - 05-1326-031
Golder Associates
discharge, respectively. In the literature, multi-variate regime equations exist in the form of the following equation:
DQY cba
ααα 50=
where αc represents the exponent for median stream bed particle size (D50). The coefficient and exponents are determined by regression analysis.
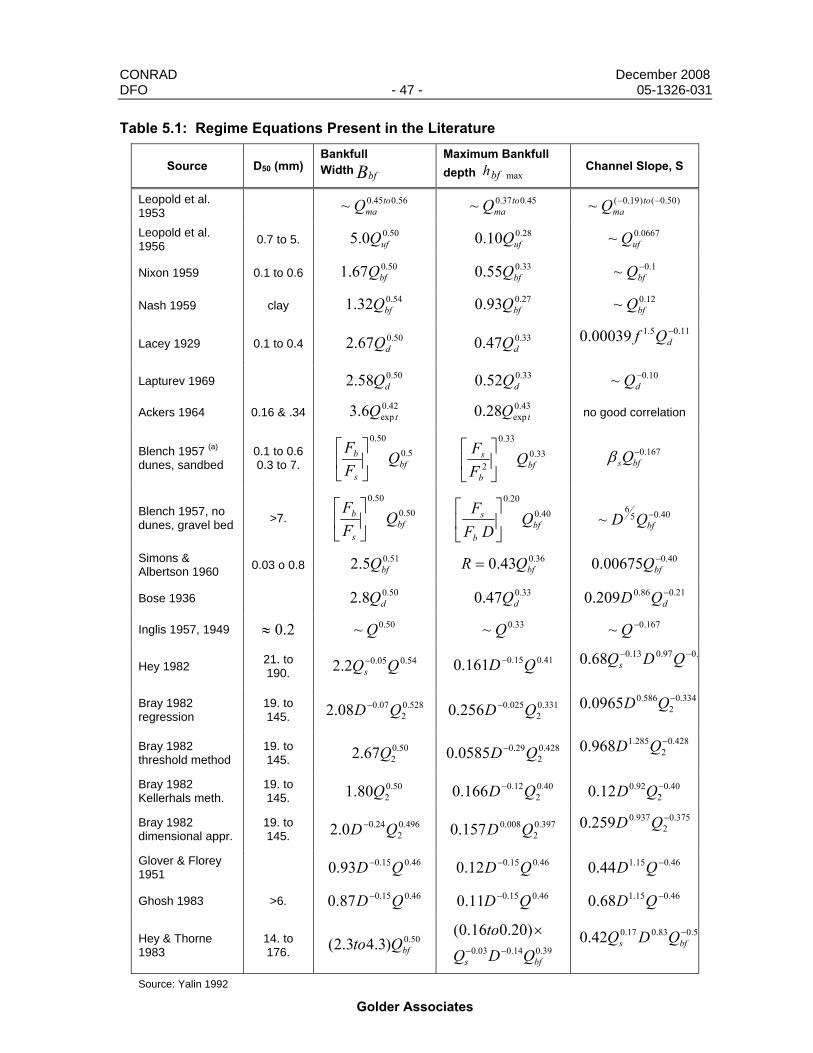
CONRAD December 2008 DFO - 47 - 05-1326-031
Golder Associates
Table 5.1: Regime Equations Present in the Literature
Source D50 (mm) Bankfull Width Bbf
Maximum Bankfull depth maxbfh Channel Slope, S
Leopold et al. 1953 56.045.0~ to
maQ 45.037.0~ tomaQ )50.0()19.0(~ −− to
maQ
Leopold et al. 1956 0.7 to 5. 50.00.5 ufQ 28.010.0 ufQ 0667.0~ ufQ
Nixon 1959 0.1 to 0.6 50.067.1 bfQ 33.055.0 bfQ 1.0~ −bfQ
Nash 1959 clay 54.032.1 bfQ 27.093.0 bfQ 12.0~ bfQ
Lacey 1929 0.1 to 0.4 50.067.2 dQ 33.047.0 dQ 11.05.100039.0 −
dQf
Lapturev 1969 50.058.2 dQ 33.052.0 dQ 10.0~ −dQ
Ackers 1964 0.16 & .34 42.0exp6.3 tQ 43.0
exp28.0 tQ no good correlation
Blench 1957 (a) dunes, sandbed
0.1 to 0.6 0.3 to 7.
5.050.0
bfs
b QFF
⎥⎦
⎤⎢⎣
⎡ 33.0
33.0
2 bfb
s QFF
⎥⎦
⎤⎢⎣
⎡
167.0−bfsQβ
Blench 1957, no dunes, gravel bed >7. 50.0
50.0
bfs
b QFF⎥⎦
⎤⎢⎣
⎡ 40.0
20.0
bfb
s QDF
F⎥⎦
⎤⎢⎣
⎡ 40.05
6~ −
bfQD
Simons & Albertson 1960 0.03 o 0.8 51.05.2 bfQ 36.043.0 bfQR = 40.000675.0 −
bfQ
Bose 1936 50.08.2 dQ 33.047.0 dQ 21.086.0209.0 −dQD
Inglis 1957, 1949 2.0≈ 50.0~ Q 33.0~ Q 167.0~ −Q
Hey 1982 21. to 190.
54.005.02.2 QQs− 41.015.0161.0 QD −
.097.013.068.0 −− QDQs
Bray 1982 regression
19. to 145.
528.02
07.008.2 QD − 331.02
025.0256.0 QD − 334.0
2586.00965.0 −QD
Bray 1982 threshold method
19. to 145.
50.0267.2 Q 428.0
229.00585.0 QD −
428.02
285.1968.0 −QD
Bray 1982 Kellerhals meth.
19. to 145.
50.0280.1 Q 40.0
212.0166.0 QD − 40.0
292.012.0 −QD
Bray 1982 dimensional appr.
19. to 145.
496.02
24.00.2 QD − 397.02
008.0157.0 QD 375.0
2937.0259.0 −QD
Glover & Florey 1951 46.015.093.0 QD − 46.015.012.0 QD − 46.015.144.0 −QD
Ghosh 1983 >6. 46.015.087.0 QD − 46.015.011.0 QD − 46.015.168.0 −QD
Hey & Thorne 1983
14. to 176.
50.0)3.43.2( bfQto 39.014.003.0
)20.016.0(
bfs QDQto
−−
×
57.083.017.042.0 −bfs QDQ
Source: Yalin 1992
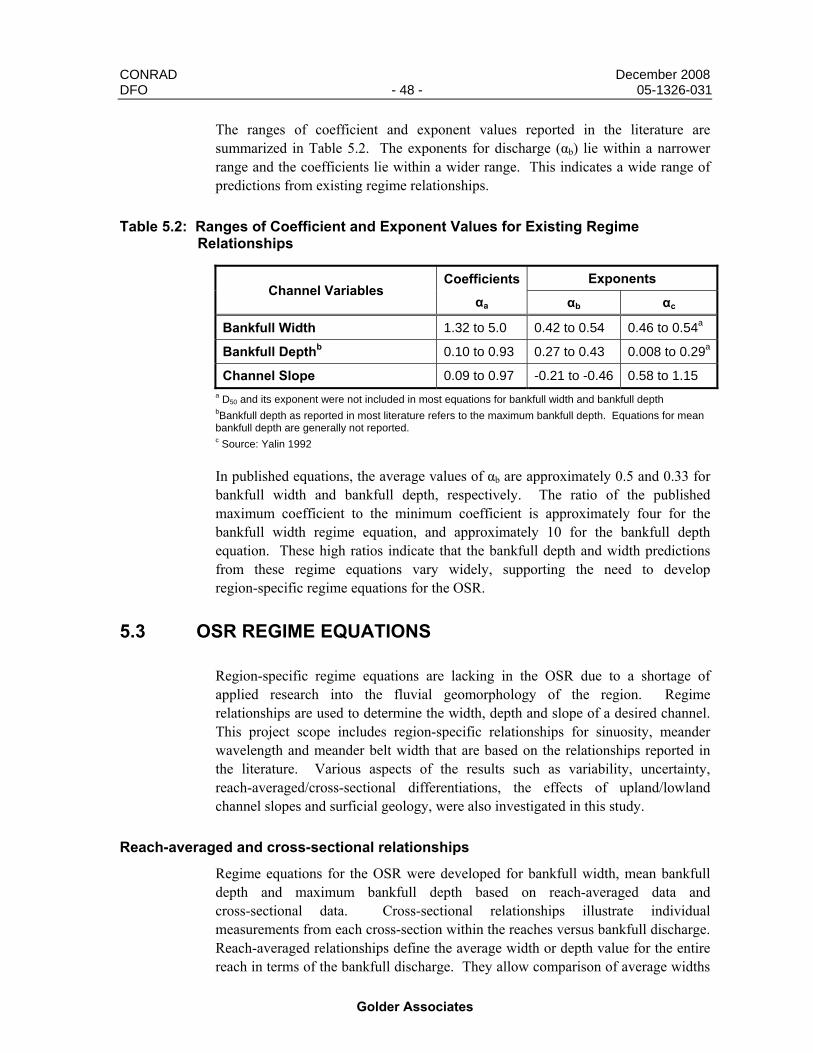
CONRAD December 2008 DFO - 48 - 05-1326-031
Golder Associates
The ranges of coefficient and exponent values reported in the literature are summarized in Table 5.2. The exponents for discharge (αb) lie within a narrower range and the coefficients lie within a wider range. This indicates a wide range of predictions from existing regime relationships.
Table 5.2: Ranges of Coefficient and Exponent Values for Existing Regime Relationships
Channel Variables Coefficients
αa
Exponents
αb αc
Bankfull Width 1.32 to 5.0 0.42 to 0.54 0.46 to 0.54a
Bankfull Depthb 0.10 to 0.93 0.27 to 0.43 0.008 to 0.29a
Channel Slope 0.09 to 0.97 -0.21 to -0.46 0.58 to 1.15 a D50 and its exponent were not included in most equations for bankfull width and bankfull depth bBankfull depth as reported in most literature refers to the maximum bankfull depth. Equations for mean bankfull depth are generally not reported. c Source: Yalin 1992
In published equations, the average values of αb are approximately 0.5 and 0.33 for bankfull width and bankfull depth, respectively. The ratio of the published maximum coefficient to the minimum coefficient is approximately four for the bankfull width regime equation, and approximately 10 for the bankfull depth equation. These high ratios indicate that the bankfull depth and width predictions from these regime equations vary widely, supporting the need to develop region-specific regime equations for the OSR.
5.3 OSR REGIME EQUATIONS
Region-specific regime equations are lacking in the OSR due to a shortage of applied research into the fluvial geomorphology of the region. Regime relationships are used to determine the width, depth and slope of a desired channel. This project scope includes region-specific relationships for sinuosity, meander wavelength and meander belt width that are based on the relationships reported in the literature. Various aspects of the results such as variability, uncertainty, reach-averaged/cross-sectional differentiations, the effects of upland/lowland channel slopes and surficial geology, were also investigated in this study.
Reach-averaged and cross-sectional relationships
Regime equations for the OSR were developed for bankfull width, mean bankfull depth and maximum bankfull depth based on reach-averaged data and cross-sectional data. Cross-sectional relationships illustrate individual measurements from each cross-section within the reaches versus bankfull discharge. Reach-averaged relationships define the average width or depth value for the entire reach in terms of the bankfull discharge. They allow comparison of average widths

CONRAD December 2008 DFO - 49 - 05-1326-031
Golder Associates
or depths between reaches and aid in design at the basin-scale. In combination with exceedance curves the reach-averaged plots, can be used for assessment of width and depth as well as width and depth variability within individual reaches.
5.3.1 Bankfull Width
Figure 5.1 shows the relationship between the reach-averaged bankfull width bfB and bankfull discharge, bfQ for 2005 and 2006 data that were collected during the course of this study. The resulting equation is shown below:
QB bfbf43.0
2.4=
The 75% confidence limit curves are plotted on the figure to show the degree of uncertainty for the derived relationship. The 75% upper confidence limit curve coincides with predictions about 100% greater than the best fit line predictions and the 75% lower confidence limit curve coincides with predictions about 50% less than the best fit line predictions.
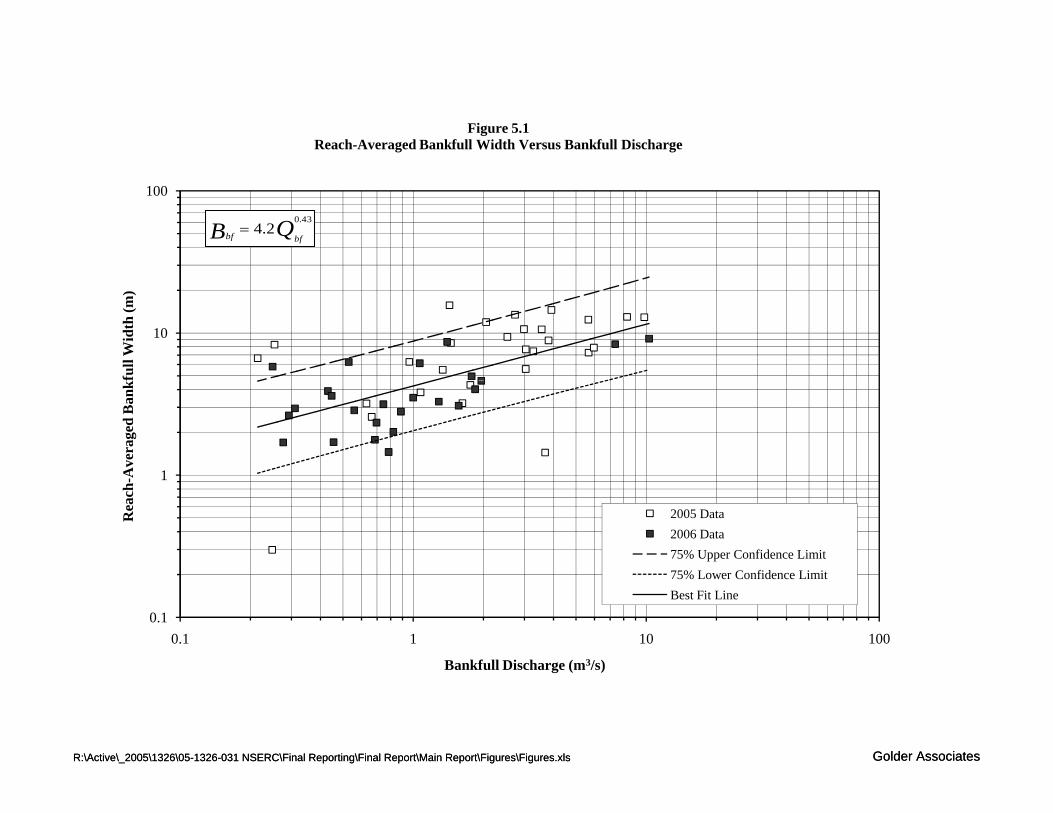
10
100
full
Wid
th (m
)Figure 5.1
Reach-Averaged Bankfull Width Versus Bankfull Discharge
QB bfbf
43.02.4=
R:\Active\_2005\1326\05-1326-031 NSERC\Final Reporting\Final Report\Main Report\Figures\Figures.xls Golder Associates
0.1
1
0.1 1 10 100
Rea
ch-A
vera
ged
Ban
kf
Bankfull Discharge (m3/s)
2005 Data2006 Data75% Upper Confidence Limit75% Lower Confidence LimitBest Fit Line
R:\Active\_2005\1326\05-1326-031 NSERC\Final Reporting\Final Report\Main Report\Figures\Figures.xls Golder Associates
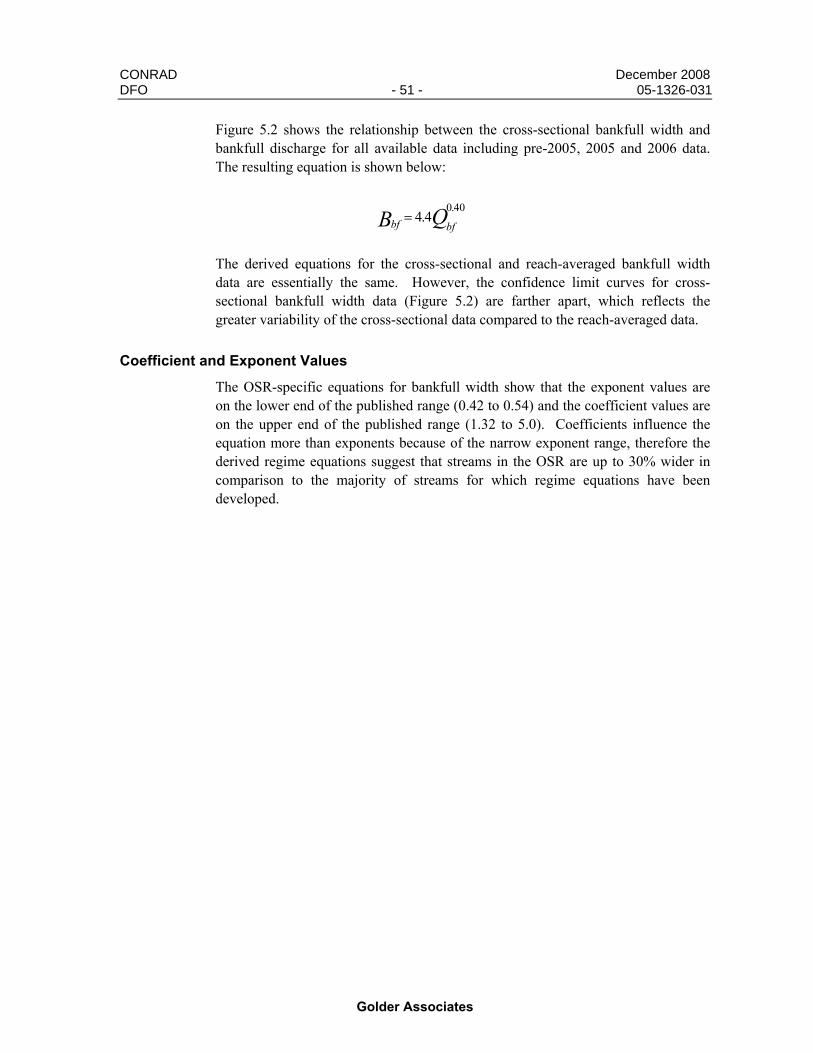
CONRAD December 2008 DFO - 51 - 05-1326-031
Golder Associates
Figure 5.2 shows the relationship between the cross-sectional bankfull width and bankfull discharge for all available data including pre-2005, 2005 and 2006 data. The resulting equation is shown below:
QB bfbf40.0
4.4=
The derived equations for the cross-sectional and reach-averaged bankfull width data are essentially the same. However, the confidence limit curves for cross-sectional bankfull width data (Figure 5.2) are farther apart, which reflects the greater variability of the cross-sectional data compared to the reach-averaged data.
Coefficient and Exponent Values
The OSR-specific equations for bankfull width show that the exponent values are on the lower end of the published range (0.42 to 0.54) and the coefficient values are on the upper end of the published range (1.32 to 5.0). Coefficients influence the equation more than exponents because of the narrow exponent range, therefore the derived regime equations suggest that streams in the OSR are up to 30% wider in comparison to the majority of streams for which regime equations have been developed.
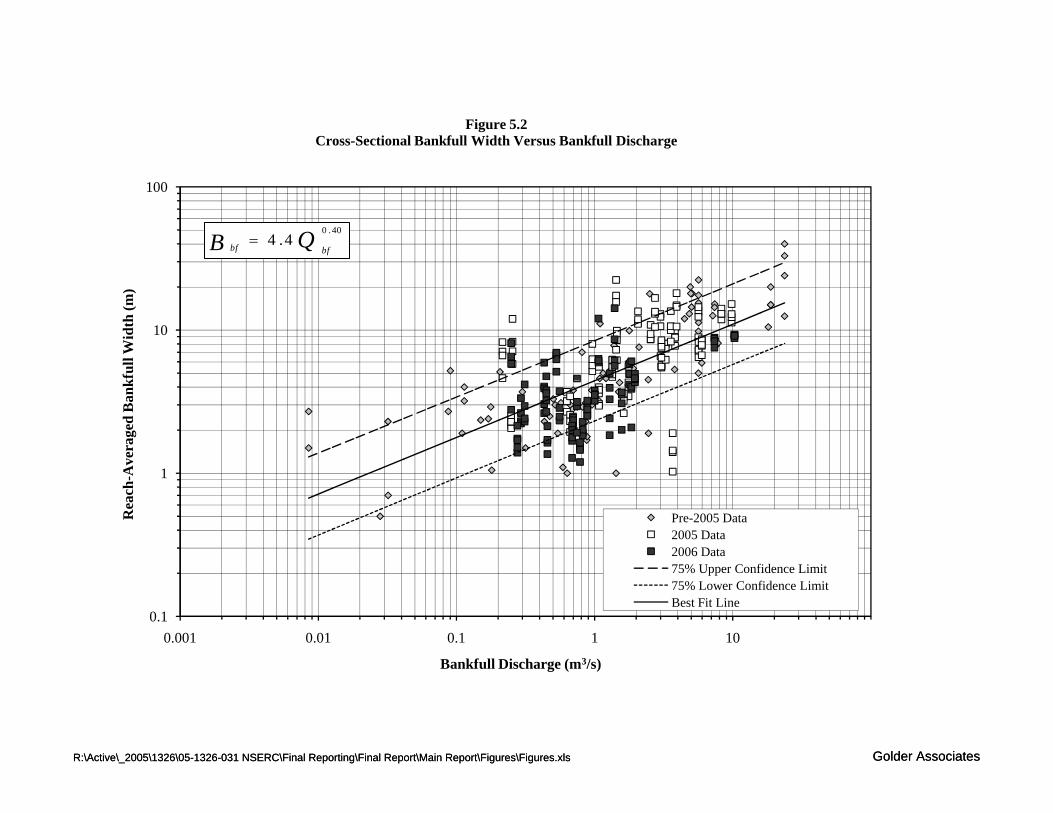
10
100
kful
l Wid
th (m
)Figure 5.2
Cross-Sectional Bankfull Width Versus Bankfull Discharge
QB bfbf
40.04.4=
R:\Active\_2005\1326\05-1326-031 NSERC\Final Reporting\Final Report\Main Report\Figures\Figures.xls Golder Associates
0.1
1
0.001 0.01 0.1 1 10
Rea
ch-A
vera
ged
Ban
k
Bankfull Discharge (m3/s)
Pre-2005 Data2005 Data2006 Data75% Upper Confidence Limit75% Lower Confidence LimitBest Fit Line
R:\Active\_2005\1326\05-1326-031 NSERC\Final Reporting\Final Report\Main Report\Figures\Figures.xls Golder Associates
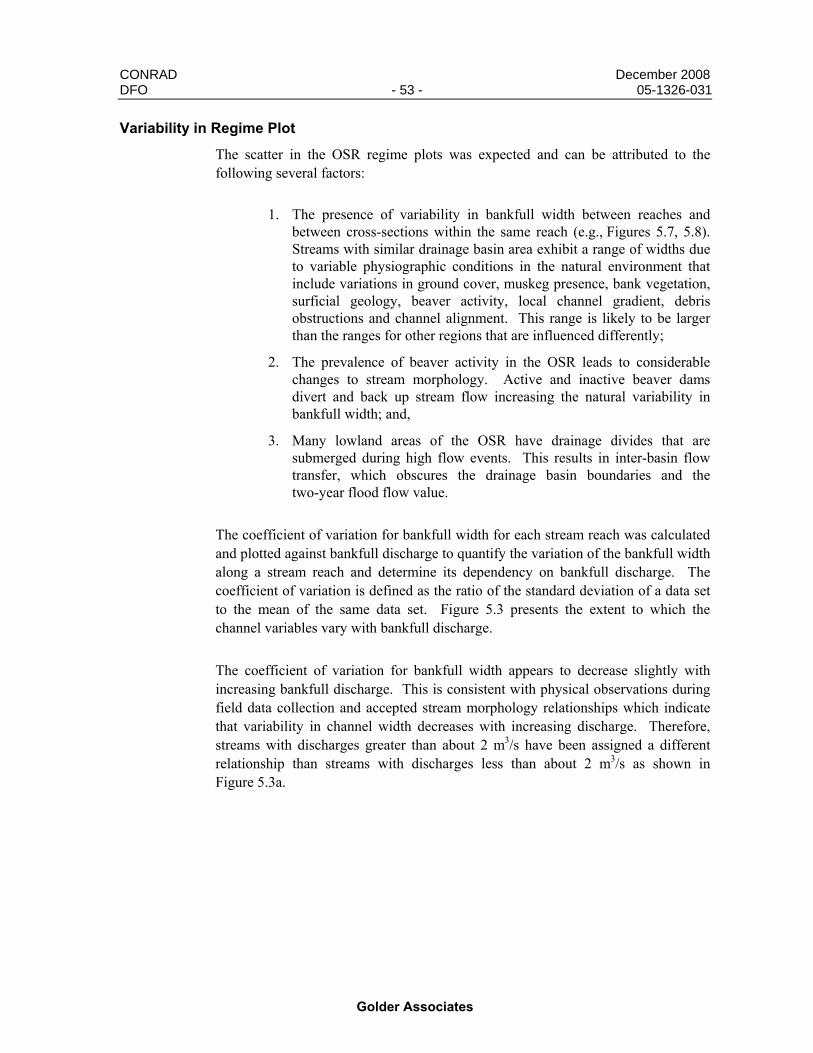
CONRAD December 2008 DFO - 53 - 05-1326-031
Golder Associates
Variability in Regime Plot
The scatter in the OSR regime plots was expected and can be attributed to the following several factors:
1. The presence of variability in bankfull width between reaches and between cross-sections within the same reach (e.g., Figures 5.7, 5.8). Streams with similar drainage basin area exhibit a range of widths due to variable physiographic conditions in the natural environment that include variations in ground cover, muskeg presence, bank vegetation, surficial geology, beaver activity, local channel gradient, debris obstructions and channel alignment. This range is likely to be larger than the ranges for other regions that are influenced differently;
2. The prevalence of beaver activity in the OSR leads to considerable changes to stream morphology. Active and inactive beaver dams divert and back up stream flow increasing the natural variability in bankfull width; and,
3. Many lowland areas of the OSR have drainage divides that are submerged during high flow events. This results in inter-basin flow transfer, which obscures the drainage basin boundaries and the two-year flood flow value.
The coefficient of variation for bankfull width for each stream reach was calculated and plotted against bankfull discharge to quantify the variation of the bankfull width along a stream reach and determine its dependency on bankfull discharge. The coefficient of variation is defined as the ratio of the standard deviation of a data set to the mean of the same data set. Figure 5.3 presents the extent to which the channel variables vary with bankfull discharge.
The coefficient of variation for bankfull width appears to decrease slightly with increasing bankfull discharge. This is consistent with physical observations during field data collection and accepted stream morphology relationships which indicate that variability in channel width decreases with increasing discharge. Therefore, streams with discharges greater than about 2 m3/s have been assigned a different relationship than streams with discharges less than about 2 m3/s as shown in Figure 5.3a.
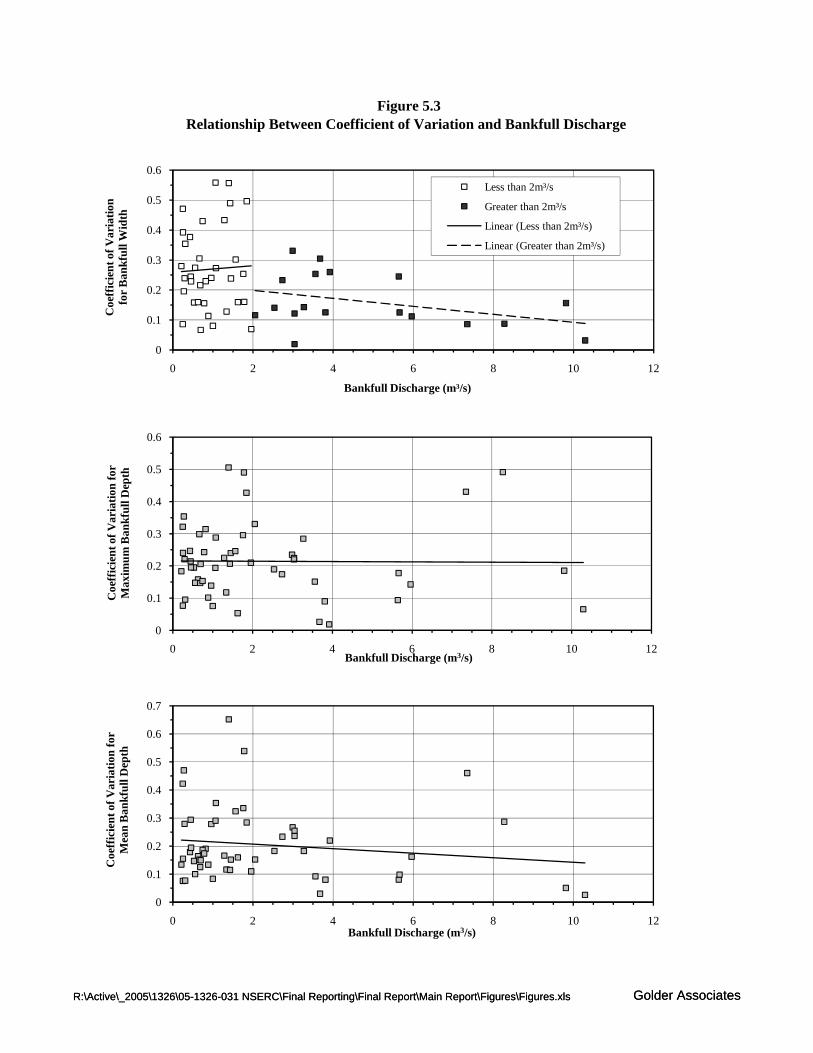
Figure 5.3Relationship Between Coefficient of Variation and Bankfull Discharge
0
0.1
0.2
0.3
0.4
0.5
0.6
0 2 4 6 8 10 12
Coe
ffic
ient
of V
aria
tion
for B
ankf
ull W
idth
Bankfull Discharge (m³/s)
Less than 2m³/s
Greater than 2m³/s
Linear (Less than 2m³/s)
Linear (Greater than 2m³/s)
0.5
0.6
on fo
rD
epth
R:\Active\_2005\1326\05-1326-031 NSERC\Final Reporting\Final Report\Main Report\Figures\Figures.xls Golder Associates
0
0.1
0.2
0.3
0.4
0 2 4 6 8 10 12
Coe
ffic
ient
of V
aria
tioM
axim
um B
ankf
ull D
Bankfull Discharge (m3/s)
0
0.1
0.2
0.3
0.4
0.5
0.6
0.7
0 2 4 6 8 10 12
Coe
ffic
ient
of V
aria
tion
for
Mea
n B
ankf
ull D
epth
Bankfull Discharge (m3/s)
R:\Active\_2005\1326\05-1326-031 NSERC\Final Reporting\Final Report\Main Report\Figures\Figures.xls Golder Associates

CONRAD December 2008 DFO - 55 - 05-1326-031
Golder Associates
Figure 5.4 illustrates the deviations from the reach-averaged bankfull width based on cross-sectional data from 2005 and 2006 reaches. The figure shows three curves that represent all of the data, data for streams with bankfull discharge greater than about 2 m3/s and streams with bankfull discharge greater than about 5 m3/s. The curves show that the deviation from the reach averaged bankfull width are smallest at about +20% ninety percent of the time (at 5 and 95 percentiles) for streams with discharges greater than 5 m3/s. These deviations are within +40% and -30% when all the data are used.
Uncertainty in Regime Plots
The best-fit line in Figure 5.2 illustrates the best approximation of the relationship between bankfull width and bankfull discharge based on the 2005 and 2006 data. The 75% confidence limit lines show the uncertainty around the best fit line predictions. For example, at a bankfull discharge equal to 1 m3/s the best approximation of the bankfull width is 4 m. However, at 75% confidence, the bankfull width lies between 2 and 9 m.
Effect of Channel Slope and Drainage Basin Surficial Geology
The influence of channel slope and drainage basin surficial geology conditions on bankfull width was analyzed because channel slope and bed material are two of the controlling factors of channel morphology. Since channel slope and bed material are two of the controlling factors of channel morphology, an attempt was made to assess the influence of upland/lowland channel slope and drainage basin surficial geology conditions on bankfull width. Results are shown in Figure 5.5 and 5.6 and illustrate that the distinction between upland and lowland channel slopes is not strong enough to warrant developing equations specific to channel slope. The distinctions between glaciofluvial and glaciolacustrine surface material are apparent, and indicate that the glaciolacustrine, clay-rich material has a more steeply sloping best fit line than the glaciofluvial, sand-rich material; however, there is insufficient data to warrant developing equations specific to surficial geology. Further investigations aimed at characterizing these channel variables based on these distinctions should be considered in future studies.
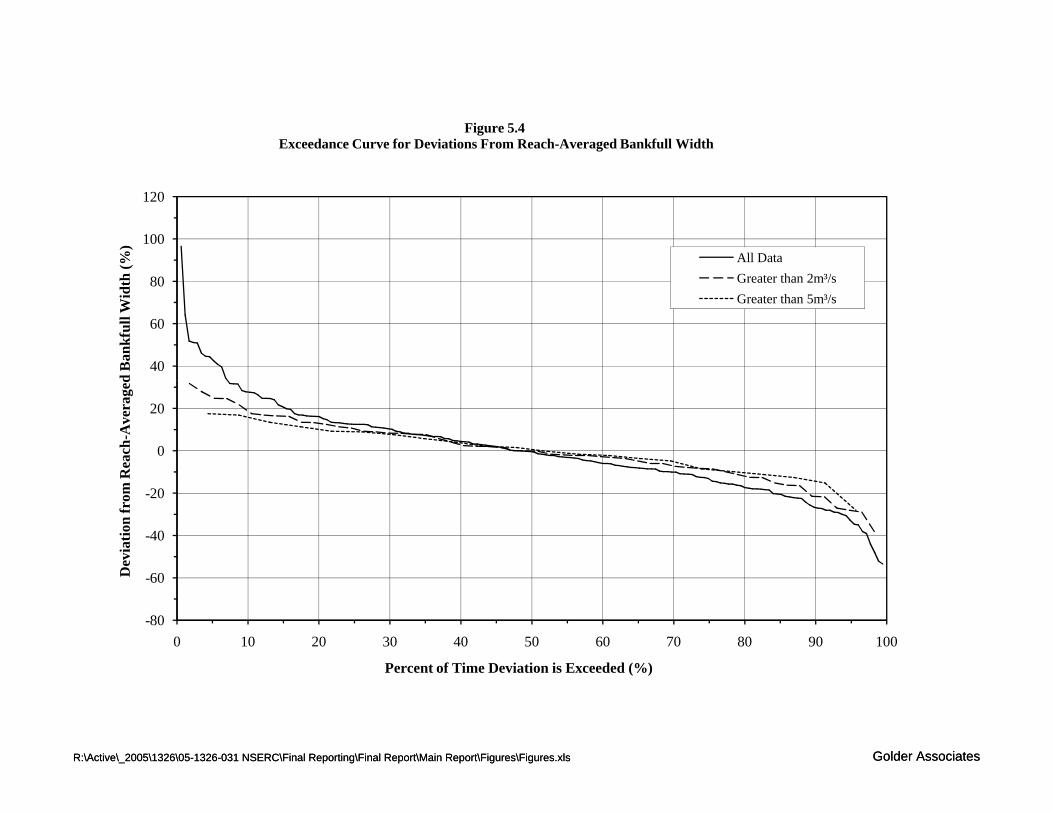
40
60
80
100
120
d B
ankf
ull W
idth
(%)
Figure 5.4Exceedance Curve for Deviations From Reach-Averaged Bankfull Width
All DataGreater than 2m³/sGreater than 5m³/s
R:\Active\_2005\1326\05-1326-031 NSERC\Final Reporting\Final Report\Main Report\Figures\Figures.xls Golder Associates
-80
-60
-40
-20
0
20
0 10 20 30 40 50 60 70 80 90 100
Dev
iatio
n fr
om R
each
-Ave
rage
d
Percent of Time Deviation is Exceeded (%)
R:\Active\_2005\1326\05-1326-031 NSERC\Final Reporting\Final Report\Main Report\Figures\Figures.xls Golder Associates
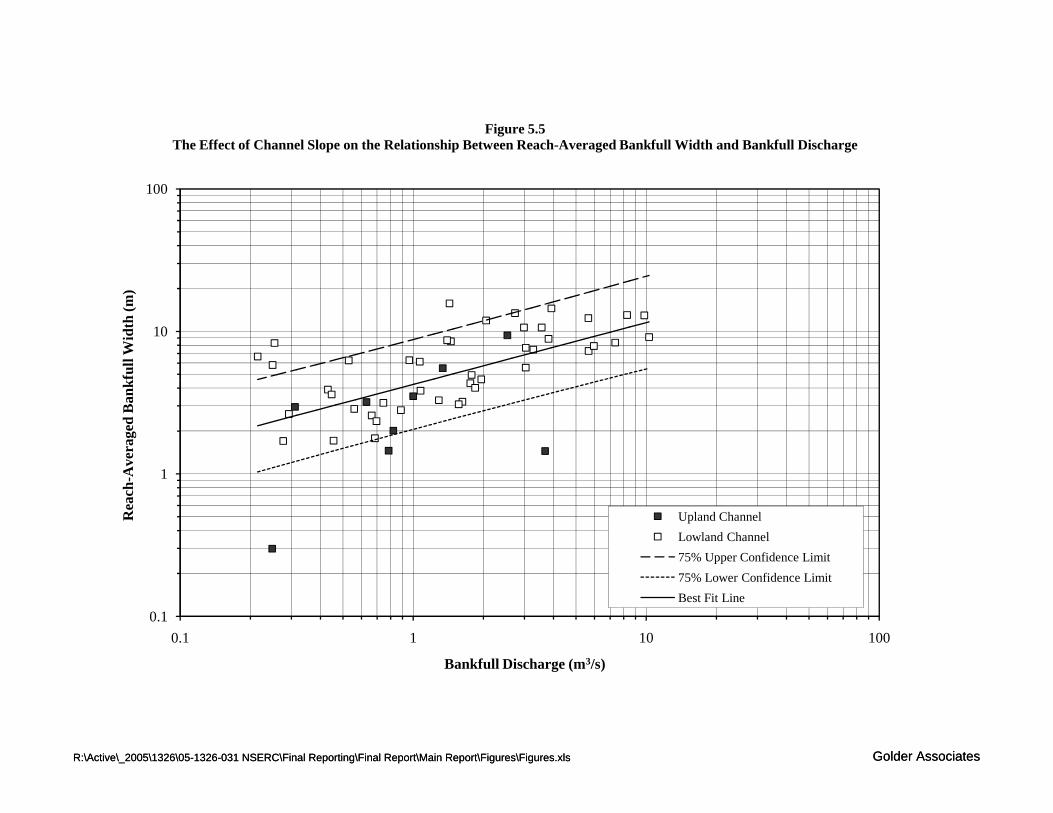
10
100
kful
l Wid
th (m
)Figure 5.5
The Effect of Channel Slope on the Relationship Between Reach-Averaged Bankfull Width and Bankfull Discharge
R:\Active\_2005\1326\05-1326-031 NSERC\Final Reporting\Final Report\Main Report\Figures\Figures.xls Golder Associates
0.1
1
0.1 1 10 100
Rea
ch-A
vera
ged
Ban
k
Bankfull Discharge (m3/s)
Upland ChannelLowland Channel75% Upper Confidence Limit75% Lower Confidence LimitBest Fit Line
R:\Active\_2005\1326\05-1326-031 NSERC\Final Reporting\Final Report\Main Report\Figures\Figures.xls Golder Associates
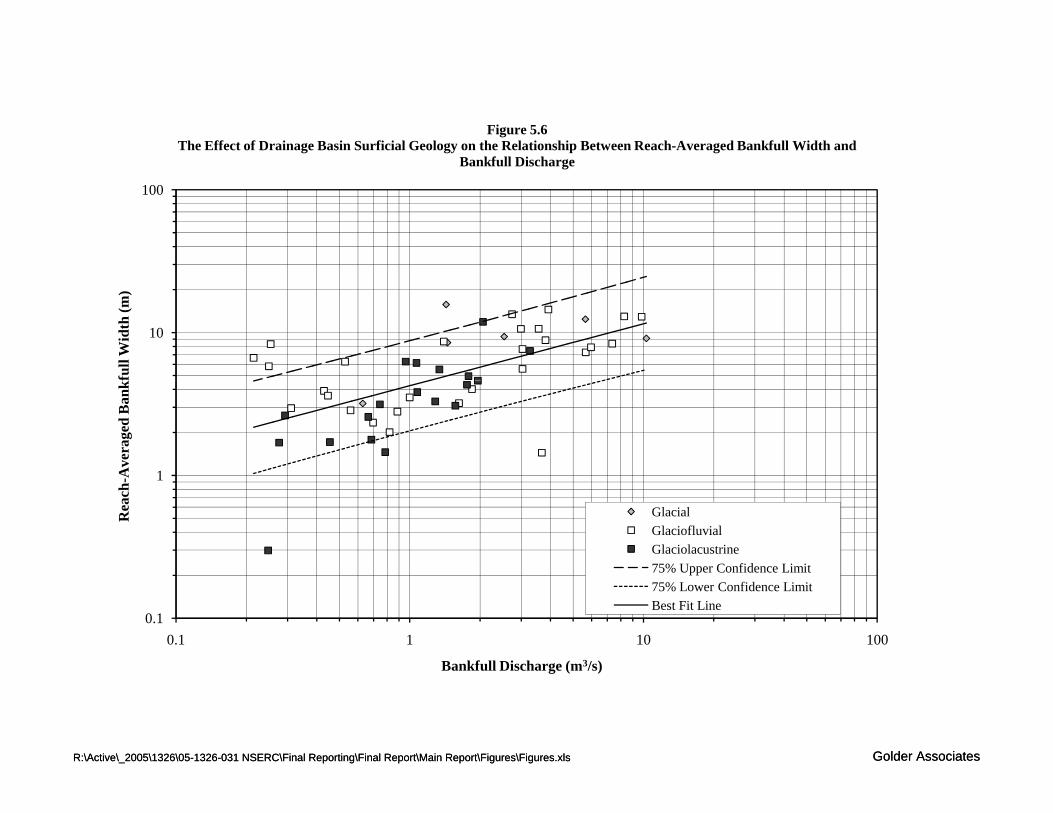
10
100
full
Wid
th (m
)Figure 5.6
The Effect of Drainage Basin Surficial Geology on the Relationship Between Reach-Averaged Bankfull Width and Bankfull Discharge
R:\Active\_2005\1326\05-1326-031 NSERC\Final Reporting\Final Report\Main Report\Figures\Figures.xls Golder Associates
0.1
1
0.1 1 10 100
Rea
ch-A
vera
ged
Ban
kf
Bankfull Discharge (m3/s)
GlacialGlaciofluvialGlaciolacustrine75% Upper Confidence Limit75% Lower Confidence LimitBest Fit Line
R:\Active\_2005\1326\05-1326-031 NSERC\Final Reporting\Final Report\Main Report\Figures\Figures.xls Golder Associates

CONRAD December 2008 DFO - 59 - 05-1326-031
Golder Associates
5.3.2 Maximum Bankfull Depth
Figure 5.7 shows the relationship between the reach-averaged maximum bankfull depth, bfh and bankfull discharge for 2005 and 2006 data collected during this study. The resulting equation is shown below:
Qbfbfh 38.06.0max
=
Figure 5.8 shows the relationship between the cross-sectional maximum bankfull depth and bankfull discharge for the entire database including pre-2005, 2005 and 2006 data. The resulting equation is shown below:
Qbfbfh 32.079.0max
=
As indicated by these two equations, the derived equations for the cross-sectional and reach-averaged maximum bankfull depth are similar, but the graph of maximum depths at specific cross-sections presents more scatter.

10
Ban
kful
l Dep
th (m
)Figure 5.7
Reach-Averaged Maximum Bankfull Depth Versus Bankfull Discharge
Qh bfbf
38.060.0
max=
R:\Active\_2005\1326\05-1326-031 NSERC\Final Reporting\Final Report\Main Report\Figures\Figures.xls Golder Associates
0.1
1
0.1 1 10 100
Rea
ch-A
vera
ged
Max
imum
Bankfull Discharge (m3/s)
2005 Data2006 Data75% Upper Confidence Limit75% Lower Confidence LimitBest Fit Line
R:\Active\_2005\1326\05-1326-031 NSERC\Final Reporting\Final Report\Main Report\Figures\Figures.xls Golder Associates
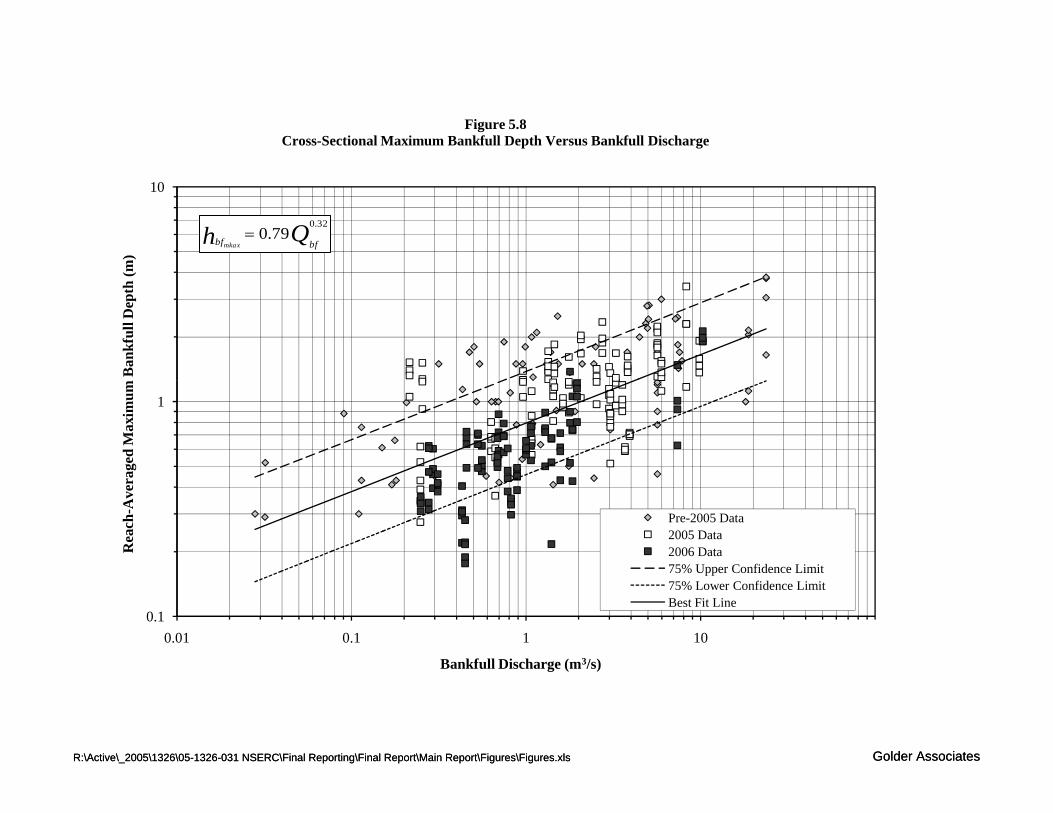
10
Ban
kful
l Dep
th (m
)Figure 5.8
Cross-Sectional Maximum Bankfull Depth Versus Bankfull Discharge
Qh bfbfmkax
32.079.0=
R:\Active\_2005\1326\05-1326-031 NSERC\Final Reporting\Final Report\Main Report\Figures\Figures.xls Golder Associates
0.1
1
0.01 0.1 1 10
Rea
ch-A
vera
ged
Max
imum
Bankfull Discharge (m3/s)
Pre-2005 Data2005 Data2006 Data75% Upper Confidence Limit75% Lower Confidence LimitBest Fit Line
R:\Active\_2005\1326\05-1326-031 NSERC\Final Reporting\Final Report\Main Report\Figures\Figures.xls Golder Associates
CONRAD December 2008 DFO - 62 - 05-1326-031
Golder Associates
Coefficient and Exponent Values
The OSR-specific equations for maximum bankfull depth show that the coefficients are on the upper end of the published range (0.1 to 0.93) and the exponents are on the lower end of the published range (0.27 to 0.43). This suggests that OSR streams are up to 50% deeper in comparison to the majority of streams for which regime equations have been developed.
Variability and Uncertainty
The 75% confidence limit curves are plotted on Figures 5.7 and 5.8. The confidence limit curves on Figure 5.8 are more widely spread indicating that the confidence interval for determining the cross-sectional maximum bankfull depth for a given bankfull discharge is larger than the confidence interval for determining the reach-averaged maximum bankfull depth. The 75% confidence limit curves shown in Figures 5.7 correspond approximately to + 80% and -60% deviations from the best-fit line.
The discussion of scatter in the regime plots in Section 5.3.1 can be applied to maximum bankfull depth. The coefficient of variation for maximum bankfull depth appears to be independent of bankfull discharge as shown on Figure 5.3. This indicates that the variation of maximum bankfull depth along a stream reach is similar for all 2005 and 2006 discharges. Figure 5.9 shows the exceedance curve for deviations from the reach-averaged maximum bankfull depth based on 2005 and 2006 data. The curve shows that the deviations are within ±30% ninety percent of the time (at 5th and 95th percentiles).
The degree of uncertainty in predicting the reach-averaged maximum bankfull depth is shown by the 75% confidence limit curves in Figure 5.7. For a bankfull discharge of 1 m3/s, one can be 75% confident that the maximum bankfull depth will be between 0.5 and 1.3 m.
Effect Channel Slope and Drainage Basin Surficial Geology
Figures 5.10 and 5.11 show the effects of channel slope and drainage basin surficial geology on the relationship between reach-averaged maximum bankfull depth and bankfull discharge. Similar to the discussion for channel bankfull width in section 5.3.1, the effects of channel slope are weak for this relationship and, while the results suggest some differences in the effects of surficial material, the data is not sufficient to develop regime relationships specific to surficial geology.
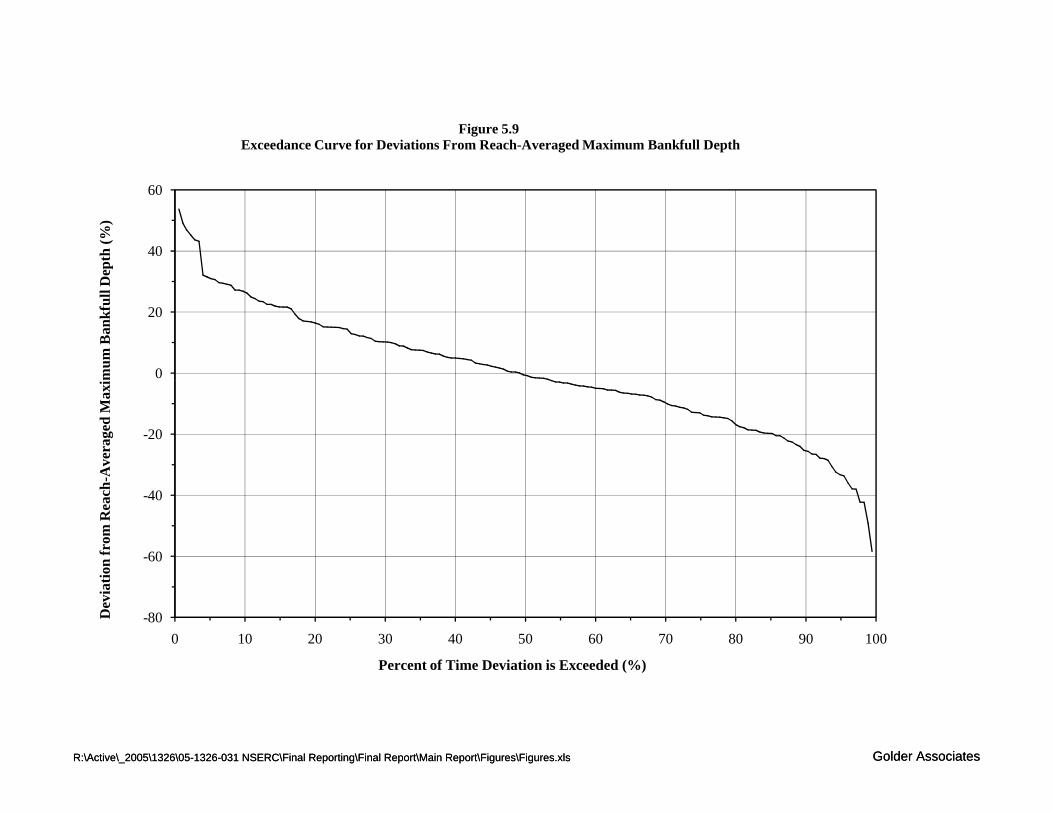
0
20
40
60
mum
Ban
kful
l Dep
th (%
)Figure 5.9
Exceedance Curve for Deviations From Reach-Averaged Maximum Bankfull Depth
R:\Active\_2005\1326\05-1326-031 NSERC\Final Reporting\Final Report\Main Report\Figures\Figures.xls Golder Associates
-80
-60
-40
-20
0 10 20 30 40 50 60 70 80 90 100
Dev
iatio
n fr
om R
each
-Ave
rage
d M
axi
Percent of Time Deviation is Exceeded (%)
R:\Active\_2005\1326\05-1326-031 NSERC\Final Reporting\Final Report\Main Report\Figures\Figures.xls Golder Associates
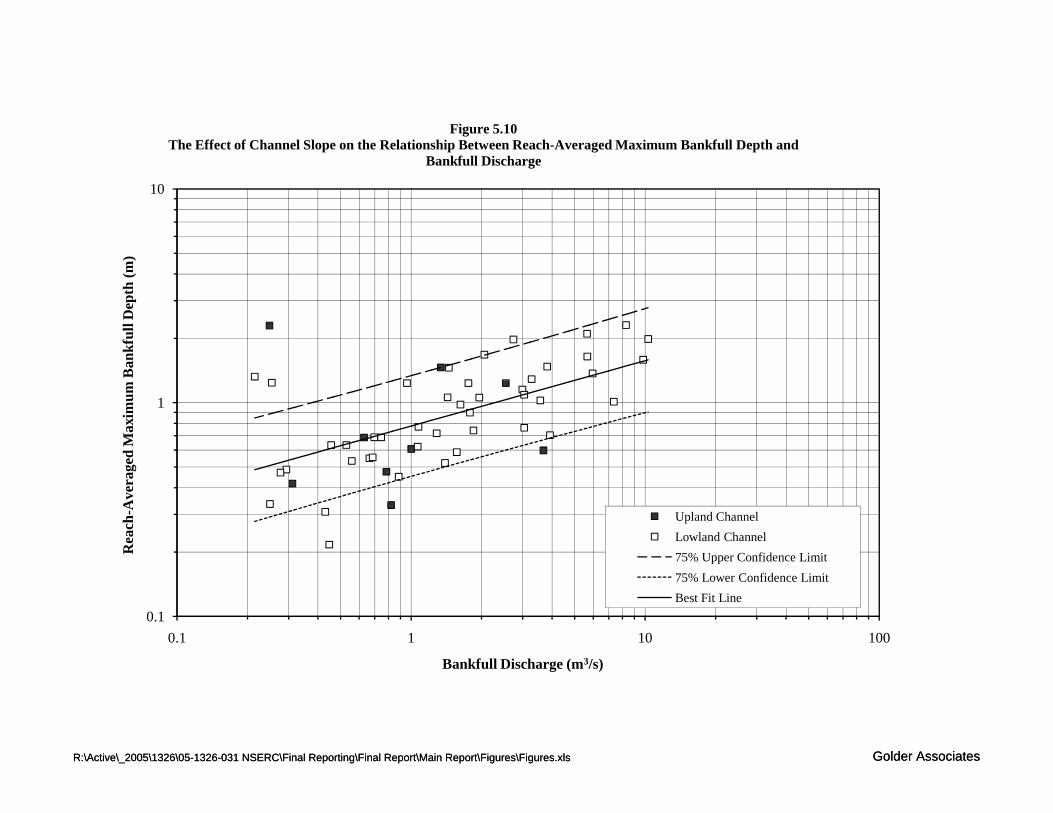
10
Ban
kful
l Dep
th (m
)Figure 5.10
The Effect of Channel Slope on the Relationship Between Reach-Averaged Maximum Bankfull Depth and Bankfull Discharge
R:\Active\_2005\1326\05-1326-031 NSERC\Final Reporting\Final Report\Main Report\Figures\Figures.xls Golder Associates
0.1
1
0.1 1 10 100
Rea
ch-A
vera
ged
Max
imum
Bankfull Discharge (m3/s)
Upland ChannelLowland Channel75% Upper Confidence Limit75% Lower Confidence LimitBest Fit Line
R:\Active\_2005\1326\05-1326-031 NSERC\Final Reporting\Final Report\Main Report\Figures\Figures.xls Golder Associates
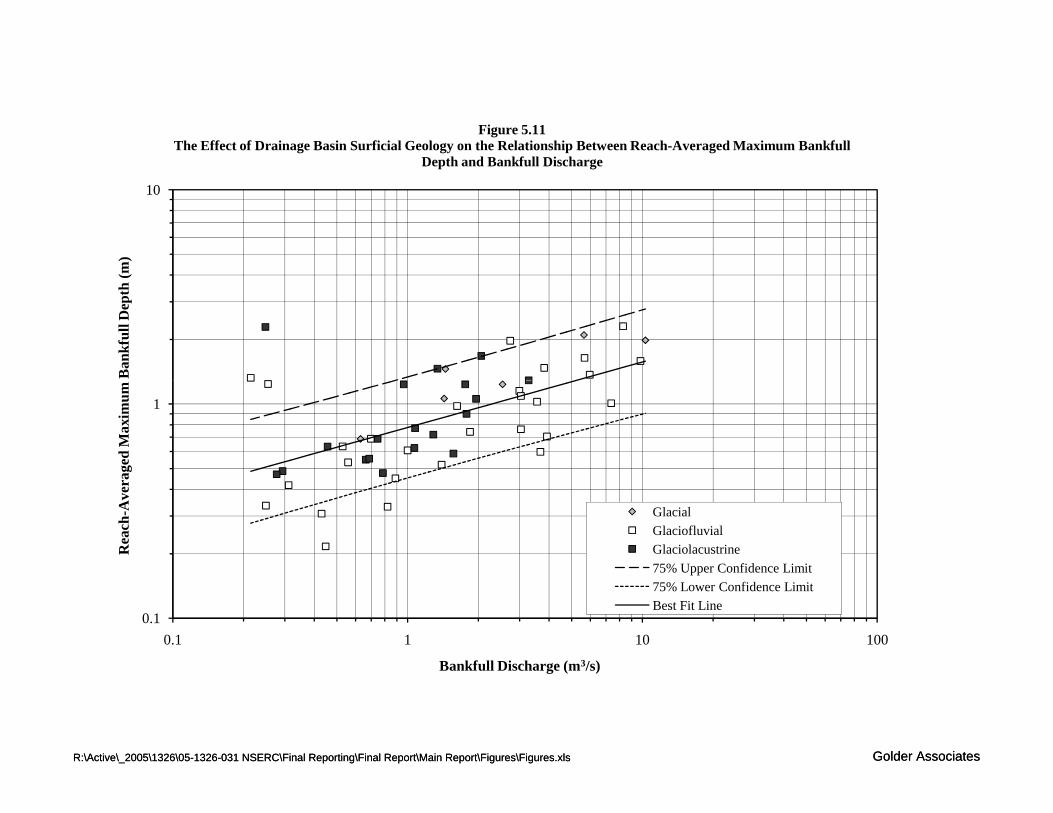
10
Ban
kful
l Dep
th (m
)Figure 5.11
The Effect of Drainage Basin Surficial Geology on the Relationship Between Reach-Averaged Maximum Bankfull Depth and Bankfull Discharge
R:\Active\_2005\1326\05-1326-031 NSERC\Final Reporting\Final Report\Main Report\Figures\Figures.xls Golder Associates
0.1
1
0.1 1 10 100
Rea
ch-A
vera
ged
Max
imum
Bankfull Discharge (m3/s)
GlacialGlaciofluvialGlaciolacustrine75% Upper Confidence Limit75% Lower Confidence LimitBest Fit Line
R:\Active\_2005\1326\05-1326-031 NSERC\Final Reporting\Final Report\Main Report\Figures\Figures.xls Golder Associates
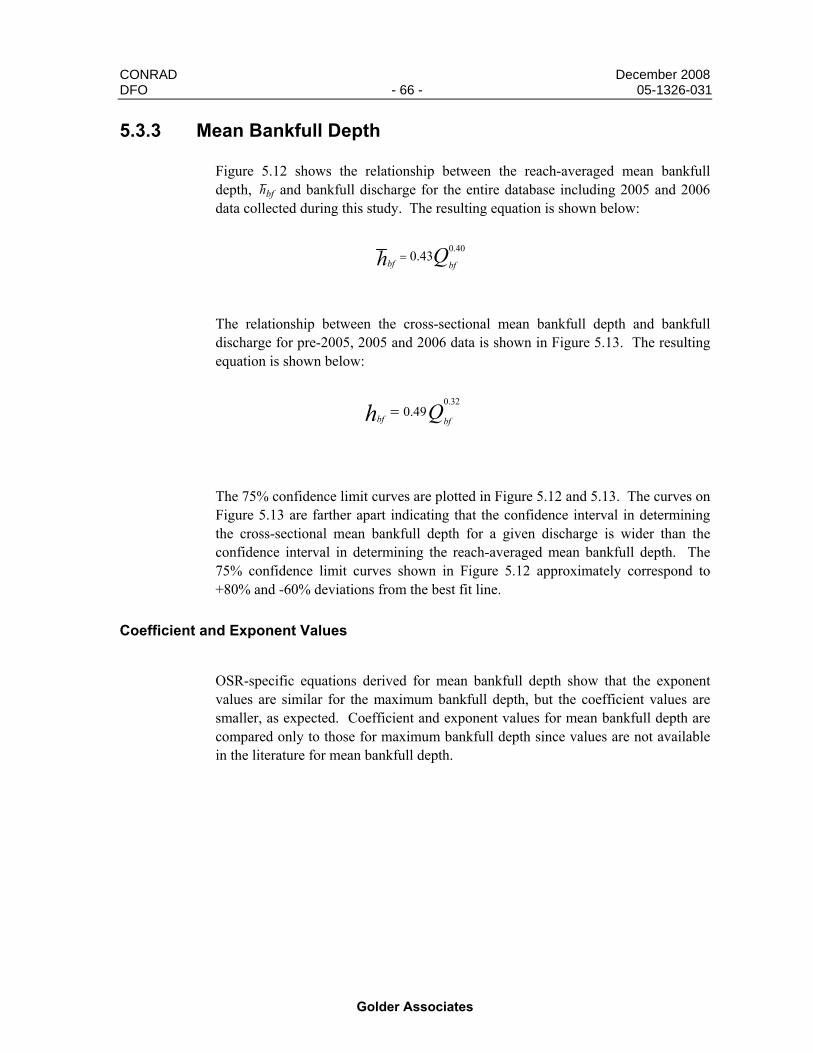
CONRAD December 2008 DFO - 66 - 05-1326-031
Golder Associates
5.3.3 Mean Bankfull Depth
Figure 5.12 shows the relationship between the reach-averaged mean bankfull depth, bfh and bankfull discharge for the entire database including 2005 and 2006 data collected during this study. The resulting equation is shown below:
Qh bfbf
40.043.0=
The relationship between the cross-sectional mean bankfull depth and bankfull discharge for pre-2005, 2005 and 2006 data is shown in Figure 5.13. The resulting equation is shown below:
Qbfbfh32.0
49.0=
The 75% confidence limit curves are plotted in Figure 5.12 and 5.13. The curves on Figure 5.13 are farther apart indicating that the confidence interval in determining the cross-sectional mean bankfull depth for a given discharge is wider than the confidence interval in determining the reach-averaged mean bankfull depth. The 75% confidence limit curves shown in Figure 5.12 approximately correspond to +80% and -60% deviations from the best fit line.
Coefficient and Exponent Values
OSR-specific equations derived for mean bankfull depth show that the exponent values are similar for the maximum bankfull depth, but the coefficient values are smaller, as expected. Coefficient and exponent values for mean bankfull depth are compared only to those for maximum bankfull depth since values are not available in the literature for mean bankfull depth.

10
ankf
ull D
epth
(m)
Figure 5.12Reach-Averaged Mean Bankfull Depth and Bankfull Discharge
2005 Data2006 Data75% Lower Confidence Limit75% Upper Confidence LimitBest Fit Line
Qh bfbf
40.043.0=
R:\Active\_2005\1326\05-1326-031 NSERC\Final Reporting\Final Report\Main Report\Figures\Figures.xls Golder Associates
0.1
1
0.1 1 10 100
Rea
ch-A
vera
ged
Mea
n B
a
Bankfull Discharge (m3/s)
R:\Active\_2005\1326\05-1326-031 NSERC\Final Reporting\Final Report\Main Report\Figures\Figures.xls Golder Associates
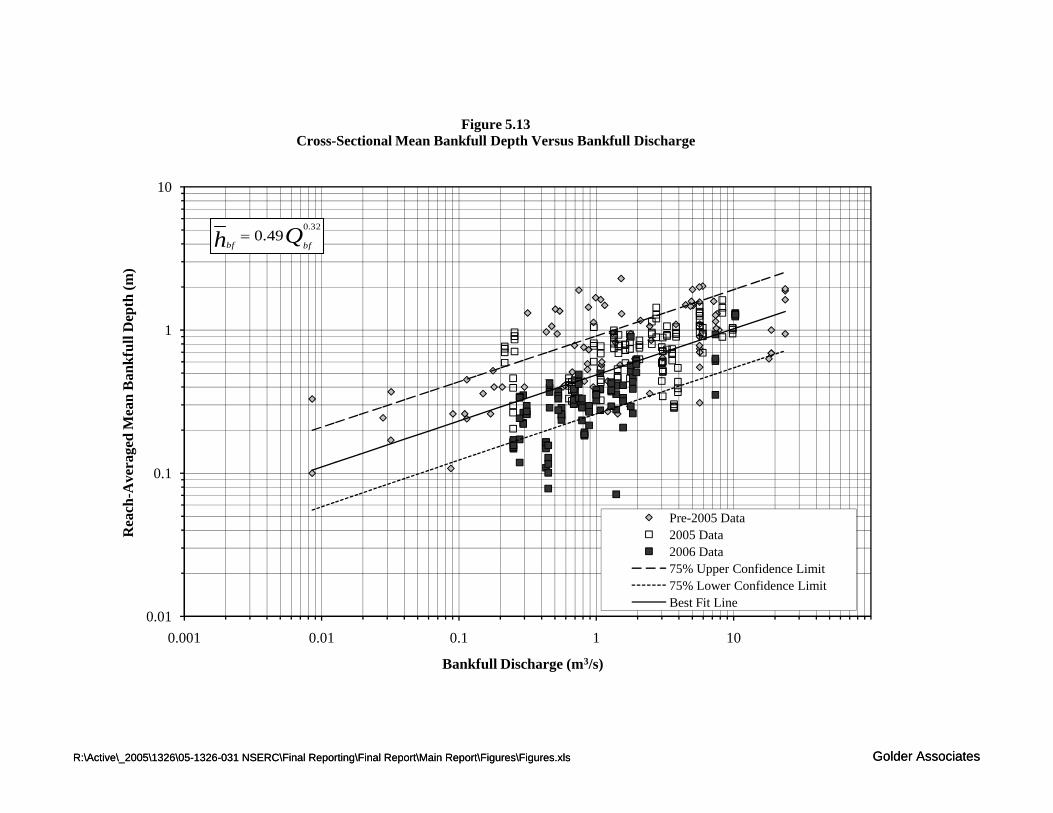
1
10
ankf
ull D
epth
(m)
Figure 5.13Cross-Sectional Mean Bankfull Depth Versus Bankfull Discharge
Qh bfbf
32.049.0=
R:\Active\_2005\1326\05-1326-031 NSERC\Final Reporting\Final Report\Main Report\Figures\Figures.xls Golder Associates
0.01
0.1
0.001 0.01 0.1 1 10
Rea
ch-A
vera
ged
Mea
n B
Bankfull Discharge (m3/s)
Pre-2005 Data2005 Data2006 Data75% Upper Confidence Limit75% Lower Confidence LimitBest Fit Line
R:\Active\_2005\1326\05-1326-031 NSERC\Final Reporting\Final Report\Main Report\Figures\Figures.xls Golder Associates
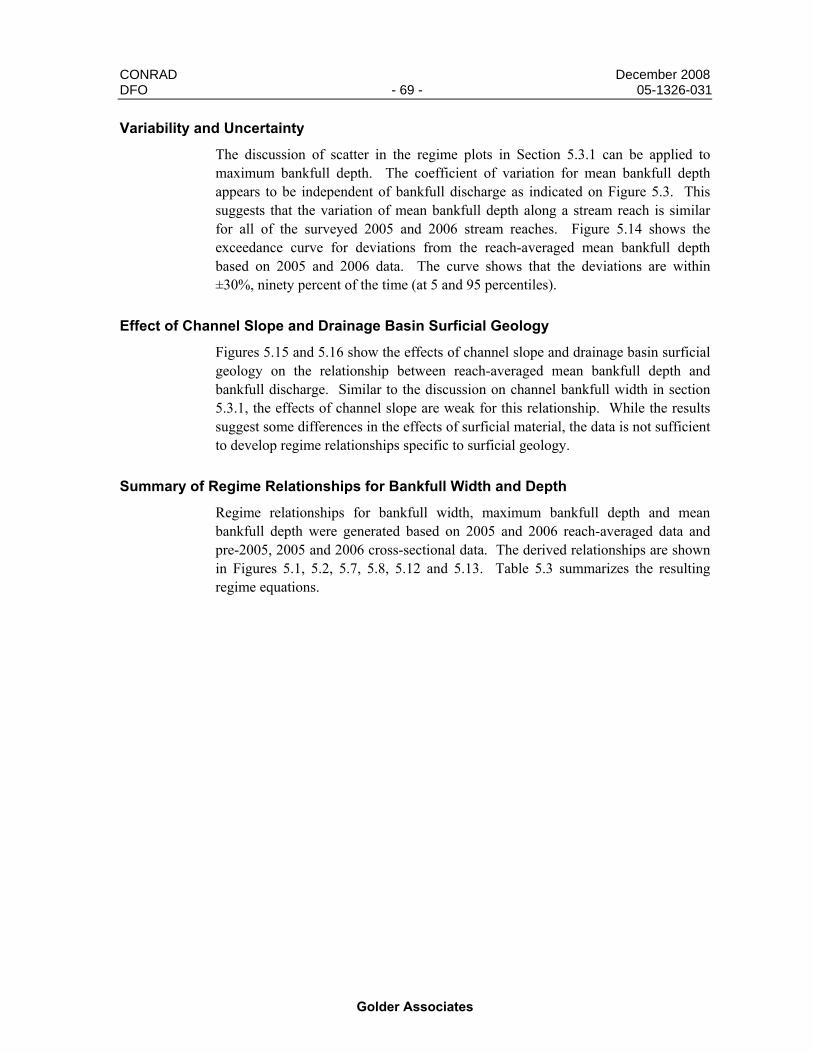
CONRAD December 2008 DFO - 69 - 05-1326-031
Golder Associates
Variability and Uncertainty
The discussion of scatter in the regime plots in Section 5.3.1 can be applied to maximum bankfull depth. The coefficient of variation for mean bankfull depth appears to be independent of bankfull discharge as indicated on Figure 5.3. This suggests that the variation of mean bankfull depth along a stream reach is similar for all of the surveyed 2005 and 2006 stream reaches. Figure 5.14 shows the exceedance curve for deviations from the reach-averaged mean bankfull depth based on 2005 and 2006 data. The curve shows that the deviations are within ±30%, ninety percent of the time (at 5 and 95 percentiles).
Effect of Channel Slope and Drainage Basin Surficial Geology
Figures 5.15 and 5.16 show the effects of channel slope and drainage basin surficial geology on the relationship between reach-averaged mean bankfull depth and bankfull discharge. Similar to the discussion on channel bankfull width in section 5.3.1, the effects of channel slope are weak for this relationship. While the results suggest some differences in the effects of surficial material, the data is not sufficient to develop regime relationships specific to surficial geology.
Summary of Regime Relationships for Bankfull Width and Depth
Regime relationships for bankfull width, maximum bankfull depth and mean bankfull depth were generated based on 2005 and 2006 reach-averaged data and pre-2005, 2005 and 2006 cross-sectional data. The derived relationships are shown in Figures 5.1, 5.2, 5.7, 5.8, 5.12 and 5.13. Table 5.3 summarizes the resulting regime equations.
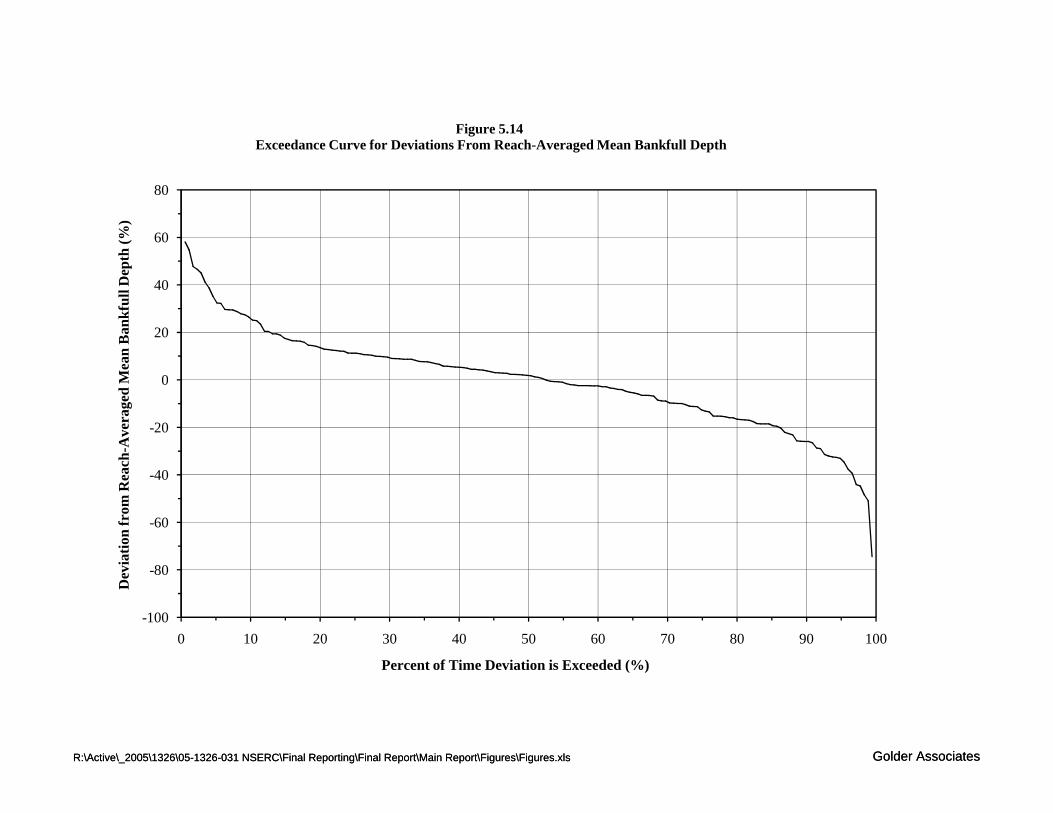
0
20
40
60
80
Mea
n B
ankf
ull D
epth
(%)
Figure 5.14Exceedance Curve for Deviations From Reach-Averaged Mean Bankfull Depth
R:\Active\_2005\1326\05-1326-031 NSERC\Final Reporting\Final Report\Main Report\Figures\Figures.xls Golder Associates
-100
-80
-60
-40
-20
0
0 10 20 30 40 50 60 70 80 90 100
Dev
iatio
n fr
om R
each
-Ave
rage
d M
Percent of Time Deviation is Exceeded (%)
R:\Active\_2005\1326\05-1326-031 NSERC\Final Reporting\Final Report\Main Report\Figures\Figures.xls Golder Associates
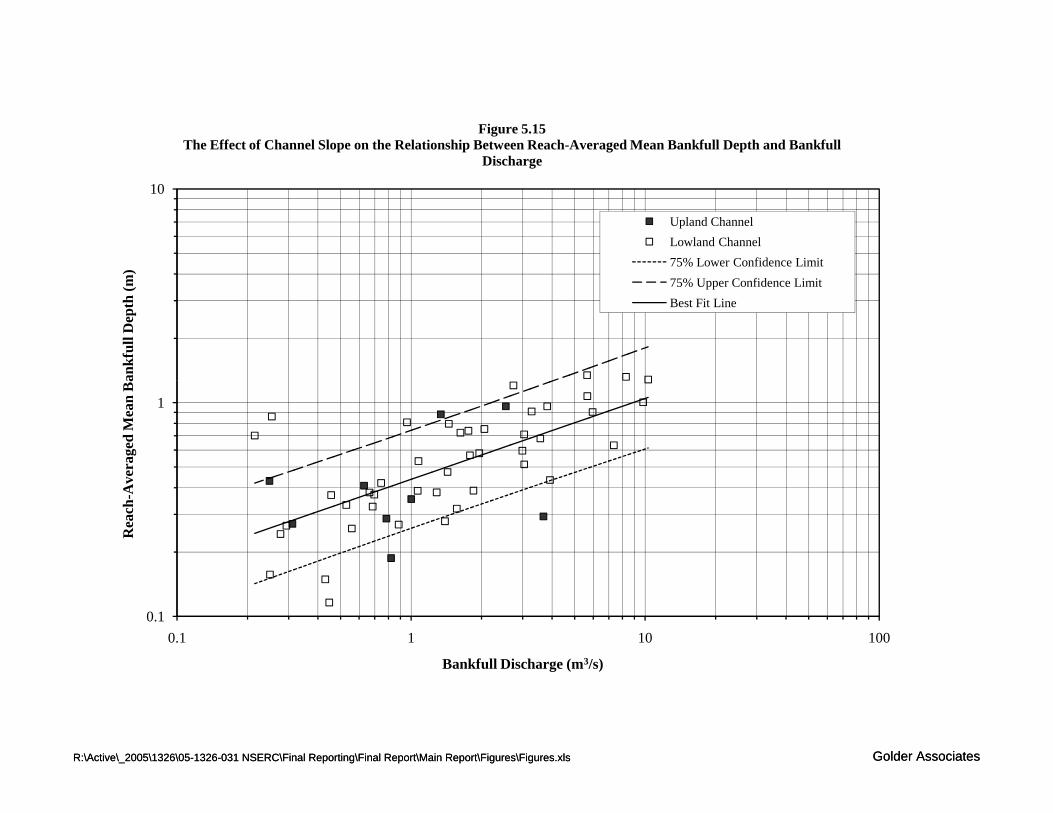
10
ankf
ull D
epth
(m)
Figure 5.15The Effect of Channel Slope on the Relationship Between Reach-Averaged Mean Bankfull Depth and Bankfull
Discharge
Upland ChannelLowland Channel75% Lower Confidence Limit75% Upper Confidence LimitBest Fit Line
R:\Active\_2005\1326\05-1326-031 NSERC\Final Reporting\Final Report\Main Report\Figures\Figures.xls Golder Associates
0.1
1
0.1 1 10 100
Rea
ch-A
vera
ged
Mea
n B
a
Bankfull Discharge (m3/s)
R:\Active\_2005\1326\05-1326-031 NSERC\Final Reporting\Final Report\Main Report\Figures\Figures.xls Golder Associates
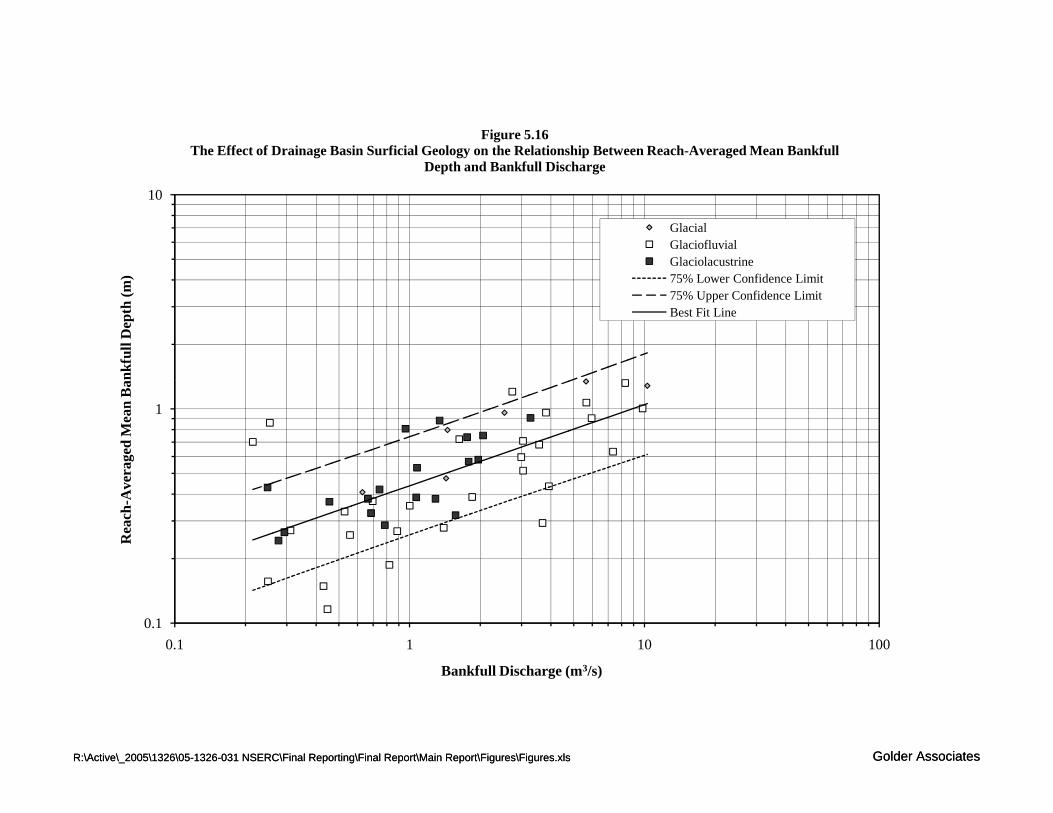
10
nkfu
ll D
epth
(m)
Figure 5.16The Effect of Drainage Basin Surficial Geology on the Relationship Between Reach-Averaged Mean Bankfull
Depth and Bankfull Discharge
GlacialGlaciofluvialGlaciolacustrine75% Lower Confidence Limit75% Upper Confidence LimitBest Fit Line
R:\Active\_2005\1326\05-1326-031 NSERC\Final Reporting\Final Report\Main Report\Figures\Figures.xls Golder Associates
0.1
1
0.1 1 10 100
Rea
ch-A
vera
ged
Mea
n B
a
Bankfull Discharge (m3/s)
R:\Active\_2005\1326\05-1326-031 NSERC\Final Reporting\Final Report\Main Report\Figures\Figures.xls Golder Associates
CONRAD December 2008 DFO - 73 - 05-1326-031
Golder Associates
Table 5.3: OSR-Specific Regime Equations for Bankfull Width and Depth
Channel Variable Reach-Averaged Regime Equations
Cross-Sectional Regime Equations
Bankfull Width, Bbf Qbf
43.02.4 Qbf40.04.4
Maximum Bankfull Depth,
maxhbf Qbf38.060.0 Qbf
32.079.0
Mean Bankfull Depth, hbf Qbf
40.043.0 Qbf32.049.0
5.3.4 Channel Slope
Figure 5.17 illustrates the relationship between channel slope and bankfull discharge in the OSR. The plot is based on data from the OSR as well as from the literature. Most of the data from the OSR study sites represent sand bed material conditions (Figure 5.17). This reflects the absence of gravels, cobbles and boulders in most of the near-surface material, the study’s focus on smaller streams (typically less than 150 km2 in area) and the focus on representative streams at common mine site areas located above the escarpment of the Athabasca River valley.
As expected, some data from the literature appear to be inconsistent with the OSR data and with one another. This inconsistency is due to unique geomorphic and hydrologic conditions at the study sites and possibly due to different sampling methods. One of the principal causes of inconsistent bed material conditions is variability in bed material supply. A stream with abundant gravel bed material supply will likely have a highly mobile gravel bed. Another stream with equal gradient and no gravel bed material supply may be armoured with larger remnant cobbles or boulders from local deposits left in place as the channel bed was degraded and smaller material was transported downstream.
The threshold boundary on Figure 5.17 also approximates the calculated initiation of motion of sand particles on the channel bed at bankfull discharge. On this basis, the bankfull discharge would typically cause minimal bed material motion, which is desirable for stable alluvial channels. The threshold for bed material size in Figure 5.17 illustrates the apparent stable upper limit of sand-sized material for which data was collected in the OSR. A designer may choose to use gravel-sized and larger material to afford a higher channel slope while maintaining a stable morphology without detrimental erosion. However, such a measure should take account of bed material supply of gravel or cobbles, since such armour material could be removed without natural replacement. Channels lined with sand-sized and smaller material must have flat slopes, such as those below the threshold line on Figure 5.17, to maintain their morphology.
CONRAD December 2008 DFO - 74 - 05-1326-031
Golder Associates
Flow in streams with steeper slopes will have relatively high velocity that will remove fine material from the bed. Fine material is eroded from the bed in these streams, leaving larger bed material behind as channel armour. In lowland streams, slope and flow velocity are relatively low such that fine material eroded from upland, headwater streams is deposited during low flows. This remnant or deposited material represents a large proportion of the bed material that was observed at study sites.
OSR data was used to develop the threshold slope condition for sand-sized material. Larger material was not present at most of the study sites. Although it may be necessary for geomorphic design of permanent channels in the OSR, a relationship between bankfull discharge and channel slope for material larger than sand is not evident on Figure 5.17 for ISR conditions. In the absence of study site data on steep channels with large material in the OSR, Figure 5.17 was supplemented with data published in the literature (Griffiths 1981; Hey and Thorne 1986; Page and Carden 1998; Emmett and Wolman 2001; Wohl and Merritt 2001). The data from the literature demonstrates in part the inconsistency of channel armour conditions that are strongly governed by bed material supply conditions rather than channel slope. This data from the literature should not be used to design alluvial channels in the OSR.
Figure 5.17 does not provide guidance for channel design above illustrated the threshold for sand-sized material. The data above this threshold is from the literature and is included in the plot to demonstrate the inconsistency of channel armour occurrence in the natural environment that reflects highly variable bed material supply conditions.
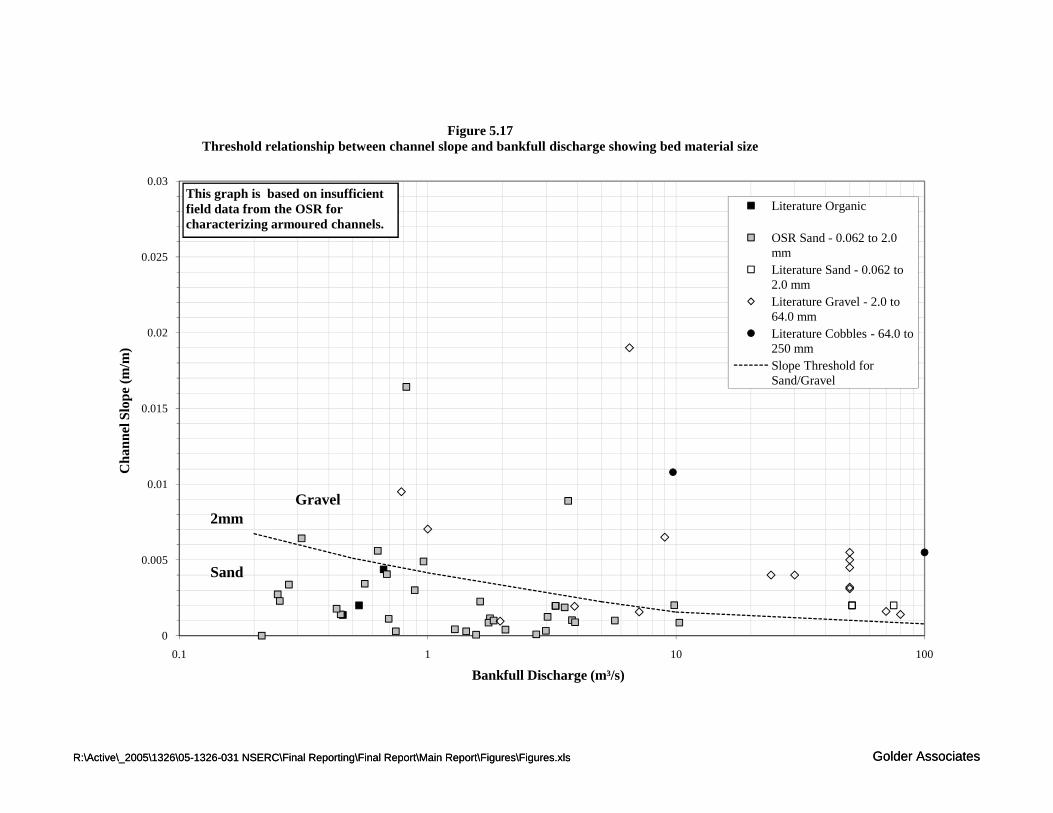
0.02
0.025
0.03
(m/m
)Figure 5.17
Threshold relationship between channel slope and bankfull discharge showing bed material size
Literature Organic
OSR Sand - 0.062 to 2.0 mmLiterature Sand - 0.062 to 2.0 mmLiterature Gravel - 2.0 to 64.0 mmLiterature Cobbles - 64.0 to 250 mmSlope Threshold for Sand/Gravel
This graph is based on insufficient field data from the OSR for characterizing armoured channels.
R:\Active\_2005\1326\05-1326-031 NSERC\Final Reporting\Final Report\Main Report\Figures\Figures.xls Golder Associates
0
0.005
0.01
0.015
0.1 1 10 100
Cha
nnel
Slo
pe (
Bankfull Discharge (m³/s)
Sand/Gravel
Sand
Gravel2mm
R:\Active\_2005\1326\05-1326-031 NSERC\Final Reporting\Final Report\Main Report\Figures\Figures.xls Golder Associates
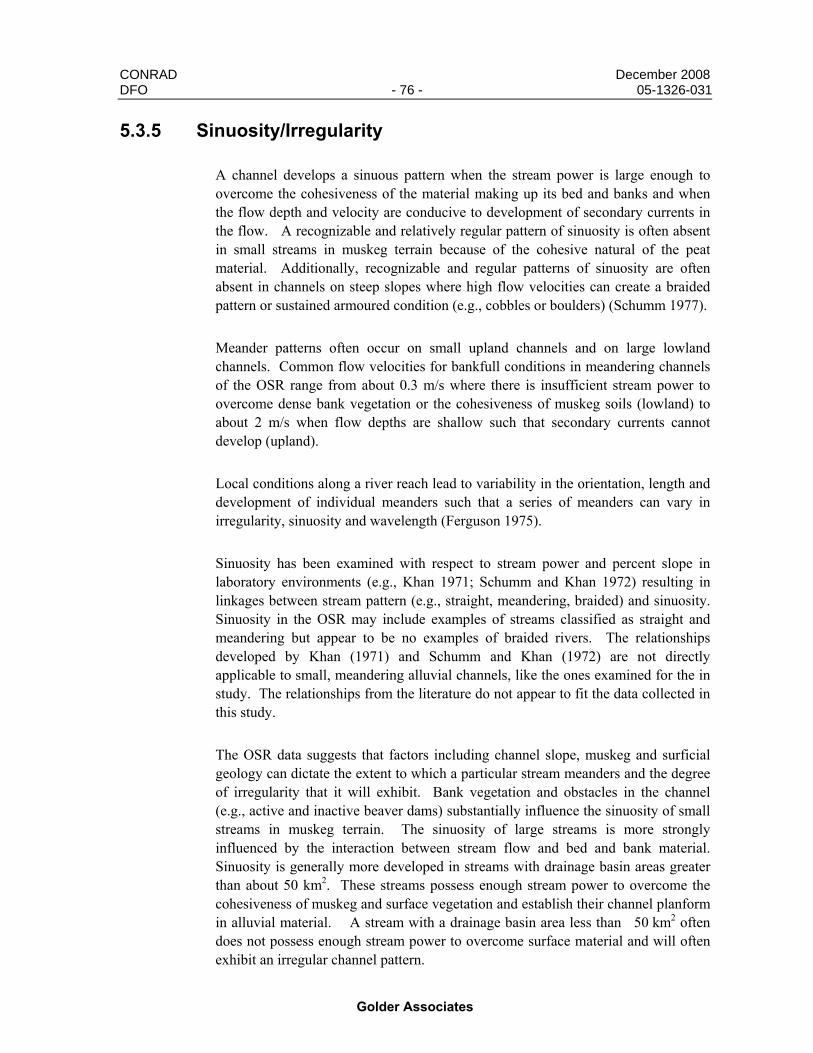
CONRAD December 2008 DFO - 76 - 05-1326-031
Golder Associates
5.3.5 Sinuosity/Irregularity
A channel develops a sinuous pattern when the stream power is large enough to overcome the cohesiveness of the material making up its bed and banks and when the flow depth and velocity are conducive to development of secondary currents in the flow. A recognizable and relatively regular pattern of sinuosity is often absent in small streams in muskeg terrain because of the cohesive natural of the peat material. Additionally, recognizable and regular patterns of sinuosity are often absent in channels on steep slopes where high flow velocities can create a braided pattern or sustained armoured condition (e.g., cobbles or boulders) (Schumm 1977).
Meander patterns often occur on small upland channels and on large lowland channels. Common flow velocities for bankfull conditions in meandering channels of the OSR range from about 0.3 m/s where there is insufficient stream power to overcome dense bank vegetation or the cohesiveness of muskeg soils (lowland) to about 2 m/s when flow depths are shallow such that secondary currents cannot develop (upland).
Local conditions along a river reach lead to variability in the orientation, length and development of individual meanders such that a series of meanders can vary in irregularity, sinuosity and wavelength (Ferguson 1975).
Sinuosity has been examined with respect to stream power and percent slope in laboratory environments (e.g., Khan 1971; Schumm and Khan 1972) resulting in linkages between stream pattern (e.g., straight, meandering, braided) and sinuosity. Sinuosity in the OSR may include examples of streams classified as straight and meandering but appear to be no examples of braided rivers. The relationships developed by Khan (1971) and Schumm and Khan (1972) are not directly applicable to small, meandering alluvial channels, like the ones examined for the in study. The relationships from the literature do not appear to fit the data collected in this study.
The OSR data suggests that factors including channel slope, muskeg and surficial geology can dictate the extent to which a particular stream meanders and the degree of irregularity that it will exhibit. Bank vegetation and obstacles in the channel (e.g., active and inactive beaver dams) substantially influence the sinuosity of small streams in muskeg terrain. The sinuosity of large streams is more strongly influenced by the interaction between stream flow and bed and bank material. Sinuosity is generally more developed in streams with drainage basin areas greater than about 50 km2. These streams possess enough stream power to overcome the cohesiveness of muskeg and surface vegetation and establish their channel planform in alluvial material. A stream with a drainage basin area less than 50 km2 often does not possess enough stream power to overcome surface material and will often exhibit an irregular channel pattern.
CONRAD December 2008 DFO - 77 - 05-1326-031
Golder Associates
About half of the data collected in 2005 and 2006 are from streams with drainage basin area less than 50 km2. Many of the streams exhibit irregular sinuosity. These sites are assigned an apparent sinuosity value in the same way as streams with regular patterns. They are included in the assessment of sinuosity even though their planform pattern is irregular instead of sinuous. In addition to these data, selected sites from the pre-2005 data and several Environment Canada sites located on large rivers with well-developed sinuosity were included in the assessment of sinuosity in the OSR and the development of the regime relationship. These selected sites were included in the assessment of sinuosity because they have recognizable patterns of sinuosity that are associated with significant stream power.
Sinuosity values were determined by manual measurements from maps. Sinuosity measurements range from 1.00 to 2.91 in the OSR. These data were plotted against bankfull discharge on two charts showing data divided by collection date and by drainage basin area as shown in Figures 5.18 and 5.19. The plots include all of the 2005 and 2006 data and the resulting equation is shown below:
QP bf
11.02.1=
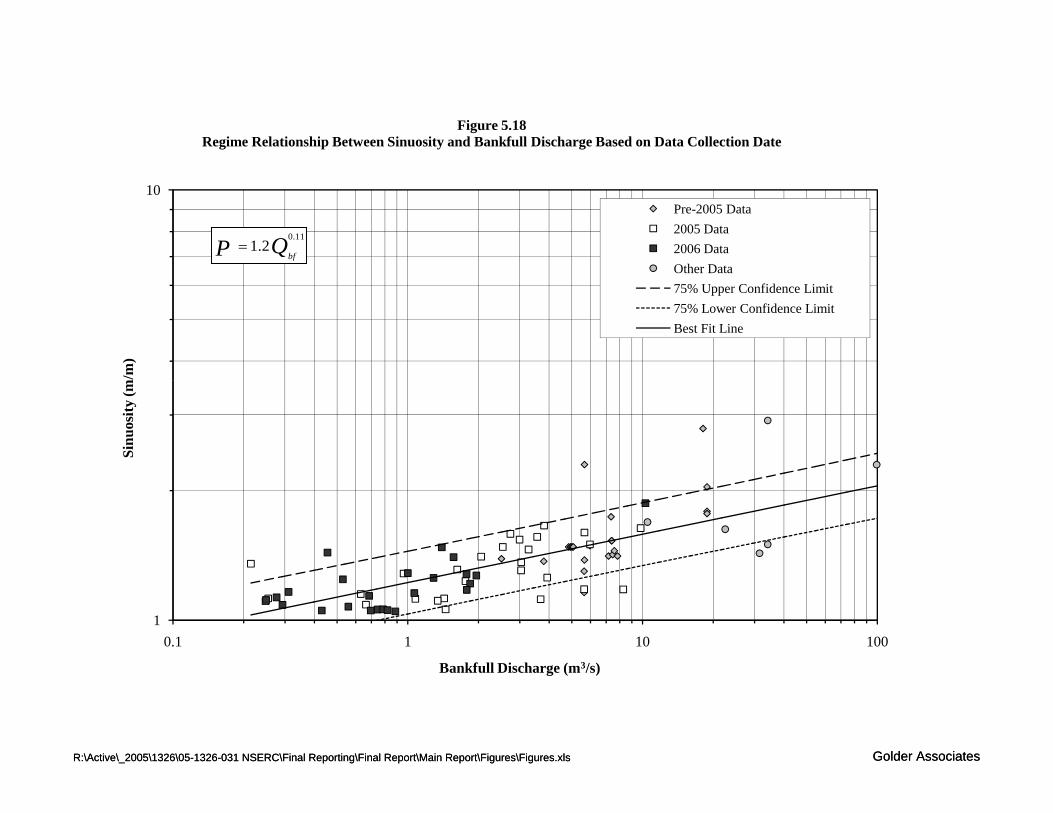
10
m/m
)Figure 5.18
Regime Relationship Between Sinuosity and Bankfull Discharge Based on Data Collection Date
Pre-2005 Data2005 Data2006 DataOther Data75% Upper Confidence Limit75% Lower Confidence LimitBest Fit Line
QP bf
11.02.1=
R:\Active\_2005\1326\05-1326-031 NSERC\Final Reporting\Final Report\Main Report\Figures\Figures.xls Golder Associates
10.1 1 10 100
Sinu
osity
(m
Bankfull Discharge (m3/s)
R:\Active\_2005\1326\05-1326-031 NSERC\Final Reporting\Final Report\Main Report\Figures\Figures.xls Golder Associates

10
/m)Figure 5.19
Regime Relationship Between Sinuosity and Bankfull Discharge Based on Drainage Basin Area
Drainage Area Less than 50km2 (Irregular)
Drainage Area Greater than 50km2 (Sinuous)
75% Upper Confidence Limit
75% Lower Confidence Limit
Best Fit Line
QP bf
11.02.1=
R:\Active\_2005\1326\05-1326-031 NSERC\Final Reporting\Final Report\Main Report\Figures\Figures.xls Golder Associates
10.1 1 10 100
Sinu
osity
(m/
Bankfull Discharge (m3/s)
R:\Active\_2005\1326\05-1326-031 NSERC\Final Reporting\Final Report\Main Report\Figures\Figures.xls Golder Associates
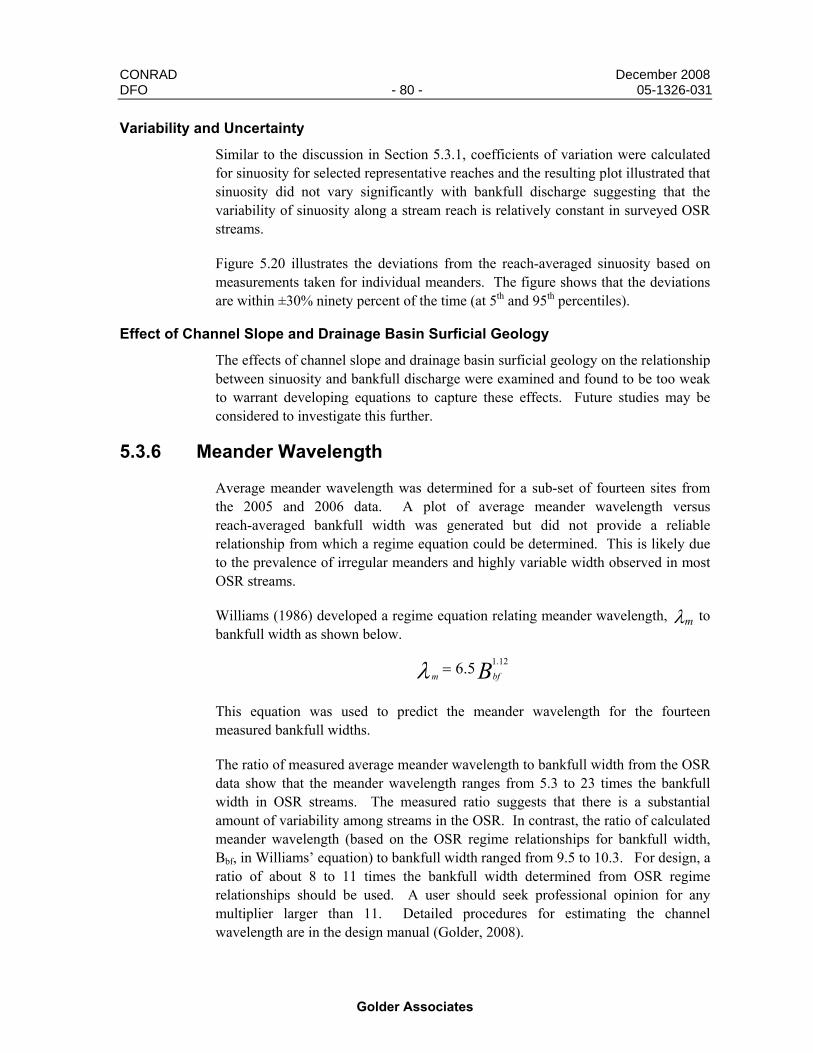
CONRAD December 2008 DFO - 80 - 05-1326-031
Golder Associates
Variability and Uncertainty
Similar to the discussion in Section 5.3.1, coefficients of variation were calculated for sinuosity for selected representative reaches and the resulting plot illustrated that sinuosity did not vary significantly with bankfull discharge suggesting that the variability of sinuosity along a stream reach is relatively constant in surveyed OSR streams.
Figure 5.20 illustrates the deviations from the reach-averaged sinuosity based on measurements taken for individual meanders. The figure shows that the deviations are within ±30% ninety percent of the time (at 5th and 95th percentiles).
Effect of Channel Slope and Drainage Basin Surficial Geology
The effects of channel slope and drainage basin surficial geology on the relationship between sinuosity and bankfull discharge were examined and found to be too weak to warrant developing equations to capture these effects. Future studies may be considered to investigate this further.
5.3.6 Meander Wavelength
Average meander wavelength was determined for a sub-set of fourteen sites from the 2005 and 2006 data. A plot of average meander wavelength versus reach-averaged bankfull width was generated but did not provide a reliable relationship from which a regime equation could be determined. This is likely due to the prevalence of irregular meanders and highly variable width observed in most OSR streams.
Williams (1986) developed a regime equation relating meander wavelength, λm to bankfull width as shown below.
Bbfm
12.15.6=λ
This equation was used to predict the meander wavelength for the fourteen measured bankfull widths.
The ratio of measured average meander wavelength to bankfull width from the OSR data show that the meander wavelength ranges from 5.3 to 23 times the bankfull width in OSR streams. The measured ratio suggests that there is a substantial amount of variability among streams in the OSR. In contrast, the ratio of calculated meander wavelength (based on the OSR regime relationships for bankfull width, Bbf, in Williams’ equation) to bankfull width ranged from 9.5 to 10.3. For design, a ratio of about 8 to 11 times the bankfull width determined from OSR regime relationships should be used. A user should seek professional opinion for any multiplier larger than 11. Detailed procedures for estimating the channel wavelength are in the design manual (Golder, 2008).
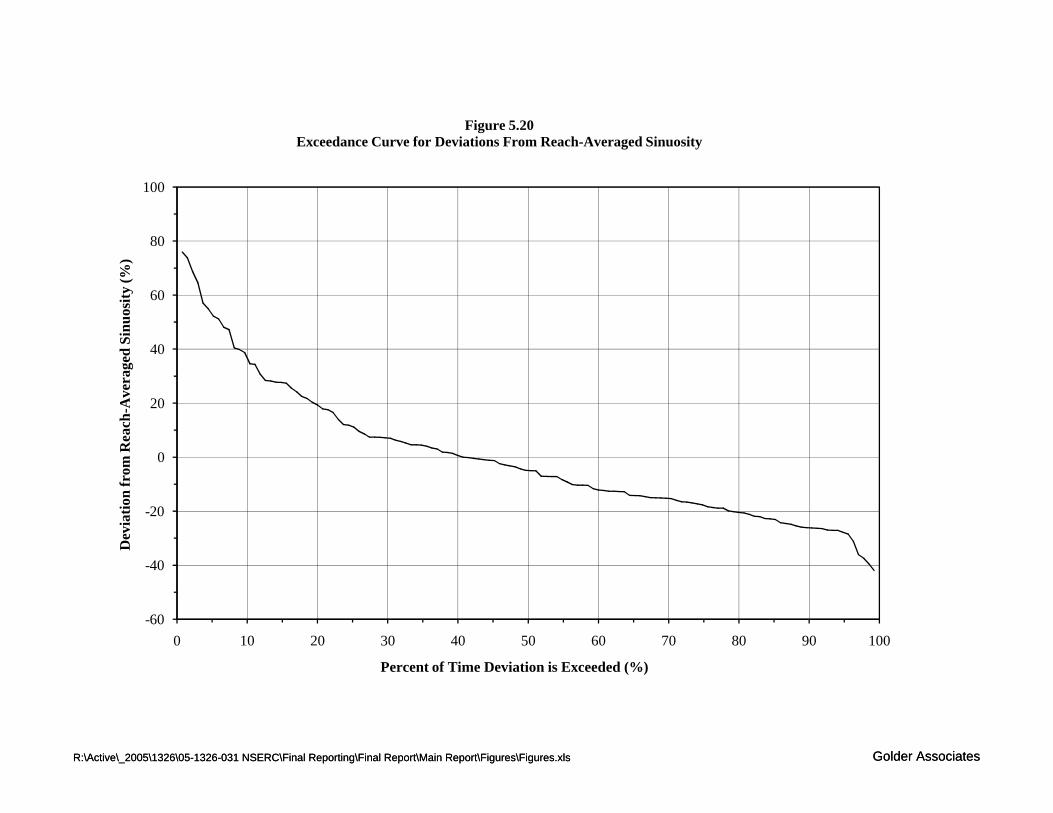
40
60
80
100
rage
d Si
nuos
ity (%
)Figure 5.20
Exceedance Curve for Deviations From Reach-Averaged Sinuosity
R:\Active\_2005\1326\05-1326-031 NSERC\Final Reporting\Final Report\Main Report\Figures\Figures.xls Golder Associates
-60
-40
-20
0
20
0 10 20 30 40 50 60 70 80 90 100
Dev
iatio
n fr
om R
each
-Ave
r
Percent of Time Deviation is Exceeded (%)
R:\Active\_2005\1326\05-1326-031 NSERC\Final Reporting\Final Report\Main Report\Figures\Figures.xls Golder Associates
CONRAD December 2008 DFO - 82 - 05-1326-031
Golder Associates
The above discussion of meander wavelength indicates that wavelength is related to channel width. Schumm (1967) indicates that meander wavelength is also related to bank composition in a study examining medium sand-sized and smaller. The study shows that meander wavelength decreases as channel boundary (bank) material becomes more cohesive. This examination of boundary material is beyond the scope of this study, but further investigations could lead to reliable predictions for OSR channels.
5.3.7 Meander Belt Width
Meander belt width (MB) defines the width in which the channel is expected to migrate and therefore the areas that will be directly affected by channel processes. The meander belt width must be contained by the floodplain, which makes this an important parameter for channel design.
Fourteen sites used to obtain average meander belt width. The ratio of average meander belt width and bankfull width in OSR streams indicates that meander belt width can range from 2.8 to 11 times the bankfull width. There is a considerable amount of variability in the ratio of measured meander belt width to bankfull depth. This variability is attributed to variability in surficial geology, bank material and meander development throughout the OSR. Williams (1986) proposed the following equation for meander belt width:
BMB bf12.17.3=
This equation was used to predict the meander belt width for the fourteen measured bankfull widths. In contrast, the ratio of calculated meander belt width to bankfull width (based on OSR regime channel width) ranged from 5.4 to 5.9. The meander belt width of a channel is a parameter that becomes fixed with the determination of sinuosity and meander wavelength. For design, the recommendation will be use a ratio of about 6 to 8 times the bankfull width to check the meander belt width of the design channel and to seek professional opinion for any multiplier larger than 8. Detailed procedures for estimating meander belt width are presented in the design manual (Golder, 2008).
5.4 FLOW RESISTANCE
Manning’s ‘n’ roughness coefficients that resulted from the modeling described in section 4.5.11. The resulting roughness coefficients are significantly higher than values that are generally reported in the literature. The high values reflect the roughness of the channel bed and bank material, channel bed and bank irregularity and obstructions in the channel such as inactive beaver dams and other organic debris. These roughness elements are lumped and represented by a single Manning’s coefficient in the hydraulic simulation using the HEC-RAS model.

CONRAD December 2008 DFO - 83 - 05-1326-031
Golder Associates
Typical Manning’s coefficients in other regions range from about 0.025 for clean straight channels to 0.15 for channels that are vegetated, overgrown or have highly irregular flow paths (Henderson 1966). However, the derived Manning’s coefficients for the 2005 and 2006 reaches ranged from 0.04 to values greater than 1 as shown in Tables 5.4 and 5.5. A summary of the simulation results is presented in Appendix VI. Stream reaches such as Reach G96 MacKay River Tributary (n = 1), Reach G105 North Steepbank River Tributary (n = 0.5) and Reach G89 Horse River Tributary (n = 0.4) are examples of stream reaches with exceptionally large Manning’s coefficients and are typically characterized by large amounts of large woody debris and well defined riffle zones downstream of obstructions.
Without intervention, newly constructed alluvial channels will not have the same roughness elements that occur in existing alluvial channels. It may take several decades before equivalent roughness elements are introduced by natural processes and beaver activity. During the transition period, roughness can be introduced by placing naturally-functioning roughness elements in the channel during construction. These roughness elements will need to be designed and spaced to mimic natural roughness in existing alluvial channels and reproduce equivalent hydraulic conditions. A simple tool was prepared to assist in the design based on the following:
• Average channel width and depth are determined from regime equations;
• The roughness elements are barriers in the channel allowing flow over a middle rectangular section at the top;
• The width of the rectangular section is assumed to be about 70 to 80% of the channel width;
• The roughness elements are equally spaced;
• Critical flow conditions occur over the roughness elements;
• The head loss between two adjacent roughness elements is equal to the head loss in the channel (ponded reach of the stream) which can be estimated from Manning’s equation and the head loss due to the contraction and expansion losses over a roughness element;
• Manning’s coefficient is estimated from data from similar streams in OSR, experience and/or published data;
• Contraction and expansion losses are assumed to be 0.3 and 0.7 respectively; and
• The height of the rectangular middle section invert above the channel bed is determined from the total head loss equation.
The inputs and outputs of the tool as well as the derivation of the equations to determine the spacing of the roughness elements and the height of the rectangular middle section invert above the channel bed are provided in the design manual (Golder, 2008).
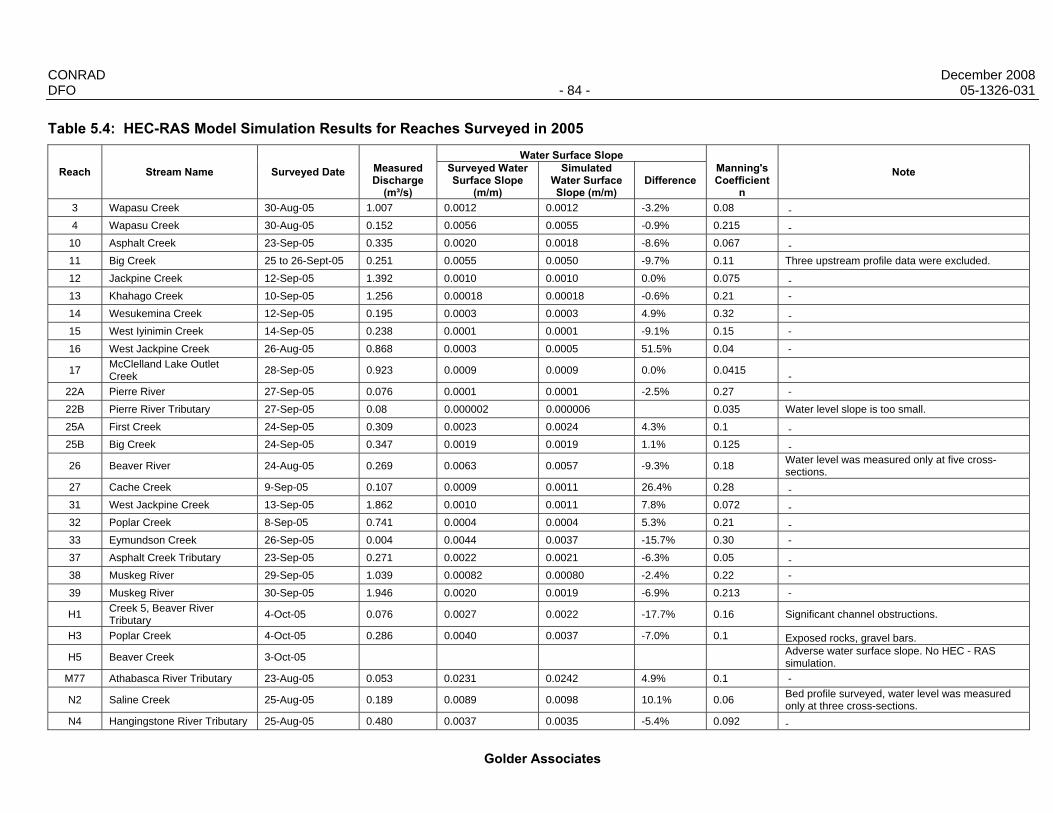
CONRAD December 2008 DFO - 84 - 05-1326-031
Golder Associates
Table 5.4: HEC-RAS Model Simulation Results for Reaches Surveyed in 2005
Reach Stream Name Surveyed Date Measured Discharge
(m³/s)
Water Surface Slope Manning's Coefficient
n
Note Surveyed Water Surface Slope
(m/m)
Simulated Water Surface Slope (m/m)
Difference
3 Wapasu Creek 30-Aug-05 1.007 0.0012 0.0012 -3.2% 0.08 - 4 Wapasu Creek 30-Aug-05 0.152 0.0056 0.0055 -0.9% 0.215 -
10 Asphalt Creek 23-Sep-05 0.335 0.0020 0.0018 -8.6% 0.067 - 11 Big Creek 25 to 26-Sept-05 0.251 0.0055 0.0050 -9.7% 0.11 Three upstream profile data were excluded. 12 Jackpine Creek 12-Sep-05 1.392 0.0010 0.0010 0.0% 0.075 - 13 Khahago Creek 10-Sep-05 1.256 0.00018 0.00018 -0.6% 0.21 - 14 Wesukemina Creek 12-Sep-05 0.195 0.0003 0.0003 4.9% 0.32 - 15 West Iyinimin Creek 14-Sep-05 0.238 0.0001 0.0001 -9.1% 0.15 - 16 West Jackpine Creek 26-Aug-05 0.868 0.0003 0.0005 51.5% 0.04 -
17 McClelland Lake Outlet Creek 28-Sep-05 0.923 0.0009 0.0009 0.0% 0.0415 -
22A Pierre River 27-Sep-05 0.076 0.0001 0.0001 -2.5% 0.27 - 22B Pierre River Tributary 27-Sep-05 0.08 0.000002 0.000006 0.035 Water level slope is too small. 25A First Creek 24-Sep-05 0.309 0.0023 0.0024 4.3% 0.1 - 25B Big Creek 24-Sep-05 0.347 0.0019 0.0019 1.1% 0.125 -
26 Beaver River 24-Aug-05 0.269 0.0063 0.0057 -9.3% 0.18 Water level was measured only at five cross-sections.
27 Cache Creek 9-Sep-05 0.107 0.0009 0.0011 26.4% 0.28 - 31 West Jackpine Creek 13-Sep-05 1.862 0.0010 0.0011 7.8% 0.072 - 32 Poplar Creek 8-Sep-05 0.741 0.0004 0.0004 5.3% 0.21 - 33 Eymundson Creek 26-Sep-05 0.004 0.0044 0.0037 -15.7% 0.30 - 37 Asphalt Creek Tributary 23-Sep-05 0.271 0.0022 0.0021 -6.3% 0.05 - 38 Muskeg River 29-Sep-05 1.039 0.00082 0.00080 -2.4% 0.22 - 39 Muskeg River 30-Sep-05 1.946 0.0020 0.0019 -6.9% 0.213 -
H1 Creek 5, Beaver River Tributary 4-Oct-05 0.076 0.0027 0.0022 -17.7% 0.16 Significant channel obstructions.
H3 Poplar Creek 4-Oct-05 0.286 0.0040 0.0037 -7.0% 0.1 Exposed rocks, gravel bars.
H5 Beaver Creek 3-Oct-05 Adverse water surface slope. No HEC - RAS simulation.
M77 Athabasca River Tributary 23-Aug-05 0.053 0.0231 0.0242 4.9% 0.1 -
N2 Saline Creek 25-Aug-05 0.189 0.0089 0.0098 10.1% 0.06 Bed profile surveyed, water level was measured only at three cross-sections.
N4 Hangingstone River Tributary 25-Aug-05 0.480 0.0037 0.0035 -5.4% 0.092 -

CONRAD December 2008 DFO - 85 - 05-1326-031
Golder Associates
Table 5.5: HEC-RAS Model Simulation Results for Reaches Surveyed in 2006
Reach Stream Name Surveyed Date
Measured Discharge
(m³/s)
Water Surface Slope Manning's Coefficient
n
Note Surveyed Water Surface Slope (m/m)
Simulated Water Surface Slope (m/m)
Difference
G01 Creek A 17-Oct-06 0.067 0.0027 0.0034 24.6% 0.22 Wood debris was at two locations.
G03-L Stanley Creek 16-Oct-06 0.031 0.0018 0.0018 0.1% 0.2 -
G03-R Stanley Creek 16-Oct-06 0.013 0.0014 0.0013 -9.7% 0.19 -
G04 Fort Creek 15-Oct-06 0.022 0.0164 0.0159 -3.1% 0.4 -
G05 Fort Creek 15-Oct-06 0.014 0.00112 0.00106 -5.9% 0.5 -
G08 Athabasca River Tributary 15-Oct-06 0.07 0.0034 0.0037 7.5% 0.24 -
G29 Muskeg Creek 21-Oct-06 0.056 0.0002 0.00003 0.1 D/S steep riffle excluded in simulation.
G40 MacKay River Tributary 26-Oct-06 0.003 Steep drop followed by a flat pool. Unsatisfactory simulation results.
G50 Big Creek Tributary 18-Oct-06 0.002 0.0003 0.0002 -30.6% 0.8 Discharge was too small.
G54 Athabasca River Tributary 18-Oct-06 0.182 0.0020 0.0022 12.1% 0.3 -
G59 Unnamed Stream -1, Highway 63 26-Oct-06 0.053 0.0010 0.0007 -28.9% 0.35 Significant woody debris.
G62 Unnamed Creek 2, Highway 63 28-Oct-06 0.041 0.0095 0.0091 -3.7% 0.09 -
G68 Hangingstone River Tributary 24-Oct-06 0.007 0.5 Wood debris.
G72 Hangingstone River Tributary 26-Oct-06 0.003 0.0070 0.0061 -13.3% 6 Two rock riffles in reach.
G73 Cameron Creek 23-Oct-06 0.013 0.0001 0.0001 5.6% 0.12 -
G74 Saline Creek Tributary 25-Oct-06 0.01 0.0003 0.0003 5.8% 0.3 -
G75 Saline Creek Tributary 25-Oct-06 0.002 0.0014 0.0011 -23.2% 2.2 -
G79 Clark Creek 22-Oct-06 0.036 0.0010 0.0010 -1.5% 0.07 -
G85 MacKay River Tributary 20-Oct-06 0.027 0.0004 0.0005 15.2% 0.12 Two active beaver dams in reach.
G89 Horse River Tributary 23-Oct-06 0.01 0.0034 0.0023 -31.5% 0.4 Beaver dam was present. Most upstream profile data were excluded.
G94 Dover River Tributary 20-Oct-06 0.002 Poor quality water level data.
G96 MacKay River Tributary 19-Oct-06 0.011 0.0012 0.0011 -3.8% 1 -
G97 MacKay River Tributary 19-Oct-06 0.009 0.0002 0.0001 -24.5% 0.65 -
G100 Athabasca River Tributary 22-Oct-06 0.019 0.0030 0.0027 -11.6% 0.15 Reach between cross sections 1 and 3 was simulated.
G105 North Steepbank River Tributary 21-Oct-06 0.181 0.0009 0.0007 -23.2% 0.5 Reach upstream of rocky riffle was
simulated.
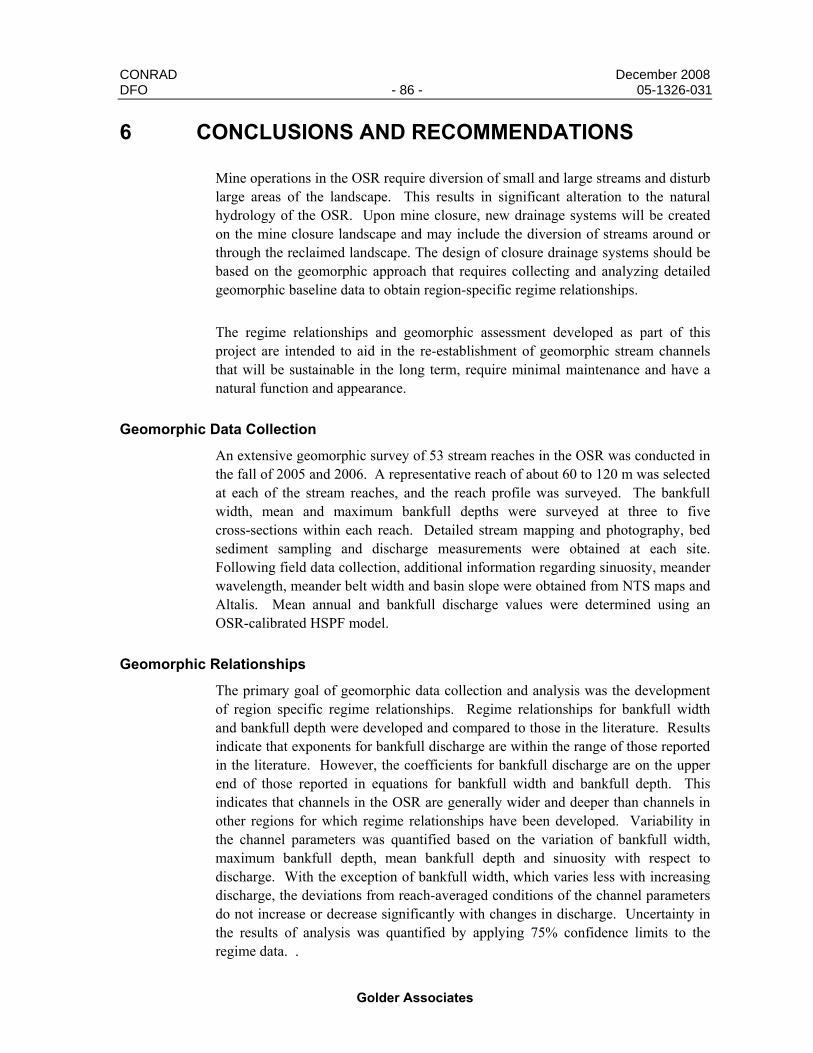
CONRAD December 2008 DFO - 86 - 05-1326-031
Golder Associates
6 CONCLUSIONS AND RECOMMENDATIONS
Mine operations in the OSR require diversion of small and large streams and disturb large areas of the landscape. This results in significant alteration to the natural hydrology of the OSR. Upon mine closure, new drainage systems will be created on the mine closure landscape and may include the diversion of streams around or through the reclaimed landscape. The design of closure drainage systems should be based on the geomorphic approach that requires collecting and analyzing detailed geomorphic baseline data to obtain region-specific regime relationships.
The regime relationships and geomorphic assessment developed as part of this project are intended to aid in the re-establishment of geomorphic stream channels that will be sustainable in the long term, require minimal maintenance and have a natural function and appearance.
Geomorphic Data Collection
An extensive geomorphic survey of 53 stream reaches in the OSR was conducted in the fall of 2005 and 2006. A representative reach of about 60 to 120 m was selected at each of the stream reaches, and the reach profile was surveyed. The bankfull width, mean and maximum bankfull depths were surveyed at three to five cross-sections within each reach. Detailed stream mapping and photography, bed sediment sampling and discharge measurements were obtained at each site. Following field data collection, additional information regarding sinuosity, meander wavelength, meander belt width and basin slope were obtained from NTS maps and Altalis. Mean annual and bankfull discharge values were determined using an OSR-calibrated HSPF model.
Geomorphic Relationships
The primary goal of geomorphic data collection and analysis was the development of region specific regime relationships. Regime relationships for bankfull width and bankfull depth were developed and compared to those in the literature. Results indicate that exponents for bankfull discharge are within the range of those reported in the literature. However, the coefficients for bankfull discharge are on the upper end of those reported in equations for bankfull width and bankfull depth. This indicates that channels in the OSR are generally wider and deeper than channels in other regions for which regime relationships have been developed. Variability in the channel parameters was quantified based on the variation of bankfull width, maximum bankfull depth, mean bankfull depth and sinuosity with respect to discharge. With the exception of bankfull width, which varies less with increasing discharge, the deviations from reach-averaged conditions of the channel parameters do not increase or decrease significantly with changes in discharge. Uncertainty in the results of analysis was quantified by applying 75% confidence limits to the regime data. .
CONRAD December 2008 DFO - 87 - 05-1326-031
Golder Associates
A relationship between channel slope and bankfull discharge, augmented by data from the literature, indicates that there is a channel slope threshold based on the bed material from the OSR.
An examination of OSR data and comparison with equations established in the literature indicates that the meander wavelength and meander belt width of a given stream varies depending on the bankfull width of that stream.
Design Manual
The design manual is a critical deliverable of this research (Golder, 2008). The manual was prepared to provide recommendations and guidelines for alluvial channel design in the OSR including permanent diversion channels built for operating conditions, and closure drainage channels on reclaimed mine-altered land. The regime equations and relationships presented in this research report, as well as other applicable relationships from the literature, provided the basis for developing the design manual.
Channel characteristics for design closure systems should, in general, be selected based upon geomorphic relationships developed for OSR streams. Several aspects of stream design are obtained from published relationships (e.g., meander wavelength and meander belt width) to augment the data collected in the OSR. Use of relationships from the literature for these purposes is justifiable since the OSR data, though limited, are consistent with predictions in the literature for these parameters. The morphology of existing streams should be replicated where possible. Natural irregularities and obstructions should also be replicated such that additional natural obstructions will form as the existing vegetation cover and hydrologic conditions are re-established.
The design of alluvial channels based on the geomorphic approach should involve a multidisciplinary team that includes river engineers, fluvial geomorphologists, fish habitat specialists, mine planners and constructors. Users of the study findings should understand the basis and limitations of the findings and the results of analysis.
Recommendations for further study 1. A sub-set of representative channel reaches from the 2005 and 2006 database,
should continue to be monitored about every two to three years to document any geomorphological or hydrological evolution that may be occurring in the OSR;
2. Data collection in support of future EIAs should be collected based on the technical procedures developed in this study such that the database and can be augmented and regime relationships can be improved;

CONRAD December 2008 DFO - 88 - 05-1326-031
Golder Associates
3. The geomorphic and hydrologic conditions and changes of constructed alluvial channels designed by the geomorphic approach outlined in the Design Manual (Golder 2008) should be monitored at least annually to confirm the self-sustaining character of the new channels. This is necessary to assess the need for maintenance and to provide a sound basis for improving the design guidelines given in the Design Manual (Golder 2008);
4. Sediment yield from constructed landforms should be monitored and compared to sediment yield from natural watersheds in the OSR. This will provide an improved basis for design channels based on the geomorphic approach because net sediment yield from a given watershed or stream reach has a significant effect on channel morphology;
5. The study findings pertaining to naturally armoured channels (i.e. channels with material larger than sand) should be improved based on an enlarged dataset of representative channels. There are relatively few naturally armoured channels in the OSR and the selected study sites for the 2005 and 2006 field programs necessarily included few naturally armoured channels. Accordingly, the results of analysis of naturally armoured channels presented in 5.17 provide a weak basis for design of armoured channels in the OSR. A concentrated study, focused on augmenting the existing bed material data is needed; and
6. The ability of constructed streams to pass fish and provide adequate fish habitat should be assessed prior to construction to make certain that federal regulatory requirements can be met. After construction, the fish passage and habitat in the streams should be assessed and any necessary changes made to the channel morphology to meet fish passage and habitat requirements.
Regime relationships and channel design recommendations should be used by an experienced river engineer or fluvial geomorphologist who has strong background knowledge of the geomorphology in the OSR, knowledge of general fluvial geomorphology and an understanding of the potential consequences of using them for channel design. Relationships that were derived as a part of this study should not be used for channel design in other regions.
CONRAD December 2008 DFO - 89 - 05-1326-031
Golder Associates
7 CLOSURE
We trust the above meets your present requirements. If you have any questions or require additional details, please contact the undersigned.
GOLDER ASSOCIATES LTD.
APEGGA PERMIT TO PRACTICE 05122
Report prepared by: Report reviewed by: ORIGINAL SIGNED ORIGINAL SIGNED Dana McDonald, M.Sc. John R. Gulley, M.Sc., P.Biol. Geomorphology Specialist Senior Oil Sands Market Director ORIGINAL SIGNED ORIGINAL SIGNED Femi Ade, Ph.D., P.Eng. Ian MacKenzie, M.Sc. Senior Water Resources Engineer Senior Oil Sands Project Director ORIGINAL SIGNED Les Sawatsky, M.Sc., P.Eng. Principal, Water Resources FA/LS/DM/JG/IM/gm

CONRAD December 2008 DFO - 90 - 05-1326-031
Golder Associates
8 THIRD PARTY DISCLAIMER
This report has been prepared by Golder for the benefit of the client to whom it is addressed. The information and data contained herein represent Golder's best professional judgment in light of the knowledge and information available to Golder at the time of preparation. Except as required by law, this report and the information and data contained herein area to be treated as confidential and may be used and relied upon only by the client, its officers and employees. Golder denies any liability whatsoever to other parties who may obtain access to this report for any injury, loss or damage suffered by such parties arising from their use of, or reliance upon, this report or any of its contents without the express written consent of Golder and the client.
CONRAD December 2008 DFO - 91 - 05-1326-031
Golder Associates
9 REFERENCES
Ackers, P. 1962. Experiments on small streams in alluvium. Journal of Hydraulic Engineering, ASCE. 90(HY4), July.
AENV. (Alberta Environment). 1999. Technical support document for the regional sustainable development strategy for the Athabasca oil sands region. Alberta Environment. 144p.
AENV (Alberta Environment). 2004. Oil and gas remediation and reclamation advisory committee: Recommendations to the Minister. Alberta Environment. 29p.
Allen, P.M., J.G. Arnold and B.W. Byars. 1994. Downstream channel geometry for use in planning-level models. Water Resources Bulletin. 30(4): 663-671.
Andrews, E.D. 1980. Effective and bankfull discharges of streams in the Yampa river basin, Colorado and Wyoming. Water Resources Research. 18: 1184-92.
ARC. Alberta Research Council, 1974a. Surficial Geology – Waterways NTS sheet 74D. Published by Alberta Research Council.
ARC. Alberta Research Council. 1974b. Surficial Geology – Bitumount NTS sheet 74E. Published by Alberta Research Council.
Beersing, A.K., L.F. Sawatsky, F.Ade. 2004. A geomorphic approach for the design of drainage systems on reclaimed mine areas.
Blench, T. 1941. Effect of dynamic shape on Lacey relations. Technical Report, Central Board of Irrigation, India.
Blench, T. 1951. “Regime theory for self-formed sediment bearing channels.” American Society of Civil Engineers. Proceedings, 77: Separate no. 70:1-18. May.
Blench, T. 1969. “Mobile-bed Fluviology” University of Alberta press. Edmonton, Canada.
Blench, T. 1986. “Mechanics of Plains Rivers.” University of Alberta press, Edmonton Canada.
CONRAD December 2008 DFO - 92 - 05-1326-031
Golder Associates
Bradley, M. and R.L. McNearny. 2000. An alternative ‘soft’ method for armouring diversion channels for mine reclamation sites. International Journal of Surface Mining, Reclamation and Environment. 14: 43-51.
Bray, D.I. 1972. “Generalized regime type analysis of Alberta rivers.” University of Alberta, Edmonton, Canada. Unpublished PhD. Thesis
Bray, D.I. 1982. “Regime equations for gravel-bed rivers.” In Hey, R.D. , Bathurst, J.C. and C.R. Thorne (eds). Gravel-bed Rivers, Chichester: John Wiley, 517-542
Catto, N.R. 1995. Fluvial Geomorphology and Sedimentology of the Athabasca River reaches, Fort McMurray – Tar Island, and the long-term geomorphic stability of the Tar Island Dyke, Alberta. Prepared for AGRA Earth & Environmental, Ltd. 86p.
Carlson (Carlson Software, Inc.). 2005. SurvCADD: Natural Regrade Module - Geofluv™. Produced by Carlson Software, Inc.
CEMA (Cumulative Environmental Management Association). 2006. Identify, Characterize & Quantify the Types of Landforms and Landscape Patterns Present in the Regional Municipality of Wood Buffalo. Prepared by: Sustainability Ecosystems Working Group. 141p.
da Silva, A.M.F. 2003. “A computation method for determination of regime channel characteristics.” Proceedings of Sixteenth Hydrotechnical Conference: Bridging the Gap between Knowledge and Practice, Canadian Society for Civil Engineering (CSCE), Canada Centre for Inland Waters, 22-24 October, Burlington Ontario (Canada).
Emmett, W.W. and W.G. Wolman. 2001. Effective discharge and gravel-bed rivers. Earth Surface Processes and Landforms. 26: 1369-1380.
Environment Canada National Climate Archive. 2008. Precipitation and Temperature data for Fort McMurray, Alberta 1950-2008. Available: http://climate.weatheroffice.ec.gc.ca/climateData/canada_e.html
Ettema, E. and C. Mutel. 2004. “Hans Albert Einstein: innovation and compromise in formulating sediment transport by rivers.” J. Hydr. Engrg. ASCE, 130(6), 477-487.
Ferguson, R.I. 1975. Meander irregularity and wavelength estimation. Journal of Hydrology. 26: 315-333.
CONRAD December 2008 DFO - 93 - 05-1326-031
Golder Associates
Fisher, T.G. and D.G. Smith. 1994. Glacial Lake Agassiz: Its northwest maximum extent and outlet in Saskatchewan (Emerson Phase). Quaternary Science Reviews. 13: 845-858.
Gill, M.A. 1968. “Rationalization of Lacey’s regime equations.” Journal of Hydraulic Engineering Division, ASCE, Vol.94, No.4, 983-995.
Golder (Golder Associates Ltd). 1999. Drainage design guidelines for mine disturbed areas. Submitted to Syncrude Canada Ltd.
Golder (Golder Associates Ltd). 2001. Operational water management plan for the Fort Hills Oils Sands Project. Submitted to True North Energy, Ltd.
Golder (Golder Associates Ltd). 2002. Surface Water Hydrology Environmental Setting for Jackpine Mine – Phase 1. Submitted to: Shell Canada Limited.
Golder (Golder Associates Ltd). 2003a. Oil Sands Regional Aquatic Monitoring Program (RAMP), Five Year Report. Submitted to RAMP Steering Committee.
Golder (Golder Associates Ltd). 2003b. Regional surface water hydrology study for re-calibration of HSPF model. Submitted to: Canadian Natural Resources Limited, Shell Canada Limited, Suncor Energy Inc., Syncrude Canada Ltd.
Golder (Golder Associates Ltd). 2004. Vegetated Waterways Design Guidelines. Submitted to Syncrude Canada Ltd.
Golder (Golder Associates Ltd). 2005a. Kearl Oil Sands Project: Baseline Hydrology Report.
Golder (Golder Associates Ltd). 2005b. Closure Drainage Parameters v 3.2. Prepared for Syncrude Canada Ltd. Compiled by Golder Associates Ltd.
Golder (Golder Associates Ltd). 2008. Alluvial Channel Design Manual Procedures for the Athabasca Oil Sands Region. Prepared for the Canadian Oil Sands Network for Research and Development and the Department of Fisheries and Oceans.
Grant, G.E. 1997. Critical flow constrain flow hydraulics in mobile-bed streams: a new hypothesis, Water Resources Research, 33, 2, 349-358.
CONRAD December 2008 DFO - 94 - 05-1326-031
Golder Associates
Griffiths, G.A. 1981. Stable-channel design in gravel-bed rivers. Journal of Hydrology. 52(3/4): 291-305.
Harrelson, C.C., C.L. Rawlins and J.P. Potyondy. 1994. Stream channel reference sites: an illustrated guide to field technique, General Technical Report RM-245, Fort Collins, Colorado, United States Department of Agriculture, Forest Service, Rocky Mountain Forest and Range Experiment Station, 61 p.
Henderson, F.M. Open Channel Flow. MacMillan Publishing Co., Inc, New York, 1966.
Hey, R.D. and G.L. Heritage. 1986. “Dimensional and dimensionless regime equations for gravel bed rivers.” Proceedings of International Conference on River Regime. Published by John Wiley and Sons. Ltd. (UK).
Hey, R.D. and C.R. Thorne. 1986. “Stable channels with mobile gravel bed.” Journal of Hydrology. Engrg., ASCE, 112(6), 671-689.
Kellerhals, R. 1967. “Stable channels with gravel-paved beds. Journal of the Waterways and Harbours Divisions, American Society of Civil Engineers, 63-84.
Khan, H.R. 1971. Laboratory study of river morphology: unpublished Ph.D. Dissertation, Colorado State University, 189pp.
Knighton, D. 1998. Fluvial forms and processes: a new perspective, Oxford University Press, New York, New York, p. 383.
Kondolf, G.M., M.W. Smeltzer and S.F. Railsback. 2001. Design and performance of a channel reconstruction project in a coastal California gravel-bed stream. Environmental Management. 28(6): 761-776
Lacey, G. 1929. Stable channels in alluvium. Minutes of the Proceedings of the Institution of Civil Engineers. Vol.: 229.
Lacey, G. 1933. Uniform flow in alluvial rivers and canals. Proceedings of the Institution of Civil Engineers. Vol.: 237.
Leopold, L.B. 1994, A view of the river, Harvard University Press, Cambridge, Massachusetts, p. 298.
CONRAD December 2008 DFO - 95 - 05-1326-031
Golder Associates
Leopold,L.B. and T. Maddock Jr. 1953. “The hydraulic geometry of stream channels and some physographic implications.” USGS Professional Paper 252.
Leopold, L.B. and M.G. Wolman. 1957. River Channel Patterns: Braided, Meandering and Straight. Geological Survey Professional Paper 282-B.
Leopold, L.B., M.G. Wolman and J.P. Miller. 1964. Fluvial processes in geomorphology. Freeman, San Francisco, CA, 522 pp.
Leopold, L.B., H.L. Silvey and D.L. Rosgen. 1998. The reference reach field book, DLR Wildland Hydrology, Fort Collins, Colorado, p. 211.
Li, M-H. and K.E. Eddleman. 2002. Biotechnical engineering as an alternative to traditional engineering methods: A biotechnical streambank stabilization approach. Landscape and Urban Planning. 60: 225-242.
Mahmood, K. and H.W. Shen. 1971. “The regime concept of sediment-transporting canals and rivers.” River Mech., Ch. 30, H.W. Shen, ed.,2, H. W. Shen, Fort Collins, Colorado, USA.
Mao, S. W. and L.R. Flook. 1971. “ Link canal design practices in West Pakistan.” River Mech., Appendix A, H.W. Shen, ed., 2, H.W. Shen, Fort Collins, Colorado, USA.
McKenna, G. and R. Dawson. 1997. Closure planning practice and landscape performance at 57 Canadian and US mines.
Mountain Station Consultants Inc. and North/South Consultants Inc. 2005. Natural range of variability of physical, biological and water and sediment quality characteristics of streams in the Athabasca Oil Sands Region. Prepared for Cumulative Environmental Management Association (CEMA) Surface water working group – Watershed Integrity, Contract 2004-0012. 151p. plus appendices.
Muskeg Subcommittee (Muskeg Subcommittee of the NRC Associate Committee on Geotechnical Research. 1973. Muskeg and the Northern Environment in Canada. Edited by N.W. Radforth and C.O. Brawner.
Nouh, M.(1988). “Regime channels of extremely air zone.” Proceedings of International Conference on Regime Rivers. Published by John Wiley and Sons Ltd. (UK).
CONRAD December 2008 DFO - 96 - 05-1326-031
Golder Associates
Nunnally, N.R. 1985. Application of fluvial relationships to planning and design of channel modifications. Environmental Management. 9(5): 417-426.
Oil States International. 2008. Canadian National Energy Board: Alberta Oil Sands. Available: http://www.oilstatesintl.com/fw/main/Canadian_Accommodations-143.html
Page, K.J. and Y.R. Carden. 1998. Channel adjustment following the crossing of a threshold: Tarcutta Creek, Southeastern Australia. Australian Geographical Studies. 36(3): 289-311.
Palmer, M.A., E.S. Bernhardt, J.D. Allan, P.S. Lake, G. Alexander, S. Brooks, J. Carr, S. Clayton, C.N. Dahm, J. Follstad Shah, D.L. Galat, S.G. Loss, P. Goodwin, D.D. Hart, B. Hassett, R. Jenkinson, G.M. Kondolf, R. Lave, J.L. Meyer, T.K. O’Donnell, L. Pagano and E. Sudduth. 2005. Standards for ecologically successful river restoration. Journal of Applied Ecology. 42: 208-217.
Parker, G., P.C. Klingeman, and D.G. McLean. 1982. Bedload and Size Distribution in Paved Gravel-Bed Streams. Journal of the Hydraulics Division, ASCE. 18(HY4): 544-571
Parker, G. 2004. One-dimensional sediment transport morphodynamics with applications to rivers and turbidity currents – Chapter 2: Characterization of sediment and grain size distributions. Available: http://www.cee.uiuc.edu/people/parkerg/_private/e-bookPowerPoint/RTe-bookCh2SedimentGSD.ppt
Pickup. G. and R.F. Warner. 1976. Effects of hydrologic regime on magnitude and frequency of dominant discharge. Journal of Hydrology. 29: 51-75.
Rosgen, D.L. 1994. A classification of natural rivers. Catena. 22: 169-199.
Rosgen, D.L. 2006. River Restoration using a geomorphic approach for natural channel design. Proceedings: Eighth Federal Interagency Sedimentation Conference (8thFISC), April2-6, 2006, Reno, NV, USA.
Sawatsky, L. 2004. Reclamation strategies that address mine closure drainage. The Canadian Institute Mine Reclamation Conference, November 8-9, 2004.
Sawatsky, L., G. McKenna, M-J Keys and D. Long. 2000. Towards minimizing the long-term liability of reclaimed mine sites. Land Reconstruction and Management. 1: 21-36.
CONRAD December 2008 DFO - 97 - 05-1326-031
Golder Associates
Sawatsky, L and G. Beckstead. 1995. Geomorphic approach for design of sustainable drainage systems for mineland reclamation. Paper prepared for the Annual Conference of the Canadian Society of Civil Engineering. June 1-3, 1995, Ottawa, Ontario.
Schumm, S.A. 1963. Sinuosity of Alluvial Rivers on the Great Plains. Geological Society of America Bulletin. 74: 1089-1100.
Schumm, S.A. 1967. Meander wavelength of alluvial rivers. Science. 157: 1549-1550.
Schumm, S.A. 1977. “The Fluvial System” John Wiley & Sons. New York.
Schumm, S.A. 1979. Geomorphic Thresholds: The concept and its applications. Transactions of the institute of British Geographers. 4(4): 485-515.
Schumm, S.A and H.R. Khan. 1972. Experimental study of channel patterns. Geological Society of America Bulletin. 83: 1755-1770.
Shields, D.F. Jr., R.R. Copeland, P.C. Klingeman, M.W. Doyle. and A. Simon. 2003. Design for Stream Restoration. Journal of Hydraulic Engineering. 129(8): 575-584.
Simon, A. and P.W. Downs. 1995. An interdisciplinary approach to evaluation of potential instability in alluvial channels. Geomorphology. 12: 215-232.
Smith, D.G. and T.G. Fisher. 1993. Glacial Lake Agassiz: the northwestern outlet and paleoflood. Geology. 21: 9-12.
Smith, S.M. and K.L. Prestegaard. 2005. Hydraulic performance of a morphology-based stream channel design. Water Resources Research. 41: W11413.
Smith, M.L. and R.G. D’Eon. 2006. Pre-Industrial Forest Condition Report for The Alberta-Pacific Forest Industries Inc. Forest management Agreement Area Alberta-Pacific Forest Industries Inc, Boyle, AB.
Tarar, R.N. and A.M. Choudri. 1979. “Behavioural evaluation of some Pakistani canals, part 1.” Presentation at the Int. Symp. on Mech. of Alluvial Channels, held at Lahore, Pakistan, June 26-29, 1979.
CONRAD December 2008 DFO - 98 - 05-1326-031
Golder Associates
Toy, T.J. and W.R Chuse. 2005. Topographic reconstruction: a geomorphic approach. Ecological Engineering. 24: 29-35.
USDA (United States Department of Agriculture). 2007. Stream Restoration Design. National Engineering Handbook.
van den Berg, J.H. 1995. Prediction of alluvial channel pattern of perennial rivers. Geomorphology. 12: 259-279.
Williams, G.P. 1978. Bankfull discharge of rivers. Water Resources Research. 14: 1141-58.
Williams, G.P. 1986. River meanders and channel size. Journal of Hydrology. 88: 147-164.
Wohl, E. 2000 Mountain rivers, American Geophysical Union, Water Resources Monograph 14, 320 pp.
Wohl, E. E. and D.M. Merritt. 2001. Bedrock channel morphology. Geological Society of America Bulletin. 113(9): 1205-1212.
Wohl, E.E., K.R. Vincent and D.J. Merritts. 1993. Pool and Riffle characteristics in relation to channel gradient. Geomorphology. 6: 99-110.
Wolman M.G. and L.B. Leopold. 1957. River flood plains: some observations on their formation. United States Geological Survey Professional Paper 282-C: Washington, D.C., 86–109.
Yalin, M.S. 1992. River Mechanics. Permagon Press, Oxford, England. 220p.

APPENDIX I
GLOSSARY OF TERMS
Appendix I I - 1 December 2008 Glossary of Terms
Golder Associates
A
Alluvial Channel: A river or stream channel formed in alluvium and free to adjust its shape in response to flow changes.
Aerial Photo: A photo of the earth’s surface taken from a plane. Overlapping photos are taken in succession such that they can be used to view the surface in three dimensions (stereo-viewing).
B
Basin Area: A geographic area drained by a single major stream and its lower-order tributaries and defined by drainage divides.
Bankfull Depth: Channel depth at which a stream first begins to overflow its natural banks.
Bankfull Discharge: Flow rate corresponding to the bankfull conditions (assumed equal to 2-yr peak flow), which occur when the river stage begins to overflow in natural banks onto the floodplain.
Bankfull Width: Channel width at which a stream first begins to overflow its natural banks.
Basin Slope: Change in basin elevation with distance along the length of the basin.
C
Channel: A natural or artificial waterway that conveys water from one location to another.
Channel Bed Material Size: Characteristic size of the sediment that forms a stream bed.
Channel Bed Slope: Change in stream bed elevation per unit channel length within a river reach.
Channel Length: The total distance along the path of the channel between two points on the channel. This distance can be applied to an entire stream or to a reach

Appendix I I - 2 December 2008 Glossary of Terms
Golder Associates
Channel Parameters: Characteristics of a stream course that include bankfull width, bankfull depth, mean bankfull depth, sinuosity, channel bed slope, channel bed material size, roughness factor, channel wavelength, percentage of bed material fines (clay and silt).
Clay: Sediment characterized by particles ranging in size from 0.24 to 4 μm.
Coefficient of Variation: A ratio describing the relative variability of two frequency distributions having different means.
Cross-sectional flow area: Stream width times stream depth. This measurement can be taken at the level of flow to determine the cross-sectional area of flow or at the bankfull level to determine the bankfull cross-sectional area.
D
Discharge: The volume of water that flows in a river cross-section per unit time.
Discharge Parameters: Characteristics of water flow rate in a stream including mean annual discharge and bankfull discharge.
Drainage Density: Ratio of total stream length within a basin to basin area (m-1).
Drainage Divide: The boundary along a topographic ridge separating two watersheds.
E
Entrenchment Ratio: Width of the flood-prone area at an elevation twice the maximum bankfull depth divided by the bankfull width.
F
Floodplain: The portion of the river valley that is immediately adjacent to the river that is subject to recurring inundation when river stage surpasses the bankfull elevation.
G
Geomorphology: A branch of science that deals with the origin, evolution, and processes of landforms.

Appendix I I - 3 December 2008 Glossary of Terms
Golder Associates
GIS: Geographic Information System. A system for storing, analysing and managing spatial data. GIS was used to compute sinuosity in this study.
Glacial: Geological surficial material that is comprised of silt, clay and sand.
Glaciofluvial: Geological surficial material that is comprised primarily of sandy material.
Glaciolacustrine: Geological surficial material comprised primarily of silt and clay material.
Gravel: Sediment characterized by particles ranging in size from 2 to 64 mm.
H
HSPF Model: Hydrological Simulation Program - FORTRAN (HSPF) is a comprehensive model used for simulation of watershed hydrology.
HEC-RAS Model: A model developed by Hydrological Engineering Services of the US Corps of Engineers. It is a one-dimensional hydraulic model used for channel flow analysis and floodplain determination.
Hydraulic Radius, The ratio of the cross-sectional flow area to the wetted perimeter.
I
Irregularity: A description of the sinuosity of a stream that does not possess enough stream power to overcome bank material and develop a regular pattern of sinuosity.
L
Lowland Area: An area in the Oil Sands Region defined by a basin slope of less than 0.5%
Lowland channel: A stream reach with a maximum channel slope of 0.5%.
Appendix I I - 4 December 2008 Glossary of Terms
Golder Associates
M
Maximum Overland Flow Path Length: Longest distance that surface runoff may travel before it becomes channelized.
Maximum Overland Flow Path Length Slope: Slope corresponding to the maximum overland flow path length at the channelized point.
Mean Annual Discharge: Average of recorded or simulated daily flow rates that flow past a river cross-section over a number of years.
Mean Bankfull Depth: Average channel depth at which a stream first begins to overflow its natural banks.
Mean Flow Depth: An average of water depths recorded at points at constant intervals across the channel width.
Meander Belt Width: The maximum width of meanders within a river valley. Complex meander systems may have a meander belt width wider than the maximum width of meanders and meander belt width may increase throughout the lifespan of a river.
Meander Wavelength: The straight line distance between two similar points on two successive bends in a river.
Mine Closure: The act of reclaiming mined areas and replacing, restoring or compensating for the original topography, drainage, surface material and water quality.
Morphology: The physical form and structure of a landscape or landscape feature (e.g., river valley, alluvial deposit).
Muskeg: A type of soil that consists of dead organic matter in various stages of decomposition and includes woody debris, such as roots, buried tree branches, or whole trees that can make up 5 to 15 percent of the soil.
N
NAD83: North American Datum of 1983. A geodetic reference system that superseded NAD 27 because of its accuracy.
Appendix I I - 5 December 2008 Glossary of Terms
Golder Associates
Northing and Easting: UTM (Universal Transverse Mercator) coordinates that specify the location of a point within a grid-based system covering the earth’s surface.
O
Oil Sands: Deposits of bitumen that are mixed with sand.
Oil Sands Region: Areas in north eastern Alberta containing oil sands deposits.
P
Percentage of Bed Material Fines (clay and silt): It is the percentage by weight of clay and silt present in the channel bed material.
Pool: Pooled areas are typically deeper, have lower flow velocity and generally have finer bed material than adjacent riffles. Pooled areas typically occur on river bends.
Pool-Riffle Sequence: The alternation between shallower, faster-moving areas and deeper slower-moving areas along the length of a stream.
R
Reach-averaged bankfull width, mean bankfull depth and maximum bankfull depth: Reach averaged bankfull width is the mean of bankfull width measurements taken at three or more cross-sections. Reach-averaged maximum bankfull depth is the mean of maximum bankfull depth measurements taken at each of three of more cross-sections. Reach-averaged mean bankfull depth is the mean of mean bankfull depth measurements taken at each of three or more cross-sections.
Riffle: Riffles are sections of a stream that are typically shallower, have higher flow velocity and tend to have coarser bed material than adjacent pools. Riffles generally occur on straight sections of streams at the inflection point between to bends or pools.
River: A high-order water body that conveys water from a drainage basin.
River Bed: Lowest part of a channel along which water moves during interflows.
Appendix I I - 6 December 2008 Glossary of Terms
Golder Associates
River Confluence: The location where one river or stream joins another river or stream.
River Mouth: A place where a river discharges into another water body (e.g., river, lake, sea, ocean).
Roughness Factor: A parameter that quantifies a channel resistance to flow.
S
Sand: Sediment characterized by particles ranging in size from 62 to 2,000 μm.
Sediment: Soils (clastic and organic) transported by water in suspension or as a bed load from the place of origin.
Sediment Discharge: The volume of sediment travelling in a channel at a given cross-section per unit time.
Sediment Yield: The total sediment outflow from a drainage basin at a given location per year.
Silt: Sediment characterized by particles ranging in size from 4 to 62 μm.
Sinuosity: The ratio of the thalweg length (i.e., the line connecting the deepest points along a stream) to valley length, for a specific reach of a river.
Stream: A waterbody or conduit that conveys water from one location to another.
Stream Morphology: The physical form and structure of a stream channel including all of its contributing elements.
Stream Mapping: Sketching a stream reach, illustrating the details of significant features in and around the channel (e.g., beaver dams, woody debris, overhanging vegetation, bed vegetation).
Stream Power: The rate at which a stream can do work (e.g., sediment transport). Stream power is largely a function of slope and discharge.
Appendix I I - 7 December 2008 Glossary of Terms
Golder Associates
Stream Reach: A portion of the total length of a stream that is of interest for a particular study or exhibits a particular phenomenon of interest.
T
Thalweg: The line of maximum depth and velocity along the length of a stream.
Tributary: A channel that flows directly into another channel but not directly into a large body of water or sea.
U
Upland Area: An area in the Oil Sands Region defined by a basin slope of greater than 0.5%.
Upland Channel: A stream reach with a bed slope greater than 0.5%.
V
Vegetated Waterway: A watercourse or conveyance channel that is lined with permanent vegetation. The relationship between contributing drainage area and slope is such that maximum velocity does not remove in-channel vegetation, which acts to minimize erosion.
Valley Length: The distance between two points in a stream valley. This distance may be straight or convoluted and is dictated by the morphology of the stream valley. This length is different from channel length.
Valley Slope: The change in elevation along from one point to another along a river valley.
W
Watershed: The contributing area to a water body or watercourse.
Watershed Parameters: Characteristics of a watershed that include basin area, basin slope, drainage density, maximum overland flow path length, maximum overland flow path length slope.
Wetted Perimeter: The portion of a stream channel cross-section that is in direct contact with the water

APPENDIX II
TECHNICAL PROCEDURES FOR GEOMORPHIC SURVEY

Appendix II - 1 December 2008 Technical Procedures For Geomorphic Survey
Golder Associates
This appendix presents a set of technical procedures outlining the methodologies for completing a thorough geomorphic survey of a river or stream reach. This set of technical procedures was prepared specifically for the 2005 and 2006 field programs and include procedures for:
II-A Open-water stream discharge measurement
II-B Vertical survey for stream cross-sectional and reach profile
II-C Bed sediment sampling
II-D Stream mapping

APPENDIX II-A
OPEN-WATER STREAM DISCHARGE MEASUREMENT
Appendix IIA - 1 December 2008 Open-Water Stream Discharge Measurement
Golder Associates
A-1 PURPOSE
This document describes the method for measuring stream velocities to obtain an estimate of discharge through a channel cross-section under open water condition.
A-2 APPLICABILITY
Two variations of the procedure include measurements made in shallow and deep open-water streams. These procedures are applicable to most streams and rivers.
A-3 DEFINITIONS
The terms ‘flow’ and ‘discharge’ are used interchangeably throughout the text and refer to the volume of water passing by a fixed point per unit time. The units of measurement are typically cubic meters per second (cms or m3/s).
A-4 REFERENCES AND SUGGESTED READING
Mosley, M.P. and A.I. McKerchar; Maidment, D.R. (editor-in-chief) 1993. Chapter 8: Handbook of Hydrology. McGraw-Hill. 39 Pages.
Water Survey of Canada. 1978-1993. Chapters 2 and 4. Hydrometric Field and Related Manuals. Golder Calgary Hydrology Library. Three-ring binder.
Meller, B.D. 1997. “Hydrometric Survey Techniques.” Distance Delivery Course, Institute for Renewable Resource Management, Lethbridge Community College, AB, Canada.
Water Survey of Canada. 1992. “Hydrometric Technician Career Development Program.” Compact Disc, Environment Canada.
USBR (United States Bureau of Reclamation). 2001. “Water Measurement Manual.” Water Resources Technical Publications, Bureau of Reclamation, U.S. Department of the Interior, Washington D.C.
A-5 DISCUSSION General Safety
• Beware of stream and flow conditions that are unsafe for wading. A rough guideline for determining if a stream can be waded safely is to avoid entering a stream where the product of the stream velocity (m/s) and the depth (m) is greater than one. This is only a guideline and other considerations should be made;

Appendix IIA - 2 December 2008 Open-Water Stream Discharge Measurement
Golder Associates
• Consider using safety rope if conditions are marginal, but not threatening (e.g., waterfalls, algae-covered rocks etc. upstream or downstream from the site); and
• For more information refer to the Golder Associates Ltd. Health and Safety Manual for details of safety procedures, and the Water Survey of Canada References in Golder’s Information Centre.
Site Selection
The site (transect) for a stream discharge measurement should be selected based on the following criteria:
• Reach should be fairly straight; site should preferably be in the centre of the reach
• Reach should have relatively uniform shape, bed profile and flow characteristics
• Reach should be free from any debris, large boulders, and other obstructions
• Site is preferable on the upstream of a bridge (if available)
• Reach has no undercut banks or backwater effects
• Preferable to have a depth of greater than 0.2 m and velocity of less than 2 m/s
• Reach should represent mainly channelized flow with little opportunity for flow on a floodplain, even during extreme events
Shallow Water Discharge Measurement (suitable for wading)
The recommended procedure for measuring flow using a Marsh-McBirney flow meter in a shallow, small-to-medium sized stream that can be waded was employed for all 2005 and 2006 stream reach visits and is as follows:
• Select a site in accordance with the guidelines listed in Section 5.2.
• Fix a tape measure or tagline to either the left or right bank so that the zero mark is at the shoreline.
o If it is not possible to zero the tagline at the waters edge, record the point on the tagline which corresponds with the water’s edge.
o Fix the tagline to natural objects or use short sections of small-diameter re-bar driven into the stream bank.
• Affix the tape or tagline to the opposite bank. Ensure the tape is perpendicular to the direction of flow.
• Record the locations of the shorelines on the discharge sheet (see Figure A-1).
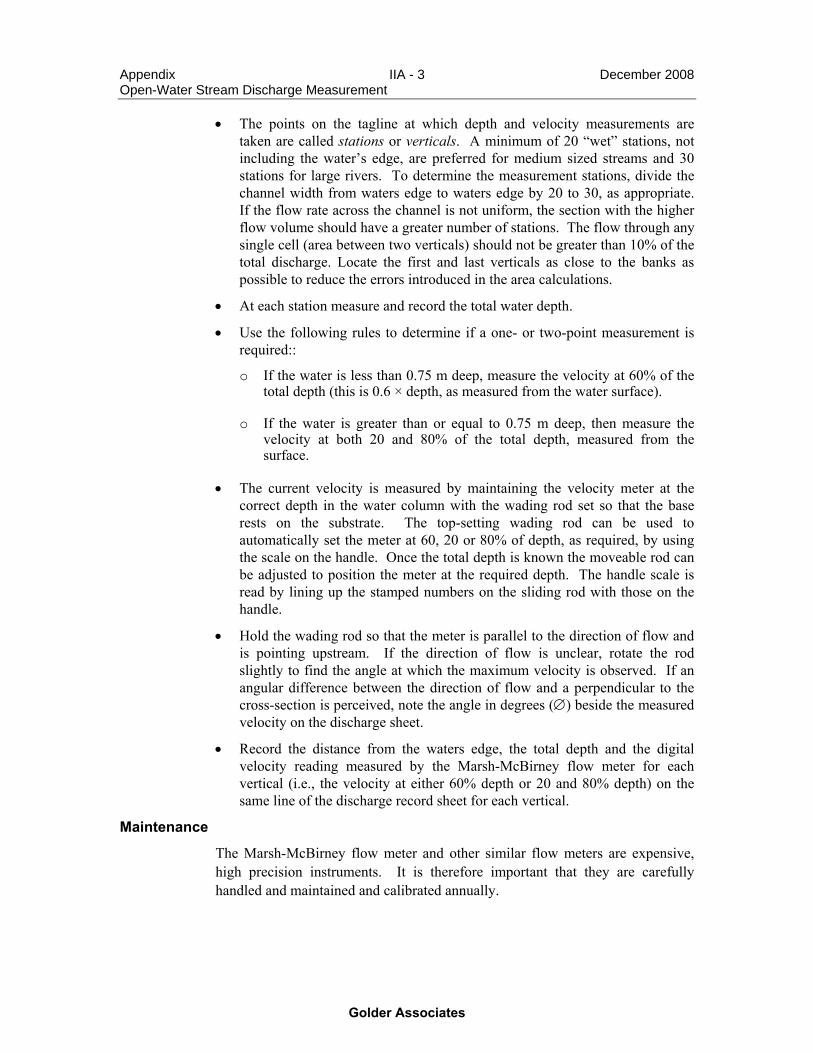
Appendix IIA - 3 December 2008 Open-Water Stream Discharge Measurement
Golder Associates
• The points on the tagline at which depth and velocity measurements are taken are called stations or verticals. A minimum of 20 “wet” stations, not including the water’s edge, are preferred for medium sized streams and 30 stations for large rivers. To determine the measurement stations, divide the channel width from waters edge to waters edge by 20 to 30, as appropriate. If the flow rate across the channel is not uniform, the section with the higher flow volume should have a greater number of stations. The flow through any single cell (area between two verticals) should not be greater than 10% of the total discharge. Locate the first and last verticals as close to the banks as possible to reduce the errors introduced in the area calculations.
• At each station measure and record the total water depth.
• Use the following rules to determine if a one- or two-point measurement is required::
o If the water is less than 0.75 m deep, measure the velocity at 60% of the total depth (this is 0.6 × depth, as measured from the water surface).
o If the water is greater than or equal to 0.75 m deep, then measure the velocity at both 20 and 80% of the total depth, measured from the surface.
• The current velocity is measured by maintaining the velocity meter at the correct depth in the water column with the wading rod set so that the base rests on the substrate. The top-setting wading rod can be used to automatically set the meter at 60, 20 or 80% of depth, as required, by using the scale on the handle. Once the total depth is known the moveable rod can be adjusted to position the meter at the required depth. The handle scale is read by lining up the stamped numbers on the sliding rod with those on the handle.
• Hold the wading rod so that the meter is parallel to the direction of flow and is pointing upstream. If the direction of flow is unclear, rotate the rod slightly to find the angle at which the maximum velocity is observed. If an angular difference between the direction of flow and a perpendicular to the cross-section is perceived, note the angle in degrees (∅) beside the measured velocity on the discharge sheet.
• Record the distance from the waters edge, the total depth and the digital velocity reading measured by the Marsh-McBirney flow meter for each vertical (i.e., the velocity at either 60% depth or 20 and 80% depth) on the same line of the discharge record sheet for each vertical.
Maintenance
The Marsh-McBirney flow meter and other similar flow meters are expensive, high precision instruments. It is therefore important that they are carefully handled and maintained and calibrated annually.
Appendix IIA - 4 December 2008 Open-Water Stream Discharge Measurement
Golder Associates
A-6 EQUIPMENT AND MATERIALS Velocity Measuring Equipment
• Marsh-McBirney flow meter
• Spare Batteries
• Automatic depth calculating (top-setting) wading rod (Figure A-2)
Record-keeping and Site Locating/Marking • Tape measure or tagline long enough to cross channel
• 2 re-bar posts hammered into the shore for positioning the tagline
• Hammer to install re-bar
• Holder to attach tape measure to re-bar (not required for tagline)
• Field Book
• Pencil/pen
• Discharge sheet
• Calculator
Health and Safety Equipment • Personal Flotation Device (PFD)
• Weather-appropriate clothing
• Safety Rope
Personal Gear • Hip Waders/Chest Waders
• Insect Repellent
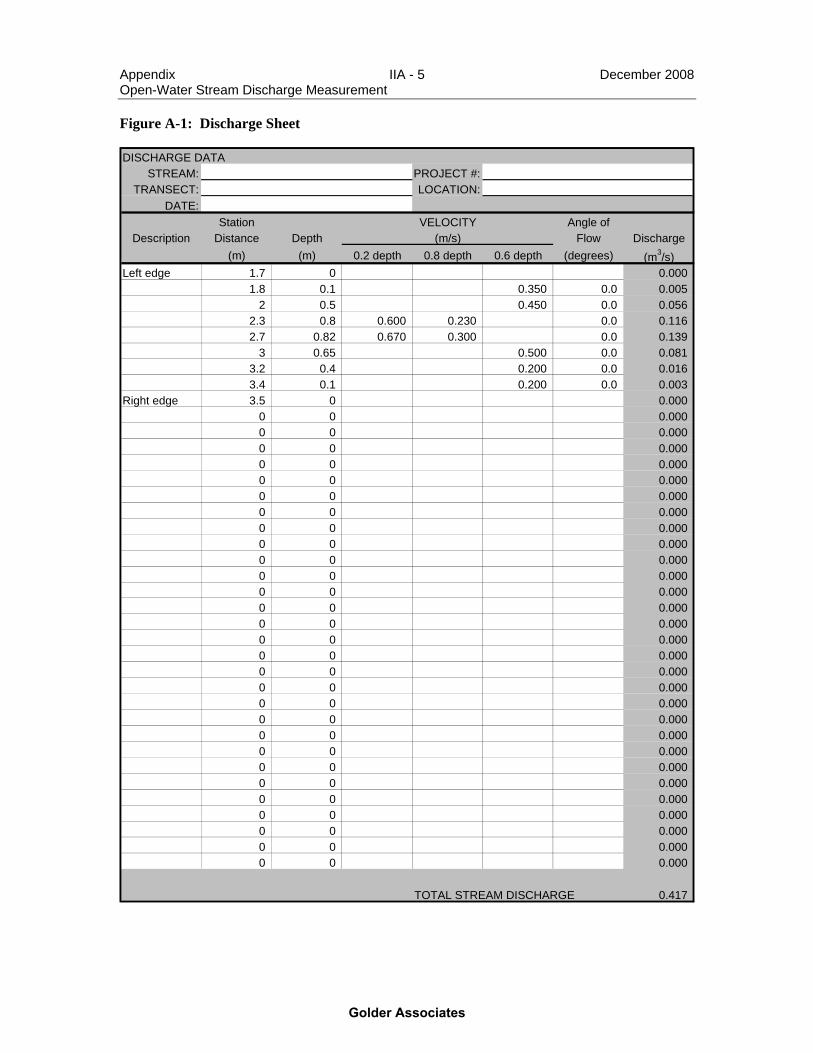
Appendix IIA - 5 December 2008 Open-Water Stream Discharge Measurement
Golder Associates
Figure A-1: Discharge Sheet
DISCHARGE DATA STREAM: PROJECT #:
TRANSECT: LOCATION:DATE:
Station VELOCITY Angle ofDescription Distance Depth (m/s) Flow Discharge
(m) (m) 0.2 depth 0.8 depth 0.6 depth (degrees) (m3/s)Left edge 1.7 0 0.000
1.8 0.1 0.350 0.0 0.0052 0.5 0.450 0.0 0.056
2.3 0.8 0.600 0.230 0.0 0.1162.7 0.82 0.670 0.300 0.0 0.139
3 0.65 0.500 0.0 0.0813.2 0.4 0.200 0.0 0.0163.4 0.1 0.200 0.0 0.003
Right edge 3.5 0 0.0000 0 0.0000 0 0.0000 0 0.0000 0 0.0000 0 0.0000 0 0.0000 0 0.0000 0 0.0000 0 0.0000 0 0.0000 0 0.0000 0 0.0000 0 0.0000 0 0.0000 0 0.0000 0 0.0000 0 0.0000 0 0.0000 0 0.0000 0 0.0000 0 0.0000 0 0.0000 0 0.0000 0 0.0000 0 0.0000 0 0.0000 0 0.0000 0 0.0000 0 0.000
TOTAL STREAM DISCHARGE 0.417
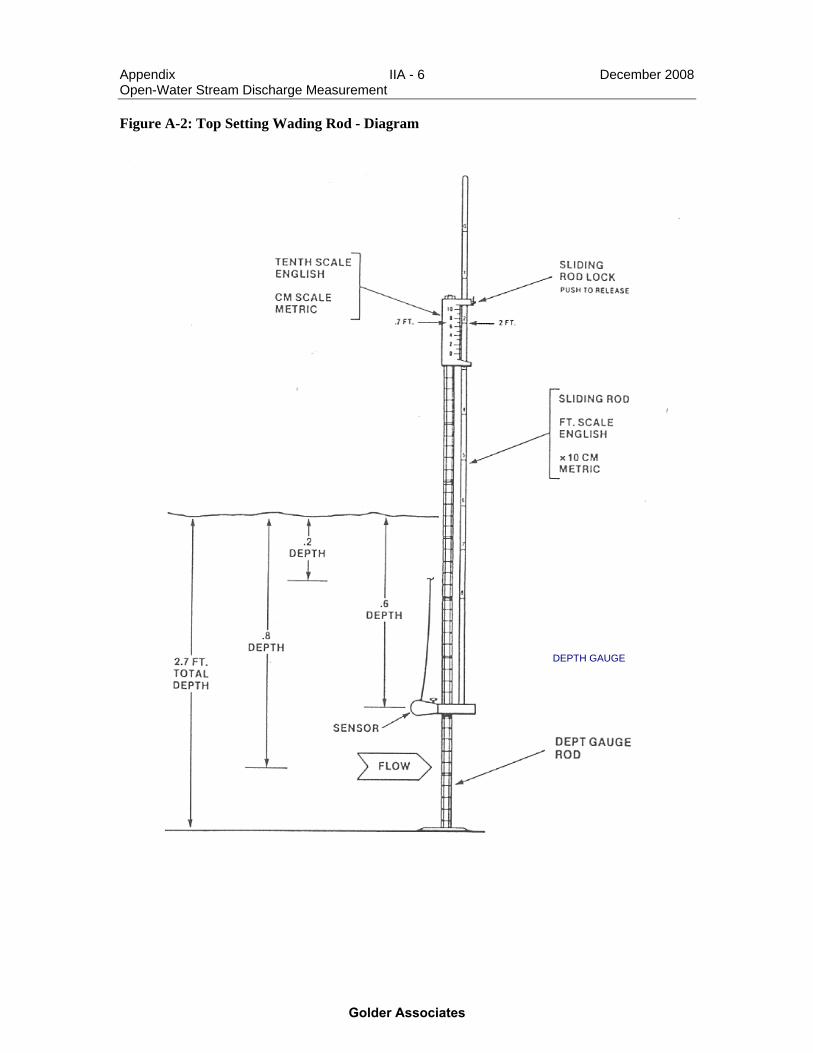
Appendix IIA - 6 December 2008 Open-Water Stream Discharge Measurement
Golder Associates
Figure A-2: Top Setting Wading Rod - Diagram
DEPTH GAUGE
ROD

APPENDIX II-B
VERTICAL SURVEY FOR STREAM CROSS-SECTIONAL AND REACH PROFILE

Appendix IIB - 1 August 2008 Vertical Survey for Stream Cross-Section and Reach Profile
Golder Associates
B-1 PURPOSE
This technical procedure outlines the methodology to be used for differential vertical survey using simple survey level equipment. This can be applied for the survey of stream cross-sections and profile. The technical procedure for vertical survey using total station equipment is different.
B-2 APPLICABILITY
This procedure is applicable to any personnel performing a vertical differential survey.
B-3 DEFINITIONS
Levelling Survey: To obtain the difference in elevation of terrain by tying it to a known datum or an assumed elevation.
Instrument Person: The person operating the differential level.
Rodman: The person holding the levelling rod.
Bench Mark (BM): A point where the elevation is known and it becomes permanent. An arbitrary datum for the first BM may be set to 100.00 m.
Temporary Bench Mark (TBM): A point where the elevation is assumed (temporary known elevation)
Turning Point (TP): A turning point is an intermediate point between benchmarks. The turning point allows the surveyor to move the instrument (level) and continue the survey without the need of a benchmark or temporary benchmark reading. In order to complete a turning point a backsight and foresight (as defined below) reading are needed.
Backsight (BS): The reading on a rod where the elevation of the point is either known (through a series of readings before a TP) or assumed (TBM, BM).
Foresight (FS): The reading on a rod where the elevation is unknown and it needs to be determined.
Height of Instrument (HI): The elevation of the line of sight from the instrument.
Figure B-1 illustrates these definitions.
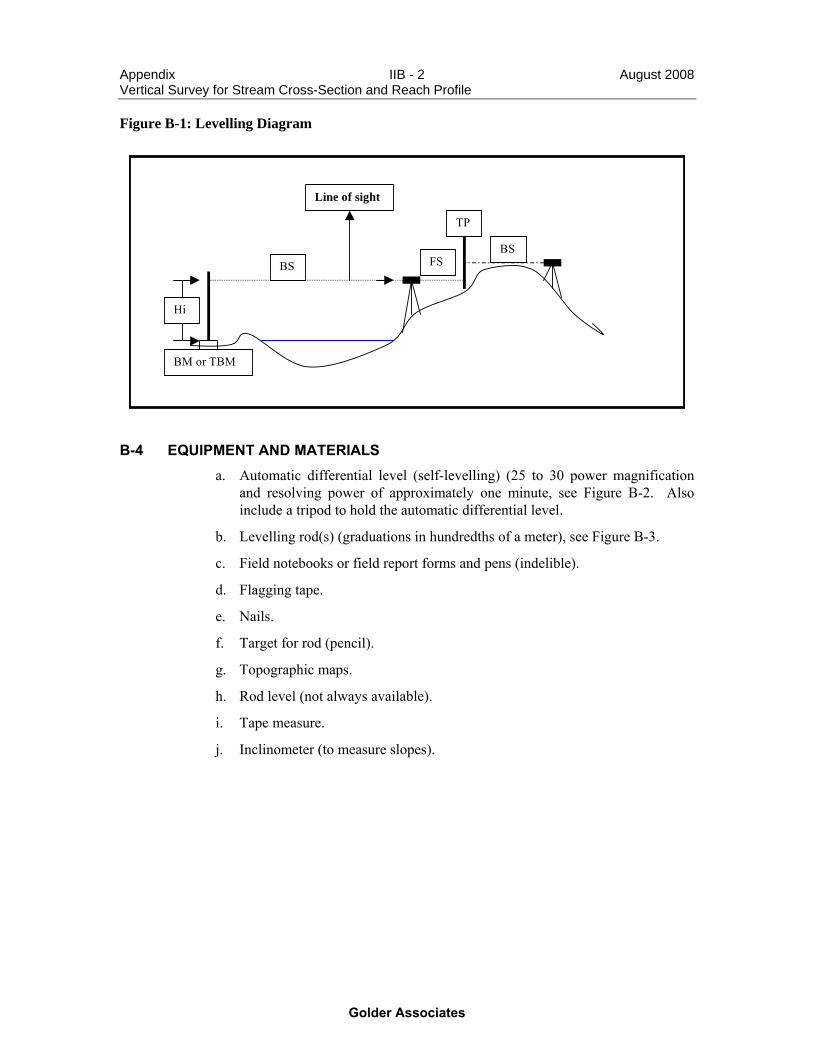
Appendix IIB - 2 August 2008 Vertical Survey for Stream Cross-Section and Reach Profile
Golder Associates
Figure B-1: Levelling Diagram
B-4 EQUIPMENT AND MATERIALS
a. Automatic differential level (self-levelling) (25 to 30 power magnification and resolving power of approximately one minute, see Figure B-2. Also include a tripod to hold the automatic differential level.
b. Levelling rod(s) (graduations in hundredths of a meter), see Figure B-3.
c. Field notebooks or field report forms and pens (indelible).
d. Flagging tape.
e. Nails.
f. Target for rod (pencil).
g. Topographic maps.
h. Rod level (not always available).
i. Tape measure.
j. Inclinometer (to measure slopes).
BM or TBM
TP
BSBS
Hi
Line of sight
FS

Appendix IIB - 3 August 2008 Vertical Survey for Stream Cross-Section and Reach Profile
Golder Associates
Figure B-2: Automatic differential level
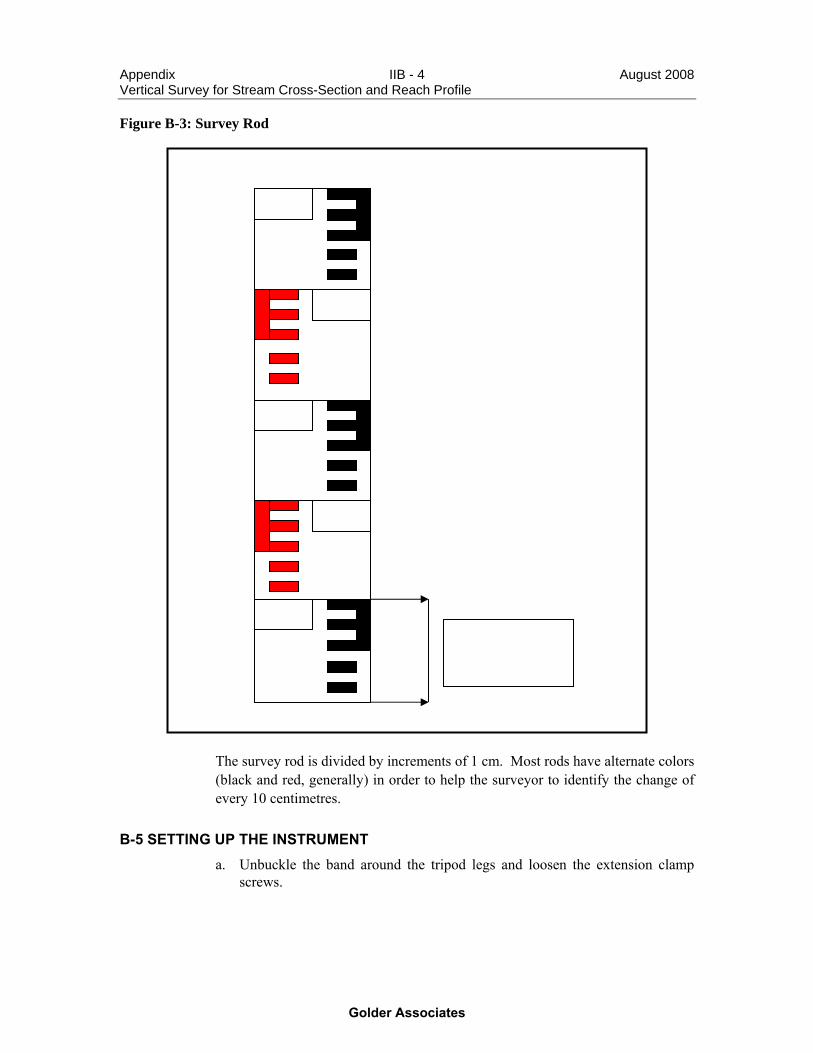
Appendix IIB - 4 August 2008 Vertical Survey for Stream Cross-Section and Reach Profile
Golder Associates
Figure B-3: Survey Rod
The survey rod is divided by increments of 1 cm. Most rods have alternate colors (black and red, generally) in order to help the surveyor to identify the change of every 10 centimetres.
B-5 SETTING UP THE INSTRUMENT a. Unbuckle the band around the tripod legs and loosen the extension clamp
screws.
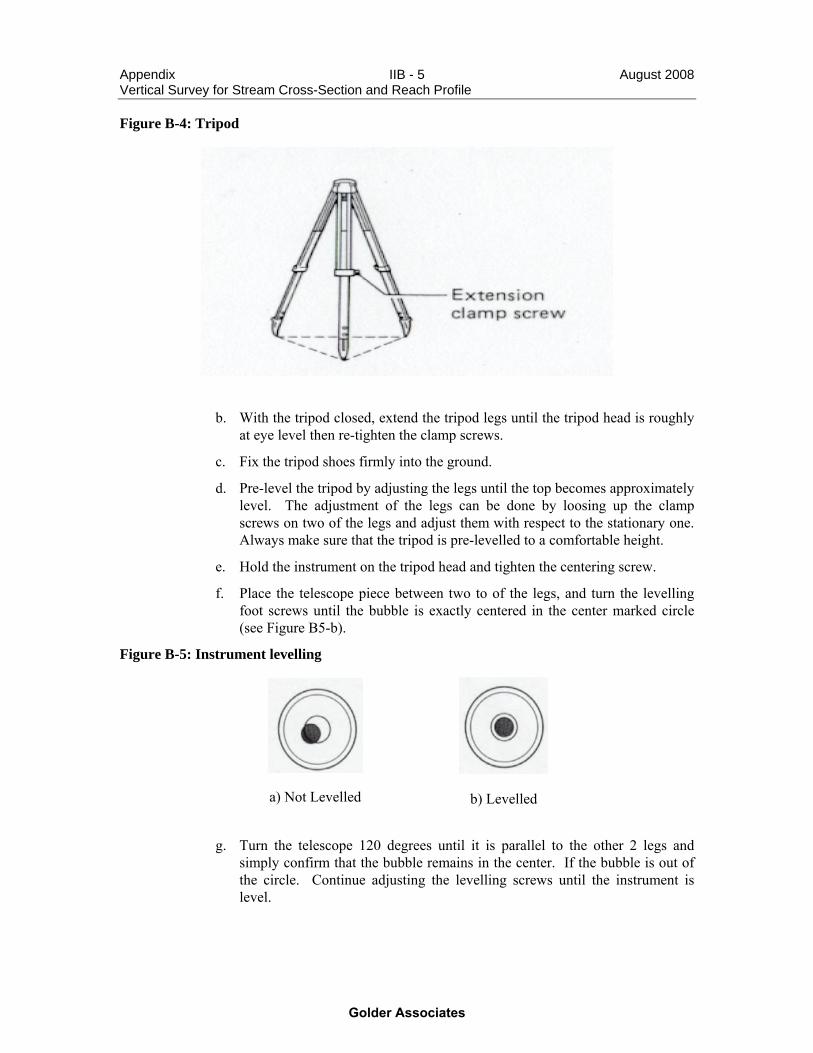
Appendix IIB - 5 August 2008 Vertical Survey for Stream Cross-Section and Reach Profile
Golder Associates
Figure B-4: Tripod
b. With the tripod closed, extend the tripod legs until the tripod head is roughly at eye level then re-tighten the clamp screws.
c. Fix the tripod shoes firmly into the ground.
d. Pre-level the tripod by adjusting the legs until the top becomes approximately level. The adjustment of the legs can be done by loosing up the clamp screws on two of the legs and adjust them with respect to the stationary one. Always make sure that the tripod is pre-levelled to a comfortable height.
e. Hold the instrument on the tripod head and tighten the centering screw.
f. Place the telescope piece between two to of the legs, and turn the levelling foot screws until the bubble is exactly centered in the center marked circle (see Figure B5-b).
Figure B-5: Instrument levelling
a) Not Levelled
b) Levelled
g. Turn the telescope 120 degrees until it is parallel to the other 2 legs and simply confirm that the bubble remains in the center. If the bubble is out of the circle. Continue adjusting the levelling screws until the instrument is level.
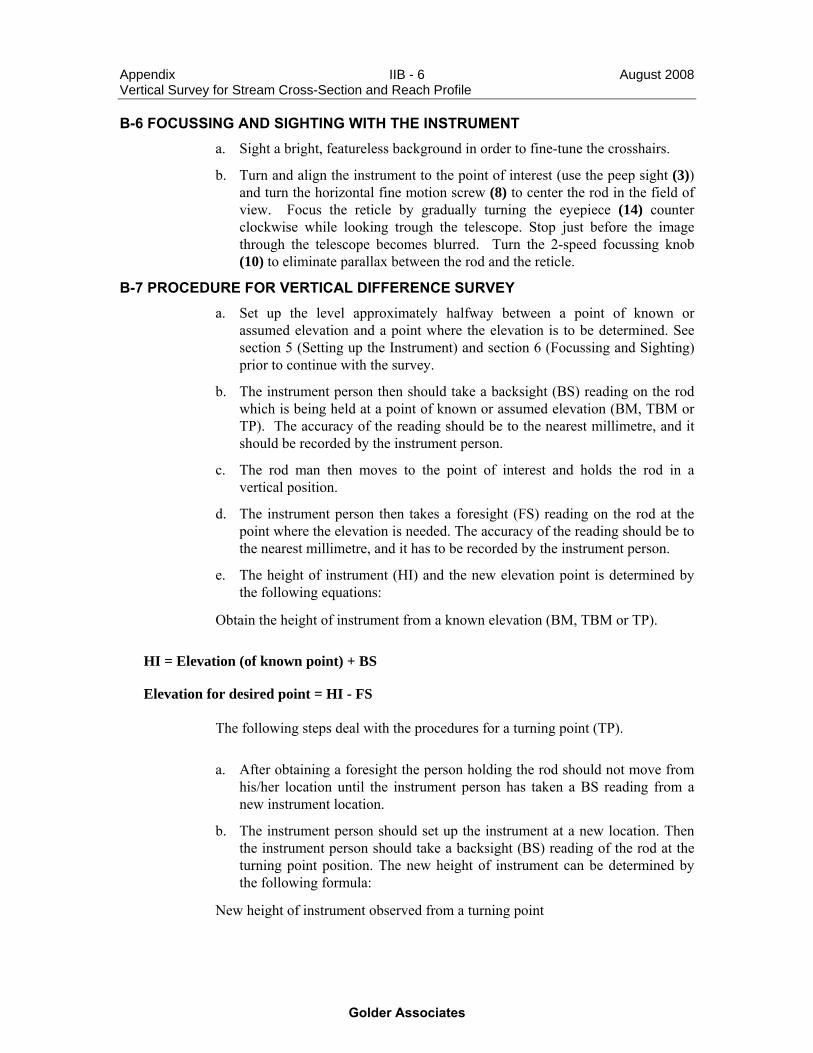
Appendix IIB - 6 August 2008 Vertical Survey for Stream Cross-Section and Reach Profile
Golder Associates
B-6 FOCUSSING AND SIGHTING WITH THE INSTRUMENT a. Sight a bright, featureless background in order to fine-tune the crosshairs.
b. Turn and align the instrument to the point of interest (use the peep sight (3)) and turn the horizontal fine motion screw (8) to center the rod in the field of view. Focus the reticle by gradually turning the eyepiece (14) counter clockwise while looking trough the telescope. Stop just before the image through the telescope becomes blurred. Turn the 2-speed focussing knob (10) to eliminate parallax between the rod and the reticle.
B-7 PROCEDURE FOR VERTICAL DIFFERENCE SURVEY a. Set up the level approximately halfway between a point of known or
assumed elevation and a point where the elevation is to be determined. See section 5 (Setting up the Instrument) and section 6 (Focussing and Sighting) prior to continue with the survey.
b. The instrument person then should take a backsight (BS) reading on the rod which is being held at a point of known or assumed elevation (BM, TBM or TP). The accuracy of the reading should be to the nearest millimetre, and it should be recorded by the instrument person.
c. The rod man then moves to the point of interest and holds the rod in a vertical position.
d. The instrument person then takes a foresight (FS) reading on the rod at the point where the elevation is needed. The accuracy of the reading should be to the nearest millimetre, and it has to be recorded by the instrument person.
e. The height of instrument (HI) and the new elevation point is determined by the following equations:
Obtain the height of instrument from a known elevation (BM, TBM or TP).
HI = Elevation (of known point) + BS
Elevation for desired point = HI - FS
The following steps deal with the procedures for a turning point (TP).
a. After obtaining a foresight the person holding the rod should not move from his/her location until the instrument person has taken a BS reading from a new instrument location.
b. The instrument person should set up the instrument at a new location. Then the instrument person should take a backsight (BS) reading of the rod at the turning point position. The new height of instrument can be determined by the following formula:
New height of instrument observed from a turning point

Appendix IIB - 7 August 2008 Vertical Survey for Stream Cross-Section and Reach Profile
Golder Associates
HI = HI* - FS + BS
Where HI* represents the height of the instrument prior to moving it to the new location
c. At the end of each levelling section, the survey shall close on the same point at which it was started. The difference in the original reading at that point and the final reading at that point is the closure error. Adjustment of intermediate allocation points shall be based on the lengths of line methods.
d. All measurements must be recorded in field notebooks or field report forms. Errors should not be erased but crossed out by a single slash and initialled and dated.
e. Field books or field forms should be submitted to the group leader or the project manager for review and approval.
B-8 HEIGHT DIFFERENCE AND ROD READING EXAMPLES a. Position the rod at point A (BM, TPB or TP) and take reading “a” (BS) on
the rod.
b. Position and sight the rod at point B and obtain the reading “b” (FS) on the rod. The difference a-b is the height difference h of B from A.
See Figures B-6 and B-7 for an illustration of the height difference and rod reading.
Figure B-6: Levelling Survey Example
Point A
“a” reading “b” reading
Point B
h
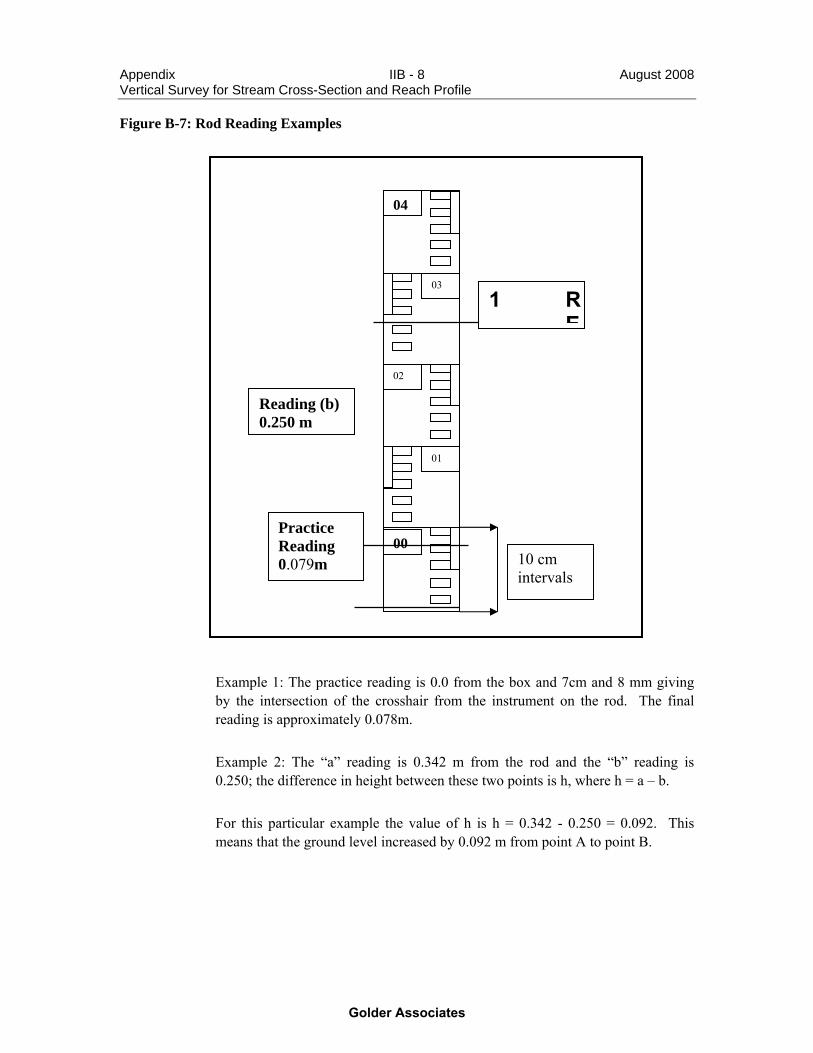
Appendix IIB - 8 August 2008 Vertical Survey for Stream Cross-Section and Reach Profile
Golder Associates
Figure B-7: Rod Reading Examples
Example 1: The practice reading is 0.0 from the box and 7cm and 8 mm giving by the intersection of the crosshair from the instrument on the rod. The final reading is approximately 0.078m.
Example 2: The “a” reading is 0.342 m from the rod and the “b” reading is 0.250; the difference in height between these two points is h, where h = a – b.
For this particular example the value of h is h = 0.342 - 0.250 = 0.092. This means that the ground level increased by 0.092 m from point A to point B.
02
04
01
00
03
10 cm intervals
1 RE
Reading (b) 0.250 m
Practice Reading 0.079m
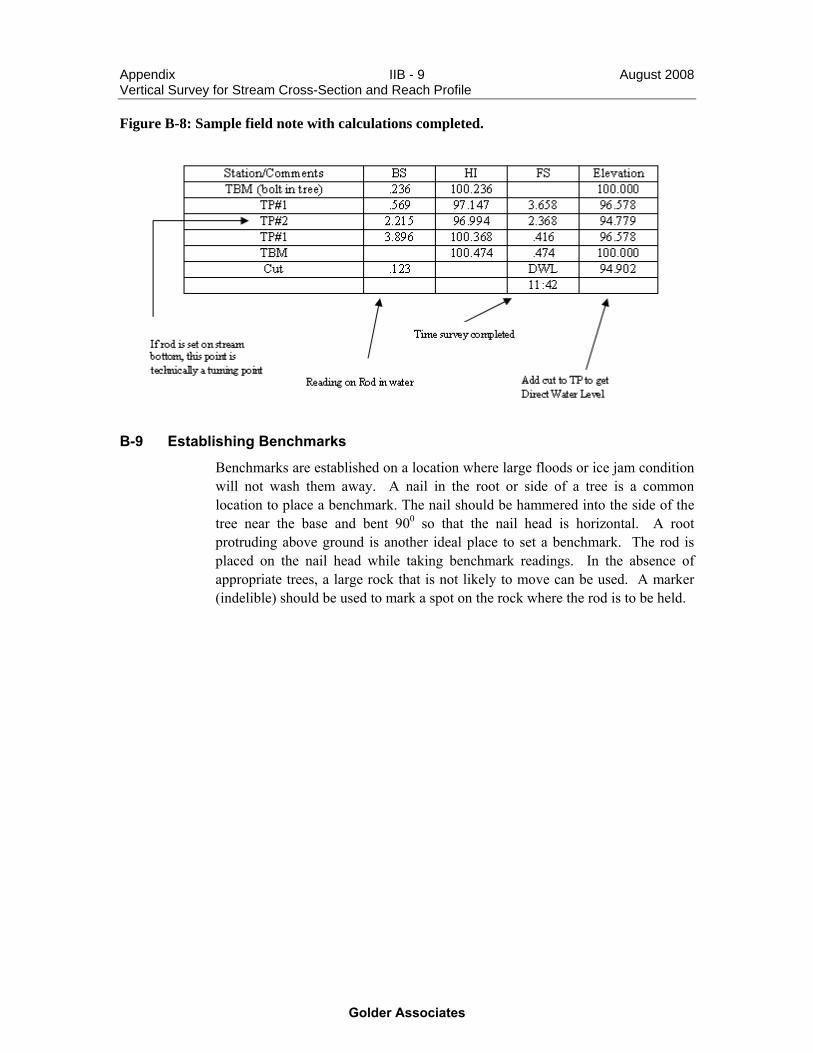
Appendix IIB - 9 August 2008 Vertical Survey for Stream Cross-Section and Reach Profile
Golder Associates
Figure B-8: Sample field note with calculations completed.
B-9 Establishing Benchmarks
Benchmarks are established on a location where large floods or ice jam condition will not wash them away. A nail in the root or side of a tree is a common location to place a benchmark. The nail should be hammered into the side of the tree near the base and bent 900 so that the nail head is horizontal. A root protruding above ground is another ideal place to set a benchmark. The rod is placed on the nail head while taking benchmark readings. In the absence of appropriate trees, a large rock that is not likely to move can be used. A marker (indelible) should be used to mark a spot on the rock where the rod is to be held.

APPENDIX II-C
BED SEDIMENT SAMPLING
Appendix IIC - 1 August 2008 Bed Sediment Sampling
Golder Associates
C-1 PURPOSE
This document describes the procedures for collecting bed-material samples in streams in open-water conditions.
C-2 APPLICABILITY
Two main variations of procedure include the cases of gravel bed material and sand bed material. The procedures described are selectively applicable for these variations by any technical person involved with sampling.
RC-3 DEFINITIONS
Bed load: the material moving in almost continuous contact with the streambed, being rolled or pushed along the bottom by the force of the water.
Bed-load discharge: the weight of bed load passing a cross section of a stream per unit of time.
Bed material: the sediment mixture of which the streambed is composed.
Bed-material sampler: a device for sampling bed material under water.
Bulk sampling: a sampling method where a predetermined volume (mass) of subsurface material is collected.
Grab sample: a sample taken manually from the surface of the stream, usually without using a sampler. Suspended-sediment concentration determined from a grab sample is usually not representative of the true concentration in the cross section.
Gravel: material of particle size between 2 and 64 mm.
Particle size: linear dimension used to quantify the size of a particle, usually expressed as a diameter in millimetres.
Particle-size distribution: cumulative frequency distribution of the relative amounts of particles coarser or finer than specified sizes.
River reach: section of river having similar morphology. The length is usually restricted on the basis of being a specified number of channel widths.
Sand: material of particle size between 0.062 and 2 mm.
Appendix IIC - 2 August 2008 Bed Sediment Sampling
Golder Associates
Surface: single-grain layer of the bed top.
C-4 REFERENCES AND SUGGESTED READING
Ashmore, P.E., T.R. Yuzyk and R. Herrington. 1988. Bed-Material Sampling in Sand-Bed Streams. Sediment Survey Section, Water Resources Branch, Inland Waters Directorate, Report #IWD-HQ-WRB-SS-88-4. 47p.
Boning, C.W. 1990. Programs and Plans - Policy and Guidelines for the Collection and Publication of Bedload Data, United States Geological Survey, Office of Surface Water Technical Memorandum No. 90.08, July 24, 1990 [URL http://water.usgs.gov/public/admin/memo/SW/sw90.08 and sw90.08att].
Church, M.A., D.G. McLean, and J.F. Wolcott. 1987. River Bed Gravels: Sampling and Analysis, in: Sediment Transport in Gravel-Bed Rivers, John Wiley and Sons Ltd., p. 43-88.
Jansen, P. 1979. Principles of River Engineering. Pitman, London, 509 p.
Kellerhals, R. and D.J. Bray. 1971. Sampling Procedures for Coarse Fluvial Sediments. Proc. Am. Soc. Civ. Eng., J. Hydraul. Div., 97, p. 1165-1180.
Klingeman, P.C. and W.W. Emmett. 1982. Gravel Bedload Transport Processes, in Gravel-Bed Rivers, Edited by R.D. Hey, J.C. Bathurst and C.R. Thorne, John Wiley and Sons, New York.
Long Yuqian. 1989. Manual on Operational Methods for the Measurement of Sediment Transport. World Meteorological Organization Operational Hydrology Report No. 29, WMO-No. 686. 169p.
Meller, B.D. 1997. “Hydrometric Survey Techniques.” Distance Delivery Course, Institute for Renewable Resource Management, Lethbridge Community College, AB, Canada.
Water Survey of Canada. 1992. “Hydrometric Technician Career Development Program.” Compact Disc, Environment Canada.
C-5 DISCUSSION General Safety
• Beware of stream and flow conditions that are unsafe for wading. A rough guideline for determining if a stream can be waded safely is to avoid entering a stream where the product of the stream velocity (m/s) and the depth (m) is

Appendix IIC - 3 August 2008 Bed Sediment Sampling
Golder Associates
greater than one. This is only a guideline and other considerations should be made.
• Consider using safety rope if conditions are marginal, but not threatening (e.g., waterfalls, algae-covered rocks etc. upstream or downstream from the site).
• For more information refer to the Golder Associates Ltd. Health and Safety Manual for details of safety procedures, and the Water Survey of Canada References in Golder’s Information Centre.
Site Selection
Desirable characteristics include that the site be located at or near a hydrometric/sediment station where possible, cover a uniform reach, be morphologically stable, away from the confluence of two streams, and have limited aquatic growth.
Site Selection for Gravel-bed Streams • Sampling for gravel-bed streams is usually done on exposed bars; however,
submerged beds may also be sampled using certain techniques.
• To overcome the problem of high spatial variability exhibited in fluvial gravels, the head of a major bar is chosen as indicative of the local bed conditions.
• Since there are many different types of sedimentary bars, a hierarchy has been established to aid in the site selection process:
o Mid-channel and diagonal bars are considered to be the most ideal sites, because they are directly exposed to higher velocities in the stream and therefore to bedload transport.
o Point bars are next in preference because velocities are slightly reduced due to redirection of flow.
o Channel side bars, or lateral bars are the least suitable because velocities are reduced severely due to boundary or bank effects.
o The riffle, although not belonging to this general class, is identified for use in small streams where exposed bars are scarce.
• To provide meaningful data for gravel beds, several sites will need to be sampled within a river reach. Where possible, select three sites: one nearby, one upstream, and one downstream of the flow measurement site. The availability of suitable sites determines the number of sites that can be sampled.
• When selecting sites, take care to select a bar that has not been disturbed. Cattle or tractor crossings are unsuitable. Avoid a bar that may be made up of material from a recent, local bank slump. When a number of sites are sampled, be consistent in bar type.
Site Selection for Sand-bed Streams • Sampling for sand-bed streams is usually done in-stream.
Appendix IIC - 4 August 2008 Bed Sediment Sampling
Golder Associates
• A reach approach to sampling has been adopted to account for spatial variability.
• Five cross sections (comprising 3 to 5 verticals) are recommended. The centre cross section should correspond to the flow measurement site, with two sections spaced equally up and downstream of the site.
Other relevant measurements
In order to properly apply the results of the bed load measurement, it may be necessary to measure other stream parameters at the same time as the bed load. Some of these are essential and others may be required for specific applications, so the goal of the study must be considered when deciding which parameters to measure. Potential information requirements include:
• Stream discharge;
• Stream geometry (cross-section and/or profile);
• Suspended sediment discharge; and
• Bed material gradation.
General Considerations for Sampling Gravel-bed Streams
• The accuracy of the field scale readings over a range of known weights should be verified and the scale calibrated at this time if necessary.
• Once in the field a suitable sampling site is chosen, the site information documented. (Plan view of sampling site, site description, GPS location, and support photos)
o The area is sketched to identify exactly where the samples were collected in the reach.
• If possible, to maximize the number of possible sites, conduct gravel-bed sampling when water levels are relatively low. This means that most sampling will be conducted during the summer and fall periods.
• Avoid rainy days because the added moisture will increase weighing errors.
• Windy days are also unsuitable because the wind creates the difficulty in reading the scale.
• In most cases one set of samples is sufficient to document a given reach of a river. There will be the need to repeat survey such as in the case where the flow regime and the bed conditions have been altered.
Sand-bed Material Streams • For sand-bed sampling it maybe necessary to sample over various discharges.
• The size composition of the bed material should be known for various stages of flow since at higher stages layers in the bed may be uncovered which are
Appendix IIC - 5 August 2008 Bed Sediment Sampling
Golder Associates
not exposed to flow at low stages. At lower flows some deposition will occur.
• At least five replicate samples should be collected at a vertical in order to approach an acceptable error in mean size of a given fraction of 10% with a probability of error of 0.1.
• The sampled layer is the upper few centimetres of the bed and sample size should be at least 0.2 kg.
• When the width of the main channel is less than 500 m a minimum of three sampling verticals are recommended; between 500 and 1,000 m, three to five are recommended; and greater than 1,000 m, five to seven could be used.
• Several cross-sections will be required to obtain representative results.
Procedure for Grab Sampling (Ekman, Ponar and Peterson samplers) • Label sample container with indelible ink marker.
• Grab sampler should be rinsed twice with ambient water prior to sampling to ensure no sediment or other material are attached. This should be done with the jaws open. Be sure to check that sediments have not dried on to the sampler. If so, remove dry material to prevent contamination and rinse sampler again.
• Using a graduated line attached to the top of the sampler, lower it slowly until it touches the bottom. If using the Ekman grab, be sure to retain the messenger (small weight used to trigger sampler) at the surface. Be careful not to touch the bottom too abruptly as surface sediments could be disturbed by the mouth of the sampler which would result in an inaccurate sample.
• Making sure the graduated line is as vertical as possible, release the messenger. Maintain some tension of the line to ensure that the messenger falls freely (Note: when using the Ponar or Peterson grabs, which do not have a messenger, use the appropriate method to trigger the sampler).
• Once you feel the messenger trigger the sampler, begin to slowly raise it off the bottom. It is important to raise the grab slowly otherwise fine sediments may be lost.
• Once the grab reaches the surface, the spring loaded jaws should be pried open and the sample put into a flat bottomed pan or similar container. The entire sample or the top layer of the sample can then be scooped into containers. Sample containers (bottles or bags) should be stored appropriately, as instructed by the analytical laboratory.
Procedure for Volumetric Bed-load Sampling (suitable for Helley-Smith bed load sampler)
See Appendix I-C-A for equipment description.

Appendix IIC - 6 August 2008 Bed Sediment Sampling
Golder Associates
• Measurements of bed load using the Helley-Smith sampler involves performing a number of point measurements across the stream and combining these to determine an estimate of total bed load.
• To perform a point measurement of bed load, the sampler is lowered to the stream bed and held in place for a prescribed period of time before being retrieved. It is important that the sampler point directly into the flow, and that it is seated firmly against the streambed without “scooping” or disturbing bed material and introducing it into the nozzle.
• When using cable-suspended samplers, it is recommended that a tether line be connected to an upstream support. This will assist in placement and retrieval of the sampler and reduce the potential for downstream drift, cross-stream “swimming” and scooping of bed material.
• Samples should be taken for the same length of time at each station. The specific amount of time will depend on the amount of material being transported as bed load, but will generally be between 30 and 60 seconds. If it takes longer than this to collect a measurable amount of sediment, the rate of transport is likely insignificant. It is recommended that before sampling begins, a test sample be taken at a high-velocity section to determine whether there is significant bed load and to select a sampling duration that will ensure that the sampling bag does not fill to more than 40% of capacity at any station.
• One sample shall be taken at each station, starting from one bank and working across to the opposite bank. Each sample shall be packed in a separate plastic bag and labelled with the stream name, transect, station number, date and time. The procedure shall then be repeated, sampling the same stations in the same sequence, to provide a replicate sample.
• Natural stream bed load sample replicates (minimum of 2 sets of samples) should be collected. If a large difference between sample sets is detected, additional replicates should be made. Studies intended to characterize bed load impacts due to in-stream work should resample intensively during the work program.
Data Analysis
The analysis of bed load samples involves determining the discharge of sediment and its particle size distribution. Composite samples may be used to simplify the analysis, though this provides less detailed information.
Composite Samples
The collected bed load samples may be combined in a number of ways to create a composite sample. Only samples with equal sampling times and width increments should be combined, and until the sampling variability of a site is determined, all samples should be analyzed individually. The lower analysis effort produced by a composite sample is balanced by the reduction in information concerning the variability of the bed load in space and time, so it is
Appendix IIC - 7 August 2008 Bed Sediment Sampling
Golder Associates
important to consider the goals of the study in choosing a composite sample method. Options include:
• Each sample individually (40 analyses);
• Composite samples from each station (20 analyses);
• Composite samples from each traverse of the transect (2 analyses); or
• Composite of all samples taken from the transect (1 analysis).
Bed Load Discharge Calculation
Where samples from different stations have not been combined, it is possible to determine the distribution of bed load across the stream. Samples should be dried and weighed after organic material has been removed (either by physical removal or ashing). The bed load discharge rate can then be determined by dividing the mass by sampling time and the width of the channel represented by the sample. The rates for individual stations should be plotted against the transect sampling position, and the resulting curve will show the distribution of bed load across the stream. The area under this curve will be equal to the total bed load discharge rate of the stream, with units of mass per unit time.
When samples from different stations have been combined, the mass of the entire sample should be divided by the stream width and sampling time to provide a value of total bed load discharge rate, again with units of mass per unit time.
When measuring natural bed load discharges, it is important to recognize that this may vary significantly with stream discharge, season of the year and sediment availability. Bed load may not vary linearly with flow velocity, as sediment of a given size is generally stable below a threshold value of shear stress, above which movement begins. Thus it may not be accurate to interpolate between two measured values on a rating curve which relates bed load and stream flow. The goals of the study should be carefully considered when choosing sampling times and interpreting the resulting data.
Particle Size Analysis
A particle size (sieve) analysis should be conducted on each individual or composite bed load sample. This will provide information about the particle size distribution, which may vary with the flow conditions or season. It may not be necessary to conduct a particle size analysis on every sample, though enough samples should be analyzed to adequately define the distribution. Particle size analysis should also consider the particle distribution of suspended sediments which may be captured by the sampler. The mesh bag size should be selected based on expected suspended and bed load characteristics, but quality control includes verifying and adjusting for particle size distribution. Other particle size

Appendix IIC - 8 August 2008 Bed Sediment Sampling
Golder Associates
analyses should be conducted on bed material and suspended sediment samples obtained from the site.
C-6 EQUIPMENT Sampling Equipment
The following is a list of the equipment recommended for sediment sampling:
• Pre-cleaned sample containers from analytical laboratory;
• Sampling equipment;
• Metal tray; and,
• Coolers and ice.
The following is a list of equipments required during winter condition:
• Ice auger;
• Snow shovel (n = 2);
• Propane heaters (n = 2);
• Propane cartridges (n = 4);
• Methanol (n = 4);
• Tripod and pulley assembly;
• Tube brush;
• Strainer; and,
• Ice fishing shack.
Field Location Equipment and Logs
The following is recommended for the complete documentation of sediment samples:
• Field record sheets;
• Maps of area for site locations;
• Indelible ink pens and felt tip markers and pencils;
• 50 metre long tape measure;
• Survey flagging tape; and,
• GPS unit.

Appendix IIC - 9 August 2008 Bed Sediment Sampling
Golder Associates
Health and Safety Equipment • Waders and waterproof gloves;
• Suitable clothing for prolonged water work: heavy socks, warm pants, rain gear, etc.;
• First aid kit; and,
• Approved personal floatation device.
Appendix IIC - 10 August 2008 Bed Sediment Sampling
Golder Associates
APPENDIX I-C-A: Helley-Smith Bed Load Sampler
This device has been in use since its development by the United States Geological Survey (USGS) in the late 1960’s and (with modifications) was approved as a tentative standard by the USGS in 1985 (Boning, 1990). It is constructed of stainless steel and is available in a range of weights and sizes for a variety of applications. Lighter models are mounted on rods and may be held against the streambed by hand. These are intended for use in shallow and/or relatively quiescent streams. Deeper or higher-energy channels may require the use of a cable-suspended model. The greater weight of these samplers allows them to be held against the streambed by gravity, even in rapid, turbulent flows.
The sampler has an open nozzle, either 76 mm or 152 mm square, which faces upstream to collect bed load. No firm guidelines exist for the nozzle size, though it is recommended that it be between two and five times the size of the largest particle likely to be collected (Boning, 1990). The cross-sectional area of the stainless steel collection tube expands downstream to reduce the influence of the sampler on stream velocity. All of the Helley-Smith samplers have an expansion ratio (Adownstream/Aupstream) of 3.22. A modification of the Helley-Smith design, called the FIASP sampler, has an expansion ratio of 1.40. This design was affirmed as the USGS standard in 1988, though acceptance of data acquired using the larger expansion ratio was also recommended as only small differences relative to other potential errors were anticipated.
The downstream end of the sampler is fitted with a sediment collection bag. This is made of permeable fabric, with the choice of mesh size depending on the nature of the stream being sampled. Commonly used sizes include 0.25, 0.5, 1.0 and 2.0 mm, with the 0.25 mm mesh being most popular. Increasing the mesh size reduces the risk of clogging with fines or organics, but the potential loss of fine bed load must be considered. The standard bag for a 76 mm sampler has a volume of 2,190 cm3, though oversize bags of up to 6,000 cm3 have been used in applications where clogging due to fines or organic material was a concern.
A cable-suspended Helley-Smith sampler is shown in Figure C-1, and details of available models are summarized in Table C-1.
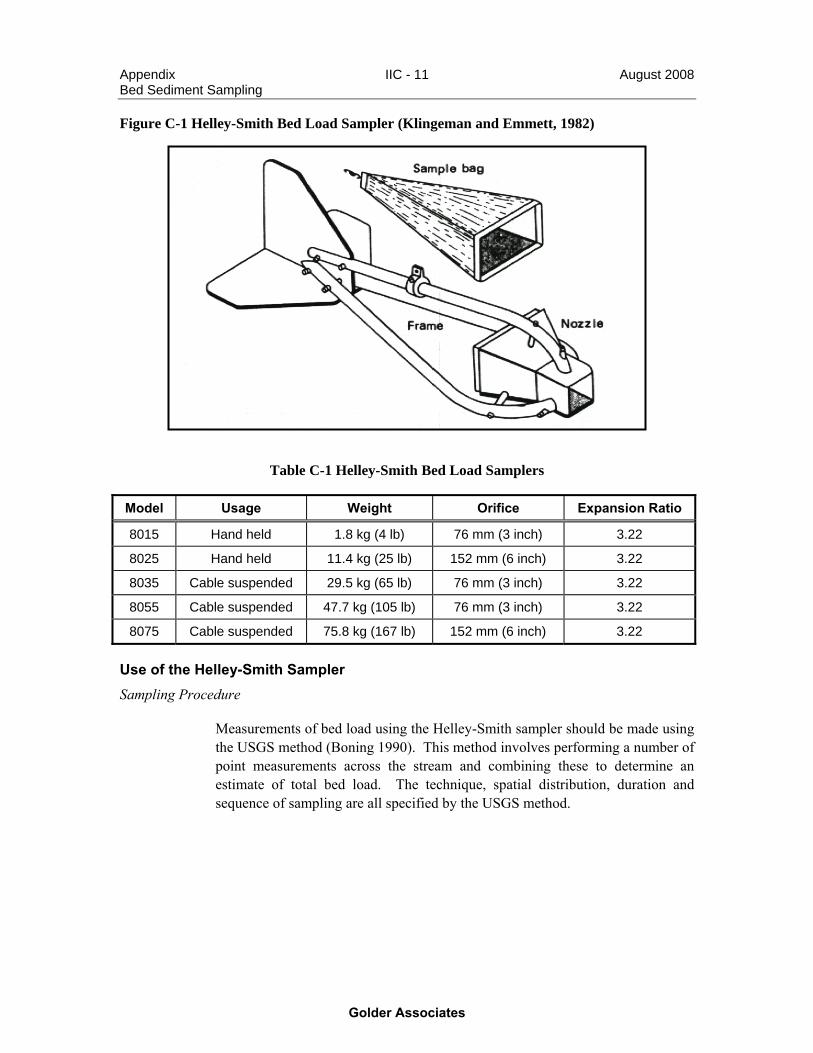
Appendix IIC - 11 August 2008 Bed Sediment Sampling
Golder Associates
Figure C-1 Helley-Smith Bed Load Sampler (Klingeman and Emmett, 1982)
Table C-1 Helley-Smith Bed Load Samplers
Model Usage Weight Orifice Expansion Ratio
8015 Hand held 1.8 kg (4 lb) 76 mm (3 inch) 3.22
8025 Hand held 11.4 kg (25 lb) 152 mm (6 inch) 3.22
8035 Cable suspended 29.5 kg (65 lb) 76 mm (3 inch) 3.22
8055 Cable suspended 47.7 kg (105 lb) 76 mm (3 inch) 3.22
8075 Cable suspended 75.8 kg (167 lb) 152 mm (6 inch) 3.22
Use of the Helley-Smith Sampler Sampling Procedure
Measurements of bed load using the Helley-Smith sampler should be made using the USGS method (Boning 1990). This method involves performing a number of point measurements across the stream and combining these to determine an estimate of total bed load. The technique, spatial distribution, duration and sequence of sampling are all specified by the USGS method.

Appendix IIC - 12 August 2008 Bed Sediment Sampling
Golder Associates
Limitations of the Helley-Smith Sampler
The characteristics of some streambeds or their bedforms may render them unsuitable for the use of the Helley-Smith bed load sampler. These include the following physical conditions:
• Bed material to soft to support the sampler and prevent it from sinking into the streambed;
• Stream velocity is too high to allow the sampler to sit on the streambed;
• Irregular bed material composition interferes with good fit of sampler to the streambed;
• Bed form or composition enhances potential for scooping of bed material during retrieval (in general, if dunes with length/height < 20 or if D50 < 1.5 mm and significant portions of coarse material are not present);
• Median diameter of bed material, D50 < 1.0 mm (unless D10 > 0.25 mm);
• D50 of bed material subject to movement > 8 mm (unless D90 < 32 mm) (76 mm sampler only); or
• Organic debris transport is significant enough to clog the sampling bag.

APPENDIX II-D
STREAM MAPPING
Appendix IID - 1 August 2008 Stream Mapping
Golder Associates
D-1 PURPOSE
This technical procedure details the stream mapping system for a watercourse. It is recommended that these steps be included in a detailed geomorphic stream survey.
D-2 APPLICABILITY
This technical procedure is for stream-mapping of small to medium sized streams.
D-3 DEFINITIONS
The following definitions and/or descriptions are directly or indirectly related to stream mapping:
Backwater: A backwater section in a stream is a localized area of variable size exhibiting reverse flow direction. This is generally produced by bank irregularities, and the velocities are variable but generally lower than main flow. Substrate in a backwater is similar to adjacent stream reach with higher percentage of fines.
Bankfull Channel Width: The horizontal distance along a transect line from stream bank to stream bank (e.g., where rooted vegetation is present on one bank to where rooted vegetation is present on the opposite bank) at the normal high water marks measured at right angles to the direction of flow.
Bank Stability: The stability of banks is the capability of a watercourse to maintain stable banks with minimal erosion and shedding of bank material or vegetation into the watercourse. Stability is dependent on factors such as bank slope, bank material, evidence of seepages, undercutting, erosion and slumping.
Bank(s): Banks are components of a watercourse. They comprise the borders of the stream channel and form the typical boundaries of a channel. Banks are only in contact with the water during high flow or flood events. They typically have rooted vegetation to distinguish them from the normally active channel.
Beaver Dam: A beaver dam is a barrier of wooden and other organic debris constructed by beavers across a slow moving stream to form a pond behind the dam for habitat.
Cascade: A cascade is a series of stream sections with high gradient and velocity. A cascade may have short vertical sections, with armoured substrate. Flow in a cascade is extremely turbulent with entire water surface broken.

Appendix IID - 2 August 2008 Stream Mapping
Golder Associates
Channel Form: Channel form refers to the cross-sectional shape of the channel as defined by the width-to-depth ratio of the channel. Channel form will range from deeply incised (low width-to-depth ratio) to broad (high width-to-depth ratio).
Channel Unit: Channel units are the hydraulic and morphological features of a stream channel. A channel unit is a section of channel which is homogeneous with respect to water depth and velocity, and is separated from other channel units by gradients in these parameters. The most common channel units are pool, riffle and run.
Channel: A channel is the main component of a watercourse, with the area that typically has flowing water, on at least a seasonal basis, and is usually defined by the area of the stream substrate. A channel is distinguishable from banks since it has contact with flowing water for at least a portion of each season which usually prevents establishment of permanent vegetation.
Chute: A chute is an area of stream constriction, usually due to bedrock intrusions. A chute section is associated with channel deepening and increased velocity.
Fall: A fall is a stream section with high water velocity falling over a vertical drop.
Flat: A flat is a stream section characterized by very low gradient, low velocity and near-laminar flow. A flat is differentiated from pool by high channel uniformity and lack of scour.
Impoundment Pool: An impoundment pool is an area that is formed behind dams. Such pools tend to accumulate sediment/organic debris more than scour pools.
Ledge: A ledge is an area of bedrock intrusion into the stream, often associated with chute or plunge pool.
Pool: A pool is a stretch of a stream in which the water depth is above average and the stream velocity is quite low. A stream pool may be bedded in sediment or armored with gravels; in some cases the pool formations may have been formed as basins in bedrock materials.
Rapids: Rapids are sections with extremely high velocity. Rapids are deeper than riffle, and carry extremely coarse (large cobble/boulder) substrate.
Riffle: A riffle (also known as a swift) is a shallow stretch of a stream, where the current is above the average stream velocity and where the water forms small
Appendix IID - 3 August 2008 Stream Mapping
Golder Associates
rippled waves as a result. Riffles are formed with broken surface due to submerged/exposed bed material, and they often consist of coarse substrate.
Run: A run in a stream is a section deeper than riffles and shallower than pools. Stream velocity and bed material type varies within this channel unit.
Shoal: A shoal is a landform within or extending into a stream, composed of sand, silt or small pebbles. Alternatively termed sandbar or sandbank, a bar is characteristically long and narrow (linear) and develops where a stream promotes deposition of granular material.
Slough: A slough is a non-flowing waterbody isolated from flowing waters except during flood events.
Snye: A snye is a discrete section of non-flowing water connected to a flowing channel only at its downstream end, generally formed in a side channel or behind a peninsula.
Stream Confinement: Stream confinement refers to the confinement of the watercourse within the boundaries of the floodplain. It is the degree to which the lateral movement of the stream channel is limited by terraces or valley walls.
Stream Gradient: The slope of the streambed over which the stream runs. Some stream characteristics are directly related to the gradient. Examples include average velocity, substrate coarseness, and presence and extent of various channel units.
Stream Map: A stream map is a sketch or map showing the alignment of a watercourse or watercourses, boundaries of water bodies and the extent of associated hydrologic and terrestrial features (e.g., floodplain vegetation and configuration)
Stream Pattern: Stream pattern describes the sinuosity of the stream or the degree to which the stream deviates from straightness. Sinuosity is the stream meander pattern which can range from straight to tortuously meandering.
Substrate: Stream substrate is the material found on the bottom of the channel portion of the watercourse. It refers to the surficial deposits that can be seen when viewing the streambed. The substrate is evaluated with respect to particle size composition, which can range from fine sediments through gravels, cobbles, boulders and bedrock. A substrate evaluation, during stream mapping, is conducted by visual observation or by collected a substrate sample based on a
Appendix IID - 4 August 2008 Stream Mapping
Golder Associates
technical procedure (e.g., Appendix I-C). The observer estimates the percentage of the substrate particles, by surface area, in each of the size categories.
Top of Bank: Where the stream channel meets the floodplain on a river bank.
Undercut Bank: An undercut bank is an eroded section of the bank at the base by flowing water, allowing water to be present underneath a portion of the bank.
Watercourse: A natural or artificial waterway which periodically or continuously contains moving water. It has a definite channel and banks, which normally confine water and displays evidence of fluvial processes.
Wetted Width: The width of the water surface measured at right angles to the direction of flow.
D-4 REFERENCES AND SUGGESTED READING
Golder Associates Ltd. 2005. Technical Procedure TP-8.5-1: Watercourse Habitat mapping System. Aquatics Division, Golder Associates Ltd. Calgary.
For bed sediment sampling:
Water Survey of Canada. 1992. “Hydrometric Technician Career Development Program.” Compact Disc, Environment Canada.
Schmidt, N and M. Bender. 1998. Golder Bed Load Sampling. Water Resources Engineering Group. Golder Associates Ltd., Calgary. r:\active\_2005\1326\05-1326-031 nserc\final reporting\final report\main report\final report_alluvial channels_dec 08_05-1326-031.doc
D-5 DISCUSSION
A Stream Map can be prepared on a base map showing the survey stream reach using an aerial photo, a NTS map, or other previous survey information. It is preferable to develop this base map prior to the survey (i.e. at the office), however, in the absence of adequate information, previous surveys or air photos, it can be developed during the stream mapping task itself.
A Stream Map may include, but is not limited to, the following features relevant to the morphology of stream:
• Channel plan-form along the length of the reach should be drawn;
Appendix IID - 5 August 2008 Stream Mapping
Golder Associates
• Width of floodplain, or offsets to the boundaries of the floodplain from the stream should be noted;
• Bank slopes and approach slopes should be recorded;
• Tributary confluences, including the tributary flow and wetted widths should be recorded;
• Type, density and location of vegetation on floodplain, banks and stream bed should be recorded:
o Overhanging vegetation should be classified into trees, shrubs and grass;
o Inundated vegetation should be classified into inundated terrestrial vegetation, emergent vegetation and submergent vegetation; and,
o Species or genus of vegetation should be recorded where possible. • Location and approximate size of riffles, runs, shoals, pools, backwater,
rapids, snye and sloughs should be recorded;
o Bed and bank substrates, at the locations of these features, should be classified into gravel, sand, silt and clay; and,
o Stream discharge/velocity, at the locations of these features, should be classified into low, medium or high; where possible approximate field methods (example: using a float and a stop watch to determine the time taken for the float to travel over a specified distance) should be used to determine flow velocity and discharge.
• Qualitative assessment of bed and bank material, and any changes along the length of the stream reach should be noted;
• Location, length, and the present condition (intact or breached) of beaver dams should be noted ;
• Locations of significant debris, collapsed banks, eroded banks and undercutting banks in the stream should be noted;
• Locations of surveyed cross-sections should be recorded; and
• Locations where discharge measurement are taken should be recorded.
Features shown on a stream map should also be documented in a field note book, and supported by appropriate site photographs (e.g., Appendix V).
The Stream Map should be drawn by using appropriate symbols to show specific features, and a legend should be provided in the map to explain these symbols.
Other pertinent information that is to be provided in a stream map includes the following:
• Date;
• Personnel;
Appendix IID - 6 August 2008 Stream Mapping
Golder Associates
• Project/Phase/Task numbers;
• Stream name or watershed (i.e., unnamed tributary to);
• Site Identifier: name/number;
• Site Location - general description;
• UTM coordinates of upstream and downstream boundaries of mapped section;
• (with NAD and Zone);
• 1:50,000 NTS map reference (e.g., 74 E/6);
• Length of watercourse mapped (m);
o Use hip-chain for small watercourses or measure off of map for larger streams ; and,
o Record length of each channel unit. • Discharge – watercourse discharge at the time of the mapping or general
rating of stage/flow as low, moderate, high;
• North arrow; and,
• Map scale or label as “schematic only – not to scale”.
APPENDIX III
OSR FLUVIAL GEOMORPHIC DATABASE
(OSR Fluvial Geomorphic Database is available on request from Golder Associates.)

APPENDIX IV
FLUVIAL GEOMORPHIC DATA SUMMARY SHEETS
(One summary sheet is provided as an example. Summary sheets for the other surveyed stream reaches are available on request from Golder Associates.)
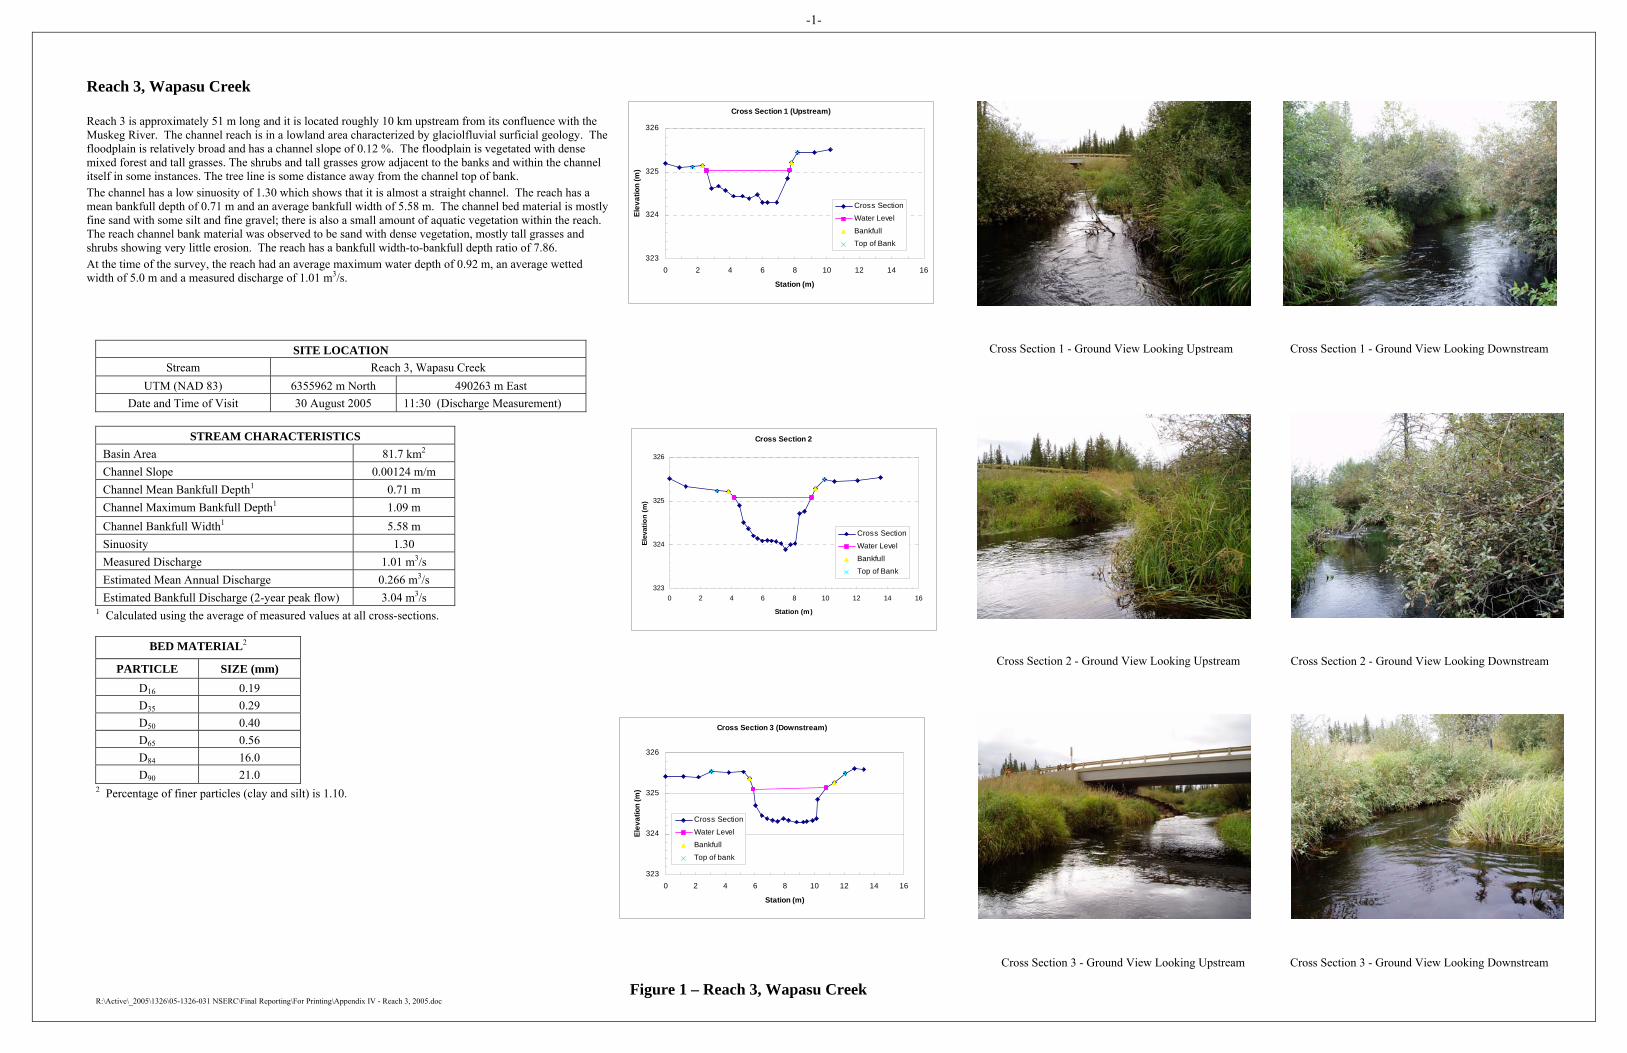
-1-
R:\Active\_2005\1326\05-1326-031 NSERC\Final Reporting\For Printing\Appendix IV - Reach 3, 2005.doc
SITE LOCATION
Stream Reach 3, Wapasu Creek UTM (NAD 83) 6355962 m North 490263 m East
Date and Time of Visit 30 August 2005 11:30 (Discharge Measurement)
STREAM CHARACTERISTICS Basin Area 81.7 km2 Channel Slope 0.00124 m/m Channel Mean Bankfull Depth1 0.71 m Channel Maximum Bankfull Depth1 1.09 m Channel Bankfull Width1 5.58 m Sinuosity 1.30 Measured Discharge 1.01 m3/s Estimated Mean Annual Discharge 0.266 m3/s Estimated Bankfull Discharge (2-year peak flow) 3.04 m3/s
1 Calculated using the average of measured values at all cross-sections.
BED MATERIAL2
PARTICLE SIZE (mm) D16 0.19 D35 0.29 D50 0.40 D65 0.56 D84 16.0 D90 21.0
2 Percentage of finer particles (clay and silt) is 1.10.
Reach 3, Wapasu Creek Reach 3 is approximately 51 m long and it is located roughly 10 km upstream from its confluence with the Muskeg River. The channel reach is in a lowland area characterized by glaciolfluvial surficial geology. The floodplain is relatively broad and has a channel slope of 0.12 %. The floodplain is vegetated with dense mixed forest and tall grasses. The shrubs and tall grasses grow adjacent to the banks and within the channel itself in some instances. The tree line is some distance away from the channel top of bank. The channel has a low sinuosity of 1.30 which shows that it is almost a straight channel. The reach has a mean bankfull depth of 0.71 m and an average bankfull width of 5.58 m. The channel bed material is mostly fine sand with some silt and fine gravel; there is also a small amount of aquatic vegetation within the reach. The reach channel bank material was observed to be sand with dense vegetation, mostly tall grasses and shrubs showing very little erosion. The reach has a bankfull width-to-bankfull depth ratio of 7.86. At the time of the survey, the reach had an average maximum water depth of 0.92 m, an average wetted width of 5.0 m and a measured discharge of 1.01 m3/s.
Flow Direction
Cross Section 2 - Ground View Looking Upstream Cross Section 2 - Ground View Looking Downstream
Cross Section 3 - Ground View Looking Upstream Cross Section 3 - Ground View Looking Downstream
Figure 1 – Reach 3, Wapasu Creek
Cross Section 2
323
324
325
326
0 2 4 6 8 10 12 14 16
Station (m)
Elev
atio
n (m
)
Cross Section
Water Level
BankfullTop of Bank
Cross Section 1 (Upstream)
323
324
325
326
0 2 4 6 8 10 12 14 16
Station (m)
Elev
atio
n (m
)
Cross Section
Water Level
BankfullTop of Bank
Cross Section 3 (Downstream)
323
324
325
326
0 2 4 6 8 10 12 14 16
Station (m)
Elev
atio
n (m
)
Cross Section
Water Level
Bankfull
Top of bank
Cross Section 1 - Ground View Looking Upstream Cross Section 1 - Ground View Looking Downstream

APPENDIX V
FLUVIAL GEOMORPHIC FIELD SURVEY DATA
(One set of the field survey data is provided as an example. Field survey data for the other surveyed stream reaches are available on request from Golder Associates.)
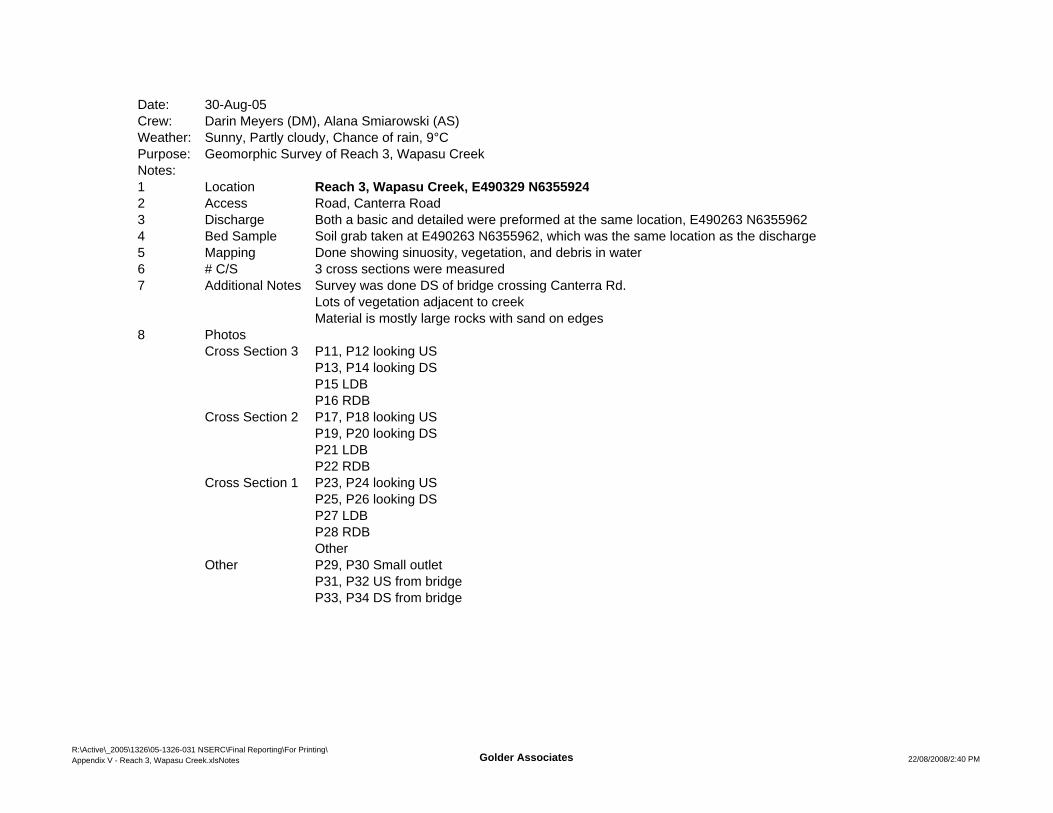
Date: 30-Aug-05Crew: Darin Meyers (DM), Alana Smiarowski (AS)Weather: Sunny, Partly cloudy, Chance of rain, 9°CPurpose: Geomorphic Survey of Reach 3, Wapasu CreekNotes:1 Location Reach 3, Wapasu Creek, E490329 N63559242 Access Road, Canterra Road3 Discharge Both a basic and detailed were preformed at the same location, E490263 N63559624 Bed Sample Soil grab taken at E490263 N6355962, which was the same location as the discharge5 Mapping Done showing sinuosity, vegetation, and debris in water6 # C/S 3 cross sections were measured7 Additional Notes Survey was done DS of bridge crossing Canterra Rd.
Lots of vegetation adjacent to creekMaterial is mostly large rocks with sand on edges
8 PhotosCross Section 3 P11, P12 looking US
P13, P14 looking DSP15 LDBP16 RDB
Cross Section 2 P17, P18 looking USP19, P20 looking DSP21 LDBP22 RDB
Cross Section 1 P23, P24 looking USP25, P26 looking DSP27 LDBP28 RDBOther
Other P29, P30 Small outletP31, P32 US from bridgeP33, P34 DS from bridge
R:\Active\_2005\1326\05-1326-031 NSERC\Final Reporting\For Printing\Appendix V - Reach 3, Wapasu Creek.xlsNotes Golder Associates 22/08/2008/2:40 PM
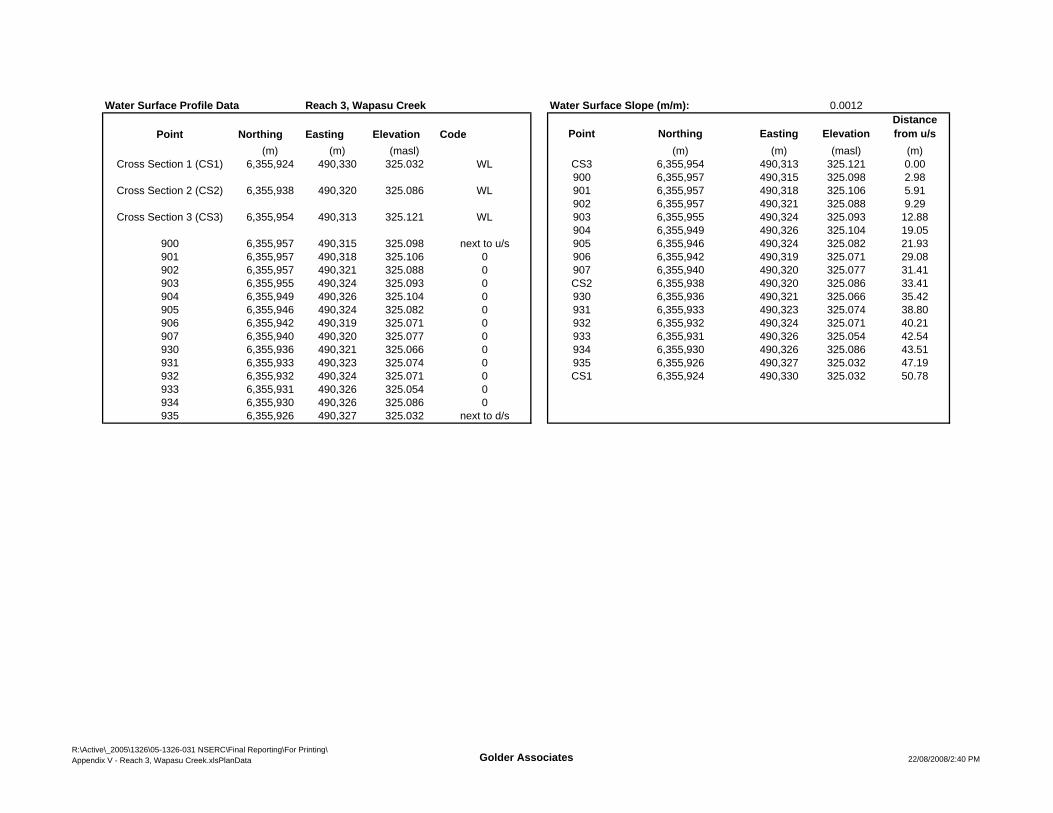
Water Surface Profile Data Reach 3, Wapasu Creek WL Water Surface Slope (m/m): 0.0012
Point Northing Easting Elevation Code Point Northing Easting ElevationDistance from u/s
(m) (m) (masl) (m) (m) (masl) (m)Cross Section 1 (CS1) 6,355,924 490,330 325.032 WL CS3 6,355,954 490,313 325.121 0.00
900 6,355,957 490,315 325.098 2.98Cross Section 2 (CS2) 6,355,938 490,320 325.086 WL 901 6,355,957 490,318 325.106 5.91
902 6,355,957 490,321 325.088 9.29Cross Section 3 (CS3) 6,355,954 490,313 325.121 WL 903 6,355,955 490,324 325.093 12.88
904 6,355,949 490,326 325.104 19.05900 6,355,957 490,315 325.098 next to u/s 905 6,355,946 490,324 325.082 21.93901 6,355,957 490,318 325.106 0 906 6,355,942 490,319 325.071 29.08902 6,355,957 490,321 325.088 0 907 6,355,940 490,320 325.077 31.41903 6,355,955 490,324 325.093 0 CS2 6,355,938 490,320 325.086 33.41904 6,355,949 490,326 325.104 0 930 6,355,936 490,321 325.066 35.42905 6,355,946 490,324 325.082 0 931 6,355,933 490,323 325.074 38.80906 6,355,942 490,319 325.071 0 932 6,355,932 490,324 325.071 40.21907 6,355,940 490,320 325.077 0 933 6,355,931 490,326 325.054 42.54930 6,355,936 490,321 325.066 0 934 6,355,930 490,326 325.086 43.51931 6,355,933 490,323 325.074 0 935 6,355,926 490,327 325.032 47.19932 6,355,932 490,324 325.071 0 CS1 6,355,924 490,330 325.032 50.78933 6,355,931 490,326 325.054 0934 6,355,930 490,326 325.086 0935 6,355,926 490,327 325.032 next to d/s
R:\Active\_2005\1326\05-1326-031 NSERC\Final Reporting\For Printing\Appendix V - Reach 3, Wapasu Creek.xlsPlanData Golder Associates 22/08/2008/2:40 PM
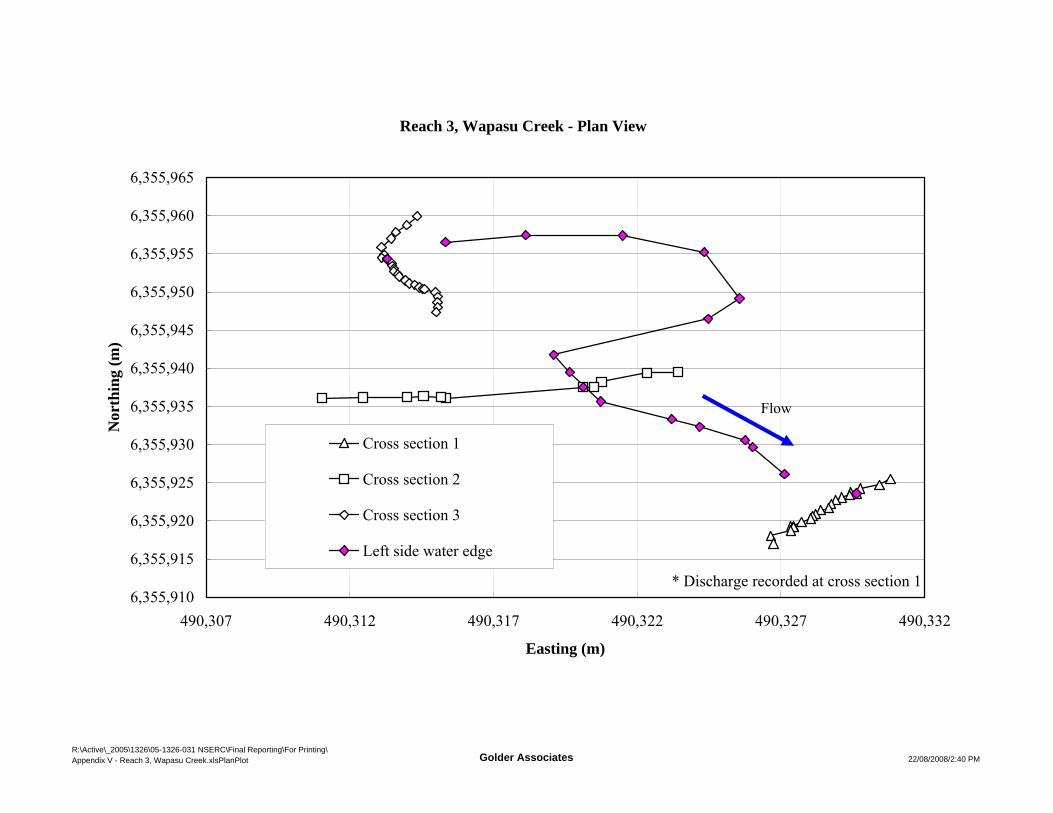
Left side water edge
Reach 3, Wapasu Creek - Plan View
6,355,910
6,355,915
6,355,920
6,355,925
6,355,930
6,355,935
6,355,940
6,355,945
6,355,950
6,355,955
6,355,960
6,355,965
490,307 490,312 490,317 490,322 490,327 490,332
Easting (m)
Nor
thin
g (m
)
Cross section 1
Cross section 2
Cross section 3
Left side water edge
Flow
* Discharge recorded at cross section 1
R:\Active\_2005\1326\05-1326-031 NSERC\Final Reporting\For Printing\Appendix V - Reach 3, Wapasu Creek.xlsPlanPlot Golder Associates 22/08/2008/2:40 PM
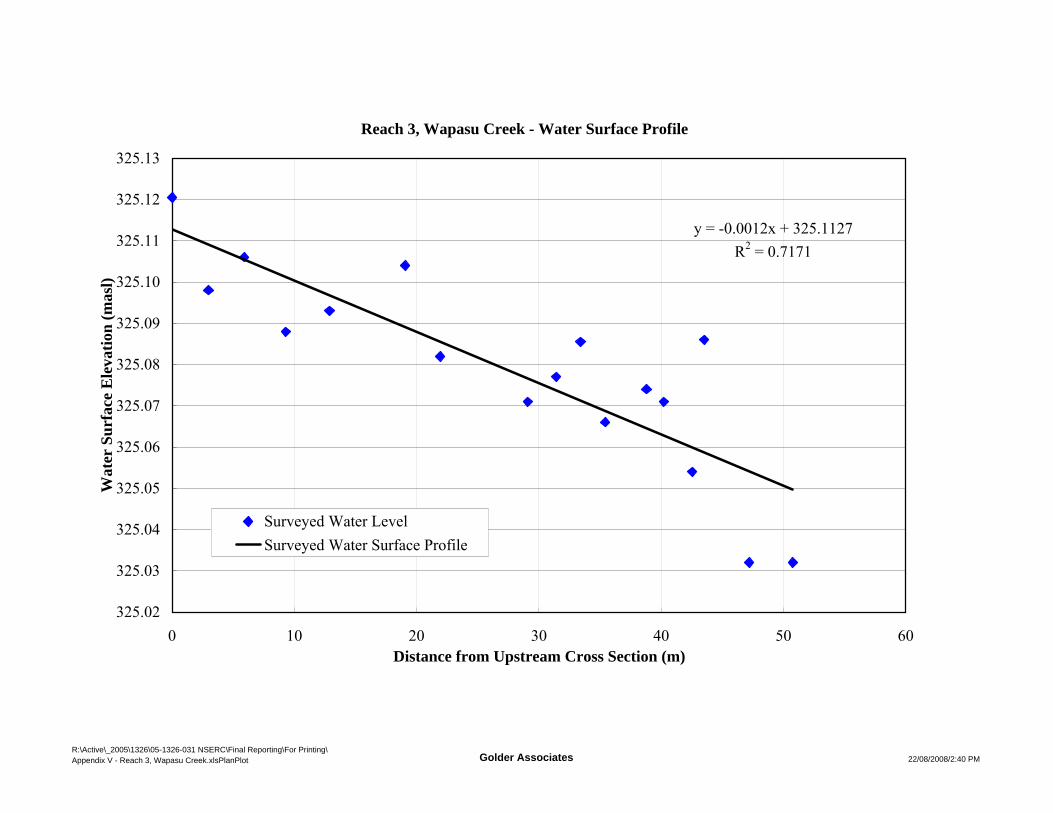
Reach 3, Wapasu Creek - Water Surface Profile
y = -0.0012x + 325.1127R2 = 0.7171
325.02
325.03
325.04
325.05
325.06
325.07
325.08
325.09
325.10
325.11
325.12
325.13
0 10 20 30 40 50 60Distance from Upstream Cross Section (m)
Wat
er S
urfa
ce E
leva
tion
(mas
l)
Surveyed Water LevelSurveyed Water Surface Profile
R:\Active\_2005\1326\05-1326-031 NSERC\Final Reporting\For Printing\Appendix V - Reach 3, Wapasu Creek.xlsPlanPlot Golder Associates 22/08/2008/2:40 PM
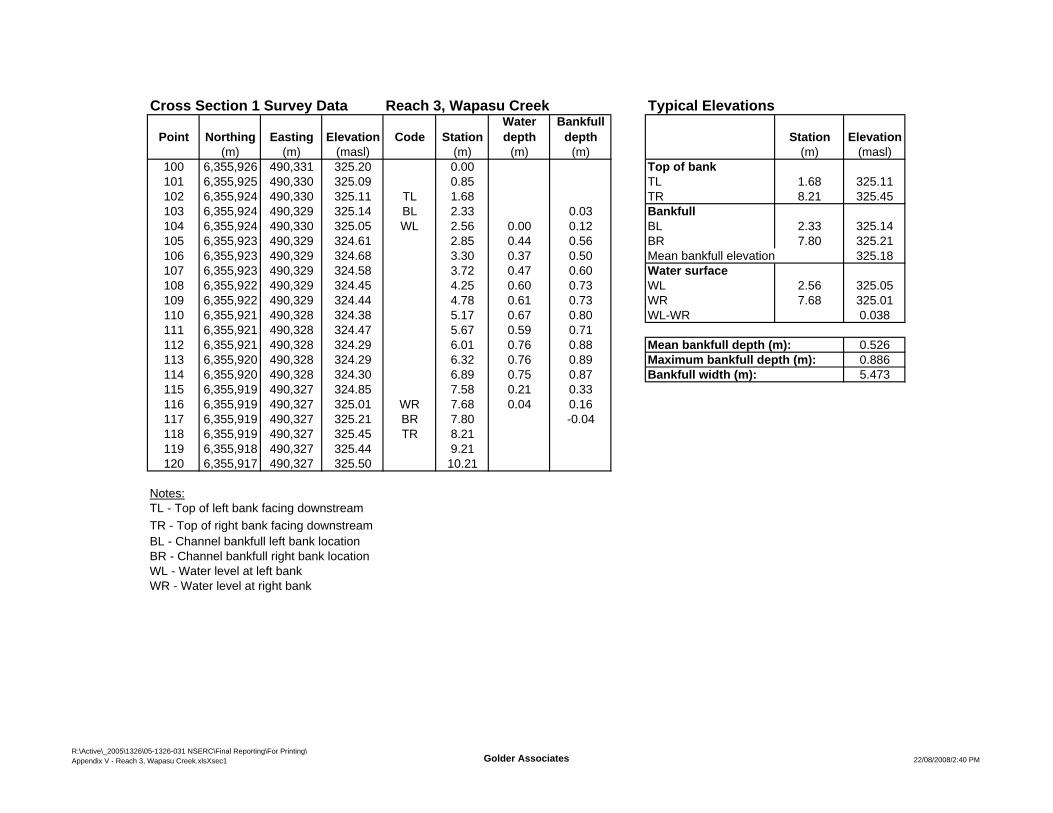
Cross Section 1 Survey Data Reach 3, Wapasu Creek Typical Elevations
Point Northing Easting Elevation Code StationWater depth
Bankfull depth Station Elevation
(m) (m) (masl) (m) (m) (m) (m) (masl)100 6,355,926 490,331 325.20 0.00 Top of bank101 6,355,925 490,330 325.09 0.85 TL 1.68 325.11102 6,355,924 490,330 325.11 TL 1.68 TR 8.21 325.45103 6,355,924 490,329 325.14 BL 2.33 0.03 Bankfull104 6,355,924 490,330 325.05 WL 2.56 0.00 0.12 BL 2.33 325.14105 6,355,923 490,329 324.61 2.85 0.44 0.56 BR 7.80 325.21106 6,355,923 490,329 324.68 3.30 0.37 0.50 Mean bankfull elevation 325.18107 6,355,923 490,329 324.58 3.72 0.47 0.60 Water surface 325.03 325.03108 6,355,922 490,329 324.45 4.25 0.60 0.73 WL 2.56 325.05109 6,355,922 490,329 324.44 4.78 0.61 0.73 WR 7.68 325.01110 6,355,921 490,328 324.38 5.17 0.67 0.80 WL-WR 0.038111 6,355,921 490,328 324.47 5.67 0.59 0.71112 6,355,921 490,328 324.29 6.01 0.76 0.88 Mean bankfull depth (m): 0.526113 6,355,920 490,328 324.29 6.32 0.76 0.89 Maximum bankfull depth (m): 0.886114 6,355,920 490,328 324.30 6.89 0.75 0.87 Bankfull width (m): 5.473115 6,355,919 490,327 324.85 7.58 0.21 0.33116 6,355,919 490,327 325.01 WR 7.68 0.04 0.16117 6,355,919 490,327 325.21 BR 7.80 -0.04118 6,355,919 490,327 325.45 TR 8.21119 6,355,918 490,327 325.44 9.21120 6,355,917 490,327 325.50 10.21
Notes:TL - Top of left bank facing downstreamTR - Top of right bank facing downstreamBL - Channel bankfull left bank locationBR - Channel bankfull right bank locationWL - Water level at left bankWR - Water level at right bank
R:\Active\_2005\1326\05-1326-031 NSERC\Final Reporting\For Printing\Appendix V - Reach 3, Wapasu Creek.xlsXsec1 Golder Associates 22/08/2008/2:40 PM
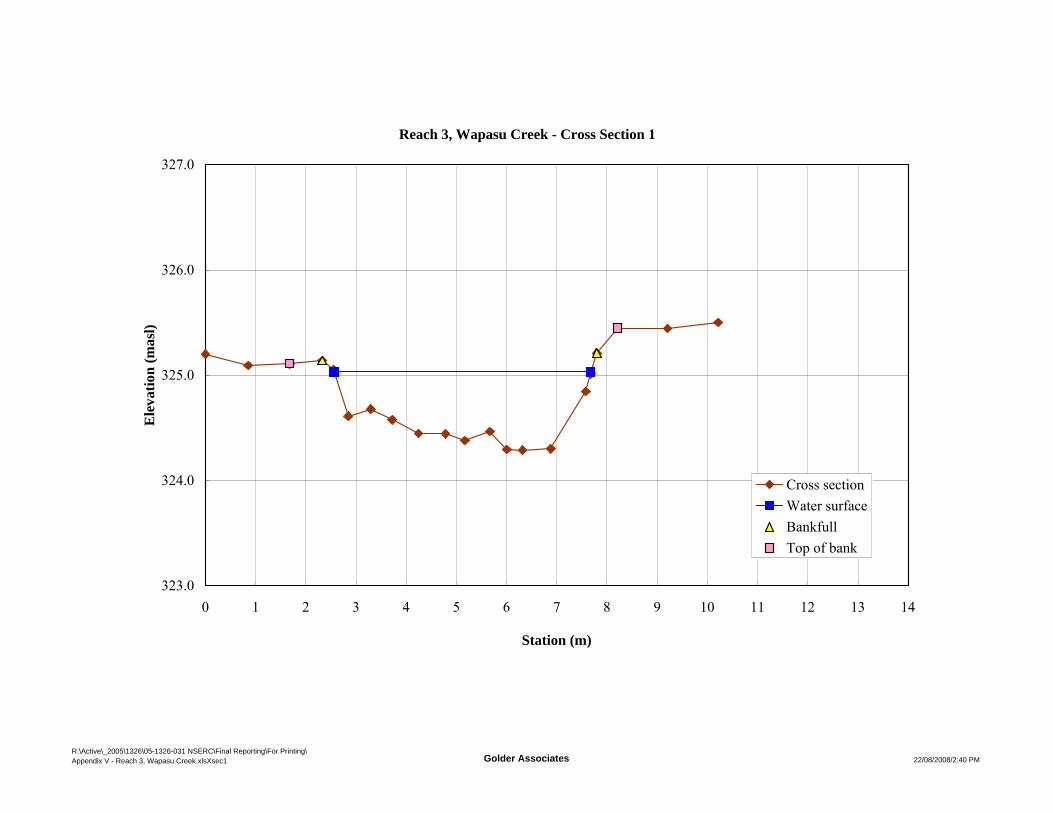
Reach 3, Wapasu Creek Cross Section 1
Reach 3, Wapasu Creek - Cross Section 1
323.0
324.0
325.0
326.0
327.0
0 1 2 3 4 5 6 7 8 9 10 11 12 13 14
Station (m)
Ele
vatio
n (m
asl)
Cross sectionWater surfaceBankfullTop of bank
R:\Active\_2005\1326\05-1326-031 NSERC\Final Reporting\For Printing\Appendix V - Reach 3, Wapasu Creek.xlsXsec1 Golder Associates 22/08/2008/2:40 PM
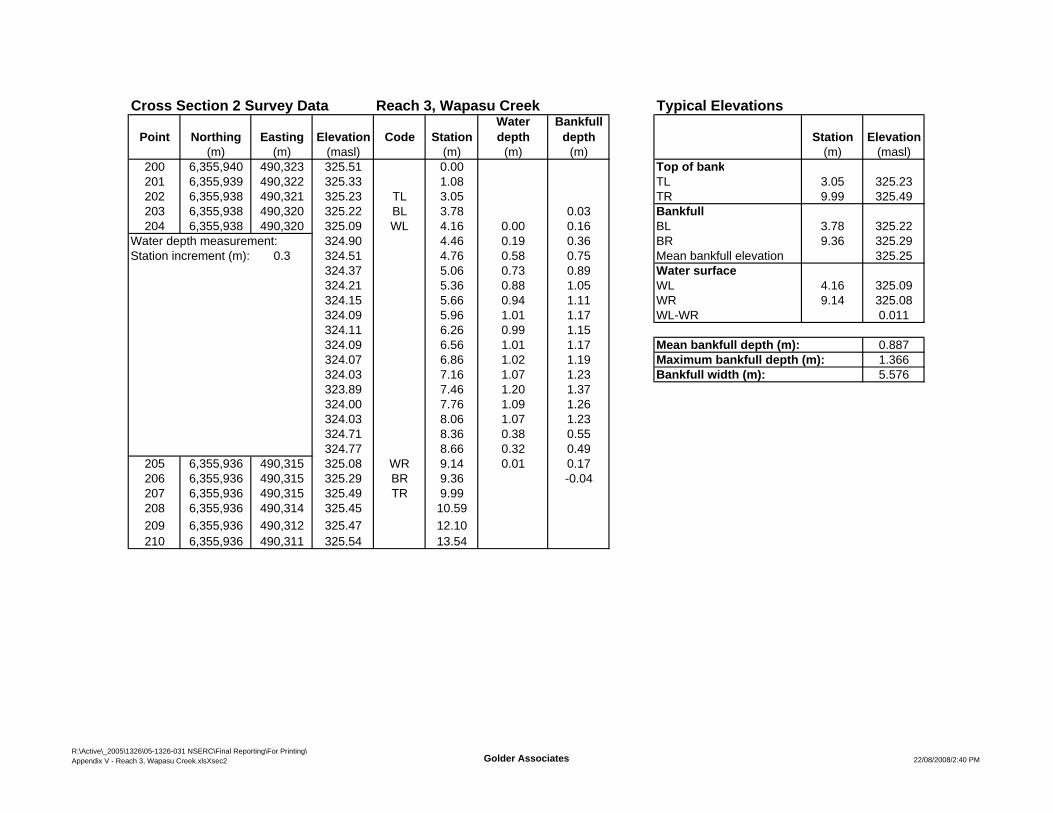
Cross Section 2 Survey Data Reach 3, Wapasu Creek Typical Elevations
Point Northing Easting Elevation Code StationWater depth
Bankfull depth Station Elevation
(m) (m) (masl) (m) (m) (m) (m) (masl)200 6,355,940 490,323 325.51 0.00 Top of bank201 6,355,939 490,322 325.33 1.08 TL 3.05 325.23202 6,355,938 490,321 325.23 TL 3.05 TR 9.99 325.49203 6,355,938 490,320 325.22 BL 3.78 0.03 Bankfull204 6,355,938 490,320 325.09 WL 4.16 0.00 0.16 BL 3.78 325.22
Water depth measurement: 324.90 4.46 0.19 0.36 BR 9.36 325.29Station increment (m): 0.3 324.51 4.76 0.58 0.75 Mean bankfull elevation 325.25
324.37 5.06 0.73 0.89 Water surface 325.09 325.09324.21 5.36 0.88 1.05 WL 4.16 325.09324.15 5.66 0.94 1.11 WR 9.14 325.08324.09 5.96 1.01 1.17 WL-WR 0.011324.11 6.26 0.99 1.15324.09 6.56 1.01 1.17 Mean bankfull depth (m): 0.887324.07 6.86 1.02 1.19 Maximum bankfull depth (m): 1.366324.03 7.16 1.07 1.23 Bankfull width (m): 5.576323.89 7.46 1.20 1.37324.00 7.76 1.09 1.26324.03 8.06 1.07 1.23324.71 8.36 0.38 0.55324.77 8.66 0.32 0.49
205 6,355,936 490,315 325.08 WR 9.14 0.01 0.17206 6,355,936 490,315 325.29 BR 9.36 -0.04207 6,355,936 490,315 325.49 TR 9.99208 6,355,936 490,314 325.45 10.59209 6,355,936 490,312 325.47 12.10210 6,355,936 490,311 325.54 13.54
R:\Active\_2005\1326\05-1326-031 NSERC\Final Reporting\For Printing\Appendix V - Reach 3, Wapasu Creek.xlsXsec2 Golder Associates 22/08/2008/2:40 PM

Reach 3, Wapasu Creek Cross Section 2
Reach 3, Wapasu Creek - Cross Section 2
323.0
324.0
325.0
326.0
327.0
0 1 2 3 4 5 6 7 8 9 10 11 12 13 14
Station (m)
Ele
vatio
n (m
asl)
Cross sectionWater surfaceBankfullTop of bank
R:\Active\_2005\1326\05-1326-031 NSERC\Final Reporting\For Printing\Appendix V - Reach 3, Wapasu Creek.xlsXsec2 Golder Associates 22/08/2008/2:40 PM

Cross Section 3 Survey Data Reach 3, Wapasu Creek Typical Elevations
Point Northing Easting Elevation Code StationWater depth
Bankfull depth Station Elevation
(m) (m) (masl) (m) (m) (m) (m) (masl)300 6,355,960 490,314 325.42 0.00 Top of bank301 6,355,959 490,314 325.42 1.20 TL 3.07 325.55302 6,355,958 490,314 325.41 2.21 TR 12.02 325.50303 6,355,957 490,313 325.55 TL 3.07 Bankfull304 6,355,956 490,313 325.51 4.24 BL 5.64 325.38305 6,355,955 490,313 325.53 5.25 BR 11.33 325.26306 6,355,954 490,313 325.38 BL 5.64 -0.06 Mean bankfull elevation 325.32307 6,355,954 490,313 325.10 WL 5.88 0.00 0.22 Water surface 325.12 325.12308 6,355,954 490,313 324.70 6.03 0.40 0.62 WL 5.88 325.10309 6,355,954 490,313 324.45 6.47 0.65 0.87 WR 10.76 325.14310 6,355,953 490,313 324.38 6.83 0.73 0.94 WL-WR -0.037311 6,355,953 490,314 324.34 7.20 0.76 0.98312 6,355,953 490,314 324.31 7.54 0.79 1.01 Mean bankfull depth (m): 0.717313 6,355,952 490,314 324.37 7.92 0.73 0.95 Maximum bankfull depth (m): 1.021314 6,355,952 490,314 324.35 8.26 0.75 0.97 Bankfull width (m): 5.688315 6,355,952 490,314 324.30 8.82 0.80 1.02316 6,355,951 490,314 324.30 9.24 0.80 1.02317 6,355,951 490,314 324.31 9.50 0.79 1.01318 6,355,951 490,314 324.33 9.88 0.77 0.99319 6,355,950 490,315 324.37 10.11 0.73 0.95320 6,355,950 490,315 324.86 10.20 0.24 0.46321 6,355,950 490,315 325.14 WR 10.76 -0.04 0.18322 6,355,949 490,315 325.26 BR 11.33 0.06323 6,355,949 490,315 325.50 TR 12.02324 6,355,948 490,315 325.61 12.67325 6,355,947 490,315 325.60 13.33
R:\Active\_2005\1326\05-1326-031 NSERC\Final Reporting\For Printing\Appendix V - Reach 3, Wapasu Creek.xlsXsec3 Golder Associates 22/08/2008/2:40 PM
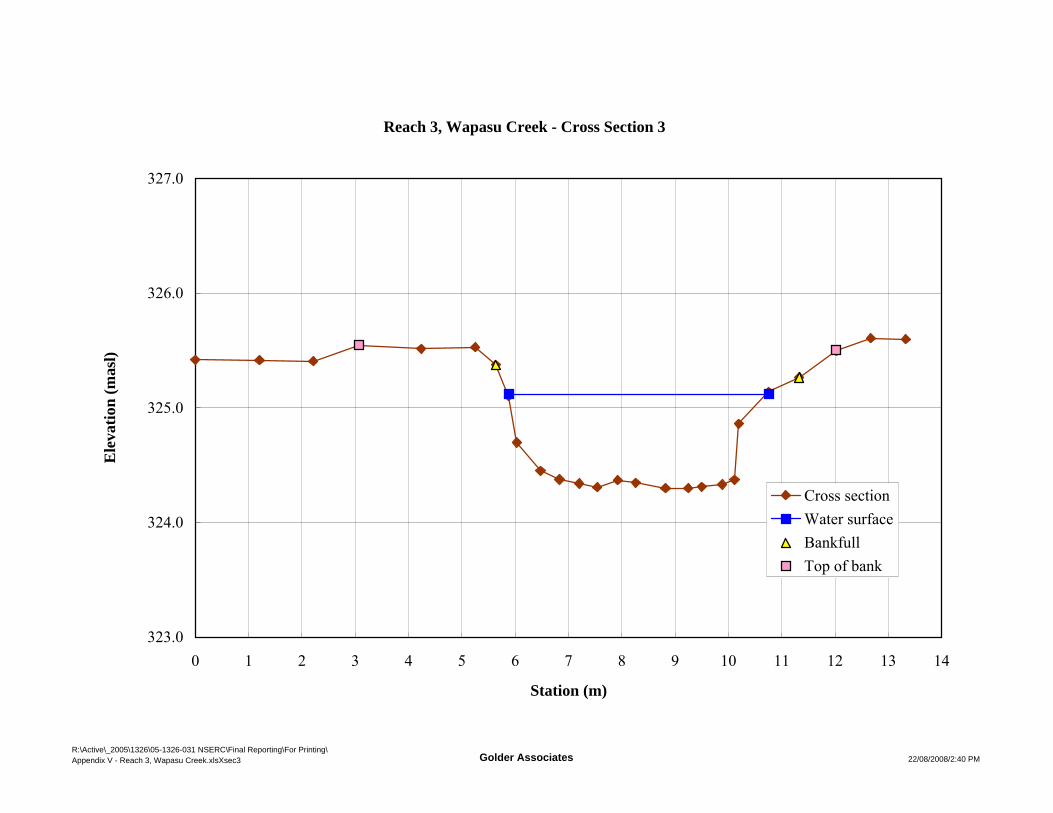
Reach 3, Wapasu Creek Cross Section 3
Reach 3, Wapasu Creek - Cross Section 3
323.0
324.0
325.0
326.0
327.0
0 1 2 3 4 5 6 7 8 9 10 11 12 13 14
Station (m)
Ele
vatio
n (m
asl)
Cross sectionWater surfaceBankfullTop of bank
R:\Active\_2005\1326\05-1326-031 NSERC\Final Reporting\For Printing\Appendix V - Reach 3, Wapasu Creek.xlsXsec3 Golder Associates 22/08/2008/2:40 PM
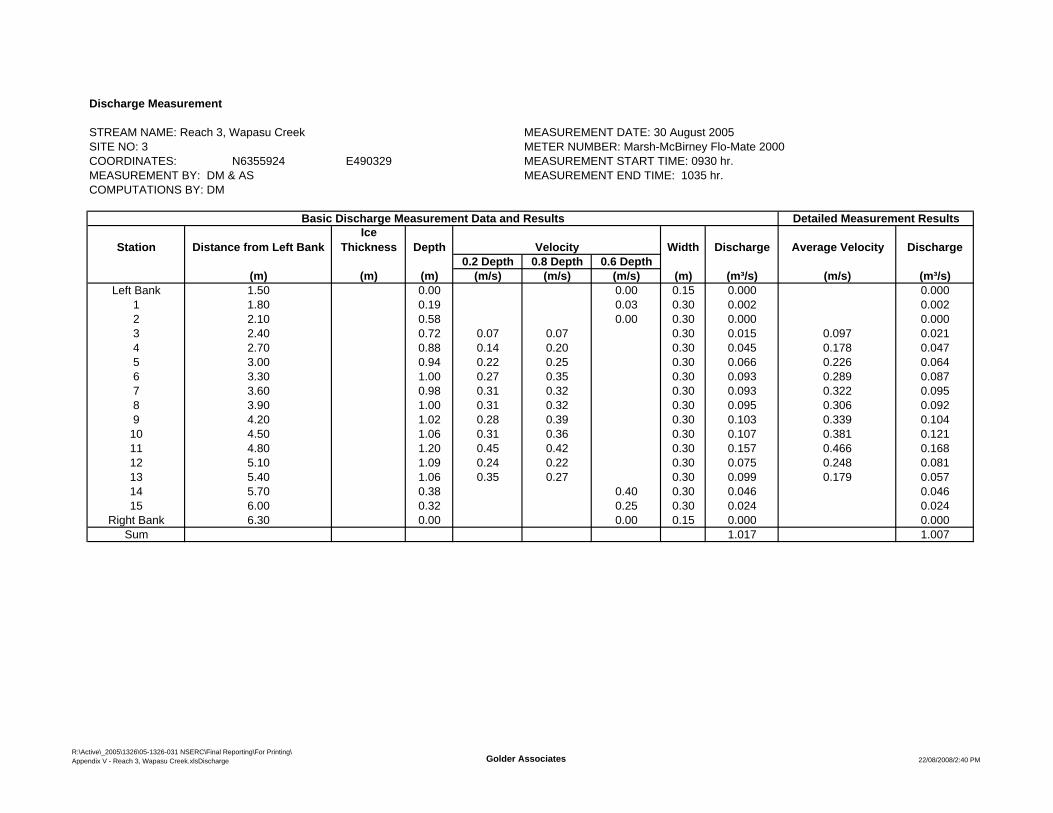
Discharge Measurement
STREAM NAME: Reach 3, Wapasu Creek MEASUREMENT DATE: 30 August 2005SITE NO: 3 METER NUMBER: Marsh-McBirney Flo-Mate 2000COORDINATES: N6355924 E490329 MEASUREMENT START TIME: 0930 hr. MEASUREMENT BY: DM & AS MEASUREMENT END TIME: 1035 hr.COMPUTATIONS BY: DM
Basic Discharge Measurement Data and Results Detailed Measurement Results
Station Distance from Left BankIce
Thickness Depth Velocity Width Discharge Average Velocity Discharge0.2 Depth 0.8 Depth 0.6 Depth
(m) (m) (m) (m/s) (m/s) (m/s) (m) (m³/s) (m/s) (m³/s)Left Bank 1.50 0.00 0.00 0.15 0.000 0.000
1 1.80 0.19 0.03 0.30 0.002 0.0022 2.10 0.58 0.00 0.30 0.000 0.0003 2.40 0.72 0.07 0.07 0.30 0.015 0.097 0.0214 2.70 0.88 0.14 0.20 0.30 0.045 0.178 0.0475 3.00 0.94 0.22 0.25 0.30 0.066 0.226 0.0646 3.30 1.00 0.27 0.35 0.30 0.093 0.289 0.0877 3.60 0.98 0.31 0.32 0.30 0.093 0.322 0.0958 3.90 1.00 0.31 0.32 0.30 0.095 0.306 0.0929 4.20 1.02 0.28 0.39 0.30 0.103 0.339 0.10410 4.50 1.06 0.31 0.36 0.30 0.107 0.381 0.12111 4.80 1.20 0.45 0.42 0.30 0.157 0.466 0.16812 5.10 1.09 0.24 0.22 0.30 0.075 0.248 0.08113 5.40 1.06 0.35 0.27 0.30 0.099 0.179 0.05714 5.70 0.38 0.40 0.30 0.046 0.04615 6.00 0.32 0.25 0.30 0.024 0.024
Right Bank 6.30 0.00 0.00 0.15 0.000 0.000Sum 1.017 1.007
R:\Active\_2005\1326\05-1326-031 NSERC\Final Reporting\For Printing\Appendix V - Reach 3, Wapasu Creek.xlsDischarge Golder Associates 22/08/2008/2:40 PM
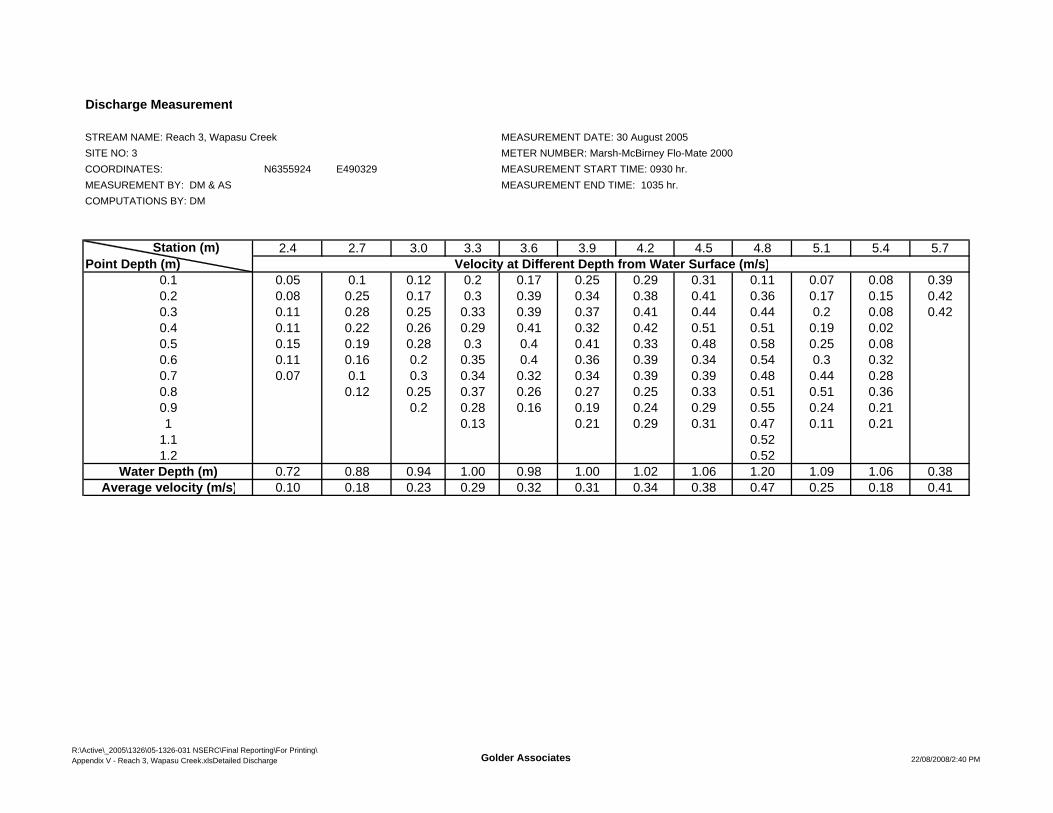
Discharge Measurement
STREAM NAME: Reach 3, Wapasu Creek MEASUREMENT DATE: 30 August 2005SITE NO: 3 METER NUMBER: Marsh-McBirney Flo-Mate 2000COORDINATES: N6355924 E490329 MEASUREMENT START TIME: 0930 hr. MEASUREMENT BY: DM & AS MEASUREMENT END TIME: 1035 hr.COMPUTATIONS BY: DM
2.4 2.7 3.0 3.3 3.6 3.9 4.2 4.5 4.8 5.1 5.4 5.7Velocity at Different Depth from Water Surface (m/s)
0.1 0.05 0.1 0.12 0.2 0.17 0.25 0.29 0.31 0.11 0.07 0.08 0.390.2 0.08 0.25 0.17 0.3 0.39 0.34 0.38 0.41 0.36 0.17 0.15 0.420.3 0.11 0.28 0.25 0.33 0.39 0.37 0.41 0.44 0.44 0.2 0.08 0.420.4 0.11 0.22 0.26 0.29 0.41 0.32 0.42 0.51 0.51 0.19 0.020.5 0.15 0.19 0.28 0.3 0.4 0.41 0.33 0.48 0.58 0.25 0.080.6 0.11 0.16 0.2 0.35 0.4 0.36 0.39 0.34 0.54 0.3 0.320.7 0.07 0.1 0.3 0.34 0.32 0.34 0.39 0.39 0.48 0.44 0.280.8 0.12 0.25 0.37 0.26 0.27 0.25 0.33 0.51 0.51 0.360.9 0.2 0.28 0.16 0.19 0.24 0.29 0.55 0.24 0.211 0.13 0.21 0.29 0.31 0.47 0.11 0.21
1.1 0.521.2 0.52
Water Depth (m) 0.72 0.88 0.94 1.00 0.98 1.00 1.02 1.06 1.20 1.09 1.06 0.38Average velocity (m/s) 0.10 0.18 0.23 0.29 0.32 0.31 0.34 0.38 0.47 0.25 0.18 0.41
Station (m)Point Depth (m)
R:\Active\_2005\1326\05-1326-031 NSERC\Final Reporting\For Printing\Appendix V - Reach 3, Wapasu Creek.xlsDetailed Discharge Golder Associates 22/08/2008/2:40 PM

Project No.: 05-1326-031 Lab No.: 619506Project Title:Location:Depth: - Sample No.: -Date Tested: 03-Oct-05 By: VK
Diameter of Percent Sieve Passing(mm) (%)
150.000 100.075.000 100.037.500 100.020.000 89.410.000 79.85.000 78.42.000 77.80.850 76.80.425 53.50.150 3.60.075 1.1
Comments/Limits:
Reach 3, Wapasu CreekCONRAD Geomorphic Study
PARTICLE SIZE ANALYSIS OF SOIL (ASTM D422)
0
10
20
30
40
50
60
70
80
90
100
Grain Size (mm)
Perc
ent F
iner
Tha
n
100 10 1 0.1 0.01 0.001
Boulder Size
Cobble Size Gravel Sand Silt and Clay
3" 1-1/2" 3/4" 4 1012" 20 100 20040
Coarse Fine Coarse Medium Fine
US Sieve Size
R:\Active\_2005\1326\05-1326-031 NSERC\Final Reporting\For Printing\Appendix V - Reach 3, Wapasu Creek.xlsSed Sample Graph Golder Associates 22/08/2008/2:40 PM
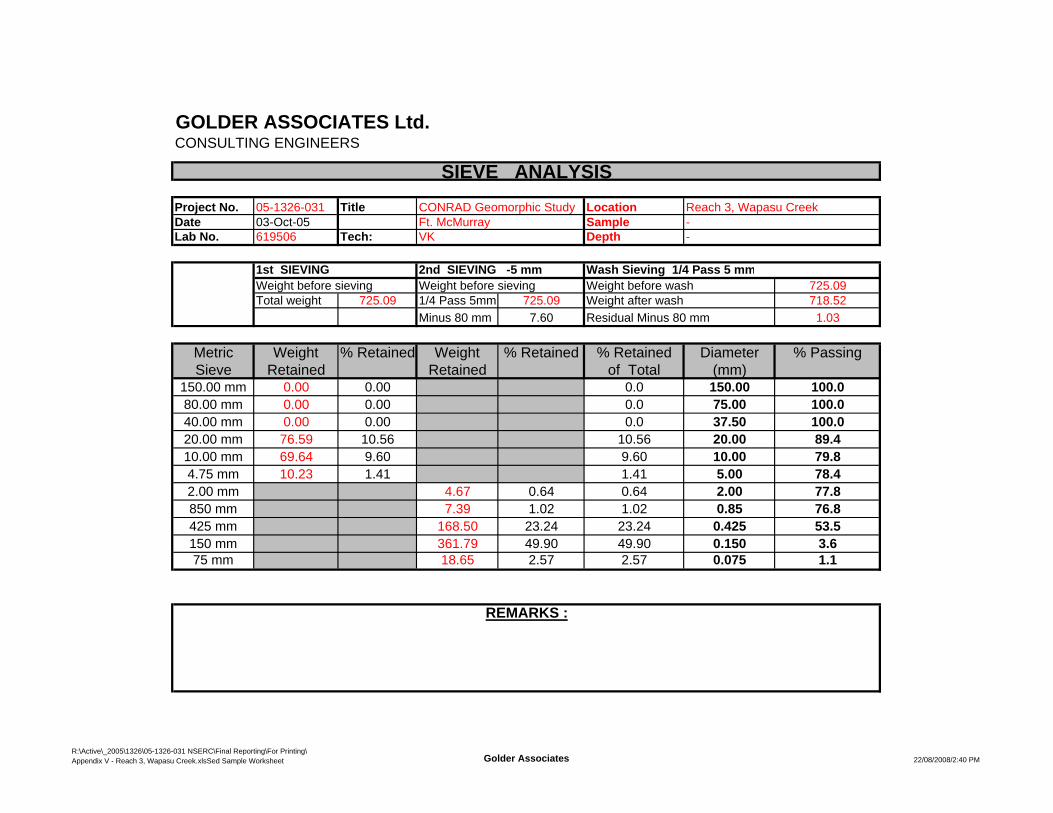
GOLDER ASSOCIATES Ltd.CONSULTING ENGINEERS
SIEVE ANALYSISProject No. 05-1326-031 Title CONRAD Geomorphic Study Location Reach 3, Wapasu CreekDate 03-Oct-05 Ft. McMurray Sample -Lab No. 619506 Tech: VK Depth -
1st SIEVING 2nd SIEVING -5 mm Wash Sieving 1/4 Pass 5 mmWeight before sieving Weight before sieving Weight before wash 725.09Total weight 725.09 1/4 Pass 5mm 725.09 Weight after wash 718.52
Minus 80 mm 7.60 Residual Minus 80 mm 1.03
Metric Weight % Retained Weight % Retained % Retained Diameter % PassingSieve Retained Retained of Total (mm)
150.00 mm 0.00 0.00 0.0 150.00 100.080.00 mm 0.00 0.00 0.0 75.00 100.040.00 mm 0.00 0.00 0.0 37.50 100.020.00 mm 76.59 10.56 10.56 20.00 89.410.00 mm 69.64 9.60 9.60 10.00 79.84.75 mm 10.23 1.41 1.41 5.00 78.42.00 mm 4.67 0.64 0.64 2.00 77.8850 mm 7.39 1.02 1.02 0.85 76.8425 mm 168.50 23.24 23.24 0.425 53.5150 mm 361.79 49.90 49.90 0.150 3.675 mm 18.65 2.57 2.57 0.075 1.1
REMARKS :
R:\Active\_2005\1326\05-1326-031 NSERC\Final Reporting\For Printing\Appendix V - Reach 3, Wapasu Creek.xlsSed Sample Worksheet Golder Associates 22/08/2008/2:40 PM

APPENDIX VI
RESULTS OF HEC-RAS ANALYSIS FOR CHANNEL ROUGHNESS
(One set of the field survey data is provided as an example. Field survey data for the other surveyed stream reaches are available on request from Golder Associates.)
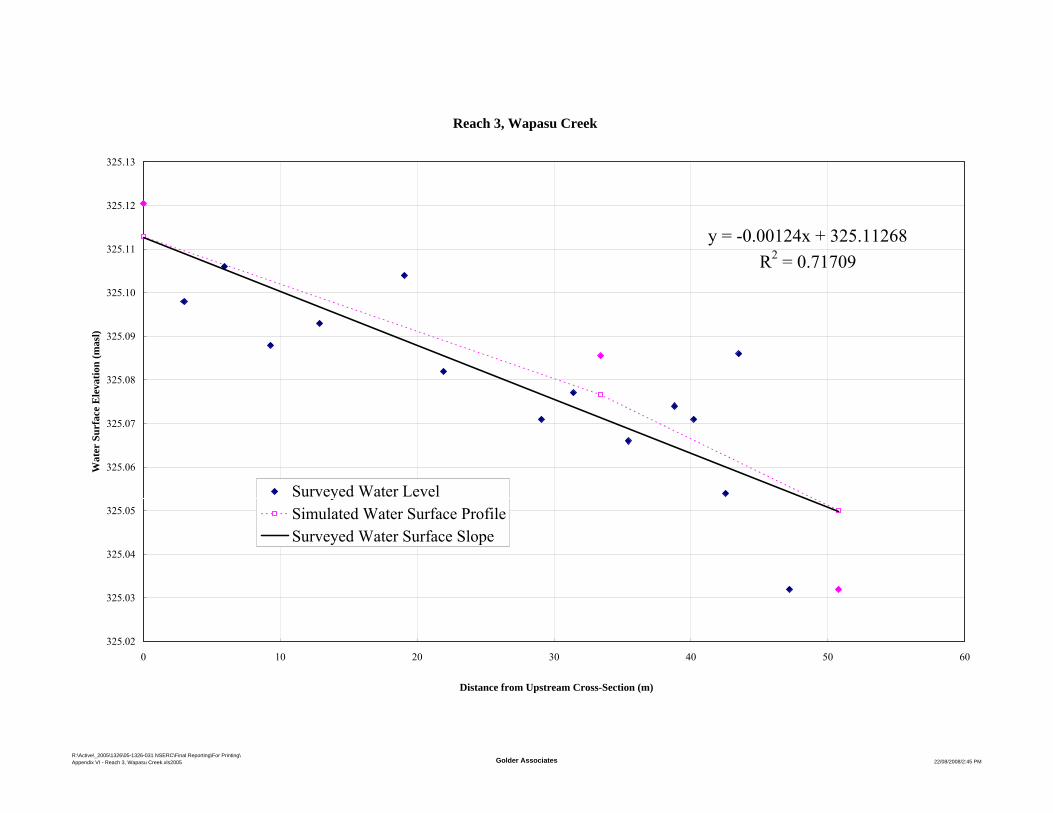
Reach 3, Wapasu Creek
y = -0.00124x + 325.11268R2 = 0.71709
325.02
325.03
325.04
325.05
325.06
325.07
325.08
325.09
325.10
325.11
325.12
325.13
0 10 20 30 40 50 60
Distance from Upstream Cross-Section (m)
Wat
er S
urfa
ce E
leva
tion
(mas
l)
Surveyed Water LevelSimulated Water Surface ProfileSurveyed Water Surface Slope
R:\Active\_2005\1326\05-1326-031 NSERC\Final Reporting\For Printing\Appendix VI - Reach 3, Wapasu Creek.xls2005 Golder Associates 22/08/2008/2:45 PM