Embed Size (px)
Citation preview

Frontier efficiency methodologies to measureperformance in the insurance industry:Overview, systematization, and recent
developments
Martin Eling und Michael Luhnen
Preprint Series: 2009-19
Fakultat fur Mathematik und WirtschaftswissenschaftenUNIVERSITAT ULM

Frontier efficiency methodologies to measure performance in the insurance
industry: Overview, systematization, and recent developments
Martin Elinga*, Michael Luhnenb
a: Institute of Insurance Science, Ulm University, Helmholtzstraße 22, 89069 Ulm, Germany
b: Institute of Insurance Economics, University of St. Gallen, Kirchlistrasse 2, 9010 St. Gallen, Switzerland
_________________________________________________________________________________________
Abstract
The purpose of this article is to provide an overview on frontier efficiency measurement in the insurance indus-
try, a topic of great interest in the academic literature during the last several years. We provide a comprehensive
survey of 95 studies with a special emphasis on innovations and recent developments. We review different
econometric and mathematical programming approaches to efficiency measurement in insurance and discuss the
choice of input and output factors. Furthermore, we categorize the 95 studies into 10 different areas of applica-
tion and discuss selected results. While there is a broad consensus with regard to the choice of methodology and
input factors, our review reveals large differences in output measurement. Significant need for future research
can be identified, e.g., with regard to analysis of organizational forms, market structure and risk management,
especially in the international context.
JEL classification: D23; G22; L11
Keywords: Efficiency; Data Envelopment Analysis; Stochastic Frontier Analysis
_________________________________________________________________________________________
∗ Corresponding author. Tel.: +49 731 5031183; fax: +49 731 5031188.
E-mail addresses: [email protected] (Martin Eling), [email protected] (Michael Luhnen)
1. Introduction
Academics as well as practitioners in the insurance sector have spent significant resources in
the last years to develop management techniques appropriate for the rapidly changing mar-
ketplace. New regulatory requirements, increasing competition, and the recent dynamics in
capital markets have all fundamentally changed the business environment that insurers are
active in. In such rapidly changing markets, shareholders and managers need accurate and
reliable information about the value generated by their business activities. As a result most
insurance companies have adopted modern management techniques such as shareholder value
or value-based management. Benchmarking techniques can be used in a variety of ways to
assist firms in evaluating whether they are performing better or worse than their peers in
terms of technology, scale, cost minimization and revenue maximization. They can be used to
direct management efforts to the areas that need improvement, to identify attractive targets
for mergers and acquisitions, and for many other purposes. Performance measurement also
can be used within the firm to compare the performance of departments, divisions, branches,
and agencies.
In this paper we focus on a new class of benchmarking techniques called frontier efficiency
methodologies. Frontier methodologies measure firm performance relative to ‘best practice’
frontiers comprised of the leading firms in the industry. They are superior to traditional tech-
niques such as financial ratio analysis because they summarize performance in a single statis-
tic that controls for differences among firms using a sophisticated multidimensional frame-
work (see Cummins/Weiss, 2000).
Efficiency measurement is one of the most rapidly growing streams of literature and the in-
surance sector in particular has seen extreme growth in the number of studies applying fron-
tier efficiency methods. Berger/Humphrey (1997) and Cummins/Weiss (2000) surveyed eight
and 21 studies, respectively. Now, less than ten years after the Cummins/Weiss survey, we
find 95 studies on efficiency measurement in the insurance industry. Recent work in the field
has refined methodologies, addressed new topics (e.g., market structure and risk manage-
ment), and extended geographic coverage from a previously US-focused view to a broad set
of countries around the world, including emerging markets such as China and Taiwan.

2
The aim of this paper is to provide a comprehensive survey of these 95 studies on frontier
efficiency measurement in insurance with a special emphasis on innovations and recent de-
velopments. We review different econometric and mathematical programming approaches to
efficiency measurement in insurance and discuss the choice of input and output factors. Fur-
thermore, we categorize the 95 studies into 10 different areas of application and discuss se-
lected results.
Our four main results can be summarized as follows. (1) Data envelopment analysis (DEA) is
the most frequently applied method of frontier efficiency analysis in insurance. In recent
years, however, there have been many proposals for refining and further developing method-
ologies, e.g., by applying more appropriate functional forms for the econometric approaches.
(2) There is a widespread agreement with regard to the choice of input factors; most studies
define, at a minimum, labour, capital, and business services (or an equivalent) as inputs of an
insurance company. There is also agreement with regard to output measurement, most studies
employ the so called value-added approach. However, there is disagreement among research-
ers as to whether premiums or claims are the more adequate proxy for value added. (3) There
has been a recent expansion to new fields of application such as market structure and risk
management. Also, geographic scope has noticeably expanded beyond its former US focus to
encompass a broad array of countries—45 according to our survey—including emerging
markets such as China, Taiwan, and Malaysia. (4) Finally, we identify significant need for
future research, e.g., especially in the field of organizational form, market structure, risk
management, and with regard to different lines of business. As most studies focus on US in-
surance markets, significant research opportunities in international insurance markets are
highlighted.
This paper contributes to the academic literature on frontier efficiency measurement for in-
surance in several ways: Apart from providing a comprehensive overview of this strongly
growing body of literature, we conduct a systematization of the different applications of fron-
tier efficiency measurement in insurance. Moreover, we study recent innovations with regard
to methodology and application and identify fields for future research. Thus, this paper serves
3
as an overview for researchers in the field as well as for regulators and managers interested in
the results and implications of frontier efficiency studies.
The remainder of the paper is organized as follows. Section 2 starts with an overview of the
95 studies focusing on frontier efficiency in the insurance industry, subdivided in ten applica-
tion areas. Section 3 introduces the two principal methodological approaches to efficiency
measurement, surveys their implementation in insurance studies, and highlights recent inno-
vations. Section 4 contains an overview on the usage of input and output factors. In Section 5
we get back to ten application areas and discuss the most important findings from the 95 stud-
ies. Finally, Section 6 concludes and highlights options for future research.
2. Overview of efficiency measurement in the insurance industry
The following overview of 95 papers (63 published articles, 32 working papers) builds upon
and significantly extends two earlier surveys of efficiency measurement literature in the fi-
nancial services industry: One by Berger/Humphrey (1997), which focuses on banks. The
second one by Cummins/Weiss (2000) focuses on the insurance industry and covers 21 stud-
ies that have been published until the year 1999. Three studies (Weiss, 1986, Weiss, 1991b,
Bernstein, 1999) that are considered in Cummins/Weiss (2000) have been excluded from this
overview since they are not efficient frontier based, but focus on productivity (these studies
are included in an extended overview that we present in the Appendix).
Table 1 is arranged according to ten different application areas (first column). Some of these
application areas have been selected following Berger/Humphrey's (1997) overview for the
banking sector. However, we extended and refined their systematization to account for the
specifics of the insurance sector. Although many studies make contributions to more than one
topic, we tried to focus on the primary field of application. A more detailed table with infor-
mation, such as input and output factors, types of efficiencies analyzed, sample periods, lines
of business covered, and main findings, is available upon request.1
Insert Table 1 here
1 In order to identify and summarize articles, we have specified a search strategy based on a list of relevant
key words, journals, databases, and authors. All details on the search strategy are available upon request.

4
3. Frontier efficiency methodologies
Frontier efficiency methodologies measure the performance of a company relative to a "best
practice" frontier, which (in the case of single input/output) is determined by the most effi-
cient companies in the industry. The efficiency score is usually standardized between 0 and 1,
with the most (least) efficient firm receiving the value of 1 (0). The difference between a
company’s assigned value and the value of 1 can be interpreted as the company’s improve-
ment potential in terms of efficiency (see, e.g., Cooper et al., 2007). Different types of effi-
cient frontiers can be estimated. In the simplest case, a production frontier is estimated, as-
suming that companies minimize inputs conditional on given output levels (input-orientation)
or maximize outputs conditional on given input levels (output-orientation).
There are two main approaches in efficient frontier analysis: the econometric approach and
the mathematical programming approach. We shortly introduce these two approaches (in-
cluding references to detailed overviews), discuss their application to the insurance field, and
highlight recent innovations.2
3.1. Econometric approaches
The econometric approaches specify a production, cost, revenue, or profit function with a
specific shape and make assumptions about the distributions of the inefficiency and error
terms. There are three principal types of econometric frontier approaches. Although they all
specify an efficient frontier form—usually translog, but also alternative forms such as gener-
alized translog, Fourier flexible, or composite cost— they differ in their distributional as-
sumptions of the inefficiency and random components (see Cummins/Weiss, 2000). The sto-
chastic frontier approach (SFA) assumes a composed error model where inefficiencies fol-
low an asymmetric distribution (e.g., half-normal, exponential, or gamma) and the random
error term follows a symmetric distribution, usually normal. The distribution-free approach
(DFA) makes fewer specific assumptions, but requires several years of data. Efficiency of
each company is assumed to be stable over time, and the random noise averages out to zero.
2 Due to space constraints we restrict ourselves to a basic description of the methodologies and focus on recent
developments and applications in the insurance industry. An extended version of this paper that contains
more details on the different methodologies is available upon request.
5
Finally, the thick frontier approach (TFA) does not make any distributional assumptions for
the random error and inefficiency terms, but assumes that inefficiencies differ between the
highest and lowest quartile firms (see, e.g., Kumbhakar/Lovell, 2000).
The most commonly used econometric approach is stochastic frontier analysis (SFA), which
was first proposed by Aigner et al. (1979). SFA is usually applied in two steps: In the first
step, a production, cost, revenue, or profit function is estimated, determining the efficient
frontier. In the second step, for individual firms, deviations from the efficient frontier due to
inefficiency and a random error are calculated (see Cummins/Weiss, 2000). To illustrate SFA
formally, we use a translog cost function that has been widely used in literature and shown to
approximate the form of the real underlying cost function fairly well (see, e.g., Choi and
Weiss, 2005; Cummins and Weiss, 2000; Cummins and Zi, 1998; Rai, 1996):
ˆln ln ( , ) ,i i i iC C p y ε= + (1)
where i
C are total observed costs of insurer i. ˆln ( , )i i
C p y , the log cost function that needs to
be estimated, contains a vector of input prices i
p and a vector of output quantities i
y . The
error term i
ε shows how far an insurer is from the efficient frontier. The deviation might be
due to two reasons and these are modelled as i i i
u vε = + . The first reason, modeled by the
first term (i
u ) are random deviations from the efficient frontier; usually, i
u is assumed to be
standard normally distributed. The second reason (modeled by the term i
v ) is inefficiency,
which is usually assumed to be half-normally distributed. To estimate efficiency,
ˆln ( , )i i
C p y is calculated using an econometric method, such as ordinary least squares or max-
imum likelihood. Then the residual is computed as:
ˆln ln ( , ) ,i i i iC C p y ε− = (2)
where i
ε needs to be broken down into the components i
u and i
v . This is done by finding
the conditional probability distribution of i
v given i
ε . Cost efficiency is then calculated as:
( 0, ),
( , )
==
i i i
it
i i i
E C v GEfficiency
E C v G (3)
6
where i
C are total observed costs of insurer i and i
G is a vector of input prices and output
quantities of insurer i. The numerator of Equation (3) reflects minimum cost achievable, pro-
vided output and technology, if the insurer i operates at full efficiency (i.e. i
v =0). The deno-
minator shows actual costs of insurer i given the actual level of efficiency.
There are two configuration decisions that must be made when employing SFA: (1) The
choice of the functional form to approximate the real underlying production, cost, revenue, or
profit function, and (2) the distributional assumption for the inefficiency term. The translog is
an accepted and widely used functional form, but there are a variety of other options, includ-
ing the Cobb-Douglas, Fuss normalized quadratic (see Morrison/Berndt, 1982), and general-
ized translog (see Caves et al., 1980). The composite cost (see Pulley/Braunstein, 1992) or
the Fourier flexible form (see Gallant, 1982) have also been applied in the financial services
industry. While the random error term is usually assumed to be distributed normally, the inef-
ficiency term has been specified to have different distributions, such as half-normal, truncated
normal, exponential, or gamma (see, e.g., Berger/Humphrey, 1997).
3.2. Mathematical programming approaches
Compared with the econometric approaches, the mathematical programming approaches put
significantly less structure on the specification of the efficient frontier and do not decompose
the inefficiency and error terms. The most widespread mathematical programming approach
is data envelopment analysis (DEA), which uses linear programming to measure the relation-
ship of produced goods and services (outputs) to assigned resources (inputs). DEA deter-
mines the efficiency score as an optimization result. DEA models can be specified under the
assumption of constant (CRS) or variable returns to scale (VRS) and can be used to decom-
pose cost efficiency into its single components—technical, pure technical, allocative, and
scale efficiency. To illustrate DEA, we discuss a basic model for measuring technical effi-
ciency assuming CRS (see, e.g., Cooper et al., 2007; Cummins and Nini, 2002; Worthington
and Hurley, 2002). Efficiency e of an insurer i is measured by the ratio:

7
/ ,T T
i i i i ie s y r x= (4)
where i
y is a vector with outputs , j = 1,…, z, of firm i. i
x is a vector with inputs ,k ix ,
k = 1,…, w. T
is is the transposed vector of output weights and T
ir the transposed vector of
input weights. Input and output data are assumed to be positive. For each insurer i, the fol-
lowing optimization problem must be solved in order to obtain optimal input and output
weights for the maximization of efficiency:
,
, ,
max / , subject to:
/ 1
, 0, 1,..., , 1,...,
=
≤
≥ ∀ = =
T T
i i i i is r
T T
i i i i
j i k i
e s y r x
s y r x
s r j z k w
(5)
The first condition of Equation (5) limits the ratio i
e of weighted outputs to weighted inputs
to a maximum of 1. Since the fractional program (Equation (5)) has an infinite number of
solutions, it must be transformed into a linear program by imposing the constraint 1T
i ir x = ,
implying that the weighted sum of inputs is standardized to 1:
,
, ,
max , subject to:
1
0
, 0, 1,..., , 1,...,
=
=
− ≤
≥ ∀ = =
T
i i is r
T
i i
T T
i i i i
j i k i
e s y
r x
s y r x
s r j z k w
(6)
The free-disposal hull (FDH) approach is a special configuration of DEA. Under this ap-
proach, the points on the lines connecting the DEA vertices are excluded from the frontier
and the convexity assumption on the efficient frontier is relaxed (see Cooper/Seiford/Tone,
2007). The concept of total factor productivity is closely related to efficiency and often used
in efficiency studies. Productivity is an index that relates the total amount of outputs pro-
duced to the total amount of inputs used in the production process (see Cummins/Weiss,
2000, p. 770). Total factor productivity growth is thus measured as the change in total outputs
net of the change in total input usage. In contrast, the concept of efficiency measures inputs
,j iy

8
and outputs in relation to a benchmark, i.e., the optimal input output usage in an industry. Of
special interest is the Malmquist index of total factor productivity, since many of the re-
viewed studies work with this measure in combination with DEA analysis (see, e.g., Cum-
mins et al., 1999b; Cummins/ Rubio-Misas, 2006). The important feature of the Malmquist
index is that it is able to decompose total factor productivity growth into two elements: Tech-
nical efficiency changes to determine how much the distance of an individual firm to the effi-
cient frontier has changed, and technical change to determine the movements of the efficient
frontier itself due to technical change over time (see Grosskopf, 1993; Cummins/Weiss,
2000). Overall, the total factor productivity growth is relatively lower in the insurance indus-
try, especially compared to manufacturing industries (Bernstein, 1999; Fuentes et al., 2001;
Luhnen, 2008).
3.3. Comparison and discussion of recent developments
Both the econometric and mathematical programming have their advantages and disadvan-
tages and there is no consensus as to which method is superior (see, e.g., Cummins/Zi, 1998;
Hussels/Ward, 2006). The econometric approach has the main disadvantage of using strong
assumptions regarding the form of the efficient frontier. It assumes a specific functional form,
such as the translog or composite cost, and therefore expects a certain underlying economic
behaviour, which may not be valid. The mathematical programming approach thus has the
advantage of imposing less structure on the efficient frontier. However, compared to the
econometric approach, it has the disadvantage of not taking into account a random error term.
Consequently, mathematical programming approaches run the risk of taking all deviations
from the efficient frontier as inefficiencies, therefore possibly mistaking a true random error
for inefficiency (see Berger/Humphrey, 1997).
In empirical studies, the DEA approach has been most frequently used. Out of the 95 sur-
veyed studies, 55 use DEA, 22 SFA, seven DFA, and one FDH. Ten studies follow the advice
given by Cummins/Zi (1998) and consider multiple approaches, ideally from both the
econometric and mathematical programming sides. Most of these find highly correlated re-

9
sults when ranking firms by their relative efficiency according to different approaches (see,
e.g., Hussels/Ward, 2006). However, both approaches illuminate efficiency from different
perspectives and thus deliver different insights. This is why we follow Cummins/Zi (1998)
and recommend considering both DEA and SFA in empirical studies. Given significant in-
creases in computer power and availability of software for both these approaches makes a
combined analysis feasible and the interpretation of the empirical findings much richer.
For DEA, the most widely used specifications have been under the assumption of VRS. For
SFA, most studies chose the translog functional form. Total factor productivity has been cal-
culated by 24 studies—in combination with DEA in 21 cases and with SFA in three cases.
The choice of methods is often determined by the available data. For example, if the available
data are known to be noisy, the econometric approach, featuring an error term to accommo-
date noise, may lead to more accurate results. In this case, the mathematical programming
approach would not be appropriate, since it mistakes the noise as inefficiencies due to the fact
that there is no error term (see Cummins/Weiss, 2000).
In recent years, there have been a number of proposals for the improvement of efficient
measurement in the field of insurance. For the econometric approach, a major direction has
been to apply more flexible specifications of the functional form. Examples are the composite
cost function or the Fourier flexible distribution (see, e.g., Fenn et al. 2008). Also, Bayesian
stochastic frontier models (see van den Broek et al., 1994), featuring advantages such as ex-
act small-sample inference on efficiencies, have been applied (see, e.g., Ennsfellner/Lewis/
Anderson, 2004). A further proposal has been made regarding the incorporation of firm-
specific variables into the estimation process. Instead of using a two-stage approach, which
first estimates inefficiency of sample firms and then examines the association of inefficiency
with firm-specific variables through regressions, a one-stage approach is suggested. In this
approach, the estimated frontier directly takes into account firm-specific variables by model-
ling mean inefficiency as a function of firm-specific variables (conditional mean approach,
see, e.g., Greene/Segal, 2004; Huang/Liu, 1994). Fenn et al. (2008) address the drawback of
the conditional mean approach, that the variance of the random and efficiency errors is as-
10
sumed constant. Following a procedure by Kumbhakar/Lovell (2000), they explicitly model
the variance of both types of errors and thus correct for potential heteroscedasticity.
Another contribution has been made with regard to the Malmquist index of total factor pro-
ductivity. Although this index is usually applied to nonparametric DEA for insurance compa-
nies, Fuentes/Grifell-Tatjé/Perelman (2001) develop a parametric distance function that en-
ables them to calculate the Malmquist index also for the econometric approach. They show
that using the estimated regression parameters, several radial distance functions can be calcu-
lated and combined in order to estimate and decompose the productivity index.
A drawback of the mathematical programming approach has been the lack of statistical
properties. But Banker (1993) has shown that DEA estimators can also be interpreted as
maximum likelihood estimators under certain conditions, providing a statistical base to DEA.
However, the sampling distribution of the underlying DEA efficiency estimators stays un-
known (see, e.g., Berger/Humphrey, 1997). Also, DEA efficiency estimates have been shown
to be biased upward in finite examples (see, e.g., Simar/Wilson, 1998). In this context, the
bootstrapping procedure proposed by Simar/Wilson (1998) has been applied to the insurance
industry. It provides an empirical approximation of the sampling distribution of efficiency
estimates and corrects the upwards bias (see, e.g., Cummins/Weiss/Zi, 2007; Erhem-
jamts/Leverty, 2007; Diboky/Ubl, 2007). Simar/Wilson (2007) also introduce a truncated
regression and bootstrapping procedure that allows to investigate the impact of external vari-
ables on efficiency scores permitting valid inference, as opposed to the commonly used Tobit
regression approaches.
A further innovation is the introduction of cross-frontier efficiency analysis, which estimates
efficiency of firms using one particular technology relative to the best practice frontier of
firms using an alternative technology. Cross-frontier efficiency analysis makes it possible to
determine whether the outputs of one specific technology could be produced more efficiently
by using the alternative technology. Cross-frontier analysis has been used to examine the ef-
ficiency of different organizational forms, comparing technical, cost, and revenue efficiency
of stocks and mutual insurers (see Cummins et al., 1999b, 2003; Cummins et al., 2004). It has
11
also been used for the analysis of scope economies, comparing diversified and specialist
firms (see Cummins et al., 2003). Finally, Brocket et al. (2004, 2005) apply a range-adjusted
measure version of DEA to the insurance industry. This DEA version, in contrast to other
DEA models, offers the advantage of being able to produce efficiency rankings suitable for
significance tests such as the Mann-Whitney statistic.
4. Input and output factors used in efficiency measurement
4.1. Choice of input factors
There are three main insurance inputs: labour, business service and materials, and capital.
Labour can be further divided into agent and home-office labour. The category of business
service and materials is usually not further subdivided, but includes items like travel, com-
munications, and advertising. At least three categories of capital can be distinguished: physi-
cal, debt, and equity capital (see Cummins/Tennyson/Weiss, 1999; Cummins/Weiss, 2000).
Data on the number of employees or hours worked are not publicly available for the insur-
ance industry in most cases. Therefore, in order to proxy labour and business service input,
input quantities are derived by dividing the expenditures for these inputs with publicly avail-
able wage variables or price indices. For example, the US Department of Labour data on av-
erage weekly wages for SIC Class 6311 (home-office life insurance labour), can be used in
the case of studying the US insurance industry (see, e.g., Berger/Cummins/Weiss, 1997;
Cummins/Zi, 1998). Physical capital is often included in the business service and materials
category, but debt and equity capital are important inputs for which adequate cost measures
have to be found (see, e.g., Cummins/Weiss/Zi, 1999).
61 out of 95 studies use at least labour and capital as inputs and most of them also add a third
category (miscellaneous, mostly business services). Out of those 61 studies, 18 differentiate
between agent and non-agent labour. Also, the number of studies differentiating between eq-
uity and debt capital is low; only 16 do so. Regarding the 34 contributions that do not employ
the standard input categories, 21 of them incorporate broader expenditure categories as in-
puts—e.g., total operating expenses—without decomposing them into quantities and prices
(see, e.g., Rees et al., 1999; Mahlberg/Url, 2003). Nine studies do not cover capital explicitly,

12
i.e., they consider labour only or labour and an additional composite category. Finally, four
studies that focus on financial intermediation consider only capital-related inputs (see, e.g.,
Brocket et al., 1998). The choice of input prices is mainly determined by the data that are
publicly available in the countries under investigation.
4.2. Choice of output factors
There are three principal approaches to measure outputs. The intermediation approach views
the insurance company as a financial intermediary that manages a reservoir of assets, borrow-
ing funds from policyholders, investing them on capital markets, and paying out claims,
taxes, and costs (see Brocket et al., 1998; also called flow approach; see Leverty/Grace,
2008). The user-cost method differentiates between inputs and outputs based on the net con-
tribution to revenues. If a financial product yields a return that exceeds the opportunity cost
of funds or if the financial costs of a liability are less than the opportunity costs, it is deemed
a financial input. Otherwise, it is considered a financial output (see Hancock, 1985; Cum-
mins/Weiss, 2000). The value-added approach (also called production approach; see
Grace/Timme, 1992; Berger et al., 2000) counts outputs as important if they contribute a sig-
nificant added value based on operating cost allocations (see Berger et al., 2000). Usually,
several types of outputs are defined, representing the single lines of business under review.
The value-added approach assumes that the insurer provides three main services, for which
volume output proxies must be defined: Through the first service, risk-pooling and risk-
bearing, insurers create value added by operating a risk pool, collecting premiums from poli-
cyholders, and redistributing most of them to customers who have incurred losses. Via the
second service, “real” financial services relating to insured losses, insurers create value added
for their policyholders by providing real services such as financial planning (life) or the de-
sign of coverage programs (property-liability). The third service is intermediation; insurers
create value added by acting as financial intermediaries that invest the premiums provided by
the policyholders, e.g., on the capital market and pays out claims and administrative expenses
(see, e.g., Cummins/Nini, 2002).

13
To proxy the risk-pooling/risk-bearing function, either premiums or incurred benefits (life)
and present value of losses (property-liability) have been used. Different output proxies are
thus used for life and property-liability insurers, reflecting differences in the types of insur-
ance and data availability (see Berger et al., 2000). In literature, there is an intense debate as
to whether premiums are an appropriate proxy because they represent price times quantity of
output and not output (see, e.g., Yuengert, 1993). The present value of real losses incurred,
however, can be used as a reasonable proxy for output as it corresponds closely to the theo-
retical measures used in insurance economics (see Cummins/Weiss, 2000, for a theoretical
derivation based on the Pratt-Arrow concept of the insurance premium). The risk-
pooling/risk-bearing function involves collecting funds from everyone in the risk pool and
redistributing it to policyholders that incur losses. Thus, losses represent the total amount
redistributed by the pool and are a useful risk proxy (see Berger et al., 2000). In life insur-
ance, incurred benefits represent payments received by policyholders in the current year; they
measure the amount of funds pooled by insurers and redistributed to policyholders as com-
pensation for insured events and are thus comparable to the loss proxy in property-liability
insurance. Insurers issue debt contracts (insurance policies and annuities) and invest the funds
until they are withdrawn by policyholders (in the case of asset accumulation products sold by
life insurers) or are needed to pay claims (see Cummins/Weiss, 2000). Additions to reserves
or invested assets are thus good proxies for the intermediation function and often used in lit-
erature (see, e.g., Berger et al., 2000; Cummins et al., 1999b). Both incurred benefits/present
value of losses, as well as additions to reserves/invested assets, are correlated with the third
function, real financial services of the insurer.
4.3. Comparison and discussion of recent developments
The value-added approach has been established as best practice; 80 out of 95 studies apply
this approach (see Appendix). However, there is a debate among those using the value-added
approach as to whether claims/benefits or premiums/sum insured are the most appropriate
proxy for value added. Out of the 80 articles, 46 follow Cummins/Weiss (2000) and specify
output as either claims/present value of claims (property-liability) or benefits/net incurred

14
benefits (life). 32 studies specify output as premiums/sum insured. Two studies use both
proxies—claims for non-life and premiums for life insurance. One study uses neither of the
two main proxies: Yuengert (1993) takes reserves/additions to reserves as a proxy for value
added. Although more studies use claims/benefits to proxy output than premiums/sum in-
sured, there is no recognizable trend over time as to whether either of the two main proxies is
gaining more of a following among researchers.3
Since the value-added approach to output measurement dominates the literature, there have
only been few innovations with regard to output measurement. Hwang/Kao (2008) introduce
a new relational two-stage production process, in which the outputs of the first production
stage, called "premium acquisition", are the inputs for the second production stage, called
"profit generation". Regarding the other two approaches for output measurement, five studies
employ the intermediation approach, e.g., taking ROI, liquid assets to liability, and solvency
scores as outputs (see Brockett et al., 2004, 2005).
A reflection of popularity is not necessarily an indication of validity. A good example is the
controversial discussion in literature on value added versus financial intermediation (Brocket
et al., 2005; Leverty/Grace, 2008). Cummins/Weiss (2000) argues that the financial interme-
diation approach is not optimal because insurers provide many services in addition to finan-
cial intermediation. Leverty/Grace (2008) show that the value added approach is consistent
with traditional measures of firm performance and inversely related to insurer insolvency.
The intermediation approach is only weakly related to traditional performance measures and
firms recognized as highly efficient have a higher proclivity to fail. In the light of these re-
sults it seems quite reasonable to prefer the value added approach over the financial interme-
diation.
None of the studies reviewed uses the user-cost approach, because this approach requires
precise data on product revenues and opportunity costs, which are not available in the insur-
3 We categorized the number of studies by usage of output proxy and year of publication: from 1991 to 1995 3
studies use claims/benefits and 5 use premiums/sum insured; 1996–2000: 12/7; 2001–2005: 12/12; 2006–
2008: 15/7. Premiums/sum insured might be used in many studies because these measures are more readily
available for most countries.

15
ance industry (see Klumpes, 2007). Five studies use both the value-added and intermediation
approaches (see, e.g., Jeng/Lai, 2005; Leverty/Grace, 2008). Two studies apply physical out-
puts, e.g., Toivanen (1997) uses number of product units produced as insurance output.
5. Fields of application in efficiency measurement
Frontier efficiency methods have been applied to a wide range of countries as well as to all
major lines of business. Furthermore, frontier efficiency methods have been used to investi-
gate various economic questions. These include risk management, market structure, organiza-
tional forms, and mergers. However, it should be noted that findings regarding the same eco-
nomic issues often vary depending on country, line of business, time horizon, and method
considered in the different studies. In the following, we analyze the 95 studies of our survey
according to their field of application and selected main results. For this purpose, we consider
10 application categories (see Table 1). As a quick overview, Table 2 summarizes the main
findings that are discussed in more detail below.
Insert Table 2 here
5.1. Distribution systems
Two main hypotheses have been developed to explain the coexistence of distribution systems
in the insurance industry (see Berger/Cummins/Weiss, 1997). According to the market-
imperfections hypothesis, independent-agency insurers survive while providing essentially
the same services as direct-writing insurers because of market imperfections, such as, e.g.,
price regulation or search costs. In contrast, according to the product-quality hypothesis, the
higher costs of independent-agency insurers can be justified with higher product quality or
greater service intensity, e.g., by providing additional customer assistance with claims settle-
ment or offering a greater variety of product choices.
While these two hypotheses argue in favour of coexistence, the empirical evidence is mixed.
Brockett et al. (1998, 2004), studying the US, and Klumpes (2004), studying the United
Kingdom, find that independent agent distribution systems are more efficient than direct sys-
tems involving company representatives or employed agents. Against it, Berger/Cummins/

16
Weiss (1997) find for the US that independent agent systems are less cost efficient, but
equally profit efficient. On a more general level, Ward (2002) finds for the United Kingdom
that insurers focusing on one distribution system are more efficient than those employing
more than one mode of distribution. Trigo Gamarra/Growitsch (2008), in a study for German
life insurance, finds that single line insurers are neither more cost nor more profit efficient
than multichannel insurers.
5.2. Financial and risk management, capital utilization
Cummins et al. (2006) were the first to explicitly investigate the relationship between risk
management, financial intermediation, and economic efficiency. In their application to the
US property-liability industry, they analyze whether both activities contribute to efficiency
through reducing costs of providing insurance. In order to show the contribution of risk man-
agement and financial intermediation to efficiency, they estimate shadow prices of these two
activities. They find positive shadow prices of both activities and conclude that they signifi-
cantly contribute to increasing efficiency. Brockett et al. (2004) argue that solvency is a pri-
mary concern for regulators of insurance companies; they thus use solvency scores deter-
mined by a neural network model as outputs in efficiency measurement, but they find that
these scores only have limited impact on efficiency in the US property liability market.
Cummins/Nini (2002) find for the same country and line of business, that large increases in
capitalization between 1989 and 1999 represent an inefficiency in so far as equity capital is
significantly over-utilized.
5.3. General level of efficiency and evolution over time
This category contains a large number of studies that represent a first application of effi-
ciency frontier methods to a country. Examples are Nigeria (see Barros/Obijiaku, 2007), Tu-
nisia (see Chaffai/Ouertani, 2002), Malaysia (see Mansor/Radam, 2000), or Australia (see
Worthington/ Hurley, 2002). Given the broad range of countries and time horizons employed,
findings regarding efficiency and productivity are mixed. However, nearly all studies note
that there are significant levels of inefficiency with corresponding room for improvement.
For example the Netherlands with 75% cost efficiency on average have significant improve-
17
ment potential (see Bikker/van Leuvensteijn, 2008). The same is true for China with average
technical efficiency of 77% in non-life and 70% in life (see Yao/Han/Feng, 2007), as well as
Greece with average cost efficiency of 65% (see Noulas et al., 2001).
5.4. Intercountry comparisons
The first cross-country comparison was conducted by Weiss (1991). It covers the US, Ger-
many, France, Switzerland, and Japan. She finds high productivity for the US and Germany.
Japan shows the weakest productivity growth for the period 1975–1987. Rai (1996), in a
broader cross-country study (11 OECD countries), concludes that firms in Finland and France
have the highest efficiency and firms in the United Kingdom have the lowest. Donni/Fecher
(1997) show for a sample of 15 OECD countries for the period 1983–1991 that average effi-
ciency levels are relatively high, but vary across countries. Growth in productivity is ob-
served for all countries, which is attributed to improvements in technical progress.
The introduction of the single European Union (EU) insurance license in 1994 raised con-
cerns over international competitiveness among EU insurers. Consequently, there have been
quite a few efficiency studies that focus on competition in the EU. For a sample of 450 com-
panies from 15 European countries and for the period 1996–1999, Diacon/Starkey/O’Brien
(2002) find striking international differences in average efficiency. According to their study,
insurers doing long-term business in the United Kingdom, Spain, Sweden, and Denmark have
the highest levels of technical efficiency. However, U.K. insurers seem to have particularly
low levels of scale and allocative efficiency compared to the other European countries in the
sample. Interestingly, and in contrast to the literature finding increasing levels of efficiency
over time, these authors find decreasing technical efficiency.
Boonyasai/Grace/Skipper (2002) study efficiency and productivity in Asian insurance mar-
kets. Their results show increasing productivity in Korea and Philippines due to deregulation
and liberalization, but liberalization had little effect on productivity in Taiwan and Thailand.
The most recent stream of efficiency literature, however, again focuses on EU markets and
includes Klumpes (2007) and Fenn et al. (2008). Fenn et al. (2008) find increasing returns to
scale for the majority of EU insurers. The results indicate that mergers and acquisitions, fa-
18
cilitated by liberalized EU markets, have led to efficiency gains. Eling/Luhnen (2008) com-
bine the AM Best US and Non-US database and conduct a cross-country comparison of in-
surers from 36 countries, 12 of which have not previously been analyzed in literature.
Overall, the empirical evidence is consistent in finding that efficiency in developed countries
is higher than that in emerging markets and that technical progress has increased productivity
and efficiency around the world. However, again the empirical findings are not unambiguous.
An example is the United Kingdom, where many studies have consistently indicated rela-
tively low efficiency levels compared to other countries (around 60%; see Rai, 1996; Fenn et
al., 2008; Vencappa/Fenn/Diacon, 2008). Diacon (2001), however, finds higher efficiency for
the United Kingdom—77%, which is higher than that found for competiting European coun-
tries in their study. Given that most efficiency research so far focuses on the US, significant
need for research at the international level can be identified. With variations in market envi-
ronments and cultural norms, we expect that future research will identify substantial differ-
ences in the results for the US and for other insurance markets, e.g., considering the effect of
different organizational forms on efficiency or considering economies of scale and scope.
5.5. Market structure
Choi/Weiss (2005, 2008) analyze three hypotheses derived from the industrial organization
literature: (1) The structure-conduct-performance hypothesis predicts that increased market
concentration leads to higher prices and profits through increased possibilities for collusion
among firms; (2) The relative market power (RMP) hypothesis focuses on economic rents
and predicts that firms with relatively large market shares will exercise their market power
and charge higher prices; (3) The efficient structure (ES) hypothesis claims that more effi-
cient firms charge lower prices than their competitors, allowing them to capture larger market
shares as well as economic rents, leading to increased market concentration. Choi/Weiss
(2005) confirm the ES hypothesis and suggest that regulators should be more concerned with
efficiency rather than market power arising from industry consolidation. Results of
Choi/Weiss (2008) support the RMP hypothesis, implying that insurers in competitive and
non-stringently regulated US states could profit from market power and charge higher unit
prices. However, firms in those states have been found, on average, more cost efficient, and

19
cost efficient insurers charge lower prices, earning smaller profits. A further contribution to
the topic of market structure with a focus on the EU has been made by Fenn et al. (2008),
finding that larger firms with high market shares tend to be less cost efficient.
5.6. Mergers
Kim/Grace (1995) conduct a simulation analysis of efficiency gains from hypothetical hori-
zontal mergers in the US life insurance industry. Their results indicate that most mergers
would improve cost efficiencies, with the exception of mergers between large firms. Two
other US studies (Cummins/Tennyson/Weiss (1999) for life insurance and Cummins/Xie
(2008) for property-liability insurance) conclude that mergers are beneficial for the efficiency
of acquiring and target firm. Klumpes (2007) tests the same hypothesis as Cum-
mins/Tennyson/Weiss (1999) and Cummins/Xie (2008) for the European insurance market
and finds that acquiring firms are more likely to be efficient than nonacquiring firms. How-
ever, he finds no evidence that target firms achieve greater efficiency gains than nontarget
firms. Merger activity in the European insurance markets seems to be mainly driven by sol-
vency objectives—i.e., financially weak insurers are bought by financially sound compa-
nies— and less by value maximization, as in the US.
5.7. Methodology issues, comparing different techniques or assumptions
A few studies primarily solve methodological issues or compare different techniques and
assumptions over time. Cummins/Zi (1998) compare different frontier efficiency methods—
DEA, DFA, FDH, SFA—and find that the efficiency results can differ significantly across
these methods. Fuentes/Grifell-Tatjé/Perelman (2001) introduce a parametric frontier ap-
proach for the application of the Malmquist index that has before that date only been used
with non-parametric frontier approaches. Leverty/Grace (2008) compare the value-added and
intermediation approaches to efficiency measurement and find that these approaches are not
consistent (see Section 3.1 and 3.2 for more details on methodology and techniques).
5.8. Organizational form, corporate governance issues
A well-developed field of frontier efficiency analysis deals with the effect of organizational
form on performance. The two principal hypotheses in this area are the expense preference
hypothesis (see Mester, 1991) and the managerial discretion hypotheses (see Mayers/Smith,
1988). The expense preference hypothesis states that mutual insurers are less efficient than

20
stock companies due to unresolved agency conflicts (e.g., higher perquisite consumption of
mutual managers). The managerial discretion hypothesis claims that the two organizational
forms use different technologies and that mutual companies are more efficient in lines of
business with relatively low managerial discretion (see Cummins/Weiss, 2000).4
The empirical evidence on these two hypotheses has been mixed. Most studies find that stock
insurers are more efficient than mutuals, confirming the expense preference hypothesis (see,
e.g., Cummins/Weiss/Zi, 1999 and Erhemjamts/Leverty, 2007 for the US market;
Diboky/Ubl, 2007 for Germany). However, other studies have found mutuals more efficient
than stocks. For example, Diacon/Starkey/O'Brien (2002), in a comparison of 15 European
countries, find higher levels of technical efficiency for mutuals than for stocks. Also,
Greene/Segal (2004) in an application to the US life insurance industry, suggest that mutual
companies are as cost efficient as stock companies. Other studies investigate efficiency im-
provements after demutualization (see, e.g., Jeng/Lai/McNamara, 2007) and compare the
efficiency of firms after initial public offerings versus that of private firms (see Xie, 2008).
Looking at corporate governance issues, a positive relation between cost efficiency and the
size of the corporate board of directors was identified (see Hardwick/Adams/Zou, 2004).
5.9. Regulation change
The aim of deregulation in the financial services sector is to improve market efficiency and
enhance consumer choice through more competition, but the empirical evidence is mixed.
Rees et al. (1999) find modest efficiency improvements from deregulation for the UK and
German life insurance markets for the period from 1992–1994. Hussels/Ward (2006) do not
find clear evidence for a link between deregulation and efficiency for the same countries and
line of business during the period 1991–2002. Mahlberg (2000) even finds decreasing effi-
ciency for Germany considering life and property-liability insurance for the period of 1992–
1996, but an increase in productivity. The results for Spain are different: Cummins/Rubio-
Misas (2006) find clear evidence for total factor productivity growth for the period of 1989–
1998, with consolidation reducing the number of firms in the market. Boonyasai/Grace/
4 The hypotheses that stocks and mutuals use different technologies is also called efficient structure hypothes-
es (Cummins/Rubio-Misas/Zi., 2004; Wende et al., 2008), but this hypotheses is not related to the efficient
structure hypotheses mentioned with the discussion of market structure in Section 5.5.

21
Skipper (2002) find evidence for productivity increases in Korea and the Philippines due to
deregulation. Considering the US, Ryan/Schellhorn (2000) find unchanged efficiency levels
from the start of the 1990s to the middle of that decade, a period during which risk-based
capital requirements (RBC) became effective. Recently, Yuan/Phillips (2008) find evidence
for cost scope diseconomies and revenue scope economies for the integrated banking and
insurance sectors after changes due to the Gramm-Leach-Bliley Act of 1999.
5.10. Scale and scope economies
Scale economies have been extensively researched in the context of consolidation and the
justification of mergers (see Cummins/Weiss, 2000). Although detailed results vary across
studies, depending on countries, methods, and time horizons employed, many contributions
have found, on average, evidence for increasing returns to scale (see, e.g., Hardwick, 1997,
for UK, Hwang/Gao, 2005, for Ireland, Qiu/Chen, 2006, for China, and Fecher/Perelman/
Pestieau, 1991 for France). However, the differentiation between size clusters must be con-
sidered to achieve more specific results. For example, Yuengert (1993) finds increasing re-
turns to scale for US life insurance firms with up to US$15 billion in assets and constant re-
turns to scale for bigger firms. In contrast, Cummins/Zi (1998), for the same market, find
increasing returns to scale for firms having up to US$1 billion in assets, and decreasing re-
turns to scale for all others except for a few firms with constant returns to scale.
The two main hypotheses regarding economies of scope are the conglomeration hypothesis,
which holds that operating a diversity of business can add value by exploiting cost and reve-
nue scope economies and the strategic focus hypothesis, which holds that firms can best add
value by focusing on core businesses (see Cummins/Weiss/Zi, 2007). Considering US life
insurers, Meador/Ryan/Schellhorn (2000) find that diversification across multiple insurance
and investment product lines resulted in greater efficiency which is in line with the conglom-
eration hypothesis. Fuentes/Grifell-Tatjé/ Perelman (2005) also find evidence for economies
of scope, in their case for Spanish life and non-life insurers. Berger et al. (2000) show for the
US that profit scope economies are more likely to be realized by larger firms. In contrast to
all these authors, Cummins/Weiss/Zi (2007) use cross-frontier analysis and find mixed results
with regard to scope economies.
22
6. Conclusion and Implications for Future Research
In recent years academics, practitioners and policy makers have spent significant attention to
frontier efficiency techniques in the insurance industry. The purpose of this paper was to pro-
vide an overview of this rapidly growing field of research. We analyze 95 studies on effi-
ciency measurement in the insurance sector, provide a systematization of different applica-
tions and highlight recent developments. The paper serves as a comprehensive overview of
relevance not only to researchers interested in frontier efficiency studies, but also to regula-
tors and managers for more practical reasons.
Data envelopment analysis (DEA) is the most frequently applied method in studies conduct-
ing frontier efficiency analysis in insurance—55 out of 95 papers apply DEA. In recent years,
there have been a number of proposals for improving both econometric and mathematical
programming approaches. Proposals include, e.g., the development of more appropriate func-
tional forms for the econometric approaches or the introduction of bootstrapping procedures
for the mathematical programming approaches. With regard to the choice of input factors,
there seems to be widespread agreement among researchers: 61 out of 95 studies use at least
labour and capital as inputs and most of them also add a third category, usually business ser-
vices. With regard to output measurement, most studies employ the value-added approach (80
out of 95). However, there is some controversy over whether premiums or claims are the bet-
ter proxy for value added. In recent years, there has been an expansion of frontier efficiency
measurement in insurance to new fields of application, such as market structure and risk
management. Also, the geographic scope has been rapidly growing, moving from a previ-
ously US-focused view to a broad set of countries around the world.
The large number of studies is indicative of increasing interest in the international competi-
tiveness and efficiency of insurance companies and our survey has brought to light a number
of opportunities for future research. First of all, significant research potential can be identi-
fied at the international level. Most of the existing cross-country comparisons are either fo-
cused on Europe—such as Fenn et. al. (2008) and Diacon et al. (2002)—or consider rela-
tively small datasets—such as Rai (1996), which covers only 106 companies in 11 countries.
In this context the relatively new research topics of market structure (see, e.g., Choi/Weiss,
2005, 2008) and risk management (see, e.g., Cummins et al., 2006) need to be analyzed for a
23
larger sample of countries. This would allow us to move away from the US focus of the few
studies that have been published to date. Another research idea in this context would be to
use cross-frontier analysis to compare the production technology in different countries.
For studies on risk and financial management, a link to the discussion regarding the imple-
mentation of new risk-based capital standards for insurers, such as Solvency II (see, e.g., El-
ing et al., 2007), would be of interest. In this case, the possible impact of different solvency
proposals on efficiency could be evaluated. Given that corporate governance is often consid-
ered as a potential cause of the recent financial market crisis, the link between corporate gov-
ernance and efficiency needs closer consideration.
A widening of the research arena beyond the United States is also needed when it comes to
analysis of mergers and efficiency. For example, all studies on this topic except for one
(Klumpes, 2007) are US-focused. Regarding the coverage of different lines of business, it
becomes obvious that most studies have been implemented at relatively high levels of aggre-
gation. Academic contributions on efficiency performance of sublines of business—e.g., auto
insurance, as done by Choi/Weiss (2008) or homeowner insurance—would be of special in-
terest for countries where appropriate data are available.
Most efficiency studies only interpret the efficiency numbers, but the analysis provides a lot
more interesting information such as the marginal rate of substitution (if the shadow prices of
two inputs are compared), the marginal productivity (if the shadow prices of one input and
one output are compared), and the marginal rate of transformation (if the shadow prices of
two outputs are compared). The shadow prices, however, have not yet been in focus of much
of the literature. Considering stochastic frontier analysis, an important contribution would be
to find which functional form best fits empirical cost or profit functions, again with possible
differences between lines of businesses and countries. Furthermore, efficiency can be meas-
ured for each decision making unit in a company, i.e., for each business unit or line of busi-
ness; the link between capital allocation in insurance companies that is controversially dis-
cussed in recent literature (Myers/Read, 2001; Gründl/Schmeiser, 2007) and efficiency could
thus be a fruitful area of future research. Overall, frontier efficiency measurement has been
one of the most rapidly growing streams of insurance literature in the last years and so it will
be in the future.

24
References
Aigner, D. J., Lovell, C. A. K., Schmidt P., 1979. Formulation and estimation of stochastic frontier production function models. Journal of Econometrics 6(1), 21–37.
Badunenko, O., Grechanyuk, B., Talavera, O., 2006. Development Under Regulation: The Way of the Ukrainian Insurance Market. Discussion Papers of DIW Berlin 644, DIW Berlin, German Institute for Economic Re-search.
Banker, R. D., 1993. Maximum Likelihood, Consistency and Data Envelopment Analysis: A Statistical Founda-tion. Management Science 39(10), 1265–1273.
Banker, R. D., Charnes, A., Cooper, W. W., Swarts, J., Thomas, D. A., 1989. An Introduction to Data Envelop-ment Analysis with Some of its Models and Their Uses. In: Chan, J. L., Patton, J. M., eds., Research in
Governmental and Non-Profit Accounting, Vol. 5, JAI Press, Greenwich. Barros, P., Barroso, N., Borges, M. R., 2005. Evaluating the Efficiency and Productivity of Insurance Compa-
nies with a Malmquist Index: A Case Study for Portugal. Geneva Papers on Risk and Insurance 30(2), 244–267.
Barros, P., Obijiaku, E. L., 2007. Technical Efficiency of Nigerian Insurance Companies. Department of Eco-nomics, Institute for Economics and Business Administration (ISEG), Technical University of Lisbon. Working Papers No. 18.
Berger, A. N., 1993. Distribution-Free Estimates of Efficiency of in the U.S. Banking Industry and Tests of the Standard Distributional Assumptions. Journal of Productivity Analysis 4(3), 261–292.
Berger, A. N., Cummins, J. D., Weiss, M. A., 1997. The Coexistence of Multiple Distribution Systems for Fi-nancial Services: The Case of Property-Liability Insurance. Journal of Business 70(4), 515–546.
Berger, A. N., Cummins, J. D., Weiss, M. A., Zi, H., 2000. Conglomeration Versus Strategic Focus: Evidence from the Insurance Industry. Journal of Financial Intermediation 9(4), 323–362.
Berger, A. N., Humphrey, D. B., 1991. The Dominance of Inefficiencies Over Scale and Product Mix Econo-mies in Banking. Journal of Monetary Economics 28(1), 117–148.
Berger, A. N., Humphrey, D. B., 1992. Measurement and Efficiency Issues in Commercial Banking. In: Griliches, Z., ed., Output Measurement in the Service Sectors, Vol. 56, National Bureau of Economic Re-search, Studies in Income and Wealth, University of Chicago Press, Chicago, IL.
Berger, A. N., Humphrey, D. B., 1997. Efficiency of Financial Institutions: International Survey and Directions for Future Research. European Journal of Operational Research 98(2), 175–212.
Berger, A. N., Mester, L. J., 1997. Inside the Black Box: What Explains Differences in the Efficiencies of Fi-nancial Institutions? Journal of Banking and Finance 21(7), 895–947.
Bernstein, J. I., 1999. Total Factor Productivity Growth in the Canadian Life Insurance Industry: 1979–1989. Canadian Journal of Economics 32(2), 500–517.
Bikker, J. A., van Leuvensteijn, M., 2008. Competition and Efficiency in the Dutch Life Insurance Industry. Applied Economics (forthcoming).
Boonyasai, T., Grace, M. F., Skipper, Jr., H. D., 2002. The Effect of Liberalization and Deregulation on Life Insurer Efficiency. Working Paper No. 02-2, Center for Risk Management and Insurance Research, Georgia State University, Atlanta.
Brockett, P. L., Cooper, W. W., Golden, L. L., Rousseau, J. J., Wang, Y., 1998. DEA Evaluations of the Effi-ciency of Organizational Forms and Distribution Systems in the US Property and Liability Insurance Indus-try. International Journal of Systems Science 29(11), 1235–1247.
Brockett, P. L., Cooper, W. W., Golden, L. L., Rousseau, J. J., Wang, Y., 2004a. Evaluating Solvency Versus Efficiency Performance and Different Forms of Organization and Marketing in US Property-Liability In-surance Companies. European Journal of Operational Research 154(2), 492–514.
Brockett, P. L., Chang, R. C., Rousseau, J. J., Semple, J. H., Yang, C, 2004b. A Comparison of HMO Efficien-cies as a Function of Provider Autonomy. Journal of Risk and Insurance 71(1), 1–19.
Brockett, P. L., Cooper, W. W., Golden, L. L., Rousseau, J. J., Wang, Y., 2005. Financial Intermediary Versus Production Approach to Efficiency of Marketing Distribution Systems and Organizational Structure of In-surance Companies. Journal of Risk and Insurance 72(3), 393–412.
Carr, R. M., Cummins, J. D., Regan, L., 1999. Efficiency and Competitiveness in the U.S. Life Insurance Indus-try: Corporate, Product, and Distribution Strategies. In: Cummins, J. D., Santomero, A. M., eds., Changes
in the Life Insurance Industry: Efficiency, Technology and Risk Management. Kluwer Academic Publishers, Boston, MA.
Caves, D. W., Christensen, L. R., Tretheway, M. W., 1980. Flexible Cost Functions for Multiproduct Firms. Review of Economics and Statistics 62(3), 477–482.
Chaffai, M. E., Ouertani, M. N., 2002. Technical Efficiency in the Tunisian Insurance Industry: A Comparison of Parametric and Non Parametric Time Variant Models. Working Paper, Research Unit on Production Econometrics, Sfax University, Sfax.

25
Charnes, A., Cooper, W. W., Lewin, A., Seiford, L., 1994. Data Envelopment Analysis: Theory, Methodology
and Applications. Kluwer Academic Publishers, Boston, MA. Charnes, A., Cooper, W. W., Rhodes, E., 1978. Measuring the Efficiency of Decision Making Units. European
Journal of Operational Research 2(6), 429–444. Choi, P. B., Weiss, M. A., 2005. An Empirical Investigation of Market Structure, Efficiency, and Performance
in Property-Liability Insurance. Journal of Risk and Insurance 72(4), 635–673. Choi, P. B., Weiss, M. A., 2008. State Regulation and the Structure, Conduct, Efficiency and Performance of
US Auto Insurers. Journal of Banking and Finance 32(1), 134–156. Christensen, L. R., Jorgenson, D. W., Lau, L. J., 1973. Transcendental Logarithmic Production Frontiers. Re-
view of Economics and Statistics 55(1), 28–45. Cooper, W. W., Seiford, L. M., Tone, K., 2007. Data Envelopment Analysis: A Comprehensive Text with Mod-
els, Applications, References and DEA-Solver Software. Springer, Boston, MA. Cummins, J. D., 1999. Efficiency in the U.S. Life Insurance Industry: Are Insurers Minimizing Costs and
Maximizing Revenues? In: Cummins, J. D., Santomero, A. M., eds., Changes in the Life Insurance Indus-
try: Efficiency, Technology and Risk Management. Kluwer Academic Publishers, Boston, MA. Cummins, J. D., Dionne, G., Gagné, R., Nouira, A., 2006. Efficiency of Insurance Firms with Endogenous Risk
Management and Financial Intermediation Activities. Working Paper. Cummins, J. D., Nini, G. P., 2002. Optimal Capital Utilization by Financial Firms: Evidence from the Property-
Liability Insurance Industry. Journal of Financial Services Research 21(1–2), 15–53. Cummins, J. D., Rubio-Misas, M., 2006. Deregulation, Consolidation, and Efficiency: Evidence from the Span-
ish Insurance Industry. Journal of Money, Credit, and Banking 38(2), 323–355. Cummins, J. D., Rubio-Misas, M., Zi, H., 2004. The Effect of Organizational Structure on Efficiency: Evidence
from the Spanish Insurance Industry. Journal of Banking and Finance 28(12), 3113–3150. Cummins, J. D., Tennyson, S., Weiss, M. A., 1999a. Consolidation and Efficiency in the US Life Insurance
Industry. Journal of Banking and Finance 23(2–4), 325–357. Cummins, J. D., Turchetti, G., Weiss, M. A., 1996. Productivity and Technical Efficiency in the Italian Insur-
ance Industry. Working Paper, Wharton Financial Institutions Center, University of Pennsylvania, PA. Cummins, J. D., Weiss, M. A., 1993. Measuring Cost Efficiency in the Property-Liability Insurance Industry.
Journal of Banking and Finance 17(2–3), 463–482. Cummins, J. D., Weiss, M. A., 2000. Analyzing Firm Performance in the Insurance Industry Using Frontier
Efficiency Methods. In: Dionne, G., ed., Handbook of Insurance Economics. Kluwer Academic Publishers, Boston, MA.
Cummins, J. D., Weiss, M. A., Zi, H., 1999b. Organizational Form and Efficiency: The Coexistence of Stock and Mutual Property-Liability Insurers. Management Science 45(9), 1254–1269.
Cummins, J. D., Weiss, M. A., Zi, H., 2007. Economics of Scope in Financial Services: A DEA Bootstrapping Analysis of the US Insurance Industry. Working Paper, The Wharton School, Philadelphia, PA.
Cummins, J. D., Xie, X., 2008. Mergers and Acquisitions in the US Property-Liability Insurance Industry: Pro-ductivity and Efficiency Effects. Journal of Banking and Finance 32(1), 30–55.
Cummins, J. D., Zi, H., 1998. Comparison of Frontier Efficiency Methods: An Application to the U.S. Life Insurance Industry. Journal of Productivity Analysis 10(2), 131–152.
Davutyan, N., Klumpes, P. J. M., 2008. Consolidation and Efficiency in the Major European Insurance Markets: A Non Discretionary Inputs Approach. Working Paper.
Delhausse, B., Fecher, F., Pestieau, P., 1995. Measuring Productive Performance in the Non-Life Insurance Industry: The Case of French and Belgian Markets. Tijdschrift voor Economie en Management 40(1), 47–69.
Deprins, E., Simar, L., Tulkens, H., 1984. Measuring Labor Efficiency in Post Offices. In: Marchand, M., Pes-tieau, P., Tulkens, H., eds., The Performance of Public Enterprises: Concepts and Measurement. North Holland, Amsterdam.
Diacon, S. R., 2001. The Efficiency of UK General Insurance Companies. Working Paper, Centre for Risk & Insurance Studies, University of Nottingham.
Diacon, S. R., Starkey, K., O’Brien, C., 2002. Size and Efficiency in European Long-Term Insurance Compa-nies: An International Comparison. Geneva Papers on Risk and Insurance 27(3), 444–466.
Diboky, F., Ubl, E., 2007. Ownership and Efficiency in the German Life Insurance Market: A DEA Bootstrap Approach. Working Paper, University of Vienna.
Donni, O., Fecher, F., 1997. Efficiency and Productivity of the Insurance Industry in the OECD Countries. Ge-
neva Papers on Risk and Insurance 22, 523–535. Donni, O., Hamende, V., 1993. Performance des Sociétés Belges D’Assurance-Comparaison des formes institu-
tionelles. Annals of Public and Cooperative Economics, Université de Liège. Eling, M., Luhnen, M. 2008. Efficiency in the International Insurance Industry: A Cross-country Comparison.
Working Paper, University of St. Gallen.
26
Eling, M., Schmeiser, H., Schmit, J. T., 2007. The Solvency II Process: Overview and Critical Analysis. Risk
Management and Insurance Review 10(1), 69–85. Ennsfellner, K. C., Lewis, D., Anderson, R. I., 2004. Production Efficiency in the Austrian Insurance Industry:
A Bayesian Examination. Journal of Risk and Insurance 71(1), 135–159. Erhemjamts, O., Leverty, J. T., 2007. The Demise of the Mutual Organizational Form: An Investigation of the
Life Insurance Industry. Working Paper. Farrell, M. J., 1957. The Measurement of Productive Efficiency. Journal of the Royal Statistical Society 120(3),
253–282. Fecher, F., Kessler, D., Perelman, S., Pestieau, P., 1993. Productive Performance in the French Insurance Indus-
try. Journal of Productivity Analysis 4(1–2), 77–93. Fecher, F., Perelman, S., Pestieau, P., 1991. Scale Economics and Performance in the French Insurance Indus-
try. Geneva Papers on Risk and Insurance 16, 315–326. Fenn, P., Vencappa, D., Diacon, S., Klumpes, P., O’Brien, C., 2008. Market Structure and the Efficiency of
European Insurance Companies: A Stochastic Frontier Analysis. Journal of Banking and Finance 32(1), 86–100.
Fuentes, H., Grifell-Tatjé, E., Perelman, S., 2001. A Parametric Distance Function Approach for Malmquist Productivity Index Estimation. Journal of Productivity Analysis 15(2), 79–94.
Fuentes, H., Grifell-Tatjé, E., Perelman, S., 2005. Product Specialization, Efficiency and Productivity Change in the Spanish Insurance Industry. Working Paper, Université de Liège.
Fukuyama, H., 1997. Investigating Productive Efficiency and Productivity Changes of Japanese Life Insurance Companies. Pacific-Basin Finance Journal 5(4), 482–509.
Fukuyama, H., Weber, W. L., 2001. Efficiency and Productivity Change of Non-Life Insurance Companies in Japan. Pacific Economic Review 6(1), 129–146.
Gallant, A. R., 1982. Unbiased Determination of Production Technologies. Journal of Econometrics 20(2), 285–323.
Gardner, L. A., Grace, M. F., 1993. X-Efficiency in the US Life Insurance Industry. Journal of Banking and
Finance 17(2–3), 497–510. Grace, M. F., Timme, S. G., 1992. An Examination of Cost Economies in the United States Life Insurance In-
dustry. Journal of Risk and Insurance 59(1), 72–103. Greene, W. H., 1993. The Econometric Approach to Efficiency Analysis. In: Fried, H. O., Lovell, C. A. K.,
Schmidt, S. S., eds., The Measurement of Productive Efficiency: Techniques and Applications. Oxford Uni-versity Press, Oxford.
Greene, W. H., Segal, D., 2004. Profitability and Efficiency in the U.S. Life Insurance Industry. Journal of Pro-
ductivity Analysis 21(3), 229–247. Grosskopf, S., 1993. Efficiency and Productivity. In: Fried, H. O., Lovell, C. A. K., Schmidt, S. S., eds., The
Measurement of Productive Efficiency: Techniques and Applications. Oxford University Press, Oxford. Gründl, H., Schmeiser, H, 2007. Capital Allocation for Insurance Companies: What Good Is It? Journal of Risk
and Insurance, 74(3): 301–317. Hancock, D., 1985. The Financial Firm: Production with Monetary and Non-Monetary Goods. Journal of Po-
litical Economy 93(5), 859–880. Hao, J. C. J., 2007. Efficiency Test on Taiwan’s Life Insurance Industry Using X-Efficiency Approach. Infor-
mation and Management Sciences 18(1), 37–48. Hao, J. C. J., Chou, L. Y., 2005. The Estimation of Efficiency for Life Insurance Industry: The Case in Taiwan.
Journal of Asian Economics 16(5), 847–860. Hardwick, P., 1997. Measuring Cost Inefficiency in the UK Life Insurance Industry. Applied Financial Econom-
ics 7(1), 37–44. Hardwick, P., Adams, M., Zou, H., 2004. Corporate Governance and Cost Efficiency in the United Kingdom
Life Insurance Industry. Working Paper. Hirao, Y., Inoue, T., 2004. On the Cost Structure of the Japanese Property-Casualty Insurance Industry. Journal
of Risk and Insurance 71(3), 501–530. Huang, C., Liu, J., 1994. Estimation of a Non-Neutral Stochastic Frontier Production Function. Journal of Pro-
ductivity Analysis 5(2), 171–180. Huang, W., 2007. Efficiency in the China Insurance Industry: 1999–2004. Working Paper. Hussels, S., Ward, D. R., 2006. The Impact of Deregulation on the German and UK Life Insurance Markets: An
Analysis of Efficiency and Productivity Between 1991–2002. Working Paper, Cranfield Research Paper Se-ries (4).
Hwang, S. N., Kao, C., 2008a. Using Two-Stage DEA to Measure Managerial Efficiency Change of Non-Life Insurance Companies in Taiwan. International Journal of Management and Decision Making 9(4), 377–401.

27
Hwang, S. N., Kao, C., 2008b. Efficiency Decomposition in Two-Stage Data Envelopment Analysis: An Appli-cation to Non-Life Insurance Companies in Taiwan. European Journal of Operational Research 185(1), 418–429.
Hwang, T., Gao, S. S., 2005. An Empirical Study of Cost Efficiency in the Irish Life Insurance Industry. Inter-
national Journal of Accounting, Auditing and Performance Evaluation 2(3), 264–280. Jeng, V., Lai, G. C., 2005. Ownership Structure, Agency Costs, Specialization, and Efficiency: Analysis of
Keiretsu and Independent Insurers in the Japanese Nonlife Insurance Industry. Journal of Risk and Insur-
ance 72(1), 105–158. Jeng, V., Lai, G. C., McNamara, M. J., 2007. Efficiency and Demutualization: Evidence from the U.S. Life
Insurance Industry in the 1980s and 1990s. Journal of Risk and Insurance 74(3), 683–711. Kessner, K., 2001a. Ein Effizienzvergleich deutscher und britischer Lebensversicherungen. In: Markttrans-
parenz und Produktionseffizienz in der deutschen Lebensversicherung. Dissertation, Ludwig-Maximilians-Universität München.
Kessner, K., 2001b. Skaleneffizienz und Produktivitätswachstum in der deutschen Lebensversicherung. In: Markttransparenz und Produktionseffizienz in der deutschen Lebensversicherung. Dissertation, Ludwig-Maximilians-Universität München.
Kessner, K., Polborn, M., 1999. Eine Effizienzanalyse der deutschen Lebensversicherer—die Best Practice Methode. Zeitschrift für die gesamte Versicherungswissenschaft 88(2–3), 469–488
Kim, H., Grace, M. F., 1995. Potential Ex Post Efficiency Gains of Insurance Company Mergers. Working Pa-per, Center for RMI Research 95-4, College of Business Administration, Georgia State University, Atlanta.
Klumpes, P. J. M., 2004. Performance Benchmarking in Financial Services: Evidence from the UK Life Insur-ance Industry. Journal of Business 77(2), 257–274.
Klumpes, P. J. M., 2007. Consolidation and Efficiency in the Major European Insurance Markets. Working Paper, Imperial College, London.
Kumbhakar, S. C., Lovell, C. A. K., 2000. Stochastic Frontier Analysis. Cambridge University Press. Leverty, T. J., Grace, M. F., 2008. Issues in Measuring the Efficiency of Property-Liability Insurers. Working
Paper. Leverty, T., Lin, Y., Zhou, H., 2004. Firm Performance in the Chinese Insurance Industry. Working Paper. Luhnen, M. 2008. Determinants of Efficiency and Productivity in German Property-Liability Insuracne: Evi-
dence for 1995–2006. Working Paper, University of St. Gallen. Mahlberg, B., 1999. Effizienzmessung österreichischer und deutscher Versicherungen—Ein Vergleich.
Wirtschaftspolitische Blätter 46(4), 400–406. Mahlberg, B., 2000. Technischer Fortschritt und Produktivitätsveränderungen in der deutschen Versi-
cherungswirtschaft. Jahrbücher für Nationalökonomik und Statistik 220(5), 565–591. Mahlberg, B., Url, T., 2000. The Transition to the Single Market in the German Insurance Industry. Working
Paper, Austrian Institute of Economic Research. Mahlberg, B., Url, T., 2003. Effects of the Single Market on the Austrian Insurance Industry. Empirical Eco-
nomics 28(4), 823–838. Mansor, S. A., Radam, A., 2000. Productivity and Efficiency Performance of the Malaysian Life Insurance
Industry. Jurnal Ekonomi Malaysia 34(1), 93–105. Mayers, D., Smith, C. W., 1988. Ownership Structure Across Lines of Property-Casualty Insurance. Journal of
Law and Economics 31(2), 351–378. Meador, J. W., Ryan, Jr., H. E., Schellhorn, C. D., 2000. Product Focus Versus Diversification: Estimates of X-
Efficiency for the US Life Insurance Industry. Working Paper, Wharton Financial Institutions Center, Uni-versity of Pennsylvania.
Mester, L. J., 1991. Agency Costs Among Savings and Loans. Journal of Financial Intermediation 1(3), 257–278.
Morrison, C. J., Berndt, E. R., 1982. Short-Run Labor Productivity in a Dynamic Model. Journal of Economet-
rics 16(3), 339–365. Myers, S. C., Read Jr., J. A., 2001. Capital Allocation for Insurance Companies. Journal of Risk and Insurance,
68(4): 545–580. Noulas, A. G., Hatzigayios, T., Lazaridis, J., Lyroudi, K., 2001. Non-Parametric Production Frontier Approach
to the Study of Efficiency of Non-Life Insurance Companies in Greece. Journal of Financial Management
and Analysis 14(1), 19–26. Pulley, L. B., Braunstein, Y., 1992. A Composite Cost Function for Multiproduct Firms with an Application to
Economies of Scope in Banking. Review of Economics and Statistics 74(2), 221–230. Qiu, S., Chen, B., 2006. Efficiencies of Life Insurers in China—An Application of Data Envelopment Analysis.
Working Paper. Rai, A., 1996. Cost Efficiency of International Insurance Firms. Journal of Financial Services Research 10(3),
213–233.

28
Rees, R., Kessner, E., Klemperer, P., Matutes, C., 1999. Regulation and Efficiency in European Insurance Mar-kets. Economic Policy 14(29), 363–397.
Ryan, Jr., H. E., Schellhorn, C. D., 2000. Life Insurer Cost Efficiency Before and After Implementation of the NAIC Risk-Based Capital Standards. Journal of Insurance Regulation 18(3), 362–384.
Schmidt, P., Sickles, R. C., 1984. Production Frontiers and Panel Data. Journal of Business and Economic Sta-
tistics 2(4), 299–326. Simar, L., Wilson, P. W., 1998. Sensitivity Analysis of Efficiency Scores: How to Bootstrap in Nonparametric
Frontier Models. Management Science 44(11), 49–61. Simar L., Wilson P., 2007. Estimation and Inference in Two-Stage, Semi-Parametric Models of Production
Processes. Journal of Econometrics 136(1), 31–64. Toivanen, O., 1997. Economies of Scale and Scope in the Finnish Non-Life Insurance Industry. Journal of
Banking and Finance 21(6), 759–779. Tone, K., Sahoo, B. K., 2005. Evaluating Cost Efficiency and Returns to Scale in the Life Insurance Corporation
of India Using Data Envelopment Analysis. Socio-Economic Planning Sciences 39(4), 261–285. Trigo Gamarra, L., 2008. The Effects of Liberalization and Deregulation on the Performance of Financial Insti-
tutions: The Case of the German Life Insurance Market. Working Paper, University of Rostock. Trigo Gamarra, L., Growitsch, C., 2008. Single- versus Multi-Channel Distribution Strategies in the German
Life Insurance Market: A Cost and Profit Efficiency Analysis. Thünen-Series of Applied Economic Theory Working Paper No. 81, University of Rostock.
Tulkens, H., 1993. On FDH Efficiency Analysis: Some Methodological Issues and Applications to Retail Bank-ing, Courts, and Urban Transit. Journal of Productivity Analysis 4(1–2), 183–210.
Turchetti, G., Daraio, C., 2004. How Deregulation Shapes Market Structure and Industry Efficiency: The Case of the Italian Motor Insurance Industry. The Geneva Papers on Risk and Insurance - Issues and Practice 29(2), 202–218
Van den Broeck J., Koop G., Osiewalski J., Steel M. F. J., 1994. Stochastic frontier models: A Bayesian per-spective. Journal of Econometrics 61, 273–303.
Vencappa, D., Fenn, P., Diacon, S., 2008. Parametric Decomposition of Total Factor Productivity Growth in the European Insurance Industry: Evidence from Life and Non-Life Companies. Working Paper.
Ward, D., 2002. The Costs of Distribution in the UK Life Insurance Market. Applied Economics 34(15), 1959–1968.
Weiss, M. A., 1986. Analysis of Productivity at the Firm Level: An Application to Life Insurers. Journal of Risk
and Insurance 53(1), 49–84. Weiss, M. A., 1991a. Efficiency in the Property-Liability Insurance Industry. Journal of Risk and Insurance
58(3), 452–479. Weiss, M. A., 1991b. International P/L Insurance Output, Input, and Productivity Comparisons. Geneva Papers
on Risk and Insurance Theory 16(2), 179–200. Wende, S., Berry-Stölzle, T. R., Lai, G. L., 2008. The Effect of Regulation on Comparative Advantages of Dif-
ferent Organizational Forms: Evidence from the German Property-Liability Insurance Industry. Working Paper, University of Cologne.
Worthington, A. C., Hurley, E. V., 2002. Cost Efficiency in Australian General Insurers: A Non-Parametric Approach. British Accounting Review 34(2), 89–108.
Wu, D., Yang, Z., Vela, S., Liang, L., 2007. Simultaneous Analysis of Production and Investment Performance of Canadian Life and Health Insurance Companies Using Data Envelopment Analysis. Computers & Op-
erations Research 34(1), 180–198. Xie, X., 2008. Are Publicly Held Firms Less Efficient? Evidence from the US Property-Liability Insurance
Industry. Working Paper. Yang, Z., 2006. A Two-Stage DEA Model to Evaluate the Overall Performance of Canadian Life and Health
Insurance Companies and Computer. Mathematical and Computer Modelling 43(7–8), 910–919. Yao, S., Han, Z., Feng, G., 2007. On the Technical Efficiency of China’s Insurance Industry After WTO Acces-
sion. China Economic Review 18(1), 66–86. Yuan, Y., Phillips, R. D., 2008. Financial Integration and Scope Efficiency in U.S. Financial Services Post
Gramm-Leach-Bliley. Working Paper. Yuengert, A. M., 1993. The Measurement of Efficiency in Life Insurance: Estimates of a Mixed Normal-
Gamma Error Model. Journal of Banking and Finance 17(2–3), 483–496. Zanghieri, P., 2008. Efficiency of European Insurance Companies: Do Local Factors Matter? Working Paper,
Association of Italian Insurers, Rome.

29
Application Country Method Author (Date)
Distribution systems US DFA Berger et al. (1997)
US DEA Brockett et al. (1998)
US DEA Carr et al. (1999)
UK SFA Klumpes (2004)
Germany DEA Trigo Gamarra/Growitsch (2008)
UK SFA Ward (2002)
Financial and risk man-
agement, capital utilization
US DEA Brockett et al. (2004a)
US SFA Cummins et al. (2006)
US DEA Cummins/Nini (2002)
General level of efficiency
and evolution over time
Portugal DEA Barros et al. (2005)
Nigeria DEA Barros/Obijiaku (2007)
Netherlands SFA Bikker/van Leuvensteijn (2008)
US DEA Cummins (1999)
Tunisia DEA, SFA Chaffai/Ouertani (2002)
Italy DEA Cummins et al. (1996)
US SFA Cummins/Weiss (1993)
France DEA, SFA Fecher et al. (1993)
US DFA Gardner/Grace (1993)
Taiwan DFA Hao (2007)
Taiwan DFA, SFA Hao/Chou (2005)
UK SFA Hardwick (1997)
China SFA Huang (2007)
Germany DEA Kessner/Polborn (1999)
China DEA Leverty et al. (2004)
Germany DEA Luhnen (2008)
Malaysia DEA Mansor/Radam (2000)
Greece DEA Noulas et al. (2001)
China DEA Qiu/Chen (2006)
India DEA Tone/Sahoo (2005)
US SFA Weiss (1991a)
Australia DEA Worthington/Hurley (2002)
China DEA Yao et al. (2007)
Intercountry comparisons France, Belgium DEA, SFA Delhausse et al. (1995)
6 European countries DEA Diacon (2001)
15 European countries DEA Diacon et al. (2002)
15 OECD countries DEA Donni/Fecher (1997)
36 countries DEA, SFA Eling/Luhnen (2008)
Germany, UK DEA Kessner (2001a)
Austria, Germany DEA Mahlberg (1999)
11 OECD countries DFA, SFA Rai (1996)
18 European countries SFA Vencappa et al. (2008)
14 European countries SFA Zanghieri (2008)
Market structure US SFA Choi/Weiss (2005)
US SFA Choi/Weiss (2008)
14 European countries SFA Fenn et al. (2008)
Mergers US DEA Cummins et al. (1999a)
US DEA Cummins/Xie (2008)
7 European countries DEA Davutyan/Klumpes (2008)
US DFA Kim/Grace (1995)
7 European countries DEA Klumpes (2007)
DEA: data envelopment analysis; DFA: distribution-free approach; FDH: free disposal hull; SFA: stochastic
frontier approach; TFA: thick frontier approach
Table 1: Studies on efficiency in the insurance industry

30
Application Country Method Author (Date)
Methodology issues, compar-
ing different techniques or
assumptions
US DEA Brockett et al. (2004b)
US DEA, DFA,
FDH, SFA
Cummins/Zi (1998)
Spain SFA Fuentes et al. (2001)
Japan DEA Fukuyama/Weber (2001)
Taiwan DEA Hwang/Kao (2008a)
Taiwan DEA Hwang/Kao (2008b)
US DEA Leverty/Grace (2008)
Canada DEA Wu et al. (2007)
Canada DEA Yang (2006)
Organizational form, corpo-
rate governance issues
US DEA Brockett et al. (2005)
Spain DEA Cummins et al. (2004)
US DEA Cummins et al. (1999b)
Germany DEA Diboky/Ubl (2007)
Belgium FDH Donni/Hamende (1993)
US DEA Erhemjamts/Leverty (2007)
Japan DEA Fukuyama (1997)
US SFA Greene/Segal (2004)
UK DEA Hardwick et al. (2004)
Japan DEA Jeng/Lai (2005)
US DEA Jeng et al. (2007)
Germany DEA Wende et al. (2008)
US DEA Xie (2008)
Regulation change Ukraine DEA Badunenko et al. (2006)
Korea, Philippines,
Taiwan, Thailand
DEA Boonyasai et al. (2002)
Spain DEA Cummins/Rubio-Misas (2006)
Austria SFA Ennsfellner et al. (2004)
Germany, UK DEA, DFA Hussels/Ward (2006)
Germany DEA Mahlberg (2000)
Germany DEA Mahlberg/Url (2000)
Austria DEA Mahlberg/Url (2003)
Germany, UK DEA Rees et al. (1999)
US DFA Ryan/Schellhorn (2000)
Germany SFA Trigo Gamarra (2008)
Italy DEA Turchetti/Daraio (2004)
US SFA Yuan/Phillips (2008)
Scale and scope economies US TFA, SFA Berger et al. (2000)
US DEA Cummins et al. (2007)
France SFA Fecher et al. (1991)
Spain SFA Fuentes et al. (2005)
Japan SFA Hirao/Inoue (2004)
Ireland DFA Hwang/Gao (2005)
Germany DEA Kessner (2001b)
US DFA Meador et al. (2000)
Finland SFA Toivanen (1997)
US SFA, TFA Yuengert (1993)
DEA: data envelopment analysis; DFA: distribution-free approach; FDH: free disposal hull; SFA: stochastic
frontier approach; TFA: thick frontier approach
Table 1: Studies on efficiency in the insurance industry (continued)

31
Application Findings
Distribution systems § In most studies independent agent distribution systems are more efficient than direct systems (Brockett et al., 1998, 2004; Klumpes, 2004)
§ Insurers with one distribution system are more efficient than those employing more than one (Ward, 2002)
Financial and risk management, capital utilization
§ Risk management and financial intermediation increase efficiency (Cummins et al., 2006)
§ Solvency scores have limited impact on efficiency (Brockett et al., 2004) General level of efficiency and evolution over time
§ Significant levels of inefficiency with corresponding room for improvement, e.g., for Nigeria, Tunisia, Malaysia
Intercountry comparisons § Striking international differences in average efficiency, e.g., Nigeria (see Barros/Obijiaku, 2007), Tunisia (see Chaffai/Ouertani, 2002), Malaysia (see Mansor/Radam, 2000), or Australia (see Worthington/ Hurley, 2002)
§ Efficiency in developed countries is on average higher than that in emerging markets and technical progress has increased productivity and efficiency around the world (Eling/Luhnen, 2008)
Market structure § More efficient firms charge lower prices than their competitors (Choi/Weiss, 2005)
§ Larger firms with high market shares tend to be less cost efficient (Fenn et al., 2008)
Mergers § Mergers are beneficial for the efficiency of acquiring and target firm (Cum-mins/Tennyson/Weiss (1999), Cummins/Xie, (2008)
§ Mergers and acquisitions, facilitated by the liberalized EU market, have led to efficiency gains (Fenn et al., 2008)
Methodology issues, comparing different techniques or assump-tions
§ Average efficiencies can differ significantly across methods (Cummins/Zi, 1998)
§ The value-added and intermediation approaches to efficiency measurement are not consistent (Leverty/Grace, 2008)
Organizational form, corporate governance issues
§ Most authors find that stock companies are more efficient than mutuals (Cummins/Weiss/Zi, 1999)
§ Efficiency improvements after demutualization were identified (Jeng/Lai/McNamara, 2007)
Regulation change § Modest efficiency improvements from deregulation in Europe (Rees et al., 1999, Hussels/Ward, 2006)
§ Efficiency gains in Asia due to deregulation (Boonyasai/Grace/Skipper, 2002) § No efficiency change with risk-based capital requirements implementation in
the US (Ryan/Schellhorn, 2000) Scale and scope economies § Increasing returns to scale for US firms with up to US$1 billion in assets
(Cummins/Zi, 1998) § Mostly evidence for economies of scope, more recently mixed evidence
(Cummins/Weiss/Zi, 2007)
Table 2: Main findings from the 95 studies

32
Authors Countries No. insu-rers
Sample period
Lines of business
Me-thod
Input type Output type Output approach
Main types of efficiencies analyzed
Application cate-gory
Selected findings
Badunenko et al. (2006)
Ukraine 163 2003-2005
Life, non-life DEA Fixed assets, current assets, liabilities, equity
Premiums Value added
Technical, scale
Regulation change Increased capitalization requirements have positively influenced Ukrainian insurance market and helped improve both technical and scale efficiency
Barros et al. (2005) Portugal 27 1995-2001
Life, non-life DEA Wages, capital, total investment income, premiums issued
Claims paid, profits Value added
Technical, pure tech-nical, scale
General level of efficiency and evolu-tion over time
Improvement of technical efficiency over time, but deterioration in terms of tech-nological change
Barros and Obijiaku (2007)
Nigeria 10 2001-2005
Life, non-life DEA Capital, operative costs, number of employees, total investments
Profits, net premiums, settled claims, outstanding claims, investment income
Value added
Technical, pure tech-nical, scale
General level of efficiency and evolu-tion over time
Most companies are VRS efficient
Berger et al. (2000) US 684 1988-1992
Life, property-liability
TFA, SFA
Labor, business services, re-serves, financial equity capital
Invested assets, present value of real losses incurred (P/L), incurred benefits (Life)
Value added
Cost, reve-nue, profit
Scale and scope economies
Conglomeration hypothesis holds for some types while strategic focus hypo-thesis dominates for others
Berger et al. (1997) US 472 1981-1990
Property-liability
DFA Labor, business services, debt capital, equity capital
Total real invested assets, present value of losses in-curred
Value added
Cost, profit Distribution systems Independent agents less cost efficient but equally profit efficient as direct writers
Bernstein (1999) Canada 12 1979-1989
Life Cost func-tion
Labor, buildings capital, machinery capital, materials
Number of policies Physical n/a General level of efficiency and evolu-tion over time
Average annual productivity growth of 1% for period 1979-1989
Bikker and van Leuvensteijn (2008)
Nether-lands
84-105
1995-2003
Life SFA Acquisition cost, other cost (man-agement cost, salaries, deprecia-tion on capital equipment, etc.)
Premium income, number of outstanding policies, sum total of insured capital, sum total of insured annuities, unit-linked fund policies
Physical Cost General level of efficiency and evolu-tion over time
Cost inefficiency of 28% on average
Boonyasai et al. (2002)
Korea, Philippines, Taiwan, Thailand
49-110
1978-1997
Life DEA Labor, capital, materials Premium income, net invest-ment income
Value added
Technical, pure tech-nical, scale
Regulation change Increasing productivity in Korea and Philippines due to deregulation and liberalization; little effect of liberalization on productivity in Taiwan and Thailand
Brockett et al. (1998) US 1524 1989 Property-liability
DEA Surplus previous year, change in capital and surplus, underwriting and investment expense, policy-holder-supplied debt capital
ROI, liquid assets to liability, solvency scores
Financial interme-diary
n/a Distribution systems Stock companies more efficient than mutuals; agency more efficient marketing system than direct
Brockett et al. (2004a) US 1524 1989 Property-liability
DEA Surplus previous year, change in capital and surplus, underwriting and investment expense, policy-holder-supplied debt capital
ROI, liquid assets to liability, solvency scores
Financial interme-diary
n/a Financial and risk management, capital utilization
Solvency scores as output only with limited impact on efficiency scores
Brockett et al. (2004b) US 538 1995 Health DEA Premiums (consumer perspective), expenses (societal perspective)
Number of outpatient visits, number of hospital days, total member months
Physical Technical Methodology issues, comparing different techniques or as-sumptions
New game-theoretic DEA model is applied; Independent Practice Organiza-tions (IPAs) are more efficient than the Group/Staff HMOs from both, the con-sumer and the societal perspective
Brockett et al. (2005) US 1524 1989 Property-liability
DEA Surplus previous year, change in capital and surplus, underwriting and investment expense, policy-holder-supplied debt capital
ROI, liquid assets to liability, solvency scores
Financial interme-diary
n/a Organizational form, corporate gover-nance issues
Stock firms with higher inefficiency in the input dimension while mutuals with higher shortfalls in all areas of output; direct systems with more inefficiencies than agency
Carr et al. (1999) US 66 n/a Life DEA Labor (admin., agents), business services, financial capital
Incurred benefits, additions to reserves
Value added
Cost, revenue Distribution systems Exclusive dealing insurers less efficient than nonexclusive dealing or direct writers; nonexclusive dealing insurers should focus on fewer product lines; firms adopting one of Porter’s 3 generic strate-gies are more efficient than rivals
Chaffai and Ouertani (2002)
Tunisia 13 1990-2000
Life, non-life DEA, SFA
Labor, physical capital, financial capital
Total premiums earned Value added
Technical General level of efficiency and evolu-tion over time
Significant potential for increase of efficiency
Table A1: Overview of studies on efficiency in the insurance industry
Appendix A: Overview of 95 Studies on efficiency measurement in the insurance industry
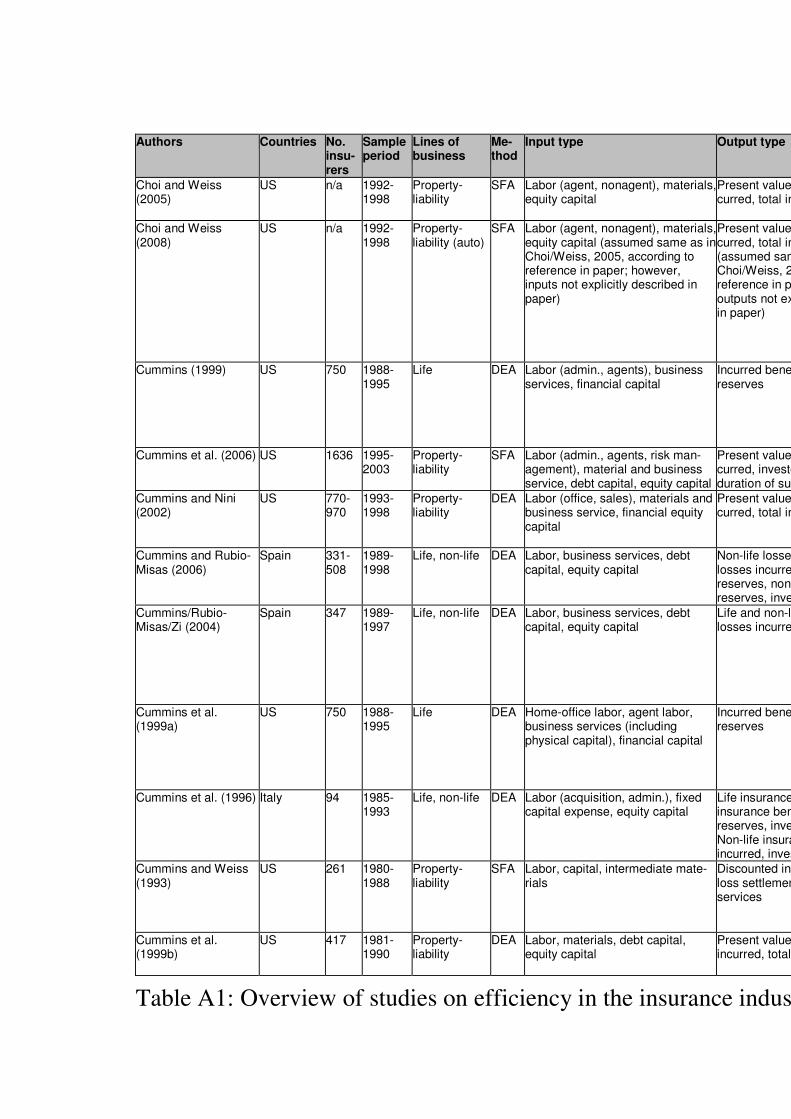
33
Authors Countries No. insu-rers
Sample period
Lines of business
Me-thod
Input type Output type Output approach
Main types of efficiencies analyzed
Application cate-gory
Selected findings
Choi and Weiss (2005)
US n/a 1992-1998
Property-liability
SFA Labor (agent, nonagent), materials, equity capital
Present value of losses in-curred, total invested assets
Value added
Cost, revenue Market structure Cost-efficient firms charge lower prices and earn higher profits; prices and profits higher in revenue-efficient firms
Choi and Weiss (2008)
US n/a 1992- 1998
Property- liability (auto)
SFA Labor (agent, nonagent), materials, equity capital (assumed same as in Choi/Weiss, 2005, according to reference in paper; however, inputs not explicitly described in paper)
Present value of losses in-curred, total invested assets (assumed same as in Choi/Weiss, 2005, according to reference in paper; however, outputs not explicitly described in paper)
Value added
Cost, revenue Market structure Insurers in competitive and non-strin-gently regulated states may benefit from market power by charging higher unit prices; insurers in these states are on average more cost efficient and cost efficient insurers charge lower prices and earn smaller profits; insurers in some rate regulated states are less revenue and cost-scale efficient than in competitive states.
Cummins (1999) US 750 1988-1995
Life DEA Labor (admin., agents), business services, financial capital
Incurred benefits, additions to reserves
Value added
Pure tech-nical, scale, allocative, cost, revenue
General level of efficiency and evolu-tion over time
Efficiency scores in insurance relatively low compared to other financial services industries; also widely dispersed; small insurers operate with IRS; big insurers with DRS; brokerage system most effi-cient
Cummins et al. (2006) US 1636 1995-2003
Property-liability
SFA Labor (admin., agents, risk man-agement), material and business service, debt capital, equity capital
Present value of losses in-curred, invested assets, dollar duration of surplus
Value added
Cost Financial and risk management, capital utilization
Risk management and financial inter-mediation increase efficiency
Cummins and Nini (2002)
US 770-970
1993-1998
Property-liability
DEA Labor (office, sales), materials and business service, financial equity capital
Present value of losses in-curred, total invested assets
Value added
Technical, allocative, cost, revenue
Financial and risk management, capital utilization
On weighted industry average, firms could reduce labor by 62%, materials by 36%, and capital by 46%; capital is used suboptimally
Cummins and Rubio-Misas (2006)
Spain 331-508
1989-1998
Life, non-life DEA Labor, business services, debt capital, equity capital
Non-life losses incurred, life losses incurred, reinsurance reserves, non-reinsurance reserves, invested assets
Value added
Cost, pure technical, allocative, scale
Regulation change Consolidation leads to growth in TFP and increases number of firms operating with decreasing returns to scale
Cummins/Rubio-Misas/Zi (2004)
Spain 347 1989-1997
Life, non-life DEA Labor, business services, debt capital, equity capital
Life and non-life insurance losses incurred
Value added
Technical, allocative, cost, revenue
Organizational form, corporate gover-nance issues
In cost and revenue efficiency, stocks of all sizes dominate mutuals in the produc-tion of stock output vectors, and smaller mutuals dominate stocks in the produc-tion of mutual output vectors; larger mutuals are neither dominated by nor dominant over stocks
Cummins et al. (1999a)
US 750 1988-1995
Life DEA Home-office labor, agent labor, business services (including physical capital), financial capital
Incurred benefits, additions to reserves
Value added
Cost, tech-nical, alloca-tive, pure technical, scale, reve-nue
Mergers M&A beneficial for efficiency; target life insurers achieve greater efficiency gains than firms that have not been involved in M&As
Cummins et al. (1996) Italy 94 1985-1993
Life, non-life DEA Labor (acquisition, admin.), fixed capital expense, equity capital
Life insurance: sum of life insurance benefits, changes in reserves, invested assets Non-life insurance: Losses incurred, invested assets
Value added
Technical General level of efficiency and evolu-tion over time
Stable efficiency over time (70%–78% for the industry) with sharp decline (25% cumulative) in productivity due to tech-nological regress
Cummins and Weiss (1993)
US 261 1980-1988
Property-liability
SFA Labor, capital, intermediate mate-rials
Discounted incurred losses, loss settlement, intermediary services
Value added
Cost, alloca-tive, technical
General level of efficiency and evolu-tion over time
Large insurers at 90% relative to their cost frontier; medium and small insurers at 80% and 88%, respectively; scale economies with small and medium-sized insurers
Cummins et al. (1999b)
US 417 1981-1990
Property-liability
DEA Labor, materials, debt capital, equity capital
Present value of real losses incurred, total invested assets
Value added
Technical, cost
Organizational form, corporate gover-nance issues
Stock cost frontier dominates mutual cost frontier
Table A1: Overview of studies on efficiency in the insurance industry (continued)
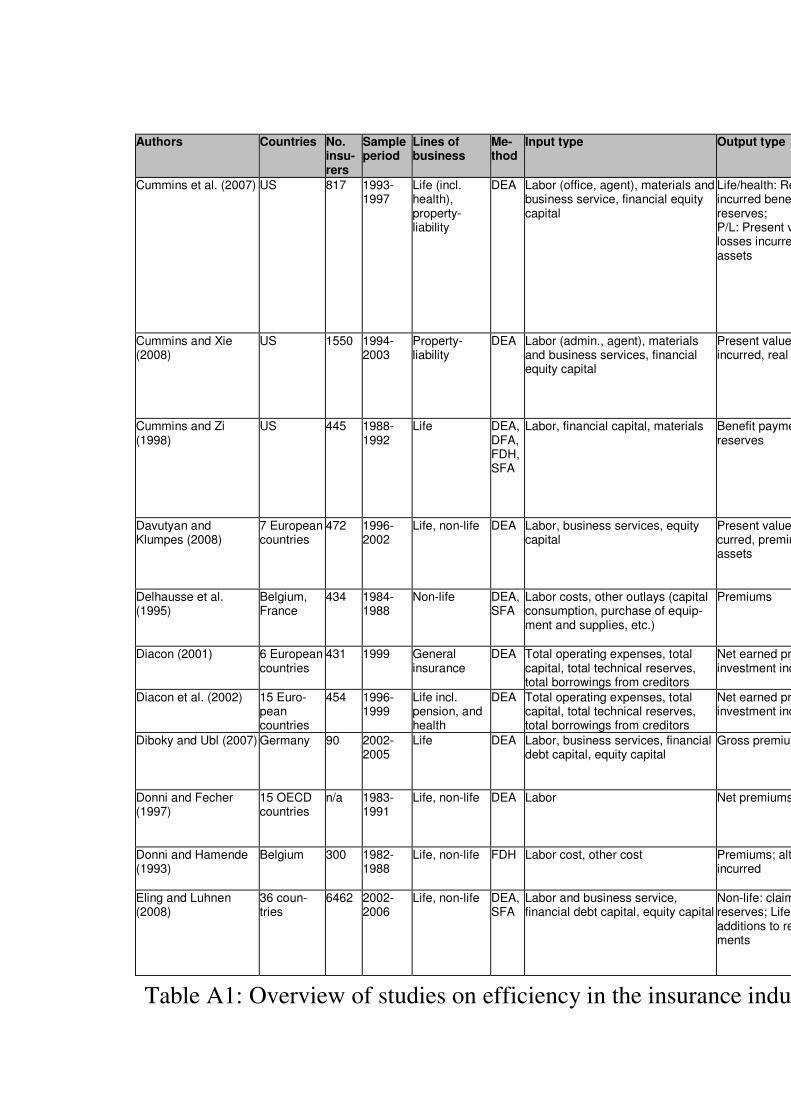
34
Authors Countries No. insu-rers
Sample period
Lines of business
Me-thod
Input type Output type Output approach
Main types of efficiencies analyzed
Application cate-gory
Selected findings
Cummins et al. (2007) US 817 1993-1997
Life (incl. health), property-liability
DEA Labor (office, agent), materials and business service, financial equity capital
Life/health: Real value of incurred benefits, additions to reserves; P/L: Present value of real losses incurred, real invested assets
Value added
Technical, cost, revenue
Scale and scope economies
Weak evidence for existence of econo-mies of scope; although diversified firms dominate specialists in the production of diversified firm output vectors in terms of revenue efficiency for both life-health and property-liability insurance, specialist firms dominate diversified firms for the production of specialist output vectors in revenue efficiency and also dominate diversified firms in cost efficiency for property-liability output vectors
Cummins and Xie (2008)
US 1550 1994-2003
Property-liability
DEA Labor (admin., agent), materials and business services, financial equity capital
Present value of losses incurred, real invested assets
Value added
Cost, tech-nical, alloca-tive, pure technical, scale, reve-nue
Mergers M&As in property-liability insurance are value enhancing; acquiring firms achieved more revenue efficiency gains than nonacquiring firms, and target firms experienced greater cost and allocative efficiency growth than nontargets
Cummins and Zi (1998)
US 445 1988-1992
Life DEA, DFA, FDH, SFA
Labor, financial capital, materials Benefit payments, additions to reserves
Value added
Cost, tech-nical, alloca-tive
Methodology issues, comparing different techniques or as-sumptions
Choice of estimation method can have a significant effect on the conclusions of an efficiency study; efficiency rankings are well preserved among the econometric methods; but the rankings are less consistent between the econometric and mathematical programming methods
Davutyan and Klumpes (2008)
7 European countries
472 1996-2002
Life, non-life DEA Labor, business services, equity capital
Present value of losses in-curred, premiums, invested assets
Value added
Technical, pure tech-nical, scale
Mergers In life insurance, after mergers, business inputs replace labor for both targets and acquirers, but these effects do not apply to non-life targets; mergers do not signifi-cantly impact acquirer behavior
Delhausse et al. (1995)
Belgium, France
434 1984-1988
Non-life DEA, SFA
Labor costs, other outlays (capital consumption, purchase of equip-ment and supplies, etc.)
Premiums Value added
Technical, scale
Intercountry comparisons
French companies on average more efficient than Belgian ones; overall low efficiency levels; high correlation between results of both approaches
Diacon (2001) 6 European countries
431 1999 General insurance
DEA Total operating expenses, total capital, total technical reserves, total borrowings from creditors
Net earned premiums, total investment income
Value added
Technical Intercountry comparisons
Average efficiencies: UK (77%), France (67%), Germany (70%), Italy (56%), Netherlands (69%), Switzerland (66%)
Diacon et al. (2002) 15 Euro-pean countries
454 1996-1999
Life incl. pension, and health
DEA Total operating expenses, total capital, total technical reserves, total borrowings from creditors
Net earned premiums, total investment income
Value added
Pure tech-nical, scale, mix
Intercountry comparisons
Striking international differences and decreasing levels of average technical efficiency over sample period
Diboky and Ubl (2007) Germany 90 2002-2005
Life DEA Labor, business services, financial debt capital, equity capital
Gross premium, net income Value added
Technical, cost and allocative efficiency
Organizational form, corporate gover-nance issues
Stock ownership is superior to mutual and public structure
Donni and Fecher (1997)
15 OECD countries
n/a 1983-1991
Life, non-life DEA Labor Net premiums Value added
Technical Intercountry comparisons
Average efficiency levels rather high and dispersed; growth in productivity ob-served in all countries and due to im-provements in technical progress
Donni and Hamende (1993)
Belgium 300 1982-1988
Life, non-life FDH Labor cost, other cost Premiums; alternatively, losses incurred
Value added
Technical Organizational form, corporate gover-nance issues
Superior efficiency of nonprofit insurance companies
Eling and Luhnen (2008)
36 coun-tries
6462 2002-2006
Life, non-life DEA, SFA
Labor and business service, financial debt capital, equity capital
Non-life: claims + additions to reserves; Life: benefits + additions to reserves; Invest-ments
Value added
Technical, cost
Intercountry comparisons
Technical and cost efficiency growth in international insurance markets from 2002 to 2006, with large differences across countries; Denmark and Japan have the highest average efficiency, the Philippines is the least efficient
Table A1: Overview of studies on efficiency in the insurance industry (continued)

35
Authors Countries No. insu-rers
Sample period
Lines of business
Me-thod
Input type Output type Output approach
Main types of efficiencies analyzed
Application cate-gory
Selected findings
Ennsfellner et al. (2004)
Austria 97-105
1994-1999
Life/ health, non-life
SFA Net operating expenses, equity capital, technical provisions
Health/life: Incurred benefits, changes in reserves, total invested assets Non-life: Losses incurred, total invested assets
Value added
Technical Regulation change Deregulation had positive effects on production efficiency
Erhemjamts and Leverty (2007)
US 1070 1995-2004
Life DEA Labor, business services, equity capital, policyholder-supplied debt capital
Incurred benefits, additions to reserves
Value added
Technical Organizational form, corporate gover-nance issues
Stock production technology dominates mutual technology; mutuals that are further away from mutual efficient frontier more likely to demutualization; access to capital important reason for demutualiza-tion
Fecher et al. (1993) France 327 1984-1989
Life, non-life DEA, SFA
Labor cost, other outlays Gross premiums Value added
Technical General level of efficiency and evolu-tion over time
High correlation between parametric and nonparametric results; wide dispersion in the rates of inefficiency across companies
Fecher et al. (1991) France 327 1984-1989
Life, non-life SFA Labor cost, other outlays Gross premiums Value added
Cost Scale and scope economies
Increasing returns to scale
Fenn et al. (2008) 14 Euro-pean countries
n/a 1995-2001
Life, non-life, composite
SFA Capital, technical provisions, labor, debt capital
Net incurred claims (= gross claims paid – claims received from reinsurers + increase in loss reserves + bonuses and rebates)
Value added
Cost Market structure Most European insurers operating under IRS; size and domestic market share lead to higher levels of cost inefficiency
Fuentes et al. (2001) Spain 55-70 1987-1994
Health, life, non-life
SFA Labor costs, composite input Annual premiums Value added
Technical Methodology issues, comparing different techniques or as-sumptions
Malmquist index of productivity growth can also be estimated on basis of para-metric frontier approach
Fuentes et al. (2005) Spain n/a 1987-1997
Health, life, property-liability
SFA Labor costs, composite input Annual premiums Value added
Technical Scale and scope economies
Overall low productivity growth over time (less than 2% per year), multi-branch companies perform better than special-ized firms
Fukuyama (1997) Japan 25 1988-1993
Life DEA Labor (office, sales), capital Insurance reserves, loans Financial interme-diary
Technical, pure tech-nical, alloca-tive, scale
Organizational form, corporate gover-nance issues
Mutual and stock companies possess identical technologies; productive effi-ciency and productivity performances differ across 2 ownership types and different economic conditions
Fukuyama and Weber (2001)
Japan 17 1983-1994
Non-life DEA Labor (office, sales), capital Reserves, loans, investments Financial interme-diary
Technical Methodology issues, comparing different techniques or as-sumptions
Productivity and technological progress over time in Japan
Gardner and Grace (1993)
US 561 1985-1990
Life DFA Labor, physical capital, misc. items Premiums, securities invest-ments
Value added
Cost General level of efficiency and evolu-tion over time
Persistent inefficiency
Grace and Timme (1992)
US 423 1987 Life Cost func-tion
Labor, capital, misc. expenses Premiums, annuities, invest-ments
Value added
n/a Scale and scope economies
Most firms have significant economies of scale; largest agency companies with approximately constant returns to scale; lack of cost complementaries in the multiproduct insurance firms
Greene and Segal (2004)
US 136 1995-1998
Life SFA Labor, capital, materials Premiums, investments Value added
Cost Organizational form, corporate gover-nance issues
Inefficiency negatively associated with profitability; stock companies as efficient and profitable as mutual companies
Hao (2007) Taiwan 26 1981-2003
Life DFA Labor, physical capital, claims Premiums, investments Value added
Cost General level of efficiency and evolu-tion over time
Firms with large market share tend to be cost efficient
Hao and Chou (2005) Taiwan 26 1977-1999
Life DFA, SFA
Labor, physical capital, claims Premiums, investments Value added
Cost General level of efficiency and evolu-tion over time
Firms with larger market share are more profitable; product diversification does not improve efficiency
Table A1: Overview of studies on efficiency in the insurance industry (continued)

36
Authors Countries No. insu-rers
Sample period
Lines of business
Me-thod
Input type Output type Output approach
Main types of efficiencies analyzed
Application cate-gory
Selected findings
Hardwick (1997) UK 54 1989-1993
Life incl. pension, and health
SFA Labor, capital Premiums Value added
Economic, scale, total inefficiency
General level of efficiency and evolu-tion over time
High level of inefficiency; increasing returns to scale
Hardwick et al. (2004) UK 50 1994-2001
Life DEA Labor, capital Incurred benefits, additions to reserves
Value added
Cost, tech-nical, alloca-tive
Organizational form, corporate gover-nance issues
Cost efficiency positively related to size of corporate board of directors
Hirao and Inoue (2004)
Japan 33 1980-1995
Property-liability
SFA Labor, agencies, materials Real incurred losses (net claims paid and changes in loss reserves)
Value added
Cost Scale and scope economies
Statistically significant economies of scale and scope
Huang (2007) China n/a 1999-2004
Life, property-liability
SFA Labor, capital, business services Premiums earned, incurred benefits and additions to reserves, total invested assets
Value added
Cost, profit General level of efficiency and evolu-tion over time
Non-state-owned companies and foreign companies are superior in terms of cost efficiency to the property insurance industry, state-owned companies, and domestic companies
Hussels and Ward (2006)
Germany and UK
47 (UK) 31 (GE)
1991-2002
Life DEA, DFA
Labor, capital Net written premiums, addi-tions to reserves
Value added
Cost, tech-nical, alloca-tive, scale
Regulation change Comparability of results from DEA and DFA; UK efficiency frontier less efficient than German frontier; no clear evidence for link between deregulation and effi-ciency levels
Hwang and Gao (2005)
Ireland 11 1991-2000
Life DFA Labor (admin., agent), financial capital
Insurance benefits, investable funds
Value added
Cost Scale and scope economies
Increasing returns to scale; magnitude of cost economies varies with firm size
Hwang and Kao (2008a)
Taiwan 17 1999-2002
Non-life DEA Business and administrative expenses, commissions and acquisition expenses
1st stage: Direct written premiums, reinsurance pre-miums 2nd stage: underwriting income, investment income
2-stage production process
n/a Methodology issues, comparing different techniques or as-sumptions
Two-stage DEA reveals significance of operating performance effectively; each company can realize its strengths and weaknesses in different production stages
Hwang and Kao (2008b)
Taiwan 24 2001-2002
Non-life DEA Operation expenses, insurance expenses
1st stage: direct written premi-ums, reinsurance premiums; 2nd stage: underwriting income, investment income
2-stage production process
n/a Methodology issues, comparing different techniques or as-sumptions
New relational model is more reliable in measuring efficiencies than independent models
Jeng and Lai (2005) Japan 19 1985-1994
Non-life DEA VA: Labor, business services, capital (debt + equity) FI: Surplus previous year/assets, change in surplus/assets, under-writing + investment ex-penses/assets, policyholder debt capital/assets
VA: Number of policies, total invested assets FI: ROA, 3 principal compo-nents of financial conditions
Value added/ financial intermedi-ation
Technical, cost
Organizational form, corporate gover-nance issues
Keiretsu firms more cost efficient than NSIFs; otherwise not possible to reject null hypothesis that all equally efficient; deteriorating efficiency for all company types; FI and VA approaches with differ-ent, but complementary, results
Jeng et al. (2007) US 11 1980-1995
Life DEA VA: Labor, business services, capital (debt + equity) FI: Surplus previous year/assets, change in surplus/assets, under-writing + investment ex-penses/assets, policyholder debt capital/assets
VA: Number of policies, total invested assets FI: ROA, 3 principal compo-nents of financial conditions
Value added/ financial intermedi-ation
Cost, tech-nical, alloca-tive
Organizational form, corporate gover-nance issues
For both approaches, no efficiency improvement after demutualization; exception: improvement for mutual control insurers under FI approach
Kessner (2001a) Germany and UK
87 (UK) 78 (GE)
1994-1999
Life DEA New business cost, administration cost, cost for capital management, reinsurance contributions
Gross and net written pre-miums, interest on capital
Value added
Technical Intercountry comparisons
British insurers more efficient than Ger-man insurers; increasing efficiency in both markets
Kessner (2001b) Germany 75 1989-1994
Life DEA New business cost, administration cost, cost for capital management, reinsurance contributions
Sum insured (new and existing business), net returns on capital investments
Value added
Technical, scale
Scale and scope economies
Small companies with increasing returns to scale; big companies with decreasing returns to scale
Kessner and Polborn (1999)
Germany 110 1990-1993
Life DEA New business cost, administration cost
Sum insured of new and in-force business
Value added
Technical General level of efficiency and evolu-tion over time
High level of inefficiency
Table A1: Overview of studies on efficiency in the insurance industry (continued)
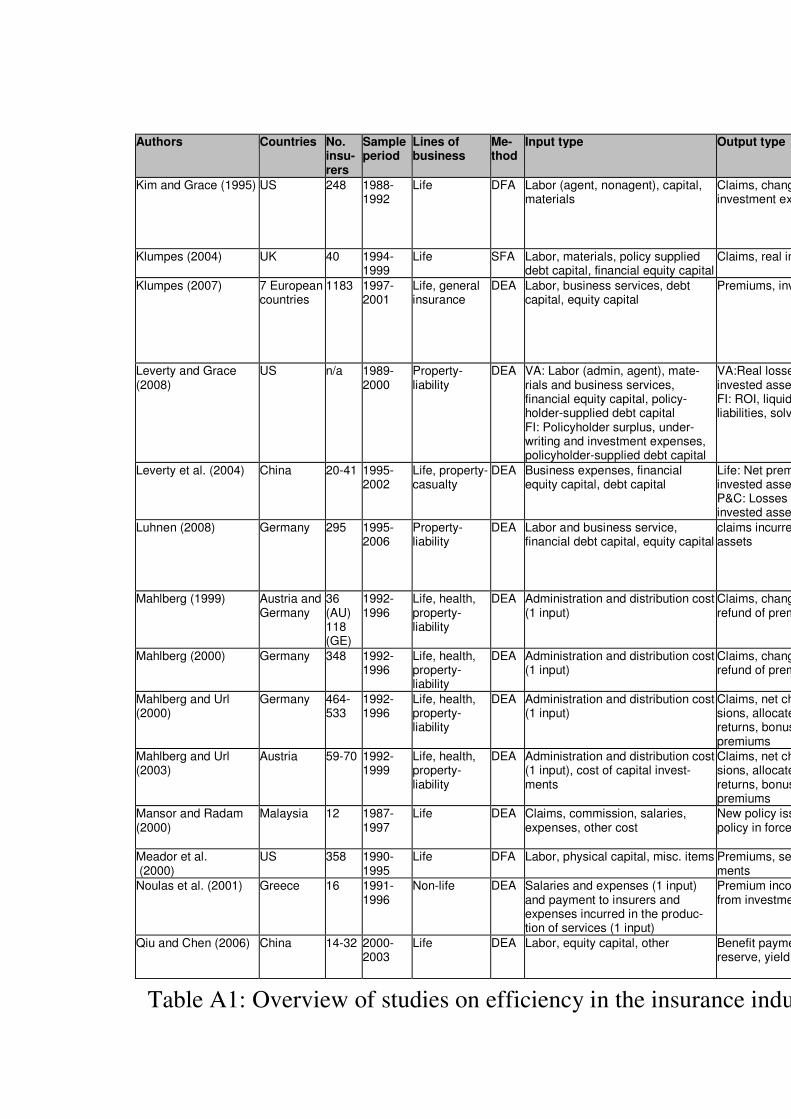
37
Authors Countries No. insu-rers
Sample period
Lines of business
Me-thod
Input type Output type Output approach
Main types of efficiencies analyzed
Application cate-gory
Selected findings
Kim and Grace (1995) US 248 1988-1992
Life DFA Labor (agent, nonagent), capital, materials
Claims, changes in reserves, investment expenses
Value added
Cost Mergers Smaller firms with larger cost savings from mergers than large firms; no cost savings in mergers of mutuals; mergers of efficient with less efficient companies increase combined firm efficiency
Klumpes (2004) UK 40 1994-1999
Life SFA Labor, materials, policy supplied debt capital, financial equity capital
Claims, real invested assets Value added
Cost, profit Distribution systems IFA-based firms less cost and profit efficient than AR/CR firms
Klumpes (2007) 7 European countries
1183 1997-2001
Life, general insurance
DEA Labor, business services, debt capital, equity capital
Premiums, investment income Value added
Cost, tech-nical, alloca-tive, pure technical, scale, reve-nue
Mergers Acquiring firms achieve greater efficiency gains than either target firms or firms not involved in mergers; no beneficial effect of mergers on target firms; M&A driven mostly by solvency objectives
Leverty and Grace (2008)
US n/a 1989-2000
Property-liability
DEA VA: Labor (admin, agent), mate-rials and business services, financial equity capital, policy-holder-supplied debt capital FI: Policyholder surplus, under-writing and investment expenses, policyholder-supplied debt capital
VA:Real losses incurred, real invested assets FI: ROI, liquid assets to liabilities, solvency score
Value added, financial intermedi-ation
Pure tech-nical, scale, technical, allocative, cost, revenue
Methodology issues, comparing different techniques or as-sumptions
Value-added and financial intermediation approach are not consistent; value-added approach closely related to traditional measures of firm performance; financial intermediation approach generally not
Leverty et al. (2004) China 20-41 1995-2002
Life, property-casualty
DEA Business expenses, financial equity capital, debt capital
Life: Net premiums written, real invested assets P&C: Losses incurred, real invested assets
Value added
Technical, scale, pure technical
General level of efficiency and evolu-tion over time
Productivity growth; in P&C due to presence of technically efficient foreign firms
Luhnen (2008) Germany 295 1995-2006
Property-liability
DEA Labor and business service, financial debt capital, equity capital
claims incurred; total invested assets
Value added
technical, cost, alloca-tive, scale
General level of efficiency and evolu-tion over time
potential for the market to improve by about 20% in terms of technical efficiency and about 50% in terms of cost efficiency moderate total factor productivity growth; low efficiency growth
Mahlberg (1999) Austria and Germany
36 (AU) 118 (GE)
1992-1996
Life, health, property-liability
DEA Administration and distribution cost (1 input)
Claims, change in reserves, refund of premium
Value added
Technical Intercountry comparisons
Inefficiencies in both markets; Austrian insurers more efficient than German insurers
Mahlberg (2000) Germany 348 1992-1996
Life, health, property-liability
DEA Administration and distribution cost (1 input)
Claims, change in reserves, refund of premium
Value added
Technical Regulation change Decreasing efficiency; increasing produc-tivity
Mahlberg and Url (2000)
Germany 464-533
1992-1996
Life, health, property-liability
DEA Administration and distribution cost (1 input)
Claims, net change in provi-sions, allocated investment returns, bonuses and returned premiums
Value added
Technical Regulation change Still cost-saving potential; increasing divergence between fully efficient firms and efficiency laggards; low cost-savings potential from further mergers
Mahlberg and Url (2003)
Austria 59-70 1992-1999
Life, health, property-liability
DEA Administration and distribution cost (1 input), cost of capital invest-ments
Claims, net change in provi-sions, allocated investment returns, bonuses and returned premiums
Value added
Technical Regulation change Still considerable inefficiency; increased productivity
Mansor and Radam (2000)
Malaysia 12 1987-1997
Life DEA Claims, commission, salaries, expenses, other cost
New policy issued, premium, policy in force
Value added
Technical General level of efficiency and evolu-tion over time
Productivity growth; but low compared to real growth of economy
Meador et al. (2000)
US 358 1990-1995
Life DFA Labor, physical capital, misc. items Premiums, securities invest-ments
Value added
Cost Scale and scope economies
Multi-product firms more efficient than focused firms
Noulas et al. (2001) Greece 16 1991-1996
Non-life DEA Salaries and expenses (1 input) and payment to insurers and expenses incurred in the produc-tion of services (1 input)
Premium income, revenue from investment activities
Value added
Technical General level of efficiency and evolu-tion over time
Industry highly inefficient, with notable differences between different companies
Qiu and Chen (2006) China 14-32 2000-2003
Life DEA Labor, equity capital, other Benefit payments, additions to reserve, yield of investment
Value added
Technical, pure tech-nical, scale
General level of efficiency and evolu-tion over time
Average technical efficiency declining over time; increasing returns to scale
Table A1: Overview of studies on efficiency in the insurance industry (continued)

38
Authors Countries No. insu-rers
Sample period
Lines of business
Me-thod
Input type Output type Output approach
Main types of efficiencies analyzed
Application cate-gory
Selected findings
Rai (1996) 11 OECD countries
106 1988-1992
Life incl.health, non-life
DFA, SFA
Labor, capital, benefits and claims Premiums (life and non-life) Value added
Cost Intercountry comparisons
Firms in Finland and France with lowest inefficiency; firms in UK with highest; small firms more cost efficient than large firms; specialized firms more cost efficient than combined firms
Rees et al. (1999) Germany and UK
n/a 1992-1994
Life DEA Distribution cost, administration cost
Total premium income and change in total premium income (UK), aggregate sum insured and change in aggre-gate sum insured (GE)
Value added
Technical Regulation change Looser regulation and increased competi-tion increase efficiency
Ryan and Schellhorn (2000)
US 321 1990-1995
Life DFA Labor, financial capital, materials Benefit payments, additions to reserves
Value added
Cost Regulation change Unchanged efficiency levels after RBC became effective
Toivanen (1997) Finland 21 1989-1991
Non-life SFA Labor Number of units produced Physical Cost Scale and scope economies
Diseconomies of scale at firm and economies of scale at branch level; economies of scope in production
Tone and Sahoo (2005)
India n/a 1982-2001
Life DEA Labor, business services, debt capital, equity capital
Present value of real losses incurred, ratio of liquid assets to liabilities
Value added
Technical, allocative, cost, scale
General level of efficiency and evolution over time
Increasing allocative inefficiencies after 1994; increase in cost efficiency in 2000
Trigo Gamarra (2008) Germany 1995-2002
Life SFA Acquisition and administration expenses, equity capital
Incurred benefits, additions to reserves, bonuses and rebates
Value added
Cost, profit Regulation change Positive total factor productivity growth, mainly driven by positive technological change; technical cost and profit effi-ciency stable on average, but significant positive scale efficiency change; market consolidation leads to efficiency gains for insurers
Trigo Gamarra and Growitsch (2008)
Germany 115 1997- 2005
Life DEA Acquisition and administration expenses, equity capital
Incurred benefits, additions to reserves, bonuses and rebates
Value added
Cost, profit, scale
Distribution systems Specialized single-channel insurers do not outperform multi-channel insurers in terms of cost or profit efficiency
Turchetti and Daraio (2004)
Italy 45 1982-2000
Motor DEA Acquisition production and organi-zation cost, overhead and admin-istrative expenses, fixed capital, financial equity capital, policy-holder debt capital
Incurred losses, invested assets
Value added
Technical, cost, alloca-tive, scale
Regulation change Cost efficiency and total factor produc-tivity increase, especially in the second half of the 1990s
Vencappa et al. (2008)
14 Euro-pean countries
n/a 1995-2001
Life, non-life SFA Labor and materials, financial capital, debt capital
Incurred claims Value added
Technical General level of efficiency and evolu-tion over time
Temporal variations in rate of overall productivity growth for life and non-life, driven by patterns of technological progress and regress, together with consistent positive contributions from scale efficiency; in most years, modest growth in technical efficiency
Ward (2002) UK 44 1990-1997
Life SFA Labor, capital Claims, additions to reserves Value added
Cost, reve-nue, profit
Distribution systems Cost benefits for firms focusing on one mode of distribution
Weiss (1986) US 2 1976-1980
Life Index Labor (supervisor, agent, other); materials; capital (home office, field)
Number of policies, constant dollar insurance in force, real premium
n/a n/a Methodology issues, comparing different techniques or as-sumptions
Theoretically sound method for measur-ing productivity in life insurance industry has been introduced
Weiss (1991a) US 100 1980-1984
Property-liability
SFA Labor (agent, supervisory, nonsu-pervisory), material, capital
Incurred losses, reserves Value added
Technical, allocative, scale
General level of efficiency and evolu-tion over time
Estimated inefficiency costs of 12–33% of premiums
Weiss (1991b) France, Germany, Japan, Switzer-land, US
n/a 1975-1987
Property-liability
Index Labor, capital Incurred losses, reserves Value added
n/a Intercountry comparisons
Japan with weakest productivity growth; US and Germany with overall high productivity
Table A1: Overview of studies on efficiency in the insurance industry (continued)
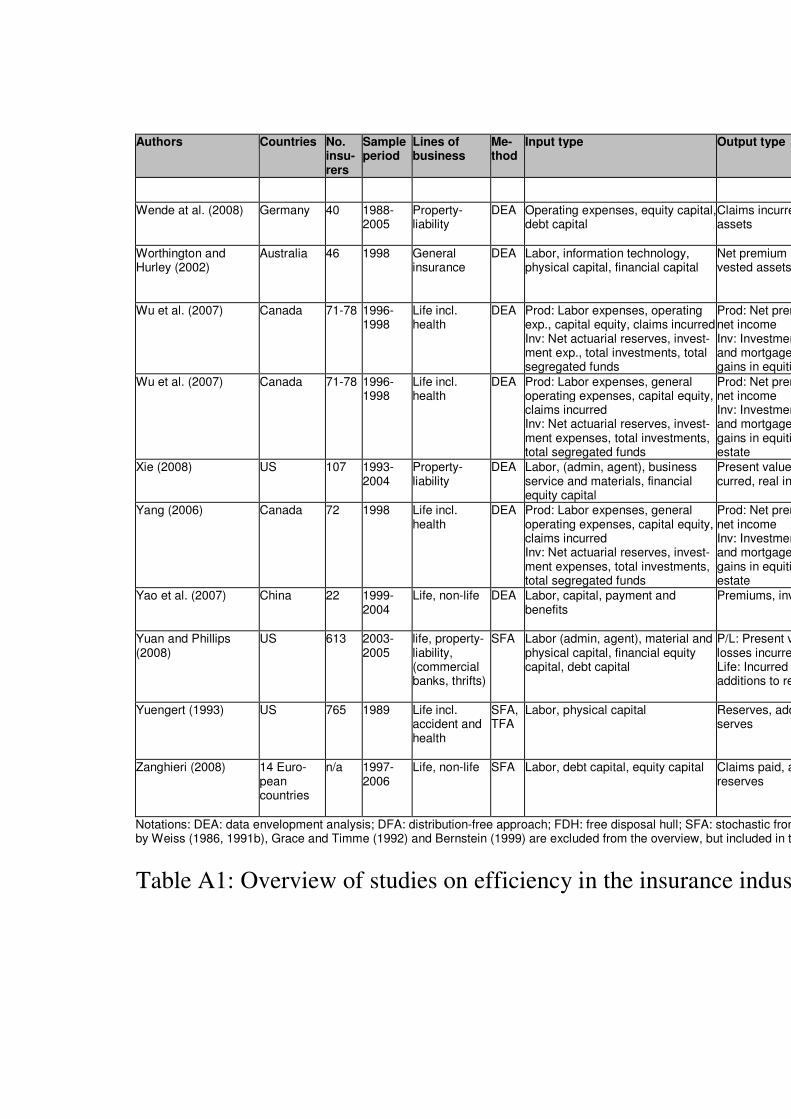
39
Authors Countries No. insu-rers
Sample period
Lines of business
Me-thod
Input type Output type Output approach
Main types of efficiencies analyzed
Application cate-gory
Selected findings
Wende at al. (2008) Germany 40 1988-2005
Property-liability
DEA Operating expenses, equity capital, debt capital
Claims incurred, total invested assets
Value added
Technical, allocative, cost
Organizational form, corporate gover-nance issues
Regulation influences comparative advantages of different organizational forms in terms of efficiency
Worthington and Hurley (2002)
Australia 46 1998 General insurance
DEA Labor, information technology, physical capital, financial capital
Net premium revenues, in-vested assets
Value added
Pure tech-nical, scale, allocative, cost
General level of efficiency and evolu-tion over time
Low average level of efficiency; mostly due to allocative inefficiency
Wu et al. (2007) Canada 71-78 1996-1998
Life incl. health
DEA Prod: Labor expenses, operating exp., capital equity, claims incurred Inv: Net actuarial reserves, invest-ment exp., total investments, total segregated funds
Prod: Net premiums written, net income Inv: Investment gains in bonds and mortgages, investment gains in equities and real est.
Value added/ financial intermedi-ation
Systematic, production, investment
Methodology issues, comparing different techniques or as-sumptions
New model allows integration of produc-tion performance and investment perfor-mance; Canadian companies operated very efficiently
Wu et al. (2007) Canada 71-78 1996-1998
Life incl. health
DEA Prod: Labor expenses, general operating expenses, capital equity, claims incurred Inv: Net actuarial reserves, invest-ment expenses, total investments, total segregated funds
Prod: Net premiums written, net income Inv: Investment gains in bonds and mortgages, investment gains in equities and real estate
Value added/ financial intermedi-ation
Systematic, production, investment
Methodology issues, comparing different techniques or as-sumptions
New model allows integration of produc-tion performance and investment perfor-mance; Canadian companies operated very efficiently
Xie (2008) US 107 1993-2004
Property-liability
DEA Labor, (admin, agent), business service and materials, financial equity capital
Present value of losses in-curred, real invested assets
Value added
Cost, revenue Organizational form, corporate gover-nance issues
IPO firms perform no worse than private firms in terms of cost and revenue effi-ciency changes
Yang (2006) Canada 72 1998 Life incl. health
DEA Prod: Labor expenses, general operating expenses, capital equity, claims incurred Inv: Net actuarial reserves, invest-ment expenses, total investments, total segregated funds
Prod: Net premiums written, net income Inv: Investment gains in bonds and mortgages, investment gains in equities and real estate
Value added/ financial intermedi-ation
Systematic, technical (production), investment
Methodology issues, comparing different techniques or as-sumptions
New model allows integration of produc-tion performance and investment perfor-mance; Canadian companies operated fairly efficiently
Yao et al. (2007) China 22 1999-2004
Life, non-life DEA Labor, capital, payment and benefits
Premiums, investment income Value added
Technical General level of efficiency and evolu-tion over time
Average efficiency of 0.77 for non-life and 0.70 for life companies
Yuan and Phillips (2008)
US 613 2003-2005
life, property-liability, (commercial banks, thrifts)
SFA Labor (admin, agent), material and physical capital, financial equity capital, debt capital
P/L: Present value of real losses incurred Life: Incurred benefits plus additions to reserves
Value added
Cost, reve-nue, profit scope
Regulatory change Significant number of cost scope dis-economies, revenue scope economies, weak profit scope economies exist in post-GLB integrated banking and insur-ance sectors
Yuengert (1993) US 765 1989 Life incl. accident and health
SFA, TFA
Labor, physical capital Reserves, additions to re-serves
Value added
Cost, scale Scale and scope economies
Economies of scale, but not for whole sample; x-inefficiency 35–50%; weakness of TFA; half-normal SFA specification not flexible enough
Zanghieri (2008) 14 Euro-pean countries
n/a 1997-2006
Life, non-life SFA Labor, debt capital, equity capital Claims paid, additions to reserves
Value added
Cost, profit Intercountry comparisons
Country-specific factors do not seem to influence the efficiency of life insurers, but do have a strong effect on the efficiency of non-life insurers
Notations: DEA: data envelopment analysis; DFA: distribution-free approach; FDH: free disposal hull; SFA: stochastic frontier approach; TFA: thick frontier approach. Four contributions to performance measurement in insurance by Weiss (1986, 1991b), Grace and Timme (1992) and Bernstein (1999) are excluded from the overview, but included in this table, since they are not efficient-frontier based.
Table A1: Overview of studies on efficiency in the insurance industry (continued)

40
Appendix B: Search Strategy
Our search strategy consists of four steps. Table 1 summarizes these four steps and their most
important elements (called sub-steps in Table 1).
Number Step Sub-steps 1 Definition of the
search strategy 1.1. Define a list of relevant key words (based on the Cummins/Weiss
(2000); Berger/Humphrey (1997) surveys and other more recent ar-ticles): Insurance, Efficiency, Productivity, Malmquist Index, Data En-velopment Analysis, Stochastic Frontier Analysis,…
1.2. Define a list of relevant authors: David Cummins, Mary Weiss, Allen N. Berger, Maria Rubio-Misas, Sharon Tennyson, Martin F. Grace,…
1.3. Define a list of relevant journals: Geneva Papers on Risk and Insur-ance, Geneva Risk and Insurance Review, Journal of Risk and In-surance, Risk Management and Insurance Review, Journal of Prod-uctivity Analysis, European Journal of Operational Research, Journal of Banking and Finance…
2 Implementation of the search strategy (data collection)
2.1. Search for articles in the relevant journals using the key words 2.2. Search for articles and working papers via Google Scholar using the
key words (for example, „Data Envelopment Analysis“ and Insurance, „Stochastic Frontier Analysis“ and Insurance)
2.3. Search for articles via publication databases such as Social Science Research Network (http://www.ssrn.com/), EBSCO (http://ejournals.ebsco.com/) and Science Direct (http://www.sciencedirect.com/) using the key words
2.4. Search for articles and working papers on the web pages of the rele-vant authors (David Cummins, Mary Weiss,…; especially in their list of publications)
2.5. Follow cross-references from overview sections of found papers 2.6. Attend and systematically scan conferences on frontier efficiency
(e.g., JBF conference on “the Uses of Frontier Efficiency Methodolo-gies for Performance Measurement in the Financial Services Sector”) and insurance (e.g., ARIA annual meeting, EGRIE conference) to identify most recent working papers on the topic
3 Evaluation of search results
3.1. Data preparation according to the categories published in the list in the Appendix of the paper (authors, countries, no. of insurers, sample period, lines of business covered, used Methods, inputs and outputs used, types of efficiency analyzed, application category, selected find-ings)
3.2. Delete articles that are not efficient frontier based, but focus mostly on productivity or other aspects (see page 5 in the paper)
3.3. Delete working papers that do not have sufficient quality 4 Revision and
completion of search based on comments of colleagues/on conferences
4.1. We have sent the manuscript including the list of papers to colleagues and asked them if there is something missing; additionally, presented search results at conferences and collected feedback
4.2. The feedback of the colleagues was integrated
Table A2: Search Strategy
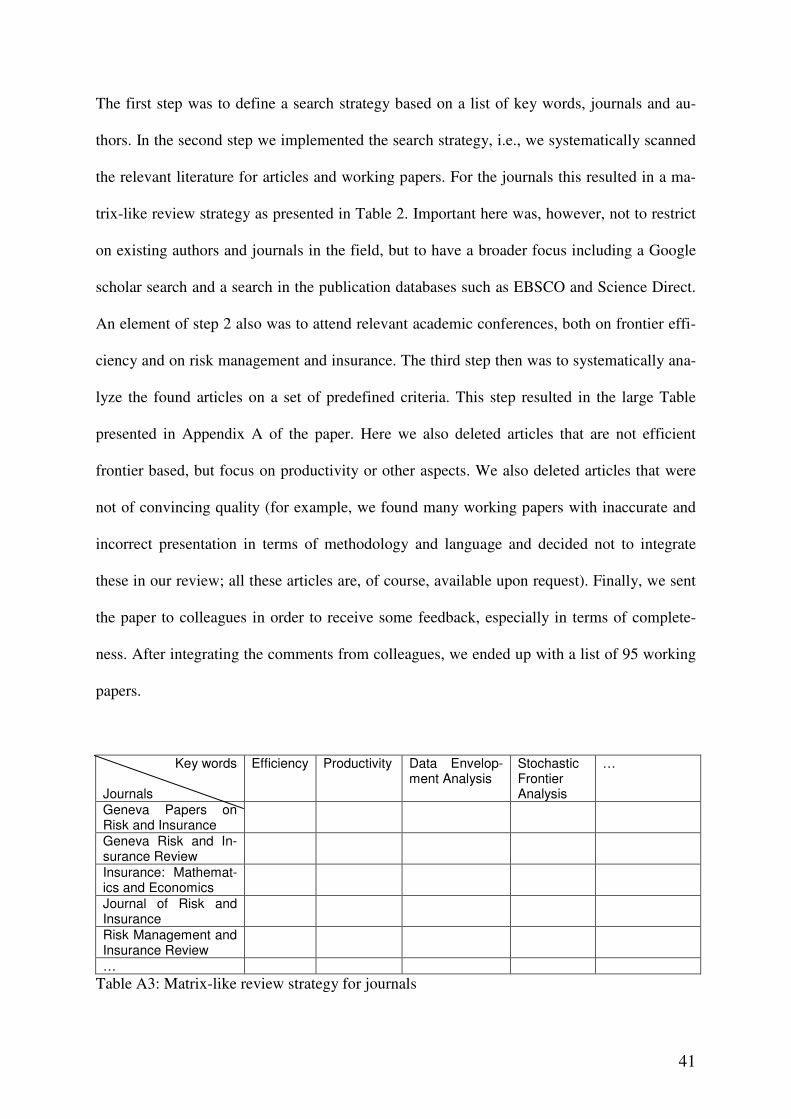
41
The first step was to define a search strategy based on a list of key words, journals and au-
thors. In the second step we implemented the search strategy, i.e., we systematically scanned
the relevant literature for articles and working papers. For the journals this resulted in a ma-
trix-like review strategy as presented in Table 2. Important here was, however, not to restrict
on existing authors and journals in the field, but to have a broader focus including a Google
scholar search and a search in the publication databases such as EBSCO and Science Direct.
An element of step 2 also was to attend relevant academic conferences, both on frontier effi-
ciency and on risk management and insurance. The third step then was to systematically ana-
lyze the found articles on a set of predefined criteria. This step resulted in the large Table
presented in Appendix A of the paper. Here we also deleted articles that are not efficient
frontier based, but focus on productivity or other aspects. We also deleted articles that were
not of convincing quality (for example, we found many working papers with inaccurate and
incorrect presentation in terms of methodology and language and decided not to integrate
these in our review; all these articles are, of course, available upon request). Finally, we sent
the paper to colleagues in order to receive some feedback, especially in terms of complete-
ness. After integrating the comments from colleagues, we ended up with a list of 95 working
papers.
Key words Journals
Efficiency Productivity Data Envelop-ment Analysis
Stochastic Frontier Analysis
…
Geneva Papers on Risk and Insurance
Geneva Risk and In-surance Review
Insurance: Mathemat-ics and Economics
Journal of Risk and Insurance
Risk Management and Insurance Review
…
Table A3: Matrix-like review strategy for journals