Embed Size (px)
Citation preview
U.S./Canadian Licensing In 2003: Survey ResultsRICHARD RAZGAITIS
Page 139
University Controlled Or Owned Technology: The State Of Commercialization And Recommendations
MARK L. GORDONPage 152
Time To Reconsider Australian And U.S. Law Regarding Exclusive Licenses Of Copyright And Patents?
ADAM LIBERMAN & BEN KREMERPage 164
Valuation Of Biotechnology Companies & Their Assets—Probability Effected Discounted Cash Flows
JEREMY WEBSTER & TREVOR PHILIPPONPage 167
Intellectual Property Strategy In BioinformaticsMARY CHOW & DENNIS FERNANDEZ
Page 171
The Management Of Intellectual Property In AustraliaADAM LIBERMAN
Page 176
Patent Pools: A Solution For The Telecommunications IndustryDON DRINKWATER
Page 183
Valuation Of Biotechnology—Stage Of Clinical Development Is Most ImportantJEREMY WEBSTER, TREVOR PHILIPPON & MYKHAYLO HOTSALIUK
Page 186
Recent Decisions In The United StatesBRIAN BRUNSVOLD & JOHN PAUL
Page 189
EU Competition Commissioner-Designate: Neelie Kroes ALEC BURNSIDE
Page 192
les NouvellesVolume XXXIX No. 4 December 2004
JOURNAL OF THE LICENSING EXECUTIVES SOCIETY®es®es
Delegates
1974 J. Gay1975 M. Finnegan1976 B. Hedberg1977 M. Okano1978 D. Smith1979 J. Gaudin1980 J. Stonier1981 S. Heijn1982 W. Poms1983 H. Hodding1984 F. Pombo1985 M. Ariga1986 L. Mackey1987 P. Hug1988 D. Ryan1989 K. Payne
International Past-Presidents
Society Offi cers Chapter President Secretary
Offi cers
President Willy ManfroyPresident-Elect Peter ChroczielPast-President Jonas GullikssonVice-President Chikao FukudaVice-President Elisabeth LogeaisVice-President Ronald GrudzieckiSecretary Adam LibermanTreasurer David Braunstein
les Nouvelles Editorial Re view BoardJeremy Brown, London, England, UKBrian G. Brunsvold, Washington, D.C., U.S.A.Michael Burnside, London, England, UKRodney M. DeBoos, Melbourne, Victoria, AustraliaClarisse Escorel, Rio de Janerio, BrazilGloria Isla del Campos, Mexico City, MexicoNorm Jacobs, Lexington, Massachusetts, U.S.A.Masato Kobasyashi, Tokyo, JapanMarek Lazewski, Warsaw, PolandJohn Ramsay, Calgary, Alberta, CanadaClem Wachinski, Wilmington, Delaware, U.S.A.Thomas G. Ryder, Editor-in-Chief 6500 Chapmans Road Allentown, PA 18106 U.S.A. Tel: +1-610-336-9575 Fax: +1-610-336-9576 E-mail: [email protected]
Carla J. Blackman, Design Interface Inc. Design & Production
les NouvellesVolume XXXIX Number 4
(ISSN 0270-174X)
The articles published in les Nouvelles refl ect the views of the au thors, and not of the Society as an association or of its offi cers. les Nouvelles is pub- lished each March, June, Sep tem ber and De cem ber by the Licensing Ex ec u tives So ci ety (U.S.A. and Canada), Inc. for the Li cens ing Executives So ci ety In ter na tion al. The Licensing Executives So ci ety In ter na tion al is a worldwide federation of busi-ness-ori ent ed pro fes sion al societies of in di vid u als in volved in the trans fer of technology and indus-trial or in tel lec tu al property rights.
Copyright ©2004 Licensing Executives Society International.
DEADLINES FOR LES NOUVELLES: Copy for pub li ca tion in the blue pages of les Nouvellesshould be re ceived by the Editor-in-Chief as far as pos si ble in advance of the fi nal dead lines, Febru-ary 1, May 1, August 1 and No vem ber 1. Ar ti cles for the white pag es are re viewed by the LES Ed i -to ri al Review Board, and they are pub lished as soon as pos si ble after acceptance. All materials are to be submitted elec tron i cal ly in ei ther MS Word or Text Only for mat.
LES IN TER NA TION AL
William OLIVEROSNabil SALAMÉMiguel O’FARRELLKaren SINCLAIRMonika VCELOUCHGregor VOSHenry Knox SHERRILLJohn ROEShaojie CHIJasenka ZANINOVICMarie SMRCKOVACecile DUPASGuenter ISENBRUCKKatalin DERZSIHenry EINAVManish THAKKARRoberto PRATOToshihiko SHIMIZUSun Ryun KIMClaire CHANCarlos TRUJILLOPatricia A. O. BUNYEMaria NIEPIEKLOSergey DOROFEEVGöran BERGQVISTRosa KANGJohan DU PREEZAntonio TAVIRARalph SCHLOSSERAlan H. GORDON
Andean CommunityArab CountriesArgentinaAustralia & New ZealandAustriaBeneluxBrazilBritain & IrelandChinaCroatiaCzech RepublicFranceGermanyHungaryIsraelIndiaItalyJapanKoreaMalaysiaMexicoPhilippinesPolandRussiaScandinaviaSingaporeSouth AfricaSpain & PortugalSwitzerlandUSA & Canada
Angel MORALESTalal ABU-GHAZALEHFernando NOETINGERDianne BEERAlexander CIZEKNigel WAGSTAFFRaul HEYStephen POWELLYue MADina Korper ZEMVAJarmila TRAPLOVAArnaud MICHELBertram HUBERMichael LANTOSShlomo COHENRani BOAZZMario E. TRAVERSOKenichi NAKANODuk Yeul BAEKPauline KHORJose Luis SOLLEIRORamon S. ESGUERRAMarek LAZEWSKINatalia KARPOVAKari SIPILASuresan SACHIHans NACHENIUSGonzola de ULLOAFelix GRETHERD. Patrick O'REILLEY
®®
1990 J. Portier1991 F. Noetinger1992 A. Mifune1993 L. Evans1994 O. Axster1995 N. Jacobs1996 J. Brown1997 S. Layton Jr.1998 R. DeBoos1999 P. Mandros2000 H. Goddar2001 E. Shalloway2002 T. Sueur2003 M. Jager2004 J. Gulliksson
Andean Community William Oliveros Angel M. Morales PlasenciaArab Countries Nabil Salamé Abdullah M. Al-SubyaniArgentina Fernando Noetinger Miguel O’FarrellAustralia & New Zealand Dianne Beer Rob McInnes Simon Rowell Karen SinclairAustria Guenter Kahler Rainer KraftBenelux Bruno Vandermeulen Lex van Wijk Nigel WagstaffBrazil Clarisse Escorel Henry Knox SherrillBritain & Ireland Chris Goodman Christi Mitchell Fiona Nicolson Stephen Powell Martin SandfordChina Shaojie Chi Rebecca Mang Chong LoCroatia Nina Cavlina Dina Korper ZemvaCzech Republic Michael Fischer Jana KuhnlovaFrance Arnaud Michel Henri Coppens Cecile DupasGermany Thomas Ahrens Wolfgang Ehrenstein
Guenter Isenbruck Jochen M. SchäferHungary Adam Szentpeteri Andras WeichingerIndia R. H. Acharya Sunil B. KrishnaIsrael Henry Einav Ramel Bar-JosefItaly Michael E. Traverso Rinaldo Plebani Michael JolicoeurJapan Chikao Fukuda Toshiko Kanayama Masashi Kurose Kenichi Nakano Kiyohide OkamotoKorea Duk Yeul Baek Sun Ryung KimMalaysia Pauline Khor Wendy LamMexico Gloria Isla Del Campo Oscar M.BecerrilPhilippines Patricia A.O. Bunye Ramon S. EsguerraPoland Anna Szafruga Malgorzata GrabowskaRussia Svetlana Makeeva
Arnaud Michel Arnaud Michel Sergey DorofeevArnaud Michel Sergey DorofeevArnaud Michel Scandinavia Jonas Gulliksson Arne Alnaes Viveca Rütter Sindre-Jacob Bostad
Singapore Suresan Scahi Alex YuSouth Africa Johan du Preez Alan LewisSpain & Portugal Fernando Pombo Gonzalo de UlloaSwitzerland Felix Grether Philipp Dreier Ralph SchlosserUSA & Canada Allen Baum Walt Bratic David Braunstein Walter G. Copan E. B. (Ted) Cross Kathleen Denis Thomas Filarski Robert Goldscheider Alan H. Gordon Ronald L. Grudziecki Michael A. Lechter Russell E. Levine Keith Lutsch N. Peter Kostopulos James E. Malackowski Kenneth D. McKay Peggy Moizel Ada Nielsen Arthur M. Nutter D. Patrick OʼReilley Dwight Olson Gene Partlow John Charles Paul Thomas A. Picone Ernest G. Posner Arthur S. Rose James R. Sobieraj
U.S./Canadian Licensing In 2003:Survey Results
BY RICHARD RAZGAITIS*
*Richard Razgaitis, President of the Licensing Foundation (2004/5).
les Nouvelles December 2004 139
Initial Results of a Survey Conducted in January/February 2004 by the Li-censing Foundation of LES (USA & Canada),1 on behalf of The Licensing Foundation.2
ABSTRACT AND SUMMARY OF FINDINGS
The results are reported of a Web-based survey of licens-ing practices of LES (USA &
Canada) members. Such survey was sponsored and conducted by the Li-censing Foundation of LES (USA & Canada) (www.licensingfoundaton.org). It was conducted in January and February of 2004 by contacting 5,349 member e-mail addresses and pro-viding a link to the online survey.
The focus of the survey and the analysis of the results was on com-panies who are intellectual property owners and who engage in out-li-censing despite their ability, in principle, to directly commercialize their IP or in in-licensing despite their general ability to develop their own technology through in-ternal R&D. 229 respondents to this survey fi t this profi le. These were further separated into “large” and “small” using the demarcation of 1,000 employees.
The results reported here are relat-ed to the business process “trade,” or dealmaking, involving technology-based IP. Such dealmaking process was surveyed for three time periods:getting to the point of substantive
negotiations, consummating such negotiations, and living with the deal done.
From these data it appears that only a small portion of what is be-lieved to be licensable IP actually is licensed within the time frame of a respondentʼs experience. A substan-tial number of factors contribute to deal breakdown both during the period when potential licensees are identified as well as during sub-stantive negotiations, and it is not always about “the money.” Finally, looking back on deals done within the past year, the survey suggests that a substantial number of such agreements would have been done differently with respect to various deal terms used in the agreement.INTRODUCTION
“Licensing” is, literally, the fi rst word of LES, and the single-word appellation of the business process that best describes our Societyʼs primary interest and what most of us designate as our profession (in-dustry) and craft (technê). Yet, the industry of licensing,3 unlike almost every other business, is both diffi cult to defi ne or encompass.
A legal perspective of licensing fo-cuses on the forms and protections of intellectual property (IP) rights, contractual vehicles by which such rights can be conveyed, and the ap-plicability of governing law to the
behaviors and misbehaviors of indi-viduals and legal entities. A fi nancial perspective leads to an analysis of the value of IP rights as they may be packaged in various forms and with other assets so they may be subjects of commercial transactions (“licens-es”). The perspective of a business owner or manager views licensing, and IP, as mechanisms by which in-vestments made can be realized, or the investments of others acquired, all as part of the competitive context of successfully satisfying the needs of its customers, present and future.The licensing expanse, almost like the heavens themselves, seems to cover an earthful (and earful) of activities and interests:
• Internal Research & Develop-ment (IR&D), contract R&D,
• Entrepreneurship, innovation, inventions, discoveries, creations,
• Patents, trade secrets, copy-rights, trademarks,
• Valuation,pricing, royalties, equity/warrants, minimums, chang-es of IP rights, supply/purchase commitments,
• Agreements (deals), deal-mar-keting, negotiation, dealmaking,
• Spinouts, Joint Ventures/Part-nerships, research collaborations, startups/NEWCOs, M&As (Merg-ers & Acquisitions),
• Infringement/IP-theft litiga-tion/negotiation/settlement,
• Government policy related to IP law and policy, economic devel-opment, and trade.4
1. www.licensingfoundation.org. The Licensing Foundation is a wholly-owned 501c3 subsid-iary of LES (USA & Canada). 2. The Licensing Foundation in January 2004 was managed by its Board comprised of Louis Berneman , Todd Dickinson, Mel Jager (Presi-dent), Dwight Olson, Richard Razgaitis, Art Rose, and Jim Soberaj, on behalf of the Board of LES (USA & Canada).
3. Some have characterized the licensing “industry” as the “market for knowledge.” The classical Greek term technê, commonly translated craft or art, and perhaps in our context and times could be best translated as “know how,” is more appropriate than “knowledge.” Although we use “licensing industry” as subject of study, it could per-haps be more comprehensively defi ned as the “market for owned/protected technê.”
The fi nal word in the above list, trade, references a basic, essential business activity that dates from antiquity and one that has had enormous societal impact. Licens-ing, albeit a very specialized form of trade, has become in the last half of the 20th Century a vibrant, and extremely important part of busi-ness and society. LES, which came into existence less than 40 years ago, has grown to 13,000 members worldwide, 5,800 of which are in the U.S. and Canada. Other associations closely related to licensing, such as AIPLA, AUTM, and IPO, have simi-larly evidenced signifi cant growth and interest. U.S. patents, which date from 1790 (a year when there were just three patents issued), have likewise shown a dramatic level of growth in the past 40 years: from 62,857 issued by the USPTO in 1965 to 169,028 in 2003.5 Software (includ-ing fi rmware and middleware) was virtually non-existent as an industry 40 years ago but has become a major element in our economy,6 affecting even our rights to write, print, and transmit articles such as this one.
It is of interest to grasp and char-acterize the extent and key issues of the business and profession of licensing. This interest has attracted the attention of numerous individu-als and groups. The U.S. Patent and Trademark Offi ce (USPTO) makes available detailed statistics on pat-ents applied for and granted. The Intellectual Property Owners (IPO) Association has recently published results of its survey of its memberʼs activities. Since FY 1990, AUTM has published an annual report of its survey results of its member institutions (primarily universities) that include not only data on R&D
funding and the resulting invention disclosures and patents but also data on license agreements entered into and royalties and other IP payments received.7 For many years Battelle has performed annual surveys to provide forecasts of annual R&D spending in both industry and government.8
In 2003 LES reported on the re-sults of a survey of compensation for licensing professionals.9 Other LES groups, such as its Intellectual Capital Management Committee have conducted surveys of licens-ing metrics relating to best practices.“An International Survey on Tech-nology Licensing Practices” has been completed in draft form on behalf of LES International (LESI), LES (USA & Canada), and LES France.10 This as yet unpublished survey analyzes 160 written questionnaires regarding 297 technology licensing agreements primarily in Europe, Japan, U.S.A., and Canada. Other such licensing process/issues surveys done by LES members (and others) include Degnan,11 McGavock,12 McGavock,13
and the Corporate Legal Times.14
Royalty rate and other IP pay-ments have been widely surveyed by many. Public fi lings of license
agreements that represent material transactions have been useful source data for IP payments and in certain respects for deal structures, par-ticularly in the healthcare industry (pharmaceuticals and biotechnol-ogy) and have been compiled into databases by commercial vendors.15
Razgaitis has summarized numer-ous such royalty rates and other fi -nancial surveys, some dating back to 1975.16
Except for the AUTM and Battelle surveys, and the U.S. Patent Offi ce statistics, most of the other survey information has been ad hoc and refl ects the particular interests of the surveying group.
One core measure of an industryʼs signifi cance is total annual revenue for all segments by all participants, and an understanding of such in-dustryʼs structural taxonomy. There have been multiple sources who have claimed that in the U.S., the licensing industry has $100 billion annual “royalty licensing revenues,”which appears to include all forms of IP patents including running royalties;17 however, there does not appear to be a research foundation for this (or any other) estimate.If such revenues are indeed ex-pressed in nine-fi gures (> $100 bil-
4. Note than the terms “license” or “licens-ing” do not explicitly appear in any of such bulleted list, although licensing is commonly an important, directly-related business prac-tice.5. http://www.uspto.gov/web/offi ces/ac/ido/oeip/taf/reports.htm#by_hist.6. U.S. software only revenues (which argu-ably could be considered as substantially all licensing revenue) in 2001 are estimated to be $69 billion with an additional $100 billion in sales outside the U.S.; Service Annual Survey, http://www.census.gov/svsd/www/sas511.pdf
7. AUTM Licensing Survey: FY 2002, The Association of University Technology Man-agers, 2003.8. http://www.battelle.org/news/04/1-22-04 R&D%20Funding.stm9. 2003 Compensation Survey Report, Licensing Executives Society (U.S. and Canada), 2003.10. “An International Survey on Technology Licensing Practices; The Diversity of Technol-ogy Licensing Agreements and their Clauses,”Eric Brousseau (coord.), Camille Chasserant, Christian Bessy; FORUM, Université de Paris X, http://forum.u-paris10.fr.11. Degnan, Stephen A., The Use of Conjoint Analysis to Establish the Most Important Evalu-ation Factors in Technology Transfer and Patent Licensing Negotiations, Ph.D. Dissertation, Golden State University School of Business, June 2002.12. McGavock, D.M. and Lasinski, M.J., “IP Survey Finds Gap in Information,” les Nou-velles, Sept. 1998, p. 107-116.13. McGavock, D.M. and Haas, D.A., “Licens-ing in the Real World: A Survey of Those Who Know,” Licensing Law and Business Report, Vol. Licensing Law and Business Report, Vol. Licensing Law and Business Report13, No. 1, May-June 1990, p. 146-156.14. Andersen, Steve, “The Evolving IP Coun-sel, The Inaugural Survey of Chief IP Counsel, Corporate Legal Times, June 2002, p. 1.
15. Such as, Recombinant Capital (http://www.recap.com/) and Windhover (http://www.windhover.com) which focuses on the pharmaceutical/biotech industry.16. Razgaitis, R., Valuation and Pricing of Tech-nology-Based Intellectual Property, John Wiley & Sons, 2003, Chapter 4.17. Such statistic has been cited for “retail” li-censing (primarily trademark licensing): “Li-censing is a $100 billion retail market world-wide, with $70 billion in business in North America alone, says Murray Altchuler, execu-tive director of the International Licensing In-dustry Merchandisersʼ Association (LIMA).”[Citation at: http://www.entrepreneur.com/article/0,4621,226781,00.html]. And $100 billion/year is also cited for technology li-censing revenues: “The IP licensing market has grown an estimated 700 percent, from $15 billion in 1990 to well over $100 billion in 1998. Patent licensing revenue is predicted to top half a trillion dollars annually by 2005.” [Citation at: “The Basics of Financing Intel-lectual Property Royalties, Part III: What is the Market?,” by Licent Capital, July 2, 2001, http://www.cafezine.com/Index_article.asp?id=412&deptId=3]
les NouvellesDecember 2004140
lion), then licensing would indeed represent a major industry joining other nine-figure segments such as computers/electronic products ($350 billion),18 telecom ($425 bil-lion),19 pharmaceuticals, and R&D itself ($284 billion).20
In this context, the Licensing Foundation commissioned an ini-tial survey of licensing activity in U.S. for the purpose of contributing to the above available information resources but also, perhaps, to inau-gurate a regular, systemic investiga-tion to complement and expand the understanding of licensing as an industry and as business practices.The long-term aspiration of such sur-veying initiative was and remains:
Provide an annual, synoptic perspec-tive on key statistics, events, and trends in the world of “Licensing” that can assist licensing professionals in under-standing and advancing the business environment in which they operate and to which they contribute, and can be used by the public, academic research-ers, and government policy analysts to grasp the issues and impacts of licensing business practices.
Based on this background and long-term objective, the Founda-tion prepared a Request for Pro-posal (RFP) which was sent to some 30 organizations including leading MBA and entrepreneur-ship academic programs and other entities known for their interest in this or related areas. After a review of several proposals that responded to the RFP, the team of Professors, Iain Cockburn of Boston University and Ajay Agrawal of the University of Toronto, was selected.
A key aspect of the survey was the desire to focus on licensing matters primarily involving corporate IP asset owners who are members of LES (USA & Canada), since partici-
pants were more readily accessible and likely to be responsive to the Licensing Foundation, and which conduct out-licensing despite being (normally) capable of directly com-mercializing such IP assets and in-licensing despite (normally) having its own R&D/product development capabilities. Such IP owners can be considered to be “OEMs” of licens-ing. Although the survey was in-clusive of all members of LES (USA & Canada) with an e-mail address (5,349 e-mail addresses associated with approximately 2,669 unique organizations), and so included numerous IP service providers (1,401 of such 2,669 unique organi-zations were such as outside legal counsel and IP valuation organiza-tions), the primary interest was the perspectives of such licensing OEMs (1,268, the difference between 2,699 and 1,401). Such a survey would also reach IP inventor/creator or-ganizations such as universities and research institutes that (normally) lack the means to directly commer-cialize its own IP opportunities; AUTM-type respondents (univer-sities and institutes) were included in the results reported here (albeit in small numbers). Other survey anal-ysis which we have tested, such as royalties collected as a percentage of EBIT, used only data from commer-cial fi rms; so data from AUTM-type respondents were excluded in such calculations. Such EBIT percentage calculations are not reported here because the number and diversity of respondents does not make such analysis statistically reliable. The industry classifi cation used by LES (USA & Canada) to group its mem-bership was also used to classify the survey responses.
To simplify the scope of the sur-vey we excluded licensing activities from the following areas: Right-to-Use licensing (sometimes known as “shrink wrap” licenses), cross-li-censing (although we did ask some questions related to the practice), copyrighted content licensing (mu-sic, text, and the like), and trademark licensing. Further, because our data-base of respondents were members of LES (USA & Canada) we asked for
data and perspectives for licensing activities in North America.SURVEY FORMAT21
The survey was implemented as an online questionnaire accessible by Web browser, rather than in the traditional format of a hardcopy mail-back questionnaire. The sur-vey was administered in January and February of 2004 by faxing a letter to the membership of the LES (USA and Canada), followed by individualized e-mails containing a link to the survey site explaining the objective of the survey. Web sur-veys of this type have recently been found to have comparable response rates to mail-based surveys.22 Web surveys also have obvious advan-tages over the traditional format in terms of speed, lower printing and distribution costs, and reduced data entry errors. Many individuals fi nd that the “task burden” of responding to a Web-based survey by clicking boxes or choosing among a menu of alternatives is signifi cantly lower than for paper questionnaires, so this format also minimizes intru-siveness and time cost. This “closed”list-based sampling frame, made up of individuals who can safely be as-sumed to have access to the Internet and a high level of familiarity with using Web browsers, is relatively im-mune to the problems with sample selection, coverage, and response bi-ases that have been identifi ed with some Web surveys that attempt to draw conclusions about larger and more heterogeneous populations.
Multiple iterations of the survey were tested with various volunteers who provided focus panel counsel.Such counsel resulted in signifi-cant reductions in the scope and complexity of the questions in the interest of increasing the likelihood of a larger response. Substantial dis-
18. 2002 U.S. annual revenues as defi ned by U.S. Census Bureau, 2002 Economic Census, http://www.census.gov/econ/census02/advance/TABLE1.HTM19. U.S. Census Bureau, 2002, Op cit.20. Battelle R&D Forecast 2004, citing 2003, U.S., http://www.battelle.org/news/04/1-22-04R&D%20Funding.stm
21. This section and the one following is substantially the contribution of Prof. Iain Cockburn, whose assistance is gratefully acknowledged.22. Kaplowitz, M.D., Hadlock, T.D., Levine, R. (2004) “A Comparison of Web and Mail Survey Response Rates.” Public Opinion Quarterly. 68(1):94-102.
les Nouvelles December 2004 141
cussion took place regarding the bal-ance between questions that asked for subjective opinion (“strongly agree,” “agree,” etc.) versus a greater (or total) focus on quantita-tive responses (dollars, numbers, “facts”). The resulting survey was designed to minimize any need for research numbers (to increase response rate), to be completed in not more than 20 minutes, and to be done with complete anonymity23
by any or multiple members of any given licensing OEM. This approach precluded the capacity to have OEM data from, say, each of the top ten pharmaceutical companies.
The Web based format also al-lowed us some flexibility to ad-dress the heterogeneity of the LES membership, whose involvement with various aspects of licensing varies greatly, and who belong to quite different kinds of organiza-tions. The questionnaire was struc-tured to serve up questions tailored to respondents answering for an entire company versus business unit, and for those engaged largely in out-licensing, largely in in-licens-ing, significant amounts of both activities, or indirectly involved as consultants or legal advisors. This prevented respondents from be-ing asked redundant or irrelevant questions, speeding up the process of completing the questionnaire and further reducing the task burden.
Respondents were alerted to the general content of the question-naire in the faxed invitation letter and follow-up e-mails, and were guaranteed anonymity. Two rounds of “reminder” e-mails were sent dur-
ing the month long period that the survey was administered.
It is important to distinguish between surveys designed to elicit useful descriptive information about a phenomenon from volunteer re-spondents, and those designed to precisely measure population statistics. The latter requires strict “probability sampling” i.e. draw a random sample from the population of interest (e.g. dialing random dig-its to poll the U.S. population) and to get good results may often need “quota sampling” based on popula-tion strata and stringent controls to minimize response bias. This makes them both expensive and intrusive, and difficult to implement when key individuals with specialized information must be contacted and persuaded to willingly provide responses including confidential information. The former can use-fully be done from “convenience samples” like ours, particularly when targeted at a list such as the
23. Though e-mails to respondents were tracked with a randomly generated se-rial number to prevent us from reminding people who had already participated in the survey, and to maintain database integrity if respondents visited the survey web pages multiple times, no identifying information about respondents was retained after the survey was closed.
les NouvellesDecember 2004142
LARGE SMALL OVERALL ORGANIZATIONS ORGANIZATIONS
QUESTION Number Mean Number Mean Number Mean
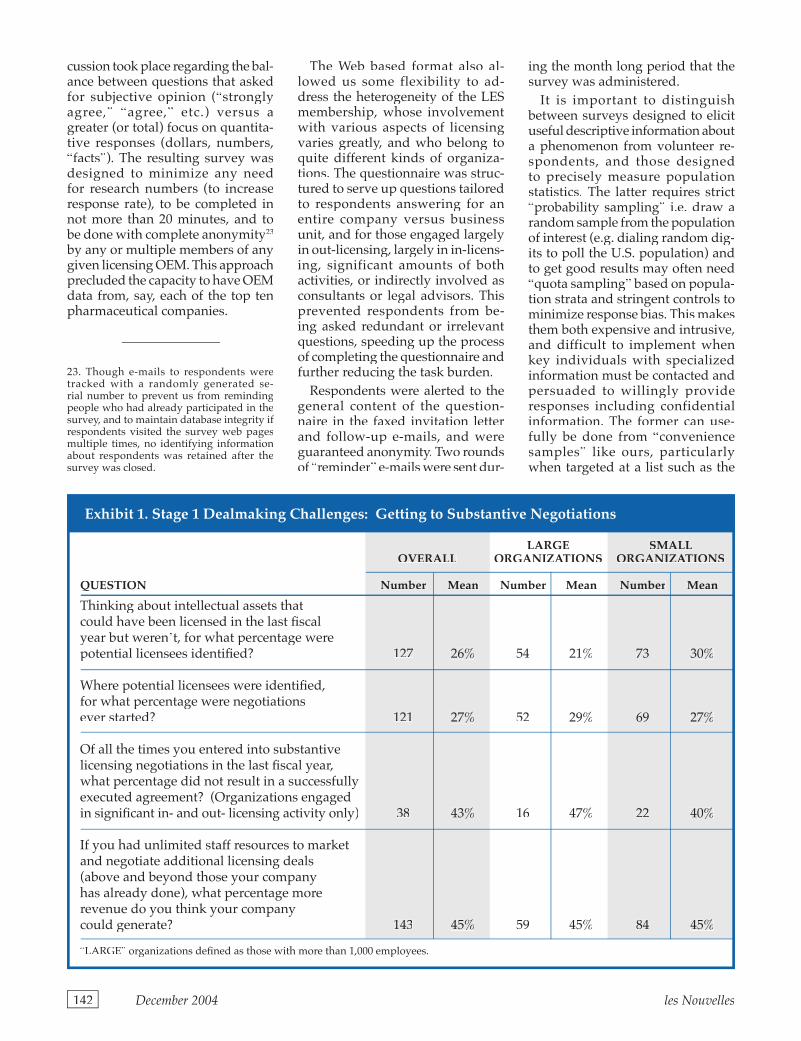
Thinking about intellectual assets that could have been licensed in the last fi scal year but werenʼt, for what percentage were potential licensees identifi ed? 127 26% 54 21% 73 30%
Where potential licensees were identifi ed, for what percentage were negotiations ever started? 121 27% 52 29% 69 27%
Of all the times you entered into substantive licensing negotiations in the last fi scal year, what percentage did not result in a successfully executed agreement? (Organizations engaged in signifi cant in- and out- licensing activity only) 38 43% 16 47% 22 40%
If you had unlimited staff resources to market and negotiate additional licensing deals (above and beyond those your company has already done), what percentage more revenue do you think your company could generate? 143 45% 59 45% 84 45%
“LARGE” organizations defi ned as those with more than 1,000 employees.
Exhibit 1. Stage 1 Dealmaking Challenges: Getting to Substantive Negotiations
LES (USA & Canada) membership made up of well-informed profes-sionals with an interest in the out-come. But this type of information is vulnerable to response bias (those who choose to answer may not be representative of the sample) and to “frame bias” (the sample is not representative of the population it is drawn from).
A complete copy of the survey in-structions and questions is available at the Licensing Foundation Website:www.licensingfoundation.org.RESPONSE RATE
799 unique visitors to the Web site containing the questionnaire were recorded. Of these, 350 pro-ceeded to complete at least part of the questionnaire. Of these 350
respondents, 121 were involved in licensing primarily as consultants or legal advisors, and are excluded from the following analysis. Of the remaining 229 respondents, 117 were engaged primarily in out-licensing activity, 45 primarily in in-licensing activity, and 67 were involved in signifi cant amounts of both in- and out-licensing.
Sample selection has not yet been assessed. The “core” sample of 229 respondents is a small fraction of the total LES membership and in particular the 5,349 with e-mail addresses (as of the time period of the Survey: January 2004). However LES members are affiliated with only 2,669 distinct organizations, of which 1,401 are law fi rms, con-
sulting companies, banks, or other professional service fi rms, and are therefore excluded from consid-eration here. This leaves just over 1400 “target” organizations that can be considered as the survey target OEMs of licensable IP and employ one or more LES members. Results reported here should therefore be thought of as a 15 percent sample from this reference.
It should be recognized that some of the questions posed in the sur-vey received very low numbers of responses (50 or fewer) and the conclusions that can be drawn from these data are obviously very limit-ed. This response rate is low, but not unusual for surveys of this nature.Studies that obtain higher response
les Nouvelles December 2004 143
LARGE SMALL OVERALL ORGANIZATIONS ORGANIZATIONS
QUESTION Number Mean Number Mean Number Mean
For out-licensing, where potential licensees out-licensing, where potential licensees out-licensingwere identifi ed but negotiations never started, for what percentage of these cases was it due to:
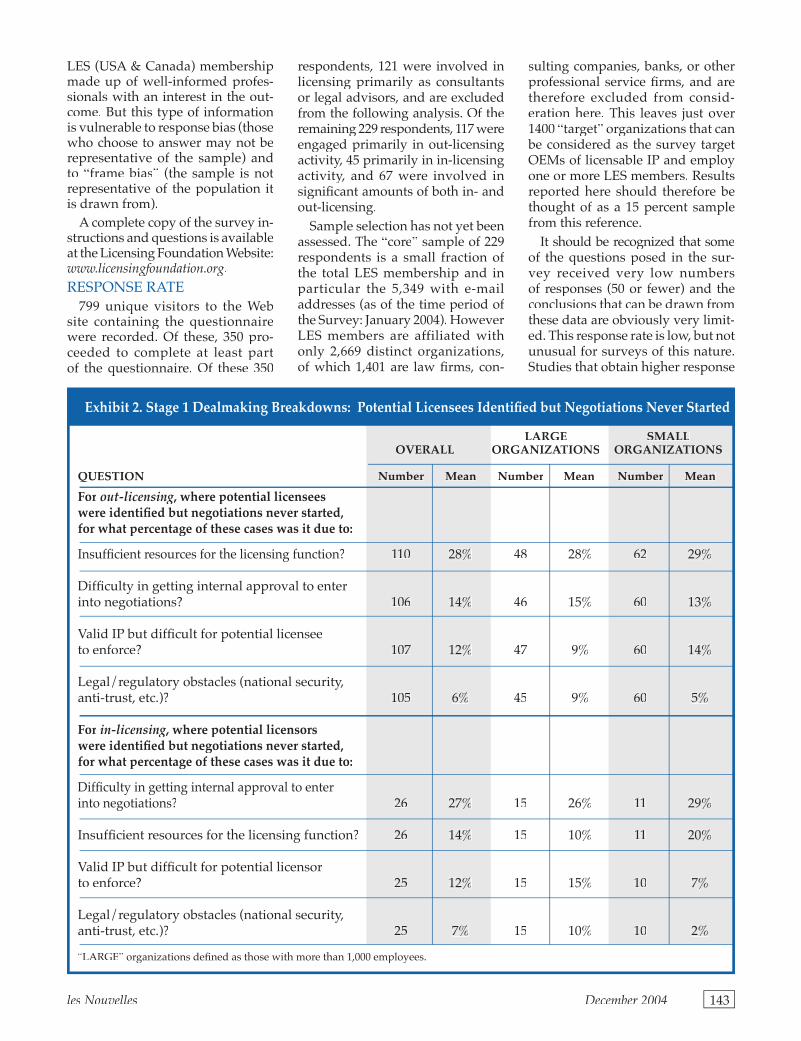
Insuffi cient resources for the licensing function? 110 28% 48 28% 62 29%
Diffi culty in getting internal approval to enter into negotiations? 106 14% 46 15% 60 13%
Valid IP but diffi cult for potential licensee to enforce? 107 12% 47 9% 60 14%
Legal/regulatory obstacles (national security, anti-trust, etc.)? 105 6% 45 9% 60 5%
For in-licensing, where potential licensors in-licensing, where potential licensors in-licensingwere identifi ed but negotiations never started, for what percentage of these cases was it due to:
Diffi culty in getting internal approval to enter into negotiations? 26 27% 15 26% 11 29%
Insuffi cient resources for the licensing function? 26 14% 15 10% 11 20%
Valid IP but diffi cult for potential licensor to enforce? 25 12% 15 15% 10 7%
Legal/regulatory obstacles (national security, anti-trust, etc.)? 25 7% 15 10% 10 2%
“LARGE” organizations defi ned as those with more than 1,000 employees.
Exhibit 2. Stage 1 Dealmaking Breakdowns: Potential Licensees Identifi ed but Negotiations Never Started
les NouvellesDecember 2004144
LARGE SMALL OVERALL ORGANIZATIONS ORGANIZATIONS
QUESTION Number Mean Number Mean Number Mean
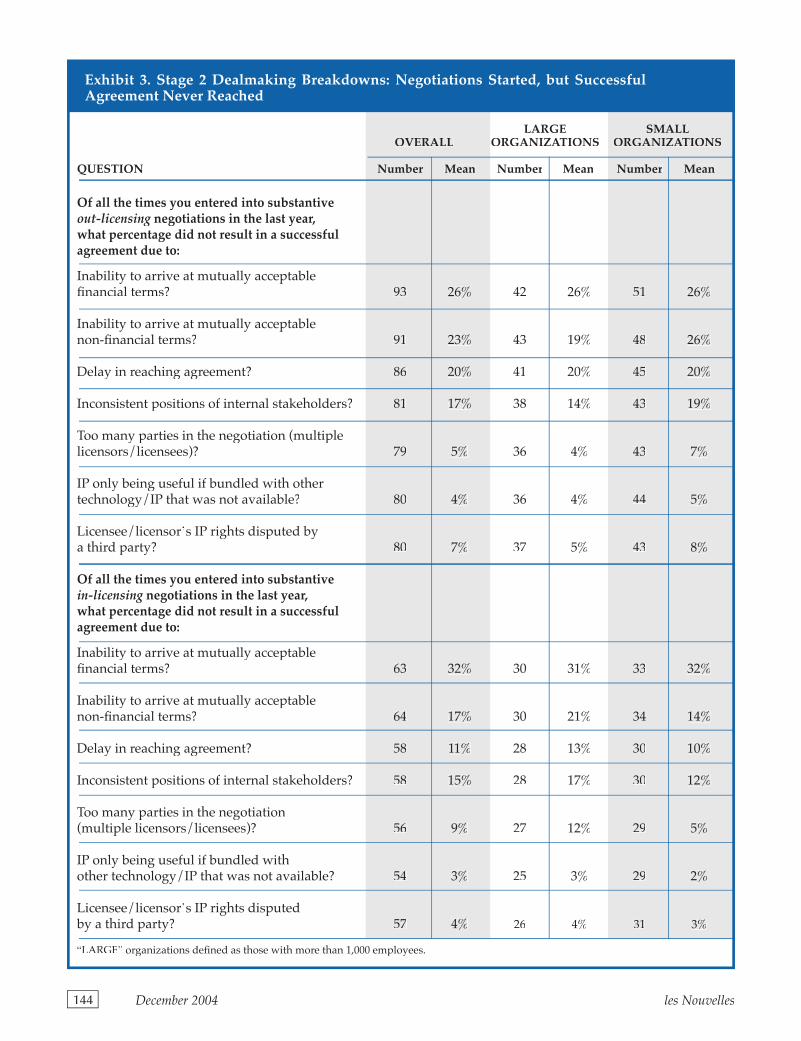
Of all the times you entered into substantive out-licensing negotiations in the last year, out-licensing negotiations in the last year, out-licensingwhat percentage did not result in a successful agreement due to:
Inability to arrive at mutually acceptable fi nancial terms? 93 26% 42 26% 51 26%
Inability to arrive at mutually acceptable non-fi nancial terms? 91 23% 43 19% 48 26%
Delay in reaching agreement? 86 20% 41 20% 45 20%
Inconsistent positions of internal stakeholders? 81 17% 38 14% 43 19%
Too many parties in the negotiation (multiple licensors/licensees)? 79 5% 36 4% 43 7%
IP only being useful if bundled with other technology/IP that was not available? 80 4% 36 4% 44 5%
Licensee/licensorʼs IP rights disputed by a third party? 80 7% 37 5% 43 8%
Of all the times you entered into substantive in-licensing negotiations in the last year, in-licensing negotiations in the last year, in-licensingwhat percentage did not result in a successful agreement due to:
Inability to arrive at mutually acceptable fi nancial terms? 63 32% 30 31% 33 32%
Inability to arrive at mutually acceptable non-fi nancial terms? 64 17% 30 21% 34 14%
Delay in reaching agreement? 58 11% 28 13% 30 10%
Inconsistent positions of internal stakeholders? 58 15% 28 17% 30 12%
Too many parties in the negotiation (multiple licensors/licensees)? 56 9% 27 12% 29 5%
IP only being useful if bundled with other technology/IP that was not available? 54 3% 25 3% 29 2%
Licensee/licensorʼs IP rights disputed by a third party? 57 4% 26 4% 31 3%
“LARGE” organizations defi ned as those with more than 1,000 employees.
Exhibit 3. Stage 2 Dealmaking Breakdowns: Negotiations Started, but Successful Agreement Never Reached
rates typically use costly (and intru-sive) methods such telephone calls to non-responding members of the sample frame.CHARACTERISTICS OF SUR-VEY RESPONDENTS
The respondentsʼ organizations varied in size from less than $1 million in annual revenues and 10 employees to more than $50 billion and 20,000 employees. On average they employed 7,863 people, had sales of $5.6 billion, and annually invested $676 million in R&D. To aid in understanding the effect of organization size, responses were analyzed separately for organiza-tions with more than 1,000 employ-ees (hereafter “large”) versus those with less (“small”). The average global metrics of the 96 “large” re-sponding organizations were 18,000
employees, $13 billion in revenues, and just under $1.5 billion in R&D spending, compared to the 133 “small” organizations with 147 em-ployees, $53 million revenues, and $41 million in R&D.
Respondents were asked whether they preferred to answer on behalf of their entire company (CO) or for a specific business unit (SBU) or division: 65 percent did respond on behalf of the CO, and 35 percent for a specifi c SBU.
Respondents belong to ten of the eleven LES industry categories: the largest category of respondents were in healthcare (29 percent CO respondents, 31 percent SBU), which includes biotechnology, pharmaceu-ticals, and biology. Approximately22 percent of the respondents werefrom the combination of electronics
(six percent CO respondents, zero percent SBU), energy (fi ve percent CO & SBU), software (three percent CO, two percent SBU) transporta-tion and mechatronics (three percent CO, two percent SBU), and “other”(seven percent CO, 12 percent SBU).The balance of respondents included university and government labora-tories (14 percent CO, 21 percent SBU), and service sectors, primarily and approximately evenly divided between legal and consultants.SURVEY DATA RELATING TO LICENSE DEALMAKING
Considering “trade” as a core element of “licensing,” one of the major areas surveyed were aspects of such dealmaking that are be-lieved to be important or critical.Data were obtained relating to the impediments/difficulties of
les Nouvelles December 2004 145
LARGE SMALL OVERALL ORGANIZATIONS ORGANIZATIONS
QUESTION Number Mean Number Mean Number Mean
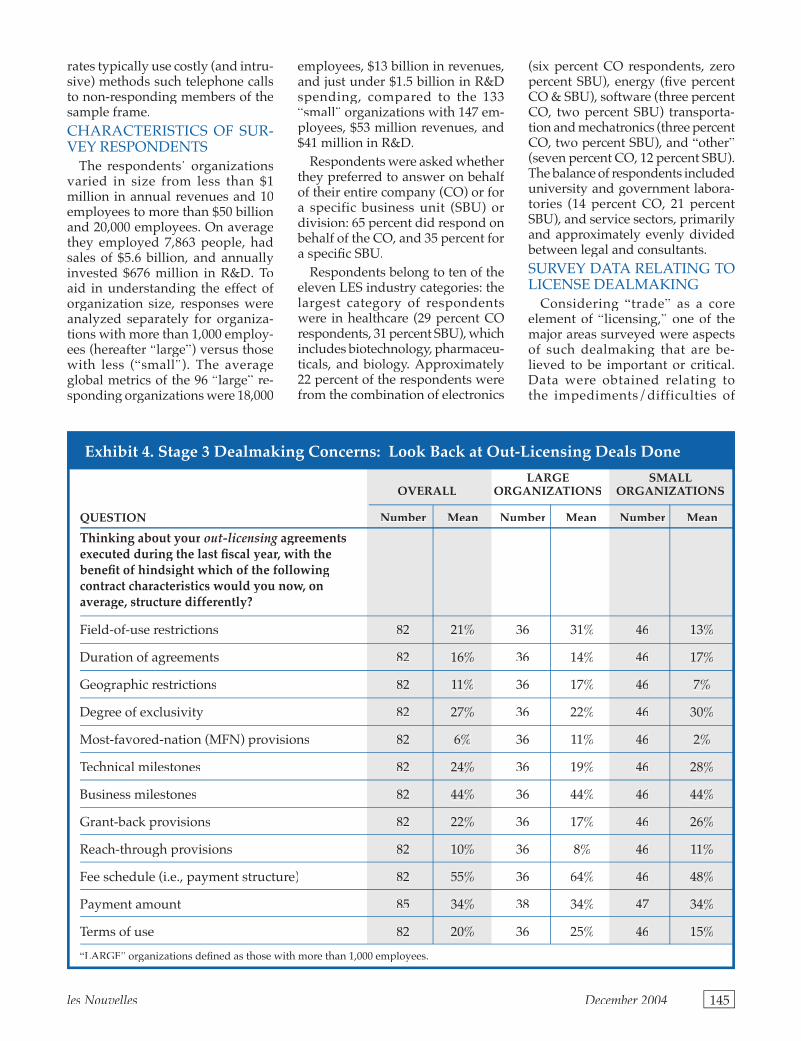
Thinking about your out-licensing agreements out-licensing agreements out-licensingexecuted during the last fi scal year, with the benefi t of hindsight which of the following contract characteristics would you now, on average, structure differently?
Field-of-use restrictions 82 21% 36 31% 46 13%
Duration of agreements 82 16% 36 14% 46 17%
Geographic restrictions 82 11% 36 17% 46 7%
Degree of exclusivity 82 27% 36 22% 46 30%
Most-favored-nation (MFN) provisions 82 6% 36 11% 46 2%
Technical milestones 82 24% 36 19% 46 28%
Business milestones 82 44% 36 44% 46 44%
Grant-back provisions 82 22% 36 17% 46 26%
Reach-through provisions 82 10% 36 8% 46 11%
Fee schedule (i.e., payment structure) 82 55% 36 64% 46 48%
Payment amount 85 34% 38 34% 47 34%
Terms of use 82 20% 36 25% 46 15%
“LARGE” organizations defi ned as those with more than 1,000 employees.
Exhibit 4. Stage 3 Dealmaking Concerns: Look Back at Out-Licensing Deals Done
dealmaking at various stages: (1) getting to the point of substantive negotiations, (2) consummating such substantive negotiations, and (3) living with the deal (which may include buyer/seller remorse).
The data shown in Exhibit 1 show survey responses for both Small and Large organizations, and for both in- and out-licensing (except where noted) relating to the fi rst two dealmaking stages. Considering Stage 1, getting to substantive nego-tiations, these data suggest another kind of 25 percent rule: of IP assets that (in the respondentʼs opinion) could have been licensed (in the past year) only (approximately) 25
percent had been developed to the stage where potential licensees were identifi ed, and of those assets where potential licensees were identifi ed only ca. 25 percent reached Stage 2, initiating substantive negotiations.This result suggests that one out of eight opportunities believed to be licensable became part of serious buyer-seller discussions. In Stage 2, these data show that less than half (43 percent average of Large and Small data sets) reached consum-mation of a license. Coupled with the earlier stage erosion of dealmak-ing opportunities, this suggests that the percentage of asset opportuni-ties that reach agreement is in the
single-digits, perhaps even less than fi ve percent. Yet, when asked what the effect would have been of unlim-ited staff resources, the respondentsʼmean response was 45 percent more revenue than that which actually occurred. From an absolute dol-lars perspective, 45 percent is a signifi cant number, but from a per-spective of the large reported deal opportunity erosion, there must be other important factors than solely additional staff resources.
Considering the large disparity in size between the average Large and Small companies (the Large ones on average have nearly 250 times the annual revenue of the Small), the
les NouvellesDecember 2004146
LARGE SMALL OVERALL ORGANIZATIONS ORGANIZATIONS
QUESTION Number Mean Number Mean Number Mean
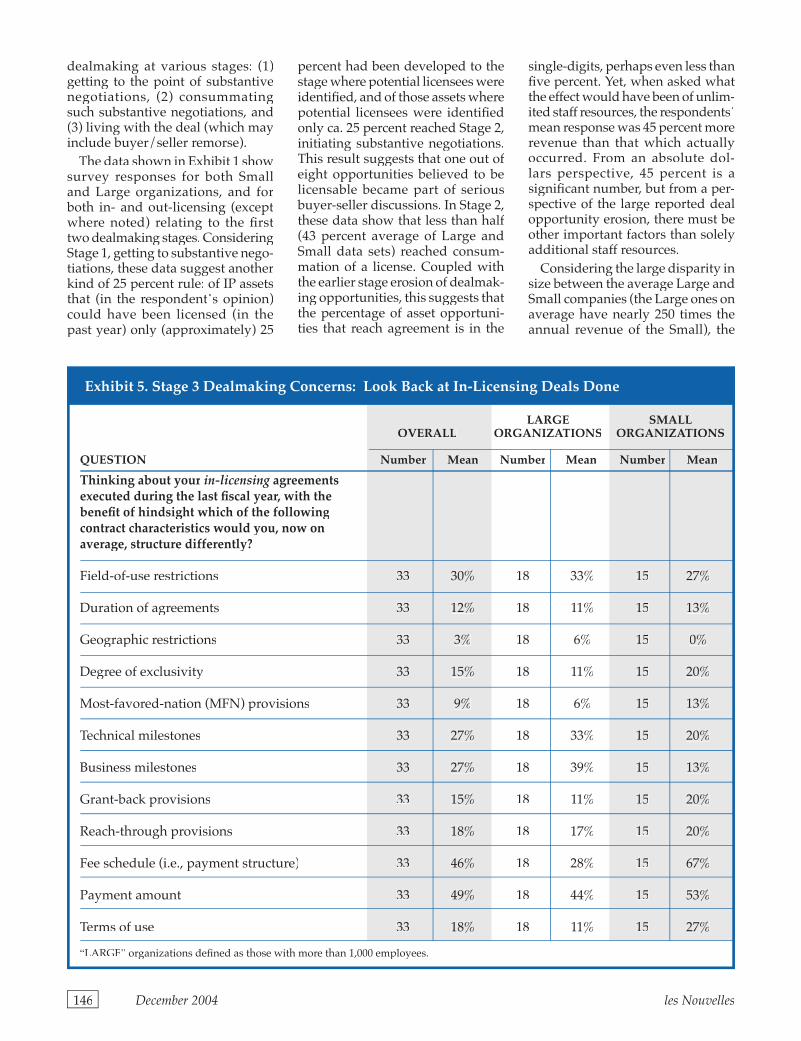
Thinking about your in-licensing agreements in-licensing agreements in-licensingexecuted during the last fi scal year, with the benefi t of hindsight which of the following contract characteristics would you, now on average, structure differently?
Field-of-use restrictions 33 30% 18 33% 15 27%
Duration of agreements 33 12% 18 11% 15 13%
Geographic restrictions 33 3% 18 6% 15 0%
Degree of exclusivity 33 15% 18 11% 15 20%
Most-favored-nation (MFN) provisions 33 9% 18 6% 15 13%
Technical milestones 33 27% 18 33% 15 20%
Business milestones 33 27% 18 39% 15 13%
Grant-back provisions 33 15% 18 11% 15 20%
Reach-through provisions 33 18% 18 17% 15 20%
Fee schedule (i.e., payment structure) 33 46% 18 28% 15 67%
Payment amount 33 49% 18 44% 15 53%
Terms of use 33 18% 18 11% 15 27%
“LARGE” organizations defi ned as those with more than 1,000 employees.
Exhibit 5. Stage 3 Dealmaking Concerns: Look Back at In-Licensing Deals Done
les Nouvelles December 2004 147
LARGE SMALL OVERALL ORGANIZATIONS ORGANIZATIONS
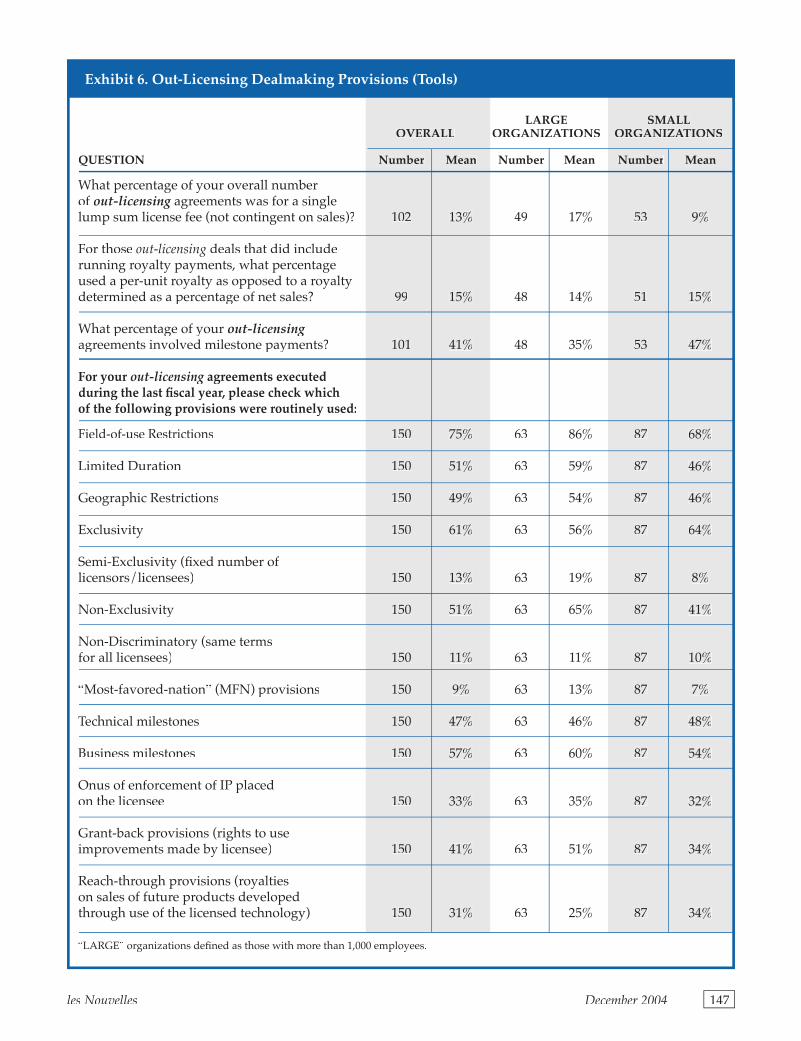
QUESTION Number Mean Number Mean Number Mean
What percentage of your overall number of out-licensing agreements was for a single out-licensing agreements was for a single out-licensinglump sum license fee (not contingent on sales)? 102 13% 49 17% 53 9%
For those out-licensing deals that did include running royalty payments, what percentage used a per-unit royalty as opposed to a royalty determined as a percentage of net sales? 99 15% 48 14% 51 15%
What percentage of your out-licensingagreements involved milestone payments? 101 41% 48 35% 53 47%
For your out-licensing agreements executed out-licensing agreements executed out-licensingduring the last fi scal year, please check which of the following provisions were routinely used:
Field-of-use Restrictions 150 75% 63 86% 87 68%
Limited Duration 150 51% 63 59% 87 46%
Geographic Restrictions 150 49% 63 54% 87 46%
Exclusivity 150 61% 63 56% 87 64%
Semi-Exclusivity (fi xed number of licensors/licensees) 150 13% 63 19% 87 8%
Non-Exclusivity 150 51% 63 65% 87 41%
Non-Discriminatory (same terms for all licensees) 150 11% 63 11% 87 10%
“Most-favored-nation” (MFN) provisions 150 9% 63 13% 87 7%
Technical milestones 150 47% 63 46% 87 48%
Business milestones 150 57% 63 60% 87 54%
Onus of enforcement of IP placed on the licensee 150 33% 63 35% 87 32%
Grant-back provisions (rights to use improvements made by licensee) 150 41% 63 51% 87 34%
Reach-through provisions (royalties on sales of future products developed through use of the licensed technology) 150 31% 63 25% 87 34%
“LARGE” organizations defi ned as those with more than 1,000 employees.
Exhibit 6. Out-Licensing Dealmaking Provisions (Tools)
les NouvellesDecember 2004148
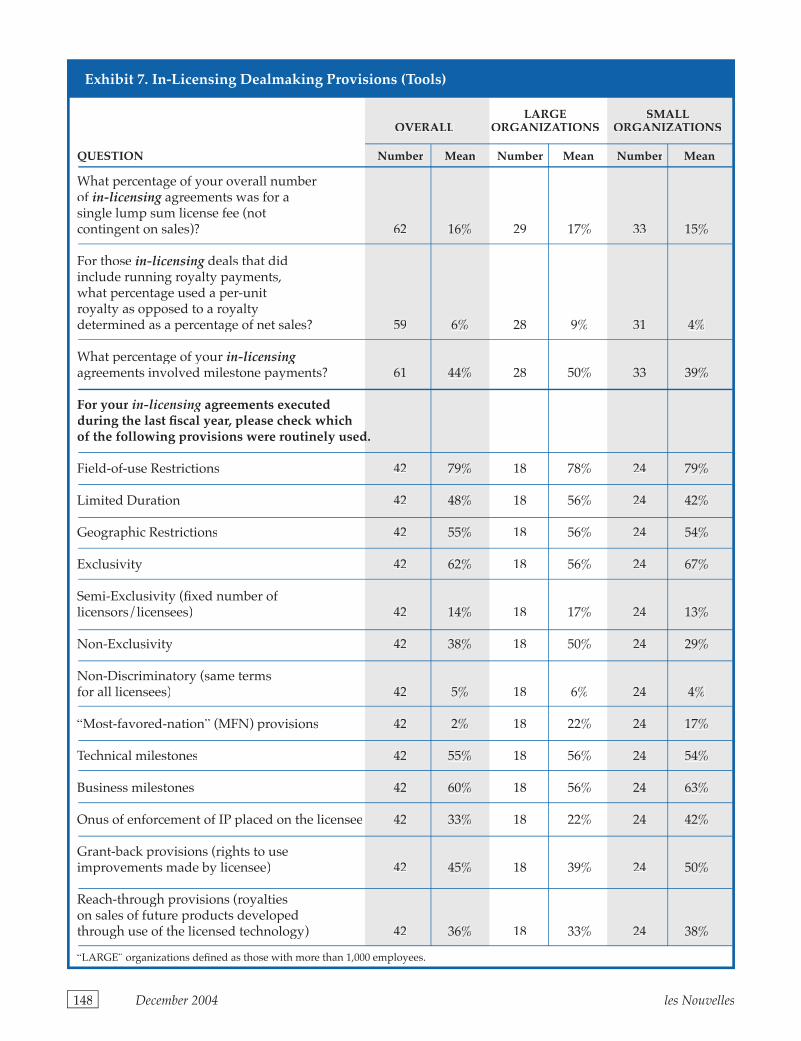
Exhibit 7. In-Licensing Dealmaking Provisions (Tools)
LARGE SMALL OVERALL ORGANIZATIONS ORGANIZATIONS
QUESTION Number Mean Number Mean Number Mean
What percentage of your overall number of in-licensing agreements was for a in-licensing agreements was for a in-licensingsingle lump sum license fee (not contingent on sales)? 62 16% 29 17% 33 15%
For those in-licensing deals that did in-licensing deals that did in-licensinginclude running royalty payments, what percentage used a per-unit royalty as opposed to a royalty determined as a percentage of net sales? 59 6% 28 9% 31 4%
What percentage of your in-licensingagreements involved milestone payments? 61 44% 28 50% 33 39%
For your in-licensing agreements executed in-licensing agreements executed in-licensingduring the last fi scal year, please check which of the following provisions were routinely used.of the following provisions were routinely used.
Field-of-use Restrictions 42 79% 18 78% 24 79%
Limited Duration 42 48% 18 56% 24 42%
Geographic Restrictions 42 55% 18 56% 24 54%
Exclusivity 42 62% 18 56% 24 67%
Semi-Exclusivity (fi xed number of licensors/licensees) 42 14% 18 17% 24 13%
Non-Exclusivity 42 38% 18 50% 24 29%
Non-Discriminatory (same terms for all licensees) 42 5% 18 6% 24 4%
“Most-favored-nation” (MFN) provisions 42 2% 18 22% 24 17%
Technical milestones 42 55% 18 56% 24 54%
Business milestones 42 60% 18 56% 24 63%
Onus of enforcement of IP placed on the licensee 42 33% 18 22% 24 42%
Grant-back provisions (rights to use improvements made by licensee) 42 45% 18 39% 24 50%
Reach-through provisions (royalties on sales of future products developedthrough use of the licensed technology) 42 36% 18 33% 24 38%
“LARGE” organizations defi ned as those with more than 1,000 employees.
difference in response to the ques-tions in Exhibit 1 is small, but in some cases it may be significant.Small companies appear to have had more diffi culty fi nding potential licensees (canʼt get the attention of the right parties?), and Large ones more diffi culty in consummating negotiations (because theyʼre more demanding?). On the question of the effect of unlimited resources, and getting from identifi ed potential li-censees to the start of negotiations, the Large and Small companies report the same percentages.
The responses of Exhibit 2 look more closely at the inability to get from the point of potential licensee identifi cation in Stage 1 to onset of Stage 2 (negotiations). For out-licens-ing, the number one factor was insuf-fi cient licensing resources reported by 28 percent of the respondents, with, interestingly, no difference between Large and Small entities.For in-licensing (for which we are dealing with very small datasets), the number one impediment was internal approvals (27 percent) with again little if any difference between Large and Small companies. Get-ting internal approvals was the 2nd most important factor for out-licens-ing (14 percent), but apparently half as common a problem than fi nding necessary resources. Concerns about the licenseeʼs ability to enforce the IP was also a relatively low concern (in frequency) but occurs more often for Small companies than for Large. This result may be due to Small companies having earlier and less developed IP. Regulatory concerns were the least important of these four factors for both size categories and of lesser importance to Small companies than to Large.Concerns about IP enforceability of the IP owner/licensor in in-licensing contexts show that Large companies appear to give this far more weight than small companies. This is an ap-proximate reversal of the reported percentages in an out-licensing con-text, where Small companies report a substantially higher frequency of concern regarding the licenseeʼs ability to enforce.
Exhibit 3 shows dealmaking break
-down within Stage 2, namely the in-ability to consummate negotiations that have begun. For out-licensing, the top four factors, ranging in frequency of citation from 17 to 26 percent were the inability to arrive at mutually acceptable fi nancial and non-fi nancial terms, with fi nancial barriers slightly more important, and the effect of delays and incon-sistent positions of internal stake-holders. So the common tagline of dealmaking failure—“show me the money!”—appears to be somewhat valid (it was the highest cited fac-tor), but there were three other fac-tors almost as important. For Small companies, the non-fi nancial terms and inconsistent position of internal stakeholders were more commonly cited than for Large companies. Of far lesser importance for both Small and Large companies, ranging in frequency of cause of breakdown from four to seven percent, were the effects of too many entities in the negotiation (such as a three-way, or more, deal participants), the un-availability of other useful IP, and IP rights disputed by a third party. For in-licensing contexts, the data are similar with the notable exception that nearly one third of the time the negotiation diffi culties were really about the money, for both Small and Large companies. All other factors were substantially lower in impor-tance. Also an interesting difference was a reversal of the perceptions of Large and Small companies with respect to non-financial terms in comparison to out-licensing con-texts: in out-licensing, the issue of non-fi nancial terms was cited more frequently by Small companies, but in in-licensing, it was cited more by Large companies. This is likely due to the prevalence of Small compa-nies more engaged in out-licensing (relatively speaking) and Large in in-licensing. Another factor for which such reversal is observed is the adverse effect of inconsistent positions of internal stakeholders, likely for the same reason: the buyer-seller roles are reversed.
Moving to Stage 3, living with the deal done, Exhibit 4 and 5 show the surveyʼs results for out-licensing
and in-licensing, respectively. In both contexts the question sought to examine near term, less-than-one year post-deal, satisfaction with the deal done. This presented a kind of JD Powers “how are you liking your new car?” perspective. When considering these data we should be reminded that deals are not (nor-mally) like victories, where there is literally a winner-take-all outcome.Deals require by their nature a mu-tuality of agreement, which casts a shadow, and sometimes a pall, over oneʼs aspirations. The parties usually recognize this situation by feeling somehow that the deal was a tie, not a victory, and yet both sides are benefi ted by the outcome com-pared to no deal. Put another way, in some ways dealmaking exhibits the famous fi ve phases popularized by Elisabeth Kübler-Ross associated with grieving, even bereavement:denial, anger, bargaining, depres-sion, and (fi nally) acceptance. If so, one would think that dealmakers looking back on less than year-old deals would exhibit a high degree of acceptance, expressed by low fre-quency responses as to provisions or characteristics that they would now “on average structure differ-ently.” Yet, the data of Exhibit 4 and 5 show a relatively high frequency identifi cation of deal characteristics that the respondent would now do differently, presumably because of both a more detached perspective away from the negotiating table and also the availability of new informa-tion from both sides of the deal.24
Looking at Exhibit 4, hindsight perspectives of out-licensing deals done, responses to 12 factors show double-digit frequencies for 11 of these factors. Only MFN provisions are in single digits, and eight of the factors are reported at percentages
les Nouvelles December 2004 149
24. Another possible explanation is that these data include the perspective of deals that were done but not with the participation of the re-spondent. In such cases, because deals are compromises not victories, it would not be unexpected that a respondent would have a generally-critical perspective, not having been at the table and faced with the necessary horse-trading to reach an agreement.
of 20 percent or greater. Three of the factors are at percentages above 33 percent, and one was greater than 50 percent. This does not look like Kübler-Ross phase-5 “acceptance;”it is more like phase-4 “depression,”which does indeed sometimes follow “bargaining.” The top three factors reported at percentages from 34 to 55 percent all relate to “show me the money!”: fee schedule (55 percent), business milestones (44 percent), and payment amount (34 percent). It looks like the seller is most unhappy about the timing of payments, then perhaps the business events that trigger such payments, and is also quite unhappy about the magnitude of the payment, all from a less-than-one-year perspective. Given the time period of the question such disap-pointment is unlikely to be about royalty payments. Is it sublicensing activities and splits there from? Is it lack of licensee implementation? Next are six factors with reported frequen-cies ranging from 16 to 27 percent:degree of exclusivity (27 percent), technical milestones (24 percent), grant-back provisions (22 percent), fi eld-of-use restrictions (21 percent), terms of use (20 percent), and dura-tion of agreements (16 percent). The technical milestone concerns are likely related to the payment trig-gering events associated with the top three factors, but it is interesting that business milestones were a greater concern than technical milestones (44 percent vs. 24 percent) by almost a two-to-one ratio. Concerns regard-ing exclusivity, fi eld-of-use, duration, terms of use, and grant-back may all relate to a form of seller remorse whereby the loss of what has been sold is more keenly felt than had been expected; perhaps this is a dealmak-ing version of “absence makes the heart grow fonder,” or the aphorism that the only time youʼll ever miss something is just after you tossed it out. The fi nal three factors ranged from a low of six percent (MFN provisions) to ten percent (reach-through provisions) and 11 percent (geographic restrictions).
These data of Exhibit 4 also showa dramatic difference between Large and Small companies. For two of the
factors there is a 16 and 18 point dif-ference between the two category responses. Concerns about field-of-use restrictions and fee schedule where of greater importance to Large companies by 18 and 16 point differ-ences, respectively. There were six additional factors where the differ-ence in response by Large and Small companies was between eight and 10 points: three where Large companies were more concerned (geographic re-strictions, MFN, and terms of use), and three that Small companies cited signifi cantly more often (degree-of-exclusivity, technical milestones, and grant-back provisions).
Exhibit 5 provides parallel data to Exhibit 4 but for in-licensing. As with other in-licensing questions, there were substantially fewer re-spondents, making interpretation more problematic. In the highest frequency category were also fee schedule and payment amount, but here payment amount was the #1 factor at nearly 50 percent (49 percent), and fee schedule was close behind at 46 percent. With re-spect to out-licensing, the payment amount had been cited substantially less often, 34 percent, refl ecting per-haps the difference in perception be-tween paying and being paid. The next most frequent cluster ranging between 27 and 30 percent were business and technical milestones (both at 27 percent) and fi eld-of-use restrictions (30 percent). Business milestones appear to be less of a frequent concern for in-licensing (27 percent) than out-licensing (44 percent), again perhaps refl ecting on who is wearing what shoes. In the range of 12 to 18 percent were dura-tion (12 percent), degree of exclusiv-ity and grant-backs (15 percent), and reach-through and terms of use (18 percent). The responses concerning geographic restrictions (three per-cent) and MFN (nine percent) were in single digits.
Again the differences between Large and Small companies are striking with respect to certain factors. Small companies cited fee schedule concerns 67 percent of the time compared to 28 percent for Large companies, a difference
of 39 points. On the other hand Large companies cited business milestone 26 points more often than Small. The only other double-digit spreads were 13 points regarding technical milestones (also more of Large company concern) and a 16 point spread for terms of use (more of a Small company concern).DEALMAKING PROVISIONS (TOOLS)
Provisions, a common term of dealmaking art, somewhat like “pro-visions” as used in an expeditionary sense, are used to give the deal a de-signed life, anticipating the future and sometimes long-term needs and expectations of the respective parties.Switching metaphors, in pragmatic terms, provisions are really deal-maker tools. Well, what tools do our respondents use? Exhibit 6 and 7 give the frequency of use three common IP payment forms and 13 dealmak-ing provisions for out-licensing and in-licensing, respectively.
Perhaps most surprising from these data is the frequency of use of both grant-back and reach-through provisions, 41 percent and 31 percent, respectively, for out-licensing and even somewhat greater percentage for in-licensing (45 and 36 percent).Perhaps also a little surprising is the frequency of geographic restrictions:in this small/one-world, spaceship earth, global economy, international-ization era about half the agreements (49 percent for out-licensing and 55 percent for in-licensing) evidence geographic restrictions.
One of the interesting issues in-nate to dealmaking is the question of the licenseeʼs unbounded com-mercial application of the subject technology. Normally, licenseeʼs want the unfettered use of the li-censed subject matter so that it can follow the market like a sunfl ower the sun, productizing and re-shap-ing the opportunity in whatever way the market values. The data of Exhibit 6 and 7 suggest that such unbounded freedom is granted by the seller far less often: 75 and 79 percent of the time there are fi eld-of-use restrictions, for out-licensing and in-licensing, respectively.
les NouvellesDecember 2004150
Not shown in these data are some notable differences in respondents for the “healthcare” industry versus, say, electronics, with respect to the use of single lump sum license fees.As might be expected, the healthcare industry makes comparatively less use of paid up licenses, whereas paid up licenses have been commonly done in the electronics industry. In a similar fashion, the healthcare in-dustry commonly uses royalty rates expressed as a percentage of sales whereas (for example) the electron-ics industry when it does make use of running royalties it more-frequently does so on some form of per-unit ba-sis. Following this trend, the use of milestone payments is very common in healthcare, and relatively uncom-mon in electronics. This is believed to refl ect the longer time-to-market and perhaps also the ready demarcation of various FDA stage approvals in the health care sector.WHATʼS NEXT: FUTURE SURVEYS
Returning to the introductory discussion, our data for 2003 sim-ply was not suffi ciently extensive to even hint at the answer to the question of the size of the licensing industry. As stated at the outset, we surveyed only the members of LES (USA & Canada) with e-mail addresses. We made no attempt to singularize the reporting for any given company (i.e., making sure we were not double counting revenues) or assuring that every company of reasonable size reported (under confi dence) their data. These tasks would be diffi cult to accomplish.25
Further, our sample set was useful, we believe, for the observations made here, but insuffi cient to make statistically reliable inferences about aggregate licensing activity.
A more expansive report of these
2004 results is expected to be pub-lished. The Foundation Web site will provide updated information on the availability of such additional infor-mation: www.licensingfoundation.org.
The original long-term objective of the Foundationʼs initial attempt was to catalyze a more comprehen-sive understanding of this impor-tant industry, to capture not only its scale, but also its dynamism.We asked the respondents in the subject survey what questions we should have asked and did not, and we received many interesting responses, such as:
• “What percent of your IP do you present license-out? Being the licensing professional in our business I always try to maximize this while [S]BU people try to minimize it.”
• “How do you market your technology for licensing?”
• “What was the value of the deals that were done? What clinical phase were the products at the time of the license?”
• “Royalty rates paid or negoti-ated.”
• “How long between when the technology was licensed and when the fi rst commercial application was released?”
• “What was the value of the competitive advantage provided by the new licensed technology?”
• “For most of these deals, the post deal management aspect is overlooked.”
• “What state of readiness for commerce when the technology that were investigated? Transacted?”
• “How often did you use refer-ence materials on royalty rates? How often did you use [various] valuation techniques and what techniques were employed most often?”
• “Percentage of out-licensing based on enforcement (stick) versus enticement (carrot)?”
• “Questions related to industrial sectors involved? (There is a big dif-ference).”
• “Splits between patents, trade-marks, copyrights, and trade secrets [licensing]?”
• “Use of reverse engineering to increase your licensing odds?”
• “Uncovered reasons for stalling in negotiations and letting deals die on the vine.”
This all, of course, leads to another survey. It is the Foundationʼs plan to conduct in January and Febru-ary 2005 a second survey built on the learnings of this one. We hope these results contribute to further understanding of certain aspects of our profession and industry and ask that everyone give strong consider-ation and support of the next survey to make next yearʼs results better.There is another trade at work here:your help in exchange for a better understanding of your industry. Is it a deal?ACKNOWLEDGEMENTS
The Foundation wishes to ac-knowledge the assistance of the Board of Directors of LES (USA & Canada) in providing counsel and testing of the survey, and its support and use of the e-mail directory. The Foundation also wishes to express thanks to Professors Cockburn and Agrawal for their services in prepar-ing the survey, making it available in electronic form, providing the raw output, and assisting in the in-terpretation and perspective of the results. Most of all the Foundation thanks the nearly 800 respondents who participated in the survey, especially those who worked their way to the end.
les Nouvelles December 2004 151
25. Although we did not attempt to constrain reporting to one-respondent/one-company, there were in fact no detectable duplicates; however, such duplicates could have occurred because invisible SBU-parent relationships.
University Controlled Or Owned Technology:The State Of Commercialization And Recommendations
BY MARK L. GORDON*
*Mark L. Gordon ([email protected]) is a partner at the law fi rm of Gordon & Glickson LLC (www.ggtech.com), which is devoted exclusively to providing strategic legal counsel to the technology market-places. The author wishes to express his grateful appreciation to Brian W. Farmer, research assistant and collaborator, my partner, Michael E.C. Moss, for his con-structive commentary and editorial talent and, my colleague, Derek A. Roach, for his editorial assistance. Previously published, “University Controlled or Owned Technol-ogy: The State of Commercialization and Recommendations,” University of Notre Dame, The Journal of College and Univer-sity LawVolume 30, Number 3; 2004.
les NouvellesDecember 2004152
University technology trans-fer is the process by which a university commercializes
inventions and innovations devel-oped by university faculty and re-searchers. Technology transfer takes many forms, from patent licensing to forming start-up ventures on cam-pus. University technology transfer programs are growing exponentially. Universities have long reflected upon, studied, and implemented transfer and commercialization pro-grams. However, due to current economic and legal realities, an in-tense, if not completely new, era has emerged. Universities are increasing their commitment to, and support of, commercialization programs. Policies and missions have been revisited and reshaped. Campus research is exploding with applied innovation. Faculty and students are being recruited by the strength and virtue of commercialization programs. Economic pressures and competition are intense. Opportu-nities, as well as pitfalls, abound in this complex fi eld. Universities that proceed with the proper bal-ance of aggressiveness, creativity, and prudence will realize the many benefits of university technolo-gy transfer.
I. History—the Opening of the EraUniversity technology transfer
did not gain real momentum in the United States until the early 1980s.1
Several forces have coalesced to raise the prominence and expansion of university technology transfer, not the least of which are the Bayh-Dole Act,2 the changing economy of the United States, and fi nancial pressures on universities coupled with the potential for pay-offs from transfer programs.The Numbers
The statistics clearly illustrate the explosive growth of university technology transfer activities over the past two decades.3 In 1980, uni-versities generated about $1 million in licensing revenue.4 According to the most recent Association of University Technology Managers (“AUTM”) survey for the year 2001,5
licensing revenue for survey respon-dents was $1.071 billion.6 In 1985, 589 new patents were awarded to aca-demia.7 AUTM survey respondents fi led 6,812 new patent applications8
and were issued 3,721 new patents in 2001.9 During the ten-year period from 1974 through 1984, universi-
1. This is not to say that university technol-ogy transfer was previously non existent. See Kenneth Sutherlin Dueker, Biobusiness on Campus: Commercialization of University-Developed Biomedical Technologies, 52 Food & Drug L.J. 453, 454-61 (1997) (briefl y discussing the history of university technology transfer prior to 1980). See also, Ned T. Himmelrich and Jonathan M. Holda, Technology Transfer Agreements: Donʼt Be an Amateuer, 34-Dec. Md. t Be an Amateuer, 34-Dec. Md. t Be an AmateuerBar J. 30, 31 (2001).2. 35 U.S.C. §§ 200-12 (1994).
3. In 1972, fewer than thirty universities had technology transfer programs. See Dueker, supra note 1, at 476. “Today nearly every research university in the country has a technology-licensing offi ce.” Eyal Press and Jennifer Washburn, “The Kept University,”The Atlantic Monthly, Mar. 2000, at pt. 3, p. 2, available at http://www.theatlantic.com/issues/2000/03/press.htm.4. See Association of University Technol-ogy Managers, AUTM Licensing Survey: FY 1994 Survey Summary and Selected Data FY 1991-FY 1994, at 27 (1995). The Association of University Technology Managers began conducting in-depth surveys of university technology transfer activities in 1991.
5. Respondents to the 2001 AUTM survey included 142 U.S. universities, 28 U.S. hos-pitals and research institutes, 27 Canadian institutions, and one third-party patent man-agement fi rm. Although the survey results did not cover all universities involved in technology transfer, nor only universities, it is nonetheless the most comprehensive study of technology transfer activities by universi-ties available to date and clearly illustrates the increase in university technology transfer activities. The survey respondents included 92 of the top 100 universities according to amount of money spent on research activi-ties annually. See Association of University Technology Managers, AUTM Licensing Sur-vey: FY 2001 Survey Summary, at 5 (2003), available at http://www.autm.net/surveys/01/01summarypublicversion.pdf [hereinafter 2001 01summarypublicversion.pdf [hereinafter 2001 01summarypublicversion.pdfAUTM Survey].6. See id. at 12. In 1995, AUTM survey re-spondents earned $424 million in licensing income. In 1997, AUTM survey respondents earned $611 million in licensing income.7. See National Science Board, Science and Engineering Indicators - 2000 ch. 6 (2000), available at http://www.nsf.gov/sbe/srs/seind00/access/c6/c6s4.htm.8. See 2001 AUTM Survey, supra note 5, at 7. AUTM survey respondents fi led 2,872 new patent applications in 1995 and 4,267 new patent applications in 1997.9. See id. AUTM survey respondents were issued 1,833 patents in 1995 and 2,645 in 1997.
ties granted about 1,000 licenses total.10 In 2001 alone, AUTM survey respondents reported the execution of 4,058 licenses and options.11 From 1980 through 1993, AUTM survey respondents were involved in the formation of a total of 1,169 start-up companies.12 In 2001 alone, survey respondents formed 494 start-up companies.13
The Bayh-Dole ActThe Bayh-Dole Act14 (the “Act”)
governs the commercialization of inventions and innovations resulting from research funded by the federal government. It was signed into law on December 12, 1980, and became effective in July 1981. The Act was a response to an increase in global competition in technology-related fi elds, and was also seen as a way for taxpayers to enjoy the benefi ts
of the investment they made in university-based research.15 Prior to the passage of the Act, govern-mental policies regarding owner-ship of inventions and innovations developed by entities with federal government funding lacked unifor-mity. Different federal agencies ap-plied different rules.16 One common element of all of these government agenciesʼ policies was that title to the inventions and innovations funded by the government was presumed to rest with the government.17 This presumption proved diffi cult and costly to overcome, meaning that universities rarely retained owner-ship of inventions and innovations developed by their researchers with federal government money.18
In passing the Act, Congress stated that it wanted to promote the com-mercialization and public availability of federally-funded inventions and innovations.19 In order to meet this objective, the Act, in most cases, al-lows recipients of federal funding to retain title to inventions developed with federal funding.20 Thus, univer-sities that develop inventions and in-
novations with federal government funding may license them to third parties and keep the proceeds.21
However, the university is required to grant the government a nonexclu-sive, irrevocable, paid-up license to utilize the invention throughout the world.22 The government is also giv-en “march-in rights” to help ensure that the public receives the benefi t of the invention. This right allows the government to revoke a universityʼs title to any invention or innovation if it is determined by the federal agency that funded the research that the universityʼs commercialization ef-forts have been inadequate.23
The Bayh-Dole Act is essential to universitiesʼ ability to commercialize inventions and innovations devel-oped by their researchers, because the majority of university research was, and is, funded by the federal government. AUTM survey respon-dents reported that 67% of their re-search expenditures for 2001 came from the federal government.24 Thus, without the Act, universities would have substantial diffi culties reaping
10. See General Accounting Offi ce, Patent Policy: Universitiesʼ Research Efforts Under Public Law 96-517, at 2 (1986).11. See 2001 AUTM Survey, supra note 5, at 9. In 1995, AUTM survey respondents executed 2,616 licenses and options. In 1997, AUTM survey respondents executed 3,328 licenses and options.12. See id. at 14.13. See id. AUTM survey respondents formed 223 start-ups in 1995 and 333 start-ups in 1997.14. 35 U.S.C. §§ 200-12 (1994). The Depart-ment of Commerce developed regulations for the Act, which are codifi ed in title the Code of Federal Regulations (37 C.F.R. pt. 401.1-401.16 (1997)).15. “Simply put, American efforts at innova-tion, in which we were once the undisputed world leader, were stagnating and falling behind those of other nations. There were a number of theories on the various causes of these problems, but clearly the United States needed to develop a more effective overall technology transfer policy. Senator Dole and I agreed that there was an opportunity in one particular area where we could begin the process of providing a comprehensive technology transfer policy for the United States. This was in the area of federally funded research conducted by universities and small businesses… The taxpayers were getting almost no return on their investment. We came to the realization that this failure to move from abstract research into useful com-mercial innovation was largely a result of the governmentʼs patent policy and we sought to draft legislation which would change this pol-icy in a way to quickly and directly stimulate the development and commercialization of inventions.” Hearings Before the Subcomm. On Patents, Copyrights and Trademarks of the Sen. Judiciary Comm., 103d Cong., 2d Sess. (1994), available in 1994 WL 14185684 (testimony of Sen. Birch Bayh).
16. See Association of University Technology Managers, AUTM Licensing Survey, FY 1991-FY 1995: A Five-Year Summary of Technology Licensing (and Related) Performance for U.S. and Canadian Academic and Nonprofi t Institu-tions, and Patent Management Firms (1997)[hereinafter 1997 AUTM Survey]. See also, Dueker, supra note 1, at 460 (noting that different regulations regarding ownership of inventions and innovations created with federal money were released by 26 separate federal agencies).17. See Dueker, supra note 1, at 460. If a uni-versity wished to retain rights in an inven-tion or innovation that resulted from research funded by a federal agency, the university would have to negotiate an arrangement with the funding agency.18. See id. A few universities, such as the University of Wisconsin-Madison, were able to structure patent agreements with various federal agencies that allowed them to retain rights in their inventions and innovations that resulted from research funded by those agencies, but the transaction costs and red tape involved in coming to such an arrange-ment were too much for most universities to overcome.19. See 35 U.S.C. § 200 (1994).20. See 35 U.S.C. § 202(a) (1994). In limited circumstances, the funding agreement may provide that the funding recipient may not elect to retain title.
21. A university must meet certain require-ments in order to enjoy the benefi ts of the Act. For instance, the university must disclose any invention to the federal agency within a rea-sonable time after its development, must elect whether or not to retain title to the invention within two years of disclosure, and must fi le a patent for the invention within the statutory period. See 35 U.S.C. § 202(c)(1)-(3) (1994).22. See 35 U.S.C. § 202(c)(4) (1994).23. See 35 U.S.C. § 203 (1994). In 1997, a pri-vate company, Cellpro, attempted to invoke the march-in provision. Cellpro sought to ob-tain a license for a stem-cell separation tech-nology that was developed by a researcher at The Johns Hopkins University under a grant from the National Institutes of Health (“NIH”). Cellpro wrote to the Secretary of the Department Of Health and Human Services and argued that march-in was warranted be-cause Johns Hopkins and its licensee, Baxter Healthcare, had failed to take reasonable steps to commercialize the technology and that government action was needed in order to alleviate health or safety needs that were not being met by Baxter. The NIH declined to initiate march-in proceedings, although it left open the possibility of march-in if new facts arose. See Offi ce of the Director, National Institutes of Health, Determination of Petition of Cellpro, Inc., (Aug. 1, 1997), available at http://www.nih.gov/news/pr/aug97/nihb-01.htm. See also Johns Hopkins Univ. v. Cellpro, 978 F. Supp. 184 (D. Del. 1997).24. See 2001 AUTM Survey, supra note 5, at 6.
les Nouvelles December 2004 153
the fi nancial benefi ts of a great deal of their research. Likewise, the public did not receive the full benefi t of this research prior to passage of the Act, because much of it was not made commercially available.25 The Bayh-Dole Act opened the door to a new era in which both universities and the general public are able to enjoy the fruits of research funded by the federal government.The Changing U.S. Economy
For much of the 20th century, the United States had an industrial economy based on large-scale pro-duction and manufacturing, such as automobile manufacturing. In 1960, manufacturing output was 27% of U.S. GDP and manufactur-ing jobs accounted for 31% of total employment in the U.S.26 As the twentieth century came to a close, however, some manufacturing ac-tivity had moved overseas and the manufacturing fi rms that remain in this country have become increas-ingly dependent on technology to increase productivity and remain competitive. By 1997, manufactur-ing output was 17% of GDP and, in 1998, manufacturing jobs accounted for 14.9% of total employment.27 A new type of American economy has emerged. The industries that have remained in the United States are more reliant and focused on scien-tifi c and technological innovation in fields such as biomedical and computer technology.28 With this shift, the type of scientifi c and tech-nology-related research conducted
at universities has become more directly relevant and important to the United Statesʼ economy. The passage of the Bayh-Dole Act repre-sented (among other things) a recog-nition of this shift. Private industry also recognized this trend and has signifi cantly increased its fi nancial support of university research.29
Many universities have responded by embracing technology transfer and pushing for the commercializa-tion of university-developed inven-tions and innovations.Economic Payoffs/Economic Pressures
University technology transfer is “hot.” Most universities are in-volved, and some generate a great deal of revenue from it.30 This fact, combined with the reality of budget cuts and economic pressures faced by many universities,31 has made success in technology transfer very important to many universities.
Clearly, the payoff for such success is potentially very signifi cant. This potential has proven attractive to many universities.
The reasons for the growth of uni-versity technology transfer, whether it be the Bayh-Dole Act, the chang-ing economy of the United States, economic realities at universities, or a combination of these factors, may be debatable,32 but it is hard to deny that it has grown at an amazing rate over the past two decades. A ques-tion remains debated passionately: Is this a good thing?II. Tension of Technology Trans-fer with Mission
Traditionally, it has been under-stood that universities have a two fold mission. First, universities are charged with educating their stu-dents, and second, universities are expected to conduct research for the benefi t of the public.33 Some argue that these missions can be, and in some cases are, compromised when private interests become involved in the research process and commer-cialization becomes the goal of re-search endeavors.34 Both universities and researchers stand to profi t from the successful commercialization of inventions and innovations. Is the traditional mission of universities and their faculty members compro-mised by this fact?Compromised Faculty?
Prior to the explosion in university technology transfer, it was generally presumed that university researchers toiled for the welfare of the general
25. While it was possible for a company to license technology from the federal govern-ment, the process to do so often proved too costly and cumbersome. “The bureaucratic red tape that accompanied any attempt at innovation was simply too great a disin-centive to any company seeking to license directly from the government.” See Howard W. Bremer, Testimony on the Effectiveness of the Bayh-Dole Act, 5 J. Assʼn U. Tech. Managers (1993), available at http://www.autm.net/pubs/journal/93/testimony93.html. Thus, a lot of important technology remained unused on the shelf, under the ownership of the federal government.26. See Michael Knetter, Trade Defi cits and the US Economy, Part II (Spring 2000), available at http://mba.tuck.dartmouth.edu/paradigm/spring2000/articles/knetter-economy2.html.27. See id.
28. See Robert D. Atkinson and Randolph H. Court, The New Economy Index: Understand-ing Americaʼs Economic Transformation (1998), available at http://www.neweconomyindex.org/index_nei.html. 29. In 1980, private industry funding ac-counted for 4% of university research ex-penditures. See General Accounting Offi ce,Patent Policy: Universitiesʼ Research Efforts Under Public Law 96-517, at 3 (1986). AUTM Under Public Law 96-517, at 3 (1986). AUTM Under Public Law 96-517survey respondents reported that 8% of their 2001 research expenditures came from private industry. See 2001 AUTM Survey, supra note 5, at 6. In 1997, U.S. companies spent $1.7 bil-lion on science and engineering research at universities, an increase of fi ve-fold over 1977 numbers. See David Shenk, “Money Science = Ethics Problems on Campus,”The Nation, Mar. 22 1999, available at http://www.thenation.com/doc.mhtml?i=19990322&s=shenk.30. For instance, in 1993 alone, Stanford Uni-versity earned $24.5 million from its patent on recombinant DNA. See Victoria Slind-Flor, “The Trouble With Techno Transfers, The Natʼl L.J.,” Oct. 3, 1994. The University of Florida generates millions of dollars each year from Gatorade. See David Villano, “Big Money on Campus,” Fla. Trend, Dec. 1, 1995, at 66, available in 1995 WL 8683002. The Univer-sity of California earned over $57 million in royalties in 1995 from 548 revenue-generating licenses. See 1997 AUTM Survey, supra note 16, at 44. Michigan State University brought in over $15 million from 42 licenses in that same year. See id.31. See Elizabeth Zeman, “Budget Cuts Hit Public Universities,”Daily Illini, Jan. 16, 2002, available at http://www.uwire.com/content/topnews011602001.html (briefly discussing universities that are facing budget cuts and other fi nancial problems).
32. See, e.g., Tamsen Valoir, Government Funded Inventions: “The Bayh-Dole Act and the Hopkins v. Cellpro March-In Rights Contro-versy,” 8 Tex. Intell. Prop. L.J. 211, 234-37 (2000) (questioning whether the Bayh-Dole Act has played an important role in the growth of university technology transfer).33. See Hans Wiesendanger, A History of OTL Overview, available at http://otl.stanford.edu/about/resources/history.html.34. See generally Shenk, supra note 29 and Press, supra note 3 (discussing many prob-lems inherent to industry support of aca-demic research). But see Dueker, supra note 1, at 470-71 (suggesting that industry does not necessarily have a corrupting infl uence on academics).
les NouvellesDecember 2004154
public, without regard to the com-mercial potential of their discover-ies. More recently, however, it has become clear that this is not always the case. A consequence of increased university commercialization is that the professor/entrepreneur is be-coming more and more common, and for good reason. Responsible faculty members now usually receive a portion of any revenue generated by their inventions or innovations.35
The Bayh-Dole Act requires that the inventor receive some share, albeit an indeterminate one, of the revenue generated from his invention or in-novation developed with federal funding.36 A study from 2000 found that 28% of life sciences faculty at universities received private spon-sor funding, 15% held equity in the private sponsor, 33% were engaged in paid consulting arrangements, and 32% held board positions.37
University researchers often have a direct fi nancial stake in the outcome of their research. Some critics argue that this fact creates confl icts of in-terest that can compromise their re-search.38 Some critics even argue that university researchers sometimes choose their research topics based
on the short-term commercial poten-tial of the subject and that, because of this, important areas of research with less commercial appeal are often ignored.39 On the other hand, a study by Professor David Blumen-thal suggests that, instead of having a corrupting influence on faculty members, university commercializa-tion actually has a positive impact. The study concluded that biomedical faculty who were involved in tech-nology commercialization taught no less, published more, produced more patented discoveries, and served in more administrative capacities than faculty not involved in technology transfer activities.40
Another matter of concern com-monly raised by critics of univer-sity technology transfer is that the free fl ow of ideas in the academic world is stifled by the focus on commercialization of inventions and innovations. Many in the academic community insist that it is impera-tive that discoveries are published immediately and that information is shared openly.41 Companies that work with university researchers, on the other hand, often demand delays in the publication and sharing
of discoveries and ideas.42 In order to protect the value of proprietary information, it is often necessary to avoid publication, or other forms of sharing of information and data, until proper intellectual property protection is in place. In the United States, a patent cannot be issued for an invention or innovation if it has been described in a printed publi-cation more than one year before a patent application is fi led with the Patent and Trademark Offi ce.43 This one-year grace period is not even available in some foreign countries, meaning that any sort of publication can lead to the loss of intellectual property rights if steps are not tak-en to protect them.44 Likewise, any ownership or rights in trade secrets, or “know-how,” can be lost if not properly protected before the infor-mation is shared with other parties.45
The National Institutes of Health has developed guidelines suggesting that universities not allow compa-nies to delay publication for more than two months,46 but lengthier delays are not uncommon.47
Many universities, along with their faculty members, have re-acted to these concerns by adopting conflict-of-interest policies. These policies attempt to avoid confl icts of interest as much as possible, and to ensure that those confl icts that do arise do not taint research outcomes.48
Compromised Universities?While university-industry partner-
ships have become quite common,49
some believe that a serious confl ict in
35. See Peter D. Blumberg, From “Publish or Perish” to “Profi t or Perish”: Revenues from University Technology Transfer and the S 501(C)(3) Tax Exemption, 145 U. Pa. L. Rev. 89, 101 (1996). For example, inventors at Stanford University receive 33% of the net royalties received on their licensed inventions (see Wi-esendanger, supra note 33), while inventors at the University of Notre Dame receive 50% of royalty revenues after university borne ex-penses are covered (see University of Notre Dame Offi ce of Research, Frequently Asked Questions in Technology Transfer, available at http://www.nd.edu/~research/techtransfer/ttfaq.html). Such arrangements, which were rare in the past, are now common at universi-ties with technology transfer programs.36. See 35 U.S.C. § 202(c)(7)(B) (1994). “[The university shall] share royalties with the inventor.”37. See Elizabeth A. Boyd and Lisa A. Bero, “Assessing Faculty Financial Relationships With Industry: A Case Study,” 284 JAMA2209, 2209-10 (2000). 38. See Shenk, supra note 29 (discussing ex-amples of academic research being tainted, and researchers being pressured to change research results, by companies that sponsor the research).
39. See id. (“Scientists sometimes may not pursue drugs or tests that lack obvious short-term markets”). See also Press, supranote 3, part 3. Some critics also contend that the drive toward commercialization has skewed academic research away from basic research to applied research. National Science Foundation statistics show that this argument is weak, however. The composition of academic research has remained consistent since 1980 with about 66% of research being basic science, although this is down from 77% in the early 1970s. See Richard Florida, “The Role of the University: Leveraging Talent, Not Technology,” Issues in Sci. & Tech., Summer 1999, available at http://www.nap.edu/issues/15.4/fl orida.htm.40. See David Blumenthal, et. al, “University-Industry Research Relationships in Biotech-nology: Implications for the University,” 232 Sci. 1361 (1986).41. “One of the basic tenets of science is that we share information in an open way. As biotech and pharmaceutical companies have become more involved in funding research, thereʼs been a shift toward confi dentiality that is severely inhibiting the interchange of information.” Press, supra note 3, part 2 (quoting Steven Rosenberg, National Cancer Institute).
42.See Press, supra note 3, part 2.43. See 35 U.S.C. § 102(b).44. See Dueker, supra note 1, at 473.45. See id. This type of protection, unlike patent protection, which lasts 20 years from when the patent application is fi led, lasts indefi nitely.46.See Shenk, supra note 29.47.See Press, supra note 3, part 2. See also Shenk, supra note 29.48.See Peter J. Harrington, “Faculty Confl icts of Interest in an Age of Academic Entrepre-neurialism: An Analysis of the Problem, the Law and Selected University Policies,” 27 J.C. & U.L. 775 (2001) (discussing the fac-ulty confl ict-of-interest policies of several universities).
les Nouvelles December 2004 155
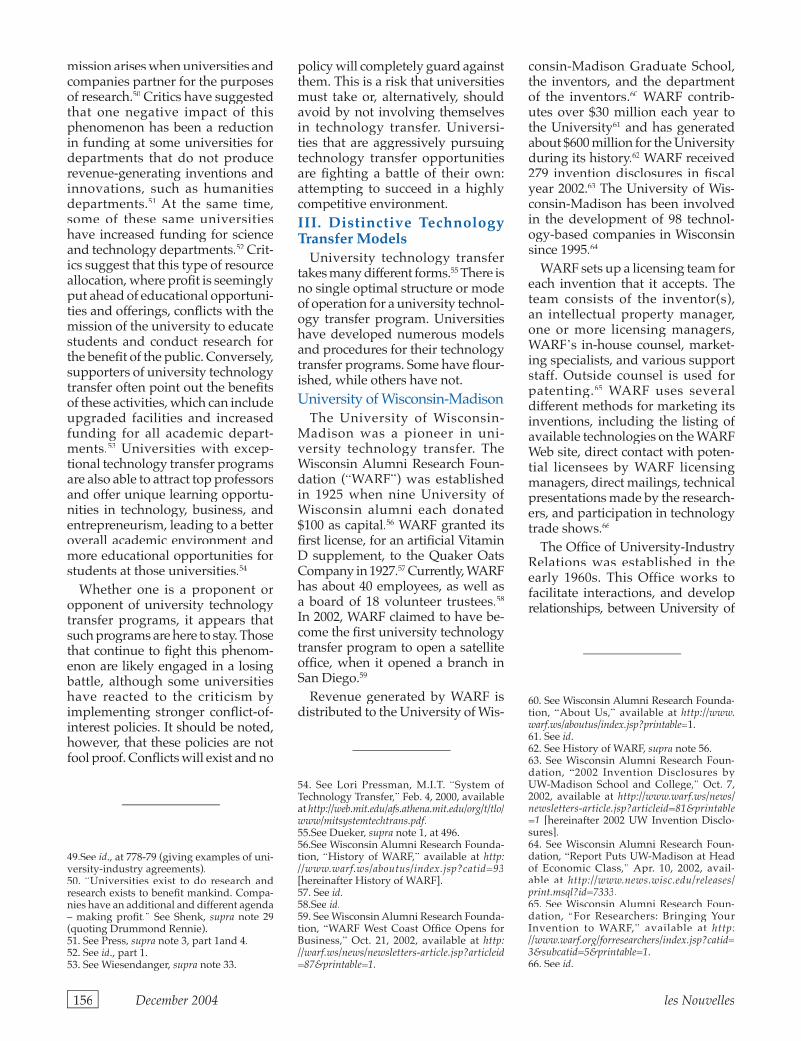
mission arises when universities and companies partner for the purposes of research.50 Critics have suggested that one negative impact of this phenomenon has been a reduction in funding at some universities for departments that do not produce revenue-generating inventions and innovations, such as humanities departments.51 At the same time, some of these same universities have increased funding for science and technology departments.52 Crit-ics suggest that this type of resource allocation, where profi t is seemingly put ahead of educational opportuni-ties and offerings, confl icts with the mission of the university to educate students and conduct research for the benefi t of the public. Conversely, supporters of university technology transfer often point out the benefi ts of these activities, which can include upgraded facilities and increased funding for all academic depart-ments.53 Universities with excep-tional technology transfer programs are also able to attract top professors and offer unique learning opportu-nities in technology, business, and entrepreneurism, leading to a better overall academic environment and more educational opportunities for students at those universities.54
Whether one is a proponent or opponent of university technology transfer programs, it appears that such programs are here to stay. Those that continue to fi ght this phenom-enon are likely engaged in a losing battle, although some universities have reacted to the criticism by implementing stronger confl ict-of-interest policies. It should be noted, however, that these policies are not fool proof. Confl icts will exist and no
policy will completely guard against them. This is a risk that universities must take or, alternatively, should avoid by not involving themselves in technology transfer. Universi-ties that are aggressively pursuing technology transfer opportunities are fi ghting a battle of their own: attempting to succeed in a highly competitive environment.III. Distinctive Technology Transfer Models
University technology transfer takes many different forms.55 There is no single optimal structure or mode of operation for a university technol-ogy transfer program. Universities have developed numerous models and procedures for their technology transfer programs. Some have fl our-ished, while others have not.University of Wisconsin-Madison
The University of Wisconsin-Madison was a pioneer in uni-versity technology transfer. The Wisconsin Alumni Research Foun-dation (“WARF”) was established in 1925 when nine University of Wisconsin alumni each donated $100 as capital.56 WARF granted its fi rst license, for an artifi cial Vitamin D supplement, to the Quaker Oats Company in 1927.57 Currently, WARF 57 Currently, WARF 57
has about 40 employees, as well as a board of 18 volunteer trustees.58
In 2002, WARF claimed to have be-come the fi rst university technology transfer program to open a satellite offi ce, when it opened a branch in San Diego.59
Revenue generated by WARF is distributed to the University of Wis-
consin-Madison Graduate School, the inventors, and the department of the inventors.60 WARF contrib-utes over $30 million each year to the University61 and has generated about $600 million for the University during its history.62 WARF received 279 invention disclosures in fi scal year 2002.63 The University of Wis-consin-Madison has been involved in the development of 98 technol-ogy-based companies in Wisconsin since 1995.64
WARF sets up a licensing team for each invention that it accepts. The team consists of the inventor(s), an intellectual property manager, one or more licensing managers, WARFʼs in-house counsel, market-ing specialists, and various support staff. Outside counsel is used for patenting.65 WARF uses several different methods for marketing its inventions, including the listing of available technologies on the WARF Web site, direct contact with poten-tial licensees by WARF licensing managers, direct mailings, technical presentations made by the research-ers, and participation in technology trade shows.66
The Offi ce of University-Industry Relations was established in the early 1960s. This Office works to facilitate interactions, and develop relationships, between University of
49.See id., at 778-79 (giving examples of uni-versity-industry agreements).50. “Universities exist to do research and research exists to benefi t mankind. Compa-nies have an additional and different agenda – making profi t.” See Shenk, supra note 29 (quoting Drummond Rennie).51. See Press, supra note 3, part 1and 4.52. See id., part 1.53. See Wiesendanger, supra note 33.
54. See Lori Pressman, M.I.T. “System of Technology Transfer,” Feb. 4, 2000, available at http://web.mit.edu/afs.athena.mit.edu/org/t/tlo/www/mitsystemtechtrans.pdf.www/mitsystemtechtrans.pdf.www/mitsystemtechtrans.pdf55.See Dueker, supra note 1, at 496.56.See Wisconsin Alumni Research Founda-tion, “History of WARF,” available at http://www.warf.ws/aboutus/index.jsp?catid=93[hereinafter History of WARF].57. See id.58.See id.59. See Wisconsin Alumni Research Founda-tion, “WARF West Coast Offi ce Opens for Business,” Oct. 21, 2002, available at http://warf.ws/news/newsletters-article.jsp?articleid=87&printable=1.
60. See Wisconsin Alumni Research Founda-tion, “About Us,” available at http://www. warf.ws/aboutus/index.jsp?printable=1.61. See id.62. See History of WARF, supra note 56.63. See Wisconsin Alumni Research Foun-dation, “2002 Invention Disclosures by UW-Madison School and College,” Oct. 7, 2002, available at http://www.warf.ws/news/newsletters-article.jsp?articleid=81&printable=1 [hereinafter 2002 UW Invention Disclo-sures].64. See Wisconsin Alumni Research Foun-dation, “Report Puts UW-Madison at Head of Economic Class,” Apr. 10, 2002, avail-able at http://www.news.wisc.edu/releases/print.msql?id=7333.65. See Wisconsin Alumni Research Foun-dation, “For Researchers: Bringing Your Invention to WARF,” available at http://www.warf.org/forresearchers/index.jsp?catid=3&subcatid=5&printable=1.66. See id.
les NouvellesDecember 2004156
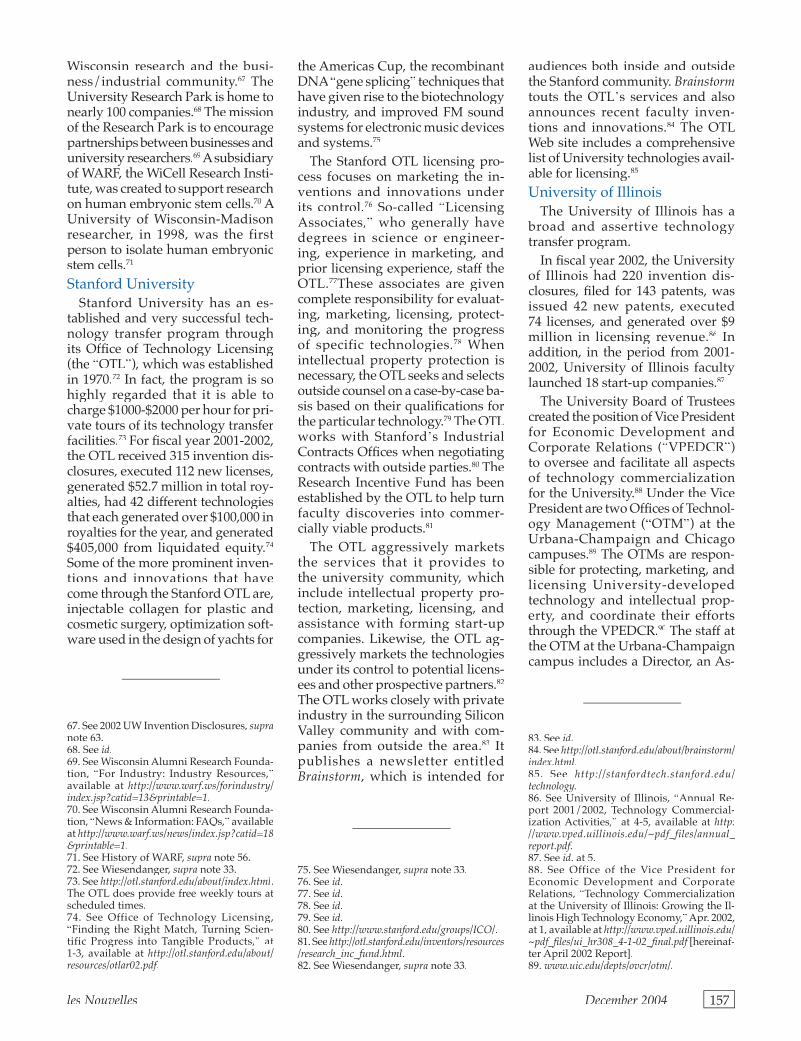
Wisconsin research and the busi-ness/industrial community.67 The University Research Park is home to nearly 100 companies.68 The mission of the Research Park is to encourage partnerships between businesses and university researchers.69 A subsidiary of WARF, the WiCell Research Insti-tute, was created to support research on human embryonic stem cells.70 A University of Wisconsin-Madison researcher, in 1998, was the first person to isolate human embryonic stem cells.71
Stanford UniversityStanford University has an es-
tablished and very successful tech-nology transfer program through its Offi ce of Technology Licensing (the “OTL”), which was established in 1970.72 In fact, the program is so highly regarded that it is able to charge $1000-$2000 per hour for pri-vate tours of its technology transfer facilities.73 For fi scal year 2001-2002, the OTL received 315 invention dis-closures, executed 112 new licenses, generated $52.7 million in total roy-alties, had 42 different technologies that each generated over $100,000 in royalties for the year, and generated $405,000 from liquidated equity.74
Some of the more prominent inven-tions and innovations that have come through the Stanford OTL are, injectable collagen for plastic and cosmetic surgery, optimization soft-ware used in the design of yachts for
the Americas Cup, the recombinant DNA “gene splicing” techniques that have given rise to the biotechnology industry, and improved FM sound systems for electronic music devices and systems.75
The Stanford OTL licensing pro-cess focuses on marketing the in-ventions and innovations under its control.76 So-called “Licensing Associates,” who generally have degrees in science or engineer-ing, experience in marketing, and prior licensing experience, staff the OTL.77These associates are given complete responsibility for evaluat-ing, marketing, licensing, protect-ing, and monitoring the progress of specific technologies.78 When intellectual property protection is necessary, the OTL seeks and selects outside counsel on a case-by-case ba-sis based on their qualifi cations for the particular technology.79 The OTL works with Stanfordʼs Industrial Contracts Offi ces when negotiating contracts with outside parties.80 The Research Incentive Fund has been established by the OTL to help turn faculty discoveries into commer-cially viable products.81
The OTL aggressively markets the services that it provides to the university community, which include intellectual property pro-tection, marketing, licensing, and assistance with forming start-up companies. Likewise, the OTL ag-gressively markets the technologies under its control to potential licens-ees and other prospective partners.82
The OTL works closely with private industry in the surrounding Silicon Valley community and with com-panies from outside the area.83 It publishes a newsletter entitled Brainstorm, which is intended for
audiences both inside and outside the Stanford community. Brainstormtouts the OTLʼs services and also announces recent faculty inven-tions and innovations.84 The OTL Web site includes a comprehensive list of University technologies avail-able for licensing.85
University of IllinoisThe University of Illinois has a
broad and assertive technology transfer program.
In fi scal year 2002, the University of Illinois had 220 invention dis-closures, fi led for 143 patents, was issued 42 new patents, executed 74 licenses, and generated over $9 million in licensing revenue.86 In addition, in the period from 2001-2002, University of Illinois faculty launched 18 start-up companies.87
The University Board of Trustees created the position of Vice President for Economic Development and Corporate Relations (“VPEDCR”) to oversee and facilitate all aspects of technology commercialization for the University.88 Under the Vice President are two Offi ces of Technol-ogy Management (“OTM”) at the Urbana-Champaign and Chicago campuses.89 The OTMs are respon-sible for protecting, marketing, and licensing University-developed technology and intellectual prop-erty, and coordinate their efforts through the VPEDCR.90 The staff at the OTM at the Urbana-Champaign campus includes a Director, an As-
67. See 2002 UW Invention Disclosures, supranote 63.68. See id.69. See Wisconsin Alumni Research Founda-tion, “For Industry: Industry Resources,”available at http://www.warf.ws/forindustry/index.jsp?catid=13&printable=1.70. See Wisconsin Alumni Research Founda-tion, “News & Information: FAQs,” available at http://www.warf.ws/news/index.jsp?catid=18&printable=1.71. See History of WARF, supra note 56.72. See Wiesendanger, supra note 33.73. See http://otl.stanford.edu/about/index.html. The OTL does provide free weekly tours at scheduled times.74. See Office of Technology Licensing, “Finding the Right Match, Turning Scien-tific Progress into Tangible Products,” at 1-3, available at http://otl.stanford.edu/about/resources/otlar02.pdf.resources/otlar02.pdf.resources/otlar02.pdf
75. See Wiesendanger, supra note 33.76. See id.77. See id.78. See id.79. See id.80. See http://www.stanford.edu/groups/ICO/.81. See http://otl.stanford.edu/inventors/resources /research_inc_fund.html.82. See Wiesendanger, supra note 33.
83. See id.84. See http://otl.stanford.edu/about/brainstorm/index.html.85. See http://stanfordtech.stanford.edu/technology.86. See University of Illinois, “Annual Re-port 2001/2002, Technology Commercial-ization Activities,” at 4-5, available at http://www.vped.uillinois.edu/~pdf_files/annual_report.pdf.87. See id. at 5.88. See Office of the Vice President for Economic Development and Corporate Relations, “Technology Commercialization at the University of Illinois: Growing the Il-linois High Technology Economy,” Apr. 2002, at 1, available at http://www.vped.uillinois.edu/~pdf_fi les/ui_hr308_4-1-02_fi nal.pdf [hereinaf-~pdf_fi les/ui_hr308_4-1-02_fi nal.pdf [hereinaf-~pdf_fi les/ui_hr308_4-1-02_fi nal.pdfter April 2002 Report].89. www.uic.edu/depts/ovcr/otm/.
les Nouvelles December 2004 157
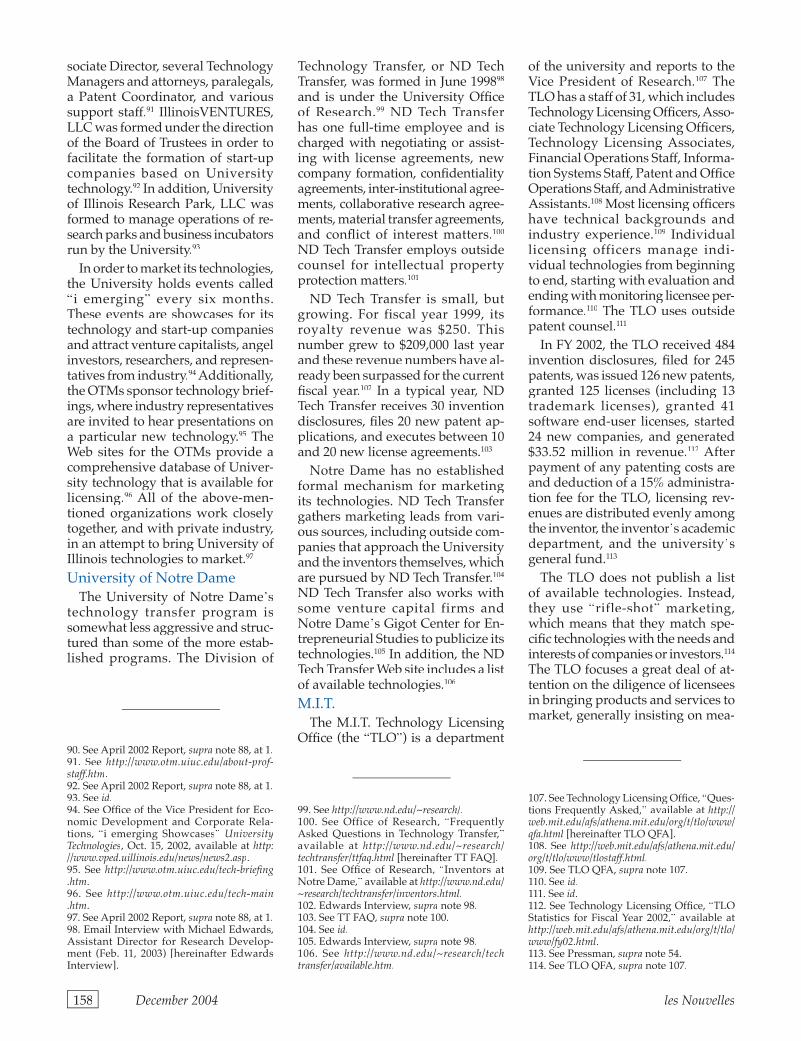
sociate Director, several Technology Managers and attorneys, paralegals, a Patent Coordinator, and various support staff.91 IllinoisVENTURES, LLC was formed under the direction of the Board of Trustees in order to facilitate the formation of start-up companies based on University technology.92 In addition, University of Illinois Research Park, LLC was formed to manage operations of re-search parks and business incubators run by the University.93
In order to market its technologies, the University holds events called “i emerging” every six months. These events are showcases for its technology and start-up companies and attract venture capitalists, angel investors, researchers, and represen-tatives from industry.94 Additionally, the OTMs sponsor technology brief-ings, where industry representatives are invited to hear presentations on a particular new technology.95 The Web sites for the OTMs provide a comprehensive database of Univer-sity technology that is available for licensing.96 All of the above-men-tioned organizations work closely together, and with private industry, in an attempt to bring University of Illinois technologies to market.97
University of Notre DameThe University of Notre Dameʼs
technology transfer program is somewhat less aggressive and struc-tured than some of the more estab-lished programs. The Division of
Technology Transfer, or ND Tech Transfer, was formed in June 199898
and is under the University Offi ce of Research.99 ND Tech Transfer has one full-time employee and is charged with negotiating or assist-ing with license agreements, new company formation, confi dentiality agreements, inter-institutional agree-ments, collaborative research agree-ments, material transfer agreements, and confl ict of interest matters.100
ND Tech Transfer employs outside counsel for intellectual property protection matters.101
ND Tech Transfer is small, but growing. For fiscal year 1999, its royalty revenue was $250. This number grew to $209,000 last year and these revenue numbers have al-ready been surpassed for the current fi scal year.102 In a typical year, ND Tech Transfer receives 30 invention disclosures, fi les 20 new patent ap-plications, and executes between 10 and 20 new license agreements.103
Notre Dame has no established formal mechanism for marketing its technologies. ND Tech Transfer gathers marketing leads from vari-ous sources, including outside com-panies that approach the University and the inventors themselves, which are pursued by ND Tech Transfer.104
ND Tech Transfer also works with some venture capital firms and Notre Dameʼs Gigot Center for En-trepreneurial Studies to publicize its technologies.105 In addition, the ND Tech Transfer Web site includes a list of available technologies.106
M.I.T.The M.I.T. Technology Licensing
Offi ce (the “TLO”) is a department
of the university and reports to the Vice President of Research.107 The TLO has a staff of 31, which includes Technology Licensing Offi cers, Asso-ciate Technology Licensing Offi cers, Technology Licensing Associates, Financial Operations Staff, Informa-tion Systems Staff, Patent and Offi ce Operations Staff, and Administrative Assistants.108 Most licensing offi cers have technical backgrounds and industry experience.109 Individual licensing officers manage indi-vidual technologies from beginning to end, starting with evaluation and ending with monitoring licensee per-formance.110 The TLO uses outside patent counsel.111
In FY 2002, the TLO received 484 invention disclosures, fi led for 245 patents, was issued 126 new patents, granted 125 licenses (including 13 trademark licenses), granted 41 software end-user licenses, started 24 new companies, and generated $33.52 million in revenue.112 After payment of any patenting costs are and deduction of a 15% administra-tion fee for the TLO, licensing rev-enues are distributed evenly among the inventor, the inventorʼs academic department, and the universityʼs general fund.113
The TLO does not publish a list of available technologies. Instead, they use “rifle-shot” marketing, which means that they match spe-cifi c technologies with the needs and interests of companies or investors.114
The TLO focuses a great deal of at-tention on the diligence of licensees in bringing products and services to market, generally insisting on mea-
90. See April 2002 Report, supra note 88, at 1.91. See http://www.otm.uiuc.edu/about-prof-staff.htm.92. See April 2002 Report, supra note 88, at 1.93. See id.94. See Offi ce of the Vice President for Eco-nomic Development and Corporate Rela-tions, “i emerging Showcases” University Technologies, Oct. 15, 2002, available at http://www.vped.uillinois.edu/news/news2.asp.95. See http://www.otm.uiuc.edu/tech-briefi ng .htm.96. See http://www.otm.uiuc.edu/tech-main .htm.97. See April 2002 Report, supra note 88, at 1.98. Email Interview with Michael Edwards, Assistant Director for Research Develop-ment (Feb. 11, 2003) [hereinafter Edwards Interview].
99. See http://www.nd.edu/~research/.100. See Office of Research, “Frequently Asked Questions in Technology Transfer,”available at http://www.nd.edu/~research/techtransfer/ttfaq.html [hereinafter TT FAQ].101. See Offi ce of Research, “Inventors at Notre Dame,” available at http://www.nd.edu/~research/techtransfer/inventors.html.102. Edwards Interview, supra note 98.103. See TT FAQ, supra note 100.104. See id.105. Edwards Interview, supra note 98.106. See http://www.nd.edu/~research/tech transfer/available.htm.
107. See Technology Licensing Offi ce, “Ques-tions Frequently Asked,” available at http://web.mit.edu/afs/athena.mit.edu/org/t/tlo/www/qfa.html [hereinafter TLO QFA].108. See http://web.mit.edu/afs/athena.mit.edu/org/t/tlo/www/tlostaff.html.109. See TLO QFA, supra note 107.110. See id.111. See id.112. See Technology Licensing Offi ce, “TLO Statistics for Fiscal Year 2002,” available at http://web.mit.edu/afs/athena.mit.edu/org/t/tlo/www/fy02.html.113. See Pressman, supra note 54.114. See TLO QFA, supra note 107.
les NouvellesDecember 2004158
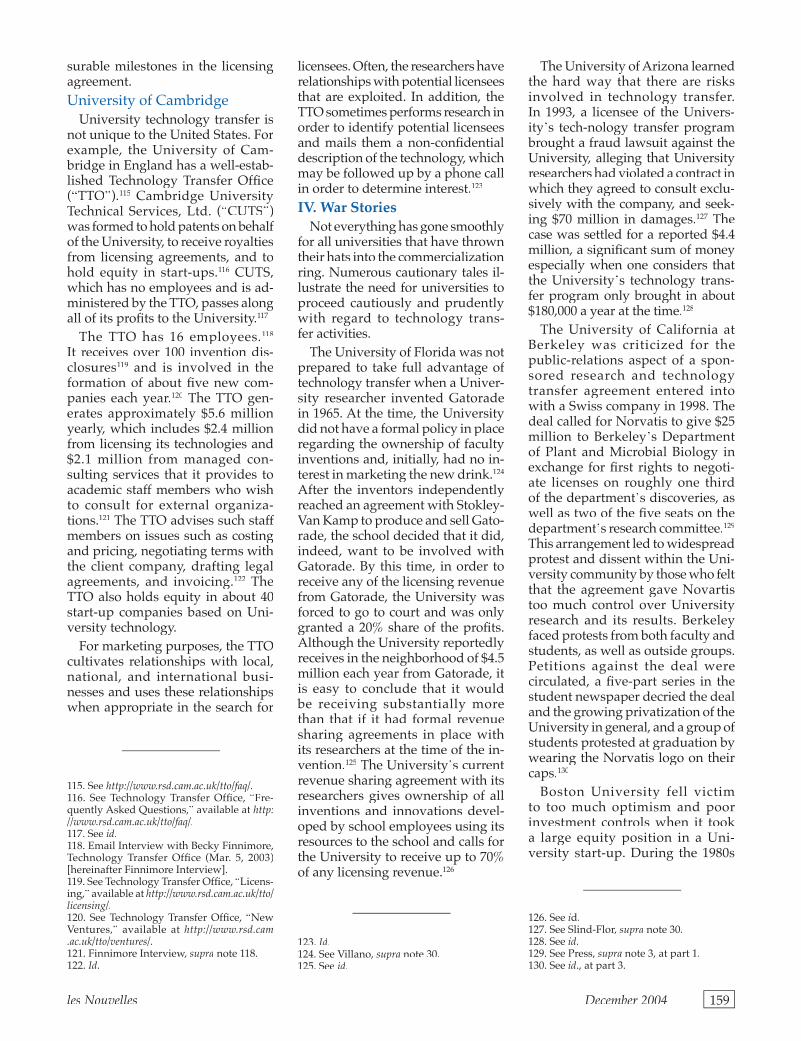
surable milestones in the licensing agreement.University of Cambridge
University technology transfer is not unique to the United States. For example, the University of Cam-bridge in England has a well-estab-lished Technology Transfer Offi ce (“TTO”).115 Cambridge University Technical Services, Ltd. (“CUTS”) was formed to hold patents on behalf of the University, to receive royalties from licensing agreements, and to hold equity in start-ups.116 CUTS, which has no employees and is ad-ministered by the TTO, passes along all of its profi ts to the University.117
The TTO has 16 employees.118
It receives over 100 invention dis-closures119 and is involved in the formation of about fi ve new com-panies each year.120 The TTO gen-erates approximately $5.6 million yearly, which includes $2.4 million from licensing its technologies and $2.1 million from managed con-sulting services that it provides to academic staff members who wish to consult for external organiza-tions.121 The TTO advises such staff members on issues such as costing and pricing, negotiating terms with the client company, drafting legal agreements, and invoicing.122 The TTO also holds equity in about 40 start-up companies based on Uni-versity technology.
For marketing purposes, the TTO cultivates relationships with local, national, and international busi-nesses and uses these relationships when appropriate in the search for
licensees. Often, the researchers have relationships with potential licensees that are exploited. In addition, the TTO sometimes performs research in order to identify potential licensees and mails them a non-confi dential description of the technology, which may be followed up by a phone call in order to determine interest.123
IV. War StoriesNot everything has gone smoothly
for all universities that have thrown their hats into the commercialization ring. Numerous cautionary tales il-lustrate the need for universities to proceed cautiously and prudently with regard to technology trans-fer activities.
The University of Florida was not prepared to take full advantage of technology transfer when a Univer-sity researcher invented Gatorade in 1965. At the time, the University did not have a formal policy in place regarding the ownership of faculty inventions and, initially, had no in-terest in marketing the new drink.124
After the inventors independently reached an agreement with Stokley-Van Kamp to produce and sell Gato-rade, the school decided that it did, indeed, want to be involved with Gatorade. By this time, in order to receive any of the licensing revenue from Gatorade, the University was forced to go to court and was only granted a 20% share of the profi ts. Although the University reportedly receives in the neighborhood of $4.5 million each year from Gatorade, it is easy to conclude that it would be receiving substantially more than that if it had formal revenue sharing agreements in place with its researchers at the time of the in-vention.125 The Universityʼs current revenue sharing agreement with its researchers gives ownership of all inventions and innovations devel-oped by school employees using its resources to the school and calls for the University to receive up to 70% of any licensing revenue.126
The University of Arizona learned the hard way that there are risks involved in technology transfer. In 1993, a licensee of the Univers-ityʼs tech-nology transfer program brought a fraud lawsuit against the University, alleging that University researchers had violated a contract in which they agreed to consult exclu-sively with the company, and seek-ing $70 million in damages.127 The case was settled for a reported $4.4 million, a signifi cant sum of money especially when one considers that the Universityʼs technology trans-fer program only brought in about $180,000 a year at the time.128
The University of California at Berkeley was criticized for the public-relations aspect of a spon-sored research and technology transfer agreement entered into with a Swiss company in 1998. The deal called for Norvatis to give $25 million to Berkeleyʼs Department of Plant and Microbial Biology in exchange for fi rst rights to negoti-ate licenses on roughly one third of the departmentʼs discoveries, as well as two of the fi ve seats on the departmentʼs research committee.129
This arrangement led to widespread protest and dissent within the Uni-versity community by those who felt that the agreement gave Novartis too much control over University research and its results. Berkeley faced protests from both faculty and students, as well as outside groups. Petitions against the deal were circulated, a fi ve-part series in the student newspaper decried the deal and the growing privatization of the University in general, and a group of students protested at graduation by wearing the Norvatis logo on their caps.130
Boston University fell victim to too much optimism and poor investment controls when it took a large equity position in a Uni-versity start-up. During the 1980s
115. See http://www.rsd.cam.ac.uk/tto/faq/.116. See Technology Transfer Offi ce, “Fre-quently Asked Questions,” available at http://www.rsd.cam.ac.uk/tto/faq/.117. See id.118. Email Interview with Becky Finnimore, Technology Transfer Offi ce (Mar. 5, 2003) [hereinafter Finnimore Interview].119. See Technology Transfer Offi ce, “Licens-ing,” available at http://www.rsd.cam.ac.uk/tto/licensing/.120. See Technology Transfer Offi ce, “New Ventures,” available at http://www.rsd.cam .ac.uk/tto/ventures/.121. Finnimore Interview, supra note 118.122. Id.
123. Id.124. See Villano, supra note 30.125. See id.
126. See id.127. See Slind-Flor, supra note 30.128. See id.129. See Press, supra note 3, at part 1.130. See id., at part 3.
les Nouvelles December 2004 159
and early 1990s, the University in-vested $85 million, nearly one-fi fth of its endowment, in one company, Seragen, a biotech fi rm founded by several Boston University professors that focused on cancer research.131
Seragen eventually failed and was sold, leaving the University with a net loss of almost $60 million.132
It was later discovered that the Universityʼs president, as well as a number of the Universityʼs trustees, had personally invested millions of dollars in Seragen.133
Despite the many possible pit-falls and hurdles, most universi-ties continue to move forward in their pursuit of technology transfer success. Some universities may proceed conservatively, but few, if any, universities have been intimi-dated away from technology trans-fer by cautionary tales such as those above—rightfully so.V. The Future of University Technology Transfer
There is every reason to believe that university technology transfer will continue to grow in years to come. All of the players involved in university technology transfer in the United States, including the federal government, state and local governments, corporations, and the universities (including researchers), have many incentives to support such activities, and to continue to increase support.
The federal government will con-tinue to support technology transfer, both through laws and with fi nancial aid. As discussed above, university technology transfer is an important component of the United Statesʼfi ght to remain competitive in the global marketplace.134 In addition, university technology transfer adds to the bottom line of the economy. From 1980-2001, at least 3,870 new companies were formed based on university-developed technology.135
In fi scal year 1999, university tech-nology transfer activities contributed almost $40 billion to the economy and supported over 260,000 jobs in the United States.136 In addition, about $5 billion in federal, state, and local tax revenue was generated by technology transfer activities.137 Fi-nally, the revenue that universities generate through their technology transfer activities supplements and invigorates government funding of university research.
For many of the same reasons, state and local governments have incentives to support university technology transfer in their areas. These governments are interested in remaining competitive on a smaller scale. They will support activities, such as university technology trans-fer, that lead to business and job creation, as well as tax revenue and other economic growth in their areas. In addition, state governments will support university technology trans-fer because it can be an additional revenue stream for cash-strapped state universities and budgets.
Corporations, obviously, will continue to increase their support of university technology transfer. By working with universities, cor-porations are able to gain access to advanced research facilities and talent. In addition, a lot of univer-sity research is subsidized by the government, thereby decreasing research expenses for the corpora-tions. This is a major reason why the percentage of university research funding by corporations increased from 2.6% to 7.1% between 1970 and 1997.138 In addition, as noted, the U.S. economy has changed such that the type of research conducted at universities is more directly relevant to corporations.139
Despite challenges, there is every reason to believe that most research universities will continue to be involved in technology transfer. Clearly, the potential to generate significant revenues via technol-ogy transfer is a strong incentive for many universities. As Pennsylvania State University economist Irwin Feller pointed out, the fastest grow-ing source of funding for university research is the universities them-selves.140 There are also more direct educational benefi ts from university technology transfer. Participation in such activities can be a means to lure top professors and graduate students to a university. It is also a way to teach students about entrepreneurism, and to demonstrate in a real world man-ner the social and commercial utility of university research.141
Because it is seemingly inevitable that all of these forces will continue to intensely support university technology transfer, it appears that the phenomenon is here to stay and will only continue to grow. Each university will determine how it will respond to this reality.VI. Commercialization Guidelines
University commercialization presents vast opportunities, but also daunting challenges. The reality is that all too many universities do not generate suffi cient return from tech-nology transfer and many others are struggling to establish effective pro-grams. The expectations for a return are very high at the same time these institutions are budget-constrained to invest in these programs. Technol-ogy transfer is a complex landscape that requires expertise in a wide variety of disciplines. While much guidance is available, it is also un-doubtedly true that given the vast environmental differences among universities, there is no one optimal structure for programs of this type. Nonetheless, each program should do no less than carefully analyze
131. See id.132. See “The Underground Staff, BU: Not So Well Endowed,” The Student Underground, available at http://thestudentunderground.org/print.php3?ArticleID=174.133. See id.134. See supra, Part I.
135. See 2001 AUTM Survey, supra note 5, at 14.136. See “Association of University Technol-ogy Managers, AUTM Licensing Survey: FY 1999, Survey Summary (2000),” at 1, available at http://www.autm.net/surveys/99/survey99A.pdf.137. See id.138. See Florida, supra note 39, at 365.
139. See supra, Part I.140. See Florida, supra note 39, at 369.141. See Pressman, supra note 54.
les NouvellesDecember 2004160
and focus on the following nine fundamentals.One: Institutional Mission Alignment
A universityʼs technology transfer program should not, and does not have to, confl ict with the mission of the university. In fact, a properly de-veloped commercialization program will only enhance a universityʼs abili-ty to achieve its mission by increasing fi nancial resources and educational opportunities. A concerted effort should be made to ensure that a confl ict with mission does not arise, both during the establishment of a technology transfer program and throughout its life. The participa-tion of stakeholders from through-out the university community in a technology transfer program and the establishment of a confl ict-of-interest policy are two important alignment considerations.
It should be kept in mind that it is likely not all members of a univer-sity community will be supportive of a universityʼs technology trans-fer program. University technology transfer has critics.142 Thus, in order to integrate in a healthy manner any such opposition, it is advisable to construct programs with appro-priate representation from various sectors of the university community and to conduct frequent coordina-tion and communication exercises.
Further, the development of a well-structured and comprehensive confl ict-of-interest policy is a key to a successful technology transfer pro-gram. The policy should encourage commercialization of inventions and innovations, while simultaneously guarding against potential abuses or the perception of impropriety. The universityʼs mission statement should be kept in mind during the creation of a conflict-of-interest policy, as well as throughout the life of the program, to ensure that the operation of the technology transfer program remains consistent with the mission of the university.
Two: Program Structure and Resources
As evidenced by the case studies,143
a university technology transfer pro-gram can take many different forms. By way of example, if the leadership at a university is supportive of the idea of a technology transfer pro-gram, but is not enthusiastic about a large initial capital outlay to set up a program in-house, many of the necessary technology transfer func-tions, such as patenting, licensing, and marketing, can be outsourced to qualifi ed third parties. On the other hand, if maintaining strict control of the program is critical and the necessary funding is available, pro-fessionals can be hired and brought into the technology transfer program full-time. Other relevant factors that may be considered when determin-ing the structure for a universityʼs technology transfer program include the size of the school, the type and nature of research conducted at the university, and the number of inven-tions disclosed annually.
When a university technology transfer program is in its earliest stages, it may be wise to start small with many functions outsourced.144
As the program matures, in-house professionals and staff can be added. This strategy allows the university to avoid the large initial capital outlay required to set-up a fully function-ing in-house technology transfer program. Additionally, it will allow the university to avoid mistakes in the initial structure of the program and to access the expertise of those with experience. Needs should be accurately identifi ed and addressed slowly and methodically. Three: Funding Sources; Projections
A university technology transfer program can be funded in many alternative manners. Usually, the university provides some level of initial funding—cash or in kind
services. However, if a university cannot, or will not, budget for an ad-equate commitment, there are other options. For instance, individuals and private foundations sometimes fund technology transfer programs, such as in the case of the University of Wisconsinʼs Alumni Research Foundation.145 Also, corporations may be willing to fund technology transfer operations at a university in exchange for rights or prefer-ences in the technology that comes through the technology transfer of-fi ce. Nonetheless, a long-term goal of any technology transfer program must be to become fi nancially self-suffi cient and, eventually, a source of sustained value for the university.
Financial planning for a technol-ogy transfer program is challenging. It is diffi cult to project a programʼs income because it is impossible to predict the quantity and quality of new technologies that will be de-veloped by university researchers. It may also take many years before a promising technology begins to generate positive cash fl ow, or any cash fl ow at all. Nonetheless, just as in any speculative venture, the pro-cess of fi nancial planning and pro-jecting is essential. In essence, these programs must have a business and fi nancial plan at least as rigorous as they require for the technology that they aspire to commercialize.Four: Identifying, Protecting, and Defending Assets
Without assets (in this case most likely intellectual property), there is no program. But the fundamentals of identifying, protecting, and defend-ing intellectual property rights are often undernourished. A universityʼs property must be properly protected, even before the technology transfer program becomes involved with a particular invention or innovation. It is imperative that, at a minimum, university researchers understand the basics of intellectual property law so that the university does not unwittingly lose “control” of the
142. See supra, Part II.
143. See supra, Part III.144. The work can be outsourced on a case-by-case basis, or as a whole. 145. See supra, Part III
les Nouvelles December 2004 161
inventions or innovations by, for instance, researchers publishing the results of their research before prop-er intellectual property protection is obtained. It is incumbent upon the technology transfer offi ce to ensure that researchers are supported on these matters.
Additionally, a comprehensive intellectual property policy should be developed that clearly articulates ownership and control issues, as well as obligations of both the uni-versity and the researchers. Some of the important topics that should be addressed in an intellectual property policy include, scope, ownership of inventions and innovations, income sharing formulae, disclosure mecha-nisms, obligations of inventors, and publication policies.
It is also important that a process through which researchers disclose inventions and innovations be devel-oped. Generally, universities create an invention disclosure form and mandate that researchers complete such a form for every invention or innovation they develop. Some important parts of an invention disclosure form include, research funding source, detailed descrip-tion of the invention or innovation, names of potential licensees in the fi eld, disclosures of the invention or innovation made to other persons or entities, and proposed dates of publication or presentations about the invention or innovation.
Technology transfer programs will also need to take the necessary steps to secure protection of assets—by contract, securing copyright, patent, trademark, and other legal protec-tions, and will need to consider geographic protections.146 Outside legal counsel or dedicated in-house counsel with appropriate expertise must be consulted and utilized. Moreover, no program is complete without a strategy to identify and deal with third party infringe-ment and to enforce these hard-earned rights. Five: Missionary Work
Identification and protection are essential, but marketing and dis-tribution are synonymous with
“commercialization.” University re-searchers need to be made aware of the existence and role of the technol-ogy “transfer” program. They need to have a sense of the value to them-selves, their research, the university, and community. Thus, another es-sential mission of technology transfer offi cials must be to focus on internal marketing. This includes ensuring awareness and education for univer-sity administration, alumni, boards of trustees, and any other stakehold-ers whose support are needed to nurture or grow a program. Public universities should be sure to take taxpayers into account, as they are an additional group of stakehold-ers whose support is important. The more support the program has within the university community, and among any other stakehold-ers, the better. Part of the education must be that the risks of undertak-ing certain studies must, and will, be taken, and as with any venture, some things will go well and other things will not go so well. Methods of in-ternal marketing and raising aware-ness include informational meetings, publication of inventorʼs handbooks, mailings, and a technology transfer Web site. These activities should not only focus on the fi nancial benefi ts of technology transfer, but also the educational benefi ts and the benefi ts to our society as a whole. Six: Evaluation and Valuation of Assets
Perhaps among the more diffi cult aspects of university technology transfer is the evaluation, valuation, and prioritization of the inventions and innovations that are disclosed to the technology transfer offi ce. What assets hold a reasonable chance to be marketable and under what terms? Which of the disclosures have the commercial potential such that the technology transfer program should put its precious and constrained time
and resources into developing and marketing them? This process will greatly depend on the structure of the technology transfer program. Some programs are set up with this function in mind. They are staffed by licensing professionals with experi-ence and knowledge in particular fi elds of technology. Other technology transfer programs have advisors that may include academics and individu-als from private industry to evaluate disclosures. The use of outside con-sultants with expertise in the fi eld to evaluate the commercial potential of a particular invention or innovation is also not uncommon. Once it has been determined that an invention or innovation does have commercial potential, it is sound to focus on how to derive market value—there are numerous choices.Seven: Marketing & Distribu-tion Channels
Direct licensing, ventures, alli-ances, start-ups, and donation are all distribution alternatives. Find-ing the right choice or choices (since few formats are mutually exclusive) is no small task. Researchers them-selves are often good resources for information on potential partners in their particular areas of exper-tise. It is also important for a tech-nology transfer offi ce to develop a network of contacts both in private industry and in the venture capital community. AUTM is a resource for both marketing information and contacts. Some university technol-ogy transfer programs display their inventions and innovations at tech-nology trade shows. Others, such as the University of Illinois, hold their own showcases of university technology. Most university tech-nology transfer programs include a list of available technologies on their Web site. Whichever meth-ods a technology transfer program chooses for marketing itself, it must be aggressive.
There are many different types of partners with whom a university technology transfer program may choose to work, including licens-ees, capital sources, investors, joint venture partners, consultants, and
146. See Robert C. Dorr and Christopher H. Munch, Protecting Trade Secrets, Patents, Copy-rights, and Trademarks (Aspen Publishers), for a detailed resource on securing intellectual property protection.
les NouvellesDecember 2004162
counsel. When choosing potential partners, it is important to carefully evaluate their skills and experience in the relevant fi eld or discipline.147
For example, when evaluating potential licensees or joint venture partners for an invention or inno-vation, the goal is to fi nd a partner that will be able to help maximize the commercial potential of the technol-ogy. An acceptable candidate should have proven skills in commercial-izing products or services in the relevant fi eld, as well as a realistic plan for developing and marketing the product or service. Other impor-tant attributes to look for include contacts in the fi eld, fi nancial stabil-ity, and an established distribution system. It is advisable to consult with other university technology transfer programs that may have dealt with a potential partner in the past.148
Part of evaluating inventions and innovations is the determination of the optimal path to market. Often, this determination will lead to licens-ing the technology. However, it may sometimes be better to start a new company to develop and market an invention or innovation. Factors to be considered in determining whether a start-up is the proper path to com-mercialization include, whether the product or service is ready for commercialization or must be de-veloped further, the willingness and ability of the inventor(s) to work on the marketing and development of the product or service, other avail-able managers, and, of course, fund-ing sources.
When looking for and evaluating capital partners and other potential investors, it is important to be both practical and prudent. It can be dif-
fi cult to attract investment dollars. It is necessary, therefore, to have a realistic outlook regarding poten-tial investors and what to expect. Nonetheless, it is important to assess carefully the skills and attributes of potential investors. Characteristics to evaluate include, the types of proj-ects in which they have invested in the past, their experience in the relevant field, experience in the management of start-ups, contacts, reputation, and experience working with universities. Contractual terms offered by the investor must also be carefully evaluated.149 It is wise to interview multiple candidates for roles to fi nd the professionals best suited for the desired purpose.Eight: Documenting Transactions
No part of our commercial market-place works without documenting understandings and expectations. Experience, knowledge, diligence, and planning are especially required at this point. Proper terms and con-ditions can make the difference be-tween success and failure.
It is a good idea for a technology transfer offi ce to develop a library of basic form contracts for different situations. This library could include exclusive and non-exclusive licens-ing agreements of various types (patent license, software license, etc.), sponsored research contracts, joint venture contracts, and non-disclosure agreements. These basic contracts will serve as starting points in various circumstances.
It is important to have a feel for standard terms and conditions within an industry and for the type of agreement that will be negotiated. It is also important to keep in mind
that terms that may be standard in private industry may not be accept-able or standard when a university is involved. For instance, the Stanford OTL will not enter into agreements that require the university to keep all information about the license confi dential, that require the uni-versity to guarantee that the inven-tion does not infringe any patents, or that demand fi rst rights to future inventions in the same fi eld for a partner.150 Laws that govern public universities may preclude them from entering into contracts with terms that are deemed standard within private industry. Nine: Consistent, Critical and Continuous Re-evaluation
University technology transfer programs are often very focused on getting inventions or innovations to market, or the “launch.” It is impor-tant to keep in mind, though, that this is not the end of the process for a technology transfer offi ce. It is only the beginning. Continued monitoring and evaluation of both products and partners are neces-sary to ensure that the commercial potential of an invention or innova-tion is maximized and that lessons for the program can be learned and integrated. Thus, a technol-ogy transfer offi ce should conduct regular audits of the activities of its partners. In addition, a technology transfer program should continually audit its own internal processes and make adjustments.Conclusion
There is no conclusion. This is a very bright dawn for commercial-ization of university controlled and owned innovations.
147. See Paul J. Kollmer and Phillip L. Spec-tor, Communications and Technology Alliances: Business and Legal Issues (West Group), for a detailed resource on joint ventures and other business alliances. See Jay Dratler, Jr., “Licens-ing of Intellectual Property,”Law Journal Press, for a detailed resource on intellectual prop-erty licensing.148. This is true for all types of potential partners.
149. See J. Robert Brown, Jr., Raising Capital: Private Placement Forms & Techniques (Aspen Publishers) for a detailed resource on fi nding and working with investors. 150. See Wiesendanger, supra note 33.
les Nouvelles December 2004 163
Time To Reconsider Australian And U.S. Law Regarding Exclusive Licenses Of Copyright And Patents?
BY ADAM LIBERMAN & BEN KREMER*
*Adam Liberman is a partner, and Dr. Ben Kremer is a solicitor at Freehills, Sydney, NSW, Australia.
les NouvellesDecember 2004164
The Free Trade Agreement (FTA) that was recently nego-tiated between Australia and
the United States (U.S.) has a num-ber of far-reaching consequences for Australian and U.S. intellectual property law. One, of considerable importance to commercial practice, is the possibility that alterations will be required to the legislation of both countries regarding “exclusive li-censees” of copyright and patents.The FTA
The FTA will take effect as a treaty between Australia and the U.S. It has yet to be ratifi ed by either country, and its language is still in “draft”status.1 Nevertheless, it is expected that the wording of the fi nal treaty will not differ too greatly from the current draft.
Article 17 of the FTA sets out standards concerning intellectual property with which both Austra-lia and the U.S. must comply. Of particular interest is the language in article 17.11.5, which requires both countries to make available to rights-holders “civil judicial proce-dures concerning the enforcement of any intellectual property right.”A footnote to that provision states that “the term ̒ right holderʼ shall in-clude exclusive licensees,” and that “the term ʻexclusive licenseeʼ shall include the exclusive licensee of any one or more of the exclusive intellec-tual property rights encompassed in a given intellectual property.”2
At fi rst sight, this provision seems relatively straightforward: each of the kinds of intellectual property dealt with in the FTA; i.e., copyright, trade marks, designs and patents; gives to their owner a number of exclusive rights. In general, each exclusive right deals with an act done in respect of the intellectual property (such as to reproduce a copyright work), and consists of the ability to exclude all other people from doing that act, plus the right to authorise any person or persons to do the act.
As a matter of commercial prac-tice, those rights are often licensed exclusively by the owner of the in-tellectual property. Sometimes, all rights are licensed exclusively to one licensee. Other times, the rights are apportioned exclusively between more than one licensee. A matter of critical commercial importance is whether the “exclusive” licensee of a piece of intellectual property may bring proceedings against infring-ers of the right or rights licensed to them. Currently, the answer to this question—both in Australia and the U.S.—depends on the type of intel-lectual property being licensed.
However, the FTAʼs defi nition of “exclusive licensee” expressly en-visages that there may be multiple exclusive licensees of each form of intellectual property, and requires that each of them must be able to sue to enforce their exclusive rights. In essence, article 17.11.5 will require harmonisation in both Australia and the U.S. of the exclusive licensee provisions among different types of intellectual property that govern
the right to bring infringement pro-ceedings.
As a result, it is necessary to ex-amine how well current Australian and U.S. intellectual property law fi ts with the approach required in article 17.11.5, as well as the practical consequences of the harmonisation that the article imposes.Exclusive licences to copyright
Current Australian and U.S. copy-right law probably conforms with the requirements of the FTA. Australian Position
Under Australian copyright law, an “exclusive licence” is a licence from the copyright owner authoris-ing the licensee “to the exclusion of all other persons, to do an act that, by virtue of this Act, the owner of the copyright would, but for the licence, have the exclusive right to do.”3 An “exclusive licensee” of copyright has the power to commence proceedings for infringement, subject to various conditions regarding joinder of the owner in appropriate cases.4
The concept of “exclusion” is straightforward: it requires that the act be within the monopoly granted by copyright, and that it be granted to the licensee to the exclusion of
1. The text is “subject to legal review for ac-curacy, clarity and consistency.”2. Emphasis added.
3. Copyright Act 1968 (Cth), section 10.4. Copyright Act 1968 (Cth), section 119.
everyone else including the owner of the copyright.
The concept of “an act” is a little more diffi cult. It appears that the Copyright Act should be read so that the word “an act” means any activity or activities that are within the scope of the copyright ownerʼs exclusive rights. For example, the owner of copyright in a work has the exclusive rights to (among other things) make “reproductions” of that work (e.g., exact copies of that work), to make “adaptations” of the work (such as making translations), and also to authorise other people to do either of these acts.
Thus, a copyright owner can grant a licence to reproduce the work in printed form to one person to the exclusion of everyone else, and a li-cence to reproduce the work in digi-tal form to another person, also to the exclusion of everyone else; or they may grant a licence to one person to translate the work into Russian to the exclusion of everyone else, and a licence to another person to trans-late the work into Spanish also to the exclusion of everyone else. Each of those licence holders would appear to come within the Actʼs defi nition of “exclusive licensee.”5
The use of the word “act” there-fore appears to make it clear that the bundle of exclusive rights contained in copyright are divisible, and can be split among one or more people. U.S. Position
Similarly, in the U.S., copyright consists of a number of exclusive rights, such as the right to reproduce the copyrighted work, or to prepare derivative works. Not only may each of these rights be granted to a differ-ent exclusive licensee, but it also ap-pears that each exclusive right may be subdivided indefi nitely, and each subdivision apportioned among different licensees. Provided each licensee is granted the relevant part of the exclusive right to the exclusion of all others, the licence will be an exclusive licence.6
An exclusive licence to any exclu-sive right comprised in copyright is considered to be a “transfer of copyright ownership” in that right (whether or not it is limited in time or place of effect) and the exclusive licensee, as owner of that particular exclusive right, “is entitled, to extent of that right, to all of the protec-tion and remedies accorded to the copyright owner.”7 This includes the right to bring proceedings for infringement.Exclusive licences to patents
It is with respect to exclusive licences to patents that the FTA appears to require a change in the law. The FTAʼs requirement that any person who holds “one or more” of the exclusive rights in a piece of intellectual property must have a right to sue to enforce that right is inconsistent with U.S., and possibly also Australian, patent law.Australian Position
In Australia, the term “exclusive licensee” is defi ned in the Patents Act to mean “a licensee under a licence granted by the patentee and conferring on the licensee, or on the licensee and persons authorised by the licensee, the right to exploit the patented invention throughout the patent area to the exclusion of the patentee and all other persons.”8
The notion of “exploiting” a patent is also defi ned: where the invention is a product, “exploit” includes “make, hire, sell or otherwise dis-pose of the product, offer to make, sell, hire or otherwise dispose of it, use or import it, or keep it for the purpose of doing any of those things;” and where the invention is a method or process, it includes “use the method or process,” or to do any of the above acts “in respect of a product resulting from such use.”
Slightly different language was used in the previous Australian Patents Act, and the High Court held that under that Act there could only be one exclusive licensee of a patent, and that to be an exclusive licensee, the licensee had to be granted all of the relevant rights under the patent.9So, a licensee who only had the ex-clusive right to make a patented product, or to import a product made by a patented process, was not an “exclusive licensee” for the purposes of the previous Act. In such a case, despite the intention of the parties, only the patent owner could commence proceedings for infringement of the patent.
It is unclear whether this approach will be adopted for the current Pat-ents Act, which is worded slightly differently.10 So far, the proposition has been examined in only one case, which suggests that under the new Act a licence of only some of the patent rights may be an exclusive licence under the Act.11 The decision is of a single judge, sitting at fi rst in-stance, and it is unclear whether the basis of the decision will ultimately be accepted by higher courts. If it is, then Australian patent law will be consistent with article 17.11.5 of the FTA. If not, then legislative change will be required.U.S. Position
It seems clear that the position in the U.S. is virtually identical to the position under the previous Austra-lian Patents Act. The U.S. Patent Act grants a “remedy by civil action for infringement of [a] patent” only to
5. PM Sulcs & Associates Pty Ltd v. Detroit Diesel-Allison Australia Pty Ltd (1997) 39 IPR 328 at 334–5; Sega Enterprises Ltd v. Galaxy Electronics Pty Ltd (1998) 39 IPR 577.
6. Silvers v. Sony Pictures Entertainment, Inc., 330 F.3d 1204 (9th Cir. 2003). See 17 U.S.C. § 201(d)(2): “[a]ny of the exclusive rights com-prised in a copyright, including any subdivision of any of the rights specifi ed by section 106, may be transferred as provided by clause (1) and owned separately.”7. 17 U.S.C. § 101 and § 201(d)(2).8. Patents Act 1990 (Cth), Schedule 1.
9. Ex parte British Nylon Spinners Ltd; Re Imperial Chemical Industries Ltd (1963) 109 CLR 336.10. Grant v. Australian Temporary Fencing Pty Ltd (2003) AIPC 91-899.11. Although the list of actions constituting “exploiting” an invention now reads disjunc-tively, in contrast to the previous Act, the cur-rent Act still refers to “the right” to exploit the patented invention. Such a reference in the previous Act was one of the factors that led the High Court to insist that there could be only one exclusive licensee of a patent. Argu-ably, unless the licence contains all the rights listed in the defi nition of “exploit,” it might not be a “licence to exploit” the patent at all, and hence cannot be an “exclusive licence.”
les Nouvelles December 2004 165
the “patentee,”12 and to “successors in title to the patentee.”13 Subse-quent case law has confi rmed that an exclusive licensee of a patent can also sue for infringement (provided additionally that they join the pat-entee), because such a licensee has “all substantial rights” to the patent, and so is effectively an assignee of the patent (i.e., a successor in title to the patentee).14
However, such a licensee must actually have all substantial rights; a licensee of a patent who does not have “all substantial rights” under the patent is not an exclusive licens-ee (but a mere licensee), and does not have standing to sue in the U.S. for infringement of the patent.Contrast: United Kingdom Copyright and Patent Law
The above should be contrasted with the position in, for example, the United Kingdom, where multiple exclusive licences can be granted to both copyright and patent. An exclu-sive licence to copyright consists of an exclusive grant by the copyright owner to another “to exercise a right which would otherwise be exercis-able exclusively by the copyright owner,”15 while an exclusive licence to a patent involves the exclusive grant (i.e., to the exclusion of all other persons, including the proprietor or applicant) of “any right in respect of the invention to which the patent or application relates.”16
A licensorʼs ability to control its exclusive licenseesʼ lawsuits
If Australian and/or U.S. patent law is changed to allow there to be multiple exclusive licensees of
a patent, an important commercial issue arises: can a licensor remove the ability of an exclusive licensee to bring infringement proceedings, and if so, how? The identical issue arises in the copyright context, even though no change in the law is required.
In a commercial context, a licensor may wish to prevent the possibility that one exclusive licensee can take action against another exclusive li-censee, or against a third party. This might be the case, for example, where the licensor has commercial relation-ships with a potential defendant that it wishes to protect. Alternatively it might wish to reduce the chance that the validity of the patent will be chal-lenged by a defendant to a patent in-fringement suit, which is a common defence tactic in such suits.
At least two issues arise. One in-volves the ability of private parties to contract out of rights granted in public statutes. The issue is illus-trated in its diametrically opposed forms in the Australian Trade Marks Act, which specifi cally provides that the rights of an authorised user—whether exclusive or not—are sub-ject to contract between the licensor and authorised user, and the Trade Practices Act, which specifically provides that certain rights granted by that Act cannot be contracted out of.17
Current Australian copyright and patent law, however, are silent as to whether the rights of an exclusive licensee to bring infringement pro-ceedings can be contracted out of. Given the review process brought
about by the FTA, it would seem an opportune time for this issue to be resolved.
A second issue is whether any limitation on the exclusive licenseeʼs right to sue might in fact make the licence non-exclusive. Currently, given the defi nition in U.S. patent law, there is a good argument that any licence granted to a licensee that does not give the licensee un-fettered power to sue for infringe-ment is not a grant of “all substantial rights” under the patent, and hence not an “exclusive licence.”18 The preferable course here would seem to be to adopt language similar to the Australian Trade Marks Act, in which a person may be an autho-rised user—whether exclusive or otherwise—notwithstanding that their rights under the Act are sub-ject to modifi cation by the parties. Therefore, absent any cogent policy reason, the principle of freedom of contract should prevail.Conclusion
It appears that neither Australian nor U.S. copyright law regarding exclusive licensees will require amendment as a consequence of ar-ticle 17.11.5 of the FTA. It is doubtful, however, that the same can be said of Australian and U.S. patent law in that area. In both cases, however, there would be merit in amending the copyright and patent legisla-tion of both countries to expressly deal with whether exclusive licens-eesʼ rights to bring infringement proceedings may be modifi ed by contract.
12. 35 U.S.C. § 281.13. 35 U.S.C. § 100(d).14. Vaupel Textilmaschinen KG v. Meccanica Euro Italia S.P.A., 944 F.2d 870 (Fed. Cir. 1991); Textile Prods., Inc. v. Mead Corp., 134 F.3d 1481 (Fed. Cir. 1998).15. Copyright, Designs and Patents Act 1988 (UK), section 92(1).16. Patents Act 1977 (UK), section 130(1).
17. Trade Marks Act 1995 (Cth), section 26; Trade Practices Act 1974 (Cth), section 68.18. See also the position under copyright law: Althin CD Medical, Inc. v. West Sub-urban Kidney Center, S.C., 874 F.Supp. 837 (N.D.Ill.,1994).
les NouvellesDecember 2004166
Valuation Of Biotechnology Companies & Their Assets—Probability Effected Discounted Cash Flows
BY JEREMY WEBSTER & TREVOR PHILIPPON*
*Jeremy Webster and Trevor Philippon are at Deloitte & Touche Financial Advisory Services. © 2004, Jeremy Webster, Trevor Philippon and Deloitte & Touche LLP, All Rights Reserved.
les Nouvelles December 2004 167
What is Biotechnology?
Biotechnology is the “use of cellular and molecular pro-cesses to solve problems or
make useful products.”1
Biotechnology can be applied to basic scientifi c research, develop-ment of healthcare products (thera-peutics, devices, and diagnostics) and services, agriculture, and nu-traceuticals. The Clinical Development Process
It is important to have an under-standing of the clinical development process for human therapeutics. It is through this process that compounds identifi ed by scientists are approved for human use (for specifi c purposes) by regulatory authorities. Each coun-try has a regulatory authority such as the Food and Drug Administration (FDA) in the U.S. and the Health Protection Branch (HPB) in Canada. Clinical development risk is the larg-est business risk facing biotechnol-ogy companies.
We have provided an overview of the clinical development process in the Appendix.Companies are Made up of a Group of Products
Generally a biotechnology com-pany is a collection of one or more market opportunities or products. Therefore to value a company, each one of the products must be valued. The value of the company is then de-termined by adding up the value of all the products and the companyʼs
other assets and liabilities. Some-times companies indicate that they have a “platform” technology with a large number of possible products or services. Management must decide where to allocate their resources and therefore which opportunities to pursue.Two Major Stages of Product Life:
There are two major stages of a productʼs life:
1. Research & Development Stage, and
2. Commercialization Stage.The cash fl ow for each of these two
periods can be estimated separately. It is quite usual for a valuation anal-ysis to start with the second major time period component. By starting with the second component, the analyst can quantify the eventual market opportunity. This is how many companies begin their analysis when determining whether it makes economic sense to even contemplate starting the clinical trial process. This is the payoff! This is the op-portunity sought. This is the reason to invest. The opportunity needs to be there to justify the investment to be made in clinical trials. Certain companies have minimum market opportunity sizes before they will even begin to consider whether to pursue an opportunity.
Therefore, this is how we begin our analysis.Step One: Start with Commer-cialization Stage
To determine the value from mar-ket launch to the end of the product
life, estimates of the following are made:
1. The forecast cash flow from market launch until the end of the product life.
2. The discount rate to apply the cash fl ows.
3. The net present value at the market launch date is then deter-mined by applying the discount rate to the forecasted cash fl ows.
The forecasted cash flow from market launch to product expiry (product life) requires a quantifi ca-tion of:
1. Expected revenue;2. Cost of sales;3. Operating costs; and4. Income taxes.For the purposes of this summary
article we have made a simplifying assumption that the value of the opportunity at market launch is $1 Billion.Step Two: Value back through R&D Stage
The expected future cash flow during the development stages un-til market launch is made up sub-stantially of the costs of pre-clinical trial research & development and conducting the clinical trials related to the specifi c indication. Therefore, the valuator must make an estimate of the:
1. Source: www.bio.org, Guide to Biotechnol-ogy.
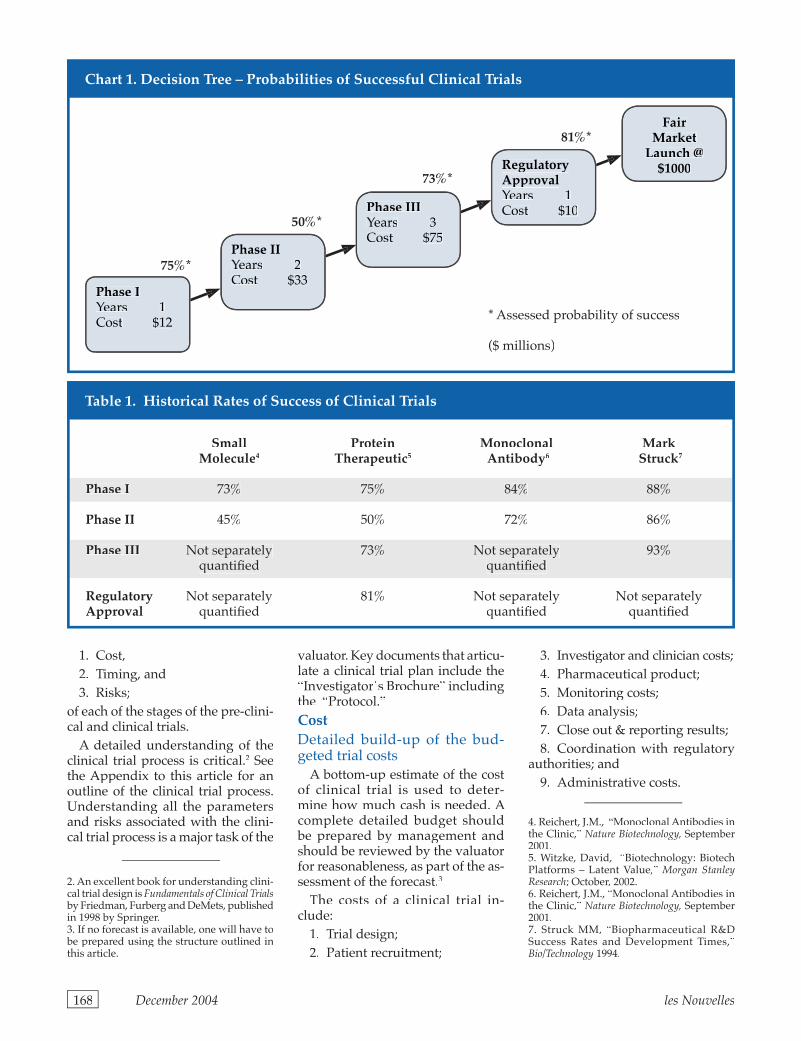
1. Cost, 2. Timing, and 3. Risks;
of each of the stages of the pre-clini-cal and clinical trials.
A detailed understanding of the clinical trial process is critical.2 See the Appendix to this article for an outline of the clinical trial process. Understanding all the parameters and risks associated with the clini-cal trial process is a major task of the
valuator. Key documents that articu-late a clinical trial plan include the “Investigatorʼs Brochure” including the “Protocol.”CostDetailed build-up of the bud-geted trial costs
A bottom-up estimate of the cost of clinical trial is used to deter-mine how much cash is needed. A complete detailed budget should be prepared by management and should be reviewed by the valuator for reasonableness, as part of the as-sessment of the forecast.3
The costs of a clinical trial in-clude:
1. Trial design;2. Patient recruitment;
3. Investigator and clinician costs;4. Pharmaceutical product;5. Monitoring costs;6. Data analysis;7. Close out & reporting results;8. Coordination with regulatory
authorities; and9. Administrative costs.
Small Protein Monoclonal MarkMolecule4 Therapeutic5 Antibody6 Struck7
Phase I 73% 75% 84% 88%
Phase II 45% 50% 72% 86%
Phase III Not separately 73% Not separately 93%quantifi ed quantifi ed
Regulatory Not separately 81% Not separately Not separately Approval quantifi ed quantifi ed quantifi ed
Chart 1. Decision Tree – Probabilities of Successful Clinical Trials
Phase IYears 1Cost $12
Table 1. Historical Rates of Success of Clinical Trials
2. An excellent book for understanding clini-cal trial design is Fundamentals of Clinical Trialsby Friedman, Furberg and DeMets, published in 1998 by Springer.3. If no forecast is available, one will have to be prepared using the structure outlined in this article.
Phase IIYears 2Cost $33
Phase IIIYears 3Cost $75
Fair Market
Launch @$1000Regulatory
ApprovalYears 1Cost $10
* Assessed probability of success
($ millions)
75%*
50%*
73%*
81%*
4. Reichert, J.M., “Monoclonal Antibodies in the Clinic,” Nature Biotechnology, September 2001.5. Witzke, David, “Biotechnology: Biotech Platforms – Latent Value,” Morgan Stanley Research; October, 2002.6. Reichert, J.M., “Monoclonal Antibodies in the Clinic,” Nature Biotechnology, September 2001.7. Struck MM, “Biopharmaceutical R&D Success Rates and Development Times,”Bio/Technology 1994.
les NouvellesDecember 2004168
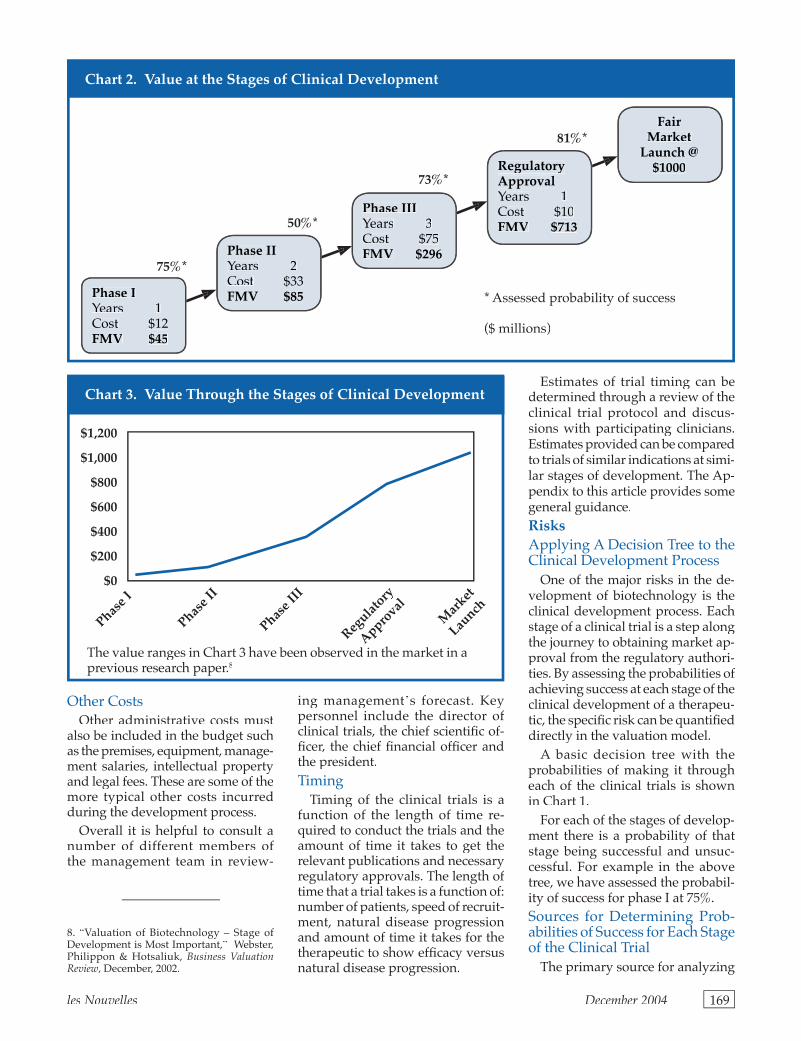
Other CostsOther administrative costs must
also be included in the budget such as the premises, equipment, manage-ment salaries, intellectual property and legal fees. These are some of the more typical other costs incurred during the development process.
Overall it is helpful to consult a number of different members of the management team in review-
ing managementʼs forecast. Key personnel include the director of clinical trials, the chief scientifi c of-fi cer, the chief fi nancial offi cer and the president.Timing
Timing of the clinical trials is a function of the length of time re-quired to conduct the trials and the amount of time it takes to get the relevant publications and necessary regulatory approvals. The length of time that a trial takes is a function of: number of patients, speed of recruit-ment, natural disease progression and amount of time it takes for the therapeutic to show effi cacy versus natural disease progression.
Estimates of trial timing can be determined through a review of the clinical trial protocol and discus-sions with participating clinicians. Estimates provided can be compared to trials of similar indications at simi-lar stages of development. The Ap-pendix to this article provides some general guidance.RisksApplying A Decision Tree to the Clinical Development Process
One of the major risks in the de-velopment of biotechnology is the clinical development process. Each stage of a clinical trial is a step along the journey to obtaining market ap-proval from the regulatory authori-ties. By assessing the probabilities of achieving success at each stage of the clinical development of a therapeu-tic, the specifi c risk can be quantifi ed directly in the valuation model.
A basic decision tree with the probabilities of making it through each of the clinical trials is shown in Chart 1.
For each of the stages of develop-ment there is a probability of that stage being successful and unsuc-cessful. For example in the above tree, we have assessed the probabil-ity of success for phase I at 75%. Sources for Determining Prob-abilities of Success for Each Stage of the Clinical Trial
The primary source for analyzing
Chart 2. Value at the Stages of Clinical Development
Chart 3. Value Through the Stages of Clinical Development
$1,200
$1,000
$800
$600
$400
$200
$0
Phase I
The value ranges in Chart 3 have been observed in the market in a previous research paper.8
Phase IYears 1Cost $12FMV $45
Phase IIYears 2Cost $33FMV $85
Phase IIIYears 3Cost $75FMV $296
RegulatoryApprovalYears 1Cost $10FMV $713
* Assessed probability of success
($ millions)
75%*
50%*
73%*
81%*Fair
Market Launch @
$1000
Phase I
I
Phase I
II
Regulat
ory
Approval
Mar
ket
Launch
8. “Valuation of Biotechnology – Stage of Development is Most Important,” Webster, Philippon & Hotsaliuk, Business Valuation Review, December, 2002.
les Nouvelles December 2004 169
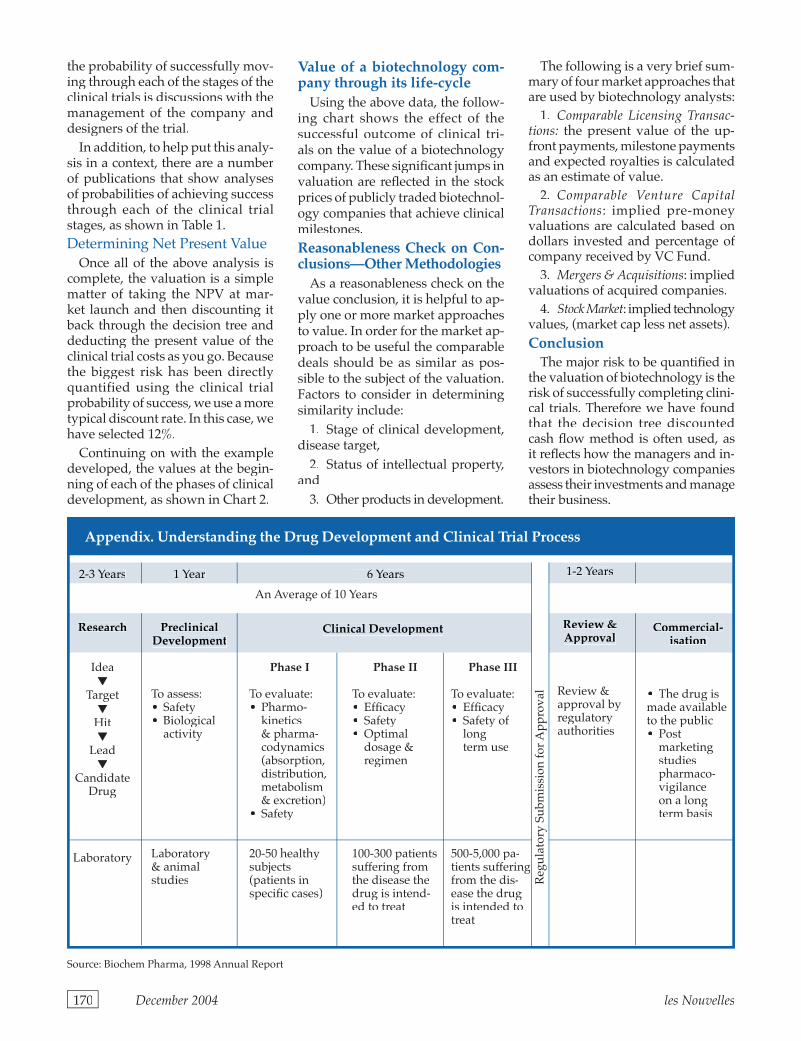
Appendix. Understanding the Drug Development and Clinical Trial Process
1 Year
PreclinicalDevelopment
To assess:• Safety• Biological
activity
Laboratory & animal studies
Phase I
To evaluate:• Pharmo-
kinetics & pharma-codynamics (absorption, distribution, metabolism & excretion)
• Safety
20-50 healthy subjects (patients in specifi c cases)
6 Years
Phase II
To evaluate:• Effi cacy• Safety• Optimal
dosage & regimen
100-300 patients suffering from the disease the drug is intend-ed to treat
1-2 Years
Review & Approval
Review &approval by regulatory authorities
Commercial-isation
• The drug is made available to the public• Post
marketing studies pharmaco-vigilance on a long term basis
Phase III
To evaluate:• Effi cacy• Safety of
long term use
500-5,000 pa-tients suffering from the dis-ease the drug is intended to treat
Clinical Development
2-3 Years
Research
Idea▼
Target▼
Hit▼
Lead▼
Candidate Drug
Laboratory
An Average of 10 Years
Source: Biochem Pharma, 1998 Annual Report
the probability of successfully mov-ing through each of the stages of the clinical trials is discussions with the management of the company and designers of the trial.
In addition, to help put this analy-sis in a context, there are a number of publications that show analyses of probabilities of achieving success through each of the clinical trial stages, as shown in Table 1.Determining Net Present Value
Once all of the above analysis is complete, the valuation is a simple matter of taking the NPV at mar-ket launch and then discounting it back through the decision tree and deducting the present value of the clinical trial costs as you go. Because the biggest risk has been directly quantified using the clinical trial probability of success, we use a more typical discount rate. In this case, we have selected 12%.
Continuing on with the example developed, the values at the begin-ning of each of the phases of clinical development, as shown in Chart 2.
Value of a biotechnology com-pany through its life-cycle
Using the above data, the follow-ing chart shows the effect of the successful outcome of clinical tri-als on the value of a biotechnology company. These signifi cant jumps in valuation are refl ected in the stock prices of publicly traded biotechnol-ogy companies that achieve clinical milestones.Reasonableness Check on Con-clusions—Other Methodologies
As a reasonableness check on the value conclusion, it is helpful to ap-ply one or more market approaches to value. In order for the market ap-proach to be useful the comparable deals should be as similar as pos-sible to the subject of the valuation. Factors to consider in determining similarity include:
1. Stage of clinical development, disease target,
2. Status of intellectual property, and
3. Other products in development.
The following is a very brief sum-mary of four market approaches that are used by biotechnology analysts:
1. Comparable Licensing Transac-tions: the present value of the up-front payments, milestone payments and expected royalties is calculated as an estimate of value.
2. Comparable Venture Capital Transactions: implied pre-money valuations are calculated based on dollars invested and percentage of company received by VC Fund.
3. Mergers & Acquisitions: implied valuations of acquired companies.
4. Stock Market: implied technology values, (market cap less net assets).Conclusion
The major risk to be quantifi ed in the valuation of biotechnology is the risk of successfully completing clini-cal trials. Therefore we have found that the decision tree discounted cash fl ow method is often used, as it refl ects how the managers and in-vestors in biotechnology companies assess their investments and manage their business.
les NouvellesDecember 2004170
Reg
ula
tory
Su
bmis
sion
for
Ap
pro
val
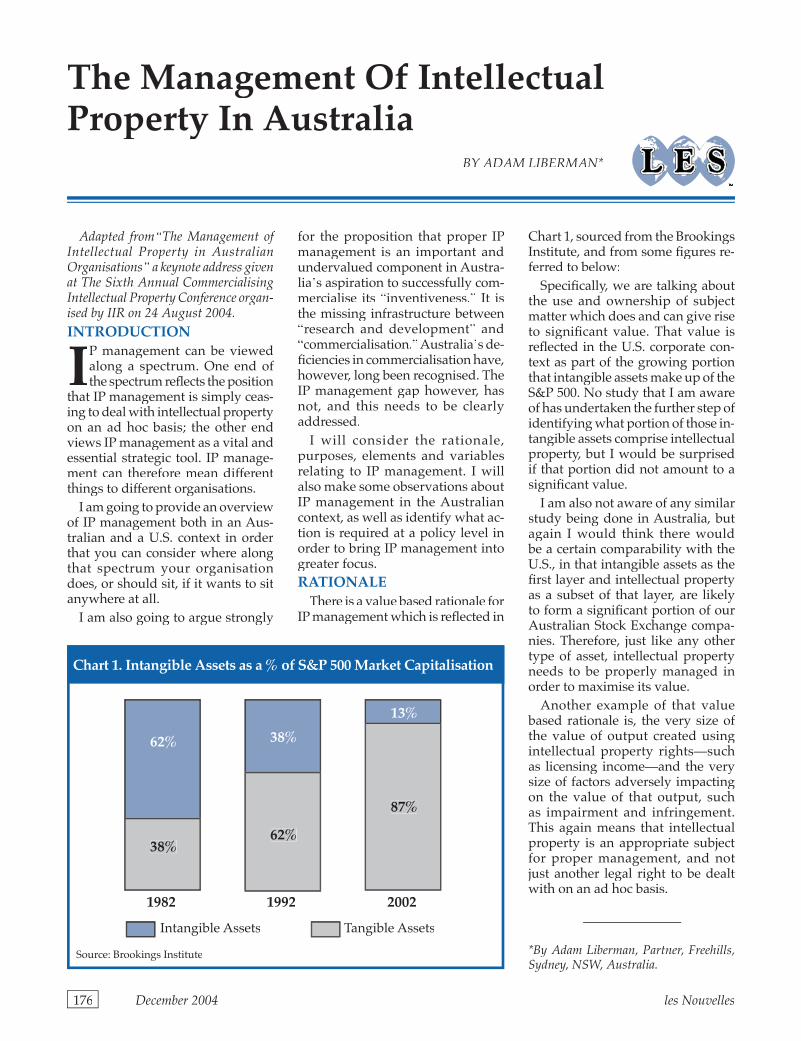
The Management Of Intellectual Property In Australia
BY ADAM LIBERMAN*
*By Adam Liberman, Partner, Freehills, Sydney, NSW, Australia.
les NouvellesDecember 2004176
Adapted from“The Management of Intellectual Property in Australian Organisations” a keynote address given at The Sixth Annual Commercialising Intellectual Property Conference organ-ised by IIR on 24 August 2004.INTRODUCTION
IP management can be viewed along a spectrum. One end of the spectrum refl ects the position
that IP management is simply ceas-ing to deal with intellectual property on an ad hoc basis; the other end views IP management as a vital and essential strategic tool. IP manage-ment can therefore mean different things to different organisations.
I am going to provide an overview of IP management both in an Aus-tralian and a U.S. context in order that you can consider where along that spectrum your organisation does, or should sit, if it wants to sit anywhere at all.
I am also going to argue strongly
for the proposition that proper IP management is an important and undervalued component in Austra-liaʼs aspiration to successfully com-mercialise its “inventiveness.” It is the missing infrastructure between “research and development” and “commercialisation.” Australiaʼs de-fi ciencies in commercialisation have, however, long been recognised. The IP management gap however, has not, and this needs to be clearly addressed.
I will consider the rationale, purposes, elements and variables relating to IP management. I will also make some observations about IP management in the Australian context, as well as identify what ac-tion is required at a policy level in order to bring IP management into greater focus.RATIONALE
There is a value based rationale for IP management which is refl ected in
Chart 1, sourced from the Brookings Institute, and from some fi gures re-ferred to below:
Specifi cally, we are talking about the use and ownership of subject matter which does and can give rise to signifi cant value. That value is refl ected in the U.S. corporate con-text as part of the growing portion that intangible assets make up of the S&P 500. No study that I am aware of has undertaken the further step of identifying what portion of those in-tangible assets comprise intellectual property, but I would be surprised if that portion did not amount to a signifi cant value.
I am also not aware of any similar study being done in Australia, but again I would think there would be a certain comparability with the U.S., in that intangible assets as the fi rst layer and intellectual property as a subset of that layer, are likely to form a signifi cant portion of our Australian Stock Exchange compa-nies. Therefore, just like any other type of asset, intellectual property needs to be properly managed in order to maximise its value.
Another example of that value based rationale is, the very size of the value of output created using intellectual property rights—such as licensing income—and the very size of factors adversely impacting on the value of that output, such as impairment and infringement. This again means that intellectual property is an appropriate subject for proper management, and not just another legal right to be dealt with on an ad hoc basis.
Source: Brookings InstituteChart 1. Intangible Assets as a % of S&P 500 Market Capitalisation
Source: Brookings Institute
1982 1992 2002
62%
38%
38%
62%
13%
87%
Tangible AssetsIntangible Assets
The figures set out below are estimates from the U.S. intellec-tual property merchant bank, ICMB Ocean Tomo:U.S. Estimates
• Over US$100 billion annually collected in Intellectual Property licensing income.
• Over US$200 billion annually written off from Intellectual Prop-erty impairments.
• Over US$300 billion annually in unpaid infringements.
Whilst these figures are large, they clearly do not take into ac-count a whole range of other value creating activities involving the use of intellectual property, e.g. securitisation based on intellectual property rights, sale and purchases of intellectual property rights, using intellectual property rights as secu-rity for fi nancings and the revenue earned from patented products, to name but a few. We in Australia can aspire to achieve our equivalent value of licensing income referable to the size of our economy. If the U.S. economy is 22 times larger than the Australian economy, then in simple proportional terms, Australia would expect to be earning licensing income of over US$4.5 billion, suffer-ing impairments of over US$9 billion and infringements of over US$13.6 billion. I am not aware that there are any comparable fi gures for Austra-lia, but I would be very surprised if a fi gure of US$4.5 billion in licensing income was being achieved. I sug-gest that it will not be achieved until proper IP management becomes an embedded feature of Australiaʼs business landscape between the research and development function and the commercialisation function, and, of course, until we get better at commercialisation.
Also, separately from these very large numbers, in my view, it just makes sense because if you have a bundle of rights that the law grants you, and others want those rights, then there is clearly a greater likeli-hood to extract the maximum value from those rights if they are properly managed, than if they are not.
PURPOSEThe nature of IP management can
vary signifi cantly, depending upon its purpose or purposes. The three purposes that I usually encounter are the following:Extraction of maximum value for benefi t of relevant stakeholders
The nature of the value to be extracted differs depending upon the nature of the organisation being considered. Thus, at the extremes, a purely profi t motivated organisa-tion will have a different concept of value to a purely “public good”motivated organisation and as such a different concept of the value that each would seek to extract for their relevant stakeholders.Risk management
Increasingly also organisations are thinking about intellectual property in the context of risk management. Amongst the risk areas, particularly in the United States (a market that most Australian businesses aspire to enter), licensors have been held to be liable for the activities of their licensees. Additionally, in the United States, I understand that there is a growing trend to intellec-tual property based class actions by shareholders. Those actions include allegations about misleading state-ments and prospectuses concerning patents and false claims about the exclusivity of licences.
In Australia, there is no reason why the provisions of section 180 of the Corporations Act, relating to the duties of directors, could not apply to directors of a company if those directors do not fulfill their duty concerning the management of a companyʼs intellectual property and that company thereby sustains a loss.
There is also a growing friction be-tween employer and employee rights in intellectual property which is il-lustrated by the recent Federal Court case of Victoria University of Technol-ogy v. Wilson. That friction could be minimised by better intellectual property management practices.
These are obviously not the only risks that need to be considered. A
hierarchy of the principal risk areas likely to affect an organisation need to be properly identifi ed in order to deal with this purpose. Record keeping
Finally, whilst record keeping may seem to be the simplest purpose to implement, you may be surprised to know the number of transactions that I am aware of where delay and signif-icant additional costs were incurred because details of an organisationʼs intellectual property were not in or-der—simple things like not recording an assignment or forgetting the ex-istence of overseas registrations can cause unnecessary problems.
Importantly, the above purposes should not be considered to be either mutually exclusive or exhaustive. Additionally, whatever purposes are identifi ed as relevant to a particular organisationʼs IP management, the success or otherwise of that manage-ment should be judged against those purposes and not others. ELEMENTSLegal rights
A crucial component of a suc-cessful IP management strategy is the recognition that intellectual property is a bundle of legal rights and that those rights can be complex and differ from country to country. Thus, whilst an organisation may well have excellent systems in place to deal with whatever issues they are intended to deal with, if the appropriate legal input is not built into those systems, they will be of lesser or nil value depending upon the circumstances.
For example, it may be important to know and deal with the fact that co-ownership of patents is dealt with differently under the Australian law, than it is under U.S. law. It may also be important to know things such as:
(a) just because your organisation is referred to as an “exclusive licens-ee” under a patent licence, that will not necessarily mean that it will have the rights of an “exclusive licensee”under relevant patent legislation;
(b) an obligation to pay patent royalties which extends beyond the term of a relevant patent, will not be
les Nouvelles December 2004 177
enforceable in the U.S.;(c) in Australia, the entirety of an
agreement may be brought to an end if one of the patents that is licensed under it is no longer in force – and this, even though the agreement may deal with a much wider range of subject matter than just patents;
(d) in Australia, that registered trade marks cannot be assigned for a part of Australia, but patents and copyrights can be; and
(e) registered trade marks are the only form of registered intellectual property right that can have on un-limited term.
The list of these sorts of examples can literally go on forever and that is why having appropriate legal input at the appropriate time is particu-larly important.Leadership
Another crucial element of a suc-cessful IP management program is that leadership of the relevant or-ganisation participates in, endorses and champions the program, e.g. if education sessions are conducted, the relevant leaders of the organisa-tion should be seen as active partici-pants in those sessions.Education
Education sessions cannot be one off, must be part of the induction program of an organisation, must be given at least equal priority to any other education programs conduct-ed for staff in an organisation and cannot rely solely on on-line learn-ing as its basis. The education ses-sions should be conducted by both internal and external personnel; the external personnel being particularly important to provide both fresh ideas and reinforce existing good practices that derive from experiences outside your organisation. Resources
In an extensive study of U.S. indus-try by Petrash Williamson entitled “Strategic and Operational Manage-ment of Intellectual Property Benchmark Report,” in keeping with the value proposition mentioned at the outset of this talk, it was found that:“Generally intellectual property is
recognised as an important compo-
nent of [a] companyʼs value. There is [however] a gap between this rec-ognition and providing the resources needed to effectively manage…IP portfolios.”
Anecdotally, in Australia that recognition of value varies from or-ganisation to organisation. Proper resourcing will be dependent upon the extent to which the following propositions prevail:
• That measurable returns are required from an investment in IP management.
• That there is inherent merit in properly managing IP without necessarily having all the metrics to prove it.
I discuss the important issue of metrics below, but in the meantime, highlight another key point in the resources debate. The key point is that the “resources debate” appears to be based on the incorrect premise that all the relevant resources have to be made available at the one time. When viewed in that light the cost of implementation can be viewed as prohibitive. If, however, the es-tablishment and maintenance of a proper IP management regime was viewed as an incremental exercise, the cost of resourcing it is less likely to be viewed in such extreme terms.Alignment with organisationʼs strategy/business plan
Just as all other aspects of the man-agement of an organisation need to be aligned to that organisationʼs strategy and business plan, so the management of an organisationʼs intellectual property needs to be so aligned. The issue is not whether this is a correct approach to adopt, rather the issue is how best to imple-ment that approach. The principal diffi culty in such implementation, in my experience, derives from two sources. Firstly, that intellec-tual property has traditionally been viewed principally as a legal func-tion; this in turn means that it has been viewed as a place where costs are incurred rather than revenue earned. Secondly, there is little in the way of management tradition and skills for dealing with it.
Before I suggest some methods for
creating the alignment sought, I give an example of the potential benefi ts of such alignment.
Company A identifi es a market need that if met would bring about anticipated revenue on a worldwide basis of $1 billion per annum. Patent and design searches are undertaken to determine the extent to which such a product is already covered by published patent applications, granted patents or designs.
Company B is identifi ed as having signifi cant coverage in this area. In-vestigations into Company Bʼs actual market activities in this area reveal that none of the relevant products are yet available on the market and further that Company Bʼs fi nancial position means that it is unlikely that it would have the resources on its own to bring such products to market in the near future.
Company A considers the follow-ing options:
• Acquiring Company B;• Acquiring the patent/design
portfolio;• Licensing the patent/design
portfolio;• Approaching Company B to
form a joint venture; • Employing the principal in-
ventors/designer of Company B disclosed in the patents, etc.
From this example, one can see that there is an interaction between the creators of the relevant strategy/business plan and those who deal with IP management for Company A. It is that interaction between those who face the market or are respon-sible for an organisationʼs activities in the market, and those involved in or responsible for IP management that is crucial to bringing about that alignment. How this interaction best occurs will differ from organisation to organisation. In the Australian Nuclear Science and Technology Organisation (ANSTO), a research based organisation, there is a Pat-ent Management Committee that comprises ANSTO business devel-opment people, ANSTO intellectual property management people, AN-STO scientists, as well as qualifi ed
les NouvellesDecember 2004178
persons external to ANSTO who are bound by confi dentiality undertak-ings. ANSTO Business Development supports the patent protection costs for inventions recommended by the Patent Management Committee for up to 18 months after fi ling the ini-tial patent application. During the 18 month period inventions with recognised commercial potential identified by the Patent Manage-ment Committee will progress fur-ther through the ANSTO business development process.
In other organisations, IP man-agement reports to relevant busi-ness units; in others, there is a regular interaction with marketing departments; in others, the head of IP management sits on the body within the organisation responsible for developing strategy and busi-ness planning.
Having made it sound relatively easy to achieve this alignment, it is heartening to a certain extent to fi nd that in the U.S. context, that alignment is also not being easily achieved. Thus, amongst the con-clusions of the above mentioned Petrash Williamson study, are the following:“Intellectual property is not very
well aligned with the business strate-gies of the survey companies…”“Not a lot of management process-
es are in place to assure alignment of intellectual property tactics and that actions are aligned with the business strategy.”
Heartening as those conclusions may be, in that they perhaps indicate we in Australia may not be that far off the pace, this is where the greatest return from IP management can be achieved, i.e. aligning the tools that can provide exclusivity and protec-tion with where the greatest market return and market need lies, and therefore providing the necessary infrastructure between creativity and commercial success.Inventory, valuation and audit
There are a few simple points that I would like to make in relation to the elements of inventory, valuation and audit. Firstly, you need to know what you have before you can manage it,
and as such, the need for an inven-tory. Secondly, you need to keep that inventory up to date otherwise it will lose its relevance. Thirdly, separately from any accounting requirements, attribution of value is a proxy for de-termining priorities in management, and is therefore a useful tool to have. Fourthly, by audit I mean a regular review of the inventory to determine its relevance to the organisationʼs strategy. Fifthly, using the opportu-nity presented by the introduction of the new accounting standards for intangible assets, commencing 1 January 2005, as a springboard to create an intellectual property inven-tory and therefore as a cost effective incremental step in developing an IP management program.Monitoring competitorsʼ activities
There are a number of reasons for monitoring competitorsʼ activities in relation to intellectual property. The fi rst is that for registrable rights such as designs, patents and trade marks, fi lings may be a useful pointer to the direction that competitors may be heading. The second is to prevent your competitors from obtaining certain rights, e.g. through an opposi-tion process. The third is to determine the extent to which your competitors may be infringing your rights.
All of these are legitimate reasons and all of them should be considered in any monitoring program.
The Petrash Williamson study found that:“Most companies routinely monitor
their competitorsʼ patent activities.”Without in any way being exhaus-
tive, in my experience, trade mark monitoring has been used as an early warning device by pharmaceutical companies concerned about the activities of their generic competi-tors and by consumer companies to determine the next line of snack food that their competitors are likely to introduce. Design registra-tion fi lings have been used by shoe companies in the youth market to determine where the market leader is heading.
Separately from monitoring the fi ling activities of your competitors
in the actual geographic market that you compete in, monitoring the ac-tivities of market leaders in other markets can also be advantageous, particularly if you know or it is likely that those market leaders will take little interest in the Australian market or other geographic markets relevant to your interest.Enforcement
An organisation will need to develop a mindset about enforce-ment that there is no such thing as the “self-enforcement of rights,” i.e. that obtaining the relevant rights is only part getting the benefi t of those rights. An important part of creating that mindset within an organisation is the allocation of a budget for deal-ing with such contingencies. This provides a clear signpost for the organisation that some money may need to be spent and therefore some action may be required. Budgeting for such a contingency should not be viewed as other than a normal feature of an organisationʼs budget-ing process.
The development of a policy for dealing with enforcement should preferably be characterised in terms of “protecting an organisationʼs assets” rather than “dealing with infringements.” The former is a characterisation which makes it an issue for the organisation as a whole, rather than an issue just for the organisationʼs lawyers, and as such, something removed from the organisation itself.
Whilst the policy should be un-compromising in terms of protecting an organisationʼs intellectual prop-erty, it should also recognise that in many instances infringements are inadvertent and that therefore they can usually be dealt with by well drafted letter from the organisation itself. If such a letter and follow up steps do not achieve the desired re-sult, then the policy should clearly identify a process for the matter to be escalated. The policy should be appropriately disseminated within the organisation.
Three particular features of en-forcement are worth commenting on. Firstly, any letter of demand that
les Nouvelles December 2004 179
is written should not arm the recipi-ent with a means of attacking your organisation on the basis the letter contains what are known as “unjus-tifi ed threats.” Unjustifi ed threats are actionable in their own right in many jurisdictions, including Australia. Secondly, all your com-munications with your professional advisers should ideally be protected by legal professional privilege, i.e. it is preferable for advice to be ob-tained through your lawyers and not through other professionals such as accountants. Finally you should be prepared and factor into your attack on any alleged infringer that they may seek to counter by attacking your intellectual property rights.
In simple terms, all of the preced-ing means that enforcement should be thought of in proactive terms rath-er than reactive terms, i.e. something you control, rather than something that controls you. Incentives
There is no IP management pro-gram that I have encountered which has not had an incentive component of some sort built into it. Incentives range from fi nancial to non-fi nancial and can focus anywhere along the spectrum from creation of relevant subject matter, to that subject mat-ter encountering the market place. None of the incentive components that I have seen, however, relate to adherence to or developing im-provements to the IP management process itself. I think that these latter activities are just as worthy of con-sideration, to the extent that they can have a positive impact on the principal focus of the incentives.
As to what the incentives should target, there are three principal areas which require consideration:
(a) the factors that motivate the relevant constituency;
(b) the activities that an organisa-tion seeks to encourage; and
(c) the impact that the relevant activities have on the business of the organisation.
Thus, using a simple example, if money is the motivating factor and the activity that is sought to be en-couraged is patent fi lings, this is one
incentive level. The impact or value that the relevant patent fi lings have on the business of an organisation is another incentive level. It is this impact layer that is frequently miss-ing from incentive programs and it is this layer which is likely to be most relevant to an organisationʼs intellec-tual property strategy being aligned with its business strategy. It is the right mix of these three layers that should be the goal of any incentives program, and needs to be tailored for the relevant circumstances at hand.Metrics
Metrics are perhaps the most difficult part of IP management. By metrics I mean establishing meaningful, quantifi able measures of the impact of IP management on an organisation. Amongst the diffi culties in seeking such metrics are fi rstly, that some things are not easily susceptible to measurement, e.g. where the sale of a business goes through smoothly because the intellectual property was in order or where an organisation has de-tected and stopped a competitorʼs infringement because of a monitor-ing program of competitor activities. Secondly, it may not be possible to isolate one particular activity as the cause of a certain outcome, e.g. it may not only be signifi cant to have a patented product in the market, which derives from aligning IP strategy with business strategy, but the marketing, strategy and mi-nimisation of manufacturing costs, amongst other things, can be equally important to a productʼs success in the market place. Thirdly, it can take time for an activity to have an impact and it may be diffi cult to determine what time should be allowed for the success or otherwise of a component of IP management to be judged.
My caution is therefore do not become obsessed by metrics, or as Professor Tim Devinney, co-author of the Australian Graduate School of Management/Freehills Report en-titled “The Management of Intellectual Property in Australian Organisations”(AGSM/Freehills Report) puts it:“…fundamentally, what you fi nd
is that the fi rms that are very good
at IP management have an under-standing that they are not going to be able to measure it perfectly and what they do is put emphasis on the processes to do it as best as they can. What we discovered in the Australian Graduate School of Management/Freehills Report is that doing it as best as your can, is a lot better than not doing it at all.”
Having said that you should not become obsessed, there are obvi-ously some measures that may be relevant and easily identifi able, e.g. licensing income, sales revenue from patented products, cost savings in maintaining a patent or trade mark portfolio etc. It should also, howev-er, be clearly understood there is no better way to attract the approval of an organisationʼs top management than to provide it with metrics that show the positive impact that IP management is having on the driv-ers of that organisation.
Additionally, whilst it is easier said than done, benchmarking your organisation against comparable organisations or market leaders should be an activity that is high on the metrics agenda.
Whatever metrics you choose or, more likely, whatever metrics evolve out of your IP management, make sure that they are meaningful to your organisationʼs purposes. Integrated/unobtrusive systems
Irrespective of whether the ap-propriate metrics have been or are capable of being determined in rela-tion to an IP management program, the more effi cient the systems that form part of the program, the more likely the program will add value to an organisation. That value is more likely to arise if the systems do not impose a signifi cant additional bur-den on those affected by it. Thus, where possible, they should be integrated into existing systems of an organisation, e.g. in the case of establishing an intellectual property inventory, this could be an element derived from the requirement of the accounting standards to have an in-ventory of intangible assets. They should also be unobtrusive in the
les NouvellesDecember 2004180
sense that they are or become a nor-mal feature of an organisationʼs day to day activities. This in turn results in conduct that becomes “second nature,” or “unconsciously skilled”in psychologistʼs jargon.
The areas where systems are needed are as follows:
• Capture/assessment/conver-sion of knowledge to IP rights.
• Interaction with lawyers at the right time.
• Interaction with business units at the right time.
• Interaction with strategic plan-ners.
• Keeping intellectual property inventory current.
• Monitoring competitorsʼ activi-ties.
• Capturing and assessing infor-mation relevant to any metrics.
• Administration of IP portfolio.In relation to the capture, assess-
ment and conversion of knowledge to intellectual property rights, by way of example, some companies have their in-house patent attorneys physically located next to, or inside laboratories, where developments are likely to occur. Those patent at-torneys interact with scientists and technical people both in formal and less formal social settings.
Interactions with lawyers at the right time, in my experience, usu-ally stem from factors such as an appropriate intellectual property education program; lawyers being an appropriate sign off party in relation to certain activities, e.g. the development of a new trade mark; and lawyers taking part in the plan-ning process of an organisation.
Each of the other areas mentioned by me are equally important, but in the time available, I will not have the opportunity to consider them in any greater detail.IP Policy
An intellectual property policy can have either an inward looking component, an outward looking component, or both.
The inward looking component seeks to identify the entitlements of
an organisationʼs internal constitu-ency to the ownership and use of IP rights created within that organisa-tion, e.g. in a university context, students generally, Ph.D. students specifically, academics, both per-manently employed and visiting scholars, part time staff who have appointments both at universities and at hospitals, etc. That policy will not only seek to identify such entitlements, but it will also seek to make the policy on those en-titlements legally binding. Some people tend to forget, however, that the mere promulgation of a policy does not necessarily mean that it is automatically legally binding on the relevant constituency.
The outward looking component seeks to identify an organisationʼs preferred means of dealing with its IP rights and with IP rights that arise from interactions with third parties. The outward looking component may be published externally or may be purely for internal consumption. An organisation needs to very care-fully consider the advantages and disadvantages that publication can bring about.Responsibility for implementation
The final element that I con-sider is the person responsible for implementing any IP manage-ment program. That person must have se-niority and status and must, if any metrics are determined for the IP management program, have achieve-ment of those metrics as part of his or her key performance indicators.
The preceding may be a useful checklist of issues for you to consider in developing your own IP manage-ment program.VARIABLES
After considering the possible purposes and elements that can comprise an IP management pro-gram, one still needs to consider other variables in order to make that program relevant to your or-ganisation. Firstly, are the activities or business being conducted by your organisation—a fi nancial in-stitution has very different IP needs to a beer brewing company, which
in turn has very different needs to an organisation that licenses the manufacture of its beer products. Secondly, the industry in which an organisation conducts those activi-ties or its business will also have a signifi cant infl uence because of the behaviour of competitors regard-ing IP. Intellectual property may be viewed as important in an industry, but no one in the industry devotes any signifi cant resources to its man-agement. It may, on the other hand, be viewed as important and sig-nifi cant resources are devoted to its management. And fi nally, rightly or wrongly, intellectual property may not be viewed as important in an industry at all. Whether one does or does not conform with any industry norms concerning IP management, it is useful to undertake the exercise of determining what those norms (if any) are, because as a result you may be able to gain some advantage in either adopting largely conforming conduct or adopting non-conform-ing conduct regarding IP manage-ment. Such information could arise from informal enquiries; it could also arise from industry associations un-dertaking surveys of their members; it could also arise from surveys un-dertaken by IP based associations, with answers being categorised by industry. The above mentioned Pe-trash Williamson study is based on the latter approach, in that it resulted from a survey of the members of the U.S. Intellectual Property Owners Association. I am not aware that much industry association based or IP association based survey activity of the type referred to above actu-ally occurs in Australia, but would suggest that it would be very useful tool to have in this context.
Thirdly, the jurisdiction in which an organisation conducts its activi-ties or business will also be a sig-nifi cant determinant of the extent and nature of IP management. Conducting business in the U.S.A. is more likely to make IP manage-ment important than would be the case if business is being conducted in Russia, for instance.
Fourthly, the nature of the intel-lectual property itself will be a very
les Nouvelles December 2004 181
signifi cant factor in determining the nature and extent of IP management. A patent based IP management pro-gram is very different to a trade se-cret based IP management program or a copyright based IP management program, and so on.
The final, but very important, variable that I briefl y touch on is the culture of the organisation itself. Amongst the signifi cant consider-ations in relation to culture are the approach of the leader—for instance, whether what the leader says goes or whether the relevant constitu-ency within any organisation fi rst has to buy in to an activity before it is truly implemented. The culture of an organisation must be carefully read and understood as part of the process of determining how best to initiate and maintain an IP manage-ment program.
The preceding milieu of compo-nents draws me to two conclusions: the fi rst is that “one size does not fi t all!” so far as IP management is concerned and secondly, is that IP management requires a range of skills in order for it to be properly implemented. OBSERVATIONS
For those considering the imple-mentation of an IP management program within their organisations, the following observations may be of some value:
• Generally speaking, IP man-agement is probably not the most important issue for Australian or-ganisations today, but it is likely to be more important than it is currently
appreciated by most Australian organisations. Therefore the impor-tance of IP management should not be oversold.
• That IP management should be viewed as important for all Aus-tralian organisations that seek to conduct activities in sophisticated markets outside of Australia. I have heard too many stories of Australian businesses that attack a foreign mar-ket such as the United States and, figuratively speaking, come back with a “bloody nose” because they have not done their homework on the intellectual property landscape in the market that they are seeking to enter.
• That IP management should be viewed as important for all organisa-tions that are creators of knowledge and that want to benefi t fi nancially from that knowledge being used in a market place.
• That the change in accounting standards to start in Australia from 1 January 2005 relating to intangible assets will provide a wonderful opportunity for Australian organi-sations to embark upon the develop-ment of IP management programs, and on a grander scale, intellectual asset management programs.POLICY INITIATIVES
In a context where in the Australian Graduate School of Management/Freehills Report commented “if Aus-tralia is to develop to its full potential then the management of knowledge assets must become a high priority not just to research organisations and a few elite fi rms, but to the vast ma-
jority of fi rms throughout the coun-try. One area where this needs to be emphasised is in the management of IP—the legally enforceable rights that create and provide protection for knowledge assets,” the following two suggested policy initiatives may as-sist in realising that potential sooner than would otherwise be the case.
Firstly, there needs to be a clear policy recognition by Australian governments that IP management provides the missing infrastructure between “research and development”and “commercialisation.” There are muted signs of such recognition in that, for example, the requirements of Commonwealth Government programs such as R&D Start, BIF and COMET, specifically mention the need for an IP management plan. The additional components to join the dots and complete the picture would include separate funding being provided for IP management as part of such programs, together with a much clearer statement as to why IP management, in the strategic sense discussed above, is important for commercialisation.
Secondly, that IP management should itself be identifi ed as subject matter appropriate for a Centre of Excellence, preferably in a business school environment, where it can be separately taught and researched. Government funding for such an initiative would send a clear and resounding message that IP manage-ment should be treated as a serious and necessary discipline in backing Australiaʼs ability.
les NouvellesDecember 2004182
Patent Pools: A Solution For The Telecommunications Industry
BY DON DRINKWATER*
*Don Drinkwater recently joined the Bose Corporation where he is responsible for licensing patents and technology across the company. Previously the author was Director of Licensing at 3 Com corpora-tion. He holds a BSEE and MSEE from the University of Massachusetts and WPI respectively, and an MBA from Clark University.
les Nouvelles December 2004 183
AbstractThis paper describes patent pools and
explores the potential for additional use of patent pools in the telecommunica-tions industry. The advantages of form-ing patent pools to cover standards required to implement information technology products are covered as well as advantages to patent holders and licensees of the patent pool. This paper also discusses patent pool governance and patent pool economics.What is a Patent Pool?
Patent pools have been defi ned as “an agreement between two or more patent owners to
license one or more of their patents to one another or third parties.”1
One purpose of a patent pool is to provide a means for many com-panies to gain access to the patent rights required to sell products into the marketplace. This can promote competition and innovation. How-ever, in some cases patent pools have been used to monopolize a market. The Supreme Court broke up a patent pool of glass manufac-turers in 1945 based upon the asser-tion that the patent pool allowed its members to create a monopoly and sustain high prices2 (Hartford-Empire
Co. v. United States). For that reason, patent pools are subject to antitrust actions by the U.S. Department of Justice and care must be taken by patent pool administrators to assure that the patent pool is not unlaw-fully inhibiting competition.Brief History of Patent Pools
Patent pools have existed for many years. The Sewing Machine Combination formed a patent pool in 1856.3 In 1917 at the request of the Honorable Franklin D. Roosevelt, then the Assistant Secretary of the Navy, an aircraft patent pool was formed so that almost all aircraft manufacturers could gain access to patents necessary to supply aircraft needed to support the U.S. military in World War I. At that time the Wright Company and the Curtiss Company held patents necessary to build aircraft. Other patent pools have played a major role in bringing important technology and products to the marketplace.Patent Issues Affecting the Tele-communications Industry
The telecommunications indus-try depends upon standards for compatibility. ANSI, ITU and IEEE standards address many of the tech-nologies required for equipment to send and receive signals with com-patibility. Standards like 802.3 for Ethernet, MPEG and G.729 for data compression, and DOCSIS for mo-dems govern how devices commu-nicate with each other. Compliance with these standards is mandatory to market products successfully. To complicate matters further, many of these standards evolve to address
improvements to the products and many products must conform to multiple standards.
A recent example is the standard to send power over an ethernet cable. IEEE802.3af describes the Power over Ethernet standard. This standard provides a means to power devices such as wireless access points, IP telephones, and security devices that are connected to an ethernet cable without using a separate cable for power. Power over Ethernet technology signifi cantly en-hances the desirability and customer attractiveness of these products even though the products can and do exist without the technology. A company that does not have access to the tech-nology would be at a signifi cant dis-advantage in the marketplace.
In many cases, patents crowd the technologies required to implement the standard. Standards bodies gen-erally make participants sign agree-ments whereby they will promise to license their patents that are essential to the standard on a non-discrimina-tory and reasonable basis. However, non participants are not bound by such commitments and, even if all patent holders are offering their patents essential to the standard for license, the process of negotiating multiple licenses with each patent holder can be an onerous task. Pat-ent issues related to standards can become the subject of long lasting 1. Patents Pools: A Solution to the Problem of
Access in Biotechnology Patents, by Jeanne Clark, Legal Advisor, Offi ce of Patent Legal Administration; Joe Piccolo, Associate Solici-tor, Offi ce of the Solicitor; Brian Stanton, Bio-technology Technology Center Practice Spe-cialist; and Karin Tyson, Senior Legal Advisor, Offi ce of Patent Legal Administration with Assistance from Mary Critharis, Associate So-licitor, Offi ce of the Solicitor; Stephen Kunin Deputy Commissioner for Patent Examina-tion Policy United States Patent Trademark Offi ce (December 5, 2000),4.2. See Patents Pools, 5. 3. See Patents Pools, 4.
and expensive litigation that create a cloud of doubt for many manufac-turers. The confl ict between patent holders that have a right to receive fair compensation for their innova-tion and manufacturers that are trying to compete and to develop a marketplace for the new products creates a diffi cult environment for the industry.
While in many cases a few large companies own multiple patents es-sential to a standard, universities and individuals may also own essential patents. A disruption to technology adoption that would benefi t consum-ers can occur due to the confl icting objectives of diverse constituencies. In some cases patent pools may pro-vide a solution to such problems.The Benefi ts of a Patent Pool
A patent pool benefi ts Licensors and Licensees in a number of ways. The following lists some of the benefi ts:For the Licensor:
• Minimizes administration cost to license the essential patents.
• Allows licensing staff to work on other licensing efforts.
• Reduces the risk of costly liti-gation since the patent pool creates a shield between the Licensees and Licensors.
• Provides a means for the Licen-sor to license to a greater segment of the market.
• In many cases assures that the Licensor receives a grant back to the Licenseeʼs patents that may become essential to the standard.For the Licensee
• Provides a simple means to gain rights to many, if not all, of the pat-ents essential to build products that meet a standard.
• Minimizes legal expenses asso-ciated with negotiating and signing multiple licensees.
• Supports innovation by the Licensee since the Licensee is less likely to be stopped from practicing the standardʼs technology.
• Reduces total royalty exposure that might result from patent royalty stacking. Patent royalty stacking oc-
curs when a Licensee must take mul-tiple licenses to produce a product and the royalties stack, becoming prohibitively expensive.
• Minimizes administration costs and provides a shield between the Licensee and Licensor in regards to royalty collection and auditing.For the Industry
• Fosters competition.• Fosters innovation, since compa-
nies are rewarded for their innovation.• Provides a safety net for dis-
tributors against becoming involved with expensive patent litigation since they know that suppliers are licensed.
While the benefi ts are clear, Li-censors may believe that they will achieve higher royalties if they license directly. This may be true if they have a signifi cant organization that can institutionalize licensing programs easily. These companies may also believe that joining a pat-ent pool and agreeing to receive effective royalty rates lower than if they license directly could diminish the value of their IP. However, these companies run the risk that they will not become part of a core of companies participating in a shared manner to gain access to evolving technology essential to new areas of the standard. Patent Pool Governance
For patent pools subject to U.S. Jurisdiction, the U.S. Department of Justice and the Federal Trade Com-mission (“Agencies”) issued a set of guidelines for licensing intellectual property on April 6, 19954 that have relevance. Section 5.5 of this report addressed cross-licensing and pool-ing arrangements. The Agencies monitor such arrangements to be certain that they do not create an anti-competitive environment. Re-garding patent pooling, the Agencies do not require that the pool be open
to all who would like to join. Howev-er, the Agencies state that “exclusion from cross-licensing and pooling ar-rangements among parties that col-lectively possess market power may, under certain circumstances, harm competition.”4 The Agencies provide specifi c guidelines to assess whether exclusion inhibits competition.
The Agencies are also concerned that a pooling arrangement may deter or discourage innovation. This may occur if the pooling agreement requires grant back of the rights pro-tecting innovation at nominal rates. Participants may decide that inno-vation is not economically justifi able under such a scenario. However, the Agencies acknowledge that innova-tion may be enhanced by exploiting economies of scale and complemen-tary capabilities of the participants. Assuring participants that they will have rights to practice the technol-ogy and receive reasonable rewards is likely to encourage their invest-ment for innovation.
The Agencies should be contacted if any competitive questions exist re-garding pooling arrangements.Patent Pool Economics
Patent pools provide an effi cient means to license patents necessary to a standard. However, patent holders may believe that they will receive a lower royalty rate than they might otherwise if they license directly. Richard J. Gilbert5 provides a fairly vigorous analysis of the economics of patent pools. Trade-offs regard-ing royalty rates depend upon the number of patents in the pool and the number of companies participat-ing in the pool. While the absolute royalty rate for a single patent may be lower, the net royalties may be greater due to the decreased cost to operate the licensing program and the potential to access licensees more easily.
4. See Antitrust Guidelines for the Licensing of intellectual Property, issued by the U.S. Department of Justice and the Federal Trade Commission (April 6, 1995).
5. See Patent Pools: 100 Years of Law and Economic Solitude, Richard J. Gilbert (May 5, 2002).
les NouvellesDecember 2004184
Observations by Patent Pool Administrators
The following observations were noted during interviews with three people currently administering pat-ent pools:
1. The pool administrator evalu-ates the pool based upon market place needs and financial hurdle rates for the administrative com-pany.
2. The administrator looks for standards based technologies where more than four major patent hol-ders exist.
3. An independent evaluator is se-lected to review patents submitted to a pool and choose those deemed to be essential to the standard.
4. The administrator forms a licens-ing committee made up of members from pool participants. This commit-tee meets several times over the course of about one year to establish the terms and conditions governing the pool.
5. The administrator funds the
initiation of the pool.6. The administrator performs all
licensing activities.7. Pool membership is voluntary
and pool members do not forfeit their right to license or enforce their patents independently.
8. Pool Licensees are usually re-quired to grant back any patents that they have or obtain in the future that are essential to the standard.Summary
Patent pools provide a structure to group multiple patents owned by multiple companies that are essential to implement a standardized tech-nology. If implemented correctly and within regulated guidelines, a patent pool can be a very effi cient mecha-nism to further innovation and foster a competitive marketplace.
Patent pools have existed for many years covering technologies as diverse as sewing machines and pharmaceuticals.
The telecommunications indus-try has benefi ted from patent pools
and there may be a case to suggest that additional use of patent pools would reduce litigation expense and provide a healthier intellectual property environment for both pat-ent holders and licensees.
Patent pools are subject to antitrust actions and the patent pool adminis-trator must be certain that the patent pool adheres to certain government guidelines before implementation. While royalty rates for a specific patent may be lower, the total value of a licensing program for a Licen-sor could be higher due to the de-creased costs to license the patents, decreased litigation exposure, and increased market penetration.Acknowledgements
I want to acknowledge the help of Nathalie Beaudoin and Sarah Bernard of Sipro Lab Telecom for their help and guidance regarding the practical application of patent pools, and Dana St. James and Bill Becker, both from 3Com Corpora-tion, for their editorial comments.
les Nouvelles December 2004 185
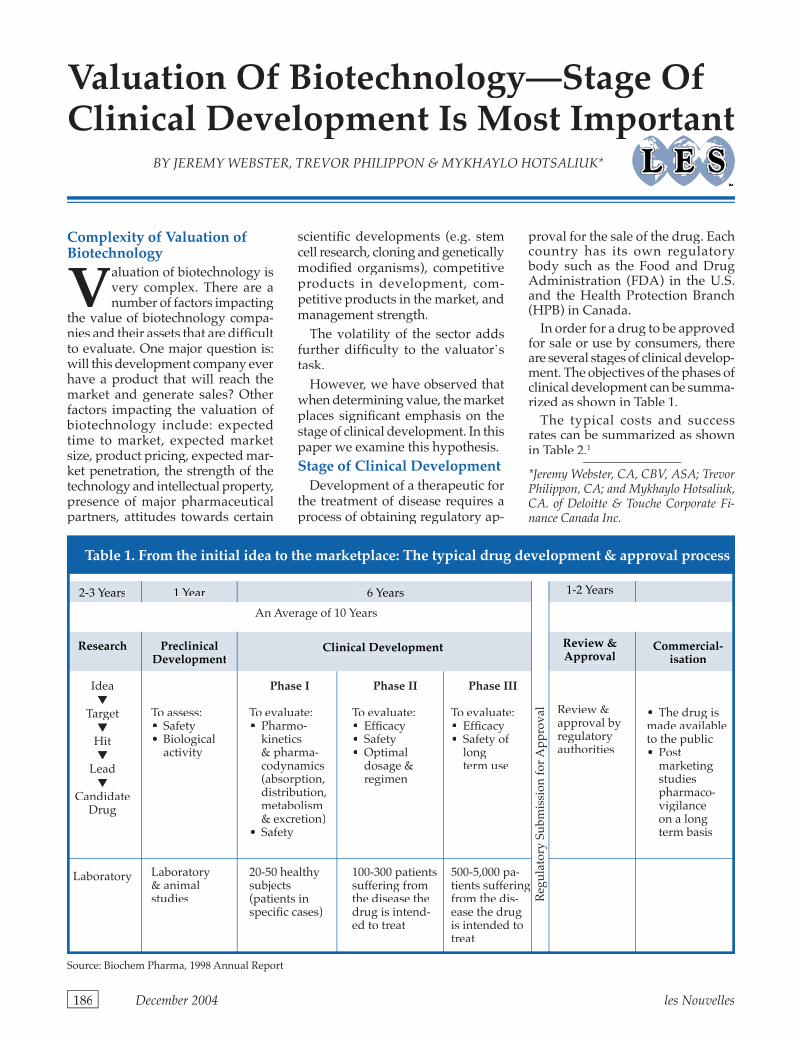
Valuation Of Biotechnology—Stage Of Clinical Development Is Most Important
BY JEREMY WEBSTER, TREVOR PHILIPPON & MYKHAYLO HOTSALIUK*
*Jeremy Webster, CA, CBV, ASA; Trevor Philippon, CA; and Mykhaylo Hotsaliuk, CA. of Deloitte & Touche Corporate Fi-nance Canada Inc.
les NouvellesDecember 2004186
Complexity of Valuation of Biotechnology
Valuation of biotechnology is very complex. There are a number of factors impacting
the value of biotechnology compa-nies and their assets that are diffi cult to evaluate. One major question is: will this development company ever have a product that will reach the market and generate sales? Other factors impacting the valuation of biotechnology include: expected time to market, expected market size, product pricing, expected mar-ket penetration, the strength of the technology and intellectual property, presence of major pharmaceutical partners, attitudes towards certain
scientifi c developments (e.g. stem cell research, cloning and genetically modifi ed organisms), competitive products in development, com-petitive products in the market, and management strength.
The volatility of the sector adds further diffi culty to the valuatorʼs task.
However, we have observed that when determining value, the market places signifi cant emphasis on the stage of clinical development. In this paper we examine this hypothesis.Stage of Clinical Development
Development of a therapeutic for the treatment of disease requires a process of obtaining regulatory ap-
proval for the sale of the drug. Each country has its own regulatory body such as the Food and Drug Administration (FDA) in the U.S. and the Health Protection Branch (HPB) in Canada.
In order for a drug to be approved for sale or use by consumers, there are several stages of clinical develop-ment. The objectives of the phases of clinical development can be summa-rized as shown in Table 1.
The typical costs and success rates can be summarized as shown in Table 2.1
Table 1. From the initial idea to the marketplace: The typical drug development & approval process
1 Year
PreclinicalDevelopment
To assess:• Safety• Biological
activity
Laboratory & animal studies
Phase I
To evaluate:• Pharmo-
kinetics & pharma-codynamics (absorption, distribution, metabolism & excretion)
• Safety
20-50 healthy subjects (patients in specifi c cases)
6 Years
Phase II
To evaluate:• Effi cacy• Safety• Optimal
dosage & regimen
100-300 patients suffering from the disease the drug is intend-ed to treat
1-2 Years
Review & Approval
Review &approval by regulatory authorities
Commercial-isation
• The drug is made available to the public• Post
marketing studies pharmaco-vigilance on a long term basis
Phase III
To evaluate:• Effi cacy• Safety of
long term use
500-5,000 pa-tients suffering from the dis-ease the drug is intended to treat
Clinical Development
2-3 Years
Research
Idea▼
Target▼
Hit▼
Lead▼
Candidate Drug
Laboratory
An Average of 10 Years
Source: Biochem Pharma, 1998 Annual Report
Reg
ula
tory
Su
bmis
sion
for
Ap
pro
val
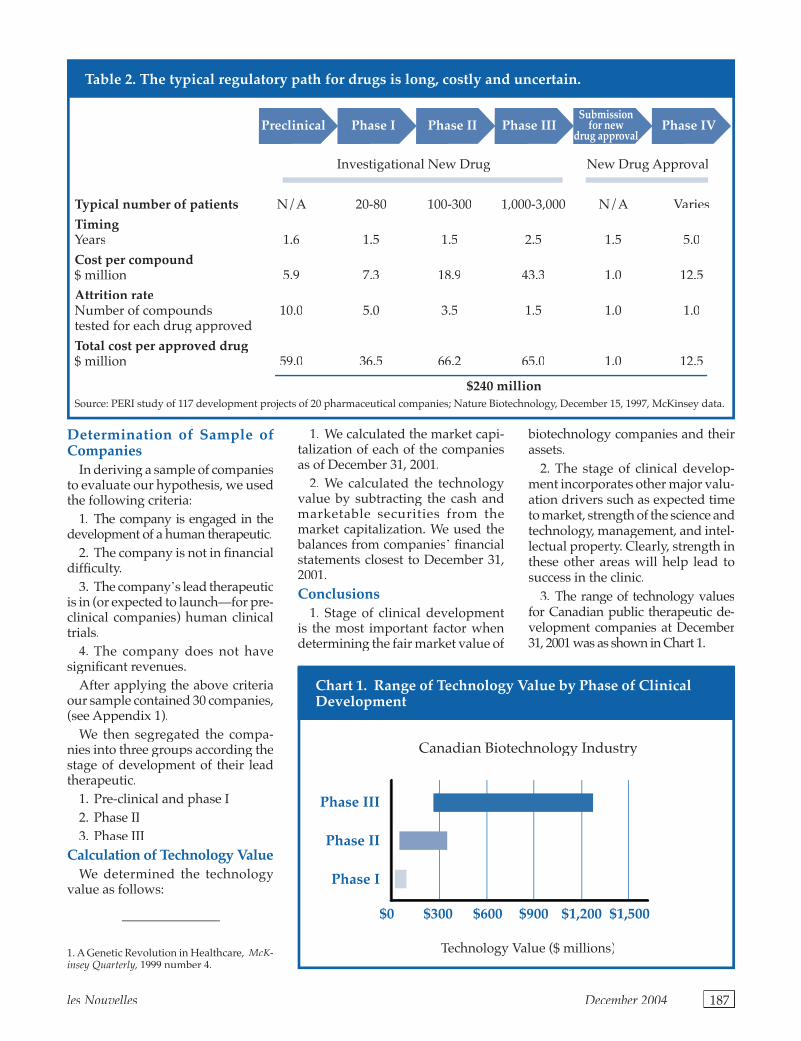
Determination of Sample of Companies
In deriving a sample of companies to evaluate our hypothesis, we used the following criteria:
1. The company is engaged in the development of a human therapeutic.
2. The company is not in fi nancial diffi culty.
3. The companyʼs lead therapeutic is in (or expected to launch—for pre-clinical companies) human clinical trials.
4. The company does not have signifi cant revenues.
After applying the above criteria our sample contained 30 companies, (see Appendix 1).
We then segregated the compa-nies into three groups according the stage of development of their lead therapeutic.
1. Pre-clinical and phase I 2. Phase II3. Phase III
Calculation of Technology ValueWe determined the technology
value as follows:
1. We calculated the market capi-talization of each of the companies as of December 31, 2001.
2. We calculated the technology value by subtracting the cash and marketable securities from the market capitalization. We used the balances from companiesʼ fi nancial statements closest to December 31, 2001.Conclusions
1. Stage of clinical development is the most important factor when determining the fair market value of
biotechnology companies and their assets.
2. The stage of clinical develop-ment incorporates other major valu-ation drivers such as expected time to market, strength of the science and technology, management, and intel-lectual property. Clearly, strength in these other areas will help lead to success in the clinic.
3. The range of technology values for Canadian public therapeutic de-velopment companies at December 31, 2001 was as shown in Chart 1.
Table 2. The typical regulatory path for drugs is long, costly and uncertain.
Chart 1. Range of Technology Value by Phase of Clinical Development
1. A Genetic Revolution in Healthcare, McK-insey Quarterly, 1999 number 4.
Investigational New Drug New Drug Approval
Typical number of patients N/A 20-80 100-300 1,000-3,000 N/A Varies
TimingYears 1.6 1.5 1.5 2.5 1.5 5.0
Cost per compound$ million 5.9 7.3 18.9 43.3 1.0 12.5
Attrition rateNumber of compounds 10.0 5.0 3.5 1.5 1.0 1.0tested for each drug approved
Total cost per approved drug$ million 59.0 36.5 66.2 65.0 1.0 12.5
$240 million Source: PERI study of 117 development projects of 20 pharmaceutical companies; Nature Biotechnology, December 15, 1997, McKinsey data.
Canadian Biotechnology Industry
Phase III
Phase II
Phase I
$0 $300 $600 $900 $1,200 $1,500
Technology Value ($ millions)
Phase IVPreclinical Phase II Phase I Phase III Submission
for newdrug approval
les Nouvelles December 2004 187
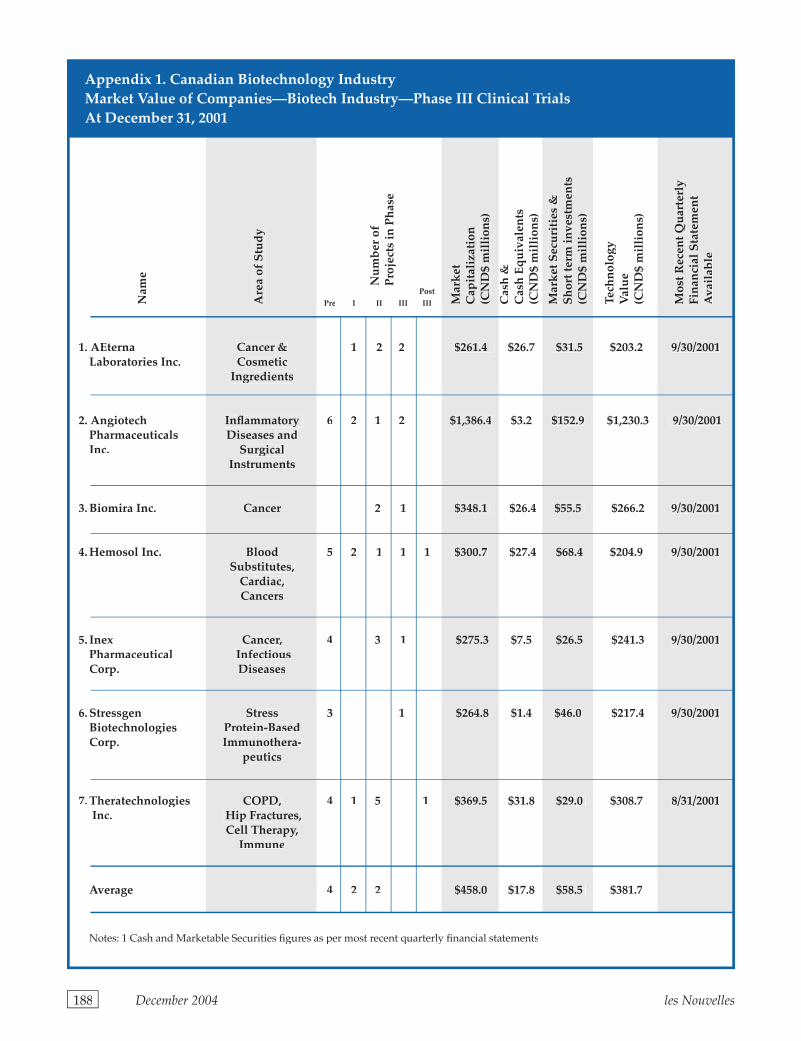
les NouvellesDecember 2004188
Post
Pre I II III III
1. AEterna Cancer & 1 2 2 $261.4 $26.7 $31.5 $203.2 9/30/2001Laboratories Inc. Cosmetic
Ingredients
2. Angiotech Infl ammatory 6 2 1 2 $1,386.4 $3.2 $152.9 $1,230.3 9/30/2001Pharmaceuticals Diseases andInc. Surgical
Instruments
3. Biomira Inc. Cancer 2 1 $348.1 $26.4 $26.4 $55.5 $266.2 9/30/2001
4. Hemosol Inc. Blood 5 2 1 1 1 $300.7 $27.4 $68.4 $204.9 9/30/2001 Substitutes, Cardiac, Cancers
5. Inex Cancer, 4 3 1 $275.3 $7.5 $26.5 $241.3 9/30/2001Pharmaceutical InfectiousCorp. Diseases
6. Stressgen Stress 3 1 $264.8 $1.4 $46.0 $217.4 9/30/2001Biotechnologies Protein-BasedCorp. Immunothera-
peutics
7. Theratechnologies COPD, 4 1 5 1 $369.5 $31.8 $29.0 $308.7 8/31/2001 Inc. Hip Fractures,
Cell Therapy, Immune
Average 4 2 2 $458.0 $17.8 $58.5 $381.7
Notes: 1 Cash and Marketable Securities fi gures as per most recent quarterly fi nancial statements
Nam
e
Are
a of
Stu
dy
Nu
mb
er o
fP
roje
cts
in P
has
e
Mar
ket
Cap
ital
izat
ion
(CN
D$
mil
lion
s)
Cas
h &
Cas
h E
qu
ival
ents
(CN
D$
mil
lion
s)
Mar
ket
Sec
uri
ties
&S
hor
t ter
m in
vest
men
ts(C
ND
$ m
illi
ons)
Tech
nol
ogy
Val
ue
(CN
D$
mil
lion
s)
Mos
t Rec
ent Q
uar
terl
yFi
nan
cial
Sta
tem
ent
Ava
ilab
le
Appendix 1. Canadian Biotechnology IndustryMarket Value of Companies—Biotech Industry—Phase III Clinical TrialsAt December 31, 2001
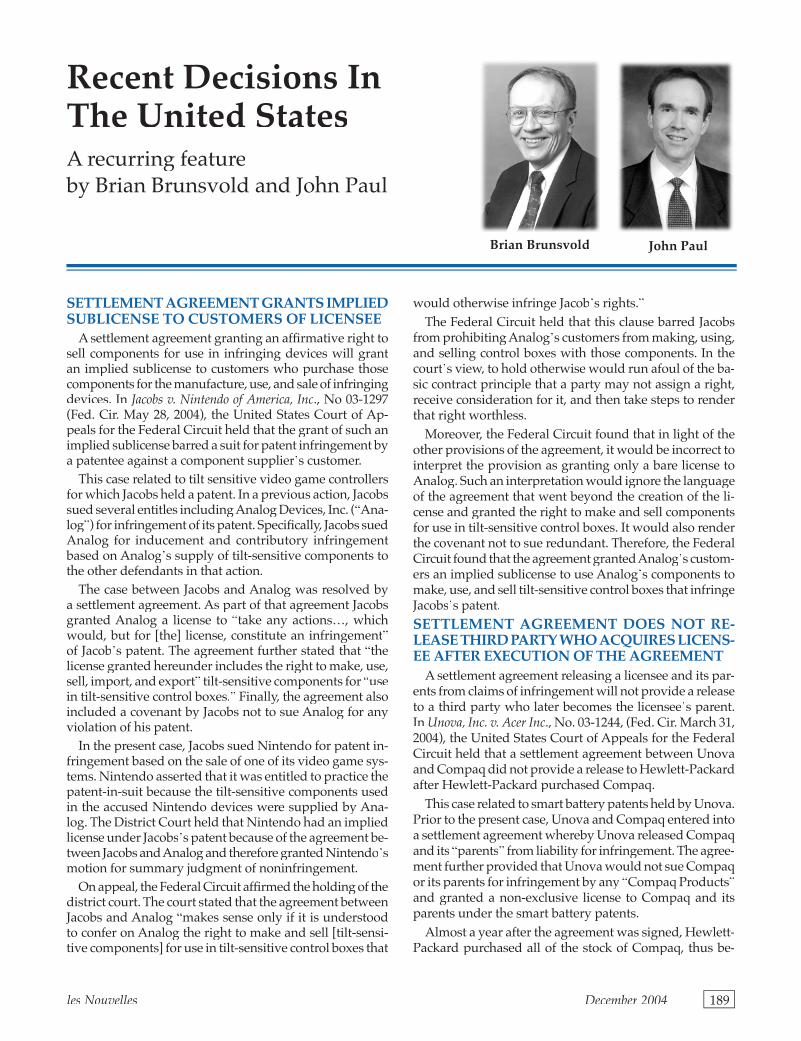
A recurring featureby Brian Brunsvold and John Paul
Recent Decisions In The United States
John PaulBrian Brunsvold
SETTLEMENT AGREEMENT GRANTS IMPLIED SUBLICENSE TO CUSTOMERS OF LICENSEE
A settlement agreement granting an affi rmative right to sell components for use in infringing devices will grant an implied sublicense to customers who purchase those components for the manufacture, use, and sale of infringing devices. In Jacobs v. Nintendo of America, Inc., No 03-1297 (Fed. Cir. May 28, 2004), the United States Court of Ap-peals for the Federal Circuit held that the grant of such an implied sublicense barred a suit for patent infringement by a patentee against a component supplierʼs customer.
This case related to tilt sensitive video game controllers for which Jacobs held a patent. In a previous action, Jacobs sued several entitles including Analog Devices, Inc. (“Ana-log”) for infringement of its patent. Specifi cally, Jacobs sued Analog for inducement and contributory infringement based on Analogʼs supply of tilt-sensitive components to the other defendants in that action.
The case between Jacobs and Analog was resolved by a settlement agreement. As part of that agreement Jacobs granted Analog a license to “take any actions…, which would, but for [the] license, constitute an infringement”of Jacobʼs patent. The agreement further stated that “the license granted hereunder includes the right to make, use, sell, import, and export” tilt-sensitive components for “use in tilt-sensitive control boxes.” Finally, the agreement also included a covenant by Jacobs not to sue Analog for any violation of his patent.
In the present case, Jacobs sued Nintendo for patent in-fringement based on the sale of one of its video game sys-tems. Nintendo asserted that it was entitled to practice the patent-in-suit because the tilt-sensitive components used in the accused Nintendo devices were supplied by Ana-log. The District Court held that Nintendo had an implied license under Jacobsʼs patent because of the agreement be-tween Jacobs and Analog and therefore granted Nintendoʼs motion for summary judgment of noninfringement.
On appeal, the Federal Circuit affi rmed the holding of the district court. The court stated that the agreement between Jacobs and Analog “makes sense only if it is understood to confer on Analog the right to make and sell [tilt-sensi-tive components] for use in tilt-sensitive control boxes that
would otherwise infringe Jacobʼs rights.”The Federal Circuit held that this clause barred Jacobs
from prohibiting Analogʼs customers from making, using, and selling control boxes with those components. In the courtʼs view, to hold otherwise would run afoul of the ba-sic contract principle that a party may not assign a right, receive consideration for it, and then take steps to render that right worthless.
Moreover, the Federal Circuit found that in light of the other provisions of the agreement, it would be incorrect to interpret the provision as granting only a bare license to Analog. Such an interpretation would ignore the language of the agreement that went beyond the creation of the li-cense and granted the right to make and sell components for use in tilt-sensitive control boxes. It would also render the covenant not to sue redundant. Therefore, the Federal Circuit found that the agreement granted Analogʼs custom-ers an implied sublicense to use Analogʼs components to make, use, and sell tilt-sensitive control boxes that infringe Jacobsʼs patent.SETTLEMENT AGREEMENT DOES NOT RE-LEASE THIRD PARTY WHO ACQUIRES LICENS-EE AFTER EXECUTION OF THE AGREEMENT
A settlement agreement releasing a licensee and its par-ents from claims of infringement will not provide a release to a third party who later becomes the licenseeʼs parent. In Unova, Inc. v. Acer Inc., No. 03-1244, (Fed. Cir. March 31, 2004), the United States Court of Appeals for the Federal Circuit held that a settlement agreement between Unova and Compaq did not provide a release to Hewlett-Packard after Hewlett-Packard purchased Compaq.
This case related to smart battery patents held by Unova. Prior to the present case, Unova and Compaq entered into a settlement agreement whereby Unova released Compaq and its “parents” from liability for infringement. The agree-ment further provided that Unova would not sue Compaq or its parents for infringement by any “Compaq Products”and granted a non-exclusive license to Compaq and its parents under the smart battery patents.
Almost a year after the agreement was signed, Hewlett-Packard purchased all of the stock of Compaq, thus be-
les Nouvelles December 2004 189
coming Compaqʼs parent. Subsequently, Unova sued Hewlett-Packard for patent infringement. Hewlett-Pack-ard moved for summary judgment that the agreement be-tween Unova and Compaq released Hewlett-Packard from liability for infringement of the smart battery patents. The District Court granted the motion, and Unova appealed.
The Federal Circuit held that the District Court erred in granting Hewlett-Packardʼs motion for summary judgment. The court held that under California contract law, a third partyʼs rights under a release agreement are predicated upon the contracting partiesʼ intent to benefi t that third party. The Federal Circuit held that Unova and Compaq did not intend to release Hewlett-Packard from liability for infringement arising from events that occurred before it became Compaqʼs parent. According to the court, the agreement intended only to release Compaq and its parents as of the date the agreement was signed. Since Hewlett-Packard became Compaqʼs parent later, it was not covered by the release.
The Federal Circuit also noted that this interpretation was consistent with the other provisions of the agree-ment. Notably, the covenant not to sue and license pro-visions applied only to Compaq-branded products. The court noted that it would be unusual for the agreement to release Hewlett-Packard for past liability but reserve the right to sue Hewlett-Packard for identical acts of in-fringement that occurred after it became Compaqʼs parent. Therefore, the Federal Circuit reversed the decision of the District Court.PATENTEE CANNOT RECOVER LOST PROFITS OF A SISTER CORPORATION IN A PATENT IN-FRINGEMENT ACTION
If a parent corporation creates two subsidiaries, one that holds its patent rights and one that makes the patented product, the patent-holding subsidiary will not be able to recover the lost profi ts of the manufacturing subsidiary. In Poly-America, L.P. v. GSE Lining Technology, Inc., No. 04-1022, (Fed. Cir. September 14, 2004), the United States Court of Appeals for the Federal Circuit held that Poly-America was not entitled to lost-profi ts damages of its sister corporation despite the close relationship between the two companies.
This case involved patents relating to textured landfi ll liners owned by Poly-America. Poly-America sued GSE lining for patent infringement and a jury found in favor of Poly-America and awarded Poly-America a reason-able royalty and lost-profi ts. Poly-America did not actu-ally manufacture the patented product. Rather, its sister corporation Poly-Flex did. Poly-Flex operated under a non-exclusive license under the patents and had granted Poly-America the right to collect damages on its behalf. Therefore, the lost profi ts awarded by the jury were based on the lost profi ts of Poly-Flex, not Poly-America.
The Federal Circuit held that Poly-America was not en-titled to recover Poly-Flexʼs lost profi ts. The Court held that while Poly-America and Poly-Flex seem to share interests as two entities collaborating in the manufacture and sale of
textured landfi ll liners, that relationship was not suffi cient to permit Poly-America to claim Poly-Flexʼs lost profi ts. The Federal Circuit found that since their parent corpora-tion set up the companies as separate corporate entities, it must take the benefi ts of that structure with the burdens. Therefore, even though Poly-America had the right to sue under its patents, it can only recover its own lost profi ts, not Poly-Flexʼs.
Moreover, the fact that Poly-Flex granted Poly-America its right to collect damages did not alter the decision. Since Poly-Flex was only a non-exclusive licensee, it could not sue for damages on its own. Therefore, Poly-Flex had no right to collect lost profi ts. Therefore, the Federal Circuit reversed the award of lost profi ts to Poly-America. JAPANESE FTC FINDS MICROSOFTʼS LICENS-ING POLICY IN VIOLATION OF ANTIMONOP-OLY ACT
On July 13, 2004, the Japanese Fair Trade Commission (“JFTC”) issued a recommendation to Microsoft concluding that certain provisions in Microsoftʼs Windows operating system (“OS”) licenses violated the Antimonopoly Act. The contracts at issue were license agreements entered into with PC manufacturers who wished to place the Windows OS on their computers. The agreements required the PC manu-facturers to agree not to sue Microsoft for any infringement of the PC manufacturerʼs patents by the Windows OS. The JFTC found that these non-assertion provisions unjustly restricted the business activities of the PC manufacturers.
The JFTC noted that Microsoft has a dominant position in the PC market and that it is extremely important to the PC manufacturers to obtain licenses to each new version of the Windows OS as it becomes available. The JFTC further noted that Microsoft has increasingly incorporated audio and visual functions (“AV function”) into its Windows OS and that many PC manufacturers were also developing technologies and held patents relating to AV function. The commission found that when PC manufacturers objected to waiving their right to assert their AV function patents against Microsoft, Microsoft refused to alter the agree-ment, thereby forcing the PC manufacturers to accept the provision.
The JFTC found that this licensing practice restrained PC manufacturers from enforcing their patent rights. The JFTC further found that such a restraint might cause these manufacturers to lose their incentives to invent and devel-op technology related to AV function. Therefore, the com-mission found that Microsoft violated the Antimonopoly Act. The JFTC concluded by recommending that Microsoft remove all such provisions from its current agreements, and further agree not to include such provisions in future agreements.
In response, Microsoft has publicly decided to no longer include such provisions in its future agreements. Microsoft, however, rejected the JFTCʼs recommendation and instead chose to proceed with a hearing on its licenses. At present, this matter is still pending.
les NouvellesDecember 2004190
PATENTEE ENTITLED TO LOST PROFITS ON SALES OF UNPATENTED MATERIALS SOLD WITH A PATENTED DEVICE
A patentee may recover its lost profi ts from lost sales of unpatented materials it sells with a patented device if it can demonstrate a functional relationship between the device and materials. In Juicy Whip, Inc. v. Orange Bang, Inc., No. 03-1609, (Fed. Cir. September 3, 2004), the United States Court of Appeals for the Federal Circuit held that Juicy Whip was entitled to present evidence on its lost profi ts on lost syrup sales due to Orange Bangʼs infringement of its beverage dispenser patent.
Before the district court, a jury found that Orange Bang had infringed Juicy Whipʼs beverage dispenser patent and awarded Juicy Whip compensatory damages. At trial, Juicy Whip sought to introduce evidence on its lost profi ts on syrup sales, but the district court denied Juicy Whipʼs motion because it did not believe the syrup and patented dispenser constituted a single functional unit.
The Federal Circuit found that the district court abused its discretion by not allowing Juicy Whip to present evi-dence of lost profi ts on syrup sales. The court held that the appropriate test for determining whether a patentee could recover lost profi ts on sales of unpatented materials was whether the unpatented materials have a functional relationship with the patented device. The Federal Circuit found that the syrup and beverage dispenser shared a functional relationship and were analogous to parts of a single assembly. Specifi cally, the syrup functioned together with the dispenser to provide a visual appearance that was central to the patent. Moreover, the fact that other syrups could be used with the dispenser did not alter this result. Therefore, the Federal Circuit vacated the juryʼs damage award and remanded for further proceedings on the issue.SUPPLYING INSTRUCTIONS OR CORPORATE OVERSIGHT FROM THE UNITED STATES FOR PRODUCTS MADE OUTSIDE THE UNITED STATES DOES NOT CONSTITUTE INFRINGEMENT
A company that manufactures and sells an accused product entirely outside of the United States typically is not liable for patent infringement. However, the U.S. patent law also provides that someone who supplies a substantial portion of components of a patented invention from the United States for combination outside of the United States is liable for patent infringement in the United States. In Pel-
legrini v. Analog Devices, Inc., No. 04-1054, (Fed. Cir. July 8, 2004), the United States Court of Appeals for the Federal Circuit held, on a case of fi rst impression, that components that are manufactured outside the United States and never physically shipped to or from the United States, do not infringe a U.S. patent even if those components are de-signed within the United States and the instructions for their manufacture and disposition are transmitted from within the United States.
This case involved chips manufactured by Analog De-vices outside of the United State that were never physically shipped to or from the United States. Analog Devices did, however, design the chips in the United States and pro-vided the instructions for their manufacture from within the United States. Pellegrini asserted that Analog Devices was liable for infringement under section 271(f) of the U.S. patent laws. Section 271(f) provides liability for a company who supplies all or a substantial portion of the components of a patented invention from the United States for combi-nation outside of the United States. The district court had granted Analog Devices motion for summary judgment that section 271(f) did not apply to its activities, and Pel-legrini appealed.
The Federal Circuit held that section 271(f) did not apply to the activities of Analog Devices. According to the court, this section applies only when components of a patented invention are physically present in the United States and then sold or supplied outside of the United States for com-bination. Therefore, the fact that Analog Devices provides instructions from the United States does not create any liability for infringement since the components were not actually supplied in or from the United States.
Pellegrini pointed to the fact that the invoices shipped with all Analog Devicesʼ products included a statement that the “commodities, technology, or software were ex-ported from the United States.” Pellegrini contended that even if the components were not actually shipped from the United States, the components should be deemed to have originated from the United States by virtue of this declaration. Analog Devices responded by stating that these statements were included out of an abundance of caution to comply with U.S. export laws. The Federal Circuit rejected Pellegriniʼs argument noting that Analog Devicesʼ statements could not override the fact that no products were actually exported from the United States. Therefore, the Federal Circuit affi rmed the decision of the district court granting Analog Devicesʼ motion for sum-mary judgment.
les Nouvelles December 2004 191
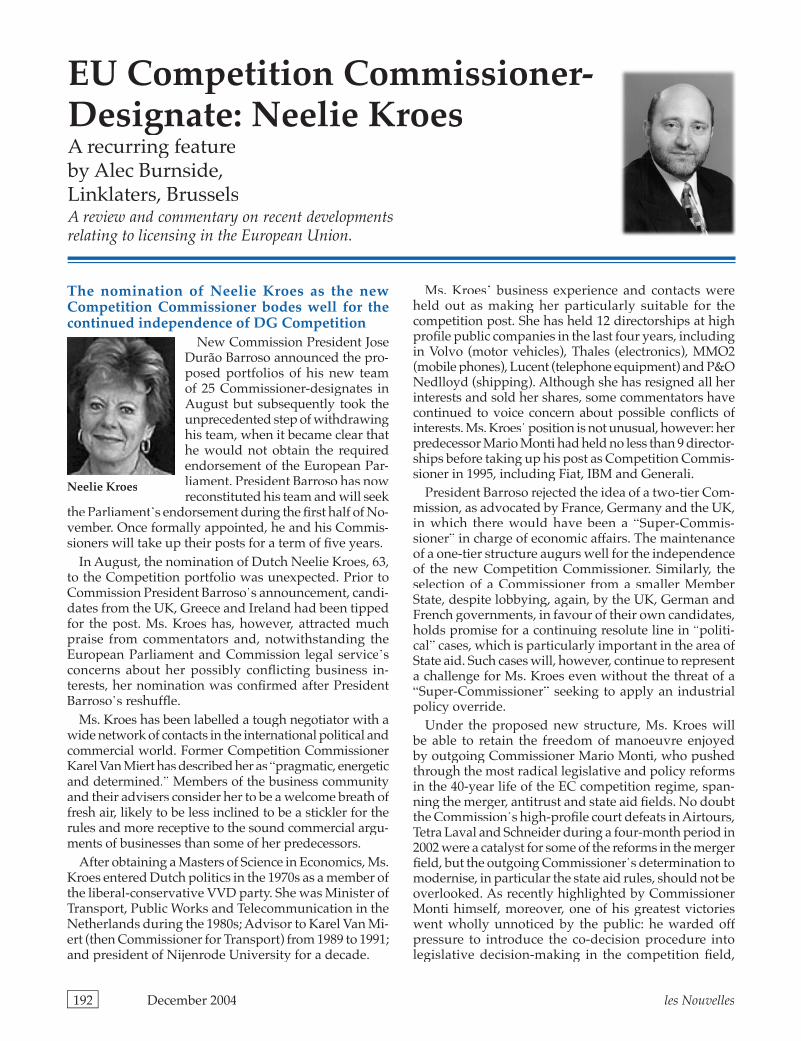
EU Competition Commissioner-Designate: Neelie KroesA recurring featureby Alec Burnside, Linklaters, BrusselsA review and commentary on recent developments relating to licensing in the European Union.
The nomination of Neelie Kroes as the new Competition Commissioner bodes well for the continued independence of DG Competition
New Commission President Jose Durão Barroso announced the pro-posed portfolios of his new team of 25 Commissioner-designates in August but subsequently took the unprecedented step of withdrawing his team, when it became clear that he would not obtain the required endorsement of the European Par-liament. President Barroso has now reconstituted his team and will seek
the Parliamentʼs endorsement during the fi rst half of No-vember. Once formally appointed, he and his Commis-sioners will take up their posts for a term of fi ve years.
In August, the nomination of Dutch Neelie Kroes, 63, to the Competition portfolio was unexpected. Prior to Commission President Barrosoʼs announcement, candi-dates from the UK, Greece and Ireland had been tipped for the post. Ms. Kroes has, however, attracted much praise from commentators and, notwithstanding the European Parliament and Commission legal serviceʼs concerns about her possibly confl icting business in-terests, her nomination was confi rmed after President Barrosoʼs reshuffl e.
Ms. Kroes has been labelled a tough negotiator with a wide network of contacts in the international political and commercial world. Former Competition Commissioner Karel Van Miert has described her as “pragmatic, energetic and determined.” Members of the business community and their advisers consider her to be a welcome breath of fresh air, likely to be less inclined to be a stickler for the rules and more receptive to the sound commercial argu-ments of businesses than some of her predecessors.
After obtaining a Masters of Science in Economics, Ms. Kroes entered Dutch politics in the 1970s as a member of the liberal-conservative VVD party. She was Minister of Transport, Public Works and Telecommunication in the Netherlands during the 1980s; Advisor to Karel Van Mi-ert (then Commissioner for Transport) from 1989 to 1991; and president of Nijenrode University for a decade.
Ms. Kroesʼ business experience and contacts were held out as making her particularly suitable for the competition post. She has held 12 directorships at high profi le public companies in the last four years, including in Volvo (motor vehicles), Thales (electronics), MMO2 (mobile phones), Lucent (telephone equipment) and P&O Nedlloyd (shipping). Although she has resigned all her interests and sold her shares, some commentators have continued to voice concern about possible confl icts of interests. Ms. Kroesʼ position is not unusual, however: her predecessor Mario Monti had held no less than 9 director-ships before taking up his post as Competition Commis-sioner in 1995, including Fiat, IBM and Generali.
President Barroso rejected the idea of a two-tier Com-mission, as advocated by France, Germany and the UK, in which there would have been a “Super-Commis-sioner” in charge of economic affairs. The maintenance of a one-tier structure augurs well for the independence of the new Competition Commissioner. Similarly, the selection of a Commissioner from a smaller Member State, despite lobbying, again, by the UK, German and French governments, in favour of their own candidates, holds promise for a continuing resolute line in “politi-cal” cases, which is particularly important in the area of State aid. Such cases will, however, continue to represent a challenge for Ms. Kroes even without the threat of a “Super-Commissioner” seeking to apply an industrial policy override.
Under the proposed new structure, Ms. Kroes will be able to retain the freedom of manoeuvre enjoyed by outgoing Commissioner Mario Monti, who pushed through the most radical legislative and policy reforms in the 40-year life of the EC competition regime, span-ning the merger, antitrust and state aid fi elds. No doubt the Commissionʼs high-profi le court defeats in Airtours, Tetra Laval and Schneider during a four-month period in 2002 were a catalyst for some of the reforms in the merger fi eld, but the outgoing Commissionerʼs determination to modernise, in particular the state aid rules, should not be overlooked. As recently highlighted by Commissioner Monti himself, moreover, one of his greatest victories went wholly unnoticed by the public: he warded off pressure to introduce the co-decision procedure into legislative decision-making in the competition fi eld,
Neelie Kroes
les NouvellesDecember 2004192
which would have given the European Parliament power to amend or veto proposals.
The major challenges for Ms. Kroes will be bedding down the Monti reforms and tackling reform of the law on dominant companies, an area of sharp divergence between the EU and U.S. One of her most difficult tasks will be to oversee the process of decentralising the control of cartels and anticompetitive behaviour to the Member States. This will involve fi nding a delicate balance between the roles of the European Commission and the national competition authorities, now linked by the European Competition Network. Ms. Kroesʼ back-ground in economics is likely to continue the drive for greater economic rigour in decision-making, while her
reputation for “free market” political beliefs should en-sure a robust enforcement policy.
Before President Barrosoʼs reshuffl e, Ms. Kroes had almost fi nalised the appointments to her private of-fi ce, with Dutch Ben Smulders heading the team. Ben Smulders is a Dutch lawyer who left private practice to join the Commissionʼs legal service. He later served in the private offi ces of Hans Van den Broeck, Frits Bolkestein and President Prodi and most recently has been a member of the expertsʼ group debating changes to the ECJʼs structure and jurisdiction culminating in the Constitutional Treaty. Unusually, Ms. Kroesʼ private offi ce appointees all hail from within the Commission and represent six different nationalities.
les Nouvelles December 2004 193
les Nouvelles will accept ad ver tise ments for products and services of professional interest to the members of LESI. The fees for advertisements are as follows:
Full Page US$ 4,000.00Half Page US$ 2,500.00Quarter Page US$ 1,300.00
A 10% discount will be given for insertion of the same ad ver tise ment in two consecutive issues and a 15% discount will be given for insertion on the same advertisement in four consecutive issues.
Advertisements must be submitted at least fi fteen (15) days prior to copy deadline (e.g., 15 January, 15 April, 15 July, and 15 October). Advertising copy is to be submitted in digital “camera ready” format. Contact les Nouvelles Advertising for layout and print spec i fi ca tions at: [email protected].
Payments are to be made to “Licensing Executives Society (U.S.A. and Canada), Inc.” in United States Dollars.
Advertising in les Nouvellesles Nouvelles
Is Accepting Advertising
For more information or to receive an advertising brochure, please contact:
les Nouvelles Advertisingc/o Licensing Executives Society
(USA and Canada)), Inc.1800 Diagonal Road, Suite 280
Alexandria, VA 22314, [email protected]
Over 12,000 people receive les Nouvelles worldwide.
Place your ad here.
The Active Ingredient in many Pharma Business Deals worldwide.
23rd EuroPLX Meeting (European Pharma License Exchange)23rd + 24th February 2005 in Monte Carlo (Monaco)For Bio/Pharma Business Development and Licensing Executives only.With a Proposed Orientation towards Deals in
•Generics, OTC Drugs, Nutraceuticals•Drug Improvement and Delivery Technologies
Kurfürstenstr. 1A69234 Dielheim, GermanyTel. +49 (6222) 9807-0Fax +49 (6222) [email protected]
RauCon.Comconcepts +
competence
Details atwww.europlx.comor from the Organizers:
Enrollment until 2nd February 2005More than 600 pharma and biopharmacompanies from 56 countries and five continentshave negotiated deals using this platform.
Presently, EuroPLXfacilitates negotia-tions at a rate of8,000 to 10,000per year.
les NouvellesDecember 2004194
Licensing And In tel lec tu al Prop er ty Or ga ni za tions Meet ings
For more information on LES or LESI Meetings call +1-703-836-3106 or go to www.usa-canada.les.org
LESI Operating Committees Chairs Vice-ChairsAuditor Ron Grudziecki
Awards Akira Mifune Heinz Goddar
Communications Arthur M. Nutter Patricia A.O. Bunye Panos Malamis Shoichi Okuyama
Education Paul Germeraad Linda Covello Chris Goodman Toshihiko Kanayama Elisabeth Thouret-Lemaitre
Endowment Mel Jager Christoph Liebscher Nabil Salamé
Investment Ernest G. Posner Antonio Tavira
IP Maintenance Fiona Nicolson Michael Fischer
Legal Bruno Vandermeulen Clyde Willian
Long-Range Benny Browne Jonas GullikssonPlanning Thierry Sueur Dwight Olson
Barry Quest
Meetings Arnaud Michel Y. B. Kim James R. Sobieraj Peggy Moizel
Membership Ernesto Cavelier-Franco Marek Lazewski Christian Osterrieth
Nominating Jonas Gulliksson Peter Chrocziel Heinz Goddar Mel Jager Thierry Sueur Willy ManfroyCommittees Kathleen Denis(Task Force 1) James Leavy
SME Norman A. Jacobs Gary Hooper(Task Force 2) Guenter Isenbruck
LESI Operating Working Groups Chairs Vice-ChairsAutomotive Elie Srour Pierre Gendraud Volker Plogman
Chemicals Energy Ada Nielsen H. S. LeeEnvironmental Andreas Winkler Hans Nachenius
Consultants Martin C. Sandford Don Kelly
Copyright Nigel Jones Micha el JolicoeurLicensing Arthur S. Rose Dispute Paule Drouault-Gardrat Neda MatijevicResolution Ruba Qalyoubi
European Allen Norris Christian W. Appelt Jean Christophe Troussel Hayley French
External Relations Philipp Dreier Cecile Dupas James E. Malakowski Patsy Koh
IARS Phillip Barnett Daniel Messick
IT & E-Commerce Kiyohide Okamato Alfred Chaouat Stefan Schohe Michael A. Lechter
Life Sciences James Hand Kevin Nachtrab Ichiro Nakatomi Jose Luis Solleiro
Americas Clarisse Escorel Armando Gomez John C. Paul
Pan Asian Masashi Kurose Rani Boazz S. R. Kim
Patent & Tech- Alan H. Gordon Per Ericssonnology Licensing Russel E. Levine Istvan Molnar
Trademark & Char- Kenneth D. McKay Yvonne Chuaacter Licensing Henry Knox Sherrill Marco nVenturello
University & Robert McInnes Regula Altmann-JoehlResearch Walter G. Copan Takafumi Yamamoto
2005January 28 Benelux Topic Meeting BrusselsFebruary 3-5 AUTM Annual Meeting Scottsdale, ArizonaFebruary 9-11 Winter Meeting Brown Palace Hotel Denver, COMarch (Date TBD) PDS Fundamentals & Intermediate Intellectual Asset Courses San Francisco, CAApril 13 LES Foundation Dinner Four Seasons Hotel Chicago. ILMay 4-6 Spring Meeting Sheraton Imperial Hotel Durham, NCJune 2-3 Technology Transfer Seminar Toronto, CanadaJune 10-16 LES International Del e gates and Committee Meetings LESI Annual Meeting Arabella Sheraton Hotel Munich, GermanyJuly 11-14 PDS Fundamentals & Intermediate Intellectual Asset Courses Chicago, ILSeptember (Date TBD) Technology Transfer Seminar Boston, MAOctober 16-19 LES (USA & Canada) Annual Meeting Marriott Desert Ridge Hotel Phoenix, AZOctober 20-22 LES International Del e gates and Committee Meetings LESI Annual Meeting Phoenix, AZNovember (Date TBD) PDS Fundamentals & Intermediate Intellectual Asset Courses
2006February 9-11 AUTM Annual Meeting Orlando, FLJune LES International Annual Conference Seoul, KoreaJune LES International Del e gates and Committee Meetings Seoul, KoreaSeptember 10-14 LES (USA & Canada) Annual Meeting Marriott Marquis New York, NYOctober 8-12 AIPPI World Congress Gothenburg, Sweden2007March 1-3 AUTM Annual Meeting San Francisco, CAJune 15-17 LES International Annual Conference Zurich, SwitzerlandJune 18-20 LESI International Del e gates and Committee Meetings Zurich, Switzerland