Embed Size (px)
DESCRIPTION
From the Margins to the Mainstream – Transportation in the 21 st Century. By Choice, Not Chance: Transportation in the Baltimore Region April, 2007. Converging Issues: The Opportunity to Rethink Transportation Strategies. - PowerPoint PPT Presentation
Citation preview
From the Margins to the Mainstream – Transportation in the 21st Century
By Choice, Not Chance: Transportation in the Baltimore Region
April, 2007
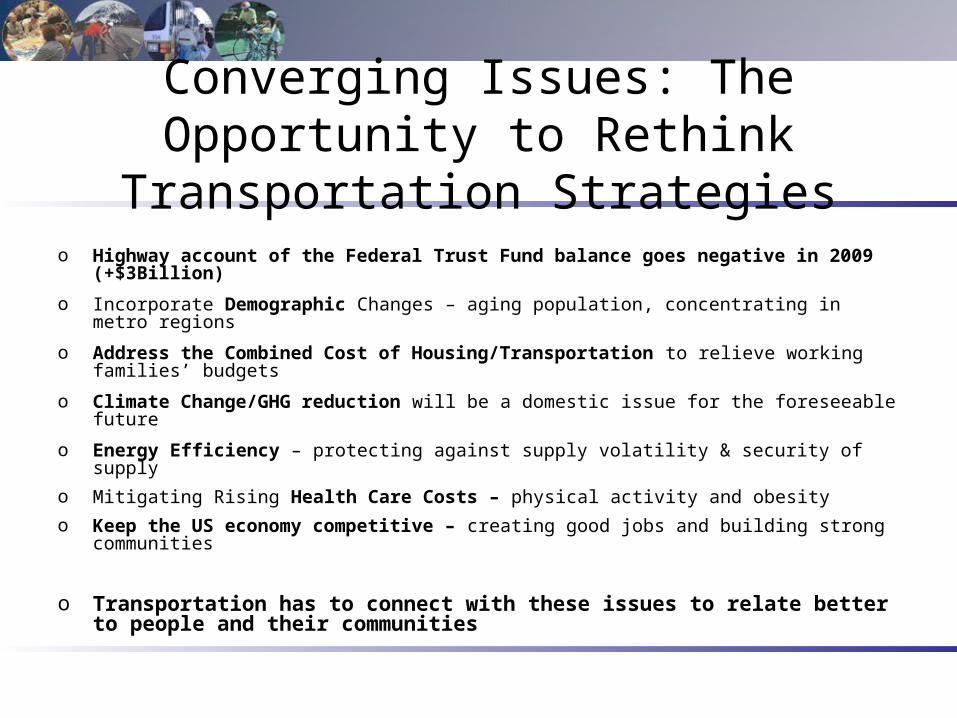
Converging Issues: The Opportunity to Rethink Transportation Strategies
o Highway account of the Federal Trust Fund balance goes negative in 2009 (+$3Billion)
o Incorporate Demographic Changes – aging population, concentrating in metro regions
o Address the Combined Cost of Housing/Transportation to relieve working families’ budgets
o Climate Change/GHG reduction will be a domestic issue for the foreseeable future
o Energy Efficiency – protecting against supply volatility & security of supply
o Mitigating Rising Health Care Costs – physical activity and obesity
o Keep the US economy competitive – creating good jobs and building strong communities
o Transportation has to connect with these issues to relate better to people and their communities
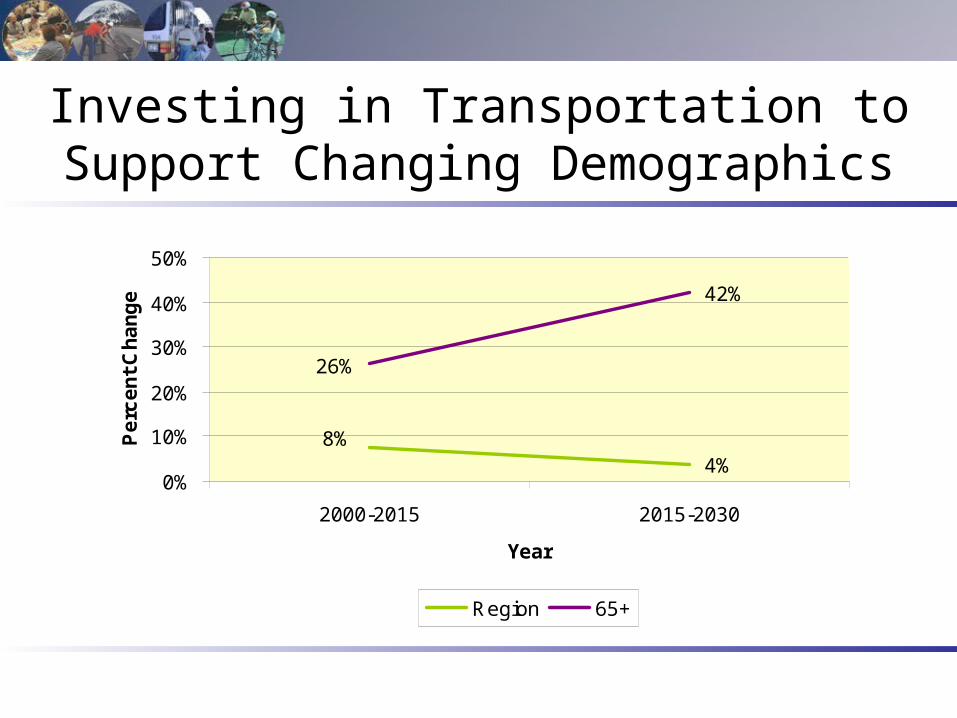
Investing in Transportation to Support Changing Demographics
4%
42%
8%
26%
0%
10%
20%
30%
40%
50%
2000-2015 2015-2030
Year
Pe
rce
nt
Ch
an
ge
Region 65+
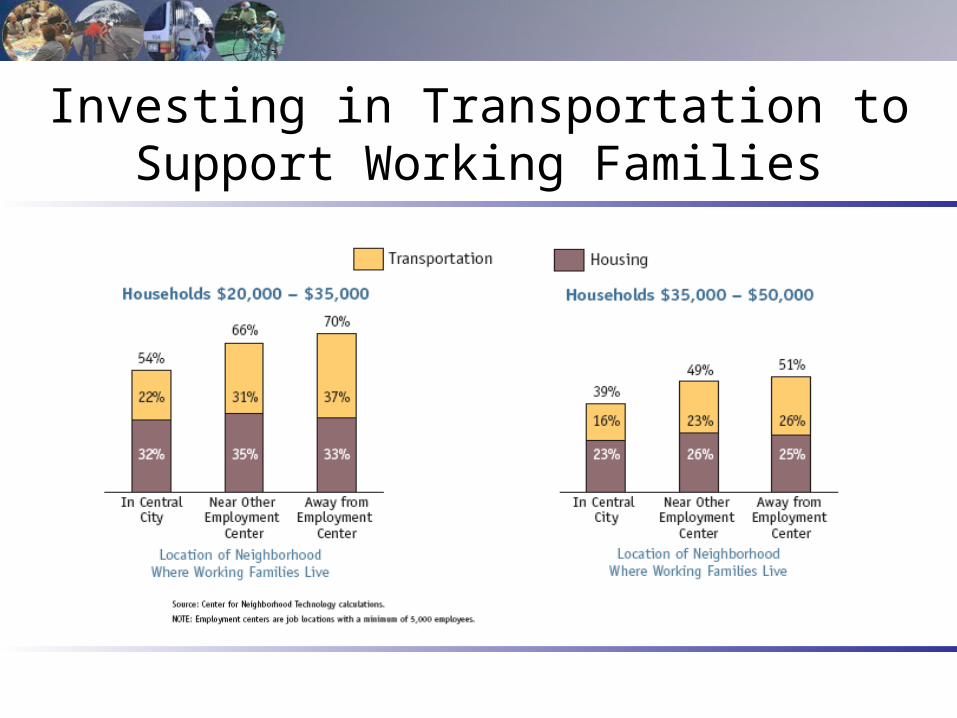
Investing in Transportation to Support Working Families
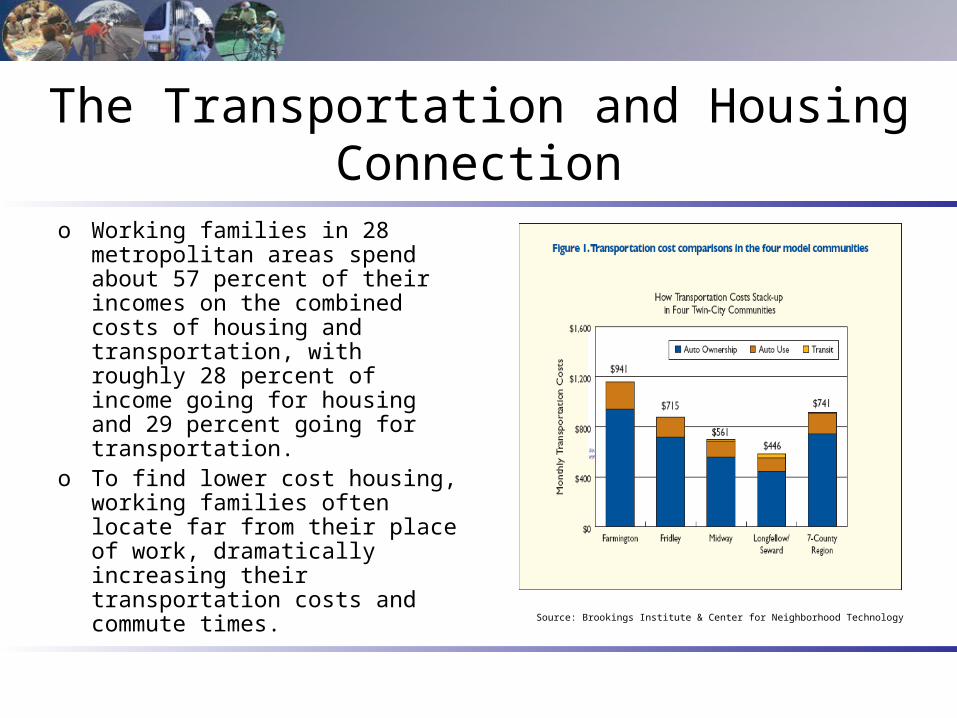
The Transportation and Housing Connection
o Working families in 28 metropolitan areas spend about 57 percent of their incomes on the combined costs of housing and transportation, with roughly 28 percent of income going for housing and 29 percent going for transportation.
o To find lower cost housing, working families often locate far from their place of work, dramatically increasing their transportation costs and commute times.
Source: Brookings Institute & Center for Neighborhood Technology
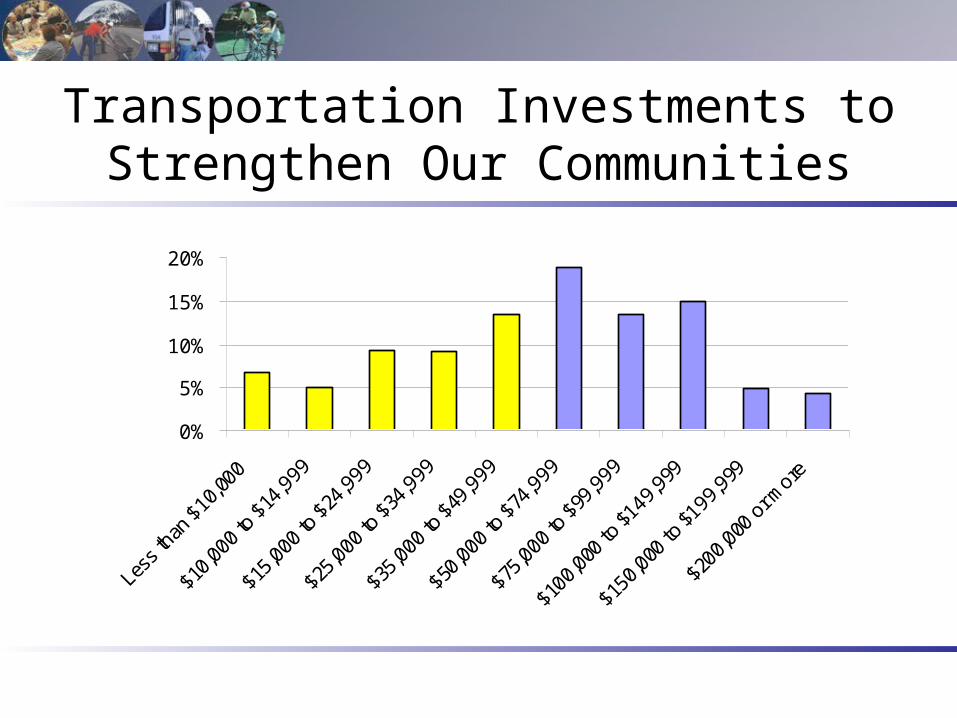
Transportation Investments to Strengthen Our Communities
0%
5%
10%
15%
20%
Less
than
$10
,000
$10,
000
to $
14,9
99
$15,
000
to $
24,9
99
$25,
000
to $
34,9
99
$35,
000
to $
49,9
99
$50,
000
to $
74,9
99
$75,
000
to $
99,9
99
$100
,000
to $
149,
999
$150
,000
to $
199,
999
$200
,000
or m
ore
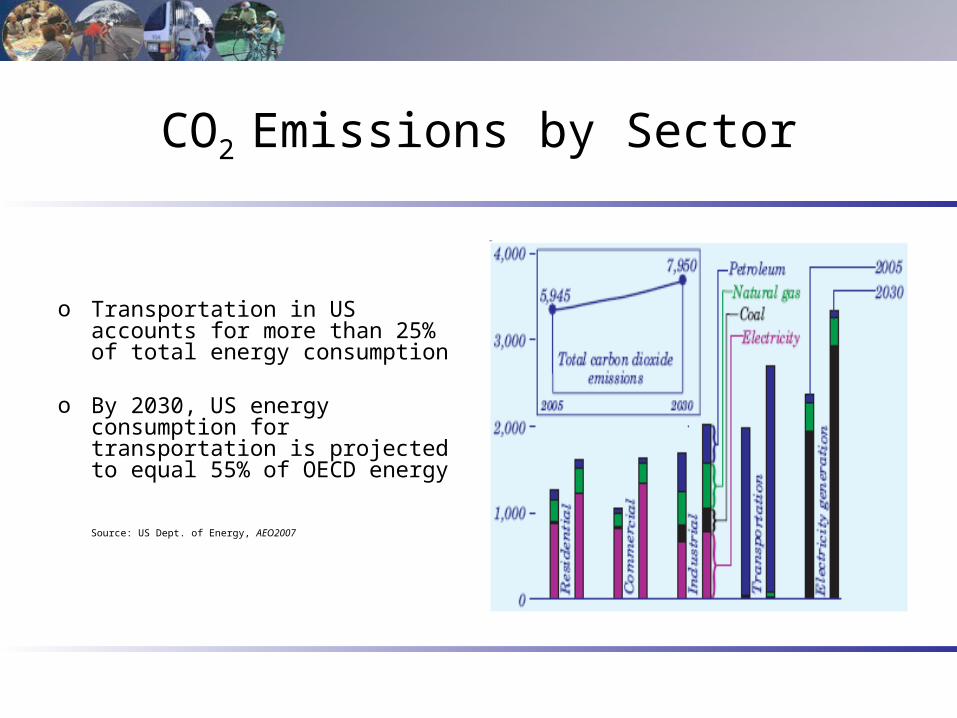
CO2 Emissions by Sector
o Transportation in US accounts for more than 25% of total energy consumption
o By 2030, US energy consumption for transportation is projected to equal 55% of OECD energy
Source: US Dept. of Energy, AEO2007
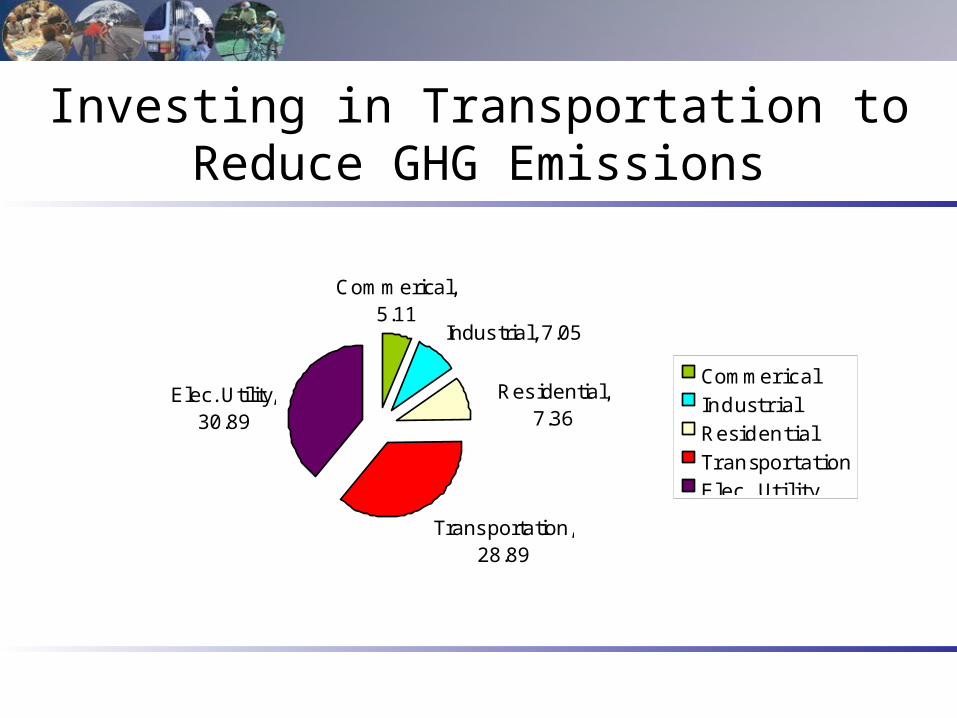
Investing in Transportation to Reduce GHG Emissions
Industrial, 7.05
Commerical, 5.11
Elec. Utility, 30.89
Residential, 7.36
Transportation, 28.89
CommericalIndustrialResidentialTransportationElec. Utility
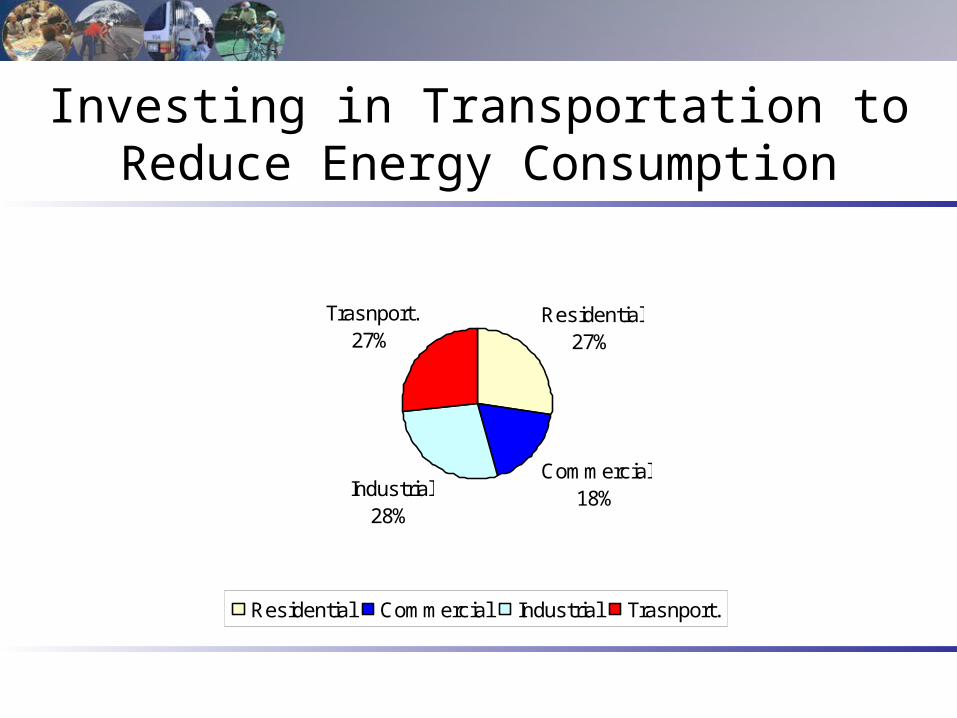
Investing in Transportation to Reduce Energy Consumption
Residential27%
Commercial18%Industrial
28%
Trasnport.27%
Residential Commercial Industrial Trasnport.
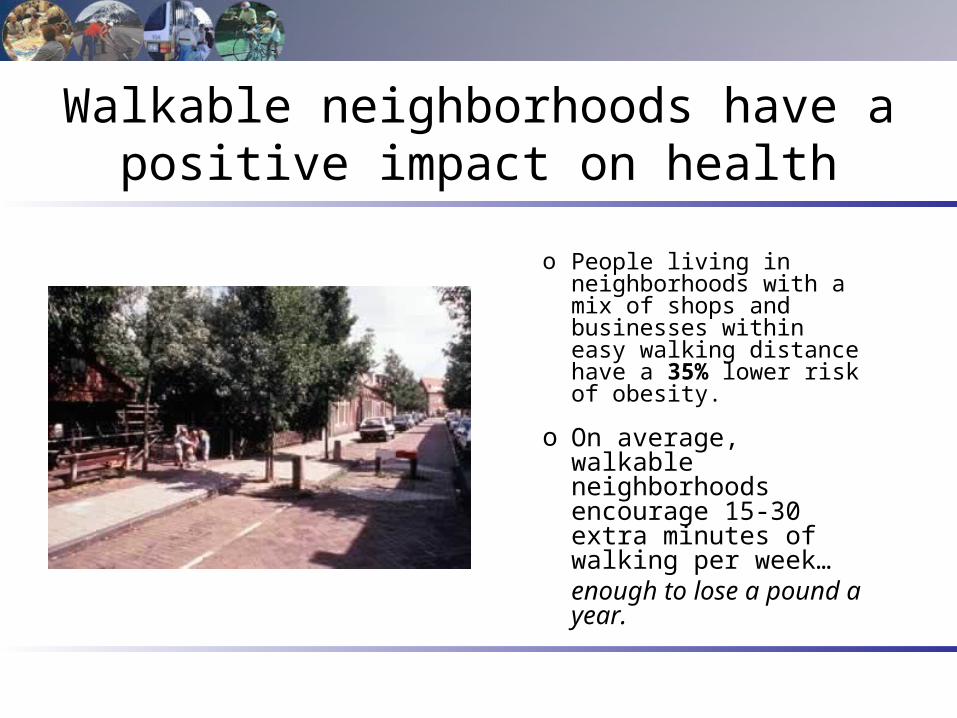
Walkable neighborhoods have a positive impact on health
o People living in neighborhoods with a mix of shops and businesses within easy walking distance have a 35% lower risk of obesity.
o On average, walkable neighborhoods encourage 15-30 extra minutes of walking per week… enough to lose a pound a year.
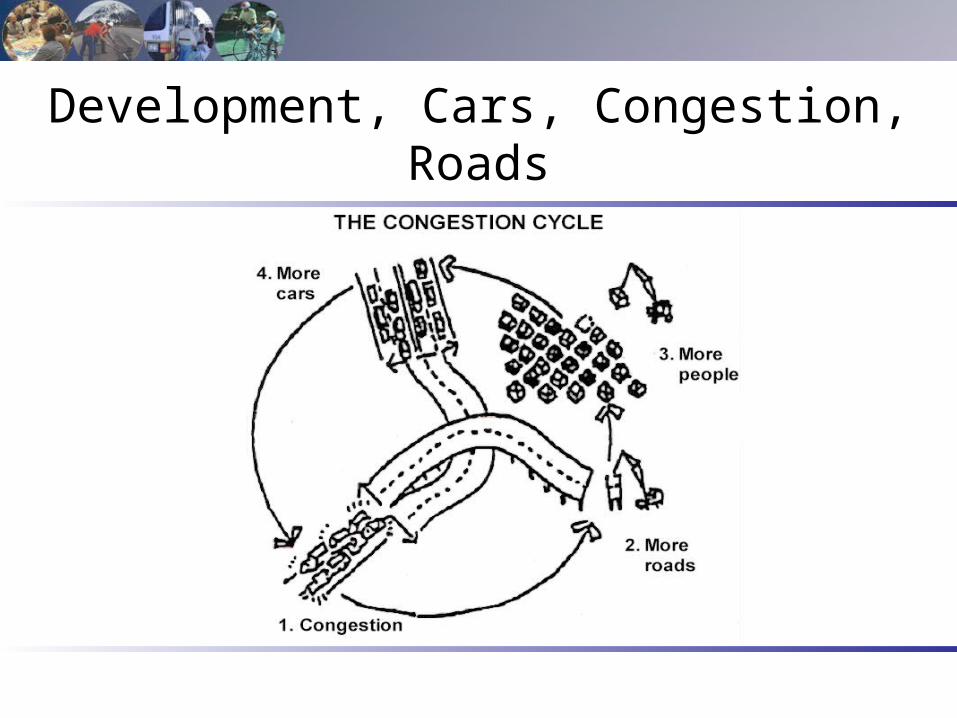
Development, Cars, Congestion, Roads
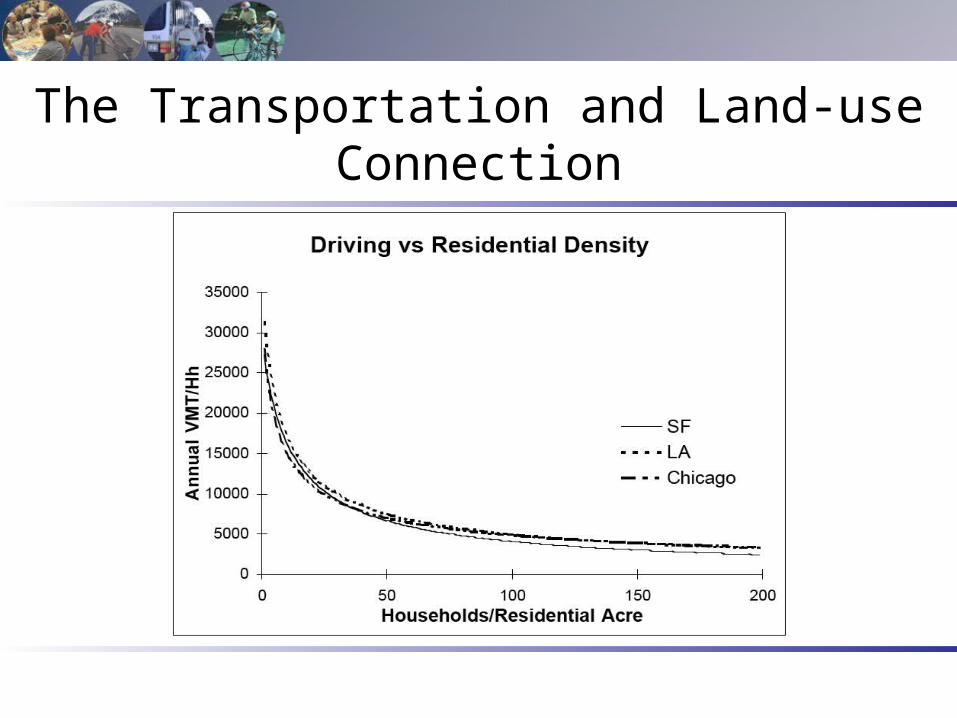
The Transportation and Land-use Connection
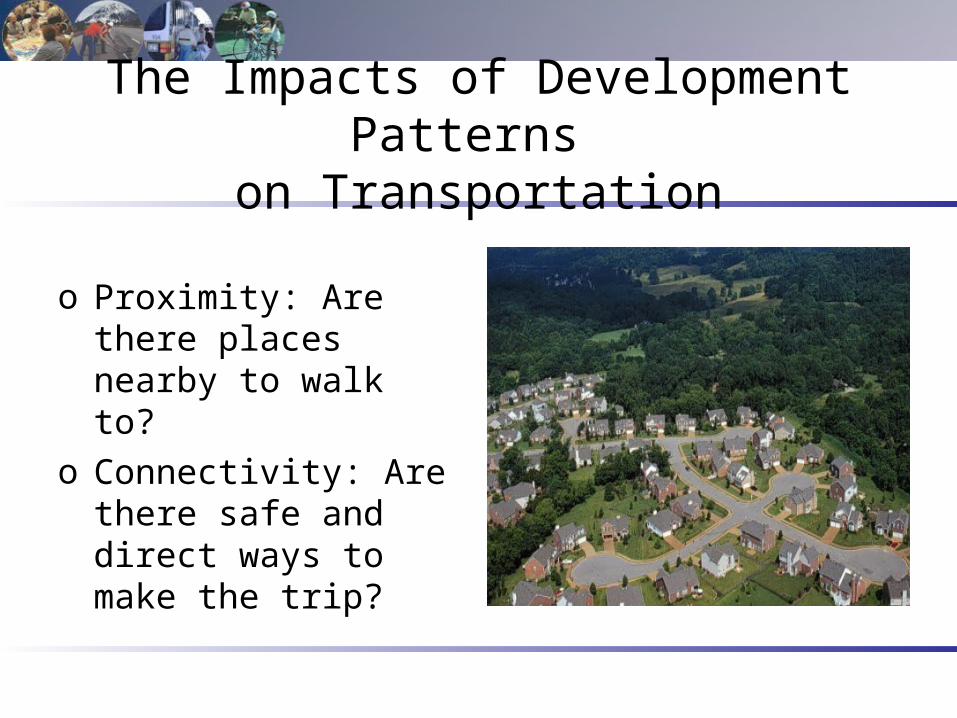
The Impacts of Development Patterns on Transportation
o Proximity: Are there places nearby to walk to?
o Connectivity: Are there safe and direct ways to make the trip?
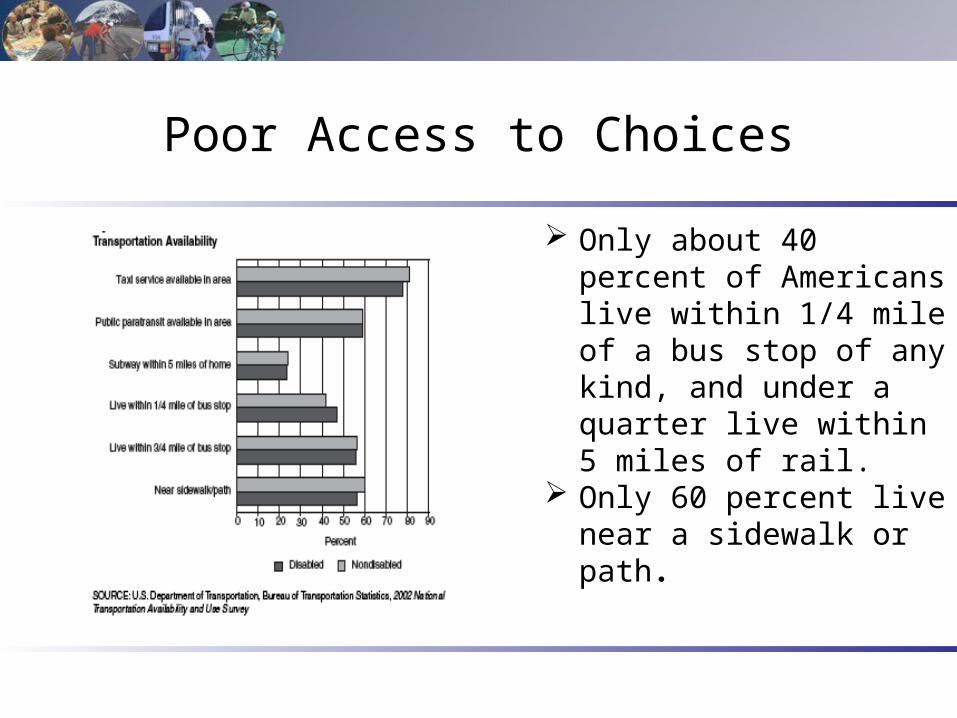
Poor Access to Choices
Only about 40 percent of Americans live within 1/4 mile of a bus stop of any kind, and under a quarter live within 5 miles of rail.
Only 60 percent live near a sidewalk or path.
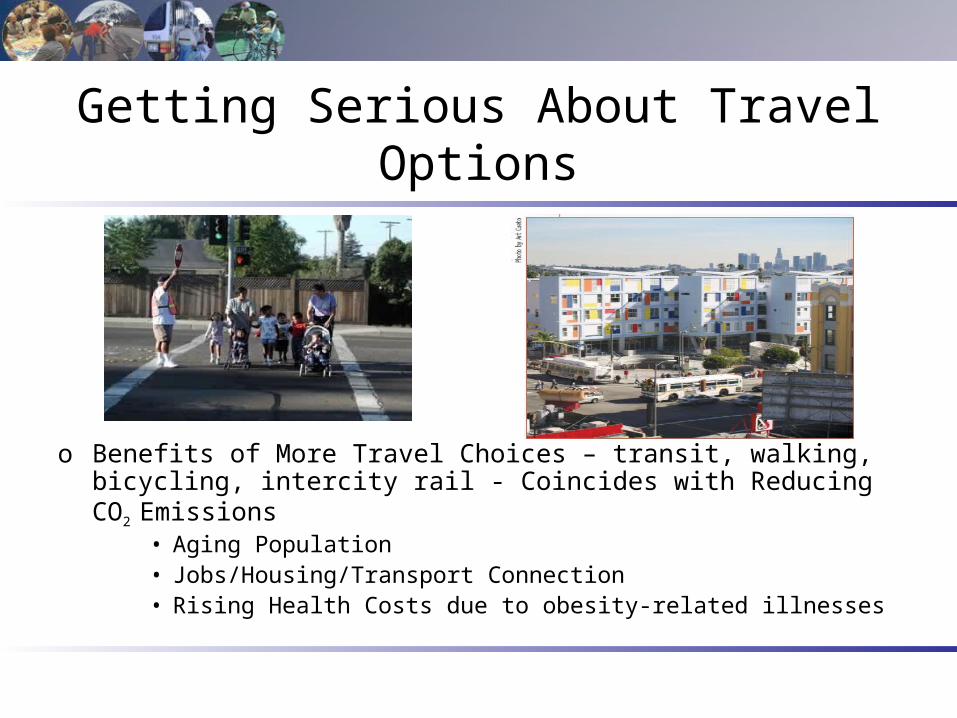
Getting Serious About Travel Options
o Benefits of More Travel Choices – transit, walking, bicycling, intercity rail - Coincides with Reducing CO2 Emissions
• Aging Population• Jobs/Housing/Transport Connection • Rising Health Costs due to obesity-related illnesses
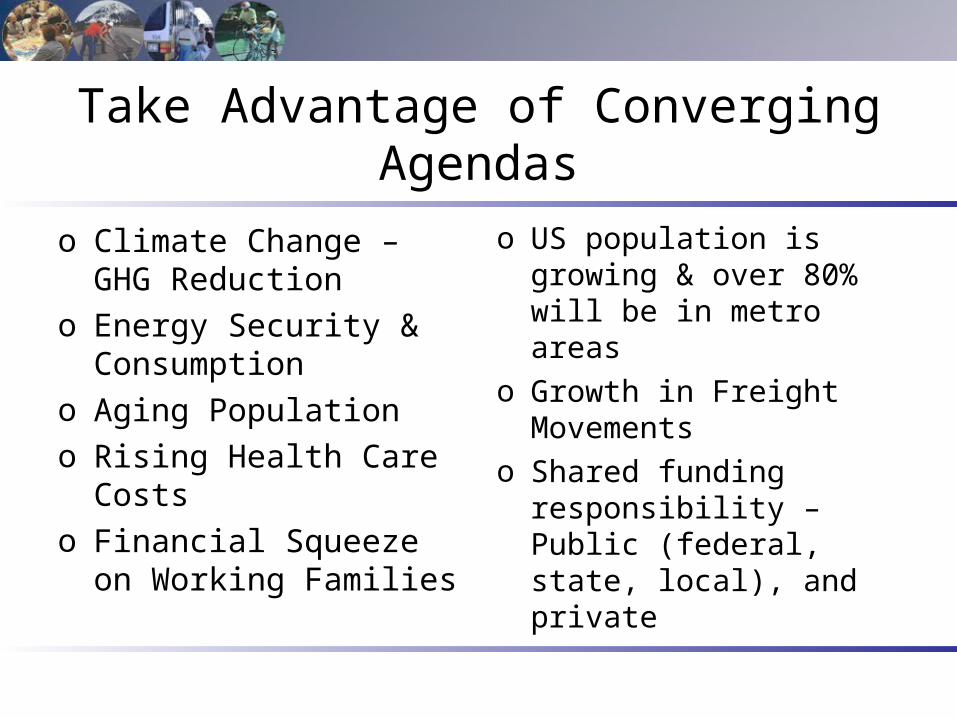
Take Advantage of Converging Agendas
o Climate Change – GHG Reduction
o Energy Security & Consumption
o Aging Populationo Rising Health Care
Costso Financial Squeeze on
Working Families
o US population is growing & over 80% will be in metro areas
o Growth in Freight Movements
o Shared funding responsibility – Public (federal, state, local), and private
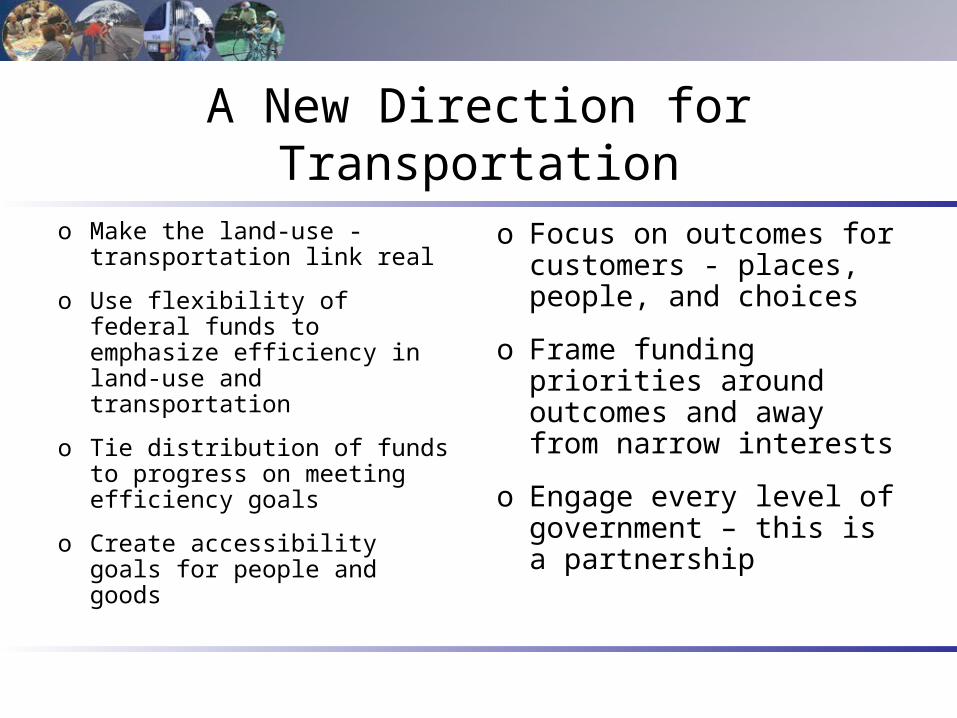
A New Direction for Transportation
o Make the land-use - transportation link real
o Use flexibility of federal funds to emphasize efficiency in land-use and transportation
o Tie distribution of funds to progress on meeting efficiency goals
o Create accessibility goals for people and goods
o Focus on outcomes for customers - places, people, and choices
o Frame funding priorities around outcomes and away from narrow interests
o Engage every level of government – this is a partnership
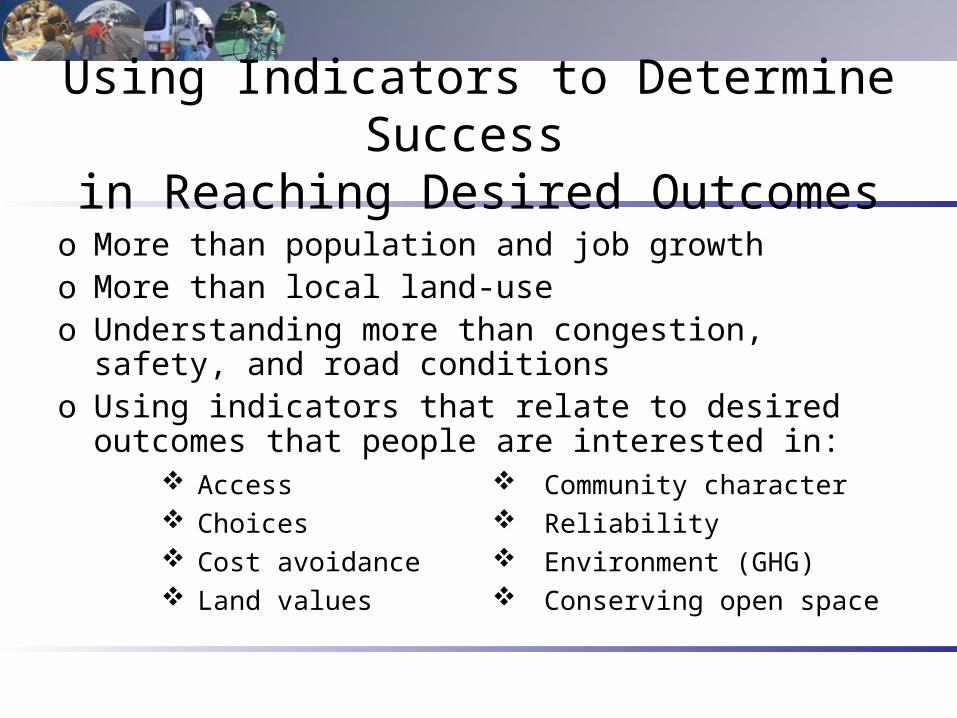
Using Indicators to Determine Success
in Reaching Desired Outcomeso More than population and job growtho More than local land-useo Understanding more than congestion, safety, and
road conditionso Using indicators that relate to desired outcomes
that people are interested in: Access Choices Cost avoidance Land values
Community character Reliability Environment (GHG) Conserving open space
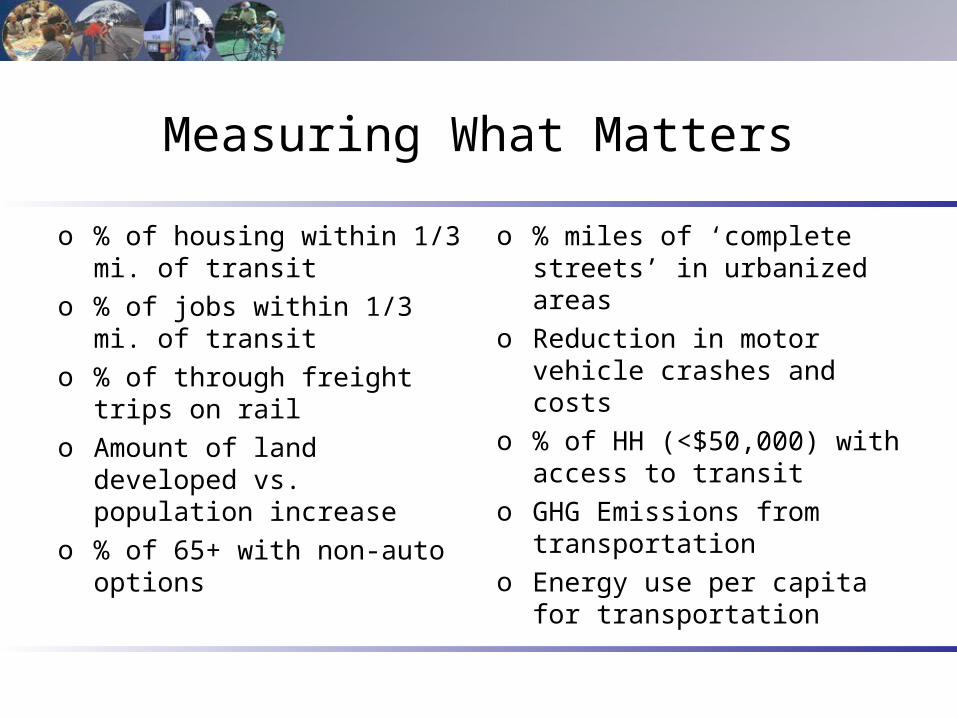
Measuring What Matters
o % of housing within 1/3 mi. of transit
o % of jobs within 1/3 mi. of transit
o % of through freight trips on rail
o Amount of land developed vs. population increase
o % of 65+ with non-auto options
o % miles of ‘complete streets’ in urbanized areas
o Reduction in motor vehicle crashes and costs
o % of HH (<$50,000) with access to transit
o GHG Emissions from transportation
o Energy use per capita for transportation