Embed Size (px)
Citation preview
From the Gregoriano Cadastre to a three-dimensional model of nineteenth-century landscape through the creation of
historical spatial data
Authors: Massimo Orciani, Valeria Frazzica, Lorena Colosi, Francesca Galletti, Andrea Cartaro
The cartographic work required for our historical analyses was based on 19th-century maps from
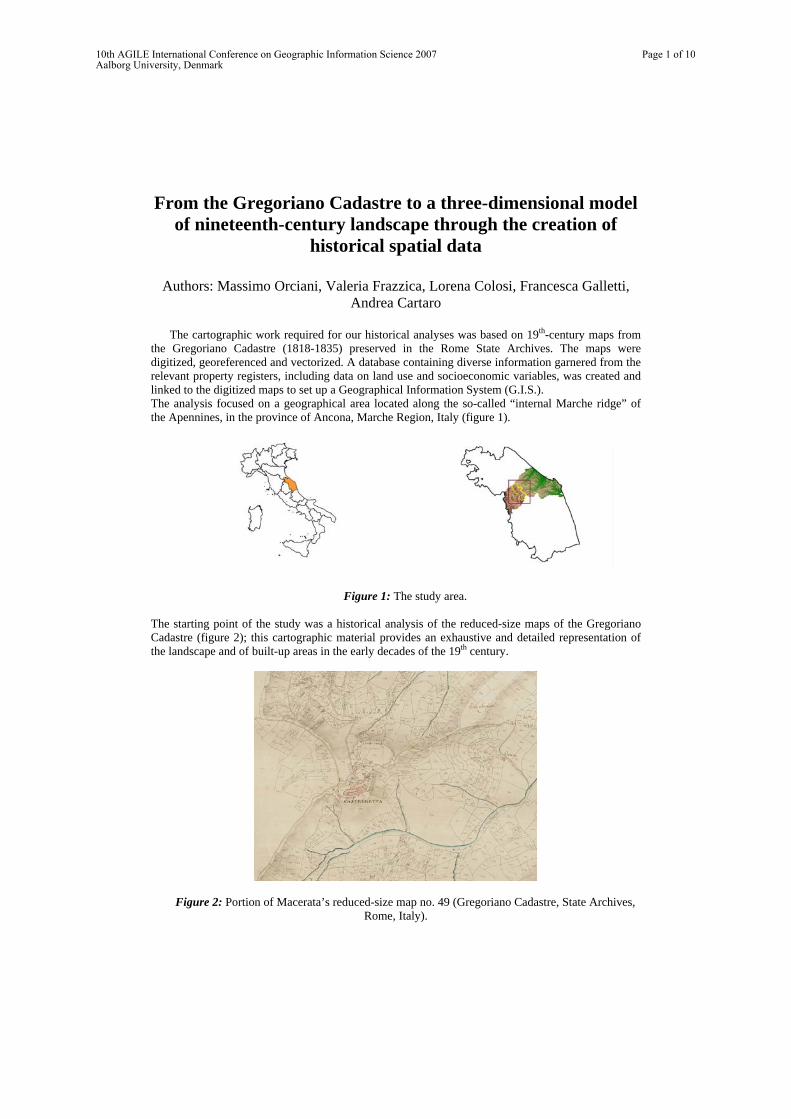
the Gregoriano Cadastre (1818-1835) preserved in the Rome State Archives. The maps were digitized, georeferenced and vectorized. A database containing diverse information garnered from the relevant property registers, including data on land use and socioeconomic variables, was created and linked to the digitized maps to set up a Geographical Information System (G.I.S.). The analysis focused on a geographical area located along the so-called “internal Marche ridge” of the Apennines, in the province of Ancona, Marche Region, Italy (figure 1).
Figure 1: The study area.
The starting point of the study was a historical analysis of the reduced-size maps of the Gregoriano Cadastre (figure 2); this cartographic material provides an exhaustive and detailed representation of the landscape and of built-up areas in the early decades of the 19th century.
Figure 2: Portion of Macerata’s reduced-size map no. 49 (Gregoriano Cadastre, State Archives, Rome, Italy).
10th AGILE International Conference on Geographic Information Science 2007Aalborg University, Denmark
Page 1 of 10
An ad hoc methodology was developed in order to acquire and process all the diverse information contained in the reduced-size maps and relevant property registers (Buonora, 2004). The maps, in digital raster format, were purchased from the State Archives and georeferenced using the Regional Technical Map (1:10,000 scale) based on the scale of representation of the historical maps and the toponymic elements. Finally, maps were mosaicized
CREATION OF HISTORICAL SPATIAL DATA
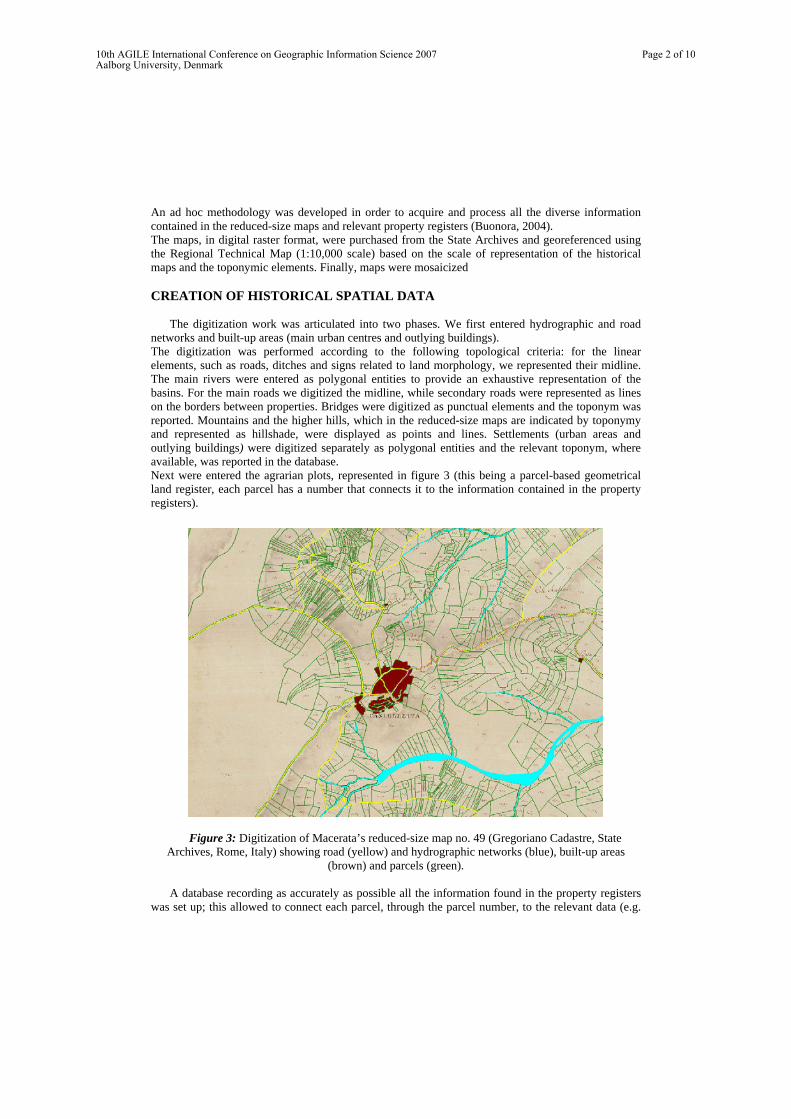
The digitization work was articulated into two phases. We first entered hydrographic and road
networks and built-up areas (main urban centres and outlying buildings). The digitization was performed according to the following topological criteria: for the linear elements, such as roads, ditches and signs related to land morphology, we represented their midline. The main rivers were entered as polygonal entities to provide an exhaustive representation of the basins. For the main roads we digitized the midline, while secondary roads were represented as lines on the borders between properties. Bridges were digitized as punctual elements and the toponym was reported. Mountains and the higher hills, which in the reduced-size maps are indicated by toponymy and represented as hillshade, were displayed as points and lines. Settlements (urban areas and outlying buildings) were digitized separately as polygonal entities and the relevant toponym, where available, was reported in the database. Next were entered the agrarian plots, represented in figure 3 (this being a parcel-based geometrical land register, each parcel has a number that connects it to the information contained in the property registers).
Figure 3: Digitization of Macerata’s reduced-size map no. 49 (Gregoriano Cadastre, State Archives, Rome, Italy) showing road (yellow) and hydrographic networks (blue), built-up areas
(brown) and parcels (green). A database recording as accurately as possible all the information found in the property registers
was set up; this allowed to connect each parcel, through the parcel number, to the relevant data (e.g.
10th AGILE International Conference on Geographic Information Science 2007Aalborg University, Denmark
Page 2 of 10
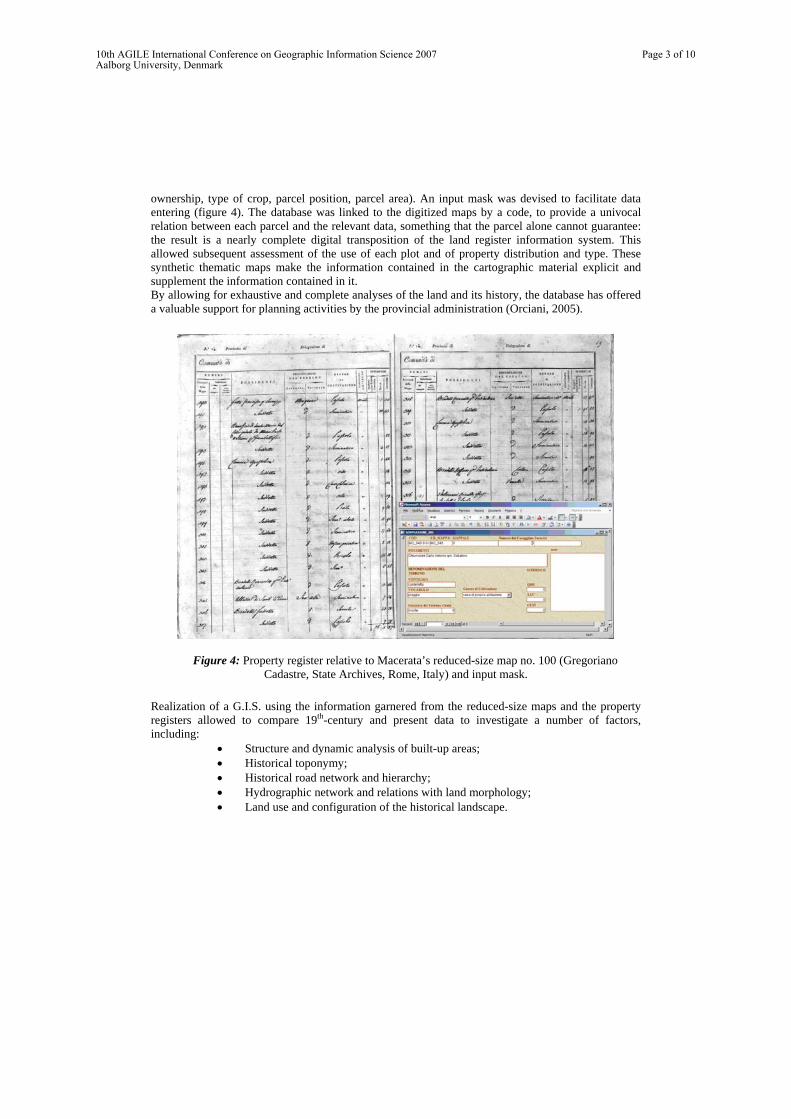
ownership, type of crop, parcel position, parcel area). An input mask was devised to facilitate data entering (figure 4). The database was linked to the digitized maps by a code, to provide a univocal relation between each parcel and the relevant data, something that the parcel alone cannot guarantee: the result is a nearly complete digital transposition of the land register information system. This allowed subsequent assessment of the use of each plot and of property distribution and type. These synthetic thematic maps make the information contained in the cartographic material explicit and supplement the information contained in it. By allowing for exhaustive and complete analyses of the land and its history, the database has offered a valuable support for planning activities by the provincial administration (Orciani, 2005).
Figure 4: Property register relative to Macerata’s reduced-size map no. 100 (Gregoriano Cadastre, State Archives, Rome, Italy) and input mask.
Realization of a G.I.S. using the information garnered from the reduced-size maps and the property registers allowed to compare 19th-century and present data to investigate a number of factors, including:
• Structure and dynamic analysis of built-up areas; • Historical toponymy; • Historical road network and hierarchy; • Hydrographic network and relations with land morphology; • Land use and configuration of the historical landscape.
10th AGILE International Conference on Geographic Information Science 2007Aalborg University, Denmark
Page 3 of 10
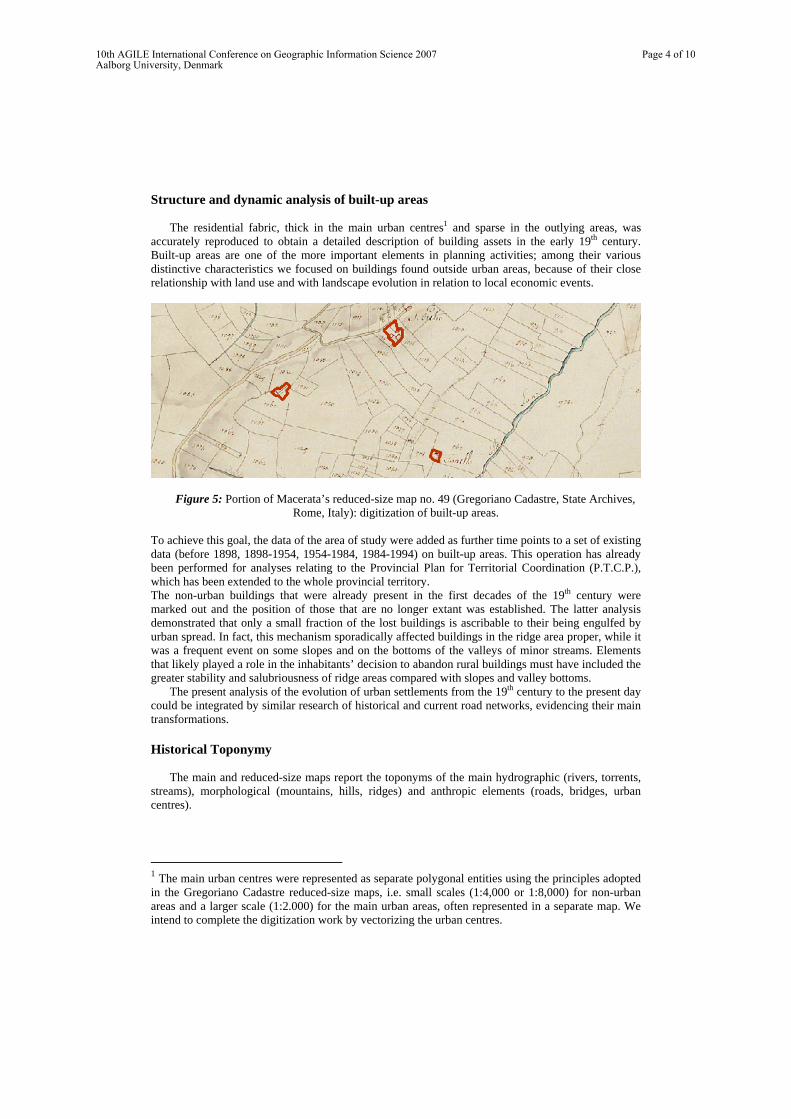
Structure and dynamic analysis of built-up areas The residential fabric, thick in the main urban centres1 and sparse in the outlying areas, was
accurately reproduced to obtain a detailed description of building assets in the early 19th century. Built-up areas are one of the more important elements in planning activities; among their various distinctive characteristics we focused on buildings found outside urban areas, because of their close relationship with land use and with landscape evolution in relation to local economic events.
Figure 5: Portion of Macerata’s reduced-size map no. 49 (Gregoriano Cadastre, State Archives,
Rome, Italy): digitization of built-up areas.
To achieve this goal, the data of the area of study were added as further time points to a set of existing data (before 1898, 1898-1954, 1954-1984, 1984-1994) on built-up areas. This operation has already been performed for analyses relating to the Provincial Plan for Territorial Coordination (P.T.C.P.), which has been extended to the whole provincial territory. The non-urban buildings that were already present in the first decades of the 19th century were marked out and the position of those that are no longer extant was established. The latter analysis demonstrated that only a small fraction of the lost buildings is ascribable to their being engulfed by urban spread. In fact, this mechanism sporadically affected buildings in the ridge area proper, while it was a frequent event on some slopes and on the bottoms of the valleys of minor streams. Elements that likely played a role in the inhabitants’ decision to abandon rural buildings must have included the greater stability and salubriousness of ridge areas compared with slopes and valley bottoms.
The present analysis of the evolution of urban settlements from the 19th century to the present day could be integrated by similar research of historical and current road networks, evidencing their main transformations.
Historical Toponymy
The main and reduced-size maps report the toponyms of the main hydrographic (rivers, torrents,
streams), morphological (mountains, hills, ridges) and anthropic elements (roads, bridges, urban centres).
1 The main urban centres were represented as separate polygonal entities using the principles adopted in the Gregoriano Cadastre reduced-size maps, i.e. small scales (1:4,000 or 1:8,000) for non-urban areas and a larger scale (1:2.000) for the main urban areas, often represented in a separate map. We intend to complete the digitization work by vectorizing the urban centres.
10th AGILE International Conference on Geographic Information Science 2007Aalborg University, Denmark
Page 4 of 10
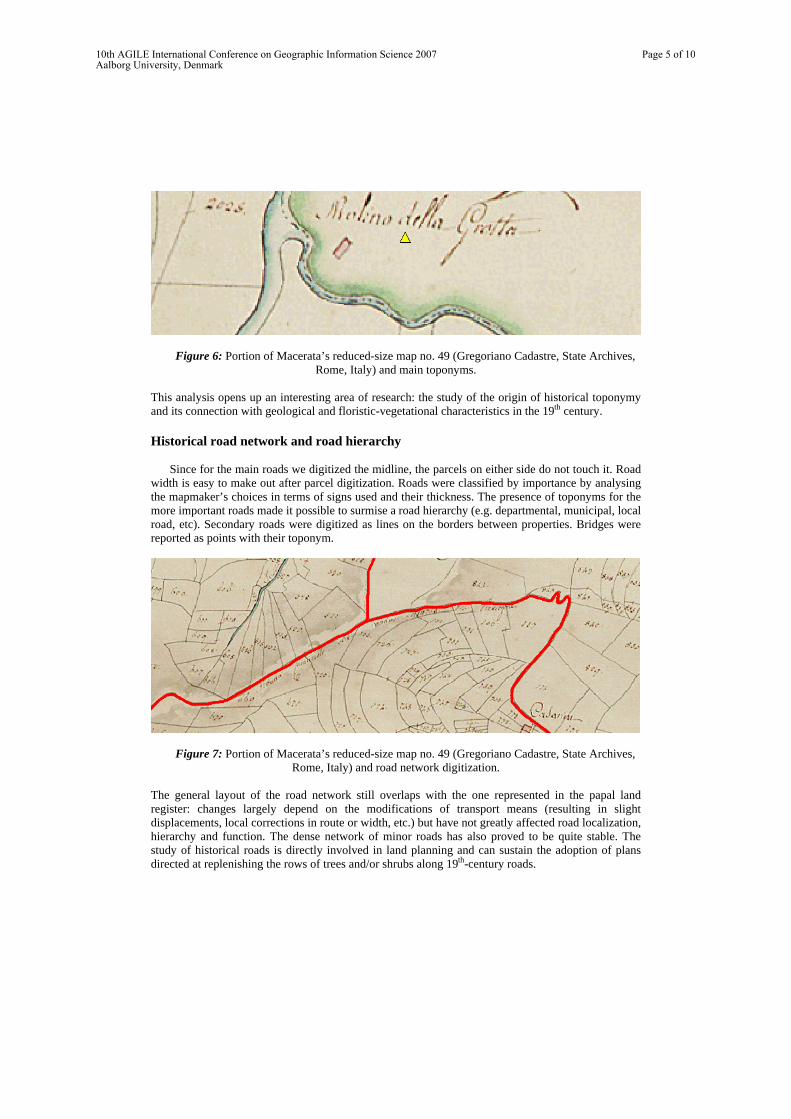
Figure 6: Portion of Macerata’s reduced-size map no. 49 (Gregoriano Cadastre, State Archives,
Rome, Italy) and main toponyms.
This analysis opens up an interesting area of research: the study of the origin of historical toponymy and its connection with geological and floristic-vegetational characteristics in the 19th century.
Historical road network and road hierarchy
Since for the main roads we digitized the midline, the parcels on either side do not touch it. Road
width is easy to make out after parcel digitization. Roads were classified by importance by analysing the mapmaker’s choices in terms of signs used and their thickness. The presence of toponyms for the more important roads made it possible to surmise a road hierarchy (e.g. departmental, municipal, local road, etc). Secondary roads were digitized as lines on the borders between properties. Bridges were reported as points with their toponym.
Figure 7: Portion of Macerata’s reduced-size map no. 49 (Gregoriano Cadastre, State Archives, Rome, Italy) and road network digitization.
The general layout of the road network still overlaps with the one represented in the papal land register: changes largely depend on the modifications of transport means (resulting in slight displacements, local corrections in route or width, etc.) but have not greatly affected road localization, hierarchy and function. The dense network of minor roads has also proved to be quite stable. The study of historical roads is directly involved in land planning and can sustain the adoption of plans directed at replenishing the rows of trees and/or shrubs along 19th-century roads.
10th AGILE International Conference on Geographic Information Science 2007Aalborg University, Denmark
Page 5 of 10
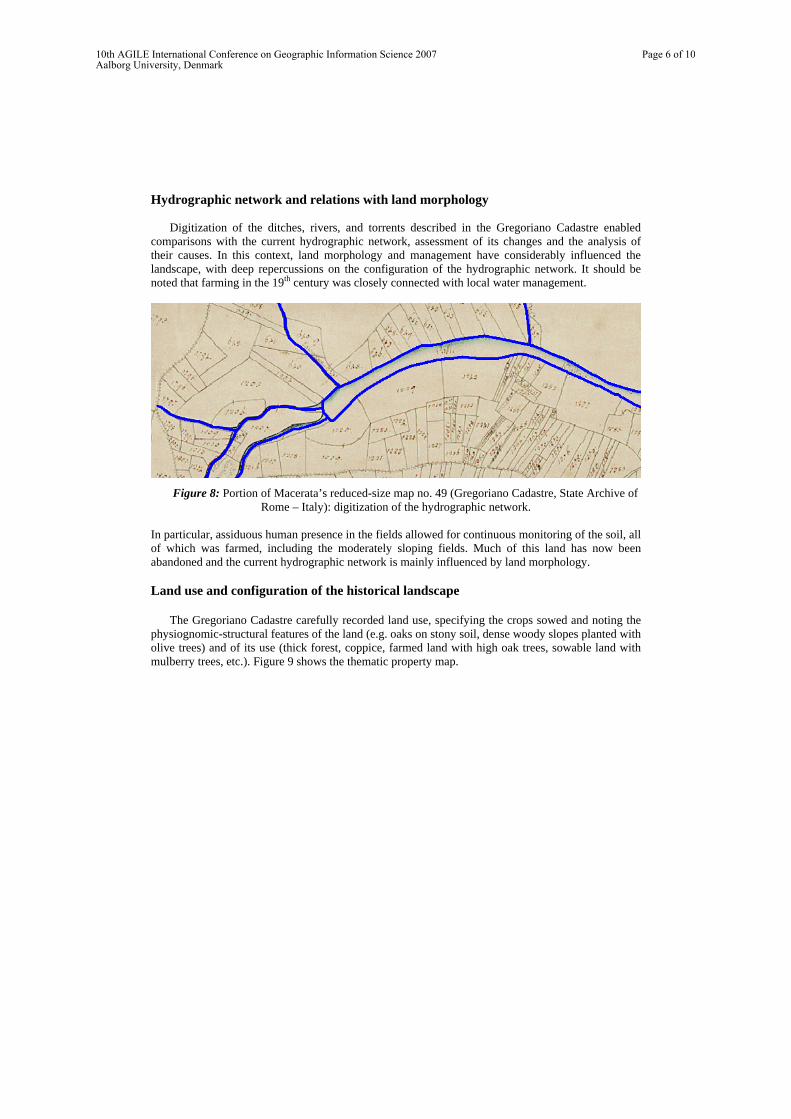
Hydrographic network and relations with land morphology
Digitization of the ditches, rivers, and torrents described in the Gregoriano Cadastre enabled comparisons with the current hydrographic network, assessment of its changes and the analysis of their causes. In this context, land morphology and management have considerably influenced the landscape, with deep repercussions on the configuration of the hydrographic network. It should be noted that farming in the 19th century was closely connected with local water management.
Figure 8: Portion of Macerata’s reduced-size map no. 49 (Gregoriano Cadastre, State Archive of
Rome – Italy): digitization of the hydrographic network.
In particular, assiduous human presence in the fields allowed for continuous monitoring of the soil, all of which was farmed, including the moderately sloping fields. Much of this land has now been abandoned and the current hydrographic network is mainly influenced by land morphology.
Land use and configuration of the historical landscape
The Gregoriano Cadastre carefully recorded land use, specifying the crops sowed and noting the
physiognomic-structural features of the land (e.g. oaks on stony soil, dense woody slopes planted with olive trees) and of its use (thick forest, coppice, farmed land with high oak trees, sowable land with mulberry trees, etc.). Figure 9 shows the thematic property map.
10th AGILE International Conference on Geographic Information Science 2007Aalborg University, Denmark
Page 6 of 10
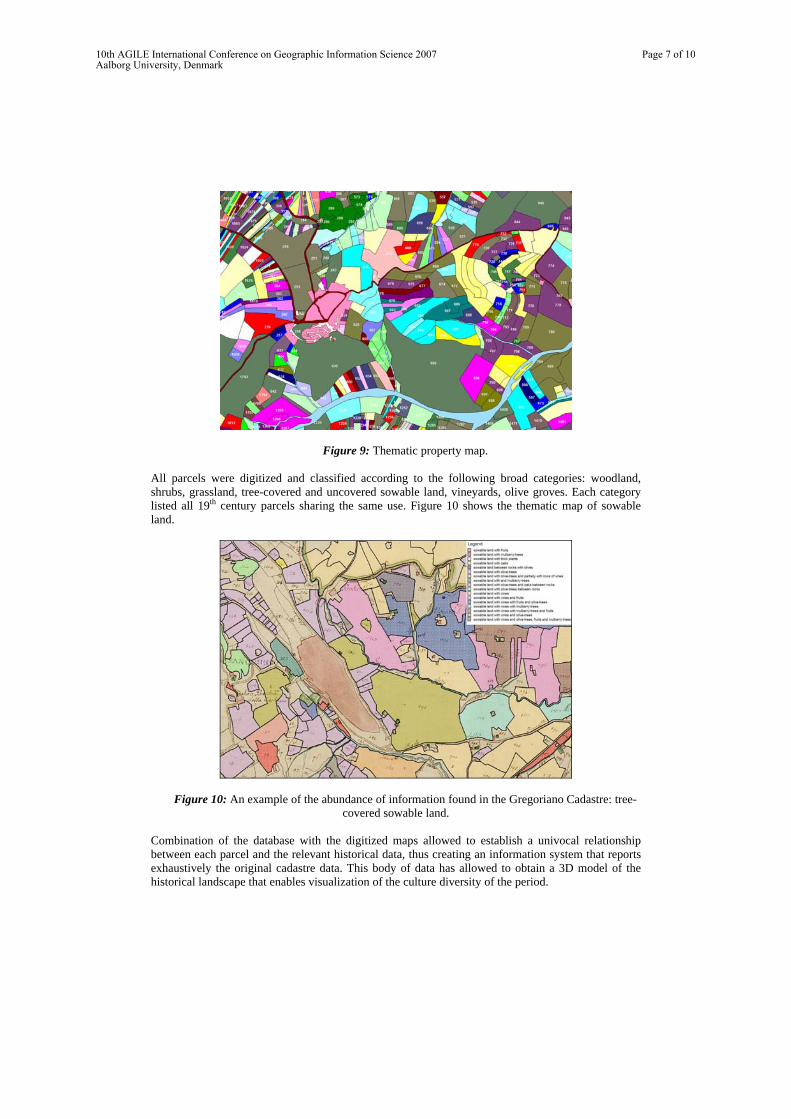
Figure 9: Thematic property map.
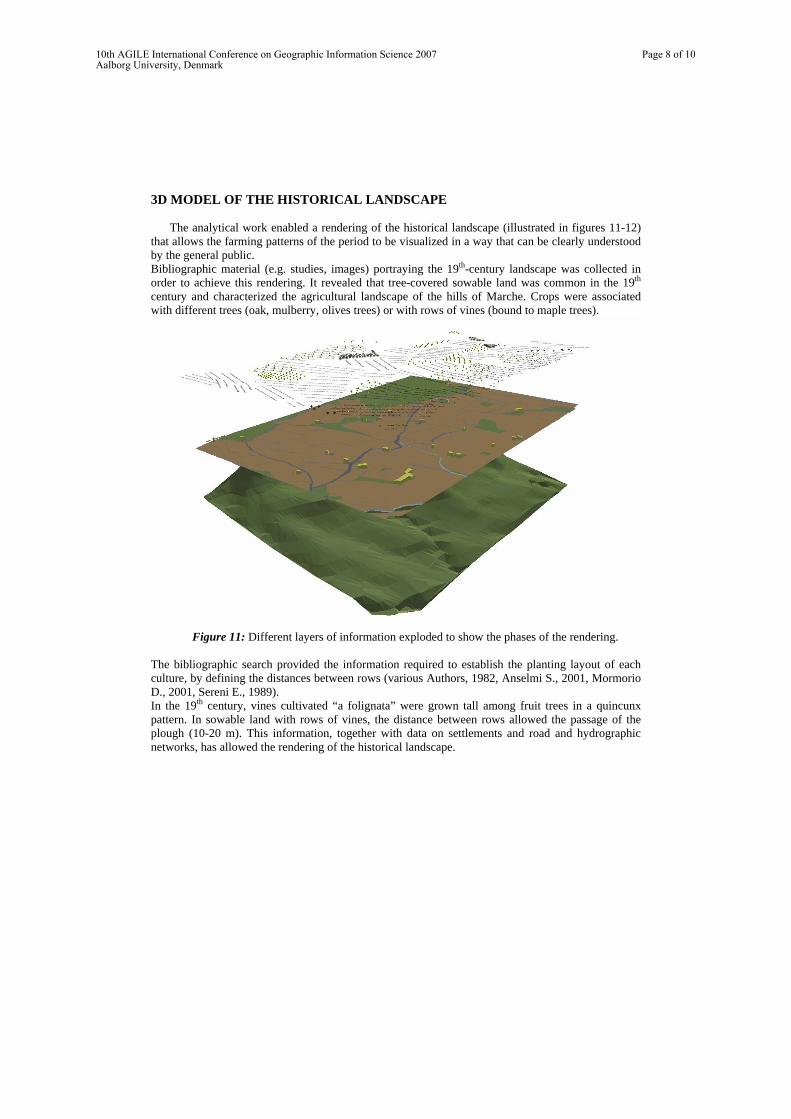
All parcels were digitized and classified according to the following broad categories: woodland, shrubs, grassland, tree-covered and uncovered sowable land, vineyards, olive groves. Each category listed all 19th century parcels sharing the same use. Figure 10 shows the thematic map of sowable land.
Figure 10: An example of the abundance of information found in the Gregoriano Cadastre: tree-covered sowable land.
Combination of the database with the digitized maps allowed to establish a univocal relationship between each parcel and the relevant historical data, thus creating an information system that reports exhaustively the original cadastre data. This body of data has allowed to obtain a 3D model of the historical landscape that enables visualization of the culture diversity of the period.
10th AGILE International Conference on Geographic Information Science 2007Aalborg University, Denmark
Page 7 of 10
3D MODEL OF THE HISTORICAL LANDSCAPE The analytical work enabled a rendering of the historical landscape (illustrated in figures 11-12)
that allows the farming patterns of the period to be visualized in a way that can be clearly understood by the general public. Bibliographic material (e.g. studies, images) portraying the 19th-century landscape was collected in order to achieve this rendering. It revealed that tree-covered sowable land was common in the 19th century and characterized the agricultural landscape of the hills of Marche. Crops were associated with different trees (oak, mulberry, olives trees) or with rows of vines (bound to maple trees).
Figure 11: Different layers of information exploded to show the phases of the rendering.
The bibliographic search provided the information required to establish the planting layout of each culture, by defining the distances between rows (various Authors, 1982, Anselmi S., 2001, Mormorio D., 2001, Sereni E., 1989). In the 19th century, vines cultivated “a folignata” were grown tall among fruit trees in a quincunx pattern. In sowable land with rows of vines, the distance between rows allowed the passage of the plough (10-20 m). This information, together with data on settlements and road and hydrographic networks, has allowed the rendering of the historical landscape.
10th AGILE International Conference on Geographic Information Science 2007Aalborg University, Denmark
Page 8 of 10
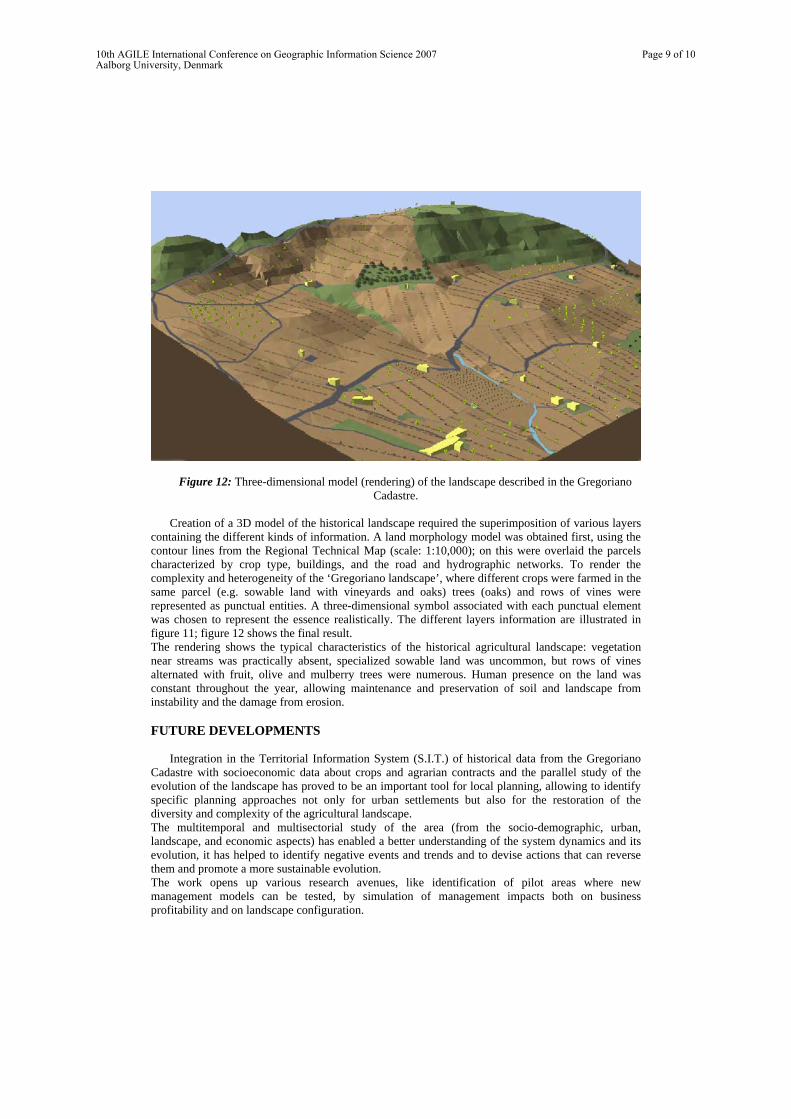
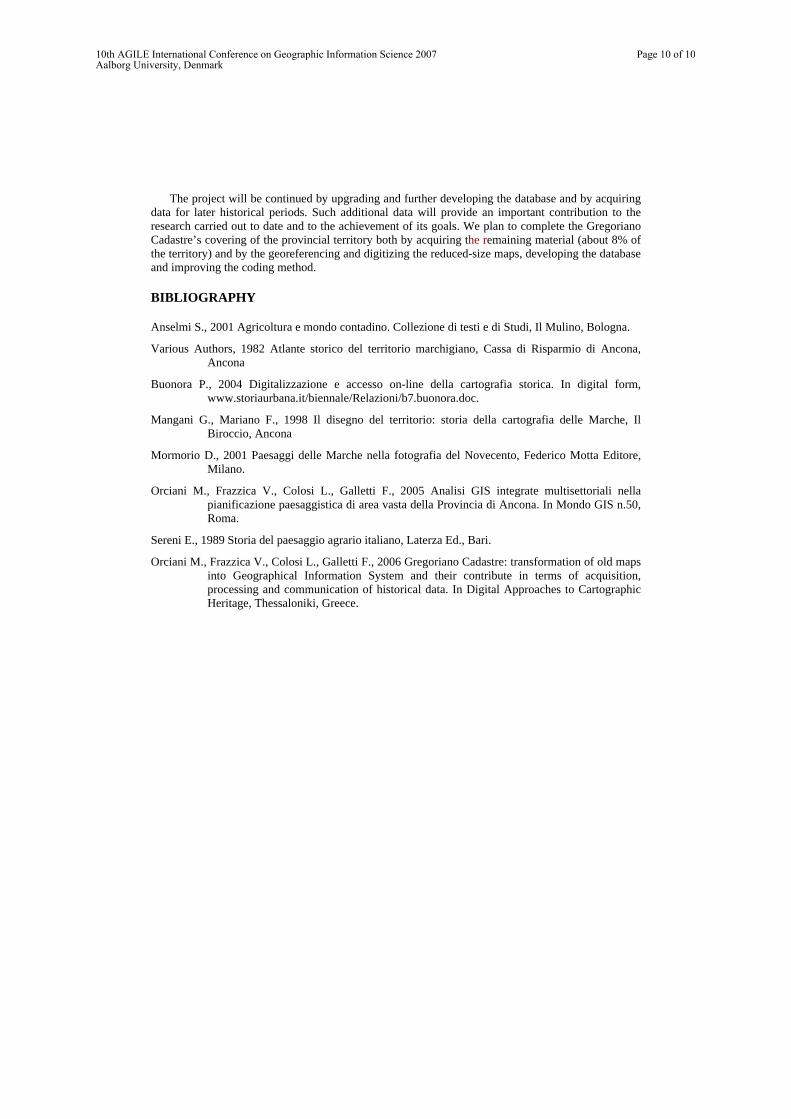
Figure 12: Three-dimensional model (rendering) of the landscape described in the Gregoriano Cadastre.
Creation of a 3D model of the historical landscape required the superimposition of various layers
containing the different kinds of information. A land morphology model was obtained first, using the contour lines from the Regional Technical Map (scale: 1:10,000); on this were overlaid the parcels characterized by crop type, buildings, and the road and hydrographic networks. To render the complexity and heterogeneity of the ‘Gregoriano landscape’, where different crops were farmed in the same parcel (e.g. sowable land with vineyards and oaks) trees (oaks) and rows of vines were represented as punctual entities. A three-dimensional symbol associated with each punctual element was chosen to represent the essence realistically. The different layers information are illustrated in figure 11; figure 12 shows the final result. The rendering shows the typical characteristics of the historical agricultural landscape: vegetation near streams was practically absent, specialized sowable land was uncommon, but rows of vines alternated with fruit, olive and mulberry trees were numerous. Human presence on the land was constant throughout the year, allowing maintenance and preservation of soil and landscape from instability and the damage from erosion.
FUTURE DEVELOPMENTS
Integration in the Territorial Information System (S.I.T.) of historical data from the Gregoriano
Cadastre with socioeconomic data about crops and agrarian contracts and the parallel study of the evolution of the landscape has proved to be an important tool for local planning, allowing to identify specific planning approaches not only for urban settlements but also for the restoration of the diversity and complexity of the agricultural landscape. The multitemporal and multisectorial study of the area (from the socio-demographic, urban, landscape, and economic aspects) has enabled a better understanding of the system dynamics and its evolution, it has helped to identify negative events and trends and to devise actions that can reverse them and promote a more sustainable evolution. The work opens up various research avenues, like identification of pilot areas where new management models can be tested, by simulation of management impacts both on business profitability and on landscape configuration.
10th AGILE International Conference on Geographic Information Science 2007Aalborg University, Denmark
Page 9 of 10
The project will be continued by upgrading and further developing the database and by acquiring data for later historical periods. Such additional data will provide an important contribution to the research carried out to date and to the achievement of its goals. We plan to complete the Gregoriano Cadastre’s covering of the provincial territory both by acquiring the remaining material (about 8% of the territory) and by the georeferencing and digitizing the reduced-size maps, developing the database and improving the coding method. BIBLIOGRAPHY Anselmi S., 2001 Agricoltura e mondo contadino. Collezione di testi e di Studi, Il Mulino, Bologna.
Various Authors, 1982 Atlante storico del territorio marchigiano, Cassa di Risparmio di Ancona, Ancona
Buonora P., 2004 Digitalizzazione e accesso on-line della cartografia storica. In digital form, www.storiaurbana.it/biennale/Relazioni/b7.buonora.doc.
Mangani G., Mariano F., 1998 Il disegno del territorio: storia della cartografia delle Marche, Il Biroccio, Ancona
Mormorio D., 2001 Paesaggi delle Marche nella fotografia del Novecento, Federico Motta Editore, Milano.
Orciani M., Frazzica V., Colosi L., Galletti F., 2005 Analisi GIS integrate multisettoriali nella pianificazione paesaggistica di area vasta della Provincia di Ancona. In Mondo GIS n.50, Roma.
Sereni E., 1989 Storia del paesaggio agrario italiano, Laterza Ed., Bari.
Orciani M., Frazzica V., Colosi L., Galletti F., 2006 Gregoriano Cadastre: transformation of old maps into Geographical Information System and their contribute in terms of acquisition, processing and communication of historical data. In Digital Approaches to Cartographic Heritage, Thessaloniki, Greece.
10th AGILE International Conference on Geographic Information Science 2007Aalborg University, Denmark
Page 10 of 10