Embed Size (px)
Citation preview
FROM THE DESK OF THE CHAIRMAN
Dear Shareholders,
RESULTS FOR THE 9 MONTHS OF 2018We are pleased to announce that PPB Group revenue for 9M2018 was RM3.36 billion, up 6% from 9M2017 at RM3.16 million due to higher revenue from the Grains & Agribusiness, Environmental Engineering & Utilities as well as Film Exhibition and Distribution segments.
Overall Group profit before tax for 9M2018 was RM921 million, 4% higher than that achieved in 9M2017 of RM887 million. The increase was due to higher contribution from Wilmar International Limited of RM682 million compared with RM614 million in 9M2017 as well as higher profits from Environmental Engineering & Utilities, Film Exhibition and Distribution and Property segments.
Profit for the period under review increased to RM867.5 million compared with RM841.5 million in 9M2017. Accordingly, earnings per share for 9M2018 increased to 60.01 sen compared with 57.13 sen achieved in the same period last year.
CORPORATE EXERCISEPPB’s 1 for 5 bonus issue was completed on 27 July 2018 following the listing and quotation of 237,099,057 bonus shares on the Main Market of Bursa Securities.
PROSPECTS FOR THE CURRENT YEARAmidst a challenging operating environment and volatile commodity market, the Grains & Agribusiness segment is expected to perform satisfactorily due to stronger export demand from flour-based food manufacturers in the final quarter; in addition, the animal feed business is also anticipated to maintain its good performance. Performance of the Consumer Products segment will remain stable with more promotional activities and campaigns going into the last quarter of the year. The Film Exhibition & Distribution segment will continue to be driven by movie releases and contribution from new cinemas opened in 2017. The Environmental Engineering & Utilities segment is expected to perform better with higher contributions from contracts in hand. The on-going sales of the Megah Rise project in Petaling Jaya and improved tenancy from the extended and refurbished Cheras LeisureMall are expected to contribute positively to the Property segment.
2
QUARTERLY REPORT • 30 SEPTEMBER 2018INVESTOR UPDATE
In summary, the Group’s main businesses are expected to perform satisfactorily in FY2018, and the overall Group financial results for the year would depend substantially on Wilmar’s business performance.
HAPPENINGSGolden Screen Cinemas (GSC) Group organised the inaugural Vietnamese Film Festival launched on 14 August 2018 at GSC Pavilion, Kuala Lumpur to coincide with Vietnam’s Independence Day on 2 September 2018. Five highly-acclaimed Vietnamese films were screened in selected GSC locations in Peninsular Malaysia.
PPB held its second Press and Analyst Briefing for the year on 4 September 2018 at Shangri-La Hotel, Kuala Lumpur to review the half-year financial results for 2018 and latest developments in the PPB Group.
CSR ACTIVITIESFor the quarter under review, PPB Group organised/participated in several corporate social responsibility (CSR) activities, amongst them being :-
• Hari Raya celebration with the children of Yayasan Chow Kit.
• 40 schools in Muar and Pasir Gudang, both located in the state of Johor were the recipients of PPB’s sponsorship for the programme “English for Better Opportunities (EBO)” in collaboration with The Star Media Group. The aim of EBO is to improve students’ English language proficiency.
• PPB participated in two charity runs namely, the Bursa Bull Charge 2018 organised by Bursa Malaysia, and The Edge Kuala Lumpur Rat Race 2018 organised by The Edge, a business and financial newspaper. GSC also sent a team of runners for The Edge event.
• GSC partnered with The Star to start the “GSC Junior Movie Club” to encourage English language learning through movies among students in Johor.
• Cheras LeisureMall celebrated National Day 2018 with the tagline “No matter what language you speak or how you say it, we are Malaysians”. Visuals of the tagline in the four main languages were displayed in the mall together with the “Rukunegara” to instill patriotism.
• FFM Marketing (FFMM) hosted Massimo Junior Master Chef Workshops 2018 for 48 children with The Star Publications’ Kuntum Magazine at FFMM’s baking studio in Sungai Buloh.
• In conjunction with Malaysia Day, GSC released their co-produced “PASKAL THE MOVIE” on 27 September 2018, featuring the Royal Malaysian Navy’s special elite force.
• Cheras LeisureMall organised its annual lantern-making contest in conjunction with the mid-autumn celebration.
• A fun-filled family day outing at Sunway Lagoon was organised by PPB for 246 staff and family members, to celebrate PPB’s 50th Anniversary which fell on 1 November 2018.
GREETINGSAs the year is coming to a close, I take this opportunity to wish all our shareholders, business associates and staff of PPB Group, SEASON’S GREETINGS TO ALL and a HAPPY NEW YEAR!
Tan Sri Datuk Oh Siew NamChairman10 December 2018
3
QUARTERLY REPORT • 30 SEPTEMBER 2018INVESTOR UPDATE

GSC LAUNCHES INAUGURAL VIETNAMESE FILM FESTIVALGolden Screen Cinemas’ (GSC) inaugural Vietnamese Film Festival (VFF) was launched at GSC Pavilion Kuala Lumpur on 14 August 2018. The week-long festival showcased five highly-acclaimed Vietnamese films at several GSC locations in Peninsular Malaysia from 23 to 29 August 2018. The VFF was held in conjunction with Vietnam’s Independence Day on 2 September. Film festivals are usually championed by foreign missions in Malaysia as an effort to promote their respective countries and culture through films. VFF 2018 is unlike other film festivals, as it was wholly-organised by GSC’s group of companies. The five Vietnamese films featured were handpicked by the GSC group’s distribution arm, GSC Movies, and supported by Galaxy Media & Entertainment, GSC’s business counterpart in Vietnam.
4
QUARTERLY REPORT • 30 SEPTEMBER 2018INVESTOR UPDATE
Happenings
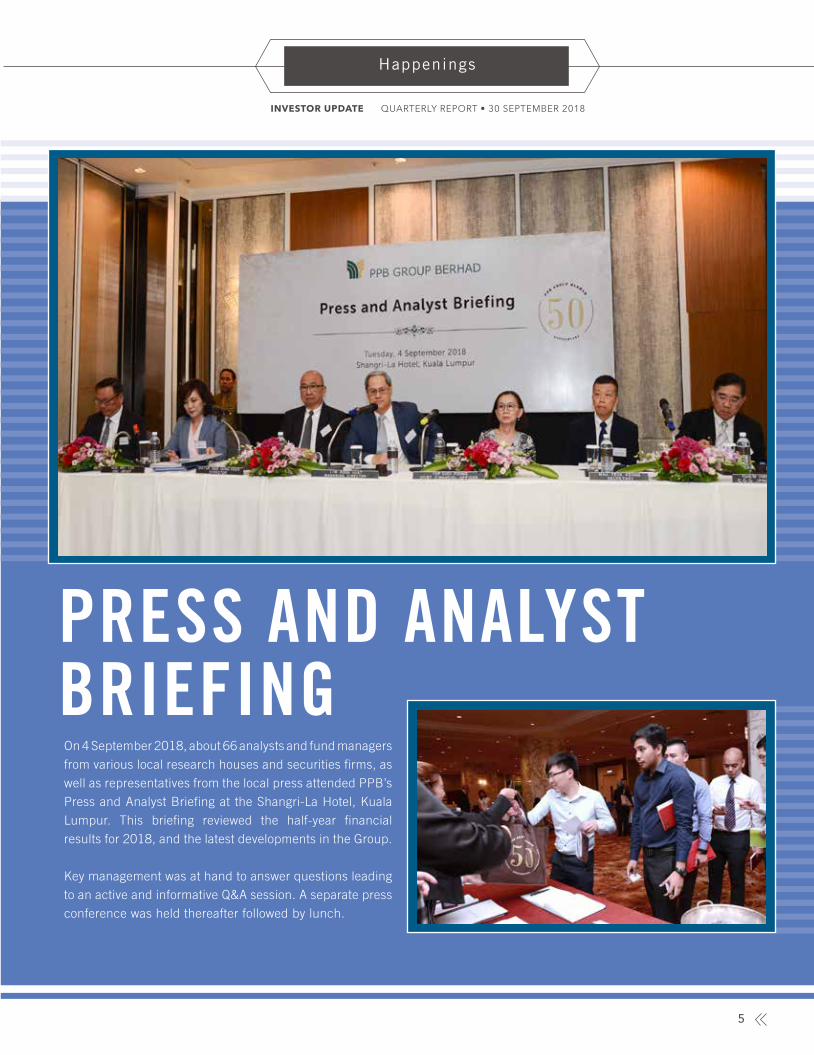
On 4 September 2018, about 66 analysts and fund managers
from various local research houses and securities firms, as
well as representatives from the local press attended PPB’s
Press and Analyst Briefing at the Shangri-La Hotel, Kuala
Lumpur. This briefing reviewed the half-year financial
results for 2018, and the latest developments in the Group.
Key management was at hand to answer questions leading
to an active and informative Q&A session. A separate press
conference was held thereafter followed by lunch.
PRESS AND ANALYST BRIEFING
5
QUARTERLY REPORT • 30 SEPTEMBER 2018INVESTOR UPDATE
Happenings
PPB CELEBRATES HARI RAYA WITH THE CHILDREN OF YAYASAN CHOW KIT
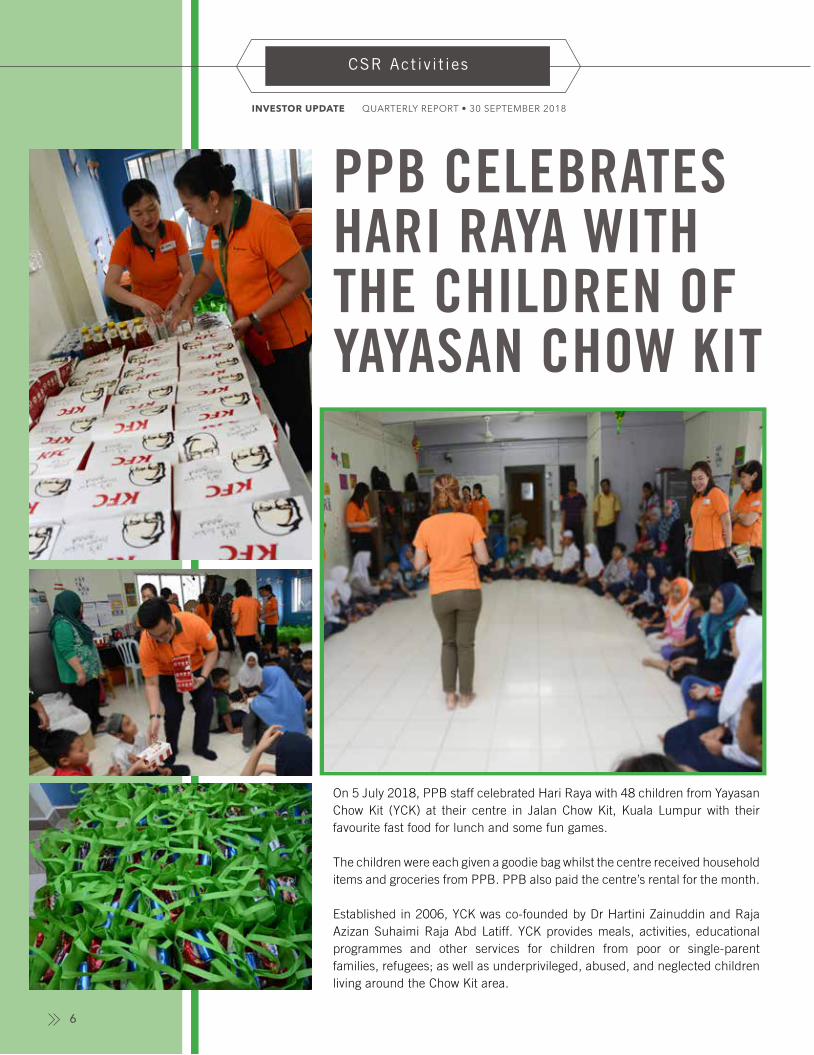
On 5 July 2018, PPB staff celebrated Hari Raya with 48 children from Yayasan Chow Kit (YCK) at their centre in Jalan Chow Kit, Kuala Lumpur with their favourite fast food for lunch and some fun games.
The children were each given a goodie bag whilst the centre received household items and groceries from PPB. PPB also paid the centre’s rental for the month.
Established in 2006, YCK was co-founded by Dr Hartini Zainuddin and Raja Azizan Suhaimi Raja Abd Latiff. YCK provides meals, activities, educational programmes and other services for children from poor or single-parent families, refugees; as well as underprivileged, abused, and neglected children living around the Chow Kit area.
QUARTERLY REPORT • 30 SEPTEMBER 2018INVESTOR UPDATE
CSR Activit ies
6

PPB SPONSORS STUDENTS FOR “ENGLISH FOR BETTER OPPORTUNITIES” PROGRAMME
PPB sponsored 40 primary and secondary schools in Muar and Pasir Gudang (both in Johor state) for The Star’s “English for Better Opportunities (EBO)” programme to improve their English language proficiency. Under the EBO, each school is given 17 issues of “Step Up” and 31 issues of “Newspapers-in-Education” (NIE) a year. Two interactive workshops each were held for the teachers on 2 and 25 July 2018, and for students on 3 and 26 July 2018 in Muar and Pasir Gudang respectively, to guide them on the EBO programme.
QUARTERLY REPORT • 30 SEPTEMBER 2018INVESTOR UPDATE
CSR Activit ies
7
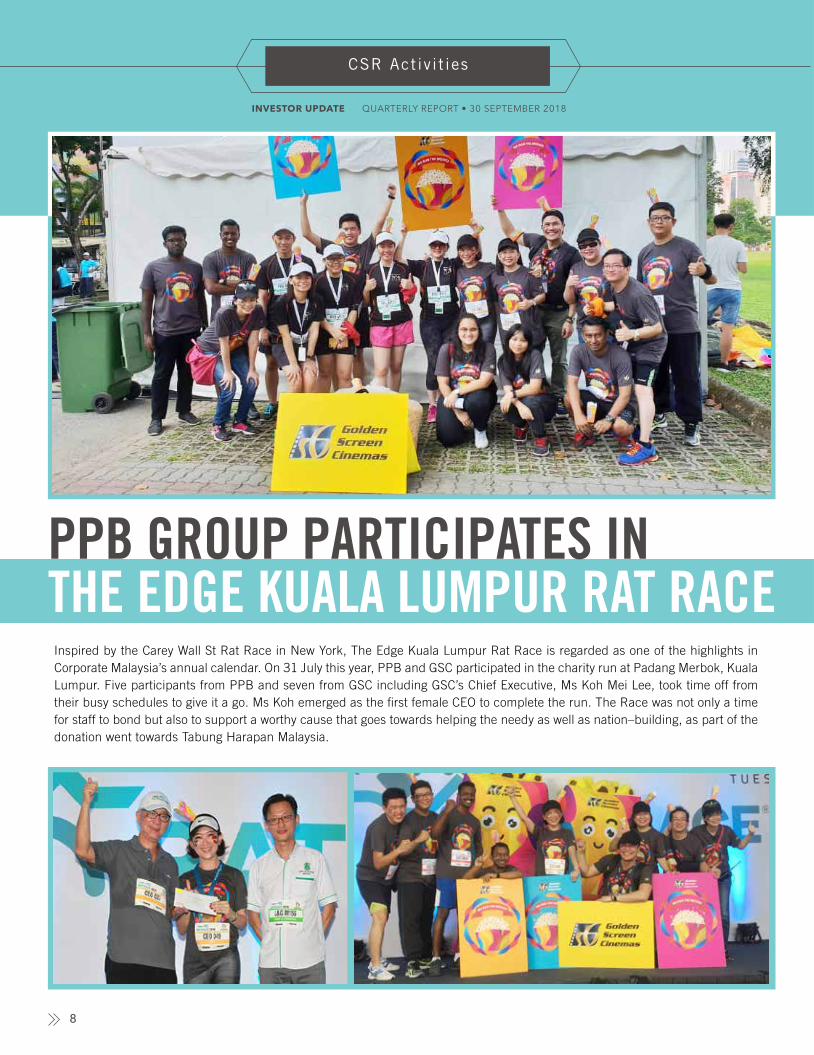
PPB GROUP PARTICIPATES IN THE EDGE KUALA LUMPUR RAT RACEInspired by the Carey Wall St Rat Race in New York, The Edge Kuala Lumpur Rat Race is regarded as one of the highlights in Corporate Malaysia’s annual calendar. On 31 July this year, PPB and GSC participated in the charity run at Padang Merbok, Kuala Lumpur. Five participants from PPB and seven from GSC including GSC’s Chief Executive, Ms Koh Mei Lee, took time off from their busy schedules to give it a go. Ms Koh emerged as the first female CEO to complete the run. The Race was not only a time for staff to bond but also to support a worthy cause that goes towards helping the needy as well as nation–building, as part of the donation went towards Tabung Harapan Malaysia.
QUARTERLY REPORT • 30 SEPTEMBER 2018INVESTOR UPDATE
CSR Activit ies
8
LEARNING ENGLISH WITH GSC JUNIOR MOVIE CLUB
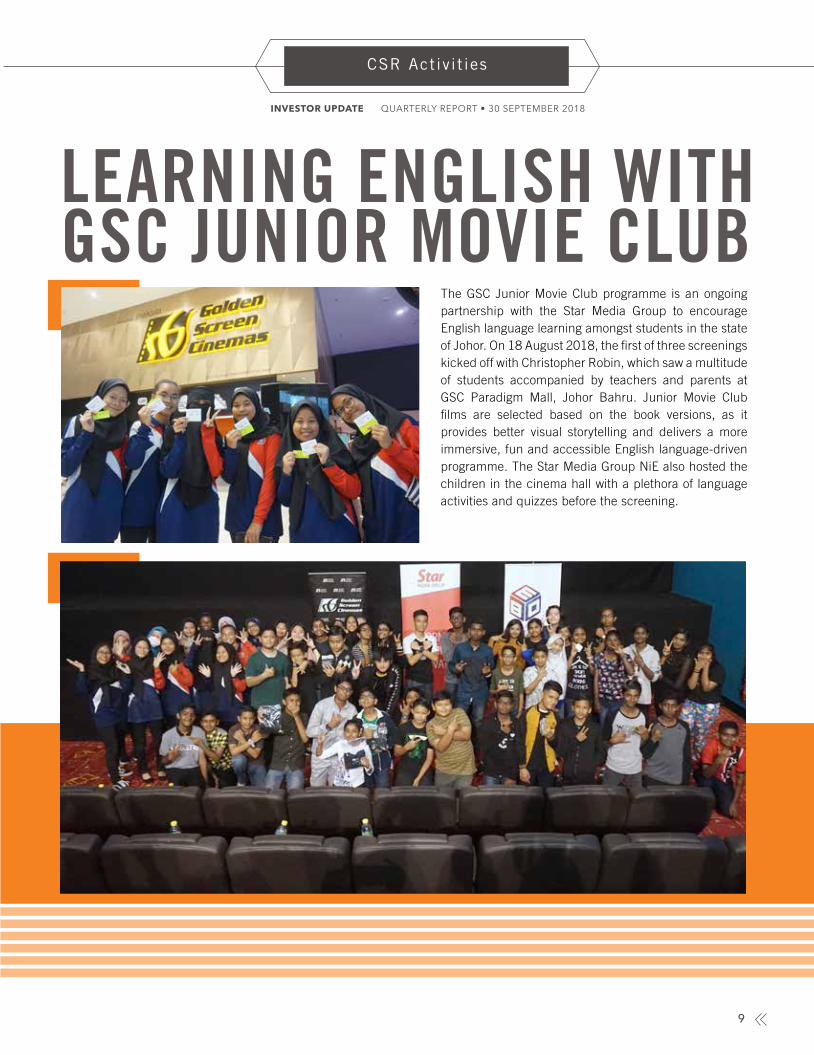
The GSC Junior Movie Club programme is an ongoing partnership with the Star Media Group to encourage English language learning amongst students in the state of Johor. On 18 August 2018, the first of three screenings kicked off with Christopher Robin, which saw a multitude of students accompanied by teachers and parents at GSC Paradigm Mall, Johor Bahru. Junior Movie Club films are selected based on the book versions, as it provides better visual storytelling and delivers a more immersive, fun and accessible English language-driven programme. The Star Media Group NiE also hosted the children in the cinema hall with a plethora of language activities and quizzes before the screening.
QUARTERLY REPORT • 30 SEPTEMBER 2018INVESTOR UPDATE
CSR Activit ies
9
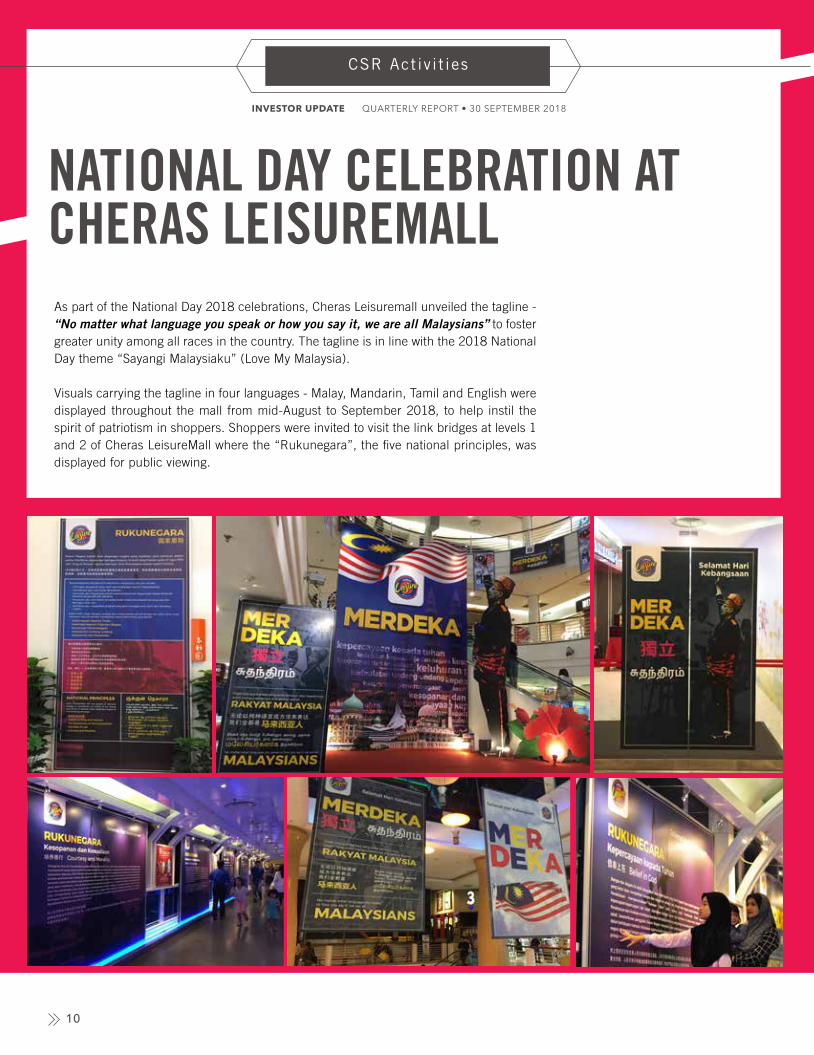
NATIONAL DAY CELEBRATION AT CHERAS LEISUREMALLAs part of the National Day 2018 celebrations, Cheras Leisuremall unveiled the tagline - “No matter what language you speak or how you say it, we are all Malaysians” to foster greater unity among all races in the country. The tagline is in line with the 2018 National Day theme “Sayangi Malaysiaku” (Love My Malaysia).
Visuals carrying the tagline in four languages - Malay, Mandarin, Tamil and English were displayed throughout the mall from mid-August to September 2018, to help instil the spirit of patriotism in shoppers. Shoppers were invited to visit the link bridges at levels 1 and 2 of Cheras LeisureMall where the “Rukunegara”, the five national principles, was displayed for public viewing.
QUARTERLY REPORT • 30 SEPTEMBER 2018INVESTOR UPDATE
CSR Activit ies
10
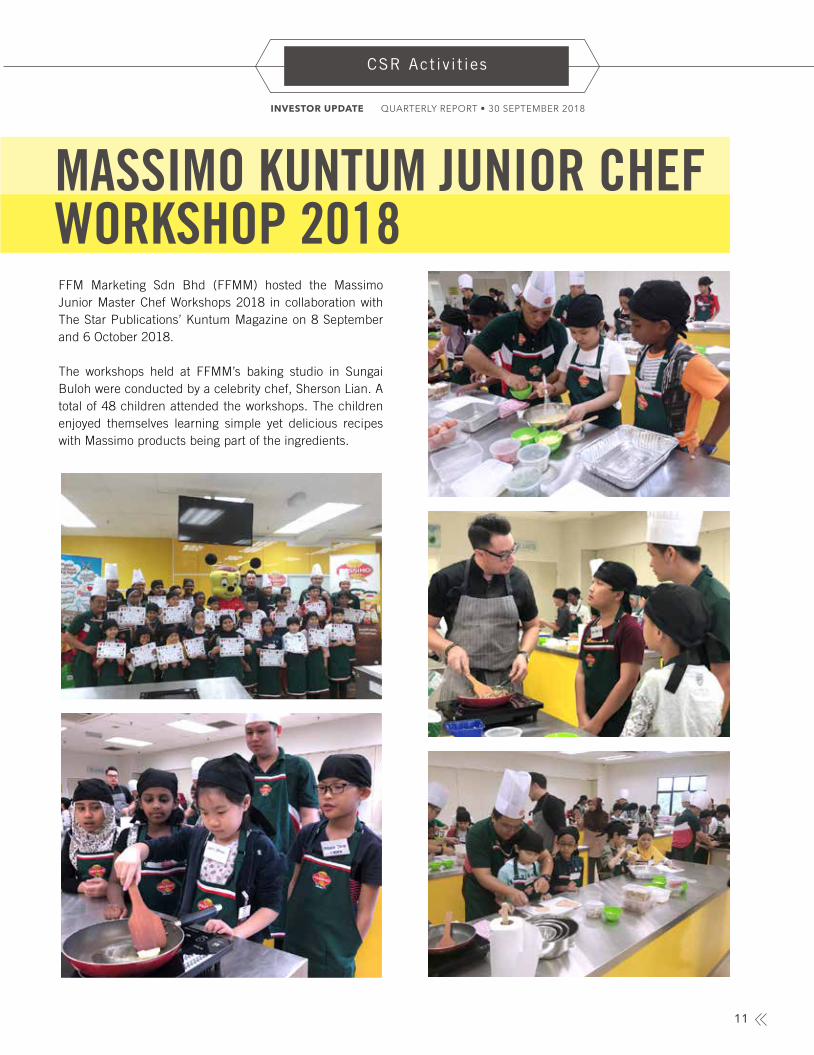
MASSIMO KUNTUM JUNIOR CHEF WORKSHOP 2018FFM Marketing Sdn Bhd (FFMM) hosted the Massimo Junior Master Chef Workshops 2018 in collaboration with The Star Publications’ Kuntum Magazine on 8 September and 6 October 2018.
The workshops held at FFMM’s baking studio in Sungai Buloh were conducted by a celebrity chef, Sherson Lian. A total of 48 children attended the workshops. The children enjoyed themselves learning simple yet delicious recipes with Massimo products being part of the ingredients.
QUARTERLY REPORT • 30 SEPTEMBER 2018INVESTOR UPDATE
CSR Activit ies
11

GSC CELEBRATES MALAYSIA DAY WITH PASKAL THE MOVIE
In conjunction with the Malaysia Day celebration, PASKAL THE MOVIE, a title co-produced by GSC, was released nationwide on 27 September. This film marks our country’s first local title focused on the Royal Malaysian Navy’s special elite force, known as PASKAL (Pasukan Khas Laut). PASKAL THE MOVIE provided audiences with an insight into the sacrifices made by our men in uniform, as well as their part in keeping Malaysia’s borders safe.
QUARTERLY REPORT • 30 SEPTEMBER 2018INVESTOR UPDATE
CSR Activit ies
12
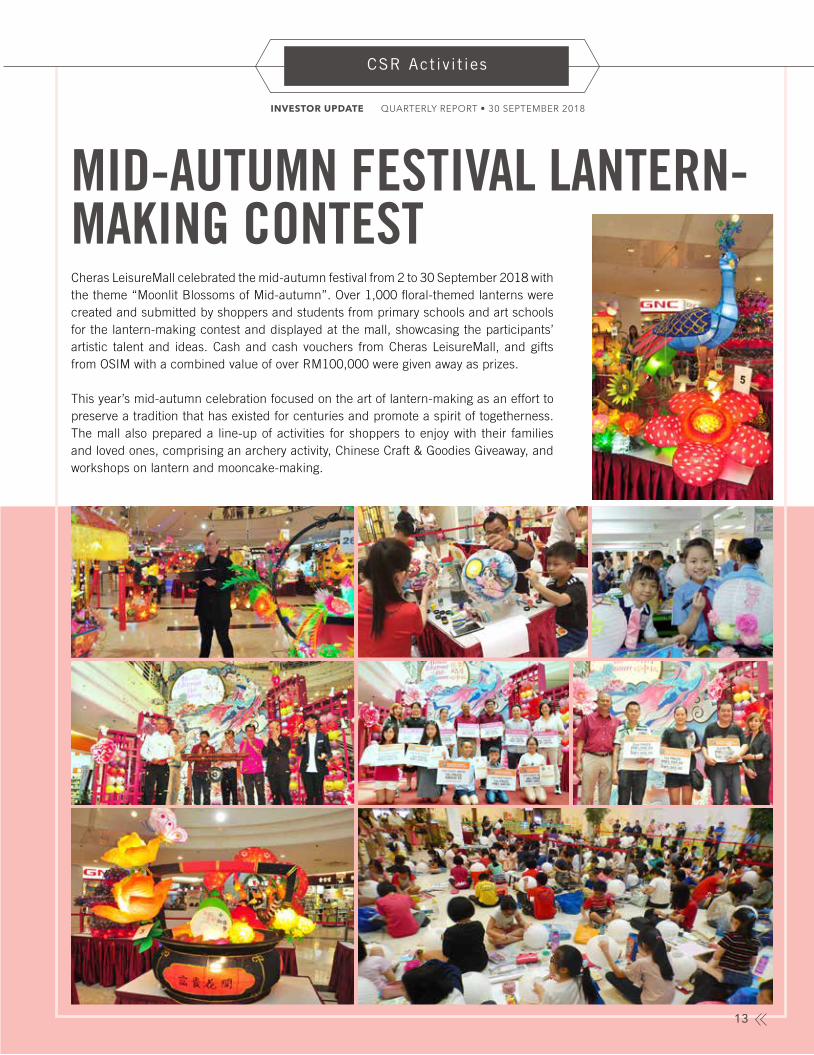
MID-AUTUMN FESTIVAL LANTERN-MAKING CONTESTCheras LeisureMall celebrated the mid-autumn festival from 2 to 30 September 2018 with the theme “Moonlit Blossoms of Mid-autumn”. Over 1,000 floral-themed lanterns were created and submitted by shoppers and students from primary schools and art schools for the lantern-making contest and displayed at the mall, showcasing the participants’ artistic talent and ideas. Cash and cash vouchers from Cheras LeisureMall, and gifts from OSIM with a combined value of over RM100,000 were given away as prizes.
This year’s mid-autumn celebration focused on the art of lantern-making as an effort to preserve a tradition that has existed for centuries and promote a spirit of togetherness. The mall also prepared a line-up of activities for shoppers to enjoy with their families and loved ones, comprising an archery activity, Chinese Craft & Goodies Giveaway, and workshops on lantern and mooncake-making.
QUARTERLY REPORT • 30 SEPTEMBER 2018INVESTOR UPDATE
CSR Activit ies
13
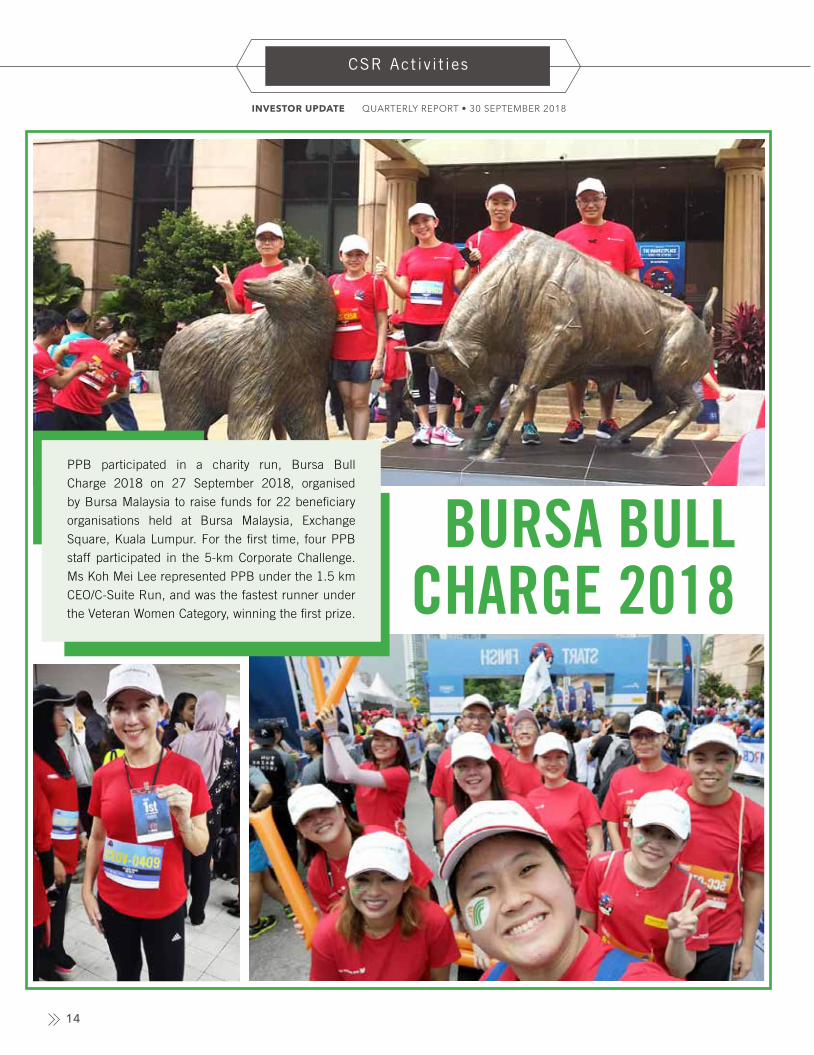
BURSA BULL CHARGE 2018
PPB participated in a charity run, Bursa Bull
Charge 2018 on 27 September 2018, organised
by Bursa Malaysia to raise funds for 22 beneficiary
organisations held at Bursa Malaysia, Exchange
Square, Kuala Lumpur. For the first time, four PPB
staff participated in the 5-km Corporate Challenge.
Ms Koh Mei Lee represented PPB under the 1.5 km
CEO/C-Suite Run, and was the fastest runner under
the Veteran Women Category, winning the first prize.
QUARTERLY REPORT • 30 SEPTEMBER 2018INVESTOR UPDATE
CSR Activit ies
14
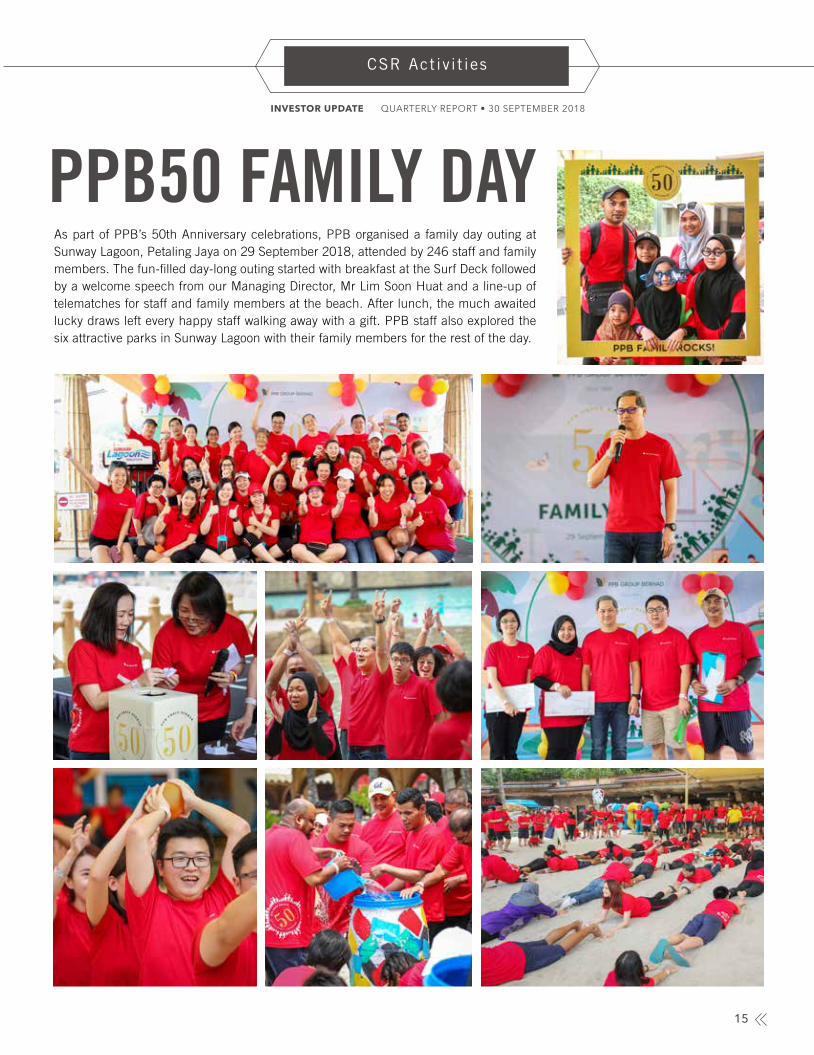
PPB50 FAMILY DAYAs part of PPB’s 50th Anniversary celebrations, PPB organised a family day outing at Sunway Lagoon, Petaling Jaya on 29 September 2018, attended by 246 staff and family members. The fun-filled day-long outing started with breakfast at the Surf Deck followed by a welcome speech from our Managing Director, Mr Lim Soon Huat and a line-up of telematches for staff and family members at the beach. After lunch, the much awaited lucky draws left every happy staff walking away with a gift. PPB staff also explored the six attractive parks in Sunway Lagoon with their family members for the rest of the day.
QUARTERLY REPORT • 30 SEPTEMBER 2018INVESTOR UPDATE
CSR Activit ies
15

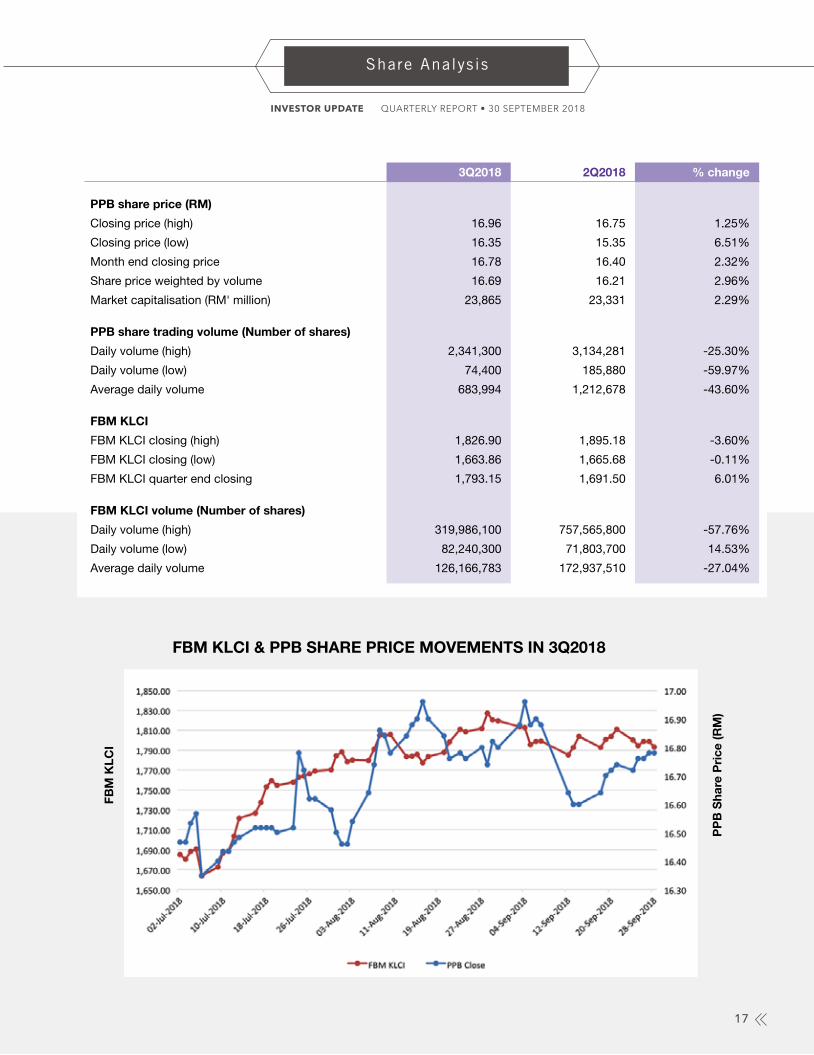
SHARE ANALYSIS The FBM KLCI recovered strongly in the third quarter, increasing by 6.0% to close at 1,793.2 points as at end-September (end-June 2018: 1,691.5 points). The improved performance during the period was mainly due to active buying from domestic institutional investors, driven by improved clarity on the status of major infrastructure projects, higher crude oil prices and positive earnings results in selected large-cap companies. Externally, however, investor sentiments continued to be affected by lingering downside risks, resulting in non-resident outflows of RM1.7 billion during the period.
[Source : Bank Negara Malaysia website]
PPB shares closed at RM16.78 compared with RM16.40 in the preceding quarter and market capitalisation increased to RM23,865 million. The average daily volume of PPB shares traded during the quarter decreased by 43.60% to 683,994 shares.
16
QUARTERLY REPORT • 30 SEPTEMBER 2018INVESTOR UPDATE
Share Analysis
FBM
KLC
I
PP
B S
hare
Pri
ce (R
M)
FBM KLCI & PPB SHARE PRICE MOVEMENTS IN 3Q2018
3Q2018 2Q2018 % change
PPB share price (RM)
Closing price (high) 16.96 16.75 1.25%
Closing price (low) 16.35 15.35 6.51%
Month end closing price 16.78 16.40 2.32%
Share price weighted by volume 16.69 16.21 2.96%
Market capitalisation (RM' million) 23,865 23,331 2.29%
PPB share trading volume (Number of shares)
Daily volume (high) 2,341,300 3,134,281 -25.30%
Daily volume (low) 74,400 185,880 -59.97%
Average daily volume 683,994 1,212,678 -43.60%
FBM KLCI
FBM KLCI closing (high) 1,826.90 1,895.18 -3.60%
FBM KLCI closing (low) 1,663.86 1,665.68 -0.11%
FBM KLCI quarter end closing 1,793.15 1,691.50 6.01%
FBM KLCI volume (Number of shares)
Daily volume (high) 319,986,100 757,565,800 -57.76%
Daily volume (low) 82,240,300 71,803,700 14.53%
Average daily volume 126,166,783 172,937,510 -27.04%
17
QUARTERLY REPORT • 30 SEPTEMBER 2018INVESTOR UPDATE
Share Analysis
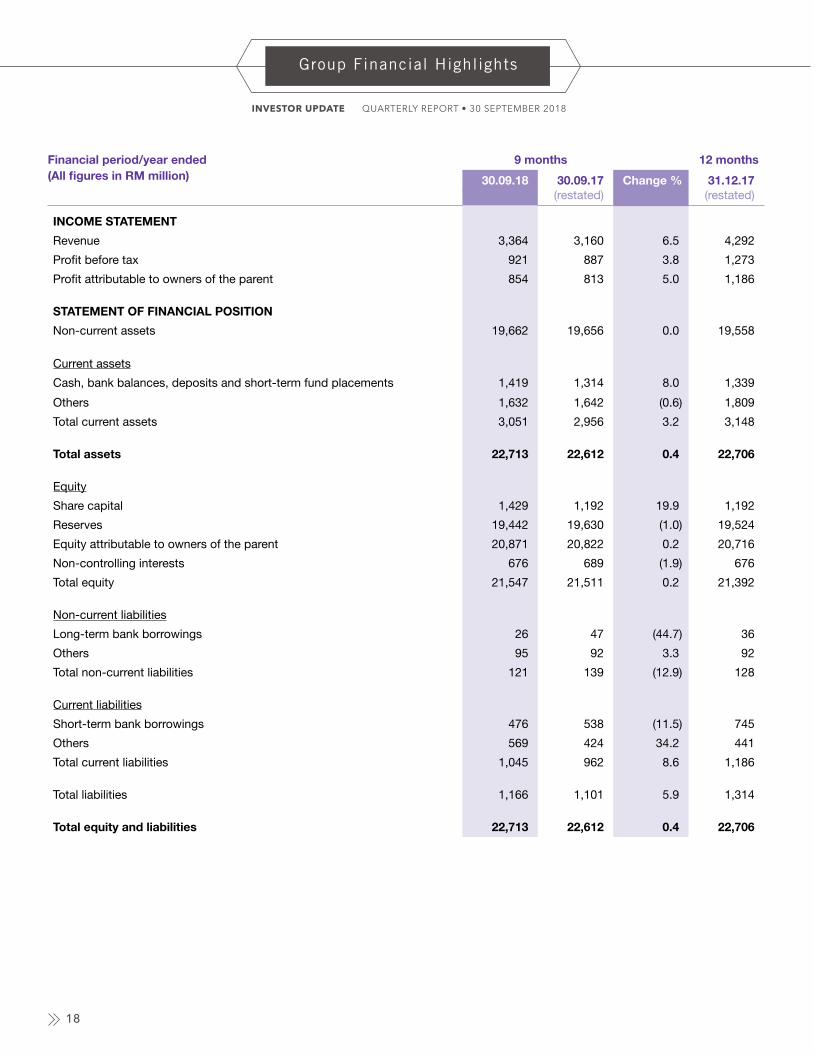
Financial period/year ended(All figures in RM million)
9 months 12 months
30.09.18 30.09.17 Change % 31.12.17(restated) (restated)
INCOME STATEMENT
Revenue 3,364 3,160 6.5 4,292
Profit before tax 921 887 3.8 1,273
Profit attributable to owners of the parent 854 813 5.0 1,186
STATEMENT OF FINANCIAL POSITION
Non-current assets 19,662 19,656 0.0 19,558
Current assets
Cash, bank balances, deposits and short-term fund placements 1,419 1,314 8.0 1,339
Others 1,632 1,642 (0.6) 1,809
Total current assets 3,051 2,956 3.2 3,148
Total assets 22,713 22,612 0.4 22,706
Equity
Share capital 1,429 1,192 19.9 1,192
Reserves 19,442 19,630 (1.0) 19,524
Equity attributable to owners of the parent 20,871 20,822 0.2 20,716
Non-controlling interests 676 689 (1.9) 676
Total equity 21,547 21,511 0.2 21,392
Non-current liabilities
Long-term bank borrowings 26 47 (44.7) 36
Others 95 92 3.3 92
Total non-current liabilities 121 139 (12.9) 128
Current liabilities
Short-term bank borrowings 476 538 (11.5) 745
Others 569 424 34.2 441
Total current liabilities 1,045 962 8.6 1,186
Total liabilities 1,166 1,101 5.9 1,314
Total equity and liabilities 22,713 22,612 0.4 22,706
18
QUARTERLY REPORT • 30 SEPTEMBER 2018INVESTOR UPDATE
Group Financial Highlights
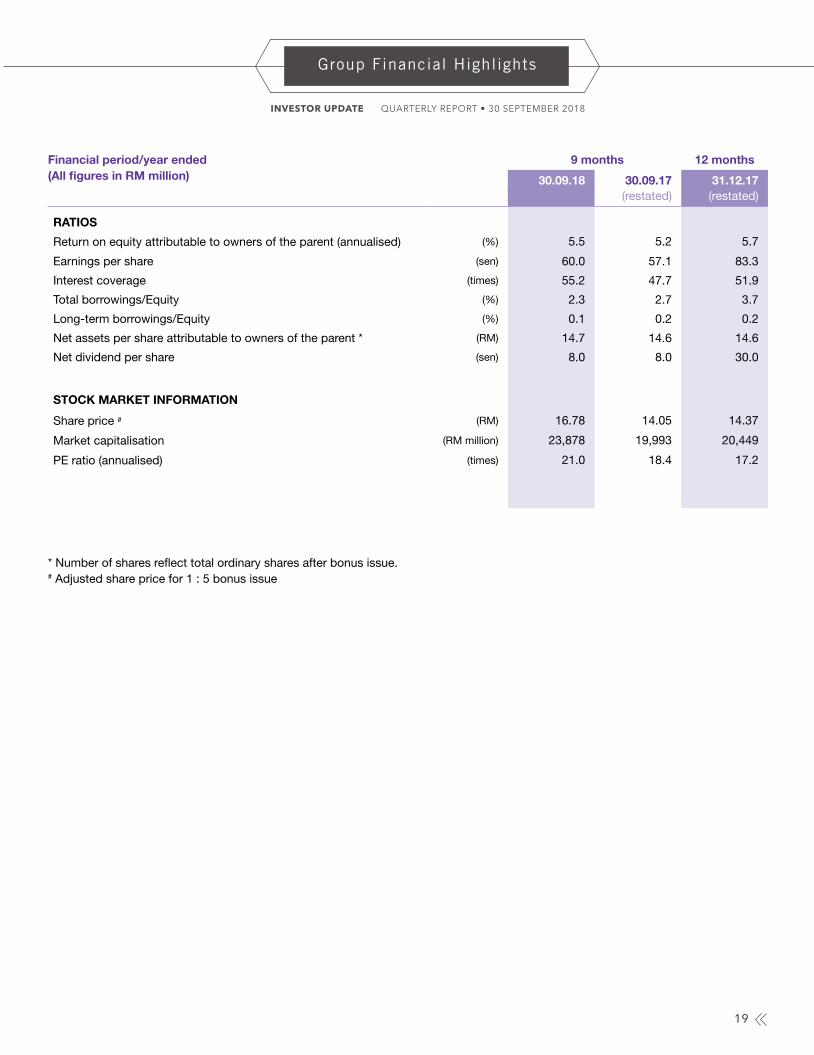
Financial period/year ended(All figures in RM million)
9 months 12 months
30.09.18 30.09.17 31.12.17(restated) (restated)
RATIOS
Return on equity attributable to owners of the parent (annualised) (%) 5.5 5.2 5.7
Earnings per share (sen) 60.0 57.1 83.3
Interest coverage (times) 55.2 47.7 51.9
Total borrowings/Equity (%) 2.3 2.7 3.7
Long-term borrowings/Equity (%) 0.1 0.2 0.2
Net assets per share attributable to owners of the parent * (RM) 14.7 14.6 14.6
Net dividend per share (sen) 8.0 8.0 30.0
STOCK MARKET INFORMATION
Share price # (RM) 16.78 14.05 14.37
Market capitalisation (RM million) 23,878 19,993 20,449
PE ratio (annualised) (times) 21.0 18.4 17.2
* Number of shares reflect total ordinary shares after bonus issue.# Adjusted share price for 1 : 5 bonus issue
19
QUARTERLY REPORT • 30 SEPTEMBER 2018INVESTOR UPDATE
Group Financial Highlights
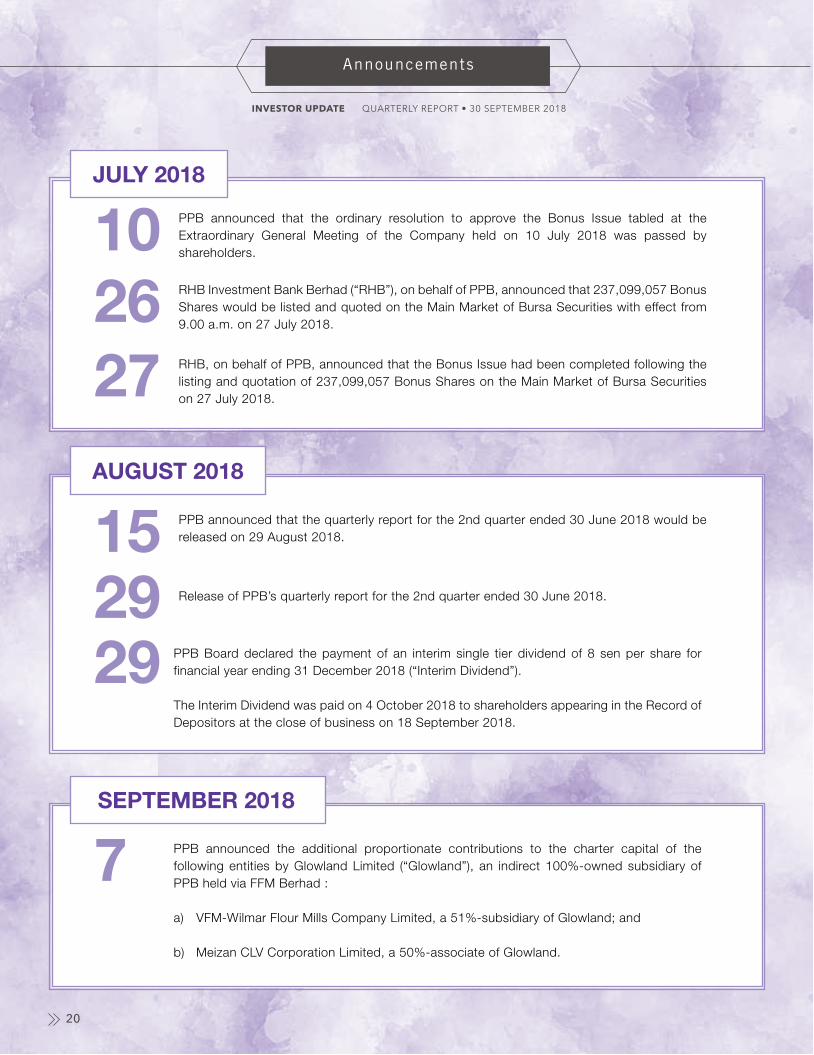
PPB announced that the ordinary resolution to approve the Bonus Issue tabled at the Extraordinary General Meeting of the Company held on 10 July 2018 was passed by shareholders.
PPB announced the additional proportionate contributions to the charter capital of the following entities by Glowland Limited (“Glowland”), an indirect 100%-owned subsidiary of PPB held via FFM Berhad :
a) VFM-Wilmar Flour Mills Company Limited, a 51%-subsidiary of Glowland; and
b) Meizan CLV Corporation Limited, a 50%-associate of Glowland.
PPB announced that the quarterly report for the 2nd quarter ended 30 June 2018 would be released on 29 August 2018.
Release of PPB’s quarterly report for the 2nd quarter ended 30 June 2018.
PPB Board declared the payment of an interim single tier dividend of 8 sen per share for financial year ending 31 December 2018 (“Interim Dividend”).
The Interim Dividend was paid on 4 October 2018 to shareholders appearing in the Record of Depositors at the close of business on 18 September 2018.
RHB Investment Bank Berhad (“RHB”), on behalf of PPB, announced that 237,099,057 Bonus Shares would be listed and quoted on the Main Market of Bursa Securities with effect from 9.00 a.m. on 27 July 2018.
RHB, on behalf of PPB, announced that the Bonus Issue had been completed following the listing and quotation of 237,099,057 Bonus Shares on the Main Market of Bursa Securities on 27 July 2018.
JULY 2018
SEPTEMBER 2018
AUGUST 2018
10
7
152929
2627
20
QUARTERLY REPORT • 30 SEPTEMBER 2018INVESTOR UPDATE
Announcements
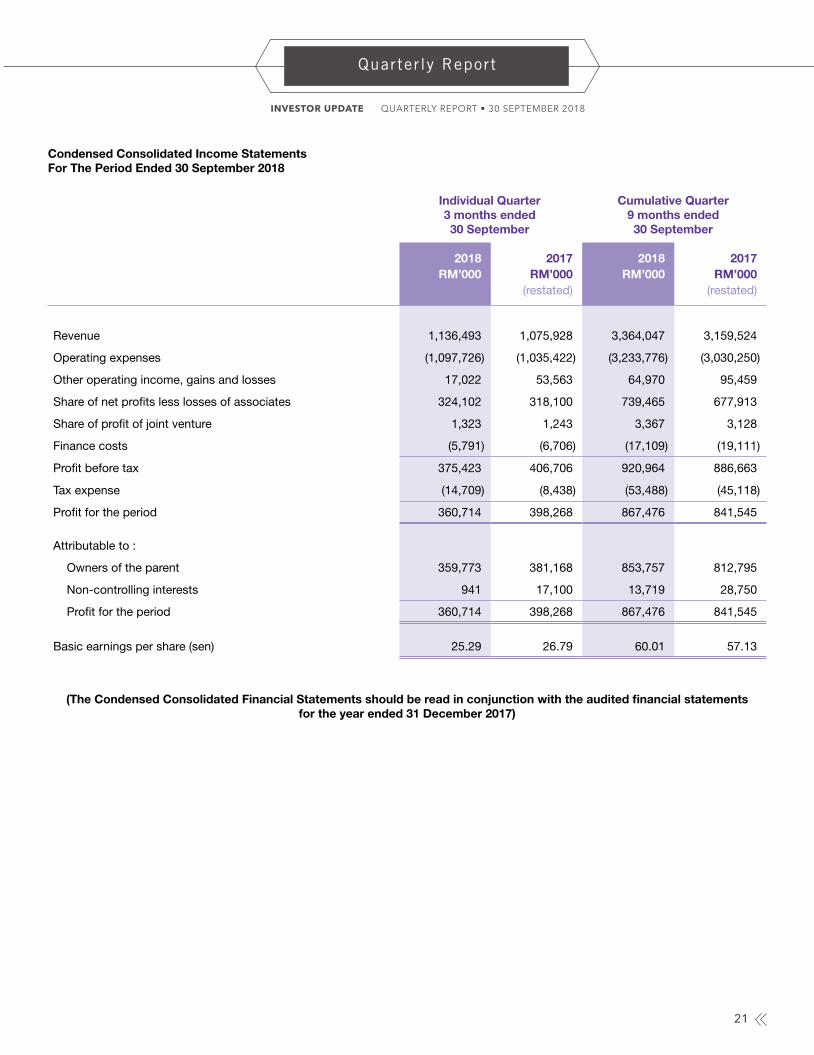
Individual Quarter3 months ended 30 September
Cumulative Quarter9 months ended 30 September
2018RM’000
2017RM’000
(restated)
2018RM’000
2017RM’000
(restated)
Revenue 1,136,493 1,075,928 3,364,047 3,159,524
Operating expenses (1,097,726) (1,035,422) (3,233,776) (3,030,250)
Other operating income, gains and losses 17,022 53,563 64,970 95,459
Share of net profits less losses of associates 324,102 318,100 739,465 677,913
Share of profit of joint venture 1,323 1,243 3,367 3,128
Finance costs (5,791) (6,706) (17,109) (19,111)
Profit before tax 375,423 406,706 920,964 886,663
Tax expense (14,709) (8,438) (53,488) (45,118)
Profit for the period 360,714 398,268 867,476 841,545
Attributable to :
Owners of the parent 359,773 381,168 853,757 812,795
Non-controlling interests 941 17,100 13,719 28,750
Profit for the period 360,714 398,268 867,476 841,545
Basic earnings per share (sen) 25.29 26.79 60.01 57.13
(The Condensed Consolidated Financial Statements should be read in conjunction with the audited financial statementsfor the year ended 31 December 2017)
Condensed Consolidated Income Statements For The Period Ended 30 September 2018
QUARTERLY REPORT • 30 SEPTEMBER 2018INVESTOR UPDATE
Quarterly Report
21
Individual Quarter3 months ended 30 September
Cumulative Quarter9 months ended 30 September
2018RM’000
2017RM’000
(restated)
2018RM’000
2017RM’000
(restated)
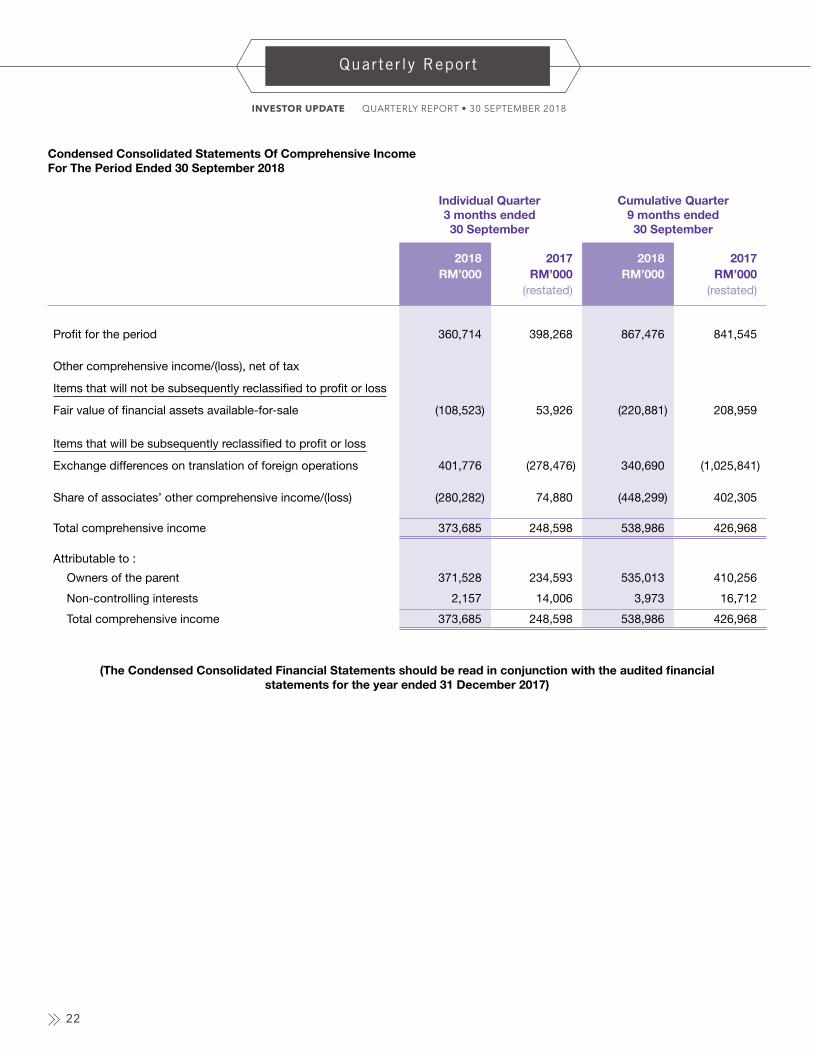
Profit for the period 360,714 398,268 867,476 841,545
Other comprehensive income/(loss), net of tax
Items that will not be subsequently reclassified to profit or loss
Fair value of financial assets available-for-sale (108,523) 53,926 (220,881) 208,959
Items that will be subsequently reclassified to profit or loss
Exchange differences on translation of foreign operations 401,776 (278,476) 340,690 (1,025,841)
Share of associates’ other comprehensive income/(loss) (280,282) 74,880 (448,299) 402,305
Total comprehensive income 373,685 248,598 538,986 426,968
Attributable to :
Owners of the parent 371,528 234,593 535,013 410,256
Non-controlling interests 2,157 14,006 3,973 16,712
Total comprehensive income 373,685 248,598 538,986 426,968
(The Condensed Consolidated Financial Statements should be read in conjunction with the audited financialstatements for the year ended 31 December 2017)
Condensed Consolidated Statements Of Comprehensive IncomeFor The Period Ended 30 September 2018
QUARTERLY REPORT • 30 SEPTEMBER 2018INVESTOR UPDATE
Quarterly Report
22
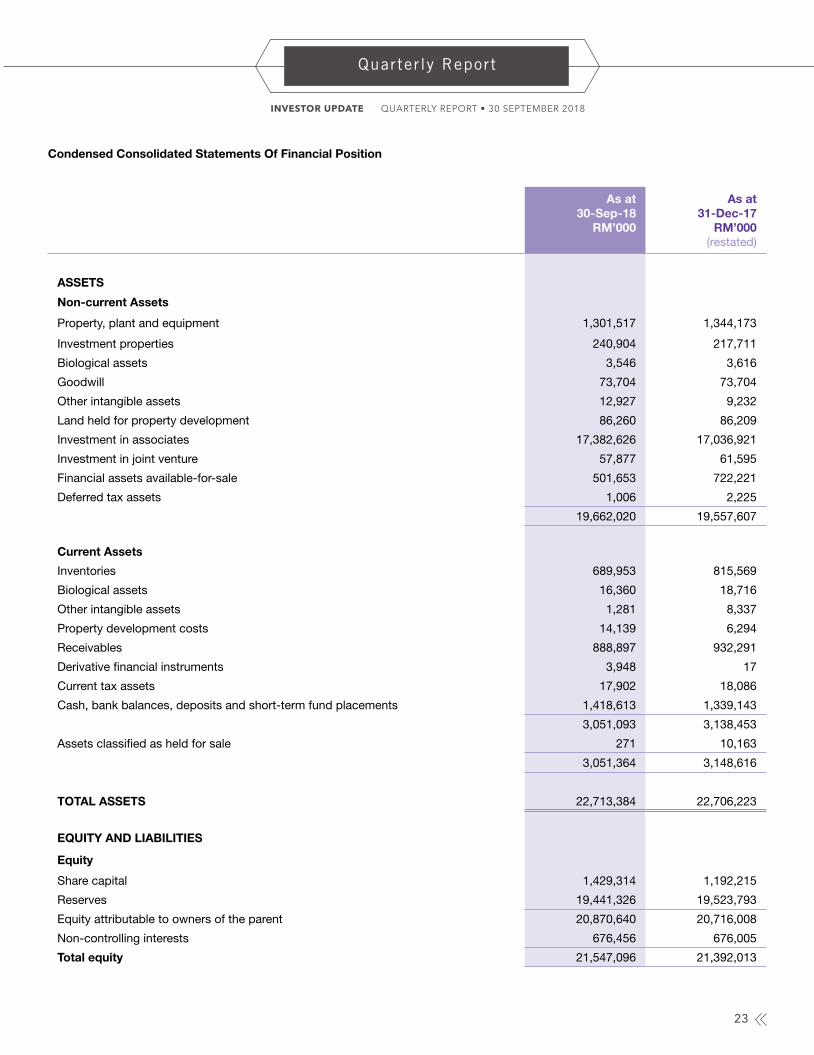
As at 30-Sep-18
RM’000
As at 31-Dec-17
RM’000(restated)
ASSETS
Non-current Assets
Property, plant and equipment 1,301,517 1,344,173
Investment properties 240,904 217,711
Biological assets 3,546 3,616
Goodwill 73,704 73,704
Other intangible assets 12,927 9,232
Land held for property development 86,260 86,209
Investment in associates 17,382,626 17,036,921
Investment in joint venture 57,877 61,595
Financial assets available-for-sale 501,653 722,221
Deferred tax assets 1,006 2,225
19,662,020 19,557,607
Current Assets
Inventories 689,953 815,569
Biological assets 16,360 18,716
Other intangible assets 1,281 8,337
Property development costs 14,139 6,294
Receivables 888,897 932,291
Derivative financial instruments 3,948 17
Current tax assets 17,902 18,086
Cash, bank balances, deposits and short-term fund placements 1,418,613 1,339,143
3,051,093 3,138,453
Assets classified as held for sale 271 10,163
3,051,364 3,148,616
TOTAL ASSETS 22,713,384 22,706,223
EQUITY AND LIABILITIES
Equity
Share capital 1,429,314 1,192,215
Reserves 19,441,326 19,523,793
Equity attributable to owners of the parent 20,870,640 20,716,008
Non-controlling interests 676,456 676,005
Total equity 21,547,096 21,392,013
Condensed Consolidated Statements Of Financial Position
QUARTERLY REPORT • 30 SEPTEMBER 2018INVESTOR UPDATE
Quarterly Report
23

As at 30-Sep-18
RM’000
As at 31-Dec-17
RM’000(restated)
Non-current Liabilities
Long-term borrowings 25,929 35,974
Deferred tax liabilities 95,565 91,871
121,494 127,845
Current Liabilities
Payables 549,670 433,687
Derivative financial instruments 8,333 337
Short-term borrowings 475,938 744,749
Current tax liabilities 10,683 6,107
1,044,624 1,184,880
Liabilities associated with assets classified as held for sale 170 1,485
1,044,794 1,186,365
Total liabilities 1,166,288 1,314,210
TOTAL EQUITY AND LIABILITIES 22,713,384 22,706,223
(The Condensed Consolidated Financial Statements should be read in conjunction with the audited financialstatements for the year ended 31 December 2017)
Condensed Consolidated Statements Of Financial Position (Cont’d)
QUARTERLY REPORT • 30 SEPTEMBER 2018INVESTOR UPDATE
Quarterly Report
24
Non-distributable Distributable
Sharecapital
RM’000
Sharepremium
RM’000
RevaluationreserveRM’000
Exchangetranslation
reserveRM’000
Fairvalue
reserveRM’000
HedgereserveRM’000
CapitalreserveRM’000
Retainedearnings
RM’000
Attributable toowners ofthe parent
RM’000
Non- controlling
interestsRM’000
Totalequity
RM’000
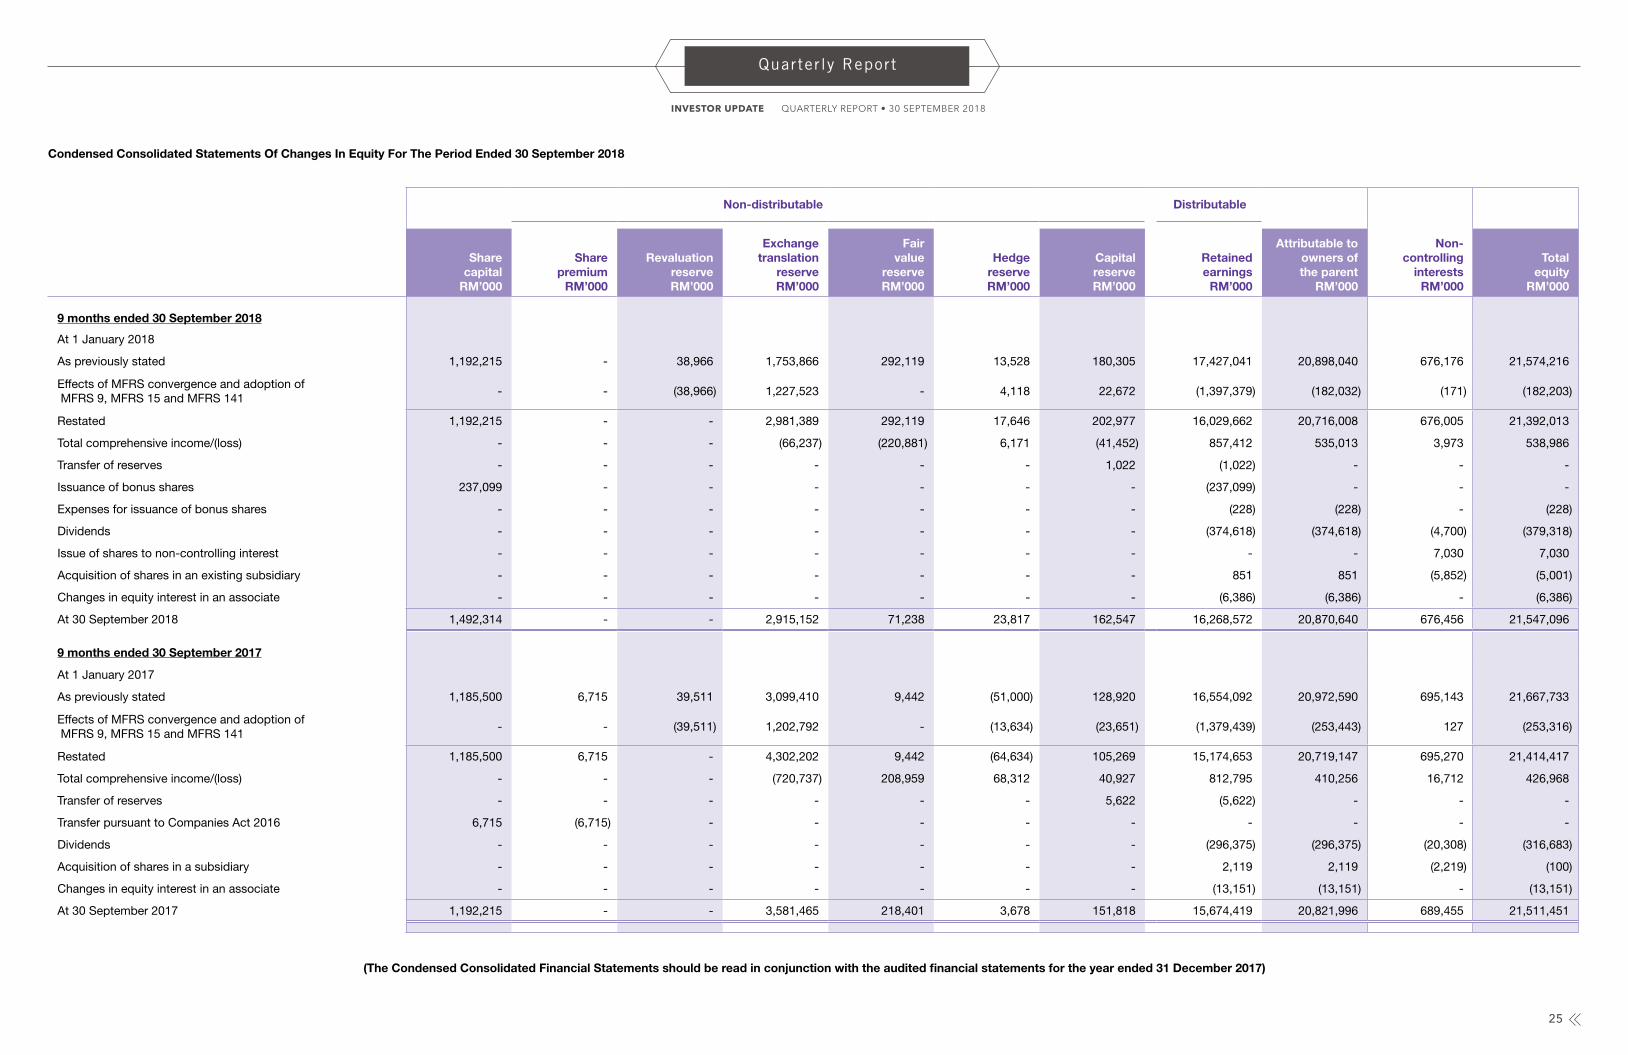
9 months ended 30 September 2018
At 1 January 2018
As previously stated 1,192,215 - 38,966 1,753,866 292,119 13,528 180,305 17,427,041 20,898,040 676,176 21,574,216
Effects of MFRS convergence and adoption of MFRS 9, MFRS 15 and MFRS 141
- - (38,966) 1,227,523 - 4,118 22,672 (1,397,379) (182,032) (171) (182,203)
Restated 1,192,215 - - 2,981,389 292,119 17,646 202,977 16,029,662 20,716,008 676,005 21,392,013
Total comprehensive income/(loss) - - - (66,237) (220,881) 6,171 (41,452) 857,412 535,013 3,973 538,986
Transfer of reserves - - - - - - 1,022 (1,022) - - -
Issuance of bonus shares 237,099 - - - - - - (237,099) - - -
Expenses for issuance of bonus shares - - - - - - - (228) (228) - (228)
Dividends - - - - - - - (374,618) (374,618) (4,700) (379,318)
Issue of shares to non-controlling interest - - - - - - - - - 7,030 7,030
Acquisition of shares in an existing subsidiary - - - - - - - 851 851 (5,852) (5,001)
Changes in equity interest in an associate - - - - - - - (6,386) (6,386) - (6,386)
At 30 September 2018 1,492,314 - - 2,915,152 71,238 23,817 162,547 16,268,572 20,870,640 676,456 21,547,096
9 months ended 30 September 2017
At 1 January 2017
As previously stated 1,185,500 6,715 39,511 3,099,410 9,442 (51,000) 128,920 16,554,092 20,972,590 695,143 21,667,733
Effects of MFRS convergence and adoption of MFRS 9, MFRS 15 and MFRS 141
- - (39,511) 1,202,792 - (13,634) (23,651) (1,379,439) (253,443) 127 (253,316)
Restated 1,185,500 6,715 - 4,302,202 9,442 (64,634) 105,269 15,174,653 20,719,147 695,270 21,414,417
Total comprehensive income/(loss) - - - (720,737) 208,959 68,312 40,927 812,795 410,256 16,712 426,968
Transfer of reserves - - - - - - 5,622 (5,622) - - -
Transfer pursuant to Companies Act 2016 6,715 (6,715) - - - - - - - - -
Dividends - - - - - - - (296,375) (296,375) (20,308) (316,683)
Acquisition of shares in a subsidiary - - - - - - - 2,119 2,119 (2,219) (100)
Changes in equity interest in an associate - - - - - - - (13,151) (13,151) - (13,151)
At 30 September 2017 1,192,215 - - 3,581,465 218,401 3,678 151,818 15,674,419 20,821,996 689,455 21,511,451
Condensed Consolidated Statements Of Changes In Equity For The Period Ended 30 September 2018
(The Condensed Consolidated Financial Statements should be read in conjunction with the audited financial statements for the year ended 31 December 2017)
25
QUARTERLY REPORT • 30 SEPTEMBER 2018INVESTOR UPDATE
Quarterly Report
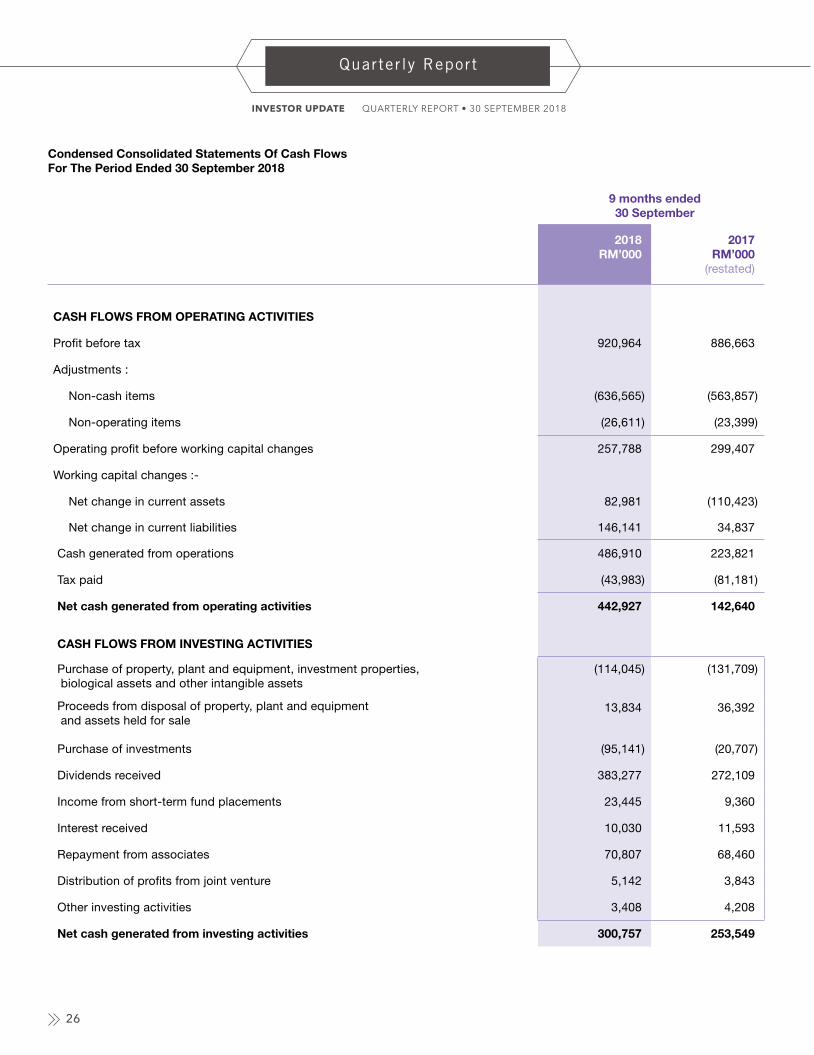
9 months ended 30 September
2018RM’000
2017RM’000
(restated)
CASH FLOWS FROM OPERATING ACTIVITIES
Profit before tax 920,964 886,663
Adjustments :
Non-cash items (636,565) (563,857)
Non-operating items (26,611) (23,399)
Operating profit before working capital changes 257,788 299,407
Working capital changes :-
Net change in current assets 82,981 (110,423)
Net change in current liabilities 146,141 34,837
Cash generated from operations 486,910 223,821
Tax paid (43,983) (81,181)
Net cash generated from operating activities 442,927 142,640
CASH FLOWS FROM INVESTING ACTIVITIES
Purchase of property, plant and equipment, investment properties, biological assets and other intangible assets
(114,045) (131,709)
Proceeds from disposal of property, plant and equipment and assets held for sale
13,834 36,392
Purchase of investments (95,141) (20,707)
Dividends received 383,277 272,109
Income from short-term fund placements 23,445 9,360
Interest received 10,030 11,593
Repayment from associates 70,807 68,460
Distribution of profits from joint venture 5,142 3,843
Other investing activities 3,408 4,208
Net cash generated from investing activities 300,757 253,549
Condensed Consolidated Statements Of Cash Flows For The Period Ended 30 September 2018
QUARTERLY REPORT • 30 SEPTEMBER 2018INVESTOR UPDATE
Quarterly Report
26
9 months ended 30 September
2018RM’000
2017RM’000
(restated)
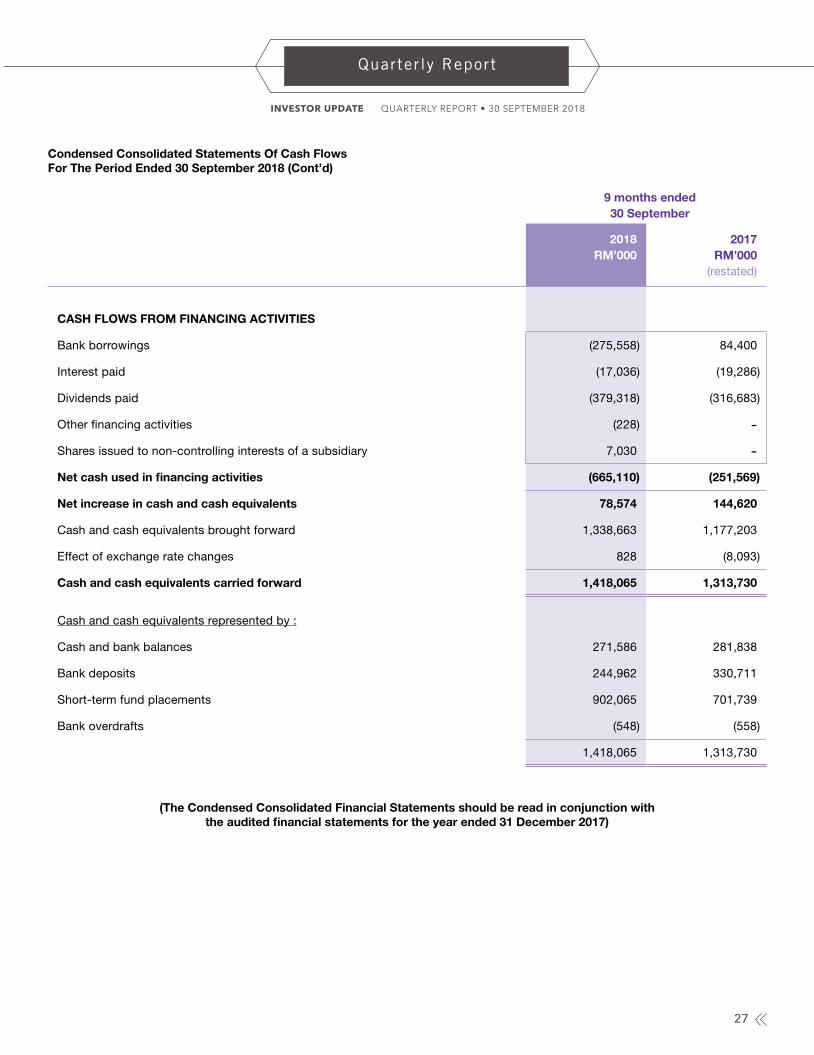
CASH FLOWS FROM FINANCING ACTIVITIES
Bank borrowings (275,558) 84,400
Interest paid (17,036) (19,286)
Dividends paid (379,318) (316,683)
Other financing activities (228) -
Shares issued to non-controlling interests of a subsidiary 7,030 -
Net cash used in financing activities (665,110) (251,569)
Net increase in cash and cash equivalents 78,574 144,620
Cash and cash equivalents brought forward 1,338,663 1,177,203
Effect of exchange rate changes 828 (8,093)
Cash and cash equivalents carried forward 1,418,065 1,313,730
Cash and cash equivalents represented by :
Cash and bank balances 271,586 281,838
Bank deposits 244,962 330,711
Short-term fund placements 902,065 701,739
Bank overdrafts (548) (558)
1,418,065 1,313,730
(The Condensed Consolidated Financial Statements should be read in conjunction with the audited financial statements for the year ended 31 December 2017)
Condensed Consolidated Statements Of Cash Flows For The Period Ended 30 September 2018 (Cont’d)
QUARTERLY REPORT • 30 SEPTEMBER 2018INVESTOR UPDATE
Quarterly Report
27
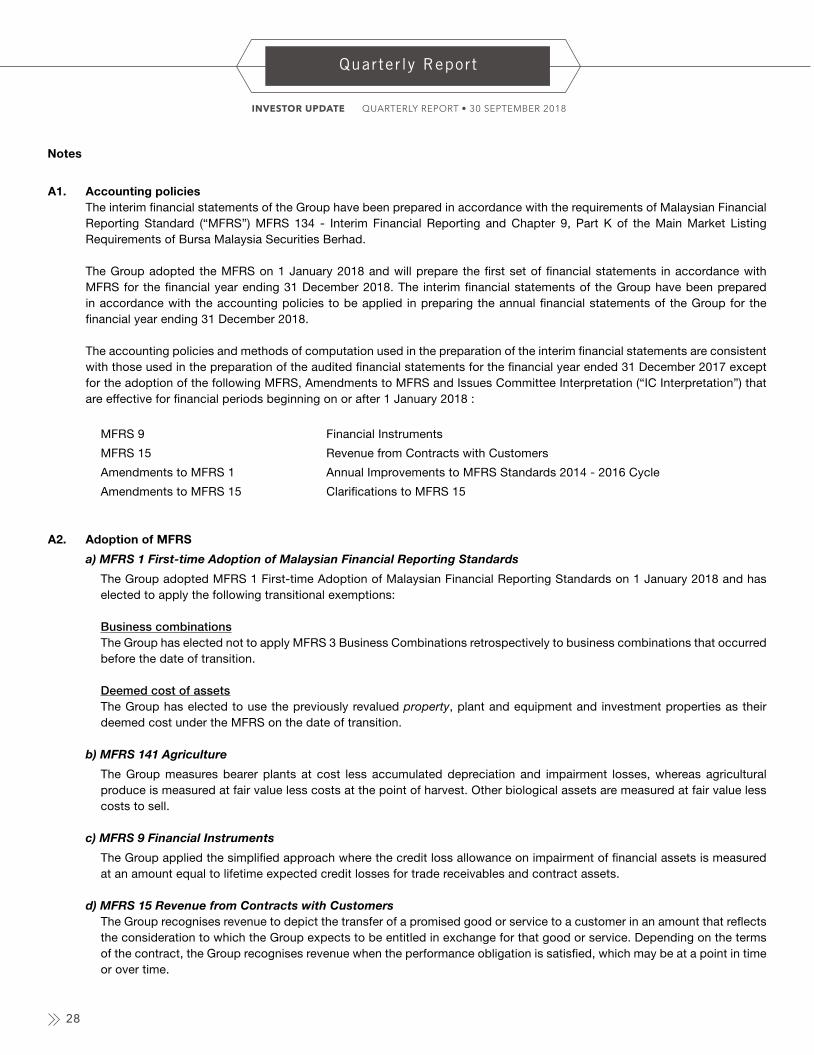
A1. Accounting policies The interim financial statements of the Group have been prepared in accordance with the requirements of Malaysian Financial
Reporting Standard (“MFRS”) MFRS 134 - Interim Financial Reporting and Chapter 9, Part K of the Main Market Listing Requirements of Bursa Malaysia Securities Berhad.
The Group adopted the MFRS on 1 January 2018 and will prepare the first set of financial statements in accordance with MFRS for the financial year ending 31 December 2018. The interim financial statements of the Group have been prepared in accordance with the accounting policies to be applied in preparing the annual financial statements of the Group for the financial year ending 31 December 2018.
The accounting policies and methods of computation used in the preparation of the interim financial statements are consistent with those used in the preparation of the audited financial statements for the financial year ended 31 December 2017 except for the adoption of the following MFRS, Amendments to MFRS and Issues Committee Interpretation (“IC Interpretation”) that are effective for financial periods beginning on or after 1 January 2018 :
MFRS 9 Financial Instruments
MFRS 15 Revenue from Contracts with Customers
Amendments to MFRS 1 Annual Improvements to MFRS Standards 2014 - 2016 Cycle
Amendments to MFRS 15 Clarifications to MFRS 15
A2. Adoption of MFRS
a) MFRS 1 First-time Adoption of Malaysian Financial Reporting Standards
The Group adopted MFRS 1 First-time Adoption of Malaysian Financial Reporting Standards on 1 January 2018 and has elected to apply the following transitional exemptions:
Business combinations The Group has elected not to apply MFRS 3 Business Combinations retrospectively to business combinations that occurred
before the date of transition.
Deemed cost of assets The Group has elected to use the previously revalued property, plant and equipment and investment properties as their
deemed cost under the MFRS on the date of transition.
b) MFRS 141 Agriculture
The Group measures bearer plants at cost less accumulated depreciation and impairment losses, whereas agricultural produce is measured at fair value less costs at the point of harvest. Other biological assets are measured at fair value less costs to sell.
c) MFRS 9 Financial Instruments
The Group applied the simplified approach where the credit loss allowance on impairment of financial assets is measured at an amount equal to lifetime expected credit losses for trade receivables and contract assets.
d) MFRS 15 Revenue from Contracts with Customers The Group recognises revenue to depict the transfer of a promised good or service to a customer in an amount that reflects
the consideration to which the Group expects to be entitled in exchange for that good or service. Depending on the terms of the contract, the Group recognises revenue when the performance obligation is satisfied, which may be at a point in time or over time.
Notes
QUARTERLY REPORT • 30 SEPTEMBER 2018INVESTOR UPDATE
Quarterly Report
28
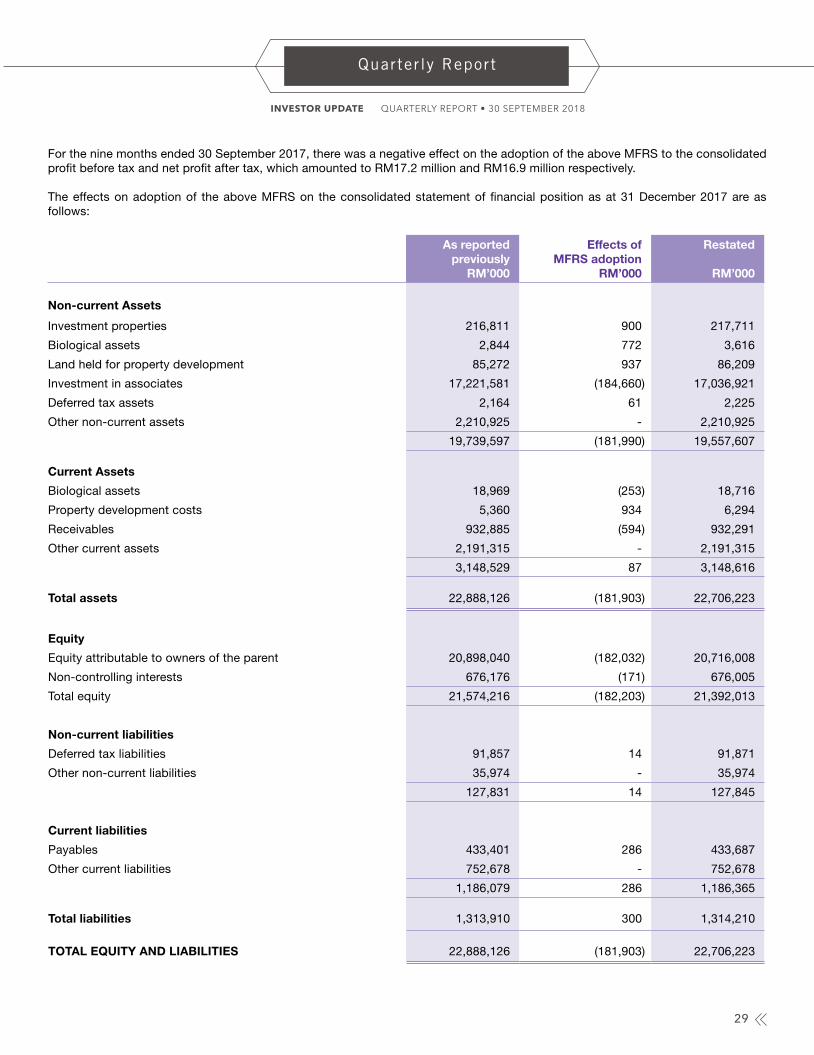
For the nine months ended 30 September 2017, there was a negative effect on the adoption of the above MFRS to the consolidated profit before tax and net profit after tax, which amounted to RM17.2 million and RM16.9 million respectively.
The effects on adoption of the above MFRS on the consolidated statement of financial position as at 31 December 2017 are as follows:
As reportedpreviously
RM’000
Effects ofMFRS adoption
RM’000
Restated
RM’000
Non-current Assets
Investment properties 216,811 900 217,711
Biological assets 2,844 772 3,616
Land held for property development 85,272 937 86,209
Investment in associates 17,221,581 (184,660) 17,036,921
Deferred tax assets 2,164 61 2,225
Other non-current assets 2,210,925 - 2,210,925
19,739,597 (181,990) 19,557,607
Current Assets
Biological assets 18,969 (253) 18,716
Property development costs 5,360 934 6,294
Receivables 932,885 (594) 932,291
Other current assets 2,191,315 - 2,191,315
3,148,529 87 3,148,616
Total assets 22,888,126 (181,903) 22,706,223
Equity
Equity attributable to owners of the parent 20,898,040 (182,032) 20,716,008
Non-controlling interests 676,176 (171) 676,005
Total equity 21,574,216 (182,203) 21,392,013
Non-current liabilities
Deferred tax liabilities 91,857 14 91,871
Other non-current liabilities 35,974 - 35,974
127,831 14 127,845
Current liabilities
Payables 433,401 286 433,687
Other current liabilities 752,678 - 752,678
1,186,079 286 1,186,365
Total liabilities 1,313,910 300 1,314,210
TOTAL EQUITY AND LIABILITIES 22,888,126 (181,903) 22,706,223
QUARTERLY REPORT • 30 SEPTEMBER 2018INVESTOR UPDATE
Quarterly Report
29
A3. Seasonality or cyclicality of interim operations The Group’s operations are not materially affected by any seasonal or cyclical factors. A4. Unusual items affecting assets, liabilities, equity, net income or cash flow There were no items of an unusual nature, size or incidence that affected the assets, liabilities, equity, net income and cash
flows of the Group during the current financial period end under review.
A5. Nature and amount of changes in estimates There were no changes in estimates of amounts reported in the previous financial year which have a material effect in the
current interim period. A6. Issuances, cancellations, repurchases, resale and repayments of debt and equity securities There were no issuances or repayment of debt and equity securities, share buy-backs, share cancellations, shares held as
treasury shares and resale of treasury shares for the current financial period to-date.
A7. Dividends paid During the first nine months ended 30 September 2018, a final dividend of 22 sen per share in respect of financial year ended
31 December 2017 was paid on 31 May 2018.
QUARTERLY REPORT • 30 SEPTEMBER 2018INVESTOR UPDATE
Quarterly Report
30
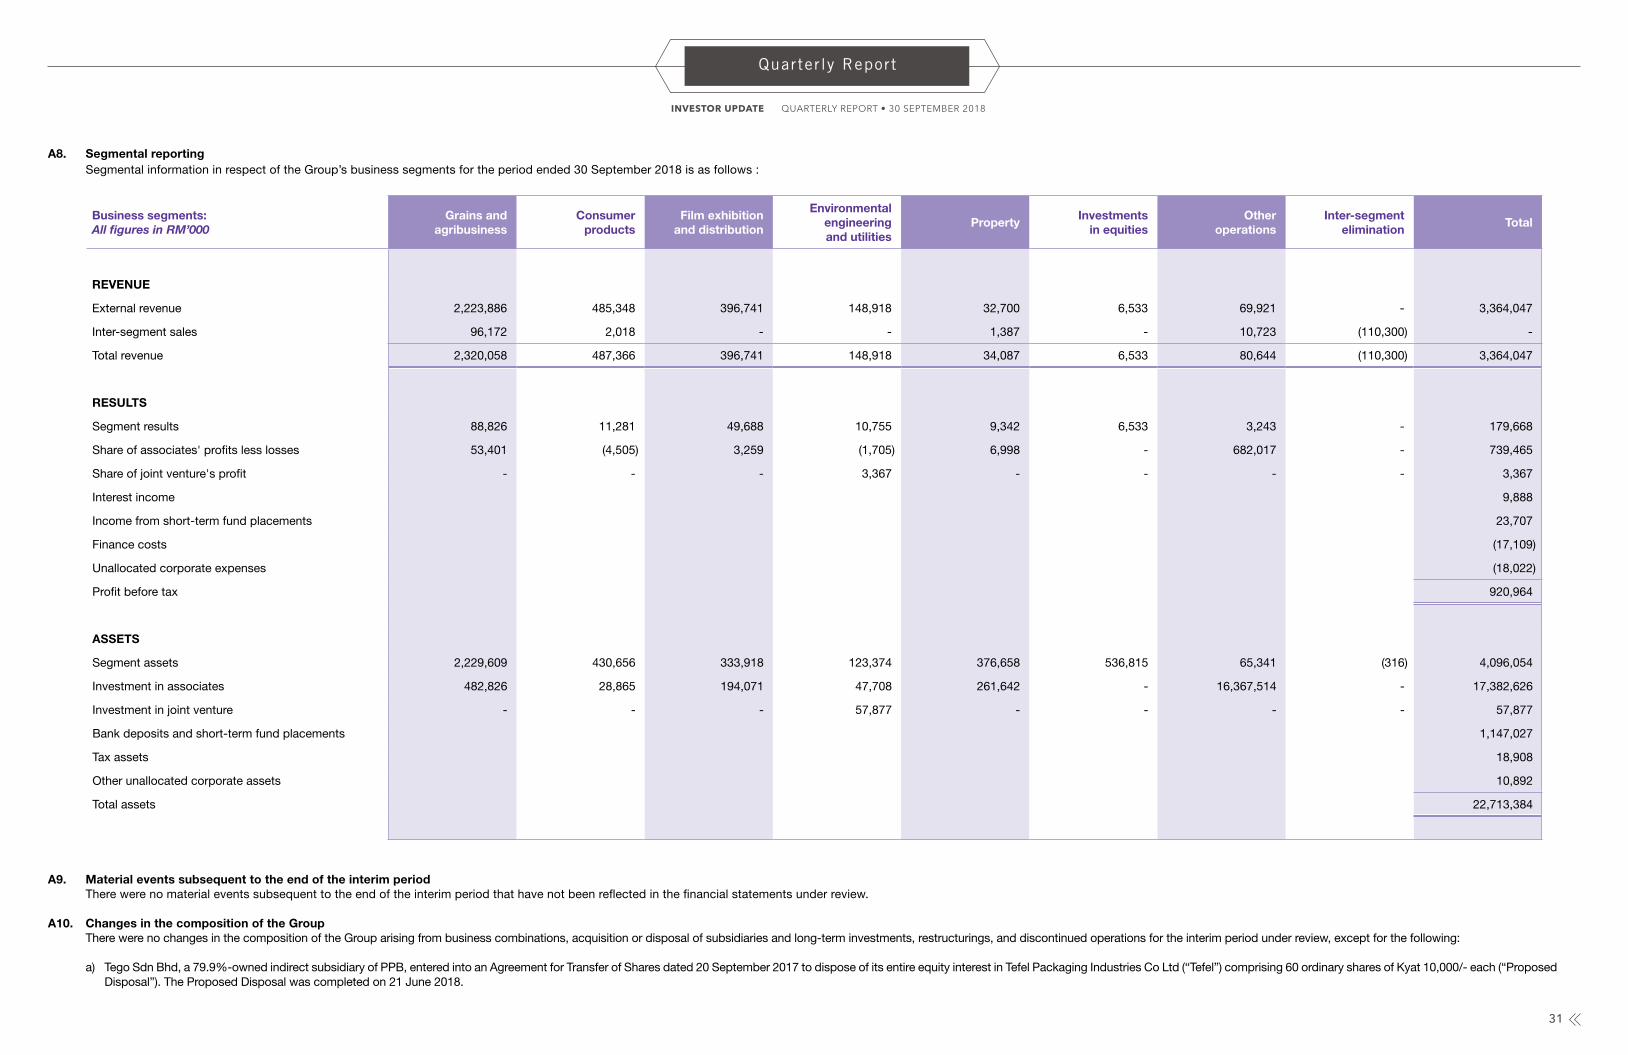
A9. Material events subsequent to the end of the interim period There were no material events subsequent to the end of the interim period that have not been reflected in the financial statements under review.
A10. Changes in the composition of the Group There were no changes in the composition of the Group arising from business combinations, acquisition or disposal of subsidiaries and long-term investments, restructurings, and discontinued operations for the interim period under review, except for the following:
a) Tego Sdn Bhd, a 79.9%-owned indirect subsidiary of PPB, entered into an Agreement for Transfer of Shares dated 20 September 2017 to dispose of its entire equity interest in Tefel Packaging Industries Co Ltd (“Tefel”) comprising 60 ordinary shares of Kyat 10,000/- each (“Proposed Disposal”). The Proposed Disposal was completed on 21 June 2018.
A8. Segmental reporting Segmental information in respect of the Group’s business segments for the period ended 30 September 2018 is as follows :
Business segments:All figures in RM’000
Grains and agribusiness
Consumerproducts
Film exhibitionand distribution
Environmentalengineeringand utilities
PropertyInvestments
in equitiesOther
operationsInter-segment
eliminationTotal
REVENUE
External revenue 2,223,886 485,348 396,741 148,918 32,700 6,533 69,921 - 3,364,047
Inter-segment sales 96,172 2,018 - - 1,387 - 10,723 (110,300) -
Total revenue 2,320,058 487,366 396,741 148,918 34,087 6,533 80,644 (110,300) 3,364,047
RESULTS
Segment results 88,826 11,281 49,688 10,755 9,342 6,533 3,243 - 179,668
Share of associates' profits less losses 53,401 (4,505) 3,259 (1,705) 6,998 - 682,017 - 739,465
Share of joint venture's profit - - - 3,367 - - - - 3,367
Interest income 9,888
Income from short-term fund placements 23,707
Finance costs (17,109)
Unallocated corporate expenses (18,022)
Profit before tax 920,964
ASSETS
Segment assets 2,229,609 430,656 333,918 123,374 376,658 536,815 65,341 (316) 4,096,054
Investment in associates 482,826 28,865 194,071 47,708 261,642 - 16,367,514 - 17,382,626
Investment in joint venture - - - 57,877 - - - - 57,877
Bank deposits and short-term fund placements 1,147,027
Tax assets 18,908
Other unallocated corporate assets 10,892
Total assets 22,713,384
31
QUARTERLY REPORT • 30 SEPTEMBER 2018INVESTOR UPDATE
Quarterly Report

b) Lamlewa Feedmill Sdn Bhd, a dormant 80%-owned indirect subsidiary of PPB which commenced a members’ voluntary winding up on 4 August 2014 pursuant to Section 254(1)(b) of the Companies Act (“CA”) 1965, was dissolved on 28 June 2018, and has accordingly ceased to be an indirect subsidiary of PPB.
c) Affluence Trading Sdn Bhd, a wholly-owned subsidiary of PPB which commenced a members’ voluntary winding up on 30 July 2015 pursuant to Section 254(1)(b) of the CA 1965, was dissolved on 26 September 2018, and has accordingly ceased to be a subsidiary of PPB.
d) Minsec Properties Berhad, a wholly-owned subsidiary of PPB which commenced a members’ voluntary winding up on 11 September 2017 pursuant to Section 439(1)(b) of the CA 2016, was dissolved on 7 September 2018, and has accordingly ceased to be a subsidiary of PPB.
A11. Changes in contingent liabilities or contingent assets There were no changes in contingent assets and contingent liabilities since the end of the last annual reporting period.
A12. Capital commitments Authorised capital commitments not provided for in the interim financial report as at 30 September 2018 were as follows:
RM’000 RM’000
Property, plant and equipment, investment properties and biological assets
- contracted 28,398
- not contracted 378,155
406,553
Other capital commitments
- contracted 246,386
652,939
A13. Significant related party transactions Significant related party transactions during the period ended 30 September 2018 were as follows:
RM’000 RM’000
Transactions with associates
- Interest income 2,706
- Sales of goods 1,140
- License fees income 1,636
- Purchase of goods 24,991
Transactions with a subsidiary of the ultimate holding company
- Sale of goods 8,815
Transactions with subsidiaries of associates
- Purchase of goods 146,981
- Sale of goods 49,765
- Rental income 2,330 - Security and other service fee expenses 1,985 - Marketing fee income 1,997 - Supervision fee income 1,575- Charter hire of vessels 38,953
QUARTERLY REPORT • 30 SEPTEMBER 2018INVESTOR UPDATE
Quarterly Report
32
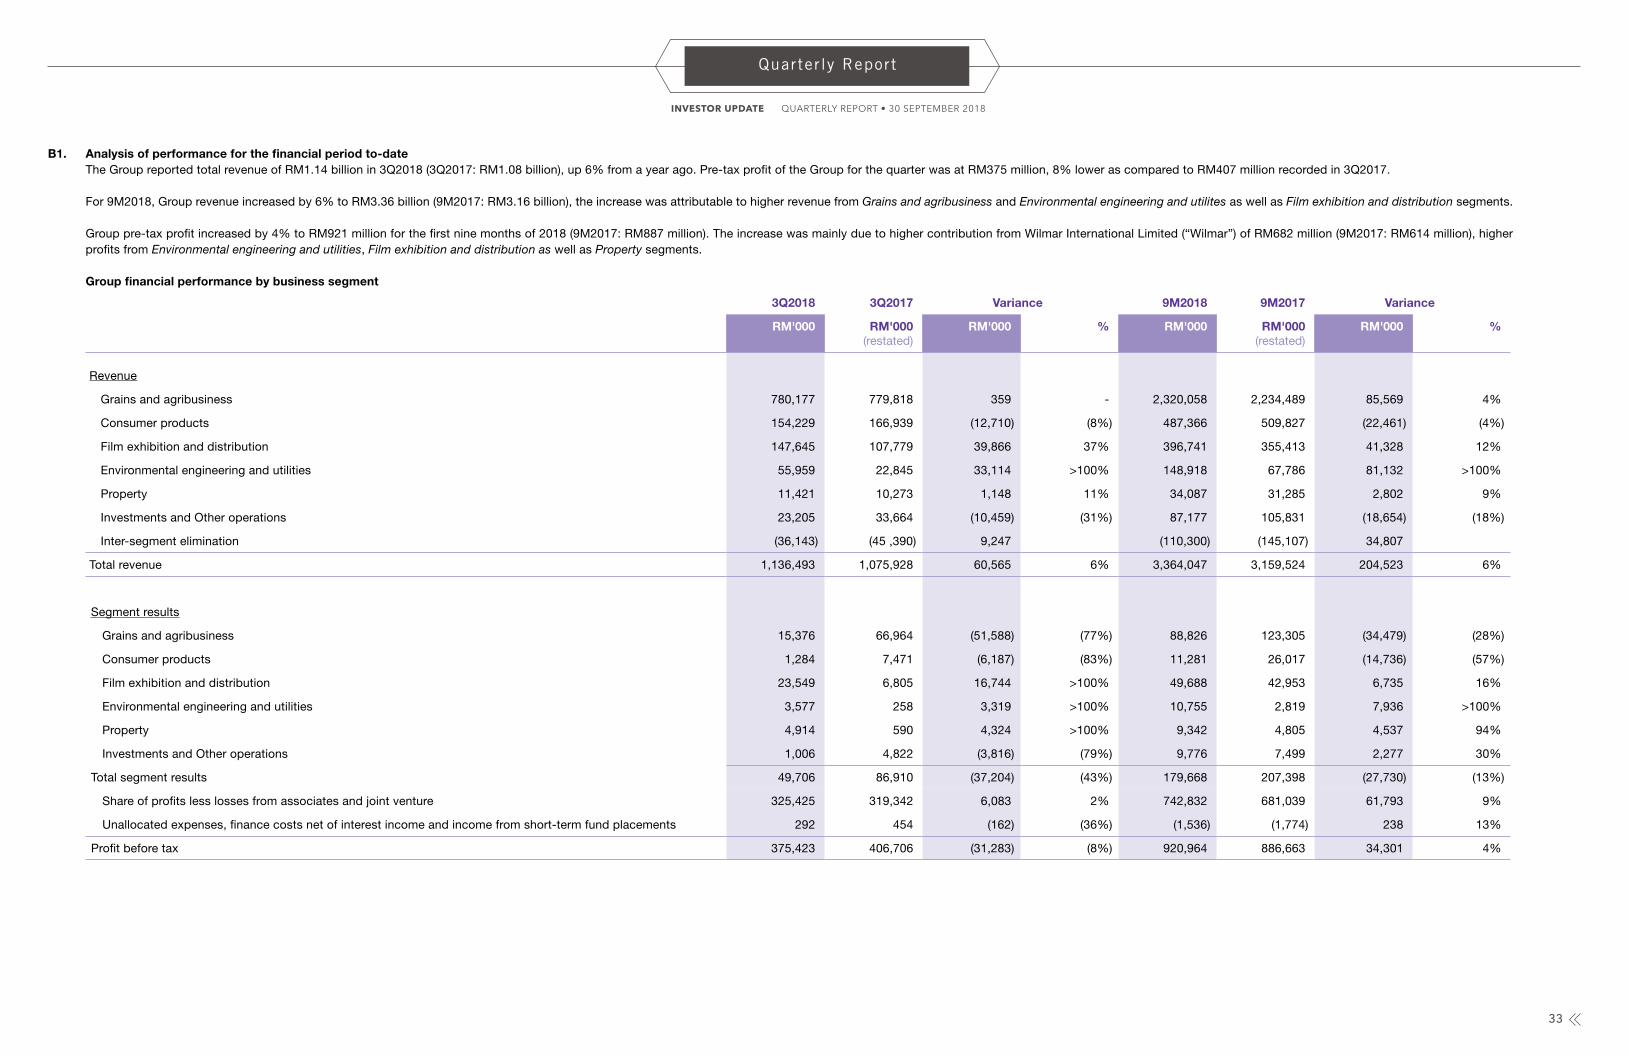
B1. Analysis of performance for the financial period to-date The Group reported total revenue of RM1.14 billion in 3Q2018 (3Q2017: RM1.08 billion), up 6% from a year ago. Pre-tax profit of the Group for the quarter was at RM375 million, 8% lower as compared to RM407 million recorded in 3Q2017.
For 9M2018, Group revenue increased by 6% to RM3.36 billion (9M2017: RM3.16 billion), the increase was attributable to higher revenue from Grains and agribusiness and Environmental engineering and utilites as well as Film exhibition and distribution segments. Group pre-tax profit increased by 4% to RM921 million for the first nine months of 2018 (9M2017: RM887 million). The increase was mainly due to higher contribution from Wilmar International Limited (“Wilmar”) of RM682 million (9M2017: RM614 million), higher
profits from Environmental engineering and utilities, Film exhibition and distribution as well as Property segments.
Group financial performance by business segment
3Q2018 3Q2017 Variance 9M2018 9M2017 Variance
RM'000 RM'000 (restated)
RM'000 % RM'000 RM'000 (restated)
RM'000 %
Revenue
Grains and agribusiness 780,177 779,818 359 - 2,320,058 2,234,489 85,569 4%
Consumer products 154,229 166,939 (12,710) (8%) 487,366 509,827 (22,461) (4%)
Film exhibition and distribution 147,645 107,779 39,866 37% 396,741 355,413 41,328 12%
Environmental engineering and utilities 55,959 22,845 33,114 >100% 148,918 67,786 81,132 >100%
Property 11,421 10,273 1,148 11% 34,087 31,285 2,802 9%
Investments and Other operations 23,205 33,664 (10,459) (31%) 87,177 105,831 (18,654) (18%)
Inter-segment elimination (36,143) (45 ,390) 9,247 (110,300) (145,107) 34,807
Total revenue 1,136,493 1,075,928 60,565 6% 3,364,047 3,159,524 204,523 6%
Segment results
Grains and agribusiness 15,376 66,964 (51,588) (77%) 88,826 123,305 (34,479) (28%)
Consumer products 1,284 7,471 (6,187) (83%) 11,281 26,017 (14,736) (57%)
Film exhibition and distribution 23,549 6,805 16,744 >100% 49,688 42,953 6,735 16%
Environmental engineering and utilities 3,577 258 3,319 >100% 10,755 2,819 7,936 >100%
Property 4,914 590 4,324 >100% 9,342 4,805 4,537 94%
Investments and Other operations 1,006 4,822 (3,816) (79%) 9,776 7,499 2,277 30%
Total segment results 49,706 86,910 (37,204) (43%) 179,668 207,398 (27,730) (13%)
Share of profits less losses from associates and joint venture 325,425 319,342 6,083 2% 742,832 681,039 61,793 9%
Unallocated expenses, finance costs net of interest income and income from short-term fund placements 292 454 (162) (36%) (1,536) (1,774) 238 13%
Profit before tax 375,423 406,706 (31,283) (8%) 920,964 886,663 34,301 4%
33
QUARTERLY REPORT • 30 SEPTEMBER 2018INVESTOR UPDATE
Quarterly Report
Grains and agribusinessSegment revenue remained relatively unchanged at RM780 million in 3Q2018, as higher sales of flour was offset by lower sales of animal feed. However, segment profit was lower at RM15 million (3Q2017: RM67 million), mainly due to higher raw material costs from the flour and feed divisions.
Segment revenue for 9M2018 increased by 4% to RM2.3 billion (9M2017: RM2.2 billion) on the back of higher sales volume from all flour mills. However, segment profit was lower by 28% at RM89 million (9M2017: RM123 million), mainly due to higher raw material costs.
Consumer productsSegment revenue decreased by 8% to RM154 million in 3Q2018 (3Q2017: RM167 million), due mainly to lower sales of in-house products. Segment profit was lower at RM1.3 million (3Q2017: RM7.5 million) mainly attributable to lower sale volumes and lower profit margin.
For 9M2018, segment revenue was lower by 4% at RM487 million (9M2017: RM510 million), mainly due to lower sales of in-house and agency products. Segment profit was lower at RM11 million for 9M2018 (9M2017: RM26 million) mainly due to the absence of a one-time gain on sale of land and building of RM8.0 million recorded in 1Q2017 and weaker performance by the bakery division.
Film exhibition and distributionSegment revenue increased by 37% to RM148 million in 3Q2018 (3Q2017: RM108 million) mainly due to higher contribution from cinemas opened in 2017 and strong performance of local titles. Segment profit increased to RM24 million in 3Q2018 (3Q2017: RM6.8 million) primarily due to strong contribution from film exhibition.
For 9M2018, segment revenue increased by 12% to RM397 million (9M2017: RM355 million), and segment profit increased by 16% to RM50 million (9M2017: RM43 million). This was mainly attributable to contribution from cinemas opened in 2017, higher concession income and screen advertising income.
Environmental engineering and utilitiesSegment revenue for 3Q2018 and 9M2018 increased to RM56 million (3Q2017: RM23 million) and RM149 million (9M2017: RM68 million) respectively, mainly attributable to progressive revenue recognised from the water treatment and sewage projects secured in 2017.
Consequently, segment profit was higher at RM3.6 million in 3Q2018 (3Q2017: RM0.3 million) and RM11 million for 9M2018 (9M2017: RM2.8 million) respectively.
PropertySegment revenue was higher at RM11 million in 3Q2018 (3Q2017: RM10 million) and increased by 9% to RM34 million for 9M2018 (9M2017: RM31 million), mainly attributable to higher project management fee income. Segment profit was higher at RM4.9 million in 3Q2018 (3Q2017: RM0.6 million) and RM9.3 million for 9M2018 (9M2017: RM4.8 million), the increase was attributable to higher project management fee income, higher rental income with the mall extension and a one-time gain on sale of vacant land of RM1 million.
Investments and Other operationsThe combined segment revenue decreased by 31% in 3Q2018 to RM23 million (3Q2017: RM34 million) and 18% to RM87 million for 9M2018 (9M2017: RM106 million) respectively, this was mainly due to the de-consolidation of Tefel as the company was disposed of in June 2018 and lower dividend income from investments.
In 3Q2018, the combined segment reported a profit of RM1 million (3Q2017: RM4.8 million) due mainly to lower investment income. For 9M2018, the combined segment profit increased to RM9.8 million (9M2017: RM7.5 million) mainly from de-consolidation of results from loss-making Tefel.
Share of associates and joint venture’s profits less lossesThe Group’s share of associates and joint venture profits increased marginally to RM325 million in 3Q2018 (3Q2017: RM319 million), mainly attributable to an increase in contribution from Wilmar amounting to RM306 million in 3Q2018 (3Q2017: RM291 million).
Profit contribution from Wilmar was at RM682 million for 9M2018 (9M2017: RM614 million), 11% higher from a year ago.
QUARTERLY REPORT • 30 SEPTEMBER 2018INVESTOR UPDATE
Quarterly Report
34
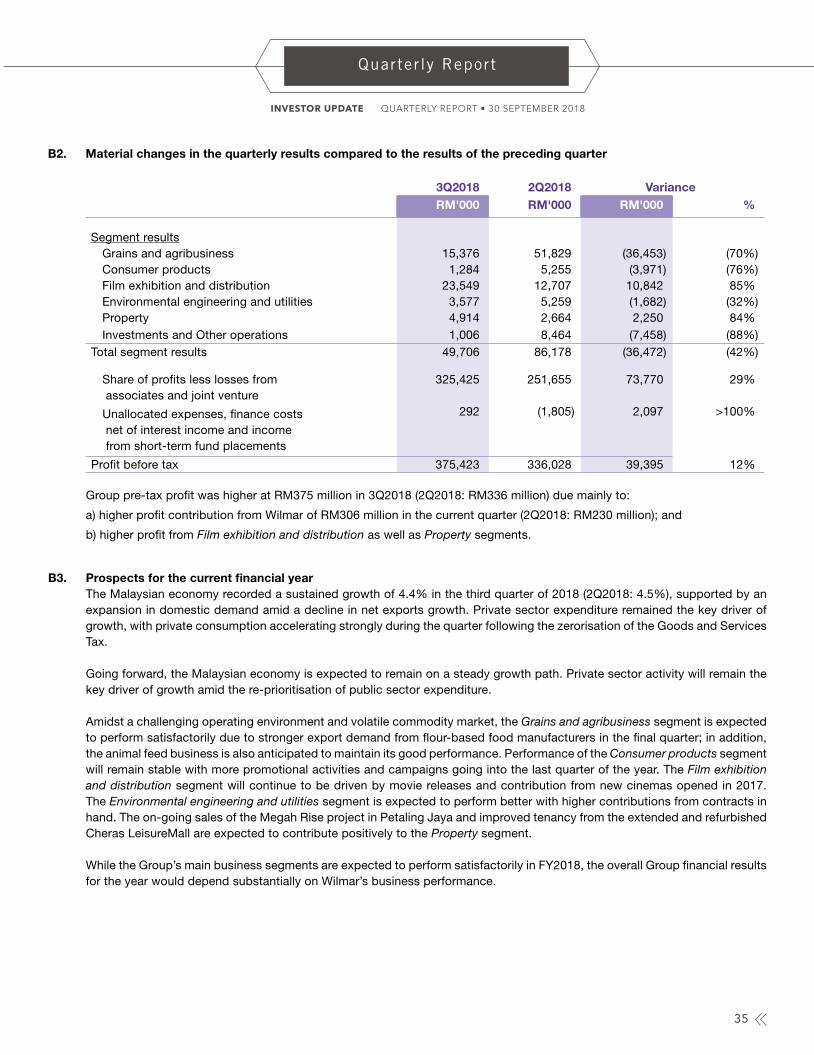
B2. Material changes in the quarterly results compared to the results of the preceding quarter
3Q2018 2Q2018 VarianceRM'000 RM'000 RM'000 %
Segment resultsGrains and agribusiness 15,376 51,829 (36,453) (70%)Consumer products 1,284 5,255 (3,971) (76%)Film exhibition and distribution 23,549 12,707 10,842 85%Environmental engineering and utilities 3,577 5,259 (1,682) (32%)Property 4,914 2,664 2,250 84%Investments and Other operations 1,006 8,464 (7,458) (88%)
Total segment results 49,706 86,178 (36,472) (42%)
Share of profits less losses from associates and joint venture
325,425 251,655 73,770 29%
Unallocated expenses, finance costs net of interest income and income from short-term fund placements
292 (1,805) 2,097 >100%
Profit before tax 375,423 336,028 39,395 12%
Group pre-tax profit was higher at RM375 million in 3Q2018 (2Q2018: RM336 million) due mainly to:
a) higher profit contribution from Wilmar of RM306 million in the current quarter (2Q2018: RM230 million); and
b) higher profit from Film exhibition and distribution as well as Property segments.
B3. Prospects for the current financial year The Malaysian economy recorded a sustained growth of 4.4% in the third quarter of 2018 (2Q2018: 4.5%), supported by an
expansion in domestic demand amid a decline in net exports growth. Private sector expenditure remained the key driver of growth, with private consumption accelerating strongly during the quarter following the zerorisation of the Goods and Services Tax.
Going forward, the Malaysian economy is expected to remain on a steady growth path. Private sector activity will remain the key driver of growth amid the re-prioritisation of public sector expenditure.
Amidst a challenging operating environment and volatile commodity market, the Grains and agribusiness segment is expected to perform satisfactorily due to stronger export demand from flour-based food manufacturers in the final quarter; in addition, the animal feed business is also anticipated to maintain its good performance. Performance of the Consumer products segment will remain stable with more promotional activities and campaigns going into the last quarter of the year. The Film exhibition and distribution segment will continue to be driven by movie releases and contribution from new cinemas opened in 2017. The Environmental engineering and utilities segment is expected to perform better with higher contributions from contracts in hand. The on-going sales of the Megah Rise project in Petaling Jaya and improved tenancy from the extended and refurbished Cheras LeisureMall are expected to contribute positively to the Property segment.
While the Group’s main business segments are expected to perform satisfactorily in FY2018, the overall Group financial results for the year would depend substantially on Wilmar’s business performance.
QUARTERLY REPORT • 30 SEPTEMBER 2018INVESTOR UPDATE
Quarterly Report
35
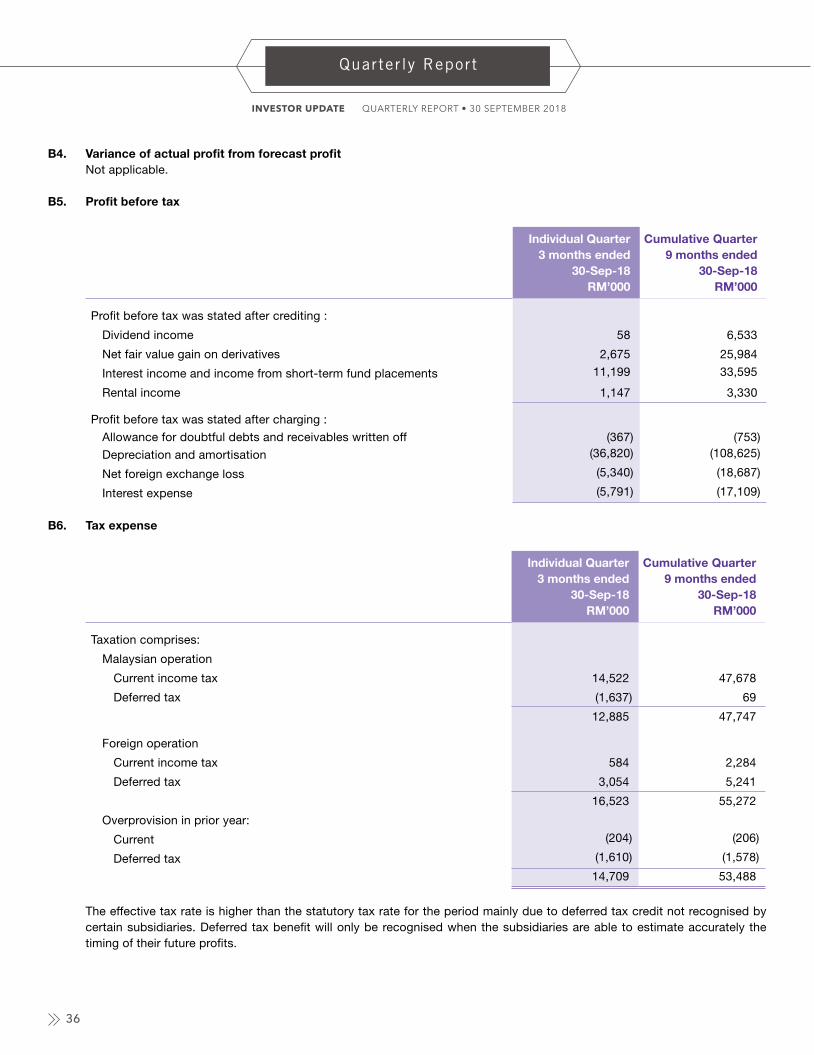
B4. Variance of actual profit from forecast profit Not applicable.
B5. Profit before tax
Individual Quarter 3 months ended
30-Sep-18RM’000
Cumulative Quarter 9 months ended
30-Sep-18RM’000
Profit before tax was stated after crediting :
Dividend income 58 6,533
Net fair value gain on derivatives 2,675 25,984
Interest income and income from short-term fund placements 11,199 33,595
Rental income 1,147 3,330
Profit before tax was stated after charging :
Allowance for doubtful debts and receivables written off (367) (753)
Depreciation and amortisation (36,820) (108,625)
Net foreign exchange loss (5,340) (18,687)
Interest expense (5,791) (17,109)
B6. Tax expense
Individual Quarter 3 months ended
30-Sep-18RM’000
Cumulative Quarter 9 months ended
30-Sep-18RM’000
Taxation comprises:
Malaysian operation
Current income tax 14,522 47,678
Deferred tax (1,637) 69
12,885 47,747
Foreign operation
Current income tax 584 2,284
Deferred tax 3,054 5,241
16,523 55,272
Overprovision in prior year:
Current (204) (206)
Deferred tax (1,610) (1,578)
14,709 53,488
The effective tax rate is higher than the statutory tax rate for the period mainly due to deferred tax credit not recognised by certain subsidiaries. Deferred tax benefit will only be recognised when the subsidiaries are able to estimate accurately the timing of their future profits.
QUARTERLY REPORT • 30 SEPTEMBER 2018INVESTOR UPDATE
Quarterly Report
36
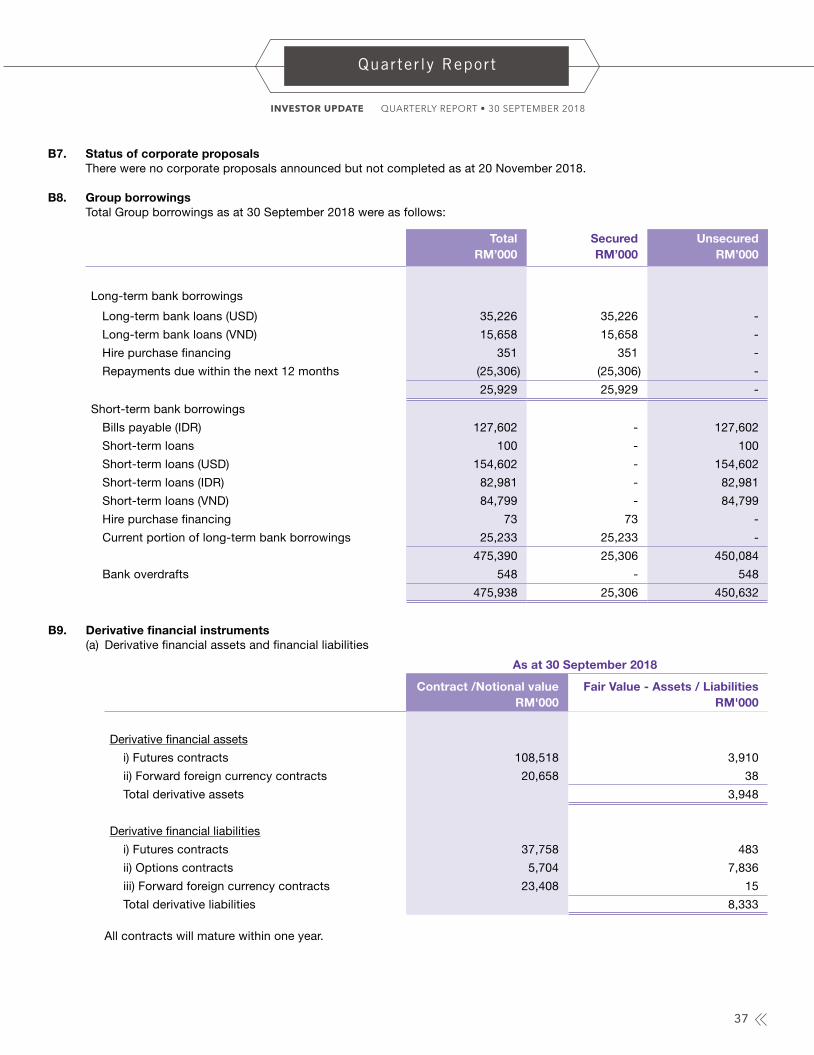
B7. Status of corporate proposals There were no corporate proposals announced but not completed as at 20 November 2018.
B8. Group borrowings Total Group borrowings as at 30 September 2018 were as follows:
TotalRM’000
SecuredRM’000
UnsecuredRM’000
Long-term bank borrowings
Long-term bank loans (USD) 35,226 35,226 -
Long-term bank loans (VND) 15,658 15,658 -
Hire purchase financing 351 351 -
Repayments due within the next 12 months (25,306) (25,306) -
25,929 25,929 -
Short-term bank borrowings
Bills payable (IDR) 127,602 - 127,602
Short-term loans 100 - 100
Short-term loans (USD) 154,602 - 154,602
Short-term loans (IDR) 82,981 - 82,981
Short-term loans (VND) 84,799 - 84,799
Hire purchase financing 73 73 -
Current portion of long-term bank borrowings 25,233 25,233 -
475,390 25,306 450,084
Bank overdrafts 548 - 548
475,938 25,306 450,632
B9. Derivative financial instruments(a) Derivative financial assets and financial liabilities
As at 30 September 2018
Contract /Notional valueRM'000
Fair Value - Assets / LiabilitiesRM'000
Derivative financial assets
i) Futures contracts 108,518 3,910
ii) Forward foreign currency contracts 20,658 38
Total derivative assets 3,948
Derivative financial liabilities
i) Futures contracts 37,758 483
ii) Options contracts 5,704 7,836
iii) Forward foreign currency contracts 23,408 15
Total derivative liabilities 8,333
All contracts will mature within one year.
QUARTERLY REPORT • 30 SEPTEMBER 2018INVESTOR UPDATE
Quarterly Report
37
Futures and options contractsThe Group is exposed to market risk mainly from fluctuations in the prices of agricultural commodities, namely wheat and corn which are the key raw materials used in the Group’s Grains and agribusiness segment. Commodity futures and options contracts are entered into with the objective to mitigate and hedge against the volatility of commodities prices. It is the policy of the Group to hedge only in contracts with corresponding underlying commodities that are used in its grains and agribusiness activities.
Forward foreign currency contractsThe Group enters into foreign currency forwards contracts to minimise its exposure to foreign currency risks as a result of transactions denominated in currencies other than its functional currency. Under the Group’s policy, foreign currency hedging is only considered for committed transactions and shall not exceed 100% of the committed amount.
There have been no significant changes since the end of the previous financial year ended 31 December 2017 in respect of the following:
(i) the credit risk, market risk and liquidity risk associated with the derivatives;
(ii) the cash requirements of the derivatives;
(iii) the policies in place for mitigating or controlling the risks associated with the derivatives; and
(iv) the related accounting policies.
(b) Fair value changes of financial liabilities
The derivative financial instruments are recognised at fair value on contract dates and subsequently re-measured at fair value through profit or loss. The resulting gain or loss from the re-measurement is recognised in the income statement. Fair value changes are dependent on the market prices of derivatives as at liquidation date and end of reporting period.
The fair value loss on options for 3Q2018 and 9M2018 amounted to RM3.8 million and RM2.4 million respectively.
The fair value gain on future contracts for 3Q2018 amounted to RM2.2 million, and a loss of RM0.5 million was recorded for 9M2018.
B10. Material litigationThere was no material litigation as at 20 November 2018.
B11. Dividends An interim dividend of 8 sen per share in respect of financial year ending 31 December 2018 was paid on 4 October 2018.
The Directors do not recommend the payment of any dividend for the third quarter under review.
QUARTERLY REPORT • 30 SEPTEMBER 2018INVESTOR UPDATE
Quarterly Report
38
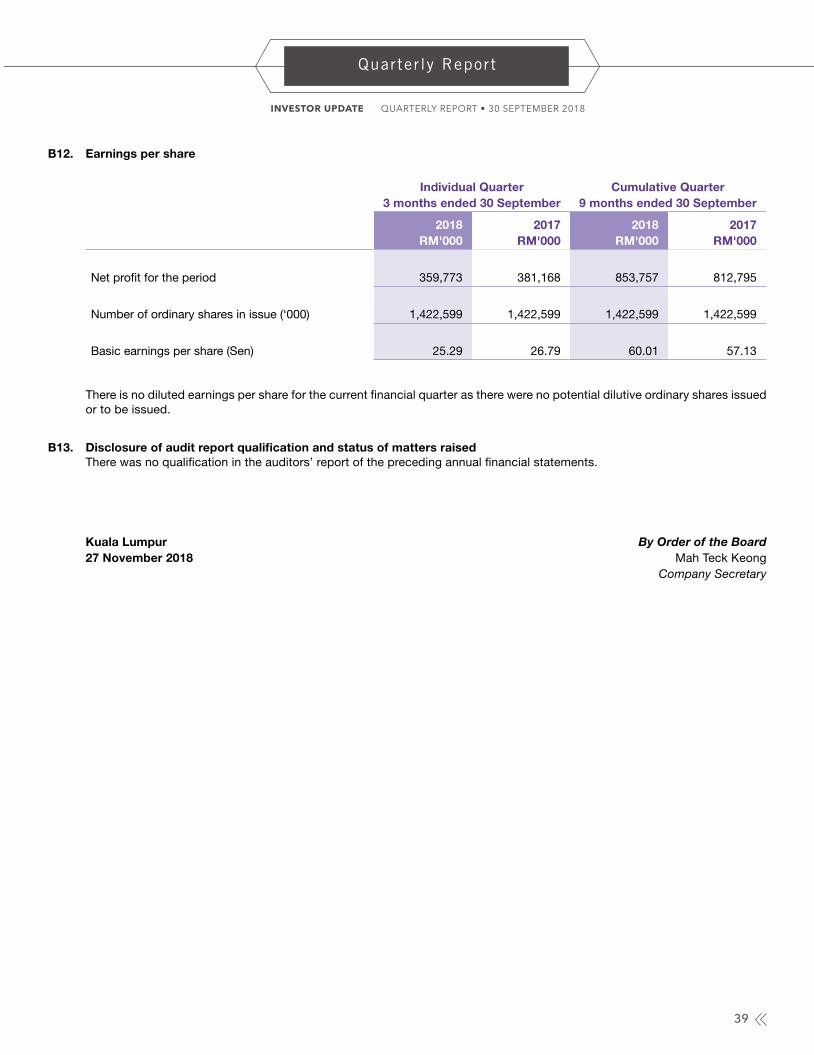
B12. Earnings per share
Individual Quarter3 months ended 30 September
Cumulative Quarter9 months ended 30 September
2018RM'000
2017RM'000
2018RM'000
2017RM'000
Net profit for the period 359,773 381,168 853,757 812,795
Number of ordinary shares in issue (‘000) 1,422,599 1,422,599 1,422,599 1,422,599
Basic earnings per share (Sen) 25.29 26.79 60.01 57.13
There is no diluted earnings per share for the current financial quarter as there were no potential dilutive ordinary shares issued or to be issued.
B13. Disclosure of audit report qualification and status of matters raised There was no qualification in the auditors’ report of the preceding annual financial statements.
Kuala Lumpur By Order of the Board27 November 2018 Mah Teck Keong Company Secretary
QUARTERLY REPORT • 30 SEPTEMBER 2018INVESTOR UPDATE
Quarterly Report
39
Registered Office:
PPB GROUP BERHAD 8167-W
12th Floor, UBN Tower, 10, Jalan P. Ramlee,50250 Kuala Lumpur, Malaysia
T 603 2726 0088
F 603 2726 0099 (General) / 603 2726 0198 (Corporate Affairs)