Embed Size (px)
Citation preview

The Consortium for Policy Research in Education includes:
University of PennsylvaniaTeachers College Columbia University
Harvard UniversityStanford University
University of MichiganUniversity of Wisconsin-Madison
Northwestern University
From Testing to Teaching: The Use of Interim Assessments
in Classroom Instruction
By
Margaret E. GoertzLeslie Nabors Oláh
Matthew Riggan

Consortium for Policy Research in Education
The Consortium for Policy Research in Education (CPRE) unites seven of the nation’s leading research institutions to
improve elementary and secondary education through research on policy, finance, school reform, and school gover-
nance. Members of CPRE are the University of Pennsylvania, Teachers College Columbia University, Harvard
University, Stanford University, the University of Michigan, the University of Wisconsin-Madison, and Northwestern
University.
CPRE is currently examining how alternative approaches to education reform--such as new accountability policies,
teacher compensation, whole-school reform approaches, and efforts to contract out instructional services--address
issues of coherence, incentives and capacity. The results of this research are shared with policymakers, educators,
practitioners, and other interested individuals and organizations in order to promote improvements in policy design and
implementation.
Want to learn more about new and upcoming CPRE publications, project research findings, or where CPRE
researchers are presenting? Please visit our Web site at http://www.cpre.org or sign up for our e-newsletter,
In-Sites, at [email protected].
CPRE Research Report Series
Research Reports are issued by CPRE to facilitate the exchange of ideas among policymakers, practitioners, and
researchers who share an interest in education policy. The views expressed in the reports are those of individual
authors, and are not necessarily shared by CPRE, or its institutional partners.
For more information, visit our website www.cpre.org, or call us at (215) 573-0700.

Consortium for Policy Research in Education
University of Pennsylvania | Teachers College | Harvard University | Stanford University | University of Michigan | University of Wisconsin-
Madison | Northwestern University
From Testing to Teaching: The Use of Interim Assessments in Classroom Instruction
By
Margaret E. Goertz Leslie Nabors Oláh
Matthew Riggan
CPRE Research Report # RR-65
Our research was funded by a National Science Foundation grant (#REC-0529485) to the Consortium for Policy Research in Education (CPRE).
Opinions expressed in this report are those of the authors and do not necessarily reflect the views of the National Science Foundation, the study districts, CPRE, or
its institutional members.
December 2009
Copyright 2010 by Margaret E. Goertz, Leslie Nabors Oláh, and Matthew Riggan
Table of Contents About the Authors i
Acknowledgements ii
Chapter 1: Introduction and Study Framework 1
Chapter 2: Methodology 36
Chapter 3: The District and School Role in Interim Assessments 60
Chapter 4: Learning to Learn From Interim Assessment Data: How Teachers Analyze and Respond to Results
106
Chapter 5: Interim Assessments in the Context of Teachers’ Formative Assessment Practice
152
Chapter 6: Doing More with Less? The Relationship Between Teacher Capacity and Formative Assessment Practice
177
Chapter 7: Summary and Policy Implications 224

About the Authors Margaret E. Goertz is co-director of the Consortium for Policy Research in Education (CPRE) and a professor of education policy in the Graduate School of Education at the University of Pennsylvania (Penn GSE). She specializes in the study of state and federal education finance and governance policy. She has conducted extensive research on state education reform policies, state teacher policies, and state and federal programs for special-needs students. Her current research activities look at the impact of standards-based reform in elementary schools and high schools, the implementation of the No Child Left Behind Act of 2001, and state and local assessment and accountability policies. She also studies how school districts and schools allocate resources in support of standards-based reform. Leslie Nabors Oláh is a senior researcher at CPRE and research assistant professor at Penn GSE. She specializes in the relationship between cognition and instruction, including the role that teacher assessment practice plays in this relationship. Her current research activities center around formative assessment in elementary mathematics. She recently served as co-principal investigator on an NSF-funded study of teachers’ use of mathematics interim assessments in Philadelphia. She was trained as a developmental psychologist at the Harvard University Graduate School of Education, where she also received an Ed.M. in Methodology in Developmental Research. She has published and presented work on infant vocabulary development and on K-1 mathematical development, and is a co-developer of the Penn Research-Informed Mathematics Education (PRIME) initiative, a professional development program designed to support urban teachers’ instruction and assessment in mathematics. Matthew Riggan is a researcher at CPRE and a lecturer at Penn GSE. He specializes in school leadership, organizational learning and change, and qualitative research methods. His current research activities include evaluations of two initiatives: 1) the School District of Philadelphia’s Twenty First Century Skills Project, an initiative to improve postsecondary transitions for high school students; and 2) an evaluation of the Benwood Initiative, an effort to scale-up promising reforms in low-performing schools in Hamilton County, TN. He is also involved in two studies focused on how teachers generate, interpret, and act on information about student understanding of mathematical concepts.
i

ii
Acknowledgements
We are grateful to the many people who made this study possible. Our work
would not have been possible without the outstanding cooperation of the teachers and
school and district leaders in our two study districts. They welcomed us into their
districts, schools and classrooms, patiently answered our many questions, and provided
invaluable insights and information. We are also indebted to the members of our
research team. Nancy Lawrence oversaw data collection in several schools, contributed
to the design of data collection and analysis instruments, tirelessly coded interviews, and
co-authored Chapters 3 and 4 of this report. Joy Anderson, Andrea Oettinger, Claire
Passantino, and John Weathers assisted in data collection and analysis. Heather Hill
and Ed Silver helped us contextualize our study within the field of mathematics
education and assisted with instrument design and content analysis of the Philadelphia
and Cumberland interim assessments. Susan Fuhrman helped conceptualize the study
questions and design and co-authored the research proposal. Joan Herman and Scott
Marion provided thoughtful and thorough reviews of an earlier draft of this work. Finally,
Kelly Stanton skillfully edited this report.
Our research was funded by a National Science Foundation grant (#REC-
0529485) to the Consortium for Policy Research in Education (CPRE). Opinions
expressed in this report are those of the authors and do not necessarily reflect the views
of the National Science Foundation, the study districts, CPRE, or its institutional
members.

CHAPTER 1
Introduction and Study Framework
Purpose of the Study
The past ten years have witnessed an explosion in the use of interim
assessments by school districts across the country. A primary reason for this rapid
growth is the assumption that interim assessments can inform and improve instructional
practice and thereby contribute to increased student achievement. Testing companies,
states, and districts have become invested in selling or creating interim assessments
and data management systems designed to help teachers, principals, and district
leaders make sense of student data, identify areas of strengths and weaknesses,
identify instructional strategies for targeted students, and much more. Districts are
keeping their interim tests even under pressure to cut budgets (Sawchuk, 2009). The
U.S. Department of Education is using its Race to the Top program to encourage school
districts to develop formative or interim assessments as part of comprehensive state
assessment systems.
Much of the rhetoric around interim assessments paints a rosy picture, often with
the ultimate claim that such measures will lead to increased student achievement. Much
of the belief in the potential of interim assessments to improve student learning comes
from the growing body of research on formative assessment. However, the majority of
this research has not focused on interim assessments themselves, but rather practices
that are embedded within classroom instruction. Very few studies exist on how interim
assessments are actually used, by individual teachers in classrooms, by principals, and
by districts. Furthermore, we know little about how teachers and other educators use
the results from such assessments, the conditions that support their ability to use these
1

Chapter 1: Introduction and Study Framework
data to improve instruction, or the interaction of interim assessments with other
classroom assessment practices. Our study begins to fill that vacuum.
The purpose of this exploratory study is to examine the use of interim
assessments and the policy supports that promote use to improve instruction, focusing
on elementary school mathematics. We use the term “interim assessments” to refer to
assessments that a) evaluate student knowledge and skills, typically within a limited time
frame; and b) the results of which can be easily aggregated and analyzed across
classrooms, schools, or even districts (Perie, Marion, & Gong, 2009).
Drawing on in-depth case studies of nine elementary schools located in two
school districts, this study addresses four questions:
1. What policy supports at the school and district levels enhance the use of interim
assessments to change instruction? How does instructional support, the nature
of professional development, the sophistication of local data systems, and the
school- and teacher-level incentives for improved instruction affect teachers’ use
of interim assessment data?
2. How do elementary school teachers, individually and collectively, learn from
interim assessment results in mathematics and apply that knowledge to
instructional decisions about content, pedagogy, and working with individual
students?
3. In what ways are interim assessments situated within the wider context of
teachers’ formative assessment practices and tools?
4. What is the relationship among teacher capacity, analysis of assessment
information, and teaching practice?
2

Chapter 1: Introduction and Study Framework
Study Framework
The framework for this study focuses on teachers’ use of interim assessment
data in a cycle of instructional improvement (See Figure 1.1); that is, how teachers
gather or access evidence about student learning, analyze and interpret that evidence,
use evidence to plan instruction, and carry out improved instruction. Many factors
influence how teachers access, manage, interpret, and act on data, as well as the types
of data available to them. In this study, we are particularly interested in how district and
school policies and practices support educators’ views of and approaches to interim and
formative assessment, encourage productive use of these assessments with various
capacity-building approaches, and ultimately support changes in instruction. At the
district level, we focus on the accountability context, instructional guidance, and the
culture of data use. At the school level, this study attends to instructional support,
capacity for data use, school leadership, and school-level culture and routines.
This section summarizes the literature that informed the development of our
conceptual framework, data collection, and data analysis.
3

Chapter 1: Introduction and Study Framework
Figure 1.1. Study Framework
*Marshall S. Smith, Hewlett Foundation, 2004
Gather evidence about standard achievement and
student learning
Use evidence to improve instruction (differentiate, etc. )
Carry out improved instruction
School-level culture and routines
Instructional support
School Context
Capacity for data use
School leadership
District Context
Instructional Guidance Professional development
Curriculum Goals
Assessment use Data systems
Culture of data use Norms about assessment
Accountability State
District School
Cycle of
Improvement*
Interpret evidence
Teacher Capacity
4
Chapter 1: Introduction and Study Framework
Cycle of instructional improvement. Cycles of instructional improvement have
their roots in quality improvement models outside of education. Perhaps the best known
of these are the Deming, or Plan-Do-Study-Act cycle that forms the basis for Total
Quality Management, and define-measure-analyze-improve-control (DMAIC)
methodology central to the Six Sigma process (DeFeo & Barnard, 2005). Both cycles
draw heavily on the early work of W. Edwards Deming (1986) and Joseph Juran (1986).
Later developments in the field of organizational theory highlighted the importance of
“loops” of learning, with single-loop learning referring to the process by which
organizations detect and correct error, and double-loop learning referring to the ability to
question or modify organizational policies or norms (Argyris & Schön, 1978). Such
theories were widely adopted in the private sector in the 1980s and 90s, as businesses
struggled to balance the demands of growth, speed, and flexibility (Senge, 1990). In
social science research, cycles of improvement were described in the pragmatic
philosophies of John Dewey (1946) and Kurt Lewin (1946), who argued that social
change was the product of iterative stages of analysis, intervention, and study. Both
believed that the purpose of theory was the improvement of objective social conditions,
which could be confirmed or disconfirmed through the continued collection and analysis
of data (Greenwood & Levin, 1998). This belief laid the foundation for action research,
which has in turn influenced the field of practitioner research and inquiry in education.
Cycles of instructional improvement are essentially models of recursive decision
making. Whether at the state, district, school, or classroom level, the basic logic of
these cycles is that professionals are engaged in ongoing decision-making that affects
their performance. Improved performance relies upon access to good information and
the capacity to analyze and act on it (Supovitz, 2006). These continuous improvement
processes—often referred to as inquiry cycles—have been championed by states,
districts, and external reform organizations. The Northwest Regional Education
5
Chapter 1: Introduction and Study Framework
Laboratory (2001) breaks the cycle into a sequence of four processes: understanding,
planning, implementing, and reflecting. The Technology Alliance, a state-level reform
organization in Washington, posits a six-step cycle: establishing desired outcomes,
defining questions, collecting and organizing data, making meaning of data, taking
action, and evaluating the actions taken (Technology Alliance, n.d.). In its knowledge-
building cycle for in-service teachers, the New Zealand Ministry of Education introduces
a process with four major steps: identifying the learning needs of students, teachers, and
school leaders; identifying inquiry or research questions; designing and engaging in
learning experiences that address those questions; and evaluating impact on teachers,
school leaders, and students (Timperley, Wilson, Barrar, & Fung, 2007). The Coalition
of Essential Schools advocates a similar process comprised of six steps: developing a
vision for teaching and learning, formulating researchable questions, designing
instruction, teaching and collecting data, analyzing data, and deriving implications for
changing practice (Cushman, 1999). Additionally, countless school districts disseminate
modified versions of the Deming cycle (Plan-Do-Study-Act) as a model for continuous
improvement.
Cycles of improvement have been applied to multiple aspects of district, school,
and classroom practice. At the district level, standardized test score data have been
used to make decisions about school and district performance goals, identify supports or
sanctions for low-performing schools, and evaluate school performance (Supovitz,
2006). Other data factor prominently into district improvement cycles depending on the
focus of inquiry. For example, a recent initiative to reduce the dropout rate among
secondary students in Portland, Oregon identified course grades (specifically, failure in
multiple classes) and low attendance as the primary risk factors for dropping out of high
school. This led to the development of intensive, school-based interventions in 9th grade
6

Chapter 1: Introduction and Study Framework
for the purposes of boosting attendance and reducing course failure among high-risk
students (Stid, O’Neill, & Colby, 2009).
At the school level, state assessment data have been used to determine
professional development needs, evaluate teachers, and identify students in need of
intensive support (Kerr, Marsh, Ikemoto, Darilek, & Barney, 2006). Interim assessment
data have been used for many of the same purposes, as well as to promote
differentiated instruction at the classroom level and monitor teacher and school progress
toward performance goals (Bulkley, Christman, Goertz, & Lawrence, 2008; Clune &
White, 2008). Data on student behavior and other climate characteristics have been
used to implement and monitor school-level behavior support interventions (Horner &
Sugai, 2004). The period of these cycles varies considerably. State assessment data
tend to inform annual interventions such as school improvement planning and teacher
evaluation, while interim assessment or behavior data are acted upon more rapidly in the
form of re-teaching, deployment of staff, or referral of students for individual support
(Perie, Marion, & Gong, 2009).
Improvement cycles at the classroom level tend to utilize different types of
evidence and be directed toward different ends (Coburn & Talbert, 2006). Specifically,
they tend to focus on the ways in which teachers surface student understandings and
respond to errors or misconceptions in real time. This process has been referred to as
“eliciting, interpreting, and acting” (Bell & Cowie, 2001) or as “eliciting, recognizing, and
using information” (Ruiz-Primo & Furtak, 2004). Black and Wiliam (2006, p. 88) further
specified this cycle as having six sequential stages:
1. A design, or intent, with formative opportunities built in;
2. Evoking of student responses;
3. Reception and interpretation of student responses;
4. Action based on interpretation of student responses;
7

Chapter 1: Introduction and Study Framework
5. Reception and interpretation of this action by the student; and,
6. Transition to the next part of the design.
While models of the cycle of instructional improvement vary in terms of the
system level at which they occur and the number of steps and processes included, they
all contain three fundamental elements: the deliberate collection of information,
interpretation of the information collected, and action based upon that interpretation. Yet
the connections between these elements are complex. Coburn and Talbert (2006) found
that conceptions of validity and appropriate use of evidence generally varied by position
within the system. District administrators tended to think of valid evidence in terms of
psychometric properties or alignment with academic outcomes, while fewer teachers and
principals held this view. On the other hand, teachers and frontline district
administrators (as opposed to top-level administrators) were more likely to see evidence
as valid if it provided insights into student thinking and reasoning. The authors
concluded that “contrasts seem to reflect differences in the nature of administrators’ and
teachers’ work. Those who had functions most closely linked with testing and
accountability held conceptions [of the validity of evidence] consistent with those
demands” (p. 485).
Further, implicit in all cycles of improvement is the connection between
interpreting data and changing practice: the capacity to continually adjust or modify
instruction based upon incoming data (Young, 2006). As such, these instructional
improvement efforts constitute professional learning problems in themselves (Thompson
& Zeuli, 1999; Honig & Ikemoto, 2008). Halverson, Pritchett, and Watson (2007) note
that the process of interpreting and making decisions based upon data (referred to in
their model as “actuation”) is organizational and social as much as cognitive, and thus
reliant upon organizational resources, capacity, and routines. Some research has raised
8
Chapter 1: Introduction and Study Framework
questions about the capacity of teachers and administrators to analyze and interpret the
data with which they are provided (Supovitz & Klein, 2003) and to act on their
interpretations (Spillane, 2000). More complex still is the process of facilitating such
learning within overlapping professional communities or across organizations and
systems (Knapp, 2008). In sum, whether at the classroom, school, or district level,
cycles of instructional improvement are complex processes requiring high levels of
individual, organizational or systemic capacity to carry out.
The study framework presented in Figure 1.1 is designed to capture both the
major elements of the cycles of instructional improvement described above and the
contextual factors most likely to influence their enactment at the school and district level.
Our framework has fewer steps than some models (e.g., Black & Wiliam, Coalition of
Essential Schools), primarily because the establishment of specific goals is not included.
While we recognize that the articulation of learning goals is an important aspect of
formative assessment (Herman, Osmundson, Ayala, Schneider, & Timms, 2006; Black &
Wiliam, 2009), the interim assessments that are the focus of this study are aligned with
the study districts’ standards and pacing schedules. We therefore assumed that the
learning goals were implicit in the policy context in which interim assessments were
adopted. Because a major focus of the study is how district and school factors influence
interim assessment use by teachers, those dimensions are foregrounded in our model
more than they are in most instructional improvement cycles.
While a common characteristic of all cycles of instructional improvement is the
collection and interpretation of information about student learning, the manner and
degree to which assessment shapes or informs these cycles varies depending on the
type of assessments employed and how they are used. The following sections review
uses and types of assessment more broadly, and then locate interim assessments within
this wider context.
9

Chapter 1: Introduction and Study Framework
Uses of assessment. The uses of assessment data fall along a continuum
ranging from summative to formative. Summative uses focus on evaluation or judgment,
while formative uses tend to focus on feedback for performance improvement. Below,
we synthesize some recent definitional discussions and show where interim
assessments lie on the summative—formative continuum.
While the term “formative assessment” has been used to refer to a great variety
of instructional practices, there has been a recent effort to put forth a common definition.
This effort, in part, stems from “truth-in-advertising” concerns on the part of formative
assessment purists who worry that private developers, as well as some states and
school districts, are using recent interest in formative assessment to sell or create testing
systems (Popham, 2008, p. 10). In 2006, the Council of Chief State School Officers
(CCSSO), after soliciting advice from several well-known researchers in the field of
assessment, proposed the following definition: “An assessment is formative to the extent
that information from the assessment is used, during the instructional segment in which
the assessment occurred, to adjust instruction with the intent of better meeting the needs
of the students assessed” (CCSSO, 2006). The crucial point here is that an assessment
(or assessment activity) provides the teacher with information that will help him or her in
modifying instruction so that students can learn better. This focus on classroom use is
one distinguishing characteristic of formative assessment. Popham (2008) adds that
formative assessment is a planned process, noting that teachers (or students) should
have access to carefully considered activities that are designed to elicit meaningful
assessment information. Finally, we acknowledge that teachers who know a) how
children learn (in general) and b) how knowledge in a particular domain is acquired will
be able to both choose the most meaningful formative assessment tasks and activities
and will also be best situated to interpret student understandings and to address
10

Chapter 1: Introduction and Study Framework
misunderstandings with appropriate instruction (National Research Council, 2001;
Popham, 2008).
Another consideration, one that has sparked some controversy, is the timeframe
in which instructional modification should occur in order to produce desired outcomes.
The CCSSO definition offered above takes a conservative perspective on this issue by
excluding assessment practices that do not inform instruction “during the instructional
segment in which the assessment occurred.” Whether an “instructional segment” refers
to an activity, a class period, or an instructional unit, however, is not specified. Likewise,
Popham (2008) does not include timing in his definition, and his advice to practitioners
encompasses formative assessment activities of various durations. Sadler maintains
that “the primary distinction between formative and summative assessment relates to
purpose and effect, not to timing” (1998, p. 120). Similarly, Wiliam and Leahy (2006)
suggest that formative assessment can vary in length or period. Halverson, Pritchett,
and Watson (2007) argue that the summative/formative dichotomy is overly simplistic:
The distinction between summative and formative often lies in the
perception of the communicators, not in the information itself. Thus,
information generated, for example, through shared assessments or peer
observation can be interpreted and used as evidence to summatively
judge and discipline teachers, just as standardized text scores can be
used to formatively reshape instructional practices (p.5).
Black and Wiliam define “formative” as “encompassing all those activities
undertaken by teachers, and or/by their students, which provide information to be used
as feedback to modify the teaching and learning activities in which they are engaged”
(1998, pp. 7-8). Together, these views suggest at best a loose relationship between
assessment type and use. Irrespective of scope or frequency, assessments may be
11

Chapter 1: Introduction and Study Framework
used to either render judgments or evaluations or to inform instructional decision making
or practice.
On the other hand, Perie, Marion, and Gong (2009) explicitly state that formative
assessments are shorter in period than either interim or summative assessments. As
shown in Figure 1.2, they suggest that summative assessments are given at the end of
instruction to provide information on what was learned. They are generally administered
once a semester or year to measure students’ performance against district or state
content standards. Summative assessments are standardized, usually given statewide
(but can be districtwide) and are often part of an accountability system. While schools
may use these data to identify students in need of extra support, they are not designed
to provide teachers with timely information about their current students’ learning.
Formative assessments, according to Perie, Marion, and Gong, occur in the natural
course of teaching and learning. They are built into classroom instructional activities and
provide teachers and students with ongoing, daily information about what students are
learning and how teachers might improve instruction so that learning gaps and
misunderstandings can be remedied. These assessments are not designed to provide
information that can be aggregated at the school or district level.
12

Chapter 1: Introduction and Study Framework
Figure 1.2. Relationship between Scope and Frequency of Assessment Administration
Source: Perie, Marion and Gong (2009)
The question of timing and period takes on added importance when considered
in the context of current research about formative assessment. The recent upsurge of
interest in formative assessment has been driven largely by research suggesting a
strong, positive relationship to student achievement. Short-cycle formative assessment
practices—largely those that are based on information collected by teachers within their
classrooms—have a substantial research base to support the contention that they are
one of the potentially most powerful means to improve the quality of teaching and raise
student performance (Black & Wiliam, 1998; Crooks, 1988; Natriello, 1987). However,
the evidence for the effects of medium- or long-cycle formative assessment—including
potentially formative uses of interim assessment (discussed below) —on student
achievement is less persuasive.
Types of assessment. Perie, Marion, and Gong (2009) have suggested that
assessments vary by both frequency and curricular scope. Frequency may range from
13

Chapter 1: Introduction and Study Framework
several times per class period to once per year. Wiliam and Leahy (2006) suggest that
frequency of administration is an important distinguishing characteristic among different
kinds of assessment. In their discussion of formative assessment types, they describe
short-, medium-, and long-cycle formative assessments. Short-cycle assessments are
those that provide feedback to teachers within a single class period; medium-cycle
assessments are those provide feedback to educators within a curricular unit; and long-
cycle assessments are those that provide information about students less frequently,
usually annually or bi-annually.
Curricular scope refers to the breadth of content assessed. Perie, Marion, and
Gong (2009) note that the uniformity of assessment increases with scope; for example,
end-of-year assessments are administered to large numbers of schools and students
(usually at the state level) and have a broad subject matter focus, while teacher
questioning routines can address individual student misunderstandings and often target
smaller domains of knowledge. Not surprisingly, these authors suggest that scope
increases as frequency decreases. Along these two continua of frequency and scope lie
literally hundreds of assessment opportunities for educators.
Defining and locating interim assessments. Interim assessments reside at
the midpoint on both the scope and frequency continua. Interim assessments would
generally be considered “medium-cycle” assessments under the Wiliam and Leahy
(2006) typology. They are administered at regular intervals, usually of several weeks,
most often at the district level. They cover common subject matter, allowing for
aggregation from classroom to school to district. On the other hand, each assessment
covers far less academic content (or covers content in less depth) than annual state
assessments, and are currently not administered at the state level.
Similarly, interim assessments occupy a gray area between formative and
summative uses of assessment. There is considerable debate about the degree to
14
Chapter 1: Introduction and Study Framework
which interim assessments may be used formatively. Claims of effectiveness made by
developers and providers, for example, routinely cite research on short-cycle formative
assessment as evidence for the impact of interim assessment. To date, however, there
is a conspicuous absence of evidence that interim assessments have effects on either
instructional modification or student learning (Shepard, 2005).
Very little research exists on how interim assessments are actually used by
individual teachers in classrooms, by principals, and by districts, or on their impact on
student performance. Some recent studies surveyed and interviewed teachers about
their use of interim test results in instruction. Many of these teachers reported that
interim test results helped them monitor student progress and identify skill gaps for their
students, and led them to modify curriculum and instruction (cf. Christman et al., 2009;
Clune & White, 2008; Stecher, Epstein, Hamilton, Marsh, Robyn, McCombs, Russell, &
Naftel, 2008). Stecher et al. (2008) found that 53% to 73% of study districts in
California, Georgia and Pennsylvania used interim or progress tests in elementary and
middle school mathematics (a focus of their study) in 2006. About three-quarters of the
teachers indicated that the results of these progress tests helped them identify and
correct gaps in curriculum and instruction. Similarly, 86% of teachers in Providence,
Rhode Island reported that they modified instruction because of interim assessment
tests (Clune & White, 2008). These activities included aligning instruction with
assessments and other standards, paying more attention to weak skills, and focusing on
content to be covered during each assessment period. Most instructional modifications
were remedial, however, such as reviewing problems from the assessments. Teachers
in a small sample of low-performing Philadelphia schools also reported re-teaching
content and skills assessed on the interim tests (Christman et al., 2009). Assessment
results were used by schools in both districts to identify both formal and informal
professional development, particularly by school-based coaches. These studies,
15

Chapter 1: Introduction and Study Framework
however, did not examine how individual teachers actually analyzed and used these
data to inform their classroom practice.
There are also few publicly available large-scale studies on the impact of interim
assessments on student learning. Henderson and colleagues from the Regional
Educational Laboratory Northeast and Islands (REL-NEI) examined the effect of
quarterly benchmark exams in mathematics on 8th-grade state test scores. Using an
interrupted time-series design, they found that, after two years of implementation of the
benchmark assessment program, participating schools posted small, non-significant
gains over comparison schools (Henderson, Petrosino, Guckenburg, & Hamilton, 2008).
In another study, researchers from MDRC evaluated the impact of the Formative
Assessments of Student Thinking in Reading (FAST-R) on 3rd- and 4th-grade state test
scores and on SAT-9 performance. Using a comparative interrupted time-series design
similar to that used in the REL-NEI study, these researchers found “generally positive
[but] not statistically significant” effects of FAST-R on state reading scores, as well as
statistically non-significant effects on SAT-9 performance, subscale scores of the state
test, as well as across subgroups (Quint, Sepanik, & Smith, 2008, p.41). Authors of both
studies caution that one to two years may be insufficient time to see effects on student
learning. Similarly, neither study incorporated the effect of other, concurrent
professional development programs into their quantitative analysis. It is possible, note
Quint, Sepanik, and Smith (2008), that while the interim assessment “may have
represented a contribution to teachers’ knowledge and skills, this contribution was not
very different from what teachers would have received had they and their schools not
participated in FAST-R” (p. 61).
Perie, Marion, and Gong (2009) suggest that interim assessments have multiple
uses. They may predict student performance on a summative, accountability
assessment; they may provide information for an evaluation of a program; or, they may
16
Chapter 1: Introduction and Study Framework
diagnose student strengths and weaknesses. However, because these authors adopt a
narrow, time and scope-constrained definition of formative assessment, they also argue
that interim assessments are distinct from formative assessment.
Interim assessments (1) evaluate students’ knowledge and skills relative
to a specific set of academic goals, typically within a limited time frame:
and (2) are designed to inform decisions both at the classroom and
beyond the classroom level, such as the school or district level (pp. 6-7).
[While interim assessments] may be given at the classroom level to
provide information for the teacher, a crucial distinction is that [unlike
formative assessments] these results can be meaningfully aggregated
and reported at a broader level (p. 6).
Beyond frequency and scope considerations, researchers have noted other
obstacles to using interim assessments formatively. In particular, in a desire to limit
instructional time taken for testing, districts have opted for interim assessments that are
quick to administer and score—generally all multiple-choice formats—and restricted the
number of items given on any one assessment. Both these trends limit the use of
interim assessments for formative use. Even if multiple-choice items are written to
provide instructionally tractable information, such information still remains an inference
made on the part of the teacher. Open-ended or constructed-response items, on the
other hand, allow students to reveal their own understandings and misunderstandings.
Likewise, while 20 items may be sufficient to obtain adequate reliability coefficients at
the district level, teachers want to use subscale scores for individual students or for
groups of 2 to10 students. These subscales, which can be made from as few as 2 to 3
items, can easily result in faulty conclusions (Herman & Baker, 2005). More generally, a
basic tension exists between those who have the most to learn from aggregated scores
on district-wide assessments (e.g., district administrators) and those who believe that
17

Chapter 1: Introduction and Study Framework
looking at student work is the best way to learn about individual student competencies
(e.g., many classroom teachers). While looking at student work is labor-intensive and
more difficult to standardize, it has been argued that data from scored assessments tend
to give only a gross sense of student performance (Shepard, 2005).
In this report, we treat the use of interim assessments as an empirical question.
This report does not assume that interim assessments are by definition formative, but
leaves open the possibility that they may be used formatively. As such, we do not
employ the more restrictive definition of formative assessment adopted by Perie, Marion,
and Gong, relying instead on the use-based definition similar to that of Black and Wiliam.
In the chapters that follow, we describe in detail the ways in which teachers do or do not
use interim assessments formatively, the factors associated with that use, and the
manner in which interim assessments relate to teacher assessment tools and practices
that are explicitly formative.
Teacher capacity. We must also consider that teachers vary greatly in their
ability to incorporate meaningful formative assessment into their instructional routines
and that more knowledge about the relationship between teacher capacity and formative
assessment practices would help to inform policies to promote this kind of teaching.
Teacher capacity to analyze interim assessment results can be looked at from two
complementary perspectives. The first asks what capacity the teachers need to have in
order to use interim assessment scores to inform instruction, while the second asks what
role the interim assessments might play in helping develop teachers’ capacity for
teaching elementary-level mathematics. This study directly addresses only the first
issue. Below, we present research findings on teachers’ capacity for carrying out high-
quality formative assessment.
Sadler (1998) notes that “highly competent teachers” bring six “resources” to the
act of formative assessment: content-area knowledge, attitudes or dispositions toward
18

Chapter 1: Introduction and Study Framework
teaching and learners, skill in constructing and/or compiling assessment tasks,
knowledge of standards, experience assessing across tasks and time, and expertise in
giving students feedback. In order to describe how teachers in our sample use interim
assessments, we consider these resources in our study.
Content-area knowledge. The interplay between subject matter and formative
assessment practice has been a topic of both theoretical and practical discussion. While
scholars and practitioners may disagree on the relative importance of content-knowledge
expertise in buttressing formative assessment practice, most agree that teachers must
have at least sufficient knowledge of content in order to establish or interpret learning
goals, and research indicates that teachers with strong subject-matter expertise can
better understand student misconceptions and adapt instruction accordingly
(Aschbacher & Alonzo, 2004; Duschl & Gitomer, 1997; Fennema, Franke, Carpenter, &
Carey, 1993). Other work points to the positive relationship between accuracy of
teacher interpretation or feedback and student learning (Herman & Choi, 2008). We
recognize that mathematical content knowledge among elementary school teachers is
generally weak (Hill, Schilling, & Ball, 2004), but that it is extremely important both for
assessing student learning and for providing developmentally appropriate feedback to
students. For example, fragile mathematical content knowledge may lead teachers to
use questions that are generic (e.g., affective or metacognitive) instead of topic specific
(Watson, 2006).
In addition to having a deep and connected knowledge of mathematical content,
educators should know about the development of mathematical knowledge and about
learning more generally. Specifically, it is crucial for teachers and assessment
developers to know how mathematical reasoning develops. For example, the National
Research Council urges that assessment design begin with “a model of learning,”
supported by empirical research (2001, p. 178-79). In a similar vein, formative
19

Chapter 1: Introduction and Study Framework
assessment advocates have long recognized the need for teachers to know: a) where
students are in their learning, b) where they need to go, and c) how to get there (Black &
Wiliam, 1998, 2006). The type of knowledge is related to, yet goes beyond, knowing the
mathematics that we expect children to learn.
Attitudes and dispositions. Previous research indicates that teacher attitudes
toward assessment and learning play a role in formative assessment practice. Marshall
and Drummond (2006) argue that true formative assessment should become “much
more than the application of certain procedures—questioning, feedback, sharing the
criteria with the learner and peer and self assessment—but about the realization of
certain principles of teaching and learning” (p. 135). In their study of 27 video-recorded
lessons, only one-fifth contained more than a superficial rendering of formative
assessment practice. Looking at interview data on these teachers’ beliefs, the
researchers found that the minority of teachers who practiced the “spirit” of formative
assessment both claimed to value pupil autonomy and to hold themselves responsible
for student learning to a greater degree than did teachers whose practice merely
touched on the “letter” of formative assessment practice (p.144). With respect to
teaching mathematics, teachers’ beliefs about and previous experience with
mathematics influence their perspectives on teaching mathematics (cf. Putnam, Heaton,
Prawat, & Remillard, 1992). For example, a belief that students do not like mathematics
may lead a teacher to emphasize “relevant and fun” activities with the intent of
increasing student interest in the subject (Borko, Eisenhart, Brown, Underhill, Jones, &
Agard, 1992, p. 205).
Naturally, just as teachers’ experiences are influenced by their beliefs, so too are
beliefs transformed by experience. Briscoe and Wells’ (2002) case study of one teacher
revealed that, in this instance, the teacher’s reflection on her beliefs about teaching and
about domain knowledge preceded change in assessment practice, although others note
20

Chapter 1: Introduction and Study Framework
that change in practice, even at a cursory level, can lead to changes in attitudes and
dispositions (Black & Wiliam,1998; Tierney, 2006). In either case, it is necessary to
include teachers’ beliefs toward teaching, learning, assessment, and domain knowledge
when looking at formative assessment practice.
Skill in constructing assessment tasks. As early as 1985, Stiggins and
Bridgeford noted that, although classroom-level assessment is a preferred method of
assessment by teachers, “research on classroom assessment has tended to focus on
standardized tests and has paid minimal attention to teacher-developed assessments”
(p. 271). While this situation has changed in the past two decades, the fact is that
systematic research on classroom-level assessment remains rare. One survey of a
representative sample of teachers in three states indicates that at least half of them use
“classroom assessments” on at least a weekly basis (Stecher & Hamilton, 2006, p.7).
While it is not clear the degree to which these assessments are curriculum-embedded or
teacher developed, teachers must still interpret and act on information from several
different data sources. Thus, we believe that any thorough study of teacher use of one
type of assessment should also take into account teachers’ more global assessment
practice.
Knowledge of standards. If formative assessment is the process of iteratively
adjusting instruction based on information about where students are in their
understanding relative to a learning goal, then a teacher’s knowledge of standards is
crucial to this progression. Knowledge of standards may begin with familiarity with state
or professional standards, which have been seen as both clarifying the goals of teaching
on one hand (Porter, 1989) and potentially “de-skilling” the work of teachers (Apple &
Jungck, 1990). Furthermore, teachers’ relationship to standards may change over time,
as they develop more support for interpreting and acting on them (Kauffman, Johnson,
Kardos, Liu, & Peske, 2002). In a recent study of NCLB implementation in three states,
21

Chapter 1: Introduction and Study Framework
between 80-90% of math and science teachers reported that “[state] standards are
useful for planning lessons” (Stecher, et al., 2008, p. 65). As Black and Wiliam (2006)
point out, however, an in-depth knowledge of learning goals goes beyond this basic
awareness of state standards. It would include taking an ontological stance vis-à-vis the
subject discipline. For example, when teaching mathematics, teachers need to be
aware that, “it is possible to ‘deliver’ the subject matter rather than to help students learn
it with understanding” (p. 85); hence, part of developing formative assessment practice
in mathematics is resisting this transmission model of teaching.
Experience in assessment. Stiggins (1991) notes that assessment literacy is
crucial for not only developing assessment(s), but also for interpretation and critique.
While elementary school teachers are familiar with methods of classroom assessment,
they are less informed about large-scale tests. Teachers do not routinely receive
graduate-level course work in assessment/measurement, and their administrators may
be no more knowledgeable (Impara & Plake, 1995). This general lack of building-level
expertise limits available supports for teachers who must administer, score, interpret,
analyze, and act on district-wide assessments.
Expertise in providing feedback. Research on classroom feedback is not new
to the field of education. In a 1986 meta analysis of 21 studies, teachers who had
distinct instructional processes to follow based on test outcomes, and who had received
explicit directions about providing feedback to students based on the data from the
assessments, demonstrated significantly higher growth in student achievement than
those teachers who used their own judgment about how to respond to the data (Fuchs &
Fuchs, 1986). The fact remains, however, that many teachers are currently not able to
use assessment results to plan subsequent instruction (Heritage, Kim, Vendlinski, &
Herman, 2009).
22

Chapter 1: Introduction and Study Framework
As part of formative assessment practice, questioning is seen as arising from
minute-by-minute “moments of contingency,” which, if successfully pursued, allow for the
regulation of learning by making student understanding (and misunderstanding) explicit
(Black & Wiliam, 2006). The teacher, therefore, relinquishes control over classroom
dialogue in order to allow students to express their own understandings. According to
this premise, once student understanding has been assessed, the teacher can adjust
instruction accordingly, leading to better learning outcomes. Viewing teacher practice in
this way has resulted in a fundamental reconceptualization of questioning and feedback
from typology-based to process-oriented and from teacher-driven to socially negotiated.
This process of monitoring student understanding has been referred to as “gathering,
interpreting, and acting” (Bell & Cowie, 2005) or as “eliciting, recognizing, and using
information” (Ruiz-Primo & Furtak, 2004).
Policy supports for data use. The literature on data-driven (or data-informed)
decision making (DDDM) has identified several barriers to and conditions for successful
use of assessment data: accountability context, instructional guidance systems, data
systems, staff capacity, school-level routines and structures, culture of data use and
inquiry, and leadership.
Accountability context. The accountability context of a school district
encompasses how school performance is defined and judged, including the use of
standardized assessments; the frequency and nature of assessments and other
measures of performance; and the consequences attached to performance levels or
changes in level. While state accountability systems focus on identifying low-performing
schools and school districts for technical assistance and, ultimately sanctions, many
districts have developed their own assessment (and in some situations, accountability)
systems for multiple purposes. Districts wanted these data to measure continuous
progress toward district and/or state standards, provide instructional feedback to
23

Chapter 1: Introduction and Study Framework
teachers, identify students needing additional support, reinforce constructivist teaching
through performance assessments, and/or evaluate programs (Coburn & Talbert, 2006;
Hamilton, Stecher, Marsh, McCombs, Robyn, Russell, Naftel, & Barney, 2007; Marsh,
Kerr, Ikemoto, Darilek, Suttorp, & Zimmer, 2005; Massell & Goertz, 2002). The design
of and district expectations for the use of their assessments can determine whether they
serve as tools of professional and organizational learning or monitoring and
accountability (Firestone & Gonzalez, 2007; Knapp, Copland, & Swinnerton, 2007).
Instructional guidance. DDDM is facilitated when districts adopt a coherent
system-wide curriculum or instructional vision accompanied by high-quality instructional
materials and challenging and measurable goals at the system, school, classroom and
individual student levels (Datnow, Park, & Wohlstetter, 2007; Supovitz, 2006). Studies
of DDDM have stressed the importance of aligning assessments to state standards and
to the curriculum being taught so the results can be used to inform and improve
instruction (Datnow, Park, & Wohlstetter, 2007; Hamilton & Koretz, 2002; Sharkey &
Murnane, 2003).
Data systems. Access to data greatly influences teacher use. In their study of
three school districts, for example, Marsh and colleagues (2005) found that educators
were much more likely to use data in a district that provided access through an online
system. Supovitz (2006) reports that Duval County, Florida greatly increased school use
of its integrated data management system when district staff developed a menu-driven,
Web-based management tool that provided easy access to student data. Thus,
researchers have recommended that data and reporting systems permit timely and easy
access to student performance information linked to state and district standards and/or
curriculum and easy analysis of assessments as well as other student information
(Datnow, Park, & Wohlstetter, 2007; Ikemoto & Marsh, 2007; Sharkey & Murnane, 2006;
Wayman & Stringfield, 2006). Yet, a national survey conducted in 2006-07 found only
24

Chapter 1: Introduction and Study Framework
72% of districts stored scores from district tests in electronic data systems and only 41%
of teachers reported having electronic access to their students’ performance on interim
or diagnostic tests (U.S. Department of Education, 2009).
Staff capacity. Districts must also address variation in teachers’ knowledge and
comfort with data systems, access to computers and capacity to interpret data reports
(Ikemoto & Marsh, 2007; Sharkey & Murnane, 2003; Supovitz & Klein, 2003; Young,
2006). For example, only 33% of teachers with access to an electronic student data
system in 2006-07 felt capable of forming data queries (U. S. Department of Education,
2009). Some districts have responded by assigning district-level staff with strong data
analysis skills to schools, or using school-based coaches or school teams to help
teachers analyze data (Kerr et al., 2006; Lachat & Smith, 2005; Massell, 2001).
Data alone will not improve student learning, however. Using data for
instructional improvement requires tightening the connection between data and
classroom practice and building instructional knowledge and skills. Yet, many teachers
lack the knowledge, resources, and support to link assessment results to teaching
(Datnow, Park, & Wohlstetter, 2007; Kerr et al., 2006; Young, 2006). For example, the
third-year evaluation of Boston’s FAST-R assessment system found that even though
these ELA assessments provide rapid feedback on student errors, “…FAST-R is often
not used to guide instruction because most of the time, it is not directly linked to
curriculum and/or to the school’s scope and sequence by the FAST-R
coaches…”(Chrismer & DiBara, 2006, p. 4). A synopsis of RAND research found that
while most teachers and principals reported having access to workshops on interpreting
assessment results, few found them to be helpful. Educators instead preferred training
on the use of assessment results in instructional planning, but this type of support “was
less often available” (Marsh, Pane, & Hamilton, 2006, pp.7-8).
25

Chapter 1: Introduction and Study Framework
School-level routines and structures. Whether formative assessment tools
are used and to what ends they are used also depend on the organizational routines at
the school level. Organizational routines, which structure much of what happens in
schools, include everything from school-improvement planning to grade-level meetings,
as well as ongoing informal interactions among staff (Spillane & Miele, 2007). It is
through these routines that teachers encounter and interpret data. For example, school
structures and routines can facilitate discussions of data and instructional practices
through dedicated time for teachers (and coaches) to discuss data and instruction
(Datnow, Park, & Wohlstetter, 2007), vertical teaming (Wayman & Stringfield, 2006), the
creation of professional learning communities within and across schools (Datnow, Park,
& Wohlstetter, 2007; Supovitz, 2006), and the integration of data use into regular staff
meetings.
Culture of data use and inquiry. A data-driven and inquiry-based culture
enables data use (Ikemoto & Marsh, 2007; Massell, 2001; Supovitz, 2006). Yet, districts
and schools face challenges in establishing a culture supportive of DDDM. Ingram,
Lewis, and Schroeder (2004), and Supovitz and Klein (2003), for example, found a
culture of teaching that works against data use even in schools and districts committed
to practicing “continuous improvement.” Teachers used personal metrics for judging the
effectiveness of their teaching, questioned the validity and relevance of externally
generated data, and based decisions on experience, intuition, and anecdotal
information. The organizational culture at schools also affects teacher data use.
Teachers will use formative assessments, or other tools, to improve instruction to the
extent that instructional improvement is an important goal. Some schools have cultures
that support ongoing discussions about teaching and its improvement. Other schools
have cultures where such conversations rarely happen. These norms of collaboration
26

Chapter 1: Introduction and Study Framework
can legitimize or constrain teachers’ joint analysis of student work and assessment data
(Young, 2006).
Leadership. All of these factors are affected by the quality of leadership at the
local system and school level. District leaders and school leaders design and promote
information systems and create a culture of data use and continuous improvement.
They determine schedules and create learning opportunities for staff. Leaders model
data use and stimulate and sustain inquiry into problems of practice. Researchers
emphasize the importance of having leaders create explicit norms and expectations
regarding data use (Datnow, Park, & Wohlstetter, 2007; Kerr et al., 2006; Lachat &
Smith, 2005; Supovitz, 2006; Wayman & Stringfield, 2006; Young, 2006), build and
support principals’ and teachers’ skills in data-based inquiry (Knapp, Copland, &
Swinnerton, 2007; Young, 2006), promote norms of collaboration (Ikemoto & Marsh,
2007; Young, 2006), and support the concept of continual learning (Sharkey & Murnane,
2006; Knapp, Copland, & Swinnerton, 2007).
Overview of the Report
The remainder of this report presents our findings about how a sample of
elementary school teachers in one urban and one suburban school district used the
results of interim and other forms of formative assessments in mathematics to inform
their instruction, and the teacher, school, and district factors that influenced this use.
Chapter 2 describes the study methodology, including our site-selection criteria and the
characteristics of our study districts and schools. Chapter 3 addresses the first study
question by examining each district’s mathematics curriculum and interim assessments,
school and district expectations for the use of these assessment results, and district and
school supports for assessment use. Chapter 4 addresses the second study question
by describing how teachers analyzed interim assessment data and planned instruction
27

Chapter 1: Introduction and Study Framework
based on these results, and the factors that influenced teachers’ interpretation and use
of interim assessments. Chapter 5 addresses the third study question, going beyond
interim assessments to take a broader look at teachers’ formative assessment practice.
It examines how teachers interpret information from different types of formative
assessments and the type of instructional strategies they employ in response, and
considers the ways in which different types of formative assessment intersect with or
reinforce one another within teachers’ practice. Chapter 6 responds to the fourth study
question, exploring the role that teacher capacity plays in formative assessment practice
by examining the relationship between two measures of teacher capacity—subject
specific knowledge for teaching and analysis of student understanding—and teachers’
analysis of assessment data and instruction in mathematics. Chapter 7 synthesizes the
study’s findings and discusses implications for the design of more effective interim
assessment policies and practices.
28

Chapter 1: Introduction and Study Framework
References
Apple, M., & Jungck, S. (1990). “You don’t have to be a teacher to teach this unit:” Teaching, technology, and gender in the classroom. American Educational Research Journal, 27, 227-251.
Argyris, C., & Schön, D. (1978). Organizational learning: A theory of action perspective.
Cambridge, MA: Addison-Wesley. Aschbacher, P., & Alonzo, A. (2006). Examining the utility of elementary science
notebooks for formative assessment purposes. Educational Assessment, 11, 179-203.
Bell, B., & Cowie, B. (2001). Formative assessment and science education. Norwell, MA:
Kluwer. Black, P., & Wiliam, D. (2009). Developing the theory of formative assessment.
Educational Assessment, Evaluation and Accountability, 21(1), 5-31.
Black, P., & Wiliam, D. (2006). Developing a theory of formative assessment. In J. Gardner (Ed.), Assessment and learning (pp. 81-100). London: Sage.
Black, P., & Wiliam, D. (1998). Assessment and classroom learning. Assessment in
Education: Principles, Policy & Practice, 5(1), 7-75. Borko, H., Eisenhart, M., Brown, C.A., Underhill, R.G., Jones, D., & Agard, P.C. (1992).
Learning to teach hard mathematics: Do novice teachers and their instructors give up too easily? Journal for Research in Mathematics Education, 23, 194-222.
Briscoe, C., & Wells, E. (2002). Reforming primary science assessment practices: A
case study of one teachers’ professional development through action research. Science Education, 86, 417-435.
Bulkley, K. E., Christman, J. B., Goertz, M., & Lawrence, N. (2008, March). Building with
benchmarks: The role of the district in Philadelphia's benchmark assessment system. Paper presented at the meeting of the American Educational Research Association, New York, NY.
Chrismer, S. S., & DiBara, J. (2006). Formative assessment of student thinking in
reading (FAST-R). Cambridge, MA: Education Matters, Inc. Christman, J., Neild, R., Bulkley, K., Blanc, S., Liu, R., Mitchell, C., & Travers, E. (2009).
Making the most of interim assessment data. Lessons from Philadelphia. Philadelphia, PA: Research for Action.
Clune, W. H., & White, P. A. (2008). Policy effectiveness of interim assessments in
Providence public schools (WCER Working Paper No. 2008-10). Madison, WI: University of Wisconsin-Madison, Wisconsin Center for Education Research.
Coburn, C. E., & Talbert, J. E. (2006). Conceptions of evidence-based practice in school
districts: Mapping the terrain. American Journal of Education, 112(4), 469-495.
29

Chapter 1: Introduction and Study Framework
Council of Chief State School Officers (CCSSO). (2006). Attributes of effective formative
assessment. Washington, DC: CCSSO FAST-SCASS. Crooks, T. (1988). The impact of classroom evaluation practices on students. Review of
Educational Research, 58, 438-481. Cushman, K. (1999). The cycle of inquiry and action: Essential learning communities.
Old Horace, 15(4), 5-17. Datnow, A., Park, V., & Wohlstetter, P. (2007). Achieving with data: How high-performing
school systems use data to improve instruction for elementary students. Los Angeles, CA: Center on Educational Governance, University of Southern California Rossier School of Education.
DeFeo, J. A., & Barnard, W. (2005). JURAN Institute's six sigma breakthrough and
beyond - Quality performance breakthrough methods. New York, NY: McGraw-Hill Professional.
Deming, W. E. (1986). Out of crisis. Cambridge, MA: MIT Centre for Advanced
Engineering. Dewey, J. (1946). The public and its problems: An essay in political inquiry. Chicago:
Gateway Books. Duschl, D. H., & Gitomer, R. A. (1997). Strategies and challenges to changing the focus
of assessment and instruction in science classrooms. Educational Assessment, 4, 839-858.
Fennema, E., Franke, M., Carpenter, T., & Carey, D. (1993). Using children’s
mathematical knowledge in instruction. American Educational Research Journal, 30, 555-583.
Firestone, W. A., & Gonzalez, R. A. (2007). Culture and processes affecting data use in
school districts. In P. A. Moss (Ed.), Evidence and decision making. The 106th yearbook of the National Society for the Study of Education, Part I (pp. 132-154). Malden. MA: Blackwell Publishing.
Fuchs, L. S., & Fuchs, D. (1986). Effects of systematic formative assessment: A meta-
analysis. Exceptional Children, 53, 199-208. Greenwood, D. J., & Levin, M. (1998). Introduction to action research: Social research
for social change. Thousand Oaks, CA: Sage. Halverson, R., Pritchett, R. B., & Watson, J. G. (2007). Formative feedback systems and
the new instructional leadership (WCER Working Paper No. 2007-3). Madison, WI: Wisconsin Center for Education Research, University of Wisconsin-Madison.
Hamilton, L. S., & Koretz, D. M. (2002). Tests and their use in test-based accountability
systems. In L. S. Hamilton, B. M. Stecher & S. P. Klein (Eds.), Making sense of test-based accountability in education (pp 13-49). Santa Monica, CA: RAND.
30

Chapter 1: Introduction and Study Framework
Hamilton, L. S., Stecher, B. M., Marsh, J. A., McCombs, J. S., Robyn, A., Russell, J. L.,
Naftel, S., & Barney, H. (2007). Standards-based accountability under No Child Left Behind: Experiences of teachers and administrators in three states (MG-589-NSF). Santa Monica, CA: RAND.
Henderson, S., Petrosino, A., Guckenburg, S., & Hamilton, S. (2008). A second follow-
up year for “measuring how benchmark assessments affect student achievement,” (REL Technical Brief 2008-No. 002). Newton, MA: Regional Educational Laboratory Northeast & Islands.
Heritage, M., Kim, J., Vendlinski, T., & Herman, J. (2009). From evidence to action: A
seamless process of formative assessment? Educational Measurement: Issues and Practice, 28, 24-31.
Herman, J., & Baker, E. (2005). Making benchmark testing work. Educational
Leadership, 62, 48-54. Herman, J., & Choi, K. (2008). Formative assessment and the improvement of middle
school science learning: The role of teacher accuracy. (CSE Report 740). Los Angeles, CA: CRESST, University of California, Los Angeles.
Herman, J., Osmundson, E., Ayala, C., Schneider, S., & Timms, M. (2006). The nature
and impact of teachers’ formative assessment practices. (CSE Report 703). Los Angeles, CA: CRESST, University of California, Los Angeles.
Hill, H. C., Schilling, S. G., & Ball, D. L. (2004). Developing measures of teachers’
mathematics knowledge for teaching. The Elementary School Journal, 105, 11- 30. Honig, M. I., & Ikemoto, G. S. (2008). Adaptive assistance for learning improvement
efforts: The case of the Institute for Learning. Peabody Journal of Education, 83, 328-363.
Horner, R., & Sugai, G. (2004). School-wide positive behavior support: Implementers'
blueprint and self-assessment. Eugene, OR: University of Oregon, OSEP Center on Positive Behavior Support.
Ikemoto, G. S., & Marsh, J. A. (2007). Cutting through the “data-driven” mantra: Different
conceptions of data-driven decision making. In P. A. Moss (Ed.), Evidence and decision making. The 106th yearbook of the National Society for the Study of Education, Part I (pp. 105-131). Malden. MA: Blackwell Publishing.
Impara, J. C., & Plake, B. S. (1995). Comparing counselors’, school administrators’, and
teachers’ knowledge in student assessment. Measurement & Evaluation in Counseling & Development, 28, 78-87.
Ingram, D., Lewis, K. S., & Schroeder, R. G. (2004). Accountability policies and teacher
decision making: Barriers to the use of data to improve practice. Teachers College Record, 106(6),1258-1287.
Juran, J. M. (1986). The quality trilogy. Quality Progress, 9(8), 19-24.
31

Chapter 1: Introduction and Study Framework
Kauffman, D., Johnson, S. M., Kardos, S. M., Liu, E., & Peske, H. G. (2002). “Lost at
sea”: New teachers’ experiences with curriculum and assessment. Teachers College Record, 104(2), 273-300.
Kerr, K. A., Marsh, J. A., Ikemoto, G. S., Darilek, H., & Barney, H. (2006). Strategies to
promote data use for instructional improvement: Actions, outcomes, and lessons from three urban districts. American Journal of Education, 112(4), 496-520.
Knapp, M. S. (2008). How can organizational and sociocultural learning theories shed
light on district instructional reform? American Journal of Education, 114, 521-539. Knapp, M. S., Copland, M. A., & Swinnerton, J. A. (2007). Understanding the promise
and dynamics of data-informed leadership. In P. A. Moss (Ed.), Evidence and decision making. The 106th yearbook of the National Society for the Study of Education, Part I (pp. 74-104). Malden, MA: Blackwell Publishing.
Lachat, M. A., & Smith, S. (2005). Practices that support data use in urban high schools.
Journal of Education for Students Placed at Risk, 10(3), 333-349. Lewin, K. (1946). Action research and minority problems. Journal of Social Issues, 2(4),
34-46. Marsh, J. A., Kerr, K. A., Ikemoto, G. S., Darilek, H., Suttorp, M., & Zimmer, R. W.(2005).
The role of districts in fostering instructional improvement (MG-361-EDU). Santa Monica, CA: RAND.
Marsh, J. A., Pane, J. F., & Hamilton, L. S. (2006). Making sense of data-driven decision
making in education. Santa Monica, CA: RAND Corporation. Marshall, B., & Drummond, M. J. (2006). How teachers engage with assessment for
learning: Lessons from the classroom. Research Papers in Education, 21, 133-149.
Massell, D. (2001). The theory and practice of using data to build capacity: State and
local strategies and their effects. In S. Fuhrman (Ed.), From capitol to the classroom: Standards-based reform in the states. The 100th yearbook of the National Society for the Study of Education, Part II (pp. 148-169). Chicago: University of Chicago Press.
Massell, D., & Goertz, M. E. (2002). District strategies for building capacity. In A. M.
Hightower, M. S. Knapp, J. A. Marsh, & M. W. McLaughlin (Eds.), School districts and instructional renewal (pp. 43-60). New York: Teachers College Press.
Natriello, G. (1987). The impact of evaluation processes on students. Educational
Psychologist, 22, 155-175. Northwest Regional Educational Laboratory (2001). Curriculum inquiry cycle. Retrieved
March 5, 2009, from http://www.nwrel.org/scpd/ci/cycle.html
32

Chapter 1: Introduction and Study Framework
National Research Council. (2001). Knowing what students know: The science and design of educational assessment. Committee on the Foundations of Assessment. J. Pellegrino, N. Chudowsky, & R. Glaser, (Eds.). Washington, DC: National Academy Press.
Perie, M., Marion, S., & Gong, B. (2009). Moving toward a comprehensive assessment
system: A framework for considering interim assessments. Educational Measurement: Issues and Practice, 28, 5-13.
Popham, W.J. (2008). Transformative assessment. Alexandria, VA: Association for
Supervision and Curriculum Development. Porter, A. C. (1989). External standards and good teaching: The pros and cons of telling
teachers what to do. Educational Evaluation and Policy Analysis, 11, 343-356. Putnam, R.T., Heaton, R.M., Prawat, R.S., & Remillard, J. (1992). Teaching
mathematics for understanding: Discussing case-studies of four fifth-grade teachers. The Elementary School Journal, 93, 213-228.
Quint, J., Sepanik, S., & Smith, J. (2008, December 1). Using Student Data to Improve
Teaching and Learning: Findings from an Evaluation of the Formative Assessments of Students Thinking in Reading (FAST-R) Program in Boston Elementary Schools. MDRC, (ERIC Document Reproduction Service No. ED503919) Retrieved August 7, 2009, from ERIC database.
Ruiz-Primo, M. A., & Furtak, E. M. (2004). Informal formative assessment of students’
understanding of scientific inquiry (CSE Report 639). Los Angeles, CA: CRESST, University of California, Los Angeles.
Sadler, D. L. (1998). Formative assessment: Revisiting the territory. Assessment in
Education: Principles, Policies, and Practice, 5, 77-84. Sawchuk, S. (May 13, 2009). Testing faces ups and downs amid recession. Education
Week, 28. Senge, P. M. (1990). The fifth discipline: Mastering the five practices of the learning
organization. New York: Doubleday Business. Sharkey, N. S., & Murnane, R. J. (2006). Tough choices in designing a formative
assessment system. American Journal of Education, 112(4), 572-588. Sharkey, N. S., & Murnane, R. J. (2003). Learning from student assessment results: A
necessary, if difficult, response to NCLB. Educational Leadership, 61(3), 77-81. Shepard, L. (2005, October). Formative assessment: Caveat emptor. Paper presented to
the Educational Testing Service Invitational Conference, New York. Spillane, J. P. (2000). Cognition and policy implementation: District policy makers and
the reform of mathematics education. Cognition and Instruction, 18(2), 141-179.
33
Chapter 1: Introduction and Study Framework
Spillane, J. P., & Miele, D. B. (2007). Evidence in practice: A framing of the terrain. In P. A. Moss (Ed.), Evidence and decision making. The 106th yearbook of the National Society for the Study of Education, Part I (pp. 46-73). Malden. MA: Blackwell Publishing.
Stecher, B., & Hamilton, L. (2006). Using test-score data in the classroom (RAND
Working Paper WR-375-EDU). Santa Monica, CA: RAND. Stecher, B., Epstein, S., Hamilton, L. S., Marsh, J. A., Robyn, A., McCombs, J. S.,
Russell, J., & Naftel, S. (2008). Pain and gain: Implementing No Child Left Behind in three states, 2004-2006. Santa Monica, CA: RAND.
Stid, D., O’Neill, K., & Colby, S. (2009). Portland public schools: From data and
decisions to implementation and results on dropout prevention. San Francisco, CA: The Bridgespan Group.
Stiggins, R. J. (1991). Facing the challenges of a new era of educational assessment.
Applied Measurement in Education, 4, 263-273. Stiggins, R. J., & Bridgeford, N. J. (1985). The ecology of classroom assessment.
Journal of Educational Measurement, 22, 271-286. Supovitz, J. A. (2006). The case for district-based reform: Leading, building, and
sustaining school improvement. Cambridge, MA: Harvard Education Press. Supovitz, J. A., & Klein, V. (2003). Mapping a course for improved student learning: How
innovative schools systematically use student performance data to guide improvement. Philadelphia, PA: Consortium for Policy Research in Education, University of Pennsylvania Graduate School of Education.
Technology Alliance (n.d.). The inquiry cycle. Retrieved March 5, 2009 from
http://www.technology-alliance.com/pubspols/dddm/inquirycycle.html Thompson, C. L., & Zeuli, J. S. (1999). The frame and the tapestry: Standards-based
reform and professional development. In L. Darling-Hammond & G. Sykes (Eds.), Teaching as the learning profession: Handbook of policy and practice (pp. 341-375). San Francisco: Jossey-Bass.
Tierney, R. D. (2006). Changing practices: Influences on classroom assessment.
Assessment in Education, 13, 239-264. Timperley, H., Wilson, A., Barrar, H., & Fung, I. (2007). Teacher professional learning
and development: Best evidence synthesis iteration (BES). Wellington, NZ: Ministry of Education.
U.S. Department of Education (2009). Implementing data-informed decision making in
schools: Teacher access, supports and use. Washington, DC: U.S. Department of Education, Office of Planning, Evaluation and Policy Development.
Watson, A. (2006). Some difficulties in informal assessment in mathematics.
Assessment in Education, 13, 289-303.
34

Chapter 1: Introduction and Study Framework
Wayman, J. C., & Stringfield, S. (2006). Technology-supported involvement of entire
faculties in examination of student data for instructional improvement. American Journal of Education, 112(4), 549-571.
Wiliam, D., & Leahy, S. (2006, April). A theoretical foundation for formative assessment.
Paper presented at the American Educational Research Association annual meeting, San Francisco, CA.
Young, V. M. (2006). Teachers’ use of data: Loose coupling, agenda setting, and team
norms. American Journal of Education, 112(4), 521-548.
35

CHAPTER 2
Methodology
To address our research questions, we collected data during the 2005-06 and
2006-07 school years from a purposive sample of nine schools located in one urban and
one suburban school district in Pennsylvania. This chapter provides a brief overview of
the study sites, details our data collection process, and describes our data analysis
methods.
Study Sites
We conducted in-depth fieldwork in nine schools in two school districts:
Philadelphia, Pennsylvania and Cumberland, Pennsylvania.1 Philadelphia is among the
largest school districts in the United States and has also been identified as one of the
most socioeconomically, financially, and academically troubled school districts in the
country. It educates approximately 175,000 students in 274 schools. The student
population is predominately African-American (64.4%), with nearly equal proportions of
Caucasian (13.2%) and Hispanic (16.4%) students. Cumberland is an economically
diverse suburban district that enrolls approximately 7,400 students in seven elementary
schools, one junior, and one senior high school. Most Cumberland students are
Caucasian (70.7%), and 21% are African-American.
These districts were selected based on a number of factors. First, to focus on
formative assessments and policy supports, we held curriculum constant by choosing
two districts using the same mathematics program, in this case, Everyday Mathematics
(EM). While we did not explicitly measure the extent to which the enacted curriculum in 1 Cumberland is a pseudonym for the suburban district in our study. While we had permission from the Philadelphia to use the name of this district, the small number of schools in the suburban district made it impossible to use their name while maintaining the confidentiality of the schools, administrators and teachers.
36

Chapter 2: Methodology
our schools mirrored the intended curriculum, choosing districts that used the same
mathematics program allowed us to view lessons across classrooms, schools and
districts that had identical objectives, materials, and embedded assessment
opportunities. In addition, the EM grade-specific Learning Goals, along with the PA state
standards, provided uniform expectations for mathematics teaching and learning across
these schools. Second, by studying two districts in the same state, we have held the
macro-accountability context constant (i.e., in both districts the interim assessments are
linked to the same state standards and the same state test for the same grades with the
same consequences for schools and districts). Third, by selecting one urban and one
suburban district, we hoped to learn how policy supports for instructional improvement
function in these different environments. Finally, both districts had already adopted
interim assessment systems in elementary mathematics.
Schools were selected according to three criteria. First, all schools had made
AYP in school year 2004-05; this allowed us to assume that each school was operating
at a minimum level of functioning that would both facilitate our research as well as
increase the odds that the schools were attending to interim assessment results.
Second, among schools that met this minimum level of achievement, we chose schools
to reflect a range of mathematics performance around the district average. The average
proficiency level in the participating Philadelphia schools ranged from 41% to 62%
(compared to the Philadelphia 2004-05 elementary school average of 49%), while the
average proficiency level in the participating Cumberland schools ranged from 80% to
93% (compared to the Cumberland 2004-05 elementary school average of 89%). The
percentage of elementary school students scoring proficient or above in Pennsylvania in
2004-2005 was 75%. The incorporation of average-performing schools was intended to
make our findings more relevant to a greater number of schools, while we believed that
including above-average performing schools, particularly in Philadelphia, would allow us
37

Chapter 2: Methodology
to see structures and routines that might not be present in the average-performing
schools. Finally, schools were chosen to reflect the ethnic and socioeconomic diversity
within each district. We studied six schools in Philadelphia. All schools were Title I
schools and ranged from 49% to 93% free- or reduced-price lunch. Four schools were
90-99% African-American, and the other two schools were approximately 99% Latino.
The six schools were located in three different regions across the district, each headed
by a regional superintendent and supported by a regional staff. The principals had
served their schools anywhere from three years to more than a decade and most had
earned masters degrees. One of the six schools elected to discontinue its participation in
the study after the first round of data collection, leaving five Philadelphia schools in the
sample for the remainder of the study. We included three Cumberland elementary
schools in our study, including one Title I school. The schools ranged from 11% to 32%
free- or reduced-price lunch. All three principals had held their positions for at least five
years, and all held doctorate degrees.
We focused on Grades 3 and 5 as these were the only elementary grades tested
by the state at the start of our study. These are also focal grades for elementary
mathematics instruction in that it is at these levels that the mathematical performance
landmarks in computation are critical for students’ academic progress. Third grade
typically marks the level at which students are expected to show mastery of core
addition and subtraction concepts and procedures with whole numbers and of
fundamental knowledge of place value. Fifth grade is the point in the curriculum when
students are expected to have mastered multiplication and division and to have
developed fraction concepts and skills. Fractions are crucial as foundations for continued
work with rational numbers as well as algebra. With a few exceptions related to teacher
attendance or schedule conflicts, we interviewed and observed all 3rd- and 5th-grade
38
Chapter 2: Methodology
teachers in our study schools. A total of 46 teacher interviews were conducted in the Fall
2006, 39 in Winter 2007, and 38 in Spring 2007.
Data Collection
We collected data from six sources: (a) classroom observations, (b) teacher
interviews, (c) school and district leader interviews, (d) observation of district and school
meetings, (e) artifacts, and (f) a survey of teachers’ Content Knowledge for Teaching-
Math (CKT-M). Each of these sources is described below.
Classroom observations. We conducted classroom observations three times
during the 2006-07 school year, visiting each 3rd- and 5th-grade teacher’s classroom for
one mathematics period. While these lessons ranged from approximately 30 minutes to
1.5 hours, on average, we observed three hour-long lessons per teacher over the school
year: once in the fall, once in the winter, and once in the spring.
Our fall observations were designed to establish a “baseline” sense of
mathematics instruction in these 3rd- and 5th-grade classrooms. During these
observations, we focused on two aspects of the lesson: a) instructional format and
content; and b) assessment and instructional practice. The goal of noting the
instructional format was to describe the student grouping strategies that teachers used, if
any (i.e., whole class, small group or partner, or individual work). We also noted the
content area(s) that was (were) addressed in each class (e.g., number concepts,
operations, measurement, etc.). The primary focus of the fall observations, however,
was on the interaction between assessment and instruction. Specifically, we noted
instances when teachers engaged in minute-by-minute assessment of student
understanding and when they also used results from the interim assessments to inform
their instruction (see below section on Teacher Interviews). We also paid particular
39

Chapter 2: Methodology
attention to occasions when student misunderstandings of content were revealed and to
teacher responses to such misunderstandings.
Because the purpose of this study is to investigate how teachers actually use
information gathered from various assessments, with an emphasis on interim
assessments, we scheduled our winter and spring visits to occur when teachers were
most likely to be using interim assessment information to re-teach before moving on to
new content. Therefore, we scheduled each of these visits in the “instructional window”
between the reporting/scoring of the interim assessment results and the end of that
assessment period (the administration of the summative EM end-of-unit test in
Cumberland, or the end of the “sixth week” according to the Philadelphia School District
pacing guide). This allowed us to make comparisons across classrooms since all
teachers within each district held essentially the same broad instructional goal during our
visits (e.g., revisit content from January and February, revisit content from EM Unit 9,
etc.). During these visits, we focused on instructional and formative assessment
practices that teachers used during the re-teaching period. Such practices included, but
were not limited to, opportunities for peer (or self) assessment, re-teaching of content,
pull-out remediation, or calling on individual students. Because we could not directly
observe whether or not these instances of practice were linked to the information gained
from the interim assessments, we asked teachers about these particular practices in the
teacher interviews, which immediately followed each classroom observation.
Teacher interviews. In the fall and winter visits to schools, we conducted
individual, hour-long interviews with teachers immediately following each classroom
observation. In almost all cases, these interviews took place right after, or a couple of
hours after, the observed lesson. Our spring interviews with Philadelphia teachers,
however, took place two weeks after classroom observations due to the administration of
the state test (the PSSA) in the days immediately following the classroom observations.
40

Chapter 2: Methodology
Spring interviews in Cumberland occurred immediately after classroom observations. All
teacher interviews were audio recorded and transcribed.
Fall interviews. The fall teacher interviews consisted of two parts: semi-
structured questions and a Data Analysis Scenario. The questions focused on teachers’
professional backgrounds, their general assessment practices, and the professional
development opportunities available to them. We also asked several questions that
helped provide context for the lesson that we had just observed and that were designed
to tap into the different ways in which teachers monitor student understanding of
mathematical content. We also asked the teachers if there was anything that they
struggled with “mathematically” during the lesson.
The Data Analysis Scenario consisted of a hypothetical mock-up of student
results based on each district’s (and each grade’s) interim assessment. The items on
each of the four2 Scenario versions were taken directly from each district’s original
interim assessments following a unit on fractions. We presented teachers with these
hypothetical interim assessment results for two reasons. First, at the beginning of our
study, we did not know the extent to which participating teachers used their district’s
assessments results, their district’s reporting mechanisms, or both. At this early stage in
our relationship with the teachers, we also did not want to ask them if they would be able
to discuss their own students’ results with us. Therefore, in order to learn more about
teachers’ familiarity with their district’s assessment system, we presented them with a
basic report from a hypothetical class of students. The second advantage to using a
hypothetical set of results was that we could standardize the “results” across grades and
districts to see what variation in teacher analysis or interpretation would occur in
response to an identical set of results. For example, while there might be some teachers
in our sample who rarely see incorrect answers on their students’ actual interim 2 One each for Philadelphia 3rd and 5th grades and for Cumberland 3rd and 5th grades.
41
Chapter 2: Methodology
assessments, we wanted to see how all of our participating teachers would respond to
certain patterns of incorrect responses. Therefore, we designed each of the four
scenarios so that 82% of the items were correct, and incorrect responses reflected
common student misconceptions in mathematics. For example, the incorrect responses
to the Philadelphia interim assessments indicated that several students could not find
common denominators, leading to errors in comparing and adding fractions.
The Data Scenarios were formatted so that they mirrored how each district
reports their interim assessment results. For example, Cumberland interim assessment
results are entered into a pre-formatted Microsoft Excel spreadsheet in which content
sub-areas on which any student gets more that one item incorrect are automatically
highlighted in yellow (see Figure 2.1). In Philadelphia, reporting these hypothetical
results was a more complex task since teachers receive their students’ scores online
through an Information Management System (IMS). Since we did not want the Scenario
to become unwieldy to administer, we chose to present the Philadelphia teachers with a
color “print out” of only the most commonly accessed view of student results, the Item
Analysis (see Figure 2.2). Since the Philadelphia online data is stored in a Microsoft
Access database, we used the same database management software to create the
Philadelphia Data Scenario.
42

Chapter 2: Methodology
Figure 2.1. Interim Assessment Results Spreadsheet for Cumberland
43

Chapter 2: Methodology
Figure 2.2. Interim Assessment Results Spreadsheet for Philadelphia
44

Chapter 2: Methodology
We presented each teacher with a one-page print out of hypothetical interim
assessment results, asking the teacher if she “had seen something like this before.” In
all cases, teachers reported having seen their district’s interim assessment results
reported in this way. We then asked each teacher to imagine that this was her class and
to “think aloud” for us about what she saw in the results. After approximately five
minutes, or after the teacher stopped talking, we continued with a series of six follow-up
questions designed to call attention to patterns in the data (e.g., Are there any topics that
this class, overall, appears to have difficulty with? How do you know?). In this way, we
were able to capture both each teacher’s initial, natural reaction to the assessment
results as well as whether or not, with probing, she noticed particular strengths and
weaknesses among her class.
Because understanding student thinking is a central part of formative
assessment in mathematics, we wanted to better understand the responses that
teachers have to typical student misconceptions. In recent years, structured scenarios
have been used in educational policy research as a proxy for classroom behavior when
large-scale observation is not possible (cf. Stecher, et al., 2006). Our purpose was
different, however. We wanted to discover how teachers in our sample interpreted
assessment results. Specifically, we wanted to learn: (a) whether or not teachers could
identify student errors in mathematics and what these errors told them about students’
thinking, (b) what questions they would ask students to learn the extent to which their
own interpretations were correct, and (c) what instructional steps they would take to
address particular misconceptions. These aims map onto the interpretation and planning
steps of the instructional improvement cycle detailed in chapter 1.
In order to present participants with scenarios that were relevant to their
experiences as elementary school teachers, we devised two sets, each composed of
45

Chapter 2: Methodology
two different prompts based on actual items from each interim assessment. 3 The first
set, given in the fall immediately following the Data Analysis Scenario, was constructed
from common misunderstandings about fractions, in particular challenges with: (a) the
relative magnitude of two fractions; (b) identifying fractional parts of an area model (both
for the 3rd-grade teachers); (c) ordering of four or more fractions, and (d) addition of two
fractions with unlike denominators (both for the 5th-grade teachers). The errors that were
constructed were also potentially indicative of greater misunderstandings about the
relationship between the numerator and the denominator and about part-to-whole
relationships. Figure 2.3 illustrates one of the 3rd-grade fall items. When presented with
each item, participating teachers were asked:
1. What might the student be thinking?
2. What question would you ask this student to find out if your opinion of her
thinking is correct?
3. How would you correct her misconception?
Figure 2.3. Item from 3rd-grade Fall Misconception Scenario
While we believe that these scenarios may provide important information on the
ways in which classroom teachers analyze and interpret assessment results, we also
3 Heather Hill provided valuable assistance in constructing the misconception scenarios.
Now imagine you are looking at some of Ananda’s homework. Here is what she wrote for the following problem:
Kim’s mom gave her 1/2 dollar to buy a drink. Jo Jo’s mom gave him 2/5 of a dollar to buy a drink. Who got more money?
Jo JO. Because Jo Jo has more of the dolar.
46

Chapter 2: Methodology
realize their potential limitations. Foremost among these is the fact that since the
assessment results are fictional, teachers are unable to bring contextual knowledge to
bear on interpreting results for individual students. For example, with a hypothetical set
of results, a teacher cannot attribute low performance to potentially contributory factors
such as the student’s language status, health status, or other disciplinary or familial
problems that occur in real life. For this reason, we believe that the scenarios are best
used in conjunction with a semi-structured interview with the teacher about her own
assessment results. This method is described in more detail in the following section.
Winter interviews. The winter teacher interviews consisted of questions focused
on planning for and teaching during the allotted re-teaching days. Many of these
questions attempted to link teacher behavior observed during our classroom visits with
teachers’ intentions and with teacher use of assessment information. We also asked
about professional development opportunities available to teachers since the first round
of interviews and about other potential supports for interim assessment use. During this
round we were particularly interested in the technological features of Philadelphia’s data
reporting system that teachers use. Finally, we asked participating teachers if the term
“formative assessment” was one that they were familiar with.
As part of this interview, we asked teachers to bring copies of their most recent
interim assessment results with them. We asked both about class-wide patterns of
performance as well as about mathematical concepts that seem to present difficulty for
students. These questions were designed to closely mirror the previous questions on the
Data Analysis Scenario. In this way, we hoped to get a more complete picture of
teachers’ individual capacity to make sense of interim assessment results. During these
interviews, we also noted that some teachers had taken extra steps to organize their
data beyond the ways in which their respective districts present this information. For
example, one Cumberland teacher used the information given by the district
47

Chapter 2: Methodology
spreadsheet to write the names of the students who got each item incorrect alongside
these items on the teacher’s copy of the interim assessment. As we analyzed our own
data, we made note of ways in which teachers modified the presentation of assessment
results to aid interpretation.
Spring interviews. The spring teacher interviews gave us an opportunity to
confirm trends in teacher formative assessment use that we had begun to identify,
specifically, to further explore teacher use of interim assessment results to understand
student thinking and to help identify their own professional development needs. We also
used this final round of interviews to ask teachers about the role of classroom
assessments in light of the annual state assessment (the PSSA) that had just been
administered.
In order to gain a broader and deeper understanding of teachers’ use of interim
assessment results, we linked several questions to two types of artifacts in our spring
interviews: an item from the most recent interim assessment and (in Philadelphia) the
Benchmark Data Analysis Protocol (BDAP), a two-page, district-created analysis and
reflection worksheet. We chose one item from each of the most recent four interim
assessments by selecting those that we felt offered teachers the most opportunity to
learn about student understanding of mathematical concepts. To our surprise, it was
difficult to identify items for which the distractors offered meaningful information about
student learning or open-ended items that targeted mathematical understanding. Out of
20 items on each assessment, only 2 to 3 were identified as potentially informing
knowledge about student understanding relative to a learning goal (as opposed to
merely indicating, for example, that a student could or could not perform a procedure).
We then chose one item from these 2 to 3 based on the relative curricular importance of
the mathematical content contained therein (e.g., operations were given precedence
over measurement) and on the perceived difficulty of the item. Much as we had done in
48

Chapter 2: Methodology
the fall and winter, we asked teachers to describe what students who got this item
incorrect might have been thinking, what steps the teachers would take to confirm or
disconfirm this hypothesis, and how they might address student misunderstanding.
Because much has been written about the greater potential for constructed-response
and open-ended items to reveal student understanding relative to multiple-choice items,
and because the Cumberland interim assessments contain constructed-response and
open-ended items, we also asked Cumberland teachers to bring examples of (incorrect)
student work to the interview. We then asked these teachers a similar set of questions
aimed at understanding what knowledge they gained from such items and their planned
instructions responses (if any) to such misconceptions.
In Philadelphia, we asked several questions about the BDAP and reflection
worksheet. While completing the reflection component of the protocol was officially
voluntary, in the Spring 2006 background interviews, all of our participating principals
reported that they expected their teachers to complete these forms and hand them in to
them. Our particular interest in the BDAP was whether or not teachers used it to report
their own professional development needs and whether or not school leaders used the
resulting information to provide requested assistance.
School and district leader interviews. In addition to observing classroom
instruction and interviewing teachers, we also conducted background interviews with
district and school leaders in Spring 2006 and Spring 2007. District respondents
included directors of assessment, accountability and curriculum and assessment, and
district-level instructional coaches (n=10). School leaders included principals and school-
based instructional coaches (n=25). We used these interviews to understand the context
for the use of interim assessments, and to identify district- and school-level expectations
for interim assessment use and potential supports offered to teachers (e.g., additional
days for re-teaching; release time for professional development; data management
49
Chapter 2: Methodology
systems). We were also interested in how school and district leaders used the data
reported from the interim assessments in their own roles. This information enabled us to
make connections (and identify mismatches) between school-and district-level
expectations, support and data uses, and classroom expectations and uses of interim
assessment results.
Observation of district and school meetings. In order to gain a more complete
understanding of assessment creation and data use at the school- and district-level, we
attended principal meetings in Philadelphia at which several types of “performance
indicators” were discussed and test-construction meetings in Cumberland. We also
observed several professional development workshops for both teachers and principals.
Finally, because grade-level collaboration was mentioned as a possible support for
teacher interim assessment use, we attended a handful of grade-group meetings in
three of the Philadelphia schools. In each case, we took field notes and used this
information to triangulate findings from the teacher and principal interviews and to help
contextualize our findings from teacher observations and interviews.
Collection of relevant artifacts. We collected copies of all 3rd- and 5th-grade
interim assessments in mathematics given in the 2006-07 school year. We also
purchased the 3rd- and 5th-grade EM program in order to better understand the learning
goals that were to be achieved during this study. We acquired copies of both districts’
pacing guides and of any additional district-wide assessments that were made available
to us. In many cases, we collected examples of teacher classroom assessments and, in
some cases, teachers offered blinded examples of student work on the interim
assessments. As mentioned above, a few teachers had constructed their own data
organization templates, and, when possible, we collected copies of these as well.
Teacher survey: Content Knowledge for Teaching-Math (CKT-M). Following
our final teacher interview, we distributed a survey designed to measure our participating
50
Chapter 2: Methodology
teachers’ mathematical knowledge for teaching. This survey was composed of nine
multiple-choice items from the CKT-M instrument, focusing on K-8 numbers and
operations. The CKT-M was developed by researchers at the University of Michigan to
measure “the knowledge teachers use in classrooms, rather than general mathematical
knowledge [emphasis in original]” (Hill, Rowan, & Ball, 2005, p. 387; see also Hill,
Shilling, & Ball, 2004). We chose to administer the CKT-M to our sample of teachers so
that we could investigate the relationship between this specific type of mathematical
content knowledge and teachers’ use of information from interim assessments in
mathematics.
The CKT-M creators chose nine items to maximize reliability while lessening the
time burden on teachers to complete the survey. Information gained from these items
was intended to be sufficient to categorize participating teachers into three groups: those
with high-, average-, and low-mathematical knowledge for teaching, relative to the other
teachers in our sample. Teachers received a $25.00 gift cheque upon completing the
CKT-M, and response rates were high. The response rate for Philadelphia teachers was
over 90%, and for Cumberland teachers was 64%.
Data Analysis
Analyzing and triangulating data across multiple sources required several steps.
First, interview data were coded using a framework developed and refined by the
research team that was aligned with the study’s conceptual framework. Second, multiple
observations were consolidated for each teacher to identify patterns or characteristics of
individual teachers’ practice that were observable across observations. Third, using a
combination of coded interview data and observation write-ups, profiles of assessment
practice were constructed for each teacher in the study. Fourth, teacher responses to
51
Chapter 2: Methodology
the two misconception scenarios (fall and spring interviews) were analyzed to construct
a typology of teacher responses to student misconceptions or errors. Finally, teacher
profiles and responses to misconceptions were analyzed in relation to individual teacher
MKT scores to explore relationships between teachers’ mathematical content knowledge
and their assessment practices.
Interview data. All interviews were professionally transcribed and analyzed
using Atlas.Ti qualitative data analysis software. The study’s conceptual framework was
used to develop an extensive set of codes, which were used to sort interview data into
descriptive categories. This code set had five primary domains. The first three domains
related to steps of the cycle of instructional improvement as presented in our conceptual
framework: data collection, data analysis, and action. The fourth domain focused on
position-based roles (e.g. principal, instructional coach) that were instrumental to the
interim assessment process. A fifth domain captured data related to how the use of
interim assessments was supported through professional development, coaching, or
other processes; and a sixth domain focused on curriculum. Additional codes were
added to mark specific segments of interviews (e.g. data or misconception scenarios); to
capture specific participant expectations, satisfaction, or desires about the use of interim
assessments; or to identify other important school or district factors (e.g. descriptions of
the accountability system or school leadership) that might influence the use of interim
assessments.
Each code was clearly defined by the research team; definitions were refined and
modified through multiple rounds of trial coding. In this process, all members of the
research team coded a single interview independent of one another, and then worked
collaboratively to refine and clarify the codes to ensure greater consistency across
analysts. Once an acceptable level of consistency was reached, individual researchers
were assigned groups of teachers, for which they coded all three interviews.
52

Chapter 2: Methodology
Once the entire data set was coded, data could be retrieved using a query
function that could include a single code, or multiple codes in relation to one another. In
addition, the data set could be filtered by individual, school, district, position and grade
level, allowing for targeted retrieval of data from subsets of the study sample.
Teacher profiles. Teacher profiles were constructed for all teachers for which
multiple interviews and observations were available (n=39). The profiles consolidated
data from interviews and classroom observations, focusing on how individual teachers
collected, interpreted, and acted on assessment information in three domains:
• Benchmark assessments/practice tests: interim-scored assessments
designed to measure the progress of an entire class over an extended period of
time.
• Short-cycle assessments: practices employed by teachers within a single class
period to determine the extent to which students grasp a specific concept or task.
• Teacher-developed assessments: tools developed or adopted by teachers to
gauge student understanding. While some teacher-developed assessments may
also be short-cycle assessments, others may extend across multiple class
periods.
Teacher profiles were constructed using a two-step process. First, the data base
was filtered by teacher and several specific queries were run. In total, data were
retrieved for codes related to all aspects of interim assessment use, short-cycle
assessment, teacher-administered tests and quizzes, interpretive or diagnostic
processes, action based on analysis of assessment data (all types) and response to
student misconceptions. These data were used to populate a matrix organized by steps
in the cycle (collection, interpretation, action) and formative assessment type (interim,
short-cycle, and teacher-developed). Second, classroom observation notes were
53
Chapter 2: Methodology
reviewed to identify tendencies, routines, or practices that were consistent across
multiple observations, and to cross-reference those with the categorized and reduced
interview data.
The profiles served three important purposes within the analysis. First, they
consolidated and reduced a large amount of teacher-level data around themes and
categories most central to an analysis of classroom practice. Second, they provided a
more detailed view of teacher assessment practice as a whole, rather than focusing
solely on interim assessments. This allowed the research team to analyze how interim
assessments were situated with a broader range of teacher routines and practices.
Finally, teacher profiles served as an important point of comparison with other classroom
level measures such as the MKT and misconception scenarios.
Misconception scenarios. As mentioned above, the goal of the misconception
scenarios was to learn: a) whether or not teachers could identify student errors in
mathematics and what these errors told them about students’ thinking, b) what questions
they would ask students to learn the extent to which their own interpretations were
correct, and c) what instructional steps they would take to address particular
misconceptions. An, Kulm, and Wu (2004) devised scenarios and a categorization rubric
to examine teacher response to student understanding of mathematical concepts. Based
on a four-part conceptual framework of Knowing Students’ Thinking, these researchers
describe ways in which teachers report that they would: a) address students’
misconceptions, b) engage students in math learning, c) build on students’ ideas, and d)
promote students’ thinking in mathematics. This analysis rubric is designed to identify
and describe practices that have been hypothesized to contribute to “learning
mathematics with understanding,” (Carpenter & Lehrer, 1999), the primary goal of the
National Council of Teachers of Mathematics (NCTM, 2000).
54
Chapter 2: Methodology
Because our research goals and scenario items are nearly identical to those of
An, Kulm, and Wu, we used their rubric to analyze the data from our misconception
scenarios. At first, we anticipated that we would need to slightly adapt their rubric for
elementary school teachers, but it turned out that this was not necessary as their
categories were directly relevant to our teachers’ responses, and no additional
categories were needed to describe our teachers’ thinking. As shown in Table 2.1,
teachers’ responses to the misconception scenarios were coded using one or more of
the following components from An, Kulm, and Wu (2004). The number of practices
reported as addressing, engaging, building, or promoting was summed for each teacher.
Quality of response was not coded in this analysis, although in order for a practice to be
counted, the teacher had to provide enough detail so that the particular instructional
practice could be understood. For example, a simple response of “I use manipulatives”
would not be counted, while a response of “I use base-10 blocks” or “I use paper cutting
to focus their attention” would be counted.
55

Chapter 2: Methodology
Table 2.1. Codes for the Misconception Scenarios (in abbreviated form)
Components of Knowing Student Thinking
Codes
a) Addressing students’ misconceptions
• Address or identify students’ misconceptions
• Use questions or tasks to correct misconceptions • Use rule or procedure • Draw pictures or table • Connect to concrete model
b) Engaging students in math learning • Manipulative activity • Connect to concrete model • Use one representation • Use more than one representation • Give example
• Connect to prior knowledge
c) Building on students’ math ideas • Connect to prior knowledge • Use concept or definition • Connect to concrete model • Use rule or procedure d) Promoting students’ thinking about mathematics
• Provide activities to focus on students’ thinking
• Use questions or tasks to help students progress in their ideas
• Use estimation • Draw picture or table • Provide opportunity to think and respond
One member of the research team coded the misconception scenarios. Because
prompting was inconsistent across the interviews, only teachers’ initial responses were
coded; in other words, teachers’ responses that followed a researcher’s prompt were not
coded for this analysis. However, if a teacher responded to a researcher’s request for
clarification, that clarification was coded.
After the data set was coded, data could be retrieved using a query function that
could include a single code, or multiple codes in relation to one another. In addition, the
data set could be filtered by individual, school, district, position and grade level, allowing
for targeted retrieval of data from subsets of the study sample. The resulting codes were
also entered into SPSS to facilitate linking with other quantitative measures and to
56

Chapter 2: Methodology
improve data presentation. The descriptive statistics for these codes are presented in
Table 2.2.
Table 2.2. Descriptive Statistics of KST Practices (n=31)
Minimum Maximum Mean SD
Addressing 1 8 5.13 1.65
Engaging 0 6 2.67 1.71
Building 0 6 2.35 1.62
Promoting 0 5 2.45 1.73
Total KST practices
3 20 11.80 4.41
MKT scoring. The returned CKT-M surveys were scored and double checked by
two members of the research team. The data was entered into SPSS. In keeping with
recommendations from the CKT-M development team, the number of items each
teacher got correct was transformed into a z-score, indicating his or her rank among the
sample. The use of z-scores is appropriate in this instance because our analytic goal is
to explore the possible reasons for and consequences of variation in MKT within our
sample and not compare individuals or groups in our sample to any external criterion.
We have found that this method of scoring has made the administration of the CKT-M
more friendly for teachers, administrators, and unions, who may be understandably
reticent to participate in any process that resembles a non-contractual performance
evaluation.
57

Chapter 2: Methodology
Because the number of items administered was adequate only to form three
categories of teachers (see above section on Data Collection), the distribution of z-
scores was then examined for potential groupings (see Figure 2.3). This examination
revealed a slightly bimodal distribution with peaks both below -1.00 SD and above 1.00
SD. This led us to create a categorical variable for each teacher indicating low (below -
1.00 SD), medium (between -1.00 and 1.00 SD), or high (above 1.00 SD) levels of MKT,
with 8 teachers in the low group, 17 teachers in the medium group, and 7 teachers in the
high group.
58

Chapter 2: Methodology
References
An, S., Kulm, G., & Wu, Z. (2004). The pedagogical content knowledge of middle school mathematics teachers in China and the U.S.. Journal of Mathematics Teacher Education, 7, 145-172.
Carpenter, T.P., & Lehrer, R. (1999). Teaching and learning with understanding. In E.
Fennema & T. Romberg (Eds.), Mathematics classrooms that promote understanding, (pp. 19-32). Mahwah, NJ: Erlbaum.
Hill, H.C., Rowan, B., & D.L. Ball. (2005). Effects of teachers’ mathematical knowledge
for teaching on student achievement. American Educational Research Journal, 42, 371-406.
Hill, H.C., Schilling, S.G., & D.L. Ball. (2004). Developing measures of teachers’
mathematics knowledge for teaching. The Elementary School Journal, 105, 11- 30.
National Council of Teachers of Mathematics (NCTM). (2000). Principles and Standards
for School Mathematics. Reston, VA: NCTM. Stecher, B., Le, V-N., Hamilton, L., Ryan, G., Robyn, A., & Lockwood, J.R. (2006). Using
structured classroom vignettes to measure instructional practices in mathematics. Educational Evaluation and Policy Analysis, 28, 101-130.
59

CHAPTER 3
The District and School Role in Interim Assessments1
This chapter addresses the question: What policy supports at the school and
district levels enhance effective use of interim assessments? It presents separate case
studies of Philadelphia and Cumberland, describing each district’s curricular and interim
assessment policies; district and school expectations for the use of interim assessment
results; and district and school supports for analyzing and responding instructionally to
these data, such as IMSs, instructional support for teachers and students, and time. The
chapter concludes with a comparison of the district and school roles in the two sites.
The findings are based on interviews with district staff, principals, instructional coaches
and teachers in the study schools; document review; and observation of district
meetings. The succeeding chapters examine how these policies and supports affected
teacher use of interim assessments.
Philadelphia
The district context. District-wide assessment has been an integral part of
Philadelphia’s education reforms for nearly 30 years. Over this time, test results have
been used for both accountability and instructional purposes. The centerpiece of
Superintendent Constance Clayton’s 12-year administration (1980-92) was the K-12
Standardized Curriculum, which was accompanied by a pacing guide that laid out a
week-by-week schedule for instruction and a criterion-referenced test aligned with the
district curriculum and administered annually. When David Hornbeck became
superintendent in 1994, he brought standards-based reform to Philadelphia through the
1 This chapter was written by Margaret E. Goertz and Nancy R. Lawrence.
60

Chapter 3: The District and School Role in Interim Assessments
Children Achieving initiative. The district abandoned the Standardized Curriculum and
citywide tests as emphasis shifted from teachers covering a prescribed curriculum to all
students meeting rigorous performance standards. Although a curriculum did not initially
accompany new locally developed standards, at the request of school-based educators,
district leaders issued Curriculum Frameworks in 1998 that offered teachers more
specific instructional activities and strategies for all subjects by grade level. In
Philadelphia’s first move toward accountability based on student achievement, the
District adopted the SAT-9. The test became an important part of a Performance
Responsibility Index that was used to reward or sanction schools based on their
progress toward meeting district-established targets (Corcoran & Christman, 2002).
In 1998, in response to the chronically low performance of Philadelphia and other
school districts, the Pennsylvania legislature enacted the first of two bills that enabled a
state takeover of Philadelphia (Boyd & Christman, 2003; Maranto, 2005). In December
2001, the district and state compromised on a “friendly takeover” that included replacing
the School Board with a new School Reform Commission (SRC). Three of the SRC’s
members are appointed by the governor, and the remaining two are appointed by the
mayor. Six months later, the SRC hired former Chicago Public Schools CEO Paul
Vallas to head the Philadelphia district. One of Vallas’ first initiatives was to institute a
districtwide Core Curriculum in four academic subjects for Grades K-8. In 2003-04, the
District added a requirement that all elementary school students have 120 minutes of
literacy and 90 minutes of mathematics per day, based on the Core Curriculum (Travers,
2003). Increased testing, including the six-week formative benchmark tests, also
accompanied the new Core Curriculum (Useem, 2005).
In addition, the district introduced two new performance and IMSs districtwide—
SchoolNet and SchoolStat. In 2003, the district contracted with SchoolNet Instructional
Management Solutions (SchoolNet) to organize and disseminate individual and
61

Chapter 3: The District and School Role in Interim Assessments
aggregate benchmark assessment data and to make assessment data immediately
accessible to teachers and principals. As discussed later in the section on District
Supports, SchoolNet is not only a IMS, but provides a set of analytical and instructional
tools aligned with the Core Curriculum to teachers, principals, and families. SchoolStat
was launched by the district and the University of Pennsylvania’s Fels Institute of
Government. During the 2003-04 school year, SchoolStat was rolled out to 15
elementary schools and was expanded districtwide by late spring of 2005. As described
later in this chapter, SchoolStat compiled and compared school-level data on student
performance and behavior and student and teacher attendance. At the time of our
study, this tool was used at regular meetings of regional superintendents with their
principals, and at meetings of the regional superintendents as a group with the district’s
chief academic officer, to discuss the status of and ways to improve climate and
achievement at their schools.2
Curriculum and benchmark tests. Philadelphia has been using a uniform
curriculum in mathematics that supports the state mathematics standards since
September 2003. In Grades K–5, the scope and sequence of this curriculum is tightly
aligned with the organization of the Everyday Mathematics (EM) program. The district
also produced a K-8 Planning and Scheduling Timeline (PST) that provided pacing for
teachers at six-week intervals tied to the EM program at each grade level. The PST
detailed the skills, topics or content to be taught during each instructional week linked to
specific lessons in the course materials, the state standards and the district’s Core
Curriculum; identified the content that will be tested on the state assessment, the
Pennsylvania System of School Assessment (PSSA), and provided links to sample
2 The SchoolStat contract was canceled in 2007, a casualty of budget cuts. While some regional superintendents have tried to maintain the monthly data reviews, the data are not as readily available as they were in the past.
62

Chapter 3: The District and School Role in Interim Assessments
PSSA items; and recommended related resources and instructional practices (School
District of Philadelphia, 2006a).
The school district administered benchmark assessments in Grades K–8 to give
teachers feedback relative to the students’ understanding of the topics taught in six-
week intervals. As illustrated in Figure 3.1, each cycle of instruction and assessment
consisted of six weeks: five weeks of instruction at the end of which the benchmark
assessments were administered and a sixth week of review and/or extended
development of topics. These benchmark assessments met Perie, Marion, and Gong’s
(2009) definition of interim assessments. They evaluated students’ knowledge and skills
relative to a specific set of academic goals within a limited period of time, were designed
to inform decisions at the classroom, and could be aggregated for use at the school and
district levels.
Although the six-week period crossed units of study, each benchmark
assessment was designed to test only those concepts and objectives taught since the
previous assessment. The district administered benchmarks in mathematics to students
in Grades 3-8. All 20 of the items (25 items in Grade 8) in the benchmark assessments
were in a multiple-choice format and came directly from the concepts and skills in the
PST. The test developer and the district maintained that the distractors for each item
contained instructionally valuable information about students’ mathematical
understanding of concepts and skills.
63
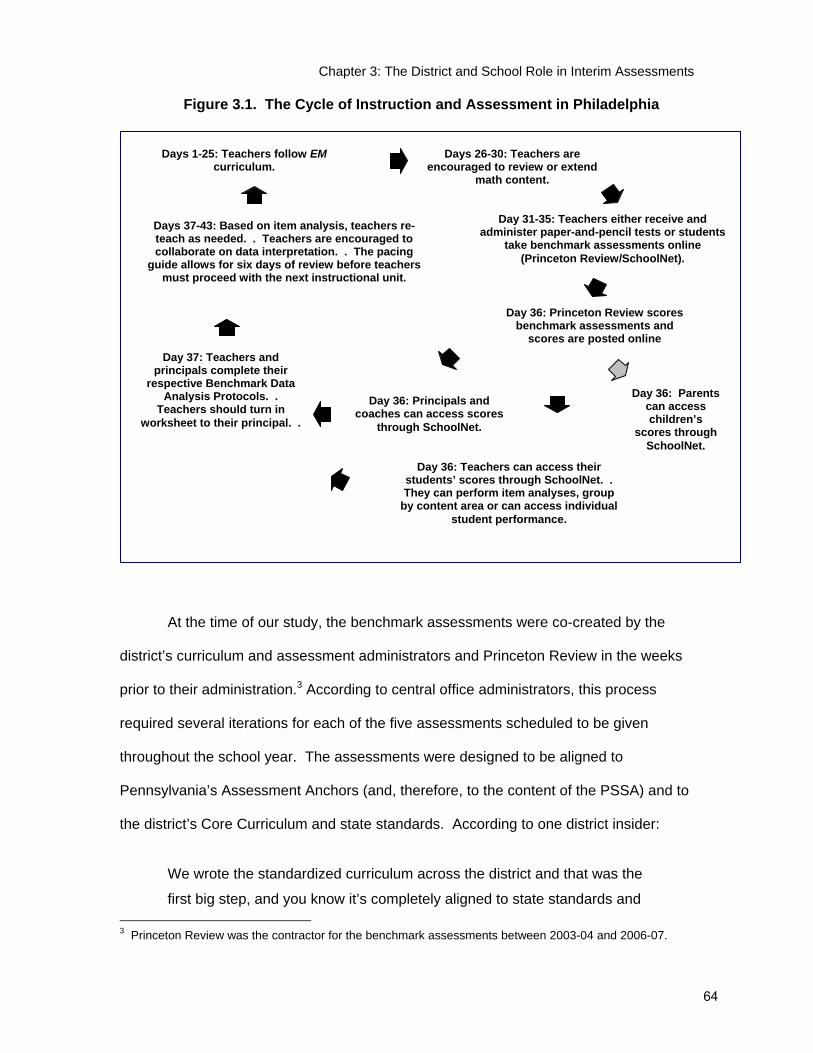
Chapter 3: The District and School Role in Interim Assessments
Figure 3.1. The Cycle of Instruction and Assessment in Philadelphia
At the time of our study, the benchmark assessments were co-created by the
district’s curriculum and assessment administrators and Princeton Review in the weeks
prior to their administration.3 According to central office administrators, this process
required several iterations for each of the five assessments scheduled to be given
throughout the school year. The assessments were designed to be aligned to
Pennsylvania’s Assessment Anchors (and, therefore, to the content of the PSSA) and to
the district’s Core Curriculum and state standards. According to one district insider:
We wrote the standardized curriculum across the district and that was the
first big step, and you know it’s completely aligned to state standards and 3 Princeton Review was the contractor for the benchmark assessments between 2003-04 and 2006-07.
Day 31-35: Teachers either receive and administer paper-and-pencil tests or students
take benchmark assessments online (Princeton Review/SchoolNet).
Day 37: Teachers and principals complete their
respective Benchmark Data Analysis Protocols. .
Teachers should turn in worksheet to their principal. .
Days 37-43: Based on item analysis, teachers re-teach as needed. . Teachers are encouraged to collaborate on data interpretation. . The pacing
guide allows for six days of review before teachers must proceed with the next instructional unit.
Day 36: Principals and coaches can access scores
through SchoolNet.
Day 36: Teachers can access their students’ scores through SchoolNet. . They can perform item analyses, group
by content area or can access individual student performance.
Days 26-30: Teachers are encouraged to review or extend
math content.
Days 1-25: Teachers follow EM curriculum.
Day 36: Princeton Review scores benchmark assessments and
scores are posted online
Day 36: Parents can access children’s
scores through SchoolNet.
64

Chapter 3: The District and School Role in Interim Assessments
we broke it down into content descriptors and then we made sure it was
at the proficient level… We divided the whole curriculum for the 3-8—the
high schools quarterly, it’s a little bit different—into six-week chunks so
you teach for five weeks, you test exactly what was taught, you see
whether or not the students learned what was taught, and then you take a
week to re-teach or enrich based on the data and that’s really the
premise.
Although these assessments were regularly touted as being aligned to the Core
Curriculum and state standards, no developer, district, or independent alignment
studies were conducted on the benchmark assessments. During the course of
this study, we found that a lack of follow-up studies on interim assessments is
common practice for districts and developers; in fact, during the professional
development sessions that we attended, no one challenged these alignment
claims. Similarly, although the District referred to these assessments as “reliable
and valid,” no reliability or validity evidence was presented to practitioners and
the district assessment office admitted that the psychometric properties of these
assessments had not been investigated.
While the benchmark items assessed the same content as the PSSA, they were
not mini-PSSA assessments. The content and formats of the two tests differed, with the
PSSA containing open-ended as well as multiple-choice items. This difference led
teachers in our study to conduct separate PSSA test preparation activities throughout
the year, and for some educators to question the alignment of the two assessments.
One district administrator, for example, agreed that the benchmarks were conceptually
aligned with the PSSA, but felt that the benchmark assessments in mathematics were
easier than the state test.
65
Chapter 3: The District and School Role in Interim Assessments
The benchmarks and the PSSAs? Of course, the standards are there but
the level of questions….When you look at the sample [PSSA] questions,
one thing that strikes you…is the amount of reading, even in math. And
there are a few sentences, three sentences, four sentences that the kids
have to read carefully and understand in many of the mathematics PSSA
problems. But in this very same concept, we test [on the benchmarks] by
reducing the amount of reading. So, although we must say that it’s the
same concept, but it’s not the same.
District expectations for use. Perie, Marion, and Gong (2009) discuss three
core purposes for interim assessments—instructional, evaluative, and predictive.
Instructional purposes enable educators “to adapt instruction and curriculum to better
meet student needs” (p. 7). Examples of such purposes include enriching the
curriculum, determining students’ strengths and weaknesses, and providing feedback for
students. Interim assessments that serve an evaluative purpose provide information
designed to allow educators at the school or district level to make changes at the
programmatic level to improve instruction and, ultimately, student performance. Such
evaluative purposes can also serve to “enforce some minimal quality through
standardization of curriculum and pacing guides” (p. 8). Finally, predictive purposes for
an interim assessment are primarily that they “are designed to determine each student’s
likelihood of meeting some criterion score on the end-of-year tests” (p. 8).
Philadelphia’s Office of Curriculum has identified multiple purposes for the
benchmark assessments:
• To provide PSSA practice for students by simulating rigor, types of questions
and building test-taking stamina;
• To provide teachers, administrators, students and parents with a quick
snapshot of student progress;
• To determine if what is taught is what is learned;
66

Chapter 3: The District and School Role in Interim Assessments
• To help teachers reflect on instructional practices; and,
• To provide data to assist in instructional decision-making (School District of
Philadelphia, 2007).
Overall, these purposes reflect a primarily instructional function for Philadelphia’s
benchmark assessments. Evaluative and predictive purposes came into play as well,
but the explicit link between these assessments and PSSA practice was not included in
district descriptions of the benchmark assessments until after our study commenced.
District leaders also set expectations for how schools should organize to analyze data
and for school leadership in the use of the benchmark tests.
Instructional use. At their core, the benchmarks were intended to be, in the
words of several district leaders, “teaching tools” —that is, tools that would provide
support to teachers’ instruction through timely information about what their students
were and were not learning. The theory of action underlying this aspect of the
benchmark instruction and assessment cycle was that a teacher would teach subject
matter from the Core Curriculum for five weeks. During the fifth week, students would
take the benchmark test. Teachers would analyze results from the benchmark test (from
the Item Analysis Report, discussed below) and, based on this information, would design
a sixth week of instruction that would provide remediation for students in areas of
weakness and enrichment in areas of strength. Consequently, students would make
more progress towards mastering the concepts taught. After the sixth week, the cycle
would begin again with new subject matter. When asked, “What would it [use of
benchmark data] look like hands-on for teachers in the ideal?” one district leader
responded:
Well, we’ve asked them ‘how might you re-group students on certain skills
and knowledge.’ Like you say, you know what, there’s a whole group of
67

Chapter 3: The District and School Role in Interim Assessments
kids who missed this but there’s another group that really got it. And
most of our standard statements, there’s more than one question, so we
can tell they either got them all right, all wrong, or mixed. So, you know,
you kind of get a handle whether they might have guessed. And so they
may re-group students, they may use different resources, they may team
up with another teacher who might have a better handle on mathematics,
or one that has a better handle on literacy, and, you know, kind of switch
rooms. There’s so many different things they can do.
District leaders identified additional instructional expectations for teachers, such as
reflecting on their instruction, expanding their instructional repertoire, planning or
modifying curriculum, and asking school leaders for instructional support.
Organizational expectations. While the primary focus of central office staff
members was on the use of benchmark results by individual teachers, they also
expected that various groups in the school—especially grade groups—would examine
the data, exchange strategies, and share instructional practices. This interest in having
groups of teachers regularly discuss the benchmarks and their students’ performances
was consistent with an emphasis on benchmarks serving instructional purposes. As one
district leader explained:
The expectation is that the 3rd-grade teachers will sit at a table with each
other and say, “Here’s how my kids did on item 1. How did your kids do?
Whoa! My kids didn’t do well. Your kids all nailed it. Tell me how you
taught that? Alright, I’ll go back and I’ll try that.” That’s supposed to
happen item by item.
This expectation was shared by principals in several of the study schools who
reported scheduling common planning time for teachers in similar grades. There was
awareness at the district level, however, that not all schools might be organized in such
68

Chapter 3: The District and School Role in Interim Assessments
a way as to provide dedicated time for grade-group teachers to meet. As one district
respondent noted:
In some schools they do, but not as frequently as they would like to, [to]
meet together in grade groups and discuss, “Well my kids did this on this.
Yours did that. What did you do?”
District leaders had expectations that principals would collaborate with fellow
principals as well on how to raise student achievement. This sharing was facilitated by
monthly SchoolStat meetings among principals in a specific region and their regional
superintendent. As described in a subsequent section, Communicating Expectations,
the intent of the meetings was to support principals’ analysis and use of data to identify
and solve problems and to provide an opportunity for principals to share effective
practices. Another goal was to create a new communications network across schools
(horizontal) and between schools and the district (vertical) that was focused on common
data, goals, and targets (Patusky, Botwinik, & Shelley, 2007).
Leadership expectations. The district looked to principals to provide leadership
to enable teachers to use the benchmarks as intended. District leaders realized that
teachers’ use of the benchmarks would be limited unless strong, supportive, committed,
and engaged leadership was present in schools. More specifically, the district expected
principals to create a professional climate that encouraged organizational learning
through inquiry, reflection, and informed action and to dedicate collaboration time
immediately after the benchmark results were reported for teachers to discuss and
analyze the benchmarks. One district leader described the principal’s role in this way:
To give teachers the time to have the conversation to plan instruction and
to support the teachers in doing what they need to do as far as giving
them the resources, the professional development, the climate to feel
69

Chapter 3: The District and School Role in Interim Assessments
safe to talk about what they know and what they still need to learn
themselves.
Principals were expected to monitor teachers’ data-driven instruction by, for example,
observing classes.
The district expected school leaders to use school-wide data for more evaluative
purposes as well. The district identified benchmark results as one form of data schools
should analyze in developing their annual School Improvement Plans. Principals were
also expected to use these data to identify the professional development needs of their
faculty and the programmatic needs of their students.
Communicating expectations. The district communicated its expectations for
the use of the benchmark assessments through its scheduling timelines, the structure of
its IMS, the formats of reports, principal meetings, and dissemination.
First, and foremost, the district teaching schedule dedicated the sixth week in
each cycle to review, remediation and enrichment based on teachers’ analyses of the
benchmark results.
Second, SchoolNet incorporated multiple ways for teachers and principals to
analyze data from the benchmark assessments. Described in greater detail in District
Supports, this information management system (IMS) provided data on how individual
students and every class performed on each item, on the entire benchmark test, and
against each tested standard. Results could be arrayed by student, test item, and/or
skill and standard.
Third, the district required teachers and principals to complete Benchmark Data
Analysis Protocols (BDAP) based on the Item Analysis data generated by SchoolNet.
The protocol was designed to help teachers think through the steps of data analysis and
action and to create an opportunity for teachers to reflect on their instruction. The form
asked teachers to respond to the following questions:
70

Chapter 3: The District and School Role in Interim Assessments
• Using the Item Analysis Report, identify the weakest skills/concepts for your
class for this benchmark period.
• How will you group or regroup students based on the information in the
necessary item analysis and optional standards mastery reports? (Think about
the strongest data and how those concepts were taught.)
• What changes in teaching strategies (and resources) are indicated by your
analysis of benchmark reports?
• How will you test for mastery?
Teachers were also asked (but not required) to complete a single-page
“Teacher’s Reflection” protocol along with their BDAP. This Reflection protocol also
encouraged teachers to reflect on their instructional practices and prompted them to
identify their professional development needs in response to the following:
• In order to effectively differentiate (remediate and enrich), I need to…
• Based on patterns in my classes’ results, I might need some professional
development or support in…
One district administrator argued that the protocols fulfilled their role in communicating
the purpose of the benchmark assessments:
The advent of the benchmark protocols, data protocols, has really helped
to elevate the importance of the interim assessments, and to clarify the
expectations around [them]. I think they have gone a long way in terms of
reaching everyone. And I’m not certain, but I would venture to say that if
you were to ask ten teachers in the district, at least nine should be able to
clearly articulate what the benchmarks are and what they do with them.
Fourth, the district highlighted student performance on benchmark assessments
through monthly principal meetings hosted by each region’s superintendent. Principals
71

Chapter 3: The District and School Role in Interim Assessments
completed BDAP on their schools and reviewed these reports with their regional
superintendents. SchoolStat meetings provided another opportunity for the district to
build a culture of data use. SchoolStat staff compiled benchmark assessment and other
student performance and behavioral data (e.g., suspensions, incidences of violence, and
student and teacher attendance) and created and reported Key Performance Indicators
that tracked each school’s performance over time (on a monthly basis) and/or compared
its performance to target outcomes as well as average performance in the school’s
region and districtwide. At monthly SchoolStat meetings, the regional superintendents
led principals of schools with similar grade spans through a discussion of these data,
with the goal of identifying root causes of problems, exchanging best practices and
strategies, and developing action plans and outcomes for their schools. The results of
these actions would be reviewed at subsequent meetings in a Plan-Do-Study-Act
continuous improvement model (Patusky, Botwinik, & Shelley, 2007).
Finally, the district communicated its expectations for assessment and data use
through meetings, presentations, and dissemination of materials to principals and
teachers. District staff held webinars and posted PowerPoint presentations that
described the benchmark assessments, their intended use, and their alignment with the
district’s Core Curriculum and state standards and assessments. These documents
emphasized that the benchmark results could be used to provide data for instructional
decision making, to help teachers reflect on their instructional practice individually and
through discussions with their colleagues, and to provide students “with new learning
opportunities to understand skills and concepts” (School District of Philadelphia, 2007).
The district’s School Handbook explained that student performance on the benchmark
tests could not be used to calculate report card grades, but rather to “guide what should
be re-taught or enriched” (School District of Philadelphia, 2005). Other materials on the
72

Chapter 3: The District and School Role in Interim Assessments
district website highlighted the importance of using of data for instructional and school
improvement (see for example, School District of Philadelphia, 2006b).
School expectations for assessment use. Principals4 in Philadelphia accepted and
reinforced the district’s expectations concerning the use of assessment data by requiring
their teachers to analyze interim assessment data and expecting them to use results to
inform their instruction. As one principal noted:
The way the Core Curriculum is designed, the teachers know that every
six weeks, the benchmarks is an assessment to see how much the kids
learned….Once they do the test, they get the results back. So it really
creates this kind of forum for really trying to go back and being reflective
to look at your data, and that your data should really drive your
instruction. (P6)
Another principal explained:
I want them basically to find out what needs to be re-taught. What
standards did they hit? What standards did they miss? The standards you
miss, I want you to go back and teach it. But I don’t want you to re-teach
it the same way, because my opinion is if you taught it the first time and
they didn’t get it, going back and teaching it again the same way is not
going to cut it….And I tell them up front, “I need you to really use that re-
teaching week to address those standards that we’re not hitting.” So from
Day One we talk about that. So I know I put a push on it. I’m constantly
talking about it. (P4)
Principals communicated their expectations by modeling data analysis and by
monitoring teachers’ use of the data. First, they conducted their own analysis of interim
assessment results to identify struggling students; areas of weak skills within a grade
level; and/or teachers whose class might be falling behind others in a grade level. One
4 Throughout this report principal interviews are coded by school name and school number. For example, all principal quotations are coded as either “P” (Philadelphia) or “C” (Cumberland) and by school number (e.g., P6).
73

Chapter 3: The District and School Role in Interim Assessments
principal’s description of his actions was typical of the study schools in Philadelphia. He
did an initial review of the benchmark results for the school to determine how students
performed. A next step was to look at performance within and across grade levels to
identify common areas of weakness to see if there were specific skills that needed
attention. The principal also used this analysis to identify teachers who might be
struggling with teaching a concept.
And then a lot of times what I’ll do is look at it and compare with another
class and say, you know, “Maybe you should talk to Mrs. So-And-So
because when she did time, her kids did a lot better. So maybe she can
give you some feedback or strategies that will be successful with the
children who didn’t. (P6)
The principals also examined subgroup performance. One principal identified a gap in
performance between boys and girls in his school; another focused on the performance
of African-American students. A third principal followed the performance of his special
education students, looking at the effects of a new inclusion program that had been
implemented in some classrooms. One study school created a “data wall” tracking
benchmarks over time.
Second, all of the study school principals reviewed results of the interim
assessments with teachers in each grade group in their school. The principals used this
opportunity, particularly in the early years of SchoolNet, to assist teachers in their
analysis of data and over the years to discuss with teachers possible explanations for
student performance and to identify instructional responses. As one principal noted:
I try to go to the grade-group meetings. I try to really prioritize if I see a
need in a certain grade, maybe they went down a little bit—I want to know
why. And I can hear the teachers. They turned in their reports to me and
I read it, [but] sometimes I need to be there and hear it so I can ask those
74

Chapter 3: The District and School Role in Interim Assessments
pertinent questions and that’s helpful. And I want to know what’s working.
If somebody else is up here all the time, maybe I need someone to give
them some time out of their classroom to come in your classroom to see it
first hand. (P4)
Third, the principals required teachers to submit the BDAP and Reflection sheets
(although the latter was not required by the district), and, in many cases, provided direct
feedback to teachers. A few principals reported comparing teachers’ analysis of student
data with their own, and some principals looked for evidence of re-teaching strategies as
they reviewed their teachers’ lesson plans for the sixth week of teaching. Principals in
our study schools discussed the importance of monitoring teacher use of the benchmark
data. One principal explained, “I feel what gets monitored gets done. So if people know
that they’re being monitored and they’re accountable for something, I think they’ll do
better at it.” (P6) Another principal described her approach:
I will leave a note in their lesson plan. They will be at my door, pleading
their case, telling me what’s wrong about this particular child or that
particular child that I may have in question. And then we sit down and
talk about the kid and figure out what are we going to do with the kid or
what we need to do with their class because, like I said, your class—
Overall you may have maybe 70% of the kids getting the wrong answer
on this question. What is wrong with that question? What is going on
with that particular skill? But, usually, I don’t have to go chase them
down. They willingly come. They don’t want those little notes in the
lesson plan. (P5)
Still another principal looked for evidence that the teacher has indeed implemented a
different instructional approach.
If you say to me you’re using T charts, and then you use the four square
approach, I should see that. There should be something in your room, or
there should be something the kids have hanging up. Or there should be
75

Chapter 3: The District and School Role in Interim Assessments
something. That’s my only evidence that you’re doing something
different, because you can put anything on a piece of paper. I want to
see proof that you’ve done it. (P4)
The teachers we interviewed concurred that the purpose of benchmarks was to
help inform their instruction. Typical of responses about the purpose and use of the
tests were:
To analyze them and to correct errors, help the children wherever their
shortcomings, to correct it and to re-teach and to reemphasize what you
didn’t teach right the first time or what they didn’t get the first time to
improve. (P6)
See their weaknesses so that we can re-teach, find different ways to re-
teach it different than what you did before and help them to master it.
(P1)
Teachers reported that these expectations were communicated to them by their
principals during professional development sessions on SchoolNet and/or through grade
group and other meetings where they analyzed the benchmark data, and through the
requirement that they complete their BDAPs. One teacher commented that they were
expected to “fill out the reports, work on the skills.” (P3) Teachers also reported that their
principals required them to plan lessons for the re-teaching week based on results of the
benchmark assessments. Few of the teachers we interviewed, however, said they
received feedback on either their BDAPs or lesson plans. Some teachers thought this
might be because their students were performing adequately on the benchmark tests.
Finally, teachers felt a press from their principals to “do better the next time” on the
benchmarks tests. One teacher explained, “Our principal, she’s used to achieving, and
so if you don’t do well, you do get talked to.” (P3)
76

Chapter 3: The District and School Role in Interim Assessments
The principals reflected the district’s organizational and evaluative expectations
as well. They expected teachers to meet in grade groups to examine data, exchange
strategies, and share instructional practices. To facilitate this activity, principals
scheduled common planning time for teachers in the same grade. Some of the
principals also dedicated school professional development time to discussing benchmark
results. The schools also used benchmark data as an additional measure of student
performance in their School Improvement Plans.
Accountability. The preceding analyses show that the primary expectations for
benchmark use was formative—to help teachers improve classroom instruction. District
leaders would hold principals accountable for ensuring that teachers used data from the
benchmark assessments, but not for the results of the tests. However, the use of
benchmarks as part of the SchoolStat process heightened school-based leaders’
perception that benchmarks were also summative and, indeed, part of the district’s
accountability system. Discussion of benchmark results occurred in settings where
administrators from central and regional offices—some of whom had line and rating
authority for principals—were present. A school’s performance on the benchmark tests
was compared to other schools in a public setting. While the intent of the “compare and
contrast” approach of the SchoolStat meetings was to create a “positive tension between
collegiality and competition” (Patusky, Botwinik, & Shelly, 2007, p. 24) that would
generate constructive dialogue among participants, some educators saw the meetings
changing the purpose of the benchmark assessments. As one regional superintendent
noted:
This past year with SchoolStat, it now became summative. And all of a
sudden this formative data become summative, and for me, it sort of lost
the essence of how do we improve practice in the classroom? And I don’t
believe that…these benchmarks are a summative thing. I mean, nobody
77
Chapter 3: The District and School Role in Interim Assessments
said that they were high stakes test, yet we’re treating them as high
stakes tests.
Principals concurred. And either wittingly or unwittingly, the accountability press was
transferred down to their teachers. Teachers in the study schools also mentioned how
the intent of the benchmark assessments had changed. Some felt that the requirement
to complete the BDAP was a reflection of this new accountability; others saw it
expressed in the way their principals expected them “to do better” on the tests.
District supports for benchmark assessment use. District leaders set high
expectations for the instructional use of the benchmarks. They acknowledged, however,
that these expectations were predicated on having the following things happen:
changing schools’ schedules; changing what happens in the classroom; and, to a certain
extent, tinkering with long-standing social and cultural practices. District leaders were
also quick to note a distinction between intended use of the benchmarks and realized
practices. That is, they noted the gap between what could and should be and what was
happening on the ground in individual classrooms and schools.
The district provided three types of supports to all schools in the district to try to
bring about these changes and to support the intended use of the benchmark
assessments: (a) easy and user-friendly access to online data, resources, and reports
through SchoolNet and tools for analyzing the data; (b) professional development; and
(c) time.5 In addition, the district held principals accountable for analysis and use of the
data, primarily through the SchoolStat meetings.
SchoolNet. SchoolNet provides a district-wide data base for the benchmark
assessments and other student data, makes benchmark assessment data quickly
accessible to every classroom teacher and building principal, and provides analysis and
5 Although outside the scope of this study, the District provided additional supports to low-performing schools (cf. Bulkley, Christman, Goertz, & Lawrence, in press).
78

Chapter 3: The District and School Role in Interim Assessments
instructional tools for educators’ use. Students’ families also have access to their
children’s SchoolNet data through the system’s FamilyNet tool which provides up-to-date
information on students’ test scores (including benchmark assessments), report card
grades, and attendance.
A critical feature of SchoolNet is the Item Analysis view. As shown in Figure 2.2
in chapter 2, a mock-up of the report, the Item Analysis view creates data spreadsheets
for every teacher that tells her:
• The names of every student who took the benchmark;
• The correct answers for each benchmark item;
• How many and exactly which items each student answered correctly;
• The wrong answer selected by individual students for each item;
• The average percent correct for each class for each item by state standard
statement; and,
• The state standard statement tested for each item.
Students’ correct answers are indicated by a green checkmark, while incorrectly
answered items are indicated by each student’s actual multiple-choice answer (e.g., “A”)
appearing in the cell in red. The state standard to which each particular test item is
linked is noted at the top of the spreadsheet. Teachers can click on the standard
number to see the particular skill assessed, and on the item number to view the
benchmark question.
The Skills Analysis view arrays data by state standard, reporting the number of
items that students answered correctly for each standard. The Standards Mastery view
report enables teachers to see how many students and the names of students who
scored at different performance levels (e.g., below, approaching, at, or above standard)
established by the district.
79

Chapter 3: The District and School Role in Interim Assessments
All of these views are easily accessible to teachers; they are generated by the
SchoolNet software when the user clicks on the appropriate tabs. SchoolNet also
provides links to information about how to re-teach a particular standard and practice
worksheets for students. The district facilitated access to SchoolNet by providing
teachers with laptop computers over a three- to four-year period.
The district highlighted the use of the Item Analysis data through its BDAP. As
discussed above in District Expectations, teachers had to use the Item Analysis view
to look for “patterns, outliers, weaknesses, and strengths” in the student data, identify
the weakest skills/concepts for their class, and then report how they would re-teach
based on their analysis of the benchmark results. The district also suggested that
teachers draw on the Standards Mastery views as well in designing their interventions.
Professional development. The district provided several kinds of professional
development for teachers: a) on the district curriculum, b) on the use of SchoolNet, and
c) school-based teacher leaders (SBTLs). In addition, several principals of the study
schools reported that the Regional SchoolStat meetings and follow-up activities with
other principals provided another source of professional development for them and some
of their staff.
When the district implemented its new mathematics curriculum, EM, all teachers
attended district-run multi-day training sessions in the summer prior to the enactment of
the curriculum. New teachers had the opportunity to attend EM training as well. The
district expected all teachers to receive training on the use of SchoolNet, but used a
school-based, turnkey training approach. Generally, principals and a technology support
person received professional development from the central office and were expected to
return to their schools and train their staff. The SchoolNet professional development
often focused on multiple ways to analyze the benchmark data.
80

Chapter 3: The District and School Role in Interim Assessments
Each school also had a mathematics SBTL, a former or current classroom
teacher whose job, in part, consisted of helping teachers fulfill the instructional purpose
of the benchmark assessments in mathematics. Some of these coaches still had their
own classrooms and were given limited release time to perform their coach duties;
others were not grade teachers but were full-time mathematics coaches. Until 2006,
each of the 11 regions of the district also had a mathematics coach who was available to
assist schools in implementing the mathematics curriculum and assessment system.
Due to funding constraints, however, that position was eliminated prior to the 2006-07
school year, the year in which we collected school site data.
The district viewed the SchoolStat meetings as a form of professional
development, as principals learned how to interpret data, to use data to identify
problems, plan for improvement and monitor their actions, and to exchange ideas. The
principals in the regions created other opportunities to share their practices, however.
One group of principals, for example, brought their teachers and mathematics and
literacy coaches together by grade level to share “best practices.” One principal
explained:
X School were the specialists of Grade 2. All the Grade 2 teachers from
the schools [in their cluster] reported to X school. They presented. They
exchanged best practices. They came back to school the next morning
and they couldn’t stop raving about just sharing and talking to another
2nd-grade teacher [from another school]…They came back with packets to
provide—they did reflective, turn around training. (P3)
The resulting product was a “best practices” binder with a section contributed by each
school that principals felt would provide teachers with new instructional ideas.
Time. Using the benchmark assessment results for instructional purposes
requires time: to re-teach skills, to analyze data, and to partake in professional
81

Chapter 3: The District and School Role in Interim Assessments
development. The primary mechanism to support teachers’ use of the benchmark
assessments is the re-teaching week scheduled after each benchmark assessment. As
discussed in earlier sections of this chapter, the assessments are electronically scored
and, in a quick turnaround, individual and class results are made available to teachers
through SchoolNet. During the remaining five days of the cycle, the sixth week, the
teachers are expected to plan and execute their re-teaching, remediation, and
enrichment activities. While the BDAP asks teachers how they will group or regroup
students based on their analysis of the assessment results, the teachers enjoy
considerable latitude around the specifics of instruction and re-teaching. Teachers
decide whether and how they retest their students on the content of the instructional
cycle. After the re-teaching week ends, students move on to the next instructional unit.
District staff expected teachers to meet in grade groups to discuss their students’
performances on the benchmarks and to share instructional strategies and concerns
with one another. To expedite this sharing, elementary school teachers in the same
grade were given a common planning time. In addition, the district instituted “half-day
Fridays” every other week.6 On these particular days, students were released around
noon and teachers remained in the building for professional development workshops
and sessions. As one central office leader explained:
The Chief Academic Office was very focused on: what do we need to do
to support the teachers, for them to use the [SchoolNet] system? And so,
one of the first things is getting mandated days on the school district
calendar so that we know that in every single school, people will be
looking at the same thing, and learning the same thing.
It was up to the individual principals, however, to ensure that the allotted time was used
to analyze and discuss student results and to learn about new instructional techniques. 6 The district eliminated these half days in 2008-09. Schools now have a half-day available for professional development about once a month.
82

Chapter 3: The District and School Role in Interim Assessments
School supports for benchmark assessment use. Principals, SBTLs, and technology
staff were the primary sources of support to teachers for the implementation and
analysis of, and instructional response to, the benchmark assessments in our study
schools. Principals and technology staff trained faculty in the use of SchoolNet, while
technology staff provided ongoing support in the use of the program. Principals and
SBTLs assisted teachers in their analysis of the benchmark assessment data and
supported mathematics instruction in their buildings. Principals scheduled time for
teacher collaboration and professional development.
Data management and analysis. As described above, the district used a
turnkey (i.e., a “train-the-trainers”) approach to train school staff in the use of SchoolNet.
Principals and teachers in the study schools reported providing and receiving training,
respectively, on SchoolNet, although this training focused on how to access and use the
components of the system (“point and click”), not on analysis of the benchmark data
itself. The principals expected all of their teachers to learn how to use SchoolNet, either
through school-based professional development (often offered after school or on
weekends) or on their own.
Technology or computer people in each of the study schools provided ongoing
support in the use of SchoolNet, and provided training to new (or refresher courses to
veteran) teachers. Teachers in the study had easy access to SchoolNet through
desktop or laptop computers, and were comfortable using the technology to access at
least the Item Analysis and the Standards Mastery views (see chapter 4). At least one
principal developed activities to help her staff become engaged with the new system.
And what I used to do just to initially get them involved in going onto the
computer was to give them little assignments. You know, I would say, “I
need you to go into SchoolNet to let me know how many kids had poor
attendance,” looking at a certain timeframe. “Okay, I need a list of all the
83

Chapter 3: The District and School Role in Interim Assessments
kids.” And they could have very well just gone to their own book and told
me that. But I kind of made it like a question where they had to go into
SchoolNet. Then they see something, go back and look at your
benchmarks and compare the kids who are absent to their test scores,
their performance on the benchmarks. And then I said, “This is
something we’re going to talk about when we have our staff development
or grade- group meeting.” (P6)
Another principal reported that while a few teachers in his school remained resistant to
using computers, the requirement that teachers do the benchmark analysis (e.g., the
BDAP) generally increased their interest in and competence to use other features of
SchoolNet.
Teachers did not receive formal training in how to analyze the benchmark data,
however. Rather, they learned these skills on the job, with the assistance of their
principal and SBTL. Principals (and their SBTLs when time allowed) reviewed
assessment results with teachers in grade groups and/or during professional
development meetings, probing on what skills students had or had not mastered and
how teachers planned to address student weaknesses. One principal started data
analysis training by examining other test score data at the beginning of the school year.
As we go through the Terra Nova and the PSSA, the data [which are last
year’s results for a teacher’s current students], they walk through as a
grade. So they understand what they are looking at. And hopefully be
able to interpret it so they will know what to do as far as instruction and
how their class did…. Then the binders are available to them if they want
to delve further into whatever it is they are looking for. But that’s how
they get to understand how to interpret the data. We actually go through
it with them. (P5)
84

Chapter 3: The District and School Role in Interim Assessments
Another principal assigned data analysis tasks to her teachers.
What I try to do, either on the daily gram or in grade-group meetings, is
give them some kind of task….I may say, you know, “Give me the kids
that you think are at borderline proficient and then I’d like you to develop
some kind of intervention plan for those five kids. Show me what you’re
doing in guided reading, or show me what you’re doing in math, why the
kids aren’t successful.” Or I might say, “I looked at your data on the
benchmark results. There was one problem that everybody got wrong.
Pull up those kids and then tell me how you’re going to address this in re-
teaching.” (P6)
Chapter 4 describes how teachers in our study actually analyzed their benchmark data.
Support for mathematics instruction. SBTLs were the principal source of
support for mathematics instruction and instructional responses to interim assessment
results in our study schools. The time that the mathematics SBTLs could spend with
teachers ranged from one released period a day to full-time. These differences reflected
budgetary decisions by the principals who paid for school-based coaches out of
discretionary funds. Because these schools performed much better in mathematics than
in reading, principals targeted their resources on providing support in reading and
language arts. The mathematics SBTLs also differed in experience and grade level
taught. Their teaching experience ranged from 4 to 20 years. One of the SBTLs was
an 8th -grade teacher and two taught in the elementary grades. The SBTL in one school
had a Ph.D. with a concentration in mathematics education and worked at a local
university. While none of the other SBTLs reported holding a masters degree, they all
had completed at least 24 hours of graduate work as required in Pennsylvania to retain
their teaching license.
The role of the SBTLs reflected available time and their own professional
capacity, but their duties were similar in many ways across the schools. First, as
85

Chapter 3: The District and School Role in Interim Assessments
discussed above, the SBTLs helped teachers analyze data, often during grade-group
meetings. This discussion could focus on weaknesses in skills that cut cross
classrooms in the same grade, or on the needs of specific students. Second, the SBTLs
located information for teachers on different ways of teaching mathematics or of
teaching mathematics skills on SchoolNet, the Internet, or from other sources. They
organized other materials as well, often PSSA study materials. One teacher reported,
for example, that her mathematics SBTL gave her booklets with common PSSA
questions that she then used for morning mathematics problems in her class. Third, the
SBTLs sometimes provided professional development to individual teachers or to the
school. For example, the SBTLs would attend district-wide training in mathematics-
related topics and, in turn, do a school-wide presentation during the school’s scheduled
professional development time. Teachers in one school reported receiving training in
the use of calculators for instruction. In another school, the SBTL presented strategies
for answering open-ended questions on the mathematics PSSA. More rarely, the SBTL
would model a lesson or teach a concept in a teacher’s classroom. One of the study
schools contracted with a local university for the services of a mathematics educator. In
addition to working directly with teachers on instructional practices, this individual
provided professional development sessions and optional courses focused on
mathematics content. These classes met twice per month and focused both on teaching
the teachers about children’s mathematical development as well as how to best support
this development through instruction.
Teachers usually asked the SBTLs directly for assistance, although principals
would sometimes ask the SBTLs to respond to professional development needs that
teachers identified on their Reflection Sheets or that the principal identified in her own
analysis of test data. The extent of SBTL involvement in data analysis and instructional
support was driven by their availability, however. For example, the full-time mathematics
86

Chapter 3: The District and School Role in Interim Assessments
SBTL in one school reviewed teachers’ BDAPs with the teachers and the principal;
attended grade-group and CSAP meetings7 where teachers discussed student results;
used these sources of information to provide instructional support to teachers, such as
modeling or co-teaching lessons in the classroom; took teachers to mathematics
professional development outside the school; created a school “data wall” that tracked
student performance over time; and made presentations at home and school meetings.
In the other study school with a full-time SBTL, the mathematics coach provided
professional development courses in addition to classroom-based support. But because
they had their own classrooms, most SBTLs were not available to help teachers in their
own rooms, and had less time to attend grade-group meetings.
Although teachers in all of the study schools spoke highly of their mathematics
SBTLs, they reported turning first to their grade-group colleagues for assistance,
including schools with full-time support. As one teacher explained:
I would start out with the 5th-grade teachers because we’d all be teaching
the same thing. And if they didn’t have a response or something that I
thought I could use, I’d probably go to [our] Math Coordinator. But I
probably wouldn’t go outside this building, only because we’re all in the
same boat together. (P3)
Finally, SBTLs did not work directly with students. Some students needing
remedial support participated in pullout programs. Otherwise, Philadelphia teachers
depended on volunteers or student teachers to provide students with additional help in
the classroom. Teachers also made time during lunch hours and before and after school
to work with students.
Time. The district scheduled dedicated time for teachers to discuss assessment
results and instructional response and to participate in professional development. 7 Comprehensive Student Assistance Program (“CSAP”) provides classroom-based and individualized help to get a child back on track without the need for formal evaluation for special education.
87

Chapter 3: The District and School Role in Interim Assessments
Teachers were expected to do the initial analysis of the benchmark data on their own
time, however.
All of the schools scheduled common planning time for teachers in each grade,
and, during the course of our study, teachers had contractual professional development
time for a half day every other Friday. District staff and principals expected teachers to
use their common planning time in grade groups to discuss benchmark results and
follow-up instruction. Principals could not dictate how teachers used their planning time,
however, and often had to dedicate their half-days to district-directed activities.
Teachers reported that other school issues often impinged on their grade-group meeting
time, and they therefore tended to talk informally (in the halls, during lunch) about
common instructional issues. They tended to use their more structured time together to
discuss students with learning problems.
One principal estimated that only about one-half of the Friday professional
development days were under a principal’s discretion. The principals in our study
schools, however, used some of this time to discuss data, develop school improvement
plans that included the use of benchmark data, and take staff to other schools to share
instructional practices. They also used some of these days to conduct turnaround
training, some of which covered mathematics topics. One school created a “data wall”
room where they posted test results over time. The principal explained, “We go over
and just do gallery walks where we go as a staff and we just look at the data. Then we
come back and we discuss it” (P1). Another principal created vertical meetings during
some of the schools’ half-days to “let each group know they are responsible for each
other” and to learn what to expect of students in each grade. She also felt that this
structure gives teachers fresh ideas about instructional interventions, “because
sometimes I feel that if they meet in the same group, they really don’t learn any more
than what they were [already] learning from each other” (P6).
88
Chapter 3: The District and School Role in Interim Assessments
Summary. Interim assessments play a major role in Philadelphia’s instructional
guidance system. At the time of our study, the benchmark tests were designed to be
“teaching tools;” that is, to provide teachers with timely information on whether their
students were learning the content and skills in the district’s curriculum and state’s
standards, and to assist teachers in adjusting their instruction to meet students’ learning
needs. The district communicated these expectations through its six-week cycle of
teach-test-reteach, the structure of the IMS, mandatory data analysis protocols, and
monthly principal meetings. Principals in our study schools accepted and reinforced the
district’s expectations by modeling and monitoring analysis of interim assessment data,
and teachers in these schools understood the instructional intent of the benchmark tests.
Making school results public in SchoolStat meetings, however, raised the stakes of
these tests for principals, and to a lesser extent, for teachers, leading some teachers to
express feeling pressure to raise student scores on these supposedly low-stakes
assessments.
Philadelphia supported the instructional use of the benchmark assessments with:
an easily accessible and user-friendly IMS that generated multiple and timely analyses
of the assessment data and a limited set of instructional tools to teachers; laptop
computers for teachers; professional development on the district mathematics curriculum
and the use of the data system; instructional support through SBTLs; and scheduled
time during the school day to facilitate group discussion of interim assessment results
and instructional responses, as well as more traditional professional development.
These supports were directed, however, primarily at the first stage of the cycle of
improvement—gathering evidence. Professional development on SchoolNet focused on
how to access benchmark data, not analyze it. The SBTLs helped teachers analyze
data and locate additional instructional materials, but the SBTLs were given limited time
to provide instructional support to teachers. Teachers rarely had other adults in their
89
Chapter 3: The District and School Role in Interim Assessments
classrooms to instruct struggling students or work with groups of students, thereby
enabling teachers to do small group instruction. Finally, while the schools in our study
did create common planning time for teachers in the same grades, and set aside half-
days for professional development, school or student issues or district-directed topics
often limited the time available for teachers to discuss interim assessment results and
common instructional challenges.
Cumberland
The Cumberland School District has long been engaged in a system-wide effort
to implement clear and rigorous performance standards and help teachers assure that
all students meet these standards. The district adopted the EM curriculum in the early
1990s, and the district leaders were strongly committed to continuing to provide
standards and content-area professional development in mathematics for each specific
grade at both the building level and the district level.
Curriculum and assessment. The teaching of elementary mathematics is
scheduled in accordance with the district pacing guide. The one-page guide identifies
the number of lessons in each EM unit, the number of days it should take to cover the
content, and the expected date of completion for each unit.
The formal and routinized assessments for elementary mathematics include
practice (formative), end-of-unit (formative/summative), end-of-book (summative) and
benchmark (predictive) tests. Every three to four weeks, the district’s Mathematics and
Science Coordinator (MSC) sends out to the elementary schools “practice tests” that
align with the pacing guide for the mathematics program and that are modeled closely
on the district’s end-of-unit mathematics tests. This process is detailed below and these
formative assessments are the primary focus of our study.
90

Chapter 3: The District and School Role in Interim Assessments
At the end of each unit, teachers give district-developed end-of-unit tests. Both
these and the practice tests are modeled on EM end-of-unit assessments They include,
however, five multiple-choice items, a number of constructed response items, and one
open-ended item that are aligned to the Pennsylvania Assessment Anchors as part of
the district’s “integrated PSSA prep.” The practice tests consist of anywhere from 11 to
20+ items (the 3rd-grade assessments tend to contain fewer items than the 5th-grade
tests) and may have from two to six items designed to assess the EM learning goals
(e.g., find equivalent names for fractions). Beginning, Developing, and Secure skills
were tested on the practice tests in the year of our study. In addition, the district
conducts a benchmark assessment in mathematics in Grades 3 through 6 once a year.
This test is also aligned with the Pennsylvania Assessment Anchors and models the
content on the PSSA. All of these assessments are updated by the MSC and teachers
during a series of test-construction meetings in the summer prior to administration.
The district’s cycle of instruction and assessment begins with approximately 28
days of instruction (see Figure 3.2) and is tied to the EM instructional units. The
instruction is followed by the administration of the practice end-of-unit test provided by
the district’s MSC. Teachers have some discretion on when to give the practice test but
it is typically administered one to three days before the more summative end-of-unit test.
These end-of-unit practice tests are, in the words of a district leader, “graded but not
counted.” Unlike in Philadelphia, students do not bring these assessments home;
parents likely never see the test or might not even know it is being administered.
Individual teachers are responsible for administering and scoring the practice end-of-unit
tests for their class. After these practice tests are scored, teachers report the scores (by
individual student) by entering them into a district-designed spreadsheet and emailing
the spreadsheet to the MSC. Approximately two to three days elapse between when the
practice test is given and when the results of individual tests are reported to the MSC.
91

Chapter 3: The District and School Role in Interim Assessments
Teachers may also report low scores for individual students to their school Elementary
Curriculum Specialist (ECS) or mathematics coach for help with remediation. As of the
2006-07 school year, Cumberland gave principals and teachers the option of using the
practice test as a pretest at an earlier point in the unit.
After teachers have scored the practice tests, entered the data by EM learning
goal, and reported their scores, they sort their students into flexible groups based on
mathematics performance. In the ensuing three to five days, teachers review the
practice test with their students in preparation for the end-of-unit test. On the sixth day
(which is day 33 of the cycle), teachers administer the end-of-unit tests to students.
Tests are then collected and again scored by classroom teachers.
92

Chapter 3: The District and School Role in Interim Assessments
Figure 3.2. The Cycle of Instruction and Assessment in Cumberland
Day 28-29: Teachers receive practice end-of-unit test (“benchmark”) from math & science coordinator (MSC)
(“graded, but not counted”) a few days before end-of-unit test. Teachers
administer and score practice test.
Day 30: Teachers use “flexible grouping” based
on test results.
Day 30-32: Teachers review material for 2-3 days.
Day 33: Teachers receive end-of-unit test (benchmark) from math & science
coordinator and administer to students.
Day 34: Teachers score test.Day 35-37: Teachers enter scores into customized spreadsheet and email to their Elementary Curriculum Specialists (ECS) within one week of test administration.
Day 38: ECSers print out spreadsheets (by class) and
put in binder for MSC.
Day 1-28:Teachers follow EDM
curriculum.
Day 39+ MSC reviews scores with ECSersonce a month, with an eye toward concepts, classes, individual remediation, enrichment,
and individual items.Day 38: Teachers examine data
individually for flexible grouping.
Day 39+ ECSers and teachers (with or without MSC) may meet to discuss instruction, individual remediation, or further
professional development as a result of test scores.
Day 30: Low scores may be reported to ECS or Math
Coach to help with remediation.
Teachers send spreadsheets for the end-of-unit tests to their building’s ECS
who compiles the school’s scores (at the individual level) by grade and class and gives
them to the building principal and district MSC. The MSC, in turn, reviews individual
class spreadsheets with the ECS during standing monthly meetings. The ECS can then
meet with teachers (with or without the MSC present) to discuss instruction, individual
remediation, or additional professional development based on the end-of-unit test
results.
93
Chapter 3: The District and School Role in Interim Assessments
District expectations for use. District administrators in Cumberland have
somewhat different expectations for the use of the various assessments, but the primary
focus is instructional for teachers and evaluative for students. Unlike Philadelphia,
district leaders do not expect the use of these assessments to shape school organization
or leadership practices. Rather, because the tests are embedded in the mathematics
curriculum—most items in both the practice and end-of-unit tests are taken from or
closely mirror test questions in the EM curriculum—the district expects teachers to use
assessment results as part of their regular instruction.
Instructional use. The practice tests, which were requested by and are
developed with teacher input, are designed solely to identify and address individual
student needs during the teaching of an EM instructional unit. As one district leader
noted, “The teacher will mark [the practice test], and he or she will write down the
children’s names that got problems wrong, so they know who they have to remediate.”
Teachers are then expected to form flexible groupings to address student needs, with
possible assistance from the district mathematics coach, the school’s ECS or the
school’s mathematics or Title I aide. Although the scores on the practice tests are
reported to the district MSC, teachers determine the scope and nature of remediation
and/or enrichment for their students.
Data from end-of-unit tests are also used to inform instruction. The MSC uses
results of these tests to discuss mathematical concepts, item analysis, individual
students, remediation, and enrichment with the ECSs. The ECS and the MSC may then
discuss these same issues with teachers in a school. As one district respondent
explained:
If I see there’s a certain grade level [in a school], or a certain teacher that
they always have [students missing items] in geometry and
measurement, then I need to sit down with that teacher, or maybe that
94

Chapter 3: The District and School Role in Interim Assessments
school, or maybe that grade level, and go over whatever it is. Three
dimensional figures, or vertices, and whatever.
Although the end-of-unit tests are not designed to measure student progress over time,
teachers are expected to continue the use of flexible grouping or other forms of
remediation if the end–of- unit test identifies students with weak skills in a learning goal.
Evaluative use. The end-of-unit test scores are also used to evaluate students.
Student performance on these tests is part of each student’s grade, which is standards-
based in Cumberland. The district assigns a performance level—Advanced, Proficient,
Basic or Below Basic—to the number of items a student gets correct on all end-of-unit
tests in a marking period. The district does not set performance expectations for, nor
does it report data by, individual schools. The MSC and school principal may, however,
use the results of end-of-unit tests to identify professional development needs for
individual teachers or schools.
Predictive use. District leaders also view performance on the end–of-unit tests
as “predictive” of how well students will do on the state assessment. They assume that
a student who earns a Proficient grade in district mathematics standards, which are
aligned with the state standards, has the requisite knowledge and skills to succeed on
the PSSA. In addition, the district initiated what it calls “integrated PSSA prep” in an
attempt to move away from separate PSSA preparation activities. The MSC developed
a set of “math messages”—five multiple-choice items and one open-ended item aligned
with Pennsylvania’s Assessment Anchors—that teachers are expected to use
instructionally. The district also included similar items in each practice and end-of-unit
test. It did not appear, however, that district staff or teachers conducted a separate
analysis of student performance on these questions. The district does administer a
separate district-developed benchmark assessment aligned with the PSSA assessment
95
Chapter 3: The District and School Role in Interim Assessments
anchors once a year. The MSC analyses student performance on this test and
discusses areas of weakness with teachers.
Leadership expectations. Leadership for the design and use of the practice
and end-of-unit assessments resides with curricular staff in the district, reflecting the
focus and intended uses of the tests. The MSC oversees the development of the
assessments by the ECS and teachers, and the analysis of the end-of-unit and the
district’s benchmark PSSA tests. The MSC meets on a regular basis with the ECSs
who, in turn, review assessment results with teachers in their schools. The MSC, ECSs,
and district mathematics coach are also responsible for supporting teachers
instructionally.
Communicating expectations. Expectations for the use of the practice tests—
solely to provide teachers with formative feedback during an instructional unit—are
communicated by district policy and practice. The district developed the practice tests at
the request of teachers and teachers participate in their development. Teachers score
their own tests, and they are not required to share the results with their parents,
colleagues, principals or the ECS. While scores are reported to the district MSC, she
does not share or act on these data. Teachers determine how to use the results of the
practice tests and to seek support for themselves and their students. The district builds
time into the teaching schedule for teachers to provide students with remediation and
enrichment prior to administration of the end-of-unit test. However, the format of the
district data reporting spreadsheet, which highlights student performance by content
sub-areas, generates expectations of when teachers should provide additional support
to students.
Accountability. The practice tests do not carry any stakes, for teachers or their
students. In contrast, results of the end-of-unit tests are public—to students, their
parents, principals and curriculum specialists, and they carry high stakes for students
96

Chapter 3: The District and School Role in Interim Assessments
through their quarterly grades. Although the end-of-unit tests are summative, and district
curriculum specialists used results to identify areas where teachers might need
additional support, the focus remained on instructional improvement, not on
accountability for performance.
District supports for assessment use. The district provided three types of
supports to schools to support their use of formative assessments: (a) an electronic IMS,
(b) instructional support and professional development, and (c) time.
Information management system (IMS). Cumberland created a pre-formatted
Microsoft Excel spreadsheet for teachers to record and analyze individual students’
scores on the practice and end-of-unit assessments. As shown in Figure 2.1 in chapter
2, individual test items are grouped together by their associated EM learning goal. As
teachers score the tests, they compute and then enter the composite number of right
and wrong answers by learning goal. The Excel program automatically highlights cells in
yellow where any student has more than one item incorrect (regardless of the number of
items administered for that given learning goal). As the spreadsheet aggregates data by
standard, no information about the percentage of students who missed any particular
item is provided. The spreadsheet also does not provide an analysis of student errors.
Instructional support and professional development. Cumberland provided
several types of instructional support and professional development in mathematics to its
elementary school teachers. The primary source of support was the school-based ECS
whose job is, according to the job description, “60% math.” The ECSs are former
elementary school teachers who, initially, were hired in part because of their
mathematics content knowledge and their enthusiasm for the subject. As the job has
taken on more administrative responsibilities, the position now requires principal
certification and is seen as more of a stepping stone to principalship. While their primary
role is providing remediation and enrichment to students in mathematics, ECSs also
97
Chapter 3: The District and School Role in Interim Assessments
facilitate analysis of practice and end-of-unit tests and, when asked, assist teachers with
instructional strategies. Furthermore, they do not have their own classroom
responsibilities. Every elementary school has an ECS as well as a mathematics aide
who assists in remediation. The mathematics ECSs in our three study schools had
between 10 and 20+ years of experience and all held masters degrees.
Three elementary schools (including the one Title I school) shared the services of
the district’s one mathematics coach. The role of the mathematics coach was driven by
teacher requests. She might teach a lesson (generally for a new teacher or to introduce
a new concept), teach the same lesson to a group of the lowest-performing students in a
class, work with low-performing students in the computer lab, or provide remediation on
specific concepts to students who scored low on the practice or end-of- unit test. The
mathematics coach also reviewed practice and end-of-unit tests with teachers.
The MSC reviewed all test results and met on a monthly basis with the ECSs to
review student performance and discuss instructional and professional development
needs in the schools. The MSC also visited all elementary schools on a regular basis to
meet with the ECS and to discuss with teachers areas of weakness identified from the
end-of-unit and district’s PSSA benchmark assessment.
New teachers received extensive professional development on the EM
curriculum by district administrators and veteran teachers (who provide the grade-level
training). Veteran teachers who were new to a grade level also attended the grade-level
sessions. Beyond that, teachers received support from their school’s ECS and grade-
level partners. Teachers were not provided specific professional development in data
analysis or use.
Time. Teachers had several opportunities for collaboration and professional
development within the school calendar. The district contract called for eight 2-hour
sessions after school. Teachers also attended two faculty meetings a month, with one
98

Chapter 3: The District and School Role in Interim Assessments
dedicated to professional development. Each building also received “collaboration”
substitutes each month—a minimum of one substitute for two days, or two substitutes for
one day—to allow teachers to meet with each other or in small (e.g., grade) groups.
Finally, teachers had 20 minutes at the beginning of the school day before classes
started. This provided an opportunity for short meetings with the ECS or the district
MSC.
School expectations and supports for assessment use. Educators
throughout the Cumberland school system expressed similar expectations for the
practice tests: they were to be used by teachers for instructional purposes. In the words
of one teacher:
Oh, I think they definitely expect me to take these results and review in
the areas where the students are having difficulty, in whole group and in
flex group and also with the curriculum specialist and with the
mathematics aide who helps with remediation. (C3)
In the opinion of many teachers, these expectations were communicated through the
district’s new requirement that they not only score the practice tests, but enter the results
in an electronic spreadsheet that was available to their ECS and principal, and analyze
the results by standard. What had been an informal process of scoring and analyzing
the practice tests was now institutionalized, and potentially subject to review by others.
However, teachers viewed the practice test as a low-stakes test.
While principals did not review results of the practice tests, they held their
teachers accountable for teaching the curriculum and ensuring that their students had
every opportunity to learn the mathematics program. As one principal described:
The role of the teacher is to implement the math program…attend the
assigned professional development programs, to raise questions about it,
and to work with the curriculum specialist, adding a [pre-referral] team
99

Chapter 3: The District and School Role in Interim Assessments
when needed, to make sure that children are profiting from
instruction….And the role of the teacher is to figure out when he or she is
digging himself into a…hole. And if the child isn’t progressing, why isn’t
[she]?....The role of the teacher is to employ all of the skills that they
know about educational practices, to create an academic environment.
(C3)
The principals’ role in the assessment cycle was student-, not teacher- or school-
focused. They reviewed data on student performance with their curriculum team in order
to identify students in need of additional assistance. One principal, for example,
prepared a list of priority-needs students at each grade level: “I’m looking for information
on who we are concerned about” (C1).
Teachers did not have to share the results of the practice tests with their ECS or
principal. Although the results were available on the computer, none of the principals or
ECSs in our study schools reported accessing them. Rather, ECSs assisted teachers in
the analysis of practice tests and creation of flexible groups for remediation and
enrichment only upon teacher request.
Teachers in the Cumberland schools had considerable instructional support
available to them. The school-based curriculum specialists provided remediation and
enrichment to students, usually in a pull-out or push-in setting. The ECS directed a full-
time instructional aide who worked with students in the classroom. The district
mathematics coach also provided remedial services in three of the district’s schools.
Some teachers scheduled their practice tests for a time when the ECS, mathematics
aide and/or mathematics coach would be available to assist with flexible grouping. The
ECSs and mathematics coach also used the results of the district’s end-of-book
assessments to “pre-teach” groups of students at the beginning of the following school
year.
100

Chapter 3: The District and School Role in Interim Assessments
The ECS and mathematics coach would give teachers instructional advice upon
request. One ECS reported “doing a couple of breakfasts” with teachers who were
having trouble teaching geometry and measurement. “I gave them additional things they
could use, and I was giving it to them, but also trying to instruct them a little bit, too. “In
case you’re not comfortable teaching this, this is what you’ll need to do” (C1). Teachers
would occasionally ask the ECS or mathematics coach to model lessons as well. As in
Philadelphia, teachers reported going first to their grade-group partner(s) if they had an
instructional question, but would then turn to either the ECS or the mathematics coach
for additional help (depending on the availability of the individual).
Summary. The primary focus of Cumberland’s practice tests is instructional, to
identify and address individual student needs during the teaching of an EM instructional
unit. Because the tests are embedded in the mathematics curriculum, the district
expects teachers to use assessment results as part of their regular instruction. Although
the tests include PSSA-like items, they are not designed to predict student performance
on the state test or to carry any stakes for teachers or students. While results of the
practice test are reported to the district’s MSC, and are available on the district’s
intranet, they remain private to the teacher. Principals do not access them, and
instructional coaches do so only at the request of a teacher. Expectations for the use of
the practice test are communicated through the district’s curriculum and instruction
hierarchy, not through traditional administrative channels. The tests are co-constructed
with teachers and were instituted at the request of the teaching staff.
Like Philadelphia, Cumberland supports the use of interim assessments through
an electronic IMS, instructional support and professional development, and time. The
IMS is accessible, but not-sophisticated, identifying only where students miss more than
one item per content standard. Teachers cannot manipulate the data in other ways,
however, and the system is not designed to generate instructional materials. Rather, the
101

Chapter 3: The District and School Role in Interim Assessments
district has an intensive system of instructional support for teachers and students
through a district mathematics coach and full-time school-based curriculum specialists
and mathematics aides who serve students as well as faculty. This staffing facilitates
the use of group instruction in the classroom, and provides more intensive remediation
to students who need additional help. The district sets aside time for teachers every
morning before classes begin and once a month for professional development, and
provides substitutes to free teachers for additional meetings. Teachers report that this
time enables them to meet with their district and school instructional coaches, as well as
with each other.
Conclusions
Philadelphia and Cumberland created six conditions that research shows can
facilitate data-driven decision making by teachers. First, both districts aligned their
interim assessments with content standards and district curriculum, ensuring that data
generated from the assessments was relevant to what teachers had been teaching in
the classroom. Both districts developed district-wide instructional guidance systems.
They enacted curriculum in mathematics aligned to state standards, adopted common
programs across schools, developed instructional timelines linked to units in the
textbook, and aligned interim assessment tasks with content of the district curriculum
and textbooks for each instructional period. The interim assessments were not designed
to be “mini-state tests” that mirrored the items in the high-stakes state assessment. By
aligning their interim assessments with curriculum units, and through the curriculum with
state and district standards, the districts were directing their teachers to address the
content and skills that the districts and the state considered important.
Second, both districts created and communicated expectations for data use at all
levels of the system. The districts viewed interim assessments as “teaching tools” that
102

Chapter 3: The District and School Role in Interim Assessments
would support and guide teachers’ instruction and both district staff and school leaders
(principals in Philadelphia and curriculum specialists in Cumberland) expected teachers
to use assessment results to reflect on their instruction, to discuss and share common
problems and instructional solutions, and to provide remediation for students in areas of
weakness and enrichment in areas of strength during a dedicated period of time
following the assessments. Philadelphia also expected principals to collaborate on how
to raise student achievement through monthly principal meetings. One consequence of
the public reporting of the benchmark assessment results in SchoolStat meetings,
however, was to raise the stakes placed on these tests.
Third, both districts designed user-friendly electronic data systems that gave
teachers easy ways to analyze a) student performance on individual items (Philadelphia
only), b) the entire test, and c) associated learning standards. Philadelphia developed
BDAPs to assist teachers in evaluating data from the interim assessment and their
teaching strategies, to plan instruction for the re-teaching time, and to identify
professional development needs. The different ways in which these systems reported
data, however, had the potential to affect teachers’ analysis of interim assessment
results.
Fourth, both districts provided professional support in curriculum, the use of the
IMSs, analysis of assessment data, and, to differing extent, instructional approaches.
Both districts designated school-based mathematics coaches for instructional and
content support—a full-time specialist in the suburban district, but only limited release
time for a grade-level teacher in the urban schools. While specialists in both districts
provided some analysis and instructional support to teachers, specialists in Philadelphia
did not work directly with students. In contrast, the curriculum specialists, a district-level
mathematics coach and instructional aides provided remediation and enrichment to
students in the suburban district.
103

Chapter 3: The District and School Role in Interim Assessments
Fifth, the districts scheduled dedicated time for teachers to discuss assessment
results and instructional techniques, to re-teach content and skills to students and to
participate in professional development. The re-teaching period provided not only an
opportunity for teachers to act on data from the interim assessments, but focused their
attention on the content and skills covered in the assessed curricular units.
Finally, school leadership and a culture of data use were critical factors in
supporting teachers’ use of data. School leaders reinforced expectations for data use by
modeling (conducting their own analyses) and monitoring (reviewing and providing
feedback) teachers’ use of data, creating time for teacher collaboration, and providing
direct support to teachers through modeling instruction. This was the role of principals in
Philadelphia and of curriculum specialists in Cumberland. The School District of
Philadelphia held principals accountable for ensuring that their teachers accessed,
analyzed, and acted on the benchmark assessments, as well as for providing
instructional leadership in their schools. In contrast, the use of data for instructional
purposes was under the purview of curriculum staff in Cumberland, thus keeping the
stakes of the interim tests low and reinforcing the instructional support that curriculum
specialists provided teachers and students.
Chapter 4 examines how teachers in the study analyzed and acted on the interim
assessments in Philadelphia and Cumberland and the effect of school and district
supports on their actions.
104

Chapter 3: The District and School Role in Interim Assessments
References
Bulkley, K., Christman, J.B., Goertz, M. E., & Lawrence, N.R. (in press). Building with
benchmarks: The role of the district in Philadelphia's benchmark assessment system. Peabody Journal of Education, 85(2)
Boyd, W. L., & Christman, J.B. (2003). A tall order for Philadelphia's new approach to
school governance: Heal the political rifts, close the budget gap, and improve the schools. In L. Cuban & M. Usdan (Eds.), Powerful reforms with shallow roots: Improving America's urban schools (pp. 96-124). New York City: Teachers College Press.
Corcoran, T., & Christman, J.B. (2002). The limits and contradictions of systemic
reform: The Philadelphia story. Philadelphia, PA: Consortium for Policy Research in Education, University of Pennsylvania.
Maranto, R. (2005). A tale of two cities: School privatization in Philadelphia and
Chester. American Journal of Education, 111(2), 151-190. Patusky, C., Botwinik, L., & Shelley, M. (2007). The Philadelphia SchoolStat Model.
Washington, DC: IBM Center for the Business of Government, Managing for Performance and Results Series.
Perie, M., Marion, S., & Gong, B. (2009). Moving toward a comprehensive assessment
system: A framework for considering interim assessments. Educational Measurement: Issues and Practice, 28, 5-13.
School District of Philadelphia (2005). School Handbook 2005-2006 School Year.
Philadelphia: The School District of Philadelphia. Retrieved from: http://www.phila.k12.pa.us/schools/jsjenks/SDP_Handbook.pdf
School District of Philadelphia (2006a). School District of Philadelphia, Office of
Curriculum and Instruction, K-8 Planning and Scheduling Timelines, 2006-07. Philadelphia: The School District of Philadelphia.
School District of Philadelphia (2006b). Strategic Use of Data for Improvement in the
School District of Philadelphia. Philadelphia: The School District of Philadelphia. Retrieved from: http://www.ed.gov/admins/tchrqual/learn/nclbsummit/thornton/thornton.pdf
School District of Philadelphia (September, 2007). Benchmark Assessments 2006-
2007, Grades 3-8. Philadelphia: The School District of Philadelphia. Retrieved from: www.phila.k12.pa.us/offices/curriculum/webinars.
Travers, E. (2003, November). The state takeover in Philadelphia: Where we are and
how we got here. Retrieved May 1, 2006, from http://www.researchforaction.org/PSR/PublishedWorks/ST031004.pdf
Useem, E. (2005). Learning from Philadelphia's school reform: What do the research
findings show so far? (Occasional Paper). Philadelphia: Research for Action.
105

CHAPTER 4
Learning to Learn From Interim Assessment Data: How Teachers Analyze and Respond to Results1
Although the rhetoric around formative assessment asserts the utility of
everything from teacher-made assignments and quizzes to district-mandated benchmark
testing for diagnostic and other instructional purposes, few studies have been conducted
of how formative assessments are actually used. While there is acknowledgement that
such assessments may be effective in improving student achievement and that students
benefit from meaningful feedback, we know little about how educators use the data or
about the conditions that support their ability to use the data to improve instruction. This
is particularly true with regard to interim or benchmark assessments.
This chapter addresses the question: How do the Philadelphia and Cumberland
teachers in our study analyze interim assessment results; how do they plan instruction
based on these results; and what are their reported instructional responses to such
results? The findings are based on three rounds of classroom observation and teacher
interviews (conducted in Fall, Winter, and Spring of the 2006-07 school year) and
relevant artifacts from classroom practice. These sources are described in detail in
chapter 2, Methodology.
One note on terminology: several times in this report we write about “conceptual
mathematics” when referring to conceptual thinking about mathematics or to teaching
conceptually. This terminology has a long and frequently controversial history in
mathematics (see Baroody, 2003 for a review). In defining these terms, we take de Jong
and Ferguson-Hessler as context in that, broadly speaking, conceptual knowledge refers
to “static knowledge about facts, concepts, and principles that apply within a certain
1 This chapter was written by Leslie Nabors Oláh, Matthew Riggan, and Nancy R. Lawrence.
106

Chapter 4: Learning to Learn from Interim Assessment Data
domain,” while procedural knowledge refers to “actions or manipulations that are valid
within a domain” (1996, p. 107). According to these authors, types of knowledge are
separated from quality of knowledge such that both conceptual and procedural
knowledge can be superficial or deep. In the mathematics education literature, however,
procedural knowledge has been largely defined as “how to” and conceptual knowledge
has been defined as “why” (Hiebert & Lefevre, 1986), with conceptual knowledge given a
privileged place. Without joining current debates on the relationship between the two
knowledge types (Baroody, Feil, & Johnson, 2007; Rittle-Johnson & Sigler, 1998), we
adopt Hiebert and Lefevre’s straightforward distinction as our definition for the purposes
of this study. Of course, we acknowledge that both knowledge types are necessary for
the development of mathematical competence.
Teacher Processes of Data Analysis and Interpretation
Analyzing interim assessment results was a universal practice among the
teachers in our study. At a minimum, all of the teachers had experience looking at
printouts of student results, and most were comfortable accessing those results using an
instructional management system (IMS). Figure 4.1 illustrates the steps most commonly
taken by teachers when looking at their interim assessment results.
107

Chapter 4: Learning to Learn from Interim Assessment Data
Figure 4.1. Teacher Process for Analyzing, Interpreting, and Acting on Interim Assessment Results
In nearly all cases, teachers begin by identifying weak points in their class’
performance, either focusing on items or content that proved challenging and then
moving on to individual students or vice versa. To better understand these weak points,
teachers often validated specific items to ensure that they accurately reflected their
students’ mathematical understanding. In Philadelphia, whether or not teachers
responded to a particular result seemed to depend largely on personal “thresholds” for
acceptable performance that were embedded—sometimes implicitly—in teachers’
analyses. These thresholds varied considerably and were influenced by a variety of
contextual factors such as past student performance, teacher background knowledge, or
position of specific content within the district’s curriculum or pacing cycle. As we discuss
below, such thresholds were less evident in the analysis process of Cumberland
teachers. However, the same factors that influenced Philadelphia teachers’ thresholds
played an important role in shaping both Cumberland and Philadelphia teachers’ overall
impressions of interim assessment results, which in turn directly informed their
instructional planning.
Identification of weak points in interim assessment results (item, content, student)
Validation of specific items “Thresholds” for acceptable performance
(Philadelphia) Context for interpretation
Instructional response
108

Chapter 4: Learning to Learn from Interim Assessment Data
Analysis processes. There was considerable uniformity in the initial steps
teachers took in analyzing benchmark data. First, nearly all of the teachers (90%)
started by looking for weaknesses. (The rest began by reviewing and assessing the
overall performance of the class.) Of all teachers, the majority (67%) began by looking
for weak content areas, either by looking directly at the standard to which an item
corresponded or by identifying individual items that covered the same curricular content.
Roughly 21% of teachers began by looking for individual low-performing students rather
than at content issues. Overall, nearly all teachers (97%) reviewed interim assessment
results by both student and content area.
Due in large part to the structure and organization of instructional management
systems (discussed below), differences were apparent in the ways in which teachers in
the two districts related items to content or standards. In Philadelphia, 79% of teachers
linked specific interim assessment items with standards or content areas, suggesting
that teachers had little difficulty linking items, content, and standards. In Cumberland, on
the other hand, results were presented in the IMS by content area, with references
provided to specific item numbers. This required teachers to take an extra step in
relating results back to specific items; fewer teachers did so as a result. Whereas 82%
of Philadelphia teachers reviewed student performance by both item and content, just
36% of Cumberland teachers did so.
In sum, the vast majority of teachers were, at least on a superficial level,
analyzing interim assessment data in a manner consistent with school district
expectations: identifying weaknesses in student performance and relating those
weaknesses back to instructional content.
Use of information management systems. As noted above, IMSs influenced
the steps teachers took in analyzing interim assessment results. In both districts, the
design of the IMS highlighted areas of weakness in student performance. In
109

Chapter 4: Learning to Learn from Interim Assessment Data
Philadelphia, this was accomplished by listing the percentage of students who answered
each item correctly and the percentage of items each student answered correctly (see
Figure 2.2 in chapter 2), while in Cumberland content areas in which students answered
more than one item incorrectly were highlighted in yellow on teachers’ reports (see
Figure 2.1 in chapter 2). It is also worth noting that in both districts, the influence of the
IMS on teachers’ analysis process was fairly rudimentary. In Cumberland this reflected
the limited capacity of the system itself, while in Philadelphia the more complex functions
of the IMS were used far less frequently than its basic functions.
In Philadelphia, all of the teachers in our study were familiar with the IMS
(described in detail in chapter 3) and had used it at some point, though some were more
familiar with specific features of it than others. Generally, teachers used the IMS to
facilitate their analysis in two ways. First, they were able to toggle between the item
analysis for their class and the specific questions from the benchmark test. This allowed
them to assess the validity of the question itself (see Validation of Test Items section
below), and to try and make sense of students’ incorrect responses. One 3rd-grade
teacher described this process as such:
Let’s see, for number one, a lot of them put B instead of…A. And this is
why I would…go and look at, there’s a place that you can click on for the
question to come up to view the problem. And so, I could look to see
what exactly the problem was, and…because it’s geared to Everyday
Math, I might be able to see that little thing that they didn’t get, the way it
was set up, it could have possibly been that more than just the
computation of the problem itself. So, I would probably go and look at
that.
Second, teachers used the IMS to link benchmark items to Pennsylvania content
standards. Several respondents reported that viewing the data by standard (rather than
by item) allowed them to more easily hone in on the specific content they needed to
110

Chapter 4: Learning to Learn from Interim Assessment Data
cover during the re-teaching weeks. Two 3rd-grade teachers spoke about the benefits of
this feature:
This is [the teacher-level component of the IMS.] And then also on the…
tab there is each of the standards, and it gives you a standard mastery by
individual [assessment administration], so then I can take just a real quick
look and say, okay, well I know that the most people need work on, I
guess right here, whatever this is, skip counting, which you think that they
would know. So that would definitely be something that we needed to
work on, was the skip counting. So this is another way.
You see, these tell me right here. These are the [items] that the kids
really had trouble with and the content and then all of the different
standards. So that helps me so that I know what to re-teach. I am not
going to re-teach something that everybody got the question—you know,
if they got it right, I am not going to re-teach that.
Use of the IMS for more complex tasks, such as generating supplemental
assessments or identifying curriculum, was far less common among teachers in our
study. Two Philadelphia teachers specifically referred to using SchoolNet to link back to
relevant Everyday Mathematics (EM) units, and just one discussed generating
worksheets based on student benchmark performance. Still, teachers were generally
highly complimentary of SchoolNet, noting that it both saved them time and helped them
focus on students and content areas that most needed their attention. A common
opinion was articulated by one 3rd-grade teacher in this way:
I think it’s really good. I really appreciate having data and having the
numbers just done for me. A lot of times, as I alluded to earlier, I have an
idea of where they’re struggling, but to actually see it numerically and get
it instantly, it saves me time and it really helps a lot. I think it’s terrific.
111
Chapter 4: Learning to Learn from Interim Assessment Data
In Cumberland, the IMS was considerably simpler and required more effort from
teachers. Whereas in Philadelphia interim assessment results were tabulated
automatically, in Cumberland teachers were required to score interim assessments
manually and input them into the IMS. While some teachers suggested that this was
time consuming, most reported, as this 5th-grade teacher did, that it was useful to be
able to view the results by content area.
And now we have the spreadsheets. It’s the most beautiful thing ever
that we’re finally in this century and on the computer. So, they take the
practice tests. I score them, I plug them right in, and then it’s standards
based. So, it’ll say “Numbers and Computation were problems one
through six.” And I put in how many they get correct. And if it’s below, it
automatically highlights in yellow. It takes a lot of work off my back,
because I used to have to do that, decide, well, what’s below, what needs
help?
Thus, the highlighting of content areas where students struggled tended to lead
teachers to focus on weak points in their classes’ performance. While the IMS referred
to the specific item numbers in a given content area, the items themselves were not
embedded in the spreadsheet program. As result, Cumberland teachers were less likely
to work back and forth from item to content than their Philadelphia counterparts, and
some, such as this 3rd-grade teacher, expressed frustration at the lack of easy access to
individual item results.
I can see here that identity place value in whole numbers up to five digits,
majority of the class didn’t do so well in. So that’s a red flag for me.
However, it’s much for me to actually look at the practice tests and see
the actual problem that is represented so that I know this is something we
need to work on versus just the verbiage…Seeing the actual problem that
there is a problem with is a much better method for me than doing it this
way.
112

Chapter 4: Learning to Learn from Interim Assessment Data
Even when they did not return to the actual items, teachers noted the number of
items included in each content area; in areas where the number of items was low,
teachers were less likely to trust reports of low performance.
Validation of test items. While Philadelphia teachers looked at item-level
results more than their Cumberland counterparts, teachers in both districts reported
returning to individual assessment items in order to determine the quality of information
that could be gleaned from them. Some type of validity check was conducted by at least
half of our teachers, although these actions were not referred to using traditional
psychometric terminology. In Philadelphia, several teachers mentioned that after looking
at students’ performance on the whole test or by content area, they would go through the
most problematic items one by one. In Cumberland district, where individual items were
not as readily available for review, teachers voiced suspicions about the validity of
specific items based on unexpectedly low performance (either by particular students or
the group as a whole) in a particular content area.
In both districts, teachers who mentioned conducting validity checks questioned
the degree to which specific items (or sets of items) assessed students’ true
understanding of mathematical concepts and procedures, yet they did so in different
ways. In Philadelphia, several teachers mentioned that the language used in particular
items confounded their ability to use the benchmark assessments to judge their
students’ mathematical knowledge, prompting one 3rd-grade teacher to ask, “Are we
measuring reading or are we measuring math?” These teachers mentioned vocabulary
as the main issue—either new mathematical vocabulary (e.g., probability versus
percentage) or vocabulary that may not be part of the everyday experience of their
students. In discussing how her class performed on an interim assessment, a 3rd -grade
teacher considered:
113

Chapter 4: Learning to Learn from Interim Assessment Data
One thing that became clear to me is that the language in some of the
word problems was difficult for them, and that might have been a hang-
up. Like with the greeting cards, if you were observant, you saw that no
one in that group knew what a greeting card was except for one girl. It
was a math problem about a box of greeting cards.
In Philadelphia, where interim assessments are administered according to a
district-wide calendar, teachers mentioned that they were far less able to make use of
the benchmark assessment results when the content tested had not yet been taught.
This occurred either because instruction had fallen behind the district’s pacing calendar,
or because teachers perceived that interim assessment items covered mathematics
content that was not supposed to have been taught yet. For example, several teachers
expressed concern about the first item of the 5th-grade interim assessment, which
required students to multiply two fractions:
We looked at this and flipped. What I did was I just said—I did it
quickly— “Whenever you have 4 x 4, I mean four 4’s, when the
numerator…” I had already taught that, numerator and denominator are
the same equals one whole. “What is one whole? One times anything, so
1 x 3/11?” That is not the way you teach multiplication, but I was able to
do it for this. So that was a problem. We looked at that and could not
believe that this was the very first problem and it was not even in our
curriculum at this point.
In Cumberland, on the other hand, some teachers expressed concern that the
practice tests were too similar to the end-of-unit tests that followed, and in some cases
were administered too close to them, thereby encouraging rote memorization rather than
deeper understanding. One 5th-grade teacher mentioned:
I have a real problem with the pretest being given two days before the real test.
Because I think, then, the real test is a very inflated score. It’s the exact same
114

Chapter 4: Learning to Learn from Interim Assessment Data
test with different numbers. So, you know, if it’s a word problem and it’s addition
on the practice test, it’s addition on the second test. So I think you’re giving the
middle kids…an inflated score because they’re memorizing, when mom’s drilling
them, they figured out the thing. So I really question—Give me a review, but
don’t give me the exact same problems.
In sum, item validation was used as a first check on class-level benchmark
results that were unexpectedly low, or appeared otherwise anomalous. It is worth
noting, however, that questions about validity were almost never raised when students
performed well on an item. As discussed later, in those instances teachers almost
always assumed that their students had mastered the content and focused on the areas
in which they struggled. The exception to this trend is illustrated by the previous
quotation; in Cumberland, questions were raised about the validity of administering the
practice and end-of-unit tests so closely together, but this was not a concern about
potentially low rigor of specific items.
Teachers’ practice of focusing heavily on item-level results, along with the
tendency to question the validity of specific items, points to a larger and potentially
problematic pattern of relying heavily on individual items to draw inferences about
student learning or performance. As we discuss below, the utility of individual items for
this purpose is questionable.
Teacher interpretations of interim assessment data. Teachers’ processes for
interpreting interim assessment data were influenced by a variety of factors, including
their knowledge about specific students’ background or past performance, student
performance in relation to their peers, district factors such as the scheduling of interim
assessments, or teacher perceptions about which mathematical content was especially
challenging for students. In Philadelphia, these factors contributed to the development
of teacher “thresholds” —criteria for determining whether student performance required
115

Chapter 4: Learning to Learn from Interim Assessment Data
an instructional response during the re-teaching week. In both districts, these factors
shaped teachers’ overall evaluation of their students’ progress.
Individual “thresholds” for interim assessments. In Philadelphia, teachers’
interpretations of interim assessment results revealed the existence of personal
“thresholds”2 that influenced their interpretation of the data. That is, teachers had in
mind a minimum score that, to them, indicated whether their students had mastered the
concepts introduced during the previous five weeks. These thresholds were individually
defined by teachers and influenced by their knowledge of their students and their
abilities, as well as by teachers’ beliefs about content difficulty and how children learn
mathematics. These thresholds appeared to vary by student, by class, by time (when
during the year the benchmark was given), and by range of students’ responses on the
benchmarks.
In one school, teachers referenced a “green,” “yellow,” and “red” system whereby
a green indicated a score of 85-100 (“mastery” or “proficient”), yellow indicated scores
between 65 and 80 (“strategic”), and red scores of 65 or less were considered “at risk.”
Yet, even at this school, teachers appeared to construct their own personal thresholds.
Across all the schools, teachers frequently used the terms “advanced” and “proficient”
when discussing their students’ scores on the mathematics interim assessments. And
while teachers’ thresholds might also have been influenced by these more fixed
distinctions, their own thresholds appeared more mutable and fluid; they could fluctuate
up or down depending on content, context, student, and even from one interim
assessment to the next.
2 It is worth noting that the term “threshold” was introduced by the research team; it was not native to the teacher lexicon. We used the term in questions included in the data scenario: Are there any students who appear to have mastered the material? …What would you consider the “threshold” for mastery…? Probe: Are there any students who appear to be having trouble with this material? …What would you consider the “threshold” for recognizing a child as having difficulty?
116

Chapter 4: Learning to Learn from Interim Assessment Data
Teachers’ personal thresholds for mastery varied considerably, but for most
teachers the marker fell between 60% and 80%. Several teachers in Philadelphia
explained the meaning of these thresholds:
I always look at 80% or above, which really means that they understand
it. …if they’re really having trouble, I would say below 60, because
they’re not passing at all. The ones who are in between are, like,
average. They’re kind of getting it, but maybe still having problems. (3rd-
grade teacher)
I would like 75 or higher… [70] is still borderline to me, so that’s not
enough, not giving me enough. (3rd-grade teacher)
I think if they’re 70, that’s not good enough.… Seventy, to me, means
you’re just getting by, by the skin of your teeth. (3rd-grade teacher)
I would say any one with…80% or higher [has mastery]. And the kids at
…70 and 75, are making progress. (5th-grade teacher)
Personal thresholds appeared to help teachers establish priorities for the re-
teaching week, both in terms of what content to address and which students most
needed support. As such, thresholds serve as a critical link between interpretation and
action in the formative assessment cycle. They are a cognitive cue that triggers a
decision based on individual teachers’ interpretation of the data.
In Cumberland, there was little evidence that teachers developed personal
thresholds akin to those found in Philadelphia. The district’s IMS was designed to
highlight content areas in which students answered one or more items incorrectly, but
did not report percentages of items answered correctly by content area or by student.
Further, the number of items in a given content area for each interim assessment varied
considerably, altering the significance of answering a single item incorrectly.
117

Chapter 4: Learning to Learn from Interim Assessment Data
Another reason why personal thresholds may have been less evident in
Cumberland is that they used interim assessment data to make different types of
decisions. Whereas in Philadelphia, thresholds helped teachers make difficult decisions
about what to re-teach and to whom within a limited time frame, in Cumberland it was
assumed that students would be flexibly regrouped on an ongoing basis, and regrouping
was supported by substantial classroom support. As such, the primary use of interim
assessment data appeared to be in helping teachers determine how to regroup students.
These differences in instructional response and their relation to available resources are
discussed further below.
Context for interpretation. As mentioned above, many Philadelphia teachers
maintained a sliding threshold of sorts; however, we found that these teachers also often
adjusted their personal thresholds depending on the student. For example, when a
Philadelphia 3rd-grade teacher was asked to explain her use of the term “good job” on
the mathematics benchmark, she said that while she personally “like[s] the 80% or
above, depending on the child, if they got a 70%,” she would be satisfied. In interpreting
their students’ scores, many teachers relied on their background knowledge of individual
students:
If that [student’s benchmark score] seems in line with what I know that the
student can do, then I’m happy. And if it’s not, if I have a student here
who’s done, like, 70 or something, then that’s kind of where my focus
would be. I’d hone in right there and figure out, “Well, what did he or she
do wrong? Normally an A student, [gets a] 70%? What’s going on?” And
then try to figure out what [happened]. (5th-grade teacher)
Because teachers often possessed detailed background knowledge of their
students, many, including this Philadelphia 5th-grade teacher, expressed surprise when a
118
Chapter 4: Learning to Learn from Interim Assessment Data
student’s score on the interim assessment was inconsistent with what they knew about a
particular student:
They were really getting into this [Everyday Mathematics] Unit. And they
seemed to have gotten what was being asked of them. So, I expected to
see most of them at least in the 70, 75 or higher. One of the students
was really low…he was like a 55%. That surprised me because I know
he’s having problems with math, but he also has an outside tutor. And I
thought he was beginning to get it.
We noted that, overall, the Cumberland teachers reported being surprised by the results
of the interim assessments more frequently than did the Philadelphia teachers, who
rarely reported being shocked by these assessment results. This may be attributable to
format of the interim assessments, which included multiple-choice, constructed-
response, and open-ended items and therefore yielded more complex and variable data
than Philadelphia’s interim assessments, which were exclusively multiple choice.
Teachers’ personal thresholds were also informed by the scores of the class as a
whole, similar to grading on a curve. When a large majority of students had scored well
on a particular mathematics assessment, teachers’ thresholds were upwardly adjusted.
In these classrooms, teachers’ attention during the re-teaching week targeted the
proficient students in an effort to bump them from “proficient” to “advanced,” as one 3rd-
grade teacher explained:
Well, the average [mathematics interim assessment] score in this class is
82%. Certainly, the kids who have 100s are very secure. Ninety-five
percent, that was just one wrong. Also, 90 is pretty strong. But I wouldn’t
necessarily say “mastery” because my goal is really to pick up each kid
as high as they can. So, 95 and above is considered advanced, and from
between 80-94 is considered proficient. So, if a child is proficient, my
119

Chapter 4: Learning to Learn from Interim Assessment Data
goal is to try to help them reach advanced. So, I wouldn’t rest on my
laurels or allow them to rest on theirs with a 90.
A 5th-grade teacher had a different expectation for her class, and when the class
did not meet her “target,” she adjusted her threshold downward:
I was hoping for 70% average and they had 64. So, I was happy with
that. They’re progressing, which obviously is a good thing. So, I was
happy with that. But I guess I was hoping that they did a little better. But
they are doing well, so I am happy with that.
Here, the teacher’s threshold adjustment is explained by her students “progressing.”
Thus, in settling for a lower class average, this teacher’s higher expectations for her
class are tempered by her satisfaction that the students are making progress.
Teachers’ personal thresholds were also influenced by the school district
curriculum and pacing schedule. Some Philadelphia teachers expressed different
expectations for the first benchmark assessment of the year, given in October, than they
did for the one given in March. As such, these teachers were less concerned with lower
scores on the October assessment than on a benchmark assessment given later in the
school year. A 5th-grade teacher commented that she’s “fairly satisfied with a 65” on the
first mathematics assessment administered in the school year as “it’s…been a summer
away from it.” However, this same teacher maintained that there are certain basic
mathematical skills that students should possess regardless of when the interim
assessment is administered:
And at the same time, there are always certain things that I feel on the
first Unit that they really should do well in, because the first marking
period, obviously, is generally…a review. So they really should. Some of
these skills that they’re seeing on the [interim assessment] are basic
addition problems. And if I see somebody that gets that wrong, I have to
120

Chapter 4: Learning to Learn from Interim Assessment Data
question whether or not it was just a silly mistake. But I would look at it
and say, “They got this wrong. Let me see if I can just take this person,
one on one, and make sure that there’s nothing really going on.”
Teachers’ knowledge of the district’s mathematics curriculum, EM, also appeared
to help shape and determine their personal thresholds. The second edition of EM was a
spirally structured program, and students received ongoing opportunities to review and
practice skills and concepts after they are first introduced. Because different skills and
concepts were introduced at different times, the second edition of EM distinguished
between “beginning,” “developing,” and “secure” skills. In discussing their personal
thresholds, some teachers expressed less concern for a lower score on a beginning and
developing skill than on a secure skill. One 5th-grade teacher explained:
I would say maybe about 75% of them…got it. …and plus, I don’t think
this was a secure goal at this time. So, since this is a spiraling program,
all of them weren’t supposed to be able to master it.
These so-called beginning skills were recently introduced concepts that the teacher had
not devoted a lot of instructional time to during the five weeks that preceded a particular
mathematics assessment. These EM distinctions —beginning, developing, and
secure— coupled with the spiraling nature of EM indicated to the teacher (and the
students) that mastery was not expected at this time. Conversely, a Cumberland 5th-
grade teacher explained that concepts that are supposed to be at a secure, or mastery
level need to be assessed as such:
This unit…is at mastery level. And you know what? On a personal note, I
am looking for mastery of certain things on these tests, things that I know
they really need to have a strong foundation on for sixth grade.
121

Chapter 4: Learning to Learn from Interim Assessment Data
In Philadelphia, the mathematics interim assessments make no such explicit distinctions,
while in Cumberland, the IMS delineates between beginning, developing, and secure
skills. It was a combination of these teachers’ knowledge of EM, of the curriculum’s
scope and sequence, and of their pacing guides, that helped them determine how much
“weight” and what threshold to set on particular items.
The same set of factors that influenced teachers’ personal thresholds also
colored their overall interpretation of student performance. Teachers interpreted student
assessment scores in the context of their expectations, both for individual students and
for the class as a whole. As discussed in a previous analysis (Nabors Oláh et al., 2007),
teachers frequently used the interim assessments to validate their impressions of
student strengths and weaknesses based on other assessments, performance on
previous interim assessments, informal observations, or nonacademic background
information. According to one Philadelphia 3rd -grade teacher:
I can’t say [benchmark results are] a big surprise, because as we’re going
through Everyday Math, we kind of know where kids are, if the interest is
there, if the hands are up. You kind of know if you’ve got them, if they’re
understanding it.
The Cumberland teachers, in particular, spoke of the interim assessments as merely a
starting point for engaging in further formative assessment activities. More often than
not, Cumberland teachers mentioned working through problems with individual students
as a way of learning more about student learning. As one Cumberland 5th-grade teacher
explained:
Well, the first thing we do is try to figure out what the kid is doing, so I
need to see the process. Because there’s no way I can teach them,
ultimately, until I see how they go about doing it.
122

Chapter 4: Learning to Learn from Interim Assessment Data
Below, a 3rd-grade teacher explains a child’s poor performance on the interim
assessment:
This child is the only child that did poorly in my class, but basically
because he doesn’t come to school until 10:00 and we teach math in the
morning. So he misses math everyday. So obviously, it’s not a learning
problem. It’s a not showing up to school problem.
In summary, we found that while teachers in Philadelphia set thresholds for
student performance, when it came to interpreting the interim assessment results, they
also took into account student characteristics, class performance, curriculum design and
content, as well as curricular pacing. Teachers in Cumberland were much less likely to
speak of specific thresholds of performance on the interim assessment. Rather, they
were more likely to speak of these results in the context of other information from their
formative assessment practice.
Diagnosis of student understanding and misconceptions. We have shown
that the teachers in our study attended to the administration of these interim
assessments and that they looked at the overall scores and performance groupings
aided by their district’s reports. Yet, a crucial question about teacher analysis of interim
assessment scores concerns any deeper analysis that teachers do once they have
looked at overall patterns of scores. In order to investigate the types of “diagnoses”3 that
teachers perform, we interviewed all of our teachers about both their own assessment
results as well as about a select number of items (the misconception probes detailed in
chapter 2). In the latter case, the important question we asked of teachers was: What
3 We have carefully considered the use of this term, as it may be confused with the types of assessments and evaluations performed for educational placement or eligibility for services. However, we have noticed that other researchers and practitioners use this term when referring to interpretation of formative assessment results, probably because it so succinctly captures the process of consciously interpreting information in order to create an action plan with the larger purpose of redressing an inadequacy. It should be further noted that the term “diagnosis” as used here refers to the specific error, rather than the student making the error.
123

Chapter 4: Learning to Learn from Interim Assessment Data
might the student be thinking? (when the student answered the question incorrectly).
We see this moment of analysis as a critical juncture between the reporting of
assessment data and modification of instruction. In this section, we describe the ways in
which teachers in both districts attributed diagnostic information to individual student
performance on specific items. It should be noted that while our interview protocols
prompted teachers to attempt to diagnose student errors on interim assessment and
other items, this level of analysis was not necessarily a routine part of their practice. As
described in chapter 5, many teachers’ use of formative assessment information
(including interim assessments) identified what content to re-teach and to whom, but did
not necessarily delve into the reasons for individual students’ mistakes.
We recognize that the four categories detailed below may simplify what is, for
many teachers, a very complex decision-making process, and we do not claim that these
categories are mutually exclusive. In fact, teachers may attribute student performance
to multiple factors simultaneously or the difference between some categories may not be
as discrete as researchers have assumed it to be (cf. Baroody, Feil, & Johnson, 2007).
We therefore view this analysis as a starting point for further inquiry.
In Philadelphia, teachers’ responses tended to initially fall along a procedural–
conceptual continuum, with procedural diagnoses being by far the most common.
Procedural diagnoses focused on missteps in applying algorithms or on computational
error. Over half of teacher diagnoses in Philadelphia included some kind of procedural
diagnosis; students were seen to have particular difficulty with items that required
multiple steps to reach an answer. For example, one 3rd-grade teacher, considering her
students’ performance on the January assessment, commented that “doing the double-
digit subtraction problems with regrouping, that was the most problematic, I thought,
because they were still having trouble with that process of doing the regrouping.”
124

Chapter 4: Learning to Learn from Interim Assessment Data
Diagnoses of conceptual misunderstandings, in which teachers mentioned
problems in students understanding basic definitions or more complex ideas, were less
frequently mentioned among the Philadelphia teachers than were procedural diagnoses.
When these teachers did speak about their own class’ development of concepts, 3rd-
grade teachers mentioned that items featuring place value were some of the most
difficult for students, while 5th-grade teachers pointed to fractions as the one subcontent
area that the interim assessments drew attention to. One 5th-grade teacher explained
her interpretation of some students’ responses to a fraction identification item:
I remember there was one question, it had four boxes and the first three
were shaded in, and the last one, it didn’t have individual boxes inside
shaded in. It just had three-fourths of it. And I think some of the students
thought—I don’t think they put together that each one of those [the big
boxes] could be divided up into four, so the denominator would have been
20 because there were four in each of the five boxes. They were thinking
of them as wholes.
A few teachers mentioned that word problems also had the potential to pose conceptual
problems for students in that students must know the purpose of different algorithms and
be able to choose the correct one to apply.
In Philadelphia, many teachers also attributed student errors to other cognitive
weaknesses. These included a list of possible causes for student underperformance,
including, but not limited to, weak reading ability, difficulty maintaining attention, and low
levels of English language proficiency. As might be expected, errors on word problems
and on multistep procedural problems most frequently elicited this type of diagnosis. For
example, a 3rd-grade teacher in a school with a high proportion of English Language
Learners (ELLs) believed that a subtraction word problem that ended with the words
“how many more marbles does he need?” had posed difficulty because when her
125

Chapter 4: Learning to Learn from Interim Assessment Data
students saw the word “more” they summed the minuend and subtrahend instead of
subtracting the latter from the former. She believed that her students “just say, Oh,
‘more’, altogether, let’s add.” Although our questions focused on teacher response to
student error, one 5th-grade teacher attributed a student’s superior performance to
increased attention to task in that, as the teacher explained, “he usually doesn’t do quite
that well….it goes to show you what he can do when he is paying attention, because he
did exceptionally well.”
Finally, teachers in Philadelphia also offered contextual or external diagnoses,
according to which student mathematical performance fell short due to factors that were
seen to be outside of the teacher’s or school’s realm of influence. These tended to
consist of perceived distal causes of the other proximal diagnoses. For example,
several teachers mentioned students’ lack of background knowledge as contributing to
difficulties in comprehending word problems. A teacher who taught two classes of
mathematics mentioned that one class was “calmer” than the other class, giving all
students the opportunity to “get more into the work… [taking] more time to look things
over.”
While initial diagnoses among teachers in Philadelphia ran along a procedural-
conceptual continuum, we found this not to be the case in Cumberland. Instead, these
teachers’ diagnoses tended to range along a symptom–etiology continuum. For
example, in light of student errors on problems involving fractions, teacher responses
ranged from symptomatic (e.g., “they tend to isolate either the denominator or the
numerator”) to etiological (e.g., “truly do they understand that the denominator has a role
here?”). This trend is markedly different from the responses of the Philadelphia
teachers, which largely consisted of purely procedural explanations of student error
(e.g., they added the two numerators together). In addition, we found that while “non-
explanations” (e.g., “students don’t like fractions,” “fractions are hard for them,” etc.),
126

Chapter 4: Learning to Learn from Interim Assessment Data
were present among the Cumberland teachers’ responses, they occurred less frequently
than among those of the Philadelphia teachers. Possible reasons for this difference are
addressed in chapter 6 of this report.
What is even more interesting is that this trend among Cumberland teachers of
seeking causes of student error led a handful of teachers to identify their mathematics
program as a potential source of student error and misunderstanding. One 5th-grade
teacher noted the use of alternative algorithms and spiraling curriculum as one such
source of error:
But this was tricky because they did have to use that partial sums
method. And he probably could have gotten the right answer if he had
just done regular addition. But this unit had them do adding, subtracting,
and multiplying, and they had to do different algorithms for all of them.
So, they got a little confused with partial sums and partial products.
At the same time, a couple of teachers mentioned that too strong a pedagogical focus on
one particular aspect of mathematics for an extended period of time can also lead to
errors on interim assessments. In one case, a 5th-grade teacher noted that some of her
students had calculated the area of a figure instead of the perimeter, which is what the
assessment item asked for. She explained:
Because what happens is in this particular unit one of the problems is that
perimeter is considered a secure skill. So it’s really not tested. It’s talked
about here briefly for like a blur, but everything else you practice is, find
the area, find the area, and it just gets habitual. Then you have to say,
“Did you read the question?”
Certainly the potential pitfalls that teachers mentioned here are not unique to the EM
program. What is intriguing is that in these cases, analyzing the interim assessment
results led some teachers to critique the curricular materials, approach, scope, and
127

Chapter 4: Learning to Learn from Interim Assessment Data
sequence as a possible source of student misunderstanding in very specific ways. This
level of specificity is important because it may lead teachers to seek specific ways to
address student errors, such as by better distinguishing the partial-products and the
partial-sums methods (in the first case) or by offering both perimeter- and area-
calculation tasks throughout the unit on area (in the second case).
As detailed above, the teachers in Cumberland were distinct from their
Philadelphia peers in that their responses tended to fall along a symptom-etiology
continuum and in that analyzing their students’ interim assessment results seemed to
give them more of an opportunity to critically approach their instructional program. We
found, however, that they more closely resembled teachers in Philadelphia with respect
to their remaining diagnoses. As with the Philadelphia teachers, the second most
common diagnosis of student error was other cognitive. Similar to the responses from
teachers in Philadelphia, these included students’ reading skills and need to “pay
attention.” While weak reading skills were mentioned as the most common diagnosis in
this group, difficulty comprehending unfamiliar vocabulary was not mentioned as often
as it was among the Philadelphia teachers.
Teachers in Cumberland also mentioned that some of their students needed to
“slow down.” A handful of teachers added test anxiety as a possible cause of error,
giving examples of cases that ranged from typical to clinical (e.g., “So once he starts
feeling pressure from a test, he gets the headaches and sometimes even has to go to
the nurse’s office to get medication”). It is important to mention, however, that these
differences may have less to do with students’ behavior than with teachers’ interpretation
of such behavior. For example, a listless student who cannot complete an assessment
could be seen as suffering from paralyzing test anxiety, laziness, or a profound lack of
understanding. We found that teachers in both districts almost always interpreted
student performance using other background knowledge they had of a student. In a
128
Chapter 4: Learning to Learn from Interim Assessment Data
similar instance, it was striking to us that while many teachers in Philadelphia mentioned
that students lacked academic support at home, among the Cumberland teachers,
parents were not referred to negatively. To the contrary, among the Cumberland
teachers it was largely expected that they could ask parents to work with their children
on specific mathematics skills. As mentioned above, teachers’ interpretations and
diagnoses are important, as they are often the first step toward a plan of action. In the
case of teachers in these two districts, we believe that differences in analysis of interim
assessment results lead to differences in instructional response.
A note on test validity and interpretation. When we heard teachers question
the validity of some interim assessment items, we decided to examine the School District
of Philadelphia’s explicit claims that the item distractors held instructionally actionable
information for teachers. In other words, we wanted to ascertain the degree to which the
interim assessments offered teachers information on which they could design
appropriate re-teaching. Because the Cumberland assessments were fashioned on the
EM end-of-unit tests and because they contained constructed-response and open-ended
items, we hypothesized that the Cumberland tests would offer teachers more
mathematically meaningful information that is relevant for modifying instruction than the
Philadelphia assessments.
We conducted a content analysis of the 3rd- and 5th-grade Cumberland and
Philadelphia interim assessments that were administered in January of 2007. We
enlisted the expertise of Ed Silver, the William A. Brownell Collegiate Professor of
Education and Mathematics at the University of Michigan, to help us determine for each
assessment item: a) what was being assessed, and b) what could be inferred from
(in-)correct answers? Among the Philadelphia assessments, only 6 of the 20 items in the
3rd-grade assessment and 5 of the 20 items in the 5th-grade assessment contained a set
of distractors reflecting multiple errors that typical students might have. Of these,
129

Chapter 4: Learning to Learn from Interim Assessment Data
however, only 2 to 3 contained information on mathematical misunderstandings, as
opposed to other sources of error (e.g., reading the problem correctly). This finding
confirmed our hypothesis that a potential reason for Philadelphia teachers’ reliance on
procedural diagnoses was that only 10 to15% of the items in an assessment allow for
more conceptual inferences to be drawn.
We did not expect, however, that the Cumberland assessment would contain
significant design weaknesses that affect teachers’ ability to draw mathematical
conclusions. It appears, however, that the more varied format introduced its own
hazards. While the 3rd-grade Cumberland assessment did contain 6 out of 23 items for
which student answers would reveal certain misunderstandings about place value and
an additional 2 items that held potential information about fraction-percent equivalents,
the majority of the items contained unclear expectations, answer choices that failed to
reveal typical student errors, or content that was simply “not very mathematical”. The
Cumberland 5th-grade assessment contained one item that would indicate an inability to
performs operations on mixed numbers and fractions as well as an additional 4 items
that could detect a lack of basic statistical vocabulary, but the vast majority of these
items had either unclear instructions or a design that did not support diagnosis because
the problem types were too mixed to allow for detection of misunderstanding across item
types.
It appears, therefore, that while teachers questioned the validity of interim
assessment items for different reasons, they were justified in challenging the validity of
these tests for instructional use. While we sampled only one assessment for each grade
in each district, we do not believe that these four assessments were atypically weak.
Furthermore, we specifically looked for any potential mathematical information that each
item held; it is certainly possible that the modal 3rd- or 5th-grade teacher may lack the
130

Chapter 4: Learning to Learn from Interim Assessment Data
capacity to make use of some of this information, depending on her own mathematical
knowledge. This is an important topic that we return to in chapter 6.
Instructional Response to Interim Assessment Data Whereas the Philadelphia and Cumberland teachers in our study shared a
commitment to using interim assessment scores, an analytic focus on low-scoring
students, and a desire to increase student mathematic understanding based on the
results of these assessments, we found that they differed in their instructional
responses, as reported to us in the interviews. While we observed variation within both
the Philadelphia and Cumberland groups, we found a larger discrepancy between the
instructional responses of the Philadelphia and Cumberland teachers. Because this
difference appears to have been shaped to some extent by the instructional supports
available to teachers, we review what these supports are. (More detail about the
supports can be found in chapter 3).
In Philadelphia, the classroom teacher is largely left on her own for the duration
of the mathematics lesson. While some may mentor student teachers or host volunteers
in their classrooms, the degree to which these additional adults have expertise or
interest in mathematics is both variable and unpredictable. While each Philadelphia
school had a school-based mathematics coach, coaches in some of the study schools
had significant responsibilities in addition to mathematics instruction, including their own
teaching load, making them a limited source of support. The Cumberland teachers, on
the other hand, had regular access to up to four people who served as resources for
instructional planning and teaching: the director of curriculum and instruction, a district
mathematics coach, a school-based elementary curriculum specialist (ECS), and a
school-based aide.
131

Chapter 4: Learning to Learn from Interim Assessment Data
The fact that most of these people worked inside the school made it easier for
teachers to use them for instructional support. In our interviews with the Cumberland
teachers, the ECS, mathematics coach, and mathematics aide were often cited as part
of instructional planning and were also available to work with students individually,
whether by push-in or pull-out. This extra support, in addition to slightly fewer students
in each classroom, also allowed the classroom teachers to spend more time with
individual students (we observed usually 1-on-1 or 1-on-3 groups). Furthermore, we
believe that having additional specialists to call on allowed the classroom teachers to be
more flexible in their instruction. For example, when there is expert support in the
classroom, the teacher of record can choose to work with higher performing students,
lower performing students, or a combination of these over time. Without such
classroom-level support in Philadelphia, we observed the teachers consistently working
with lower scoring students. Now that we have reviewed the supports available to the
Philadelphia and Cumberland teachers, we will detail teachers’ planned actions in
response to interim assessment results for each district separately.
Philadelphia teachers’ instructional responses. The teachers in Philadelphia
appeared to have some latitude in planning their lessons and activities during the 6th
week of the district’s instruction and assessment cycle, the re-teaching week. The
district’s expectations for how teachers should address their instruction were guided, at
least on paper, by the Benchmark Data Analysis Protocol (BDAP). As described in
chapter 3, this district-created protocol is designed to help teachers identify weak points
in their students’ performance, and articulate strategies for regrouping, re-teaching, and
reassessment. Additionally, it asks teachers to reflect on how they can better
differentiate their instruction to meet the needs of all students.
Beyond the BDAP, however, there seemed to be little guidance for teachers
about how to act upon their analyses of interim assessment data. Still, it appeared that
132
Chapter 4: Learning to Learn from Interim Assessment Data
many 3rd- and 5th -grade teachers adopted common instructional responses and
strategies. We noted teachers’ instructional responses to the assessments and their
approaches during the re-teaching week.
A “triage” approach. During the re-teaching week, 3rd- and 5th-grade teachers
in Philadelphia generally seemed to follow a “triage” approach to instructional planning
on the basis of interim assessment results, devoting the greatest amount of time and
effort to those students and content areas that most urgently required their attention. A
5th-grade teacher succinctly summed up this approach saying, “I can’t re-teach every
single thing.” Using their personal thresholds as barometers for their students’
mathematical mastery and understanding, teachers decided whom to target and what to
emphasize during the five days that followed the administration and scoring of the
interim assessment. In analyzing these results, many teachers looked for particular
items that the class scored low on and also determined if they were challenging for just a
few students or for many. According to a 3rd-grade teacher:
If it’s half the class…I’ll just re-teach the whole thing. But if it’s a few
children…, then I would definitively pull them out and get some special
homework for them to work on.
In general, teachers targeted the lower performing students and also those content
areas that proved the most problematic for students. Or, put another way, in the words
of a 5th-grade teacher, “I’m not going to waste a whole lesson re-teaching something that
90% of the students got. That’s just not beneficial for the other students.” Many teachers
described a similar approach. Below, a 5th-grade teacher described how she begins to
decide what content needs to be re-taught and to whom:
A lot of kids got the same ones wrong. Like, for example, [item] 5. There’s a lot
of kids who got [item] 5 wrong. And a lot of kids who got [item] 14 wrong. So,
133

Chapter 4: Learning to Learn from Interim Assessment Data
then I go back and I see, “Well, what was that question and what was it that the
question was asking?” …So, then, I would take a look at that and see, “OK, well,
I need to re-teach that.”
At the same time, many teachers took note of what they apparently had taught
well and, based on the results of the assessment, that their students had understood.
According to one 5th-grade teacher, “OK, [items] 6 and 7 look good…So, these two tell
me that they’re pretty solid on this. So, this isn’t something that I necessarily have to go
over.”
High-scoring students. Overall, there seemed to be less direct instructional
attention given to students who had scored high on the mathematics assessments.
While teachers mentioned their high scorers in interviews, in planning for the re-teaching
week their focus was on the students who had not done well. “Enrichment” for high-
scoring students often consisted of short-term activities, extra-worksheets, more EM
game times, and time on the computer. There was evidence from both 3rd- and 5th-
grades that high-scoring students received less direct instruction during the district’s re-
teaching week. A 5th-grade teacher remarked:
I don’t want to say [high-scoring students] get busy work, but they would
be the ones who I might give an independent or a small group project to
do, creating a graph. Everyday Math, our math series, has games.
They’re…educational games.
Teachers in Philadelphia often turned to their high scorers for instructional support in the
form of peer teaching. It was not uncommon for these higher scoring students to be
paired with their lower performing peers during the re-teaching week. As one 5th-grade
teacher noted, “[Students scoring in] the 50s and 65, I think I would definitely have them
working maybe with the higher students as peer tutoring.”
134

Chapter 4: Learning to Learn from Interim Assessment Data
Organization of re-teaching. Individual remediation during class time was rare
among the Philadelphia teachers in our study, due in part to lack of classroom support
for practices like conferencing. Instead, teachers in Philadelphia used a combination of
whole-group instruction, small-group instruction and peer teaching during the re-teaching
week. Teachers employed these different strategies at different times during the week
or even within a single mathematics lesson. Not surprisingly, they tended to respond to
more widespread errors with whole-class instruction. A 3rd-grade teacher spoke of this
particular practice, saying, “If almost half the class doesn’t have that, that’s something
that needs to be reviewed as a whole-class thing.”
Conversely, teachers appeared to favor small-group instruction when errors were
less common among students. Given the challenges often posed by meeting with small
groups during the regularly scheduled mathematics lesson, many teachers found time to
meet with groups of students outside of mathematics class. One 5th-grade teacher
described how she might meet with students needing additional instruction during the re-
teaching week, and how she would link this small-group instruction with the students’
experiences during class:
Probably, what I would do would be to ask them to come in the morning a
little bit early, because they’re here early enough. And I’m here all the
time early. So, for them to come—and maybe come with somebody else,
have a couple at a time come—and to work with them like that. You can
get a lot done in a very short time with that intensive kind of thing. And
then I would just kind of, like, keep an eye on them and if I—when we’re
talking about the topic, I would kind of help them build their confidence in
their ability to answer these questions by calling on them when I knew
that they knew the answers to these similar topics.
135

Chapter 4: Learning to Learn from Interim Assessment Data
A 3rd-grade teacher shared another way of arranging time for small-group practices:
I pull small groups in during recess. And I try not to take their recess. I
might just take a couple of minutes. I want everybody to go to the
board—“I want you to do two problems and then you can go out for
recess.”
A handful of teachers in Philadelphia had student teachers assigned to their
classrooms during the course of our study. Having a second adult in the classroom
allowed teachers to keep providing instruction to most of the class while the student
teacher sat with a small group of children in the back of the room, providing them with
some extra instructional support. A 5th-grade teacher described how she used a student
teacher to provide one-on-one instruction to a student having difficulty:
And now I have a student teacher, so I can have her work with students
that really just are not getting this. What we are working on today, one
student just was not getting it at all. So I sent her into the hallway with the
student teacher and they just worked on it. And then I’m in here, working
with the others.
In two of the Philadelphia schools, we observed regular volunteers in the
classroom. These volunteers, often retired citizens who helped out in the same
classrooms for as much as four hours a day, 3-4 times a week, would also work with a
small group of children needing additional instructional help.
As alluded to above, an additional strategy, often used to supplement whole-
group and small-group instruction, was peer teaching. In part, we suspect that peer
teaching proved such a popular instructional strategy for teachers because of limited
resources. That is, many teachers in the district were pretty much “on their own” in their
classrooms and relied on stronger students to help teach the students who had
performed less well on the interim assessments.
136

Chapter 4: Learning to Learn from Interim Assessment Data
When a 3rd-grade teacher was asked how she would re-teach a particular
concept, she replied:
This is where I would partner up the students that understood it versus
the students that didn’t understand it, and they can share their strategy,
because I always tell the kids that we all learn from each other, and that
someone else’s strategy might help you get the answer better. So, this is
where I would use the different groups and partners, where I might match
them up and someone who got a 95 versus somebody who got…a 60 can
maybe work with them to think of what they were thinking and go over it.
A 5th -grade teacher described her rationale for using this approach:
A lot of times I’ll get another student to help with that, because a lot of
times students are better with other students. And if you get a student
who’s really good at letting another student learn, not to show them, “This
is the answer. Write that down,” but explain…I have a couple students
that are really good at that, with explaining stuff.
At least one teacher expressed concerns about peer teaching, cautioning that “buddy
work is fine, but sometimes it doesn’t work. The other kids don’t want to do it, they’re
tired of doing it, they’re tired of helping.”
Procedural emphasis. Just as the Philadelphia teachers’ diagnoses
emphasized procedural shortcomings, these teachers’ re-teaching activities appeared to
focus first on retracing and correcting procedural steps. A 3rd-grade teacher described
how she would focus on “step by step” procedures and also on test-taking strategies:
Tell them to look for, like, key words and clue words and things like that.
Underline and pull out your information. And a lot of time they just…they
add it up. They’re not reading what the question is asking. So, that’s
another big thing that I take my time and teach…step by step. …It could
137

Chapter 4: Learning to Learn from Interim Assessment Data
take us a half hour to do one problem because I make sure that they pull
out the information.
Another 3rd-grade teacher referenced and credited the district’s mathematics
program for directing their instructional attention to procedural missteps:
Another nice thing I like about Everyday Math is that they structure so
many things and they give you so many nice sheets that you can give the
students where they are encouraged to answer a question in a certain
way so that, for instance with this kind of a problem, they have a sheet
that’s set up with a tenths column, a hundredths, a one, and so forth. And
I need to see them answer it in a certain way, if for no other reason that, if
it simply comes down to a student adding 3 and 4 incorrectly, I can see
that otherwise, they knew exactly which steps to do. And you know, 3
and 4 incorrectly, that’s one issue. That could have just been moving
quickly. But there’s the process in place. And that’s why looking at the
particular missed answers is so important.
Again, it appears that evident patterns in teachers’ analysis of interim
assessment data (in this case an emphasis on procedural diagnosis) were paralleled in
their planned instructional responses.
Changes in instructional practice. Despite this procedural emphasis,
analyzing these assessments appeared to prompt some teachers to adopt new or
different instructional practices. Many teachers held the belief that “teaching content
another way” would help lower performing students acquire skills and concepts the
second time around. A 3rd-grade teacher noted:
I would definitely try a different approach, because, obviously, they didn’t
get it the first way I did it. Or some kids develop at different stages. So,
they might get it the second time I teach it. I would try and do it…a little
bit differently.
138
Chapter 4: Learning to Learn from Interim Assessment Data
When another 3rd-grade teacher was asked if her teaching would vary during the re-
teaching week, she responded:
It depends. If most of the class got it right, got certain questions right,
then I would feel that it was a pretty effective way to teach that, and that
these children might just need a little extra push, a little more support, to
get it. And if they didn’t, the reason I would be in a small group with them
is to try to find out why that technique didn’t work for them, and whether I
need to change the vocabulary or the way I’m presenting it, or give them
more visual aids and more strategies.
Many times, this “other way” featured the use of visualization or manipulatives,
almost as a scripted response. While the use of multiple representations is an important
part of mathematical development, teachers’ use of these approaches did not seem to
depend on the content being taught, or even the errors that were made but rather, the
belief that variety of presentation, or exposure to multiple representations, is beneficial to
learning. When a 5th-grade teacher was asked how she would correct a misconception
about comparing the magnitude of fractions, she responded:
Different ways of looking at fractions, like maybe cups of water. Maybe
not so much 7/12 as maybe going back to just doing ⅓ , ½, and ¼, like
simply benchmark fractions that they might know. Because ask a kid to
give a fraction and they invariably say, “Oh, one-half!” And everything is
one-half. That’s their idea of a fraction. …Of course, it is a fraction, but
they don’t really know what that represents. And so what I would do is
probably go back to easy ones and start with that and then work up. I
would probably try to get them to give me the definition of what that
denominator is, and what that really means, and then go back and ask
them again if they thought that that was—they’d be happy with that part of
the pie. I might ask them to draw me a picture of what it is that they were
looking at. “Draw me 7/12 of a pie. Draw all of these and show me what
139

Chapter 4: Learning to Learn from Interim Assessment Data
this ate.” I might ask another question about how much is one-half of
something and three-fourths? I think the pictures would be—kind of let me
know. And so if they showed me 12, and then shaded in seven-twelfths,
then I’d be really stumped, because then I’d really have to talk to them
about it. Because that’s a serious—If they could actually represent 7/12
shaded in and all the pies were the same, I really would have to step back
and say, “What the heck are they thinking?” and then just maybe go back
and do—other than pies—some kind of manipulative. Maybe Hershey
bars or arrays or something like that.
Instructional follow-up beyond the re-teaching week. As noted elsewhere in
this chapter, the spiraling nature of the second edition of EM guaranteed that certain
concepts and content would be revisited for additional and more detailed instruction at
some point in the future—both within a given school year and from grade to grade.
Teachers well-versed in the curriculum knew that students who did not master particular
mathematical content in a specified time would have many more opportunities for
mastery later on.
While a small number of teachers noted that they might give a test or quiz at the
end of the 6th week to gauge their students’ understanding during the five days in which
they retaught, there did not appear to be any common or uniform “measurement” that
teachers administered to their students. When one six-week cycle ended (typically on a
Friday), a new cycle began the following Monday.
Cumberland teachers’ instructional responses.
Flexible grouping. Whereas the primary action that Philadelphia teachers took
in response to interim assessment results was to divide their students into groups
according to levels of performance, teachers in Cumberland viewed the interim
assessments as giving them information with which they continued their normal practice
of flexible grouping. In fact, much of the instruction that we observed in Cumberland
140
Chapter 4: Learning to Learn from Interim Assessment Data
was structured around this approach of grouping students by the understandings and
misunderstandings that had been revealed on various assessments. While this
approach may not seem so different from that found in Philadelphia, there are at least
two ways in which the theory differs from that of pulling aside lower performing students.
First, flexible groups are constructed not by level of performance alone, but by type of
misunderstanding. For example, in one class that we observed, the teacher had made
five groups out of her class; one of these consisted of students who had a lack of
understanding of place value, while another had shown consistent computational errors.
Instruction is then targeted to these specific areas of misunderstanding. While it is
possible for a teacher to use flexible grouping when alone in the classroom, the director
of curriculum and instruction in Cumberland explained that more support may be
needed:
…the ideal use of those is that those flex groups, you know, you’ve got
the teacher, maybe you schedule the ECS to come in, you schedule the
aide to come in. So, you have a variety of groups. You put your class
together with the teacher in the next room, so you have, again, more
flexibility in addressing the areas they need on the test.
The second distinguishing characteristic of flexible grouping is that, since it
makes use of students’ understandings on various mathematical concepts or strands, in
theory, the composition of the group should be flexible over time. To borrow from the
example above, the students who were having difficulty with place value may have no
such problem with measurement or geometry. Therefore, next week’s groupings could
look very different from this week’s groups. We received different impressions of the
extent to which grouping in Cumberland was truly “flexible,” or the extent to which it
consisted of leveled groups under a different name. We observed some classes where
grouping according to common (mis-)understandings was evident, and several teachers
141

Chapter 4: Learning to Learn from Interim Assessment Data
described how they kept groupings dynamic over time; for example, by allowing students
to self-select into groups. However, one ECS described the situation somewhat
differently:
So you have some children who do move in and out of groups, but there
tends to be a core group that just pretty much maintains itself for years,
sometimes. … But I think some children just need support.
These differing impressions of the degree to which grouping is flexible may be explained
by the fact that the lowest performing students can be referred to the ECS for learning
support. Therefore, while the ECS may see the same group of students over time for
remediation, within the classrooms, grouping is responsive to student understandings
that change over time.
High-scoring students. Although enrichment (both acceleration and extension)
were more common among classrooms in Cumberland, these students were most likely
to receive additional activities that were tied to the current curricular unit.
Instructional responses. In spite of a strong tendency to analyze interim
assessment results according to mathematical subcontent area, an approach that was
driven by the format of the IMS spreadsheet, the Cumberland teachers in our study
varied greatly in their approaches to instructional planning following the practice test.
Some teachers made a distinction between re-teaching and “completely re-teaching,”
where the former might include follow-up lessons or student-work examples on the
board and the latter referred to direct instruction on a concept or skill that was already
taught. As one 5th-grade teacher explained in response to the data scenario:
We might have to go back further and re-teach the whole denominator
concept, like maybe draw pie pieces and have them split up, and then
actually maybe— …maybe they need more of a tactile thing where they
draw the circles and actually build the fractions. I have done that with
142
Chapter 4: Learning to Learn from Interim Assessment Data
fractions. Sometimes you just need more practice with it. And
sometimes maybe in some—like something that they can do safe like
have them start comparing the different fractions to zero or one and try to
see where they fit. Like, for example, let’s say, five-ninths. Is that closer
to one or what do you think? And then talk about it, and then maybe
break it up like that.
This response may be related to the symptom–etiology interpretive continuum in that
teachers who understand the etiology of a misunderstanding may be more likely to know
when, what, and how to “completely re-teach.” Many of the teachers in Cumberland
mentioned that part of re-teaching involves re-teaching the concept; however, we also
observed and heard about more procedurally oriented approaches to re-teaching, such
as going through the practice test item-by-item with the whole class. One 3rd-grade
teacher described her approach as follows:
A: I gave them back. I went over everything with them. Q: When you went over, did you re-teach anything differently the way that you did it? A: No, I don’t think so. I think they just—the trade first was a difficult concept for them. And then they were adding and subtracting with two and three digit numbers, which I think was hard for a lot of them. And with the zeroes in it, so you can’t borrow from a zero, but they were. So, I just really had to—I did a lot of problems with zeroes in it on the board and stuff.
It is noteworthy that this teacher’s approach to a very difficult mathematical
understanding—the value of digits in a multi-digit number in relation to other digits in the
number—was to focus on the procedures in the operations. Again, this could be due to
the fact that while this teacher might be aware of a procedural symptom in looking at her
students’ errors, she does not view this error as indicative of a more underlying
conceptual misunderstanding.
143

Chapter 4: Learning to Learn from Interim Assessment Data
Like the teachers in Philadelphia, many teachers in Cumberland reported
exposing students to multiple representations, and particularly concrete manipulatives,
as part of re-teaching. We noted that Cumberland teachers were slightly more likely to
offer more specific detail about which representations they would use in order to respond
to which misconceptions. For example, one 3rd-grade teacher explained her reasoning
behind responding to an error on an item asking whether half of a dollar is more than
two-fifths of a dollar:
What I would do is I would give [the student] dimes, and I would tell her to
show me half of the dimes. And then I would give her the dimes back,
and tell her to take the dimes and put them into five equal groups and
now show me two-fifths and count them out. So I would make it so that it
could be broken into a half and broken into fifths. So if you give them the
dimes, it can convert to either way. You could also do it with pennies, but
it would just be too many pennies, you know, to sit there and work with
100 pennies. And some people might say that you should work with
pennies, but because I was directing it, I would do it with dimes. If it was
student directed, I would tell them maybe to do it with pennies or suggest,
“You know, you can do it with dimes. We’re going to do it with dimes,
because it’s going to be the easiest and the quickest way to do it.”
While we found that Cumberland teachers offered more detail (and more mathematical
detail) in their reasoning behind the use of particular manipulatives, also found overlap
between these groups in that a number of Philadelphia teachers also gave
mathematically detailed responses. Chapter 6 will address the role that teacher capacity
may have played, but it is also possible that the differing assessments and the different
levels of classroom support played a role as well. The fact that the Cumberland
assessment, for example, features an open-ended item, may have led those teachers to
look at student work on assessments more carefully, and such analysis have better led
teachers to instructional remedies. Or, it could be that Cumberland’s emphasis on
144
Chapter 4: Learning to Learn from Interim Assessment Data
continuous formative assessment and flexible grouping helped those teachers develop a
sense of which approaches worked best in response to which student errors.
In addition, we cannot overlook the fact that the Cumberland teachers in our
study had slightly smaller class sizes and more classroom instructional support than the
Philadelphia teachers. Perhaps more Philadelphia teachers in our study would have
reasoned in detail about choice of manipulatives if they thought that they would have the
time and support to work with individual students. Finally, we did not study the effect of
manipulative use on student understanding, so we cannot know if the Cumberland
teachers’ choices lead to greater student understanding. In fact, some teachers in
Cumberland mentioned that connecting concrete representations to abstract concepts or
formal representations remained a challenge for their instruction.
Conclusion
In both Philadelphia and Cumberland, the use of interim assessments was nearly
universal among teachers in our sample. Teachers used interim assessment results
primarily to identify weaknesses in their classes, either in terms of content areas or
individual students. The ways in which they went about doing so were greatly influenced
by the technology available to them. In both districts, the IMS presented interim
assessment data to teachers in ways that shaped their interpretation of results. In
Cumberland, for instance, the IMS drew attention to content areas where students
struggled, while in Philadelphia teachers were able to view percentages of correct
answers by student or item as well. The availability of the items themselves within the
IMS also influenced teachers’ analysis process. The steps taken by Philadelphia
teachers also conformed to the expectations of the BDAP. As described in Chapter 3,
the BDAP asked teachers to identify in writing both content areas in which their students
struggled and strategies they would adopt to address those areas. This both established
145

Chapter 4: Learning to Learn from Interim Assessment Data
an expectation that teachers would review interim assessment results and guided
teachers through a process for doing so.
Also common across districts was the tendency of teachers to check the validity
of specific items on interim assessments. The validity of items might be called into
question for a variety of reasons, including the extent to which it required reading skills
or background knowledge, or whether or not it had been adequately covered according
to the district’s pacing calendar. In general, teachers did not question the validity of
specific items on which their students had performed well.
Presented with percentages of correctly answered items by the district IMS, we
found that Philadelphia teachers developed individual “thresholds” for re-teaching—
trigger points that would lead them to focus on a specific student or topic based upon
interim assessment performance. Such thresholds were not evident in Cumberland, in
part because areas of concern were pre-defined by the district IMS, and were not
determined by a fixed percentage of correct items but rather fluctuated based on the
number of items in a given content area.
Across both districts, however, a similar set of factors influenced teachers’
interpretation of interim assessment results. These included the past performance of
individual students (based on interim assessments and other sources of information), the
performance of the class as a whole, and teacher perceptions of the difficulty of
particular content. In Philadelphia, teachers’ interpretation of results was also shaped by
the district’s pacing schedule; the amount of time they were able to devote to specific
topics informed their expectations for student performance. It is also possible that the
classroom-level supports available to teachers influenced ways in which teachers
interpreted interim assessment results. Although this seems to run contrary to the
typical “gather, interpret, plan, act” cycle found in much of the data-driven decision
making literature, we should recognize that teachers are well aware of the degree to
146

Chapter 4: Learning to Learn from Interim Assessment Data
which they have access to quality instructional support even as they are interpreting
assessment results. We should allow for the possibility that teachers with access to
fewer supports find less meaning in data because they know that they do not have to
capacity to act on more complex and meaningful interpretations. Philadelphia teachers,
for example, could not take three days out of their pacing calendar to truly re-teach place
value, even if that was suggested by the assessment results. Likewise, teachers with
students or volunteers in their classrooms might be able to conduct small group
activities, but they could not rely on this support to offer high-quality re-teaching of
fundamental mathematical concepts.
Figure 4.1 presented a simple model to illustrate the process most teachers
followed in analyzing and acting on interim assessment data. Based on the analysis
presented in this chapter, Figure 4.2 below presents a more detailed view of the analysis
process.
147

Chapter 4: Learning to Learn from Interim Assessment Data
Figure 4.2. Teachers’ Interpretation of Interim Assessment Data
Overall, it appears that teachers analyzed interim assessment data in two ways.
First, they used it to locate errors, a process that focused on whether or not students
answered items correctly, usually by content area. Students who appeared to struggle
were identified as needing additional support, though the range of supports available to
teachers varied by district. Similarly, content areas in which the class as a whole
struggled were identified for re-teaching. Second, when prompted by our questioning,
teachers were able to use interim assessment data to diagnose errors, a process that
focused on why students answered items incorrectly by looking at individual students’
responses to specific items (or in some case, groups of students’ responses to items).
Some of these diagnoses were mathematical, while others were more generally
cognitive, social, or cultural. Outside of mathematical diagnoses, teachers offered a
range of other cognitive explanations for why students might have answered items
incorrectly. These included other cognitive diagnoses, such as reading challenges, lack
of sustained attention, carelessness, limited English proficiency, or test anxiety.
Additionally, Philadelphia teachers sometimes offered contextual or external diagnoses,
Conceptual Etiology
Procedural Symptom
Interpretation of interim assessment results
Location of error • Based on number of
correct/incorrect responses • By student • By content area
Diagnosis of error
Mathematical
Other
148

Chapter 4: Learning to Learn from Interim Assessment Data
which focused on background social or cultural factors that affected student
comprehension, language use, or behavior. Examining teacher planning in response to
contextual or external diagnoses is a possible area for further analysis, since it seems
that a teacher’s concept of his or her role and/or agency in facing this type of challenge
can vary greatly. For example, some teachers may use diagnoses of this type to
demonstrate the lack of influence that their instruction can have on student performance,
while other teachers may believe that it is primarily because of these external obstacles
that they must try even harder to increase their students’ learning, or to advocate on
behalf of students for additional supports or resources.
Within mathematical diagnoses, differences in teachers’ analyses were evident
both within and across districts. In each district, teachers ranged from focusing primarily
on identifying errors to exploring the sources or causes of those errors. However, how
they did so varied by district. In general, the analyses of Philadelphia teachers could be
located on a procedural–conceptual continuum, where Cumberland teachers’
interpretation of student error fell along a symptom–etiology continuum. To be sure,
these continua are not mutually exclusive; diagnoses that delve into students’
conceptual understanding are more likely to be etiological in nature than those that are
procedural. The diagnoses of Philadelphia teachers who diagnosed conceptually had
more in common with those of Cumberland teachers who did so etiologically than they
did with their colleagues who focused more on procedure or symptom, respectively. The
symptom–etiology focus of Cumberland teachers does, however, suggest a higher level
of mathematical specificity in interpreting student errors. Procedural diagnoses primarily
consisted of a comparison of steps taken by students to solve a problem with the steps
taught by the teacher; error is defined by the degree of deviance from these steps. By
comparison, symptom diagnoses require teachers to locate evidence of weaknesses in
student understanding, even if they do not explore the reason or source of those
149
Chapter 4: Learning to Learn from Interim Assessment Data
weaknesses. Potential explanations for these apparent differences across districts are
explored in chapter 6.
In sum, teachers’ analyses of interim assessment data varied both within and
across districts, served multiple purposes, and unfolded at different levels. As chapter 5
will show, the level at which the data were analyzed was strongly related to the
instructional strategies employed in response. This pattern was evident not only for
interim assessments, but for other types of formative assessment as well.
150

Chapter 4: Learning to Learn from Interim Assessment Data
References
Baroody, A.J. (2003). The development of adaptive expertise and flexibility: The integration of conceptual and procedural knowledge. In A.J. Baroody & A. Dowker (Eds.), The Development of Arithmetic Concepts and Skills. New York: Routledge. (pp. 1-34).
Baroody, A.J., Feil, Y., & Johnson, A.R. (2007). An alternative reconceptualization of
conceptual and procedural knowledge. Journal for Research in Mathematics Education, 38, 115-131.
de Jong, T., & Ferguson-Hessler, M.G.M. (1996). Types and qualities of knowledge.
Educational Psychologist, 3, 105-113. Hiebert, J., & Lefevre, P. (1986). Conceptual and procedural knowledge in
mathematics: An introductory analysis. In J. Hiebert (Ed.), Conceptual and procedural knowledge: The case of mathematics. Hillsdale, NJ: Erlbaum. (pp. 1-27).
Nabors Oláh, L., Lawrence, N., Goertz, M., Weathers, J., Riggan, M., & Anderson, J.
(April, 2007). Testing to the test? Expectations and supports from interim assessment use. Paper presented at the annual meeting of the American Educational Research Association, Chicago.
Rittle-Johnson, B., & Siegler, R.S. (1998). The relation between conceptual and
procedural knowledge in learning mathematics: A review. In C. Donlan (Ed.), The development of mathematical skill. Hove, UK: Psychology Press. (pp. 75-110)
151

CHAPTER 5 Interim Assessments in the Context of Teachers’ Formative
Assessment Practice1
Because evidence of the impact of formative assessment on student learning is
promising, a considerable body of research has sought to isolate specific formative
assessment types or practices for the purpose of identifying those that contribute most
directly to improved student outcomes. These include instructionally embedded practices
such as choice of task, quality of discourse, questioning strategies, and quality of
feedback (Black & Wiliam, 1998); teacher-constructed performance assessments
(Shepard, et al., 1996); externally designed curriculum-embedded formative
assessments (Shavelson, et al., 2008); and externally designed interim assessments
(Henderson, et al., 2008; Quint, et al., 2008; Christman, et al., 2009).
The interest in highlighting those specific formative assessment tools, practices,
routines, or teacher skills that most directly impact learning is justifiable and
understandable. Figuring out which formative assessment strategies will leverage the
greatest benefit for students is an important policy challenge. On the other hand, it is
generally recognized that none of the specific formative assessment tools, strategies, or
practices described above exist in a vacuum. Each is embedded within teachers’
instructional planning and practice, as well as within school and district context. While
composed of various domains or components, instruction is a multidimensional, complex
practice. Attempts to measure instructional quality suggest that good teaching requires
teachers to clearly communicate their expectations to students, design rich and
challenging assignments, and encourage focused and productive dialogue in the
classroom (Matsumura, et al., 2006), as well as create classroom social environments
1 This chapter was written by Matthew Riggan.
152

Chapter 5: Interim Assessments in the Context of Teachers’ Formative Assessment Practice
that promote healthy social and emotional development (Pianta, et al., 2009). Further,
definitions of formative assessment note the overlap of different formative assessment
types. In some cases this overlap is temporal (Wiliam & Leahy, 2006). In others, good
assessment becomes, appropriately, difficult to distinguish from good teaching or good
curriculum (Shavelson, et al., 2008; Black & Wiliam, 2006). Any understanding of
specific formative assessment tools or practices must therefore take into account the
context in which they are enacted or adopted.
Despite this recognition, little research to date has considered the interaction of
different types of formative assessment within the context of individual teacher practice.
In their study of a small sample of middle-grades teachers implementing a specific
Foundational Approaches to Science Teaching (FAST) unit, Herman and others (2006)
examined the ways in which teachers employed both question routines and embedded
written assessments to elicit students’ conceptual understanding of science content,
provide appropriate feedback, and respond instructionally. Overall, they found that even
among a sample of highly engaged and experienced teachers with strong content
knowledge, formative assessment practice across types or activities remained “basic.”
Teachers infrequently assessed for conceptual understanding, provided only cursory
feedback to students, and did not consistently respond instructionally to feedback
received. While this study applied a holistic notion of formative assessment quality to
multiple tools and practices, it did not explore the relation between teachers’ use of
question routines and written assessments. Indeed, Herman and others (2006) note that
few studies have examined the ways in which teachers “orchestrate” the range of
assessment tools and practices available to them.
This chapter addresses this gap in the research by describing the role of interim
assessments in Philadelphia and Cumberland within the wider context of teachers’
formative assessment practice. In exploring their use of interim assessments, chapter 4
153

Chapter 5: Interim Assessments in the Context of Teachers’ Formative Assessment Practice
concluded that teachers analyzed data in two ways. First, they used it to locate errors,
focusing on whether or not students got items correct. Second, in response to our
prompts, they used it to diagnose those errors, focusing on why students might have
gotten certain items wrong. In doing so, some teachers looked at the manifestations of
the error (procedural or symptom analyses) while others looked for the source or cause
of the error (conceptual or etiology analyses). The previous chapter also suggested that
teachers’ interpretation of interim assessment data was enhanced and complemented by
information from other sources, some of which was obtained through other formative
assessment practices. For example, some teachers reported asking students about
their responses to interim assessment items, or reviewing students’ actual test booklets
to see their work. Finally, chapter 4 found that how teachers analyzed data, and what
resources were available to them, led to different types of instructional planning.
Taking a broader look at teachers’ formative assessment practice, this chapter
builds upon these findings. It examines the prevalence of both locating and diagnosing
error within different types of formative assessment. It then explores the relationship
between how teachers interpret formative assessment information and the type of
instructional strategies they employ in response. Finally, it considers the ways in which
different types of formative assessment intersect with or reinforce one another within
teachers’ practice, and the extent to which those intersections inform both the analysis
process and ensuing instructional response.
In keeping with the conceptual framework for this study, the analysis presented
here assumes that while interim assessments are not by definition formative, information
generated from those assessments may be used formatively by teachers. As such, for
the purposes of this analysis, interim assessments are treated as a type of formative
assessment to the extent that the interpretation of results by teachers leads to an
154

Chapter 5: Interim Assessments in the Context of Teachers’ Formative Assessment Practice
instructional response. The nature of that interpretation and the ensuing response is a
primary focus of this chapter.
As described in chapter 1, the overarching research question guiding this
analysis is: in what ways are interim assessments situated within the wider context of
teachers’ formative assessment practices and tools? Specifically, we focus on four sets
of questions:
1. To what extent do teachers focus on students’ conceptual understanding in their
use of formative assessment? To what degree is this consistent across formative
assessment types? How does it influence teachers’ instructional response?
2. How much variation is evident in teachers’ formative assessment practice? To
what extent and in what ways do teachers respond instructionally to information
generated through formative assessment?
3. Do different types of formative assessment serve different purposes within
teachers’ instructional practice?
4. How do teachers connect or sequence different types of formative assessment?
To what degree do different formative assessment types inform one another?
While there are few instances of these research questions being explored
empirically, the literature on formative assessment suggests some hypotheses about
how the different types might relate and how they might be employed within the practice
of individual teachers. First, because formative assessment is so thoroughly woven into
instruction, and the quality of instruction is known to vary widely even within schools
(Rowan, Correnti, & Miller, 2002), it is reasonable to expect that there would be
considerable variation in the ways in which teachers employ formative assessment
practices, irrespective of type. More specifically, one might expect to find variation in the
quality of formative assessment practice across teachers, with quality defined as both
teachers’ ability to penetrate the “mental life” of students based on their work (Black, et
al., 2002) and their ability to act deliberately on those inferences.
155

Chapter 5: Interim Assessments in the Context of Teachers’ Formative Assessment Practice
Second, while all formative assessment is intended to elicit information about
students’ thinking in order to improve instruction, current research on interim
assessments suggests that their ability to generate information about students’
understanding is limited (see chapter 1). On the other hand, well constructed
assessment tasks and question routines have been shown to produce useful feedback
about students’ thinking (Sadler, 1998; Stiggins, Griswold, & Wikelund, 1989). This
suggests a certain complementarity between interim and short-cycle formative
assessment practices, though the specific nature of the relation between them likely
depends on teacher capacity to make full use of both.
Finally, if the two hypotheses presented above hold true, a third might be that the
most effective teachers connect and make use of multiple forms of assessment more
than their less-skilled peers. Shepard and colleagues (2005) argue that effective
teachers must gather formative assessment information using a variety of tools and
processes, integrating all of that information into a framework that allows them to
“scaffold” their instructional responses in order to allow students to progress toward
learning goals.
Methods
The analysis presented here is built upon interview and observation data
captured in the teacher profiles described in chapter 2. Of the 39 profiles constructed, a
total of 32 (14 from Cumberland and 18 from Philadelphia) were included in the analysis.
The remaining seven were excluded because they did not contain sufficient data to
analyze across assessment types (see below).
Teacher profiles. The profiles organized teachers’ formative assessment practice
according to three types: interim, short-cycle, and teacher-developed.
156

Chapter 5: Interim Assessments in the Context of Teachers’ Formative Assessment Practice
• Interim assessments: interim-scored assessments designed to measure the
performance of an entire class over an extended period of time.
• Short-cycle assessment: practices employed by teachers within a single class
period to determine the extent to which students grasp a specific concept or task.
• Teacher-developed assessments: tools developed or adopted by teachers to
gauge student understanding. While some teacher-made assessments may also
be incorporated into short-cycle assessment, others may extend across multiple
class periods.
Teacher profiles consolidated coded data from three interviews with field notes
from paired observations for each teacher in the sample. A matrix crossed formative
assessment types (interim, short-cycle, and teacher-developed) with steps in the
formative assessment cycle aligned with the study’s conceptual framework and data
collection protocols (collection, interpretation/analysis, and action). This allowed the
research team to analyze different stages of the cycle of instructional improvement
across formative assessment types, looking specifically for patterns or variation both
within and across teachers.
To examine the ways in which teachers employed different types of formative
assessment practice, each profile was analyzed using two standard criteria. First, the
analysis considered the extent to which there was evidence that teachers focused on
students’ conceptual understanding rather than simply noting or correcting errors, where
“conceptual” refers to students’ understanding of why a given response or approach is or
is not correct (Hiebert & Lefevre, 1986). With reference to the process outlined in Figure
4.2, this criterion refers to the extent to which teachers employed mathematical
diagnoses that tended toward the conceptual-etiology end of their respective continua.
Second, the analysis noted the extent to which the data showed teachers to be
completing the formative assessment cycle (collection, interpretation, and action).
157

Chapter 5: Interim Assessments in the Context of Teachers’ Formative Assessment Practice
Specifically, it focused on the types of instructional responses associated with both
different types of formative assessment and differing degrees of conceptual focus.
In addition to evidence related to these two criteria, the analysis of teacher
profiles focused on the specific ways in which teachers linked or sequenced formative
assessment activities across types. For example, if a teacher asked specific questions
of students based upon his analysis of their performance on an interim assessment, the
profile summary would note that he sequenced interim assessment interpretation with
short-cycle collection. Similarly, if a teacher designed a performance task or test based
upon her interpretation of student work completed in groups the previous day, the profile
summary would note that she had sequenced short-cycle interpretation with teacher-
developed collection. In addition to noting all observed sequences for each teacher, the
profile summaries contained notes on how such sequences were observed.
Evidence of completing the formative assessment cycle and assessing for
conceptual understanding was considered for each formative assessment type in each
profile. This evidence was summarized using a simple binary format; if there was at
least some evidence that a teacher assessed for conceptual understanding in using
short-cycle practices, for instance, that criterion was checked “yes” on the profile
summary. This analysis resulted in a single matrix which summarized: a) the extent to
which each teacher completed the formative assessment cycle for each type; b) the
extent to which each teacher assessed for conceptual understanding for each formative
assessment type; c) specific links or sequences of formative assessment practice across
stages of the cycle and formative assessment type; and d) additional notes providing
details, references to specific transcripts or observations, or contextual information for
each teacher.
Limitations of this analysis. Analyzing patterns in teacher practice using a
large, qualitative data set requires considerable consolidation and reduction of data.
158
Chapter 5: Interim Assessments in the Context of Teachers’ Formative Assessment Practice
Cross-case analysis of this type is important for the broader relationships it reveals, but it
comes at the cost of nuance and detail. Further, data collected for this study focused
primarily on teachers’ use of interim assessments. While teacher interviews and
observations yielded a considerable amount of data about short-cycle and teacher-
developed formative assessments, data collection protocols focused less on these
practices. In two cases, available data were insufficient to determine the ways in which
teachers used short-cycle or teacher-developed assessments, while in others the
amount of data focused on these formative assessment types varied. Finally, while
steps were taken to standardize both observation protocols and teacher profile formats,
it must be acknowledged that variation always exists across both classrooms and
researchers. Invariably, this results in some degree of bias at each level of analysis.
While the frequency of observations noted in this analysis is intended to serve as an
indicator of the prevalence of certain relationships or practices, the reader is cautioned
not to interpret these frequencies too rigidly, but to focus instead on the broader
relationships those frequencies suggest.
Conceptual Focus in Formative Assessment Practice
There was considerable variation in the extent to which teachers employed
different formative assessment types to explore students’ conceptual understanding of
mathematics. For the purposes of this analysis, evidence of teachers exploring
students’ conceptual understanding included their efforts to deliberately identify
underlying conceptual causes of student error, draw out explanations of reasoning,
explore multiple or alternative problem-solving strategies, or to tie new concepts or
procedures to students’ prior knowledge. Table 5.1 shows the number of teachers in the
sample that used different types of formative assessment conceptually.
159
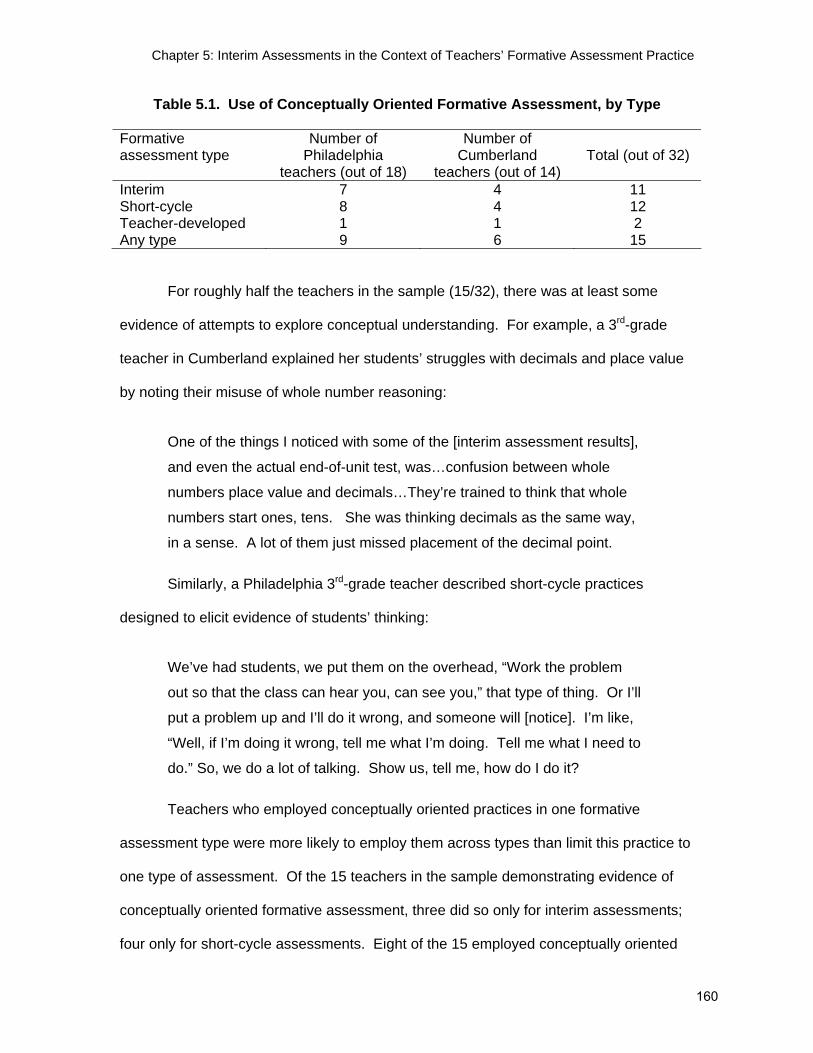
Chapter 5: Interim Assessments in the Context of Teachers’ Formative Assessment Practice
Table 5.1. Use of Conceptually Oriented Formative Assessment, by Type
Formative assessment type
Number of Philadelphia
teachers (out of 18)
Number of Cumberland
teachers (out of 14)
Total (out of 32)
Interim 7 4 11 Short-cycle 8 4 12 Teacher-developed 1 1 2 Any type 9 6 15
For roughly half the teachers in the sample (15/32), there was at least some
evidence of attempts to explore conceptual understanding. For example, a 3rd-grade
teacher in Cumberland explained her students’ struggles with decimals and place value
by noting their misuse of whole number reasoning:
One of the things I noticed with some of the [interim assessment results],
and even the actual end-of-unit test, was…confusion between whole
numbers place value and decimals…They’re trained to think that whole
numbers start ones, tens. She was thinking decimals as the same way,
in a sense. A lot of them just missed placement of the decimal point.
Similarly, a Philadelphia 3rd-grade teacher described short-cycle practices
designed to elicit evidence of students’ thinking:
We’ve had students, we put them on the overhead, “Work the problem
out so that the class can hear you, can see you,” that type of thing. Or I’ll
put a problem up and I’ll do it wrong, and someone will [notice]. I’m like,
“Well, if I’m doing it wrong, tell me what I’m doing. Tell me what I need to
do.” So, we do a lot of talking. Show us, tell me, how do I do it?
Teachers who employed conceptually oriented practices in one formative
assessment type were more likely to employ them across types than limit this practice to
one type of assessment. Of the 15 teachers in the sample demonstrating evidence of
conceptually oriented formative assessment, three did so only for interim assessments;
four only for short-cycle assessments. Eight of the 15 employed conceptually oriented
160

Chapter 5: Interim Assessments in the Context of Teachers’ Formative Assessment Practice
practices in both interim and short-cycle assessments. In other words, if a teacher used
any type of formative assessment to assess conceptual understanding, they were more
likely to use multiple types for formative assessment to that end. For example, on the
misconception scenario (see chapter 2 for details on data collection), a 5th-grade
Cumberland teacher was able to diagnose that a student did not consider the size of the
whole when comparing fractions, and suggested using multiple representations to
illustrate this concept. Observations for the same teacher revealed short-cycle question
routines aimed at determining whether student-developed algorithms were conceptually
grounded. In another example, a 5th-grade Philadelphia teacher identified a student’s
inappropriate use of whole-number reasoning as the reason for their error on an interim
assessment fraction problem. In observations, the same teacher elicited multiple
strategies from students in solving multiplication problems, asking students not only
whether each attempt would work, but why. In each of these cases, the teacher
demonstrated capacity to explore students’ conceptual understanding using multiple
formative assessment tools or processes. This pattern would seem to indicate that the
capacity for assessing students’ conceptual understanding of mathematical ideas is
“portable” across formative assessment types.
Interestingly, the eight teachers who assessed for conceptual understanding in
multiple ways came from just three of the schools in our sample; four other schools had
no teachers exhibiting conceptually oriented practices across formative assessment
types. It is possible that one school’s mathematics program contributed to greater
conceptual focus, or that schools that focused more narrowly on test preparation (often
with good performance results) inadvertently undermined a more conceptually oriented
practice. There was little evidence, however, to confirm either of these hypotheses.
This is more likely anomalous, with teacher capacity weighing more heavily than school
161

Chapter 5: Interim Assessments in the Context of Teachers’ Formative Assessment Practice
factors. (The relationship between teacher capacity and formative assessment practice
is further explored in chapter 6.)
Variation in Teachers’ Formative Assessment Practice
Across the sample, there was widespread evidence of teachers completing the
formative assessment cycle—collecting information, interpreting it, and acting on it
instructionally—for all three formative assessment types. Table 5.2 shows the number
of teachers for whom there was evidence of completing the cycle for each formative
assessment type.
Table 5.2. Completion of the Formative Assessment Cycle, by Type
Formative assessment type
Number of Philadelphia
teachers (out of 18)
Number of Cumberland
teachers (out of 14)
Total (out of 32)
Interim 18 14 32 Short-cycle 14 10 24 Teacher-developed 13 10 (2 N/A) 23
All 32 teachers in the sample linked their analysis of interim assessment data to
instruction in some way. And while it was somewhat less common for teachers to act on
short-cycle information, there was evidence of such actions for three quarters of the
teachers in the sample. Similarly, teacher-developed formative assessment feedback
was linked to instruction in more than three quarters of the cases. In the remaining
cases, there was generally evidence of collection and interpretation of information, but
no evidence of action based on that interpretation. Again, we should caution that as the
focus of this study was teachers’ use of interim assessment data, we may have
underestimated the proportion of teachers who linked short-cycle or teacher-developed
assessment to instruction.
162

Chapter 5: Interim Assessments in the Context of Teachers’ Formative Assessment Practice
Teachers acted on their interpretation of formative assessment feedback in
different ways, and probably with different degrees of success (subsequent student
“uptake” of instruction was not addressed in this study). Likewise, making instructional
decisions based on formative assessment information is not necessarily the same thing
as changing instructional practice. To study the type of instructional adjustments made
by teachers in response to formative assessment, each profile was recoded to classify
teachers’ strategies in responding to formative assessment information. Teachers
whose instructional response was primarily limited to who or what to re-teach were
classified as employing organizational strategies. Those teachers who also showed
evidence of focusing on how to re-teach were classified as employing instructional
change strategies. Instructional change strategies were defined as any attempt to
change the way content was taught. Such changes might be procedural (e.g.,
introducing a new algorithm), conceptual (e.g., having students construct alternate
models or representations for their answers), or both. The defining characteristic of
instructional change was that the mode of instructional delivery differed from the initial
teaching of that content.
Nearly all of the teachers in the sample used formative assessment (of all types
to make decisions about how to organize instruction; approximately half (17/32) used it
primarily or only for this purpose. Specifically, formative assessment information was
used to determine:
• What content to re-teach,
• Which students need additional support,
• Whether and how students should be grouped during re-teaching, and
• When to move on to the next concept or topic.
163

Chapter 5: Interim Assessments in the Context of Teachers’ Formative Assessment Practice
It is clear that these decisions were based on teachers’ analysis of data or
feedback from different types of formative assessment. As such, they constitute
instructional actions that effectively complete the formative assessment cycle, and even
serve as evidence of differentiated instruction. There is little doubt that these decisions
influenced the setting in which teaching and learning occurred. However, none of the
decisions described above required teachers to adjust the ways in which they actually
taught specific content. A 3rd-grade Cumberland teacher described the process of re-
teaching subtraction problems based on interim assessment results:
A: I went over everything with them.
Q: When you went over, did you re-teach anything differently the way that
you did it?
A: No, I don’t think so. I think they just—the trade first was a difficult
concept for them.
In addition to the organizational strategies described above, roughly half of the
teachers in the sample also showed evidence of employing instructional change
strategies. These teachers changed their approach to teaching specific content or skills
in response to formative assessment information. The fact that only half the teachers in
the sample did so raises questions about the likely impact of more general formative
assessment practices on student learning, since the most compelling evidence of the
link between formative assessment and student achievement focuses more specifically
on how instruction changes based upon feedback. Indeed, one might even question the
extent to which these practices might be termed “formative” at all, as one widely held
criterion for that label is the likelihood that teachers make better instructional decisions
based on feedback obtained (Black & Wiliam, 2009).
164

Chapter 5: Interim Assessments in the Context of Teachers’ Formative Assessment Practice
Conceptual Focus and Instructional Response
As noted above, a slight majority of teachers in the sample employed primarily
organizational strategies in response to formative assessment information. The
remaining teachers (15/32) responded with instructional change strategies. Not all of
these adjustments were conceptually grounded, nor were they all focused on a specific
type of feedback. As discussed in chapter 4, many teachers simply opted for teaching
content “a different way,” or made greater use of manipulatives in the hope that an
alternate presentation might help students to grasp material with which they had
struggled. While these instructional responses are not ideal, they represent a step
toward appropriate use of formative assessment information, an intermediate stage in
which teachers moved beyond the “who” and “what” of instructional response and
squarely into the “how.”
165
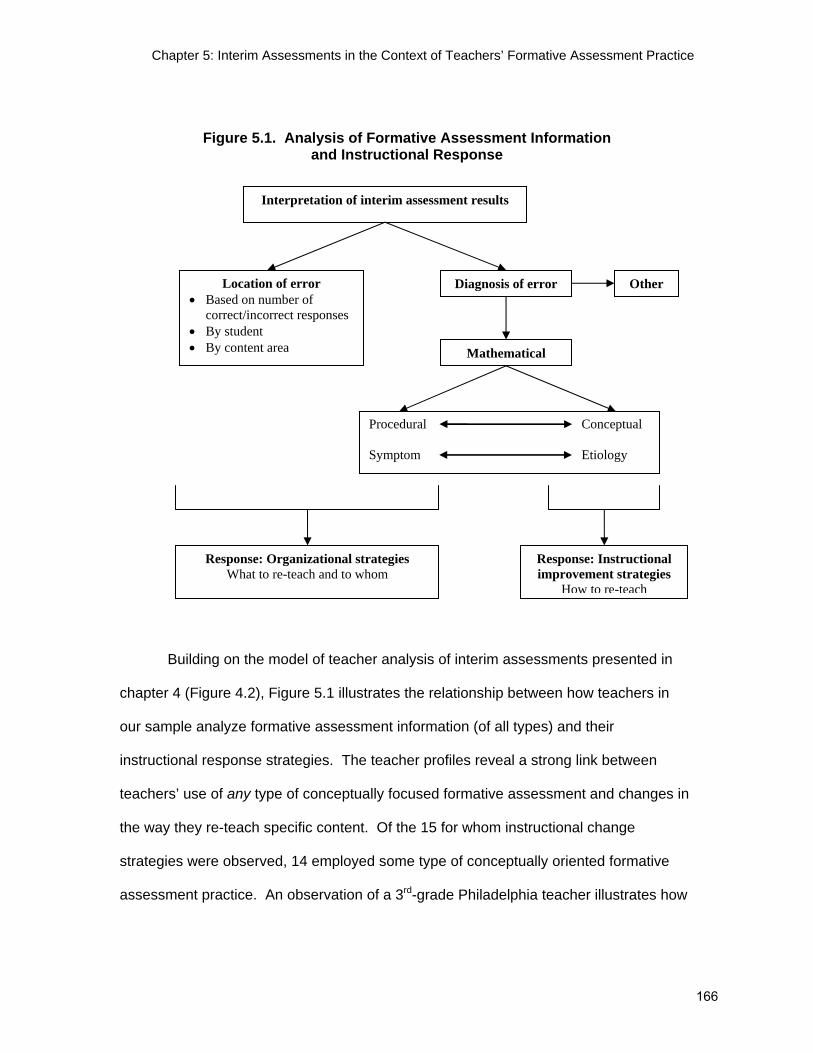
Chapter 5: Interim Assessments in the Context of Teachers’ Formative Assessment Practice
Figure 5.1. Analysis of Formative Assessment Information and Instructional Response
Building on the model of teacher analysis of interim assessments presented in
chapter 4 (Figure 4.2), Figure 5.1 illustrates the relationship between how teachers in
our sample analyze formative assessment information (of all types) and their
instructional response strategies. The teacher profiles reveal a strong link between
teachers’ use of any type of conceptually focused formative assessment and changes in
the way they re-teach specific content. Of the 15 for whom instructional change
strategies were observed, 14 employed some type of conceptually oriented formative
assessment practice. An observation of a 3rd-grade Philadelphia teacher illustrates how
Conceptual Etiology
Procedural Symptom
Interpretation of interim assessment results
Diagnosis of error
Mathematical
Other
Response: Organizational strategies What to re-teach and to whom
Response: Instructional improvement strategies
How to re-teach
Location of error • Based on number of
correct/incorrect responses • By student • By content area
166

Chapter 5: Interim Assessments in the Context of Teachers’ Formative Assessment Practice
short-cycle practices (questions and student answer cards) informed conceptual re-
teaching of shapes and area.
The question requires students to find the area of a polygon. Before the
teacher even asks for answers, [she] asks students if they remember the
concept. It is clear that [she] anticipated the possibility of student struggle.
When nearly every student in the class added the sides and put up an
answer card with perimeter, the teacher opted to re-teach the concept.
She went to the board and drew out an 8*8 array counting all the boxes
on the inside. She put 8 * Y = 64. (One student did answer correctly
before the array and explained that you had to multiply 8 by 8 but the
teacher provided the full-class explanation anyway.)
Among the 17 teachers who employed organizational responses, only one
focused on students’ conceptual understanding of mathematical ideas. This strongly
suggests that unless teachers analyze formative assessment information for conceptual
understanding, the resulting instructional responses will continue to be organizational in
nature, and unlikely to significantly alter the ways in which content is taught.
The importance of teachers’ understanding and responding to students’
conceptual understanding of mathematical ideas is well documented in the literature.
The analysis presented here is consistent with these findings. It suggests that the key to
teachers using interim assessments to improve instruction is no different than the key to
their using any type of assessment to improve instruction: they must be adept at using
assessment to deepen their understanding of students’ mathematical thinking. Our
analysis suggests that in the absence of such a conceptual focus, the adjustments
teachers make to their instruction are likely to remain organizational. While this might
allow for individual or groups of students to receive supplemental support (if such
supports are available), it is unlikely to change teaching practice, in turn limiting the
prospects for meaningfully improving student learning.
167

Chapter 5: Interim Assessments in the Context of Teachers’ Formative Assessment Practice
How Teachers Use Different Types of Formative Assessment
This section focuses on the ways in which teachers used different types of
formative assessment, and the degree to which different teachers linked or sequenced
formative assessment activities.
Teacher use of different forms of assessment. As described in chapter 4, the
most common uses of interim assessment data by teachers in the sample were
organizational: determining what to teach and to whom. In general, teachers identified
areas of weakness (either content or individual students) and planned accordingly.
These organizational practices were routine even for teachers who also employed
instructional change strategies.
With regard to short-cycle practices, it should first be noted that not all
questioning routines were considered to be formative assessment practice. Many such
routines, like other teacher-student interactions observed, focused primarily on directing
students toward a correct answer rather than eliciting information about their thinking or
process. These interactions were not included in the present analysis, as their intent
was not to elicit information but rather to direct student responses.
While variation across the sample was noted, teachers used short-cycle and
teacher-developed formative assessments in related but different ways. Short-cycle
practices were most often used to get students to explain their thinking, or to allow
teachers to observe their problem-solving processes. This action was most often
characterized by open-ended questions, such as “how did you get that answer?” These
questions were asked in response either to student vocalizations or to problems that
students had solved independently. Eliciting this feedback was at times a corrective in
itself. In describing their process aloud, students would discover their own errors.
168

Chapter 5: Interim Assessments in the Context of Teachers’ Formative Assessment Practice
Like short-cycle practices, teacher-developed formative assessments were used
to elicit additional information about students’ problem-solving processes, but were also
used as post-assessments to determine the degree to which students had mastered
specific content. This information informed pacing decisions (whether the class could
move on to a new unit, for example) and in some cases assisted teachers in planning
from one day’s lesson to the next. A 3rd-grade teacher from Philadelphia explained this
function:
Q: Thinking back to previous re-teaching, after you’ve spent five days
presenting the material again to the children, the concepts, do you test for
mastery in any way, either formally or informally?
A: I would say both. Like quizzes, like maybe three problems on a
particular skill. And any quizzes. Not unit tests in Everyday Math. No.
Teacher-made tests.
Interestingly, teacher-developed formative assessments were rarely used to
assess students’ conceptual understanding. As shown in Table 5.1, among the 15
teachers in the sample whose assessment practice suggested a focus on students’
conceptual understanding, 12 employed short-cycle practices to that end, compared to
just two that did so with teacher-developed assessments.
Sequencing of formative assessment types and activities. There was
evidence of some type of sequencing of formative assessment activities across type for
almost every teacher in the sample. Nearly all sequences involved the teacher moving
from interpretation or action on a first type of formative assessment information to
collection of a second type. The most commonly observed patterns showed teachers
moving from interpretation of interim assessment data to collection of short-cycle
information. This sequence was observed for 18 of 32 teachers in the sample, and
169

Chapter 5: Interim Assessments in the Context of Teachers’ Formative Assessment Practice
served several purposes. Most often, short-cycle practices were used to elicit more
information about why students answered interim assessment items in the way that they
did. This pattern was observed for 12 of the 18 teachers. Two teachers specifically
noted they did so to distinguish between students who genuinely did not understand the
content and those who merely made “careless mistakes.” Two other teachers suggested
that they used interim assessment data to figure out which questions to ask students in
upcoming classes. An observation of a 5th-grade Cumberland teacher illustrated this
process:
Teacher: “Yesterday, we took the practice test. After looking at the practice
tests, I noticed that the things that many of you didn’t get right we hadn’t gone
over…Many of the volume questions, you didn’t get right”…
Teacher draws a 3-D rectangular figure on the overhead and asks the students
how many “faces” the shape has. She calls on two different students; one says
“five faces” and the second student says “six faces.” Teacher then asks class,
“How many say five faces?” and counts hands in the air. “How many say six
faces?” and she counts hands. There are more hands for six faces than for five.
“Why are there six faces?” teacher asks, “why not five?”
Slightly less common (13 of 32 teachers) was the sequencing of interpretation of
interim assessment data with collection of information from teacher-developed
assessments. Ten teachers reported that, like short-cycle practices, these assessments
were used to gather more information about student problem-solving processes. And,
as noted earlier and discussed below, teacher-developed assessments were used to
gauge student progress or mastery of re-taught content (post-assessment) or to make
pacing decisions.
To a slight extent, sequencing of formative assessment practices varied by
district. For instance, teacher-developed assessments were employed more often in
170

Chapter 5: Interim Assessments in the Context of Teachers’ Formative Assessment Practice
Philadelphia to assess the extent to which students had mastered content that was re-
taught following the administration of interim assessments. This likely resulted from the
timing of the assessment cycle itself: administration of the interim assessment was
followed by a scheduled re-teaching week, after which teachers were expected to move
on to new content without any additional district-mandated or curriculum-embedded
assessment, such as end-of-unit tests. In the absence of such assessments, teachers
substituted their own to determine whether students had mastered the content they had
re-taught. In Cumberland, interim assessments were closely aligned with the timing of
end-of-unit tests, which served a similar function to the use of teacher-developed
assessments in Philadelphia.
There was also some evidence that Cumberland teachers used short-cycle (and
in some cases teacher-developed) assessment to determine the timing of interim
assessment administration. This was likely a function of the flexibility teachers had in
timing these assessments and of the fact that a summative (end-of-unit) assessment
normally followed closely after.
Several other linkages across formative assessment type were less pervasive
but noteworthy. In six instances, teacher-developed assessments were employed to
assess the impact of actions taken as a result of short-cycle assessment. This pattern
was more common in Philadelphia, where it was evident in the practice of 5 out of 18
teachers. Also in Philadelphia, three teachers reported using interim assessment
findings to confirm their interpretations of feedback from short-cycle or teacher-
developed assessments.
The previous section noted that teachers who were able to assess for conceptual
understanding more often than not did so using more than one formative assessment
type. It also noted, however, that conceptually oriented formative assessment was not
the norm for roughly half of the teachers in the sample. The analysis presented here
171

Chapter 5: Interim Assessments in the Context of Teachers’ Formative Assessment Practice
suggests that overall, teachers use different types of formative assessment for different
(though in some cases overlapping) purposes. In some cases, they scaffold different
formative assessment types in accordance with these purposes. The most common
example was the following of interim-assessment analysis with the collection of
additional short-cycle feedback focused on students’ problem solving process.
Discussion and Implications
Taken together, these findings present a complex, and at times contradictory,
view of teachers’ formative assessment practice, and the role that interim assessments
play within that practice. It is clear that teachers interpret and act on the information
generated through formative assessment of all types, but those actions are not always
transformational. Half of the teachers studied employed primarily organizational
strategies when acting on formative assessment information. All other things being
equal, there is little reason to think that simply “repackaging” instruction—re-teaching
specific content to specific students—will help students to understand content any better
than they did prior to re-teaching. As noted in earlier chapters, however, all other things
are not equal. The analysis presented in this chapter focuses on how teachers
responded to formative assessment information in their own classrooms, with their own
students. In Cumberland, students identified as struggling had far greater access to
instructional supports beyond the classroom than those in Philadelphia. It is possible
that these individual or small-group interactions with mathematics tutors or specialists
provided additional opportunities for conceptually oriented formative assessment. If this
were the case, an organizational strategy for responding to interim assessment data
might be appropriate. In Philadelphia, where such instructional supports were in short
supply, it is more difficult to see how organizational strategies alone would contribute to
improved student learning.
172

Chapter 5: Interim Assessments in the Context of Teachers’ Formative Assessment Practice
If the central goal of formative assessment is the improvement of instruction, then
it is critical to attend to those factors and processes that contribute to instructional
change. Teachers who assessed for conceptual understanding were far more likely to
employ instructional change strategies that those who did not. Further, teachers who
focused on conceptual understanding using one type of formative assessment were
more likely to do so for all types of assessment. This suggests that analytic or
diagnostic capacity is the key to effective formative assessment, regardless of whether
those assessments are embedded within instruction, developed by teachers, or
externally designed. And while there is no doubt that the quality of assessment tools
matters a great deal, it is worth noting that teachers with high capacity for analyzing
formative assessment information were able to draw out ideas about students’
conceptual understandings even using interim assessments that were poorly suited for
such analyses (see our note on validity of interim assessment for instructional use in
chapter 4).
Teachers use different types of formative assessment for different purposes.
Interim assessments are most often used to identify weak content areas or students
within a class, while short-cycle practices are most often used to gather additional
information about how students solved problems. Teacher-developed assessments
played a similar role, but also had a post-assessment function, sometimes informing
teachers’ pacing decisions. Interestingly, there appeared to be no relationship between
the type of formative assessment used and the likelihood of assessing for conceptual
understanding, or of employing instructional change strategies. Given the evidence
base for short-cycle practices (Black & Wiliam, 1998), one might expect such practices
to be more conceptually oriented than, for example, interim assessments. From this
analysis, however, it appears that teacher capacity overrides these differences. This
suggests that efforts to improve instruction through formative assessment should focus
173

Chapter 5: Interim Assessments in the Context of Teachers’ Formative Assessment Practice
first and foremost on the degree to which teachers are able to understand students’
thinking and reasoning based on assessment information.
There was considerable evidence that interim assessments structure and guide
other types of formative assessment. In themselves, interim assessments appear
limited in their capacity to inform teachers about students’ thinking or problem solving,
but they give direction to short-cycle and teacher-developed assessments that may be
better suited to that purpose. While the analysis presented here did not find that short-
cycle or teacher developed formative assessment was more likely to be used
conceptually, the type of information generated by these assessments did appear to be
better suited to conceptual diagnoses, as it provided teachers with more information
about students’ reasoning and problem-solving processes. This suggests that while
there is little evidence that directly associates interim assessments with improved
student learning, such assessments may play an important role within a broader system
of formative assessment. Such systems are currently the focus of several development
efforts (Herman, et al., 2006; Shavelson, et al., 2008).
This analysis suggests that future research should focus to a greater extent on
how different types of formative assessment—both tools and processes—interact with
and support one another within the context of teachers’ practice. Specific attention
should be given to what combinations or sequences of assessment use are most likely
to help teachers to understand students’ thinking, and the types of professional
development and support needed to help them do so.
174

Chapter 5: Interim Assessments in the Context of Teachers’ Formative Assessment Practice
References
Black, P., & Wiliam, D. (1998). Assessment and classroom learning. Assessment in Education: Principles, Policy & Practice, 5(1), 7–75.
Black, P., & Wiliam, D. (2006). Developing a theory of formative assessment. In J. Gardner (Ed.), Assessment and learning (pp. 81-100). London: Sage.
Black, P., & Wiliam, D. (2009). Developing the theory of formative assessment. Educational Assessment, Evaluation and Accountability, 21(1), 5-31.
Black, P., Harrison, C., Lee, C., Marshall, B., & Wiliam, D. (2002). Working inside the black box: Assessment for learning in the classroom. London: GL Assessment.
Christman, J., Neild, R., Bulkley, K., Blanc, S., Liu, R., Mitchell, C., & Travers, E. (2009) Making the most of interim assessment data. Lessons from Philadelphia. Philadelphia, PA: Research for Action.
Henderson, S., Petrosino, A., Guckenburg, S., & Hamilton, S. (2008). A second follow-up year for "Measuring how benchmark assessments affect student achievement." REL Technical Brief. REL 2008-No. 002. Newton, MA: Regional Educational Laboratory Northeast & Islands.
Herman, J., Osmundson, E., Ayala, C., Schneider, S., & Timms, M. (2006). The nature and impact of teachers’ formative assessment practices. CSE Technical Report 703. Los Angeles, CA: National Center for Research on Evaluation, Standards, and Student Testing.
Hiebert, J., & Lefevre, P. (1986). Conceptual and procedural knowledge in mathematics: An introductory analysis. In J. Hiebert (Ed.), Conceptual and procedural knowledge: The case of mathematics. Hillsdale, NJ: Erlbaum. (pp. 1-27).
Matsumura, L., Slater, S., Junker, B., Peterson, M., Boston, M., Steele, M., & Resnick, L.
(2006). Measuring reading comprehension and mathematics instruction in urban middle schools: A pilot study of the Instructional Quality Assessment. CSE Technical Report 681. Los Angeles, CA: National Center for Research on Evaluation, Standards, and Student Testing.
Pianta, R., & Hamre, B. (2009). Classroom processes and positive youth development: Conceptualizing, measuring, and improving the capacity of interactions between teachers and students. New Directions for Youth Development, 121, 33-46.
Quint, J., Sepanik, S., & Smith, J. K. (2008, December). Using student data to improve teaching and learning: Findings from an evaluation of the Formative Assessments of Students Thinking in Reading (FAST-R) program in Boston elementary schools. New York, NY: MDRC.
175

Chapter 5: Interim Assessments in the Context of Teachers’ Formative Assessment Practice
Rowan, B., Correnti, R., & Miller, R. (2002). What large-scale, survey research tells us about teacher effects on student achievement: Insights from the prospects study of elementary schools. Teachers College Record, 104(8), 1525-67.
Sadler, D.L. (1998). Formative assessment: Revisiting the territory. Assessment in Education: Principles, Policies, and Practice, 5, 77-84.
Shavelson, R.J., Young, D.B., Ayala, C. C., Brandon, P. R., Furtak, E. M., Ruiz-Primo, M. A., Tomita, M. K., & Yin, Y. (2008). On the impact of curriculum-embedded formative assessment on learning: A collaboration between curriculum and assessment developers. Applied Measurement in Education, 21(4), 295-314.
Shepard, L., Flexer, R.J., Weston, T.J., Marion, S.F., Mayfield, V., & Hiebert, E.H. (1996). Effects of introducing classroom performance assessments on student learning. Educational Measurement: Issues and Practice, 15(3), 7-18.
Shepard, L., Hammerness, K., Darling-Hammond, L., & Rust, F. (2005). Assessment. In L. Darling-Hammond & J. Bransford (Eds.), Preparing teachers for a changing world: What teachers should learn and be able to do (pp. 275-326). San Francisco: Jossey-Bass.
Stiggins, R., Griswold, M. M., & Wikelund, K. R. (1989). Measuring thinking skills through classroom assessment. Journal of Educational Measurement, 26(3), 233-46.
Wiliam, D., & Leahy, S. (April, 2006). A theoretical foundation for formative assessment. Paper presented at the American Educational Research Association annual meeting, San Francisco, CA.
176
CHAPTER 6
Doing More with Less? The Relationship Between Teacher Capacity and Formative Assessment Practice1
Chapter 5 described the relationship between assessment type, assessment of
conceptual understanding, and instructional response. We found that teachers who
assess for conceptual understanding are likely to do so across assessment types and
that teachers who employed instructional change strategies were more likely to use
some kind of conceptually oriented formative assessment practice than teachers who
used only organizational strategies. Because we wanted to examine our data in light of
claims that interim assessment use can lead to conceptually oriented formative
assessment practice, we acknowledged including conceptually oriented practices of
various quality in this definition. Therefore, while the patterns of practice that we found in
chapter 5 are revealing, they stop short of evaluating the mathematical quality or rigor of
such teacher practices. Because the quality of mathematics instruction has been linked
to student achievement gains (Hill, et al., 2007), the analysis in this chapter will explore
the relationship between teachers’ mathematical knowledge for teaching, their reported
analysis designed to uncover and address student misconceptions, and their observed
instruction in mathematics.
Specifically, we want to know whether or not an individual teacher’s level of
content knowledge in mathematics appears to contribute to analysis of assessment data
and to formative assessment practices in teaching mathematics for understanding. This
is a potentially important consideration when looking at teachers’ use of assessment
data, yet current practice assumes that all teachers are equally capable of utilizing such
information. In the analyses presented in this chapter, we explore the relationship
1 This chapter was written by Leslie Nabors Oláh.
177

Chapter 6: The Relationship Between Teacher Capacity and Formative Assessment Practice
between two measures of teacher capacity—subject-specific knowledge for teaching
and analysis of student understanding—and reported and observed instruction in
mathematics. The purpose is not to confirm these relationships, but rather to build
hypotheses that can be tested in subsequent studies.
We view the relationship between teacher capacity and formative assessment
practice as illustrated in Figure 6.1:
Figure 6.1. The Relationship between MKT, KST, and Teachers’ Formative
Assessment Practice.
From this perspective, higher levels of one component of teacher capacity, mathematical
knowledge for teaching (MKT), are hypothesized to lead to higher levels of another form
of teacher capacity, Knowing Student Thinking (KST). Knowing Student Thinking is seen
as a sub-set of a teacher’s formative assessment practice in mathematics. KST is
specific in that it focuses on teachers eliciting and responding to student misconceptions.
Although this is one part of formative assessment practice in mathematics, it does not
include many other practices that would be considered formative. For example, the
promotion of student self-assessment is seen as an important part of a teacher’s
formative assessment practice (Black & Wiliam, 2006), and there may be specific ways
to accomplish this in mathematics, but this is not considered part of KST. At the same
Mathematics Knowledge for Teaching
Knowing Student Thinking
Teacher Formative Assessment Practice in
Mathematics
178

Chapter 6: The Relationship Between Teacher Capacity and Formative Assessment Practice
time, KST practices may affect a teacher’s formative assessment practices in
mathematics more generally. For example, through using manipulatives in a small-group
setting, a teacher may see that her students do not have a clear grasp of the
mathematical goal of the unit. This realization could lead the teacher to recognize that
she must more explicitly communicate learning goals to her students. While the ultimate
action is not part of the KST component, it is a highly desired formative assessment
practice that originated from a KST activity (Black & Wiliam, 2006). This permeable
border between KST and teachers’ formative assessment practice in mathematics is
represented by a dashed line. The following two sections briefly review the research
literature on teacher capacity and formative assessment action in mathematics
instruction and serve to support our conceptual framework.
Teacher Capacity
Subject-specific knowledge for teaching. In 1987, Lee Shulman (1987)
introduced the construct of ‘pedagogical content knowledge’— “subject matter
knowledge for teaching” (p. 9) to discern the content knowledge that an average person
needs in everyday life from the knowledge and skills one needs to teach that content
area. In mathematics, the earlier work of Deborah Ball and her contemporary colleagues
spurred interest in “mathematical knowledge for teaching,” or MKT. While Shulman’s
pedagogical content knowledge (PCK) construct includes knowledge of the content area,
subject-specific curricula, as well as general pedagogical techniques, Hill, Schilling, and
Ball (2004) focus on the link between subject-specific knowledge and teaching such
knowledge by asking the following question: “What mathematical knowledge is needed
to help students learn mathematics?” (p. 15). In this way, MKT foregrounds content-area
knowledge in a way that PCK does not. It is believed that MKT positively impacts both
mathematics instruction and, ultimately, students’ mathematical development.
179
Chapter 6: The Relationship Between Teacher Capacity and Formative Assessment Practice
Several studies have demonstrated the impact of MKT on both instructional
practice and on student achievement outcomes. Borko and colleagues (1992) describe a
lesson in which an elementary school teacher with both completed course work in
Calculus and a desire to teach conceptual mathematics falls short in her attempt to
review division of fractions because her own knowledge of fractions was “superficial and
fragmented” (p. 206). While Borko and others’ study precedes quantitative
measurement of MKT, the situation they describe clearly illustrates the link between
MKT and teaching mathematics. Over a decade later, Ball and colleagues developed an
instrument for quantitatively measuring MKT. In a study of over 700 teachers and nearly
3,000 students, Hill, Rowan, and Ball (2005) found that mathematical knowledge for
teaching measured in this way “was the strongest teacher-level predictor” of student
achievement in mathematics, “exhibiting more of an effect than teacher background
variables and average time spent on mathematics instruction each day” (p.396). In a
more recent in-depth study of five elementary and middle school teachers, Hill and
colleagues (2008) found “a powerful relationship between what a teacher knows, how
she knows it, and what she can do in the context of instruction” (p. 496). They note that
the most obvious way in which teachers with greater MKT serve their students’ learning
of mathematics is through “avoidance of error” (p. 497), and they are also adept at
raising the level of mathematical rigor in instruction.
Another conduit through which MKT potentially impacts student achievement in
mathematics is through formative assessment. We could reason that teachers with
greater MKT are able to elicit valuable information about students’ development in
mathematics in a way that teachers with weaker MKT cannot. Also, teachers with
greater MKT may know how to respond to student questions and errors in a way that
furthers students’ understanding of mathematics in a way that teachers with weaker
MKT cannot. While this relationship between knowledge for teaching and formative
180

Chapter 6: The Relationship Between Teacher Capacity and Formative Assessment Practice
assessment practice in mathematics has not been studied on a large scale, in her study
of two teachers’ formative assessment practices, Anne Watson (2006) found that her
teachers were “concerned with learning more about learning and yet their discussions
with students are not about complex engagement with mathematics and their formative
assessment practices do not provide explicit information about mathematical progress”
(p. 299).
In addition to asking what teachers know about mathematics for teaching, we
should also consider what they know about the development of mathematical knowledge
and about learning more generally. While the MKT measures teacher responses to static
situations, many educators believe it is also important for teachers and assessment
developers to know how mathematical reasoning develops. For example, the National
Research Council report Knowing What Students Know urges that assessment design
begin with “a model of learning,” supported by empirical research (2001, p. 178-79). In a
similar vein, formative assessment advocates have long recognized the need for
teachers to know: a) where students are in their learning; b) where they need to go; and
c) how to get there (Black & Wiliam, 1998, 20066). While this study does not directly
focus on this type of teacher knowledge, we do consider how teachers’ knowledge and
beliefs about learning mathematics provide a context for their assessment practice. In
addition, we must consider how teachers come to know what their students do and do
not understand in mathematics.
Teacher analysis of student understanding. Over a decade after describing
PCK, Shulman (2000) argued that the “oldest problem in pedagogy” was not lack of
teacher knowledge per se, but rather “the appearance of learning, or illusory
understanding” (emphasis in the original, p. 131). That is, how is a teacher to know the
degree to which her students’ understanding matches with her own (or with a
developmentally appropriate alternative)? In elementary mathematics, examining
181

Chapter 6: The Relationship Between Teacher Capacity and Formative Assessment Practice
teachers’ thinking in the moment of instruction is crucial to increasing student learning,
as “the decisions made by teachers, before, during, and after instruction are a dominant
influence on what is learned by students” (Fennema & Franke, 1992, p. 156). Deborah
Ball (1993) states it plainly: “Good teachers respect children’s thinking. They view
students as capable of thinking about big and complicated ideas….” (p. 384). In
particular relevance to our larger study of interim assessment use, teachers’ decisions
represent an important link between assessment results and classroom instruction.
Current reform curricula in mathematics require teachers and students to
become partners in learning, exploring mathematical ideas together and sharing
understandings. Yet, this is not an easy step for most teachers to make (Sherin, 2002).
In the best-case scenario, student understandings act as a catalyst for improving teacher
knowledge, beliefs, and instruction (Fennema, Carpenter, Franke, Levi, Jacobs, &
Empson, 1996). A less than ideal outcome is instructional practice that is relatively
smooth on the surface, if only because there are no deep mathematical currents to make
waves (Cohen, 1990). So, what would a reasonably coherent practice of knowing
student thinking in mathematics look like?
Progress in this area of research owes much to cross-cultural work on
mathematics teaching and learning. In earlier studies of general mathematics instruction,
it was noted that the instructional approaches to mathematics differ between countries.
In one of the earliest studies on mathematics instruction, Stigler and colleagues (1987)
pull no punches when they describe the fact that, “American children were frequently left
alone to work at their seats on material in mathematics that they apparently did not
understand well…they also spent remarkably little time attending to their teachers…” (p.
1284-1285). The impression is clearly one of teachers and students engaged in parallel
universes within the same classroom. While mathematics reform has changed
expectations for mathematics instruction, important differences still exist. Liping Ma
182

Chapter 6: The Relationship Between Teacher Capacity and Formative Assessment Practice
(1999) notes that one main difference between Chinese and U.S. teachers in a lesson
using manipulatives to demonstrate subtraction with re-grouping is that “Chinese
teachers said that they would have a class discussion following the use of
manipulatives” so that students could “report, display, explain, and argue for their own
solutions (p. 20). A common theme throughout these studies is that U.S. teachers have
been wary to engage in real mathematical discussions with students, opportunities in
which they may come to better understand student thinking.
Using the lessons learned from these earlier studies, An, Klum, & Wu (2004)
propose a framework for analyzing teacher understanding and supporting of students’
learning in mathematics: Knowing Student Thinking (KST).
In this process, the teacher does not only focus on conceptual
understanding and procedural development, making sure students
comprehend and are able to apply the concepts and skills, but also
consistently inquires about students’ thinking (p.149).
This proposed construct has four components: (a) addressing or identifying students’
misconceptions, (b) building on students’ math ideas, (c) engaging students in math
learning, and (d) promoting students’ thinking in mathematics.
In their study of Chinese and U.S. teachers, An, Klum, and Wu (2004) found
differences in KST such that the Chinese teachers emphasized conceptual knowledge,
but relied on a “rigid development of procedures,” while the U.S. teachers engaged
students in a number of activities, but with “a lack of connection between manipulatives
and abstract thinking, and between understanding and procedural development.” (p.
170). We believe that KST is an important factor to consider on the road from MKT to
increased student understanding of mathematics. Certainly, making use of assessment
results, not to mention re-assessing students’ knowledge on an ongoing basis, relies
heavily on teachers’ knowing students’ thinking in mathematics.
183

Chapter 6: The Relationship Between Teacher Capacity and Formative Assessment Practice
Formative Assessment Action in Mathematics Instruction
As alluded to above, a large part of formative assessment practice in
mathematics consists of minute-by-minute observations of students and elicitation of
student understanding. At the same time, an underlying assumption of the interim
assessment movement is that these tests will lead to improved instruction, either by
providing suggestions for instructional improvement or by spurring further formative
assessment activity in the classroom. These assumptions, however, remain largely
untested. One study of interim assessments in elementary mathematics found that 86%
of the teachers reported making instructional modifications “because of the interim
assessments” (Clune & White, 2008, p. 10). However, these researchers did not ask
what types of modifications were made nor did they enter classrooms. As we showed in
chapter 5, teachers can modify instruction in various and even multiple ways.
While we do not yet have a complete picture of what an ideal integrated
formative assessment practice in elementary mathematics would look like (and for whom
and under what conditions), we do have some indications of practices that are more
likely to: a) reveal student understanding, and b) increase students’ engagement and
interaction with mathematics. These would include: implementation of tasks that are
sufficiently rigorous to reveal student understanding; recognition of learning processes
(e.g., student strategies, mathematical development, etc.) as well as outcomes;
generation of mathematical discourse and questioning; integration of assessment and
instruction; explicit communication of learning goals; students’ self-assessing; use of a
variety of appropriate mathematical representations; and ongoing modification of
instruction based on student understanding (Black & Wiliam, 2006; Heritage & Niemi,
2006; Shepard, 2000; Watson, 2006). We believe that understanding the relationship
184

Chapter 6: The Relationship Between Teacher Capacity and Formative Assessment Practice
between these practices, knowing student thinking, and teachers’ mathematical
knowledge for thinking is crucial for improving assessment and instruction in
mathematics. Furthermore, this understanding may highlight the ways in which interim
assessments do and do not contribute to instruction in elementary mathematics.
Research Questions
Given the previous research findings, as well as hypothesized relationships
among knowledge, learning, and teaching, we identified the following set of research
questions:
1. Is there variation in Mathematical Knowledge for Teaching among our sample of
teachers? If so, what factors (e.g., district or grade) account for such variation?
2. Is there variation in Knowing Student Thinking practices reported by teachers in
our sample? If so, what is the nature of this variation? In other words, are some
KST practices more widespread than others?
3. What is its relationship between MKT and KST?
4. Are there differences in the observed classroom practices (focusing on formative
assessment practices during “re-teaching” time) between teachers with high,
medium, and low MKT scores?
Methods
In order to answer these research questions, we drew on a variety of data
sources: a standardized measurement of teacher’s MKT, teacher responses to common
student misconceptions in mathematics, teacher responses to their own interim
assessment data, classroom observations and de-briefing interviews, and assessment
and instructional artifacts. Data collection and analysis are detailed in chapter 2. Here,
185

Chapter 6: The Relationship Between Teacher Capacity and Formative Assessment Practice
we briefly review the methods by which we approached our research questions for this
analysis.
Mathematical Knowledge for Teaching (MKT). To measure our teachers’
MKT, we distributed a survey following our final teacher interview. This survey was
composed of nine multiple-choice items from the Content Knowledge for Teaching-Math
(CKT-M) instrument that focused on K-8 numbers and operations. The CKT-M was
developed by researchers at the University of Michigan to measure “the knowledge
teachers use in classrooms, rather than general mathematical knowledge [emphasis in
original]” (Hill, Rowan, & Ball, 2005, p. 387; see also Hill, Shilling, & Ball, 2004). The
CKT-M creators chose nine items to maximize reliability while lessening the time burden
on teachers to complete the survey. Some items contained multiple scoreable
components, resulting in a total of 14 possible points for the 3rd-grade survey and 16
possible points for the 5th-grade survey. Each teachers’ score was derived from the
percentage of number correct so that teachers could be analyzed across grades.
Information gained from these items was sufficient to categorize participating teachers
into three groups: those with high, average, and low mathematical knowledge for
teaching, relative to the other teachers in our sample. We achieved a response rate of
82%.
The returned CKT-M surveys were scored and double checked by two members
of the research team. In keeping with recommendations from the CKT-M development
team, the percentage of items each teacher got correct was transformed into a z-score,
indicating his or her rank among the sample. Because the number of items administered
was adequate only to form three categories of teachers, the distribution of z-scores was
then examined for potential groupings. This examination revealed a bimodal distribution
with peaks both below -1.00 SD and above 1.00 SD. This led us to create a categorical
variable for each teacher indicating Low, Medium, or High levels of MKT.
186

Chapter 6: The Relationship Between Teacher Capacity and Formative Assessment Practice
Misconception scenarios. Educational policy researchers have used
misconception scenarios as a proxy for classroom practice when large-scale observation
is not possible (cf. Stecher, Le, Hamilton, Ryan, Robyn, & Lockwood, 2006). Our
purpose was different, however. We wanted to discover how teachers in our sample
interpreted assessment results with an eye toward KST. An, Kulm, and Wu (2004)
devised scenarios and a categorization rubric to examine teacher response to student
understanding of mathematical concepts. Based on their four-part conceptual framework
of Knowing Students’ Thinking, these researchers describe ways in which teachers
report that they would: a) address students’ misconceptions, b) engage students in math
learning, c) build on students’ ideas, and d) promote students’ thinking in mathematics.
We used this rubric to analyze teacher’s responses to the misconception scenarios that
were administered during the fall and spring interviews. In this way, we could produce a
list of each teacher’s responses to a standard set of assessment results. (The detailed
KST rubric is given in chapter 2). In this analysis we emphasize each teacher’s total
number of reported KST practices as well as the balance between addressing, building,
engaging, and promoting practices.
Observed instruction. We used the teacher profiles, classroom observation
notes, and teacher and student artifacts, including available interim assessment data, to
explore the relationships between MKT, KST, and actual classroom instruction. In this
case, we looked both broadly at instruction as well as for the specific formative
assessment practices listed above.
The remainder of this chapter presents findings for our four research questions.
187

Chapter 6: The Relationship Between Teacher Capacity and Formative Assessment Practice
Variation in Mathematical Knowledge for Teaching
In answer to our first research question, we found great variation among our
teachers in MKT: the average teacher got 56% of the items correct, with a standard
deviation of 26 percentage points. This variation is particularly notable considering that
teachers were sampled from schools with average and above-average student
achievement in mathematics. Comparing teachers across districts, we found that
Cumberland teachers, on average scored higher than their Philadelphia counterparts
(see Figure 6.2). However, there was a larger discrepancy between the 3rd- and 5th-
grade teachers in our sample than between the two districts. As shown in Figure 6.3,
teachers scoring at the 75th percentile among 3rd-grade teachers demonstrated weaker
mathematical knowledge for teaching than those scoring at the 25th percentile of 5th-
grade teachers. While we may expect, for various reasons, higher grade teachers to
have greater MKT than lower-grade teachers, we did not expect this difference to be so
large.
188

Chapter 6: The Relationship Between Teacher Capacity and Formative Assessment Practice
Figure 6.2 also shows that there was more variation in MKT scores among
Philadelphia teachers than among Cumberland teachers. While the top-scoring
Philadelphia teachers approach the highest-scoring Cumberland teachers, the lowest-
scoring Philadelphia teachers scored a full standard deviation below the lowest scoring
Cumberland teachers. There was also some school-by-school variation in MKT within
each district, both in terms of mean, range, and standard deviation of CKT-M scores
(see Figure 6.4). It is interesting to note that the spread of scores from C32, a Title I
school in Cumberland, more closely resembles the distribution of scores among the
Philadelphia schools than it does the other two Cumberland schools.
2 Throughout this report interviews are coded by school name and school number. The schools are identified as either “P” (Philadelphia) or “C” (Cumberland) and by school number (e.g., P6).
189

Chapter 6: The Relationship Between Teacher Capacity and Formative Assessment Practice
As might be expected, these trends were even more pronounced when we
examined which teachers fell into the High- and Low-MKT groups. Looking at the seven
teachers among our sample who fell into the High-MKT group, four came from
Cumberland and three from Philadelphia schools. While all of the Cumberland schools
had at least one teacher in the High-MKT group, only P3 and P5 had teachers in the
High-MKT group. All seven of the High-MKT teachers were teaching 5th grade during
the year of our study. Turning toward the Low-MKT group, all teachers were from the
Philadelphia schools, and each school had at least one teacher in this group. All but one
teacher in the Low-MKT group taught 3rd grade at the time of our study. Again, this
underscores the variation found in MKT within schools as well as across schools,
districts, and grades. This variation may influence schools’ and districts’ capacity to
respond to assessment information in ways that improve teaching and learning.
190

Chapter 6: The Relationship Between Teacher Capacity and Formative Assessment Practice
Variation in Knowing Student Thinking
We also found variation among our teachers in both the degree to which they
responded in ways consistent with using practices that uncover student understanding
as well as the ways in which they would respond to student misconceptions. Figure 6.5
illustrates the variation between types of KST practices summed over the two
misconception scenarios conducted in the Fall and Spring of the 2006-07 school year.
Over these two interview sessions, the average teacher in our sample told us of
approximately two ways that she would build on students’ math ideas, engage students
in math learning, and promote students’ thinking about mathematics. The average
teacher spoke of five ways to address student misconceptions through classroom
instruction.
In comparing the boxplots, one sees great variation practice-by-practice, with
practices not appearing at all in some teachers’ responses and appearing up to 7-8
times in those of other teachers. The exception to this general trend is in the category of
191

Chapter 6: The Relationship Between Teacher Capacity and Formative Assessment Practice
Addressing Students’ Misconceptions, which consists of practices such as
identifying/addressing students’ misconceptions; using questions or tasks to correct
misconceptions; using rules and procedures to address student misconceptions; drawing
a picture or a table to address student misconceptions; and connecting instruction to a
concrete model. Given that teachers were specifically asked to identify and address
student misconceptions in a scenario format, perhaps it is not surprising that the vast
majority of teachers did so; in fact, only five teachers in the fall round of interviews and
four teachers in the spring were unable to identify the student misconceptions presented
to them. All teachers identified at least one student misconception throughout the year.
This indicates that, when presented with assessment items that clearly target typical
mathematical misconceptions, the teachers in our sample were able to offer at least one
way in which they would respond to such student thinking in the classroom.
Relationship between MKT and Analysis of Student Work
We have shown variation in both MKT and in reported KST practices across our
teachers that are related to a number of factors. As detailed in the literature review
above, there is a hypothesized link between MKT, or the mathematical knowledge
needed to help students learn mathematics, and the use of instructional practices that
are intended to reveal student thinking. It seems reasonable to suggest that teachers
with higher MKT would use more opportunities to uncover student knowledge in
mathematics. Our third research question examines this relationship: What is the
relationship between MKT and KST? Specifically, are there differences among Low-,
Medium-, and High-MKT teachers in the number of KST practices that they reported?
Also, do Low-, Medium-, and High-MKT teachers have different KST “profiles”? That is,
does the balance of the four KST subtypes differ systematically between Low-, Medium-,
and High-MKT teachers?
192

Chapter 6: The Relationship Between Teacher Capacity and Formative Assessment Practice
In response to the first question, there is variation in the number of KST practices
reported by teachers in the Low- Medium- and High-MKT groups. It was not, however,
the type of variation that we initially expected to see. As shown in Figure 6.6, all three
groups reported using the same average number of KST practices, regardless of MKT
level. Furthermore, there was less variation in the High-MKT group in the number of
practices reported.3
We then hypothesized that although all three groups reported the same average
number of practices, the nature of the KST practices differed between the groups. Our
next step was to examine the balance of the four KST practices (Addressing, Building,
Engaging, and Promoting) among the Low, Medium, and High groups. Once again, we
found that there was no real difference between the groups in their emphasis on
Addressing, Building, Engaging, or Promoting (see Figure 6.7).
3 The “n” for this analysis reflects the 22 teachers for whom we had a full year of KST information (from both the fall and spring misconception scenarios) and who responded to the MKT survey.
193

Chapter 6: The Relationship Between Teacher Capacity and Formative Assessment Practice
Although a teacher’s level of MKT does not appear to be related to the number of
KST practices reported by teachers in the misconception scenarios, it still remained
possible that MKT influences the actual quality of KST and formative assessment
practice in the classroom. This seems a logical hypothesis—if a teacher has greater
MKT, she would know exactly what questions to ask to pinpoint student thinking and she
would know appropriate responses to particular misunderstandings. A teacher with a
lower level of MKT would actually have to attempt more techniques and approaches
because they would not be able to align questions to student thinking and to instructional
responses. This hypothesis has some backing. In a recent study of the impact of MKT
on quality instruction in mathematics, Hill and colleagues (2008) found that many
average- and Low-MKT teachers “fill …mathematics lessons with activities or games of
dubious value” (p. 492). We then looked at whether or not this could also be true of the
relationship between MKT and teachers’ formative assessment practices in
mathematics.
194
Chapter 6: The Relationship Between Teacher Capacity and Formative Assessment Practice
Relationship among MKT, Analysis of Student Work and Instructional Response in the Classroom As we have seen that teachers with high levels of MKT may actually use the
same number or fewer KST techniques and approaches in the math classroom when
compared to their colleagues with lower levels of MKT (see Figure 6.6), the fundamental
question to ask is whether or not the quality of formative assessment practice in High-,
Medium- and Low-MKT classrooms differed, and if so, how? When referring to
“formative assessment practice” in this analysis, we specifically mean the types of
formative assessment activities and tasks that have been shown in previous studies to
reveal student understanding and that allow teachers to address student misconceptions
and/or build on student understanding in mathematics. These may include: providing
opportunities for students to explain their thinking and explicitly compare their strategies
with those of their classmates, providing students opportunities to self-assess their work
in relation to a learning goal, using students’ (mis-) conceptions to correct or further
mathematical understanding, and providing feedback on students’ mathematical
understanding (Black & Wiliam, 1998, 2006; Watson, 2006). This is a broad definition of
formative assessment that includes many practices that resemble “just good instruction.”
While these practices are much more general than simple “interim assessment use,” we
remind the reader that interim assessments are currently marketed as part of
“comprehensive assessment systems” that include a variety of assessment components.
It is our belief that we cannot fully understand interim assessment use unless we
observe it in the context of teachers’ broader assessment practice.
Again, our purpose is not to confirm the relationships between MKT, KST, and
classroom instruction, but rather to explore ways in which MKT may influence the quality
of formative assessment and instruction in mathematics. We would also like to reiterate
195

Chapter 6: The Relationship Between Teacher Capacity and Formative Assessment Practice
that our sample of teachers came from average and above-average performing schools;
furthermore, nearly all of our teachers seemed well acquainted with the mathematics
curriculum during our interviews and all teachers were observed following the Everyday
Mathematics (EM) program in their classrooms.4 Therefore, our findings from this
sample of teaching may differ from teaching found in chronically low-performing or even
in near-average schools.
Because the previous analysis indicated that it might not be the number of KST
practices that a teacher engages in, but rather the quality of the practice that is related to
MKT, we conducted an in-depth analysis using the teacher profiles as well as all
observation notes (along with post-observation de-briefing interviews) and artifacts of six
teachers who all had reported an average number of KST practices: two with High MKT;
two with Medium MKT; and two with Low MKT. Our analysis for this section followed
both a pattern-matching approach (Yin, 2009) as well as an attempt to create a more
holistic description of each teacher’s practice in their current school context, very similar
to the methods used in Hill and others (2008).
Each of the following sections looks at teaching both generally and in relation to
interim assessment results. Each description of the High-, Medium-, and Low-MKT
teachers is then followed by a general discussion including how teachers with different
levels of MKT identified student understanding, built on student knowledge, engaged
students in mathematics, and promoted students thinking about mathematics. In order to
provide some background for our findings, basic information on these six teachers is
given in Table 6.1. All teacher and student names are pseudonyms.
4 One of the participating Philadelphia schools did not use Everyday Mathematics as their math program. We did not choose teachers from this school for this final analysis in order to make the context of our six cases more comparable. These teachers were, however, included in the MKT and KST analyses.
196

Chapter 6: The Relationship Between Teacher Capacity and Formative Assessment Practice
Table 6.1. Characteristics of Teacher Sample by Level of MKT
Teacher District School Grade Professional and Teaching Background
Emily Philadelphia P3 5th
Emily has a Masters in Education and has taught for 7 years. She has been at P3 for three years and this is her second year in 5th grade.
High
Helen Cumberland C3 5th
Helen has B.S. from her home country, a B.S. from the U.S, and is working toward an M.S. in Elementary Education. She has taught for approximately 10 years (3 in Catholic school, 7 as a long-term sub in Cumberland)
Carrie Philadelphia P4 3rd
Carrie has a B.S. in elementary education and is currently getting certified as a reading specialist. This is her fourth year teaching, all years in Philadelphia. This is her first year teaching 3rd grade (taught 2nd grade previously), so this is her first year analyzing the interim assessments. Medium
Brenda Philadelphia P1 5th
Brenda has a B.S. in elementary education and is working toward her Masters. This is her 27th year teaching – 20th year of teaching in the public system. Of the 12 years teaching at P1, her last 3 was as a math specialist (i.e., she teaches only math and science).
Jenny Philadelphia P1 3rd
Jenny has a Masters in reading from a local university known for its teacher training programs. She has taught in Philadelphia for 11 years.
Low
Lisa Philadelphia P3 3rd
Lisa has a B.S. in early childhood and elementary education. She has continuously taught 3rd grade at P3 for the past seven years. She will soon get her Masters in science and reading.
197

Chapter 6: The Relationship Between Teacher Capacity and Formative Assessment Practice
Teachers with High MKT. Both High-MKT teachers report using the interim
assessment results to plan their instruction immediately following the tests. While Emily’s
district schedules when her interim assessments are given, Helen’s district lets the
teachers choose when to administer these assessments. Helen gives her interim
assessments 2-3 days before the EM end-of-unit test, when she feels her students are
“ready,” and she schedules the following day to review the test results with her students.
Naturally, this means that Helen spends one night scoring and preparing a review for her
students. While she has more discretion in this area than Emily, in the interviews, Helen
also constantly refers to the fact that the previous year she got so behind in the pacing
that she never completed EM Unit 11. As a result, she is often fearful of falling behind
the pacing guide again.
Emily focuses on addressing the needs of her weakest students (by pairing them
with her student teacher) and the areas of content that the whole class seemed not to
understand. She believes that the interim assessments are “supposed to help your
instruction…it’s definitely a reflection on both student and teacher.” At the same time, if
Emily is satisfied with her students’ understanding of the content, then she will use the
remainder of the re-teaching week to catch-up to the pacing guide or to go a bit further in
the curriculum. In a post-observation interview, she describes her thinking:
I specifically looked at which students were low and some of their
concerns were addressed in small groups, which actually gave me an
opportunity to go on a little bit and get a little bit ahead to the next chapter
because they did so well.
In looking at her interim assessment results, Helen also focuses on weak content
areas that she may need to address in instruction. She reports that she talks about these
results with her grade-group partner, the elementary curriculum specialist (ECS), the
district math coach, and the in-building math aide. She specifically recalls a past
198

Chapter 6: The Relationship Between Teacher Capacity and Formative Assessment Practice
discussion over the fact that many of her students had difficulty with the partial products
algorithm. For her, the primary benefit of the interim assessment is to inform her flexible
grouping, which, she insists, remains very flexible throughout the year:
…some children understand some of the concepts on some tests better
than others. Some are more comfortable with algebra, some are more
comfortable with geometry, some are more comfortable with numbers and
computations.
Helen plans her re-teaching not only around the weaker concepts and flexible grouping,
but also with an eye toward the fact that she has classroom-level instructional support
every Wednesday from the ECS. In fact, the ECS makes additional visits to her room on
a more informal basis. She prefers to have the ECS work with the larger group while she
attends to those with the greatest weaknesses on the interim assessment.
Throughout the year, Emily is observed constructing re-teaching lessons from
various materials, including review items from other math programs, activities from EM
materials and questions, as well as the Pennsylvania System of School Assessment
(PSSA) preparation questions. Emily is seen using the EM math games in class, and
believes that their purpose is to reinforce “basic drill and kill in a fun way.” Engaging
students in mathematical learning is important to her. In her class of 17 students, she is
determined not to let anyone drift: she calls on students by pulling their names from a
box she keeps on her desk and during small group work, she stops at every group,
answering and asking questions. After small group work, she is observed bringing the
whole class back together to address common issues. In the following excerpt, she
addresses the class after they have completed a multiple-choice review sheet to “see
what you already know”. The specific problem that the whole class reviews asks
students to compute the area of an irregularly tiled floor (see Figure 6.8).
199

Chapter 6: The Relationship Between Teacher Capacity and Formative Assessment Practice
Figure 6.8. Review item from Emily’s class This picture shows the tiles on Martin’s kitchen floor. Each tile is one square foot. What is the area of the floor?
Once students have offered two strategies for computing area (counting tiles and
multiplying length by width), Emily asks:
T: Can you think of something in everyday life that we need to know the area for?
S1: If you want to get some carpet.
T: Yes. What about perimeter. Why would I need to know perimeter?
S2: For a fence.
T: Yes, that’s right, good examples [the class proceeds to the next question
about money].
In this exchange, Emily succeeds in tying together this item on area with a
previous item asking for the calculation of perimeter. She engages students in
mathematics by asking them to connect these computations with real world goals and
she gives feedback specific to the students’ responses (although the students’ answers
are typical of those found in EM and do not necessarily reflect activities that 5th-grade
students might engage in). Later, she is observed asking the small groups questions that
draw on estimation and number sense skills and concepts (e.g., A family car is most
likely to be which length?... Look at me. I’m 5 feet, 5 inches, so picture three of me when
thinking about a car.”) However, Emily makes an important oversight in discussing area
and perimeter in that while one can find the area of a regular shape by multiplying length
200

Chapter 6: The Relationship Between Teacher Capacity and Formative Assessment Practice
by width, this formula will not work for the irregular figure in the question under
discussion. In order to solve this problem, students must count tiles (as suggested by
one student) or segment the irregular shape into regular shapes, compute the area of
each, and then add these together. In this, she missed an important opportunity to
extend students’ application of the L x W formula to irregular shapes and has possibly
left some students with the impression that Martin’s kitchen floor can be measured by
applying L x W to the irregular shape.
In observing Emily’s teaching of addition of fractions and reducing improper
fractions, Emily is also seen asking students to explain their thinking, regardless of
whether or not a student has answered correctly or incorrectly. When one student
correctly adds 6/8 + 12/32 by multiplying the first addend by 4/4, she asks him, “Why are
you multiplying it by 4?” Turning to the class, she adds, “It’s one thing to know the
answer. It’s another thing to know how and why you get the answer.” She follows this
exchange by asking volunteers to come to the board and talk through how they reduce a
series of improper fractions that she spontaneously gives them. In this way, Emily sets
important expectations for her class: their thinking and strategies are just as important as
achieving correct answers, and they should expect to be able to explain their thinking,
both to her and to the class. Rarely, however, do we see a real discussion of
mathematical justification (the “why”) in her class. Finally, it is worth noting that while
Emily often calls on students randomly; in the last task, she asks for volunteers to come
to the board. While we did not ask her about this particular decision, we note that this is
a very effective technique if her goal was to model several students successfully
reducing fractions for the students who may be less secure in this skill. In all of these
ways, Emily acts as a conduit for her students to interact with each other, and in doing
so, she exposes them to multiple strategies and instances of student thinking.
201

Chapter 6: The Relationship Between Teacher Capacity and Formative Assessment Practice
Helen’s main technique to uncover students’ thinking is questioning. She
believes strongly in calling on students at random (“Nobody’s excused. Fair game for
everybody. Because they know … they have to stay tuned in.”), and we see her use
other questioning techniques to have students remain engaged in the math instruction.
She often asks for students to show how they have arrived at a particular answer and, at
the end of one lesson, whose goal was written on the board as “To review and practice
the partial quotients division algorithm for dividing a whole number by a whole number,”
we observed her asking the students to gauge their own understanding:
T: [to the class] Did anyone not understand what they were doing?
[many hands are raised]
T: I think tomorrow we’ll do more of this.
Helen appears to follow the EM lessons closely, as we see her use various
components of the program throughout the lessons. In her review of partial quotients, for
example, she announces to the class that her flex group will be working on partial
quotients and “if anyone decides they don’t know how to do it, join my group.” Helen
then uses both the EM Math Journal and the EM Easy Multiples sheet to guide students
through these computations. Helen’s most frequent response to student error is to back
the student up to either the misunderstanding or the procedural misstep and then let the
student correct themselves. For example, in the partial quotients flex group, one student
incorrectly arrives at 57 when subtracting 160 from 237. Helen notes, “Uh-oh! I see a
mistake! What’s 13 minus 6?” The student then corrects his problem on the board and
successfully completes the division problem. While this student is afforded the
opportunity to get individual feedback on his division, we remain unsure as to whether he
really understood his error or whether he could complete a similar problem without so
much scaffolding. To her credit, Helen also realizes this and extends the partial quotients
202

Chapter 6: The Relationship Between Teacher Capacity and Formative Assessment Practice
lesson into the following day. We also note the potential problem in reframing the error
as a 13 minus 6 problem when, in fact, the task at hand is to solve 130 minus 60.
Helen takes great care in organizing her instruction: she consults with her
colleagues; looks to interim assessment results, homework, and exit slips to constantly
monitor student understanding; and organizes the use of many appropriate materials
while remaining faithful to her district’s commitment to flexible grouping. She reports
working until 10 p.m. and getting up at 5:30 a.m. to finish preparing for school. Yet, it
seems as though she struggles to call upon her High MKT when discussing the
mathematics in her classroom. Nowhere is this more apparent than during our final
observation in which she addresses student questions on the most recent interim
assessment on area. A student is called up to solve question #6, which has been written
on the board (see Figure 6.9 below):
203
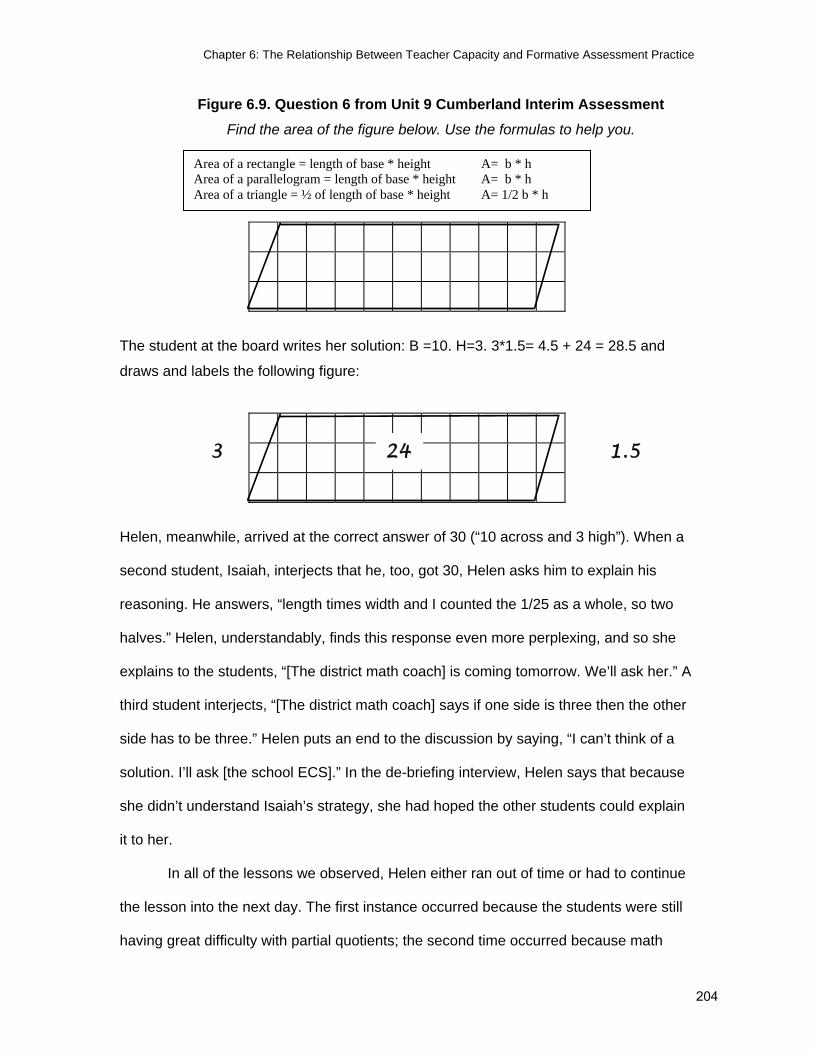
Chapter 6: The Relationship Between Teacher Capacity and Formative Assessment Practice
Figure 6.9. Question 6 from Unit 9 Cumberland Interim Assessment Find the area of the figure below. Use the formulas to help you.
The student at the board writes her solution: B =10. H=3. 3*1.5= 4.5 + 24 = 28.5 and
draws and labels the following figure:
Helen, meanwhile, arrived at the correct answer of 30 (“10 across and 3 high”). When a
second student, Isaiah, interjects that he, too, got 30, Helen asks him to explain his
reasoning. He answers, “length times width and I counted the 1/25 as a whole, so two
halves.” Helen, understandably, finds this response even more perplexing, and so she
explains to the students, “[The district math coach] is coming tomorrow. We’ll ask her.” A
third student interjects, “[The district math coach] says if one side is three then the other
side has to be three.” Helen puts an end to the discussion by saying, “I can’t think of a
solution. I’ll ask [the school ECS].” In the de-briefing interview, Helen says that because
she didn’t understand Isaiah’s strategy, she had hoped the other students could explain
it to her.
In all of the lessons we observed, Helen either ran out of time or had to continue
the lesson into the next day. The first instance occurred because the students were still
having great difficulty with partial quotients; the second time occurred because math
Area of a rectangle = length of base * height A= b * h Area of a parallelogram = length of base * height A= b * h Area of a triangle = ½ of length of base * height A= 1/2 b * h
3 1.5 24
204

Chapter 6: The Relationship Between Teacher Capacity and Formative Assessment Practice
ended early due to the school’s DARE (anti-drug use) program; during the final
observation Helen ran out of time to check homework and postponed this until the
following day.
Both Emily and Helen were observed following EM with high fidelity; they led
classes where students often participated and were given multiple opportunities to share
their thinking in mathematics. They set expectations around mathematical discourse,
and they used various assessments (including Cumberland’s interim assessment) to
better understand students’ mathematical thinking. Both teachers wanted to connect
mathematics to students’ everyday experiences. Emily, however, focused more on
soliciting student explanations of how rather than why, and Helen was so fearful of the
district’s pacing guide that she cut formative assessment opportunities short. Both Emily
and Helen appeared to have real trouble spontaneously building on student thinking in
geometry. These cases challenge a common view of teachers (and adults and children)
as being “strong (or not strong) in math,” as these teachers are in great command of
elementary school mathematics—with one notable exception. They also make us
seriously consider the potential mixed messages that teachers face from districts that
promote formative assessment practice while requiring them adhere to a weekly pacing
guide.
With reference to the KST framework, both Emily and Helen use multiple sources
to identify and address student misunderstandings, and they focus on identifying widely
problematic obstacles to student learning. They both use extensive questioning and
dialogue with their students to identify and address student misconceptions and to build
on student knowledge, although, as mentioned, this dialogue could be richer
mathematically. Both Emily and Helen show a strong commitment to maintaining student
engagement in mathematics, whether through use of EM activities or through multiple
205

Chapter 6: The Relationship Between Teacher Capacity and Formative Assessment Practice
instances of concrete and everyday examples. Finally, they both show some use of
grouping and dialogue to promote student understanding of mathematics.
Teachers with Medium MKT. Both of the Medium-MKT teachers report facing
minor challenges in using the interim assessments to inform classroom instruction.
Carrie believes that the assessments are a valid indicator of her students’ mathematical
understanding, yet when we visit her class in the middle of the school year, she is
surprised that her students performed poorly on multiplication items from the previous
test. She also reports that she does not know how to use SchoolNet very well. Brenda
also regularly analyzes her students’ results, yet she is wary that her school is moving to
online administration of the interim assessments and believes that the assessments are
becoming “too important—high stakes.” Still, Brenda reports that she “loves math” and
that “fractions are fun.”
When two items on Carrie’s January interim assessment results indicate that 13
of her 27 students could not “skip count by 2s, 3s, 5s, and 10s,” she searched SchoolNet
for ideas on how to re-teach this skill. She found no help, and so she Googled “skip
counting” and found a game in which one student bounces a ball and the class loudly
skip counts as a chorus. She tells the whole class, “if you can skip count, you can do the
multiplication table.” There is no shortage of volunteers for this activity as the students
eagerly await their turn to bounce the ball. On the 3s round, Carrie stops the activity to
point out that, “See, when you skip count by 3s four times, you’ll get 12. Three times four
is twelve. There are lots of different ways to learn multiplication problems.” This is
followed by another skip counting activity in which a strip of paper is passed from
student to student. The first student writes “2,” the second student “4,” and so on until
everyone in the class has skip counted. The students quickly move through the 2s, while
the 3s and 4s take longer. This activity ends with the 5s. As the activity comes to an end,
206

Chapter 6: The Relationship Between Teacher Capacity and Formative Assessment Practice
Carrie tells the class “When PSSA comes you won’t be able to use a number grid. Try
and use skip counting.”
This approach is typical of Carrie’s re-teaching; when students face challenges in
developing understanding or skills, she finds activities that emphasize skill practice with
the whole class. In fact, most of her instruction throughout the year consists of whole-
group lessons and calling on individual students who raise their hands. Unfortunately,
when analyzing the interim assessment results she may have overestimated her
students’ difficulty with skip counting as a technique for solving lower order multiplication
problems. When we took a second look at Carrie’s results, we noticed at least two
important qualifications to take into consideration when interpreting the poor score on
skip counting. First, we noticed that this score was derived from just two items,
potentially creating great measurement error. Second, and more important for Carrie’s
re-teaching, we saw that more than half of her students chose correct answers for
problems on “demonstrating knowledge of basic multiplication facts up to 10 x 10” and
21 of her students chose the correct answer when asked to “demonstrate the concept of
multiplication as repeated addition.” In other words, although it seemed that her students
performed poorly on two skip counting items, most of her students could perform well
when asked for basic multiplication facts and when asked to connect repeated addition
to multiplication. Given these successes, we wondered why Carrie chose to focus nearly
an entire class on skip counting, particularly when she did not connect it to multiplication
or to repeated addition in a mathematical sense. In fact, given the somewhat
contradictory interim assessment results, this would have been a perfect formative
assessment opportunity for Carrie to discern the various strategies her students’ use to
solve multiplication problems and whether or not they can connect these skills to
concepts. Instead, the glaring “failure” on one sub-area of the interim assessments lead
her to perhaps underestimate her students’ understanding. During one interview Carrie
207

Chapter 6: The Relationship Between Teacher Capacity and Formative Assessment Practice
notes that when she has called on students who have their hands down, “…sometimes
they shock me, and they really do know the answer, they just don’t feel like
participating.”
Like Carrie, Brenda notes that the interim assessment results help her decide
what content to revisit, but not how to teach it. While Brenda reports to us that she would
address certain weaknesses in mathematical performance by conducting small-group
instruction, only whole-class instruction is observed in Brenda’s class on our visits. In
fact, the layout of the room—a very long rectangle with only heavy individual desks and
29 students in the class—make it difficult for students to work in groups unless the desks
were already arranged just so. Brenda’s room is also extremely noisy. The room and the
hallway are uncarpeted. During two visits, the temperature in the room is so warm that
both a window and the door must be left open, and conversations from the hallway are
regularly heard in the room. On one visit, the researcher decides to sit in the back row of
students to see to what degree the noise may be affecting instruction. The researcher
cannot hear half of what Brenda says during this time.
All observed instruction in Brenda’s room is highly scaffolded, and by January,
the students know the routine of individual seatwork and didactic instruction where by
the Brenda writes problems on the board and then calls on individual students to solve
them. Incorrect answers are bypassed. A typical exchange occurs during the beginning
of our second visit when students begin by solving the following problem individually at
their desks: Which is greater? Find the sum: 2/3, 4/9, 1/18, 1/6. After some minutes,
Brenda asks:
T: Who has a common denominator?
S1: 18.
T: Now let’s find the least common denominator…18.
208

Chapter 6: The Relationship Between Teacher Capacity and Formative Assessment Practice
T: How do I get my first numerator? How do I get from 3 to 18?
S1 begins to speak.
T: [interrupting S1] I’m already talking to someone. I’m talking to Tyrese.
Brenda then takes the whole class through finding the equivalent fractions with
denominators of 18 and then adds up the numerators. She then tells the class that she
has to turn the sum, an improper fraction, into a mixed number and does so for them on
the board. The rest of the class period is spent having students use their TI-15
calculators to turn fractions into decimals, and they have one “f d” button for this
purpose. The class ends much the same way it began with Brenda passing out a copied
word problem handwritten on a sheet of paper:
Betty baked 4 peach [sic] pies; apple cherry, lemon and pumpkin. Her little
brother ate 1/3 of the apple pie, ½ of the cherry pie, ¾ or [sic] the lemon pie, and
5/8 of the pumpkin pie. From which pie did Betty’s brother eat the largest [sic]?
Show how you get the answer.
During this individual seatwork, Brenda does circulate and look at student work (“I was
hoping they were using some of the concepts that were being taught”). Instead of using
this information to inform a wrap-up or subsequent instruction, Brenda collects the
assigned work, grades it on a scale of 1 to 4, and returns it to the students on a following
day. In general, Brenda seems to have great difficulty in tying student errors to effective
re-teaching. Several times, she notes that she has “no idea” why her students provide
certain answers.
Both Carrie and Brenda look at their students’ interim assessment results, and
they “use” the data, but they both appear constrained in their capacity to respond to their
students’ learning needs in mathematics. Carrie does not know how to use SchoolNet
well, and it seems as though she could benefit from training or coaching on analysis of
209
Chapter 6: The Relationship Between Teacher Capacity and Formative Assessment Practice
the assessment results as well. When Carrie has questions about how to teach her
students mathematics, she does not go to the in-building math school-based teacher
leader (SBTL) (he has full classroom responsibilities in addition to his SBTL position) nor
to her grade-group partner. Carrie attempts to access instructional strategies through the
“user friendly” information management system (IMS), but fails to do so. Her final
resource for mathematics instruction is Google. As a result, Carrie finds a couple of very
enjoyable activities, and she engages her students in skip counting, but she has not
made a connection between the activities and knowledge of children’s mathematical
development or to her partially contradictory January interim assessment results.
Brenda also appears weak in knowledge of children’s mathematical
development. As she circulates around the room, she is not looking for degrees of
understanding, but rather what is “right” or “wrong.” Likewise, she is more concerned
with seeing that students use the algorithms that she has just taught than looking for
variation in students’ strategies. It is important to note that variation in student strategies
and understanding is not merely a fetish of mathematics education researchers; rather, it
is ultimately a practical concern. It is hard to imagine how a teacher can help a student
deepen his mathematical understanding if the teacher doesn’t know the degree of
understanding that the student has to begin with. Carrie and Brenda appear very
focused on what their students do not know, and, perhaps as a result, they seem to have
little knowledge about what their students do know.
This situation is not entirely surprising, as Carrie and Brenda have few supports
to help them make use of interim assessment results. Carrie admits that this is her first
year using them and she needs additional support in accessing and analyzing the data.
Brenda’s SBTL is not concerned with Brenda’s instruction; since Brenda is the 5th-grade
math specialist, it is assumed that she can successfully teach mathematics. Neither
teacher has classroom-level support as Helen does, and they have more students in
210

Chapter 6: The Relationship Between Teacher Capacity and Formative Assessment Practice
their classrooms as well. These cases have us thinking seriously about the kinds of
supports that “average” teachers with “average” knowledge of mathematics for teaching
need to improve formative assessment practices in their classrooms.
In terms of KST, both Carrie and Brenda look to the interim assessments to
identify and help address student misunderstanding in mathematics. In Carrie’s case, we
see few minute-by-minute methods for assessing student understanding; even when her
students find one skip-counting activity easy, she proceeds with another one. Brenda
also has trouble finding out what her students know, as she expects all answers to
coincide with what she knows to be the “right” answer. The lack of knowledge about how
their students think makes it difficult for both Carrie and Brenda to build on or promote
their students’ understanding. During all of our observations, no individual or small-group
work was observed. What is interesting is that Carrie is very successful in engaging her
students, only they are engaged in ball activity instead of with mathematical concepts.
Brenda mentions that she likes mathematics, yet this engagement does not transfer to
her students, who, like her, seem content with aiming for correct answers. While
accuracy is a necessary part of mathematics understanding, Brenda appears to privilege
accuracy over conceptual understanding and engagement with mathematics.
Teachers with Low MKT. Both of the Low-MKT teachers use the interim
assessment results to plan the re-teaching week. Jenny uses the interim assessment
results to determine what she will teach during the re-teaching week and she worries
that the online administration of the test has negatively affected her results. She also
believes that low reading ability was the major reason why her students struggle with
problems on the interim assessment. Jenny has either one or two other adults in the
classroom with her, but they are not there to assist Jenny in her instruction; they are
assigned to specific students as special education aides. Lisa considers the interim
assessment to be “highly valuable” and she considers it her task to “break down” the
211

Chapter 6: The Relationship Between Teacher Capacity and Formative Assessment Practice
content when re-teaching it, She reports that she might include practice in prior skills as
part of this approach (e.g., revisiting double-digit subtraction as a part of re-teaching
triple-digit subtraction).
Jenny devotes at least one class period of her re-teaching week to reviewing the
interim assessment, item by item. She sees her job as to help students better
understand the content on the interim assessments and she believes that a great way to
do this is through visualization because “kids are better at visual.” These sessions are
whole-class reviews and the classes that we observe do not seem to discriminate
among students or among math content; instead, Jenny reviews each item for the whole
class, writing it up on a sheet of poster paper. She expects that as she models her
problem-solving, students are correcting their own answers. She reminds them “Make
sure you fix your answers,” but we observe that most students are not making
corrections on their returned tests. At one point, four students have their hands raised,
but Jenny focuses on calling on students who do not volunteer because she believes
that those with raised hands already know the answer. It does not occur to her that
students may raise their hands because they have questions about the mathematics. In
fact, during one review class, Jenny acknowledges student errors only twice: once to
allow a student to correct another student’s error and a second time to draw attention to
a common error on the interim assessment. The question she reviews reads as follows:
Five tomato plants come in one box. Jane has one box. She gets three more boxes of
tomato plants. How many plants does she have in total? Jenny’s response is to draw a
box on the board and then draws five plants inside the box. She cautions the class that
many students got an incorrect answer because they did not count the box that Jane
already had. That may well be a correct interpretation of her students’ misunderstanding,
but, if so, her illustration on the board does nothing to call attention to this fact. Rather,
212

Chapter 6: The Relationship Between Teacher Capacity and Formative Assessment Practice
her illustration would have been an appropriate visual has students thought that there
were three or four tomato plants in total (i.e., one per box).
Jenny has a real desire to understand her students’ thinking, and she has a good
repertoire of formative assessment “moves.” The problem appears to be that she does
not know how to connect these general formative assessment practices to mathematical
understanding. Indeed, her questioning routines seem severely limited by the fact that
she does not know how to respond to student answers. One example takes place as
Jenny starts her EM lesson. She asks a student to read the day’s objectives from the
board and then sets the stage for a review of polygons:
T: What happens when we come to a stop sign in the road and there are four
different ways you can drive? Each lane has a stop sign.
S1: A polygon.
S2: Sides.
T: Yes, but you are at an … [points to the word ‘intersection’ on her word wall]
Ss: [as a chorus] Intersection!
Jenny then has four students come up to the front of the class to simulate four cars at an
intersection. She has them pretend to run together and then has the students who are
facing opposite walk past each other so that they do not crash.
T: See, they do not intersect. What do they do?
Ss: [silence]
T: What kinds of lines are they making?
S3: Street lines.
S4: Parallel lines.
T: Yes, thank you. [to the students who are standing] Please sit down.
213

Chapter 6: The Relationship Between Teacher Capacity and Formative Assessment Practice
Here Jenny wants to engage her students in math learning, but her desire to create a fun
demonstration can overshadow any mathematical learning that may be happening here.
We see that her students are wildly guessing at her questions, which do not serve to
further mathematical thinking, but rather are intended to recall vocabulary from a
previous lesson. Likewise, the movement from an intersection to parallel streets is
confusing, as the same students suddenly switch from facing each other at an
intersection to “driving” on parallel streets. Jenny then immediately proceeds to a review
of polygon terminology in which she asks students to describe the defining
characteristics of particular polygon:
T: [holding up a drawing of a trapezoid] What do you notice about a trapezoid?
S1: It’s like a triangle.
S2: It has four sides, shaped like a sign that sits on a thousand stones in the
desert.
T: Is the top line parallel to the bottom?
Ss: [different answers in a chorus] Yes! No!
S3: The top line is smaller than the bottom.
T: [holding up a cone] What is this?
S4: A three-dimensional shape.
Jenny, apparently dissatisfied, then walks across the room to point out geometry
vocabulary that has been written on a poster in her room. She has her students read out
the definitions of various polygons. In moving from activity to activity she rarely
acknowledges so-called incorrect answers, missing an opportunity to not only review the
definitions of polygons in students’ own words but also to draw attention to the
similarities and differences between trapezoids, triangles, and pyramids. Her questions
are not well designed to probe students’ thinking, rather they are highly convergent; in
214

Chapter 6: The Relationship Between Teacher Capacity and Formative Assessment Practice
other words, she expects only one answer, and dismisses or ignores incorrect or partial
(“a three-dimensional shape”) responses.
In analyzing her students’ interim assessment results, Lisa focused on weak
student performance, particularly in areas that she knew from past experience to be
challenging for students. She looked at two interim assessment problems with us and
was able to explain what she thought students were thinking when they answered these
questions incorrectly. Lisa said that she liked to use both whole- and small-group
instruction during the re-teaching week (“What’s nice about having a student teacher is
that a lot of times I’ll either do the whole class and she’ll take a small group or we’ll
switch off”), but only whole-class instruction was observed during our visits. Lisa also
reported using games and manipulatives to re-teach, but none were observed during our
visits.
Lisa seemed quite knowledgeable about challenges that students have in
mathematical understanding, but she seemed either unable or unwilling to design her
instruction to address these challenges. In March, when Lisa was both re-teaching from
the interim assessment and preparing her students to take the PSSAs, she decided to
focus on probability since she knows that while EM does not start probability until later in
the spring, the district encourages teachers to cover it early because it is tested on the
PSSAs. Lisa began with a typical EM warm-up, asking students to tell her something
that they will likely/not likely/ absolutely/absolutely not do that weekend. Most students
grasped these concepts easily, yet when one student offered an answer that Lisa
considered incorrect, she simply told the student to “keep thinking.” She followed this
warm-up with an activity in which students were to write down likely/not likely/
absolutely/absolutely not in response to questions that she asked. Most children raised
their hands for every question, and Lisa was sure to include the children sitting with
aides when they volunteered. Lisa then proceeded with work in the EM Math Journal on
215

Chapter 6: The Relationship Between Teacher Capacity and Formative Assessment Practice
probability. Many students finished early and took out books to read silently when they
finished working. Lisa finished this lesson by having students take their Math Message
notebooks and copy down the words “likely/not likely/ absolutely/absolutely” from the
board.
It seems as though Lisa is out of tune with her students’ understanding of
mathematics in spite of the fact that she understands the mathematics that she is
teaching. She continues through three very similar activities even though her students
find them easy. She proceeds through the class almost in spite of her students’ being
there. During another observation, she has students write down answers to four
problems on slips and then share their answers, without comment from her. She does
not collect the slips even though this might be good formative information. Her students
quickly learn the classroom routine; in fact, at one point we were surprised to hear Lisa
ask her class what they had learned that day. No students responded.
These cases taught us how different the instructional challenges can be for two
teachers, both with Low-MKT scores. While we believe Jenny wants to interact with her
students around mathematics, her narrow focus in the classroom (perhaps as a result of
her not completely understanding the mathematics that she is teaching) precludes her
from hearing her students’ contributions. On the other hand, Lisa appears to grasp a fair
amount about 3rd-grade students’ challenges in learning mathematics. She simply won’t,
or can’t, incorporate this knowledge into her teaching.
With respect to KST, Jenny’s and Lisa’s teaching seem very unconnected.
Jenny’s item-by-item recitation of the interim assessment is not connected to the
performance of individuals or groups of individuals. Her visualizations are not
mathematically connected to one of the few student errors that she chooses to address.
Lisa’s teaching rarely connects with individual students during class, and we see her
bypass opportunities to connect students’ current understandings to target
216

Chapter 6: The Relationship Between Teacher Capacity and Formative Assessment Practice
understandings. As in the case of the Medium-MKT teachers, Jenny and Lisa cannot
successfully build on or promote student understandings because their own knowledge
of their students is weak. The notable difference between Jenny and Lisa is that while
Jenny tries to engage her students in mathematical learning, Lisa sends an opposite
message. Her students seem to learn that mathematics is a series of unconnected
activities to complete. If you complete them early, then you are rewarded with reading
time.
Discussion and Implications
The purpose of this analysis was to explore the relationship between teachers’
MKT, the extent of their reported KST practices, and their reported and observed
formative assessment practices in mathematics. We were specifically interested in the
differences in interim assessment use and formative assessment practice for teachers
with Low, Medium, and High levels of MKT.
Our hypothesis that greater MKT would be associated with more reported
instances of KST was not borne out. Rather, teachers in all three groups, on average,
reported similar numbers of KST practices. In addition, teachers in all three groups
reported the same balance of Addressing, Building, Engaging, and Promoting. We then
hypothesized that it is not the reported frequency of KST activities that is affected by
MKT, but rather the quality of those activities. This supposition is consistent with other
findings that MKT affects the quality of mathematics in instruction generally (Hill, et al.,
2008). It may also be the case that the KST rubric does not capture variation among this
sample of teachers (i.e., in average- and above-average performing schools, who all
implement the same curriculum with fidelity). Nevertheless, in examining the instruction
of six teachers who reported average numbers of KST practices: two teachers with High-
217

Chapter 6: The Relationship Between Teacher Capacity and Formative Assessment Practice
MKT, two with Medium-MKT, and two with Low-MKT, we saw clear distinctions between
the groups in the way that their planned activities were realized in actual classroom
instruction.
The instruction and formative assessment practice of teachers with high levels of
MKT is generally centered around student understanding: the teachers actively seek to
learn how students think and they respond to student understandings. The level of
mathematics in these rooms is relatively high, and student engagement is maintained.
The teaching in the Medium-MKT classes is less consistent. These teachers want to
engage students in mathematics, but do not succeed in doing so for different reasons.
The lack of small-group and individual work in these rooms, coupled with mathematically
superficial questioning routines, is an obstacle to the teachers learning about student
understanding. In the Low-MKT rooms we also see only whole-group instruction and a
near total lack of discussion about what students know. There seems to be a great
disconnect between the teacher and her students in one class and an equally large
disconnect between instruction and assessment in the other.
In one way, our cases provide ample evidence of all that can go awry on the way
from MKT to teaching mathematics for understanding. While our teachers’ reported KST
practices may look similar quantitatively, we saw clear differences among our teachers
in their formative assessment practices in mathematics. We saw that Helen, a teacher
who scored into the High-MKT group was worried about taking too much time to explore
student thinking lest she fall behind in her district’s pacing schedule. At the same time,
while Helen and Emily both have high levels of MKT, they both are weak in geometry
instruction. At the other end of the MKT spectrum, Jenny poses lots of questions in class
and encourages all of her students to participate, yet she manages to teach only at a
mathematically superficial level.
218

Chapter 6: The Relationship Between Teacher Capacity and Formative Assessment Practice
As researchers, we had the benefit of watching and learning from all of our
teachers. This analysis is not intended as a critique of these teachers, but it is meant to
illustrate opportunities for instructional improvement. In the end, more than anything, we
are convinced that nearly countless stars must align in order for teachers to use interim
and formative assessment to teach mathematics for understanding. Fortunately, while
the universe may be out of our reach, we do have some very concrete suggestions for
supporting teachers in the use of interim and formative assessment data.
First, while the CKT-M is not a criterion referenced test, the great variation in
these scores, combined with our interview and observation data indicate that many
elementary school teachers could benefit from professional development in
mathematics, children’s mathematical development, and teaching mathematics in the
elementary school. In addition, the large gap in mathematical knowledge for teaching
between 3rd and 5th grade should be explored further. Currently, most districts offer one-
size-fits all professional development to elementary school teachers in mathematics. Our
findings do not justify this approach; in fact, they point to the possibility that teaching in
the lower grades is associated with lower levels of MKT. While this study cannot speak
to the causes behind this phenomenon (principals may assign teachers who are weaker
in content to the lower grades; teachers may self-select into these grades; and/or years
of teaching in the lower grades may cause teachers to forget the mathematics taught in
the higher elementary grades), it is something to consider in future research and
professional development planning.
Second, it cannot be assumed that even High-MKT teachers are strong in all
areas of mathematics. In fact, many of the participating teachers reported a lack of
confidence in or teaching about geometry. Unfortunately, this is the elementary
mathematics area in which we know the least about how children develop
understandings. Still, this analysis points to the need for researchers and practitioners to
219

Chapter 6: The Relationship Between Teacher Capacity and Formative Assessment Practice
consider potential teaching weaknesses in this domain and to look for other problem
spots in teachers’ capacity.
Third, we point to the difference between average number of KST practices
reported by teachers and the KST and formative assessment practices that were
observed in six classrooms as further evidence that quality of instruction needs to be
observed directly. More than a decade after the first TIMSS video study showed us how
instruction differs between classrooms, the most common way that researchers assess
instructional quality is still through proxies (such as total instructional time) or through
teacher report. While these methods may be sufficient to investigate what is taught for
how many minutes, we argue that they do not capture instructional quality very well.
Practitioners tend to be no better at this than researchers, as evidenced by the fact that
many administrators assess instructional quality through teachers’ lesson plans and not
through classroom walk-throughs.
Finally, this analysis pointed to a few additional ways in which teachers could be
better supported in their formative assessment practices in mathematics. We must
realize that teachers balance many student needs, as well as their own needs, during
the course of instruction (Kennedy, 2005). One role for policymakers is to provide a
context in which formative assessment needs do not compete with other, more urgent
needs. We should reconsider the wisdom in providing teachers with so many activities
and so many materials that it is not immediately clear which are appropriate for teaching
which concepts. This confusion may lead to teachers choosing the most engaging, or
“fun,” activities over those that are best suited to address particular student
understandings. Or it may lead teachers to search Google for instructional advice.
Likewise, the tension between the demands of the pacing guide and the time to explore
student thinking should be explicitly addressed. In our interviews, Helen and other
teachers were acutely aware of this pressure, yet they did not report seeking advice in
220

Chapter 6: The Relationship Between Teacher Capacity and Formative Assessment Practice
this area, perhaps because adhering to the pacing guide was seen as the most urgent
need.
In the final chapter of this report, we offer a brief summary of our findings and
additional suggestions for policymakers.
221

Chapter 6: The Relationship Between Teacher Capacity and Formative Assessment Practice
References An, S., Kulm, G., & Wu, Z. (2004). The pedagogical content knowledge of middle school
mathematics teachers in China and the U.S.. Journal of Mathematics Teacher Education, 7, 145-172.
Ball, D.L. (1993). With an eye on the mathematical horizon: Dilemmas of teaching elementary school mathematics. The Elementary School Journal, 93, 373-397.
Black, P., & Wiliam, D. (1998). Assessment and classroom learning. Assessment in Education, 5(1), 7-75.
Black, P., & Wiliam, D. (2006). Developing a theory of formative assessment. In J. Gardner (Ed.) Assessment and Learning. Thousand Oaks, CA: Sage. (pp. 81-100).
Borko, H., Eisenhart, M., Brown, C.A., Underhill, R.G., Jones, D., & Agard, P.C. (1992). Learning to teach hard mathematics: Do novice teachers give up too easily? Journal for Research in Mathematics Education, 23, 194-222.
Carpenter, T.P., Fennema, E., Peterson, P.L., & Carey, D.A. (1988). Teachers’ pedagogical content knowledge of students’ problem solving in elementary arithmetic. Journal for Research in Mathematics Education, 19, 385-401.
Clune, W.H., & White, P.A. (2008). Policy effectiveness of interim assessments in Providence Public Schools. Wisconsin Center for Education Research Working Paper No. 2008-10. Madison, WI: WCER.
Cohen, D.K. (1990). A revolution in one classroom: The case of Mrs. Oublier. Educational Evaluation and Policy Analysis, 12, 311-329.
Fennema, E., & Franke, M.L. (1992). Teachers’ knowledge and its impact. In D.A. Grouws (Ed.), Handbook of research on mathematics: Teaching and learning.(pp. 147-164). New York: Macmillan.
Fennema, E. Carpenter, T.P., Franke, M.L., Levi, L., Jacobs, V.R., & Empson, S.B. (1996). A longitudinal study of learning to use children’s thinking in mathematics instruction. Journal for Research in Mathematics Education, 27, 403-434.
Heritage, M., & Niemi, D. (2006). Toward a framework for using student mathematical representations as formative assessments. Educational Assessment, 11, 265-282.
Hill, H.C., Schilling, S.G., & D.L. Ball. (2004). Developing measures of teachers’ mathematics knowledge for teaching. The Elementary School Journal, 105, 11- 30.
Hill, H.C., Rowan, B., & D.L. Ball. (2005). Effects of teachers’ mathematical knowledge for teaching on student achievement. American Educational Research Journal, 42, 371-406.
222

Chapter 6: The Relationship Between Teacher Capacity and Formative Assessment Practice
Hill, H.C., Ball, D.L., Blunk, M., Goffney, I.M., & Rowan, B., (2007). Validating the ecological assumption: The relationship of measure scores to classroom teaching and student learning. Measurement, 5, 107-118.
Hill, H.C., Blunk, M.L., Charalambous, C.Y., Lewise, J.M., Phelps, G.C., Sleep, L., & Ball, D.L. (2008). Mathematical knowledge for teaching and the mathematical quality of instruction: An exploratory study. Cognition and Instruction, 26, 430-511.
Kennedy, M. (2005). Inside Teaching. Cambridge, MA: Harvard University Press.
Ma, L. (1999). Knowing and Teaching Elementary Mathematics. Mahwah, NJ: Erlbaum.
National Research Council. (2001). Knowing what students know: The science and design of educational assessment. Committee on the Foundations of Assessment. J. Pelligrino, N. Chudowsky, & R. Glaser (Eds.). Washington, DC: National Academy Press.
Shepard, L. (2000). The role of classroom assessment in teaching and learning. CSE Technical Report 517. Los Angeles: CRESST.
Sherrin, M.G. (2002). When teaching becomes learning. Cognition and Instruction, 20, 119-150.
Shulman, L. S. (1987). Knowledge and teaching: Foundations of the new reform. Harvard Educational Review, 57, 1-22.
Shulman, L.S. (2000). Teacher development: Roles of domain expertise and pedagogical knowledge. Journal of Applied Developmental Psychology, 21, 129-135.
Stecher, B., Le, V-N., Hamilton, L., Ryan, G., Robyn, A., & Lockwood, J.R. (2006). Using structured classroom vignettes to measure instructional practices in mathematics. Educational Evaluation and Policy Analysis, 28, 101-130.
Stigler, J.W., Lee, S-Y., & Stevenson, H.W. (1987). Mathematics classrooms in the Japan, Taiwan, and the United States. Child Development, 58, 1272-1285.
Watson, (2006). Some difficulties in informal assessment in mathematics. Assessment in Education, 13, 289-303.
Yin, R.K. (2009). Case study research: Designs and methods, Fourth Edition. Thousand Oaks, CA: Sage.
223

CHAPTER 7
Summary and Policy Implications
In classrooms, schools, and school districts around the country, educators’
enthusiasm for interim assessments continues to increase. Companies are responding
to this demand with assessments and data management systems designed to help
teachers, principals, and district leaders make sense of student data, identify areas of
strengths and weaknesses, identify instructional strategies for targeted students, and
much more. While formative assessment practices long preceded the No Child Left
Behind Act of 2001, this federal legislation upped the ante, contributing to a high-stakes
climate in which districts, schools, and teachers are experimenting with a myriad of
interim assessments intended to capture students’ understanding and knowledge so that
instructional action can be taken before a state test is given. More recently, U.S.
Secretary of Education Arne Duncan directed that a portion of the Race to the Top funds
be used by state consortia to develop new assessment systems, including formative and
interim assessments.
Much of the rhetoric around interim assessments claims that such measures will
lead to increased student achievement. Supporters argue that interim assessments will
provide data on student understanding; teachers’ analysis of this data will in turn lead to
greater differentiation of instruction and better teaching of content, resulting in improved
student learning. Effective use of assessment data assumes that school districts
communicate strong expectations for the instructional use of interim assessments; that
the assessments themselves generate useful and valid information on student
understanding of the tested content and instructionally actionable information; that
224

teachers and principals know how to interpret and act on the assessment results; and
that technology will streamline these processes.
Yet we have few studies of how interim assessments are actually used. Some
recent studies surveyed teachers about their use of test data in instruction. Many of
these teachers reported that interim test results helped them monitor student progress
and identify skill gaps for their students, and led them to modify curriculum and
instruction (cf. Christman, et al., 2009; Clune & White, 2008; Stecher, et al., 2008).
These studies, however, did not examine how individual teachers actually analyzed and
used these data to inform their classroom practice, or the conditions that supported
teachers’ ability to use interim assessment data to improve instruction.
This exploratory study of how 45 elementary school teachers in a purposive
sample of 9 schools in 2 districts used interim assessments in mathematics was
designed to address these research gaps. The study framework focused on teachers’
use of data in a cycle of instructional improvement; that is, how teachers gather
evidence about student learning, interpret that evidence, use evidence to improve
instruction, and carry out improved instruction. It also considered the many factors that
influence how teachers access, manage, interpret, and act on data. These include
district and school policies and practices and organizational norms and routines, as well
as educator capacity.
In this final chapter, we summarize the major findings of our study and discuss
their implications for educators, policymakers, and researchers.
District and School Supports for Assessment Use
Both Philadelphia and Cumberland adopted policies and created conditions that
were designed to support teacher use of interim assessment data for instructional
improvement. These included setting strong expectations for data use; generating timely
Chapter 7: Summary and Policy Implications
225

and accessible analyses of student performance data that could inform instruction;
dedicating time to analyze data, plan instruction and re-teach students; and providing
instructional support for teachers and students.
Expectations for use. The districts established and communicated expectations
for the instructional use of interim assessment data at all levels of the system. The
districts viewed these assessments as “teaching tools” that would support and guide
teachers’ instruction. District staff and school leaders (principals in Philadelphia and
curriculum specialists in Cumberland) expected teachers to use assessment results to
reflect on their instruction, to discuss and share common problems and instructional
solutions, and to provide remediation and enrichment during a dedicated period of time
following the assessments.
Both districts designed their interim assessments to be part of their overall
instructional guidance systems, not as “mini state tests” that mirrored the items in the
high-stakes state assessment. The districts enacted curriculum in mathematics aligned
to state standards, adopted common programs across schools, developed instructional
timelines linked to units in the mathematics program, and aligned interim assessment
tasks with content of the district curriculum and materials for each instructional period.
The districts communicated their expectations to principals and teachers through
several mechanisms. First, they structured their information management systems in a
way that focused the attention of teachers, instructional support staff and, in
Philadelphia, their principals on tested skills and learning standards. Philadelphia
shaped and reinforced their expectations for analysis of the interim assessment results
by mandating the use of a data analysis protocol that asked teachers to identify the
weakest skills and concepts for the instructional period and instructional strategies for re-
teaching these skills and concepts. Cumberland developed interim assessments at the
request of teachers, and teachers participated in their development, creating more of a
Chapter 7: Summary and Policy Implications
226

“buy-in” for their use. Although test results were not made public in Cumberland, the
district required all teachers to enter assessment results into an electronic spreadsheet.
The format of the spreadsheet, which highlighted student performance by content sub-
areas, generated expectations of when and where teachers should provide additional
support to students.
Second, Philadelphia held principals accountable for ensuring that teachers
accessed, interpreted, and acted on the results of the interim assessments. Philadelphia
principals were required to complete and review data analysis protocols for their schools
with their regional superintendents and to share school results with other principals at
monthly meetings. Although the intent of these meetings was to generate constructive
dialogue about instructional improvement, some educators viewed the public sharing of
data as undermining the low-stakes, instructional focus of the interim assessments. In
Cumberland, expectations for the use of the interim assessments were communicated
through the district’s curriculum and instruction staff, keeping the stakes of the interim
tests low and maintaining the emphasis on instructional use.
Finally, principals in our Philadelphia study schools reinforced the district’s
expectations for data use by modeling and monitoring teachers’ analysis of the interim
assessments. The principals conducted their own analysis of assessment results to
identify struggling students; areas of weak skills within a grade level; teachers whose
classes might be falling behind those of their grade-level colleagues; and/or subgroup
performance. Principals reviewed teachers’ data analysis protocols and they discussed
the results of the interim assessments with teachers in grade-group meetings. In some
of our study schools, principals looked for evidence of the reported re-teaching
strategies in teachers’ lesson plans. District- and school-based curriculum specialists
played this role in Cumberland, identifying common problems within grades and across
schools and discussing assessment results with teachers.
Chapter 7: Summary and Policy Implications
227

Technology and data. The districts developed user-friendly instructional
management systems (IMS) that facilitated teachers’ analysis of interim assessment
data. The IMS in Philadelphia enabled a teacher to view the performance of each
student and the entire class on individual test items and by content standard, all with a
click of the mouse. The system also displayed each student’s incorrect answer choices.
The Cumberland IMS was less sophisticated. After teachers entered test results, the
system automatically highlighted students who missed more than one test item for a
learning standard. While teachers could not conduct item analyses using this IMS, they
could easily see how many and which students were possibly weak in a particular
learning area. The Philadelphia IMS also provided links to information on how to re-
teach a particular standard and practice worksheets for students. Philadelphia provided
professional development on its IMS, but the training focused on how to access and use
the components of the system (“point and click”), rather than on how to analyze the
interim assessment data itself.
Both districts assumed that their interim assessments, which were aligned with
instructional units, would provide teachers with valid and actionable information; that is,
teachers could diagnose student error and design appropriate re-teaching based on the
results of the tests, including an analysis of incorrect answers. An independent
examination of interim assessments in both Philadelphia and Cumberland showed,
however, that few items in either district’s tests provided information on mathematical
misunderstandings.
Time. Both districts created dedicated time for teachers to discuss assessment
results and instructional techniques, to re-teach content and skills to students, and to
participate in professional development. Philadelphia created six-week cycles of
instruction and assessment: five weeks of instruction (tied to the district’s pacing guide)
culminating with the interim assessments, and a sixth week of review and/or extended
Chapter 7: Summary and Policy Implications
228

development of topics. At the end of the sixth week, teachers moved on to the next
instructional unit. The cycle was somewhat different in Cumberland, where teachers
generally administered the interim assessments, or practice tests, 3 to 5 days prior to
giving an end-of-unit test that was part of a student’s grade. In both cases, the districts
expected teachers (and where available, other support staff) to provide remediation for
students in areas of weakness and enrichment in areas of strength during these re-
teaching periods. While schools in both Philadelphia and Cumberland created common
planning time for teachers in the same grades, and set aside dedicated time for
professional development during the school day, student or school issues or district-
directed professional development often limited time available for teachers to discuss
interim assessment results and common instructional challenges.
Professional support. The districts identified two targets for professional
support: teachers and students. Each of our Philadelphia schools had a school-based
teacher leader (SBTL) whose job was to assist teachers with data analysis and
instruction in mathematics. In three schools this was a part-time position, while in two the
SBTL was full-time. The SBTLs helped teachers analyze data and locate additional
instructional materials, but they had limited time to provide instructional support to
teachers. In Philadelphia, teachers occasionally had other adults in their classrooms
(generally volunteers or student teachers) to instruct struggling students or work with
groups of students, thereby enabling teachers to implement small-group instruction.
Many of our Philadelphia teachers made time during lunch hours and before or after
school to give students additional support. In contrast, Cumberland had an intensive
system of instructional support for teachers and students through a district mathematics
coach and full-time school-based elementary curriculum specialists (ECS) who served
students as well as faculty. Cumberland schools also had mathematics aides who
worked directly with teachers. This staffing facilitated the use of group instruction in the
Chapter 7: Summary and Policy Implications
229

classroom and provided more intensive remediation to students identified as needing
additional help.
The Cycle of Assessment and Instruction Our findings confirm other reports that teachers are attempting to use interim
assessment results for instructional improvement. Analyzing interim assessment results
was a universal practice among the teachers in our study, and they understood and
generally supported district expectations for their use. At a minimum, all of the teachers
had experience looking at printouts of student results, and most were comfortable
accessing those results directly using the IMS. In both Philadelphia and Cumberland,
teachers in our sample used the data from interim results to identify weaknesses in their
classes, in either content areas or individual student performance. We found that
teachers in Philadelphia often set thresholds for student performance (a score below
which instructional response would be warranted), and these thresholds varied from
teacher to teacher. Teachers in Cumberland were much less likely to speak of specific
thresholds of performance on the interim assessment. Rather, they were more likely to
speak of these results in the context of other information from their formative
assessment practice.
Teachers’ processes for interpreting interim assessment data with an eye toward
instructional planning were influenced by a variety of factors, including their knowledge
about specific students’ backgrounds or past performance, student performance in
relation to their peers, district factors such as the scheduling of interim assessments
relative to the pacing guide, or teacher perceptions about which mathematical content
was especially challenging for students. Furthermore, the IMS in each district influenced
the steps teachers took in analyzing interim assessment results in that the design of the
Chapter 7: Summary and Policy Implications
230

IMS highlighted areas of weakness in student performance. Teachers were influenced
by all of these factors when deciding what to teach and to whom.
In planning for re-teaching time, the most common response among Philadelphia
teachers was to revisit content using a combination of whole-group and small-group
instruction with a smaller number of teachers adding peer-tutoring to this mix. In
Cumberland, the results from the interim assessments were primarily used to inform
ongoing flexible grouping based on students’ various (mis-)understandings. These
different ways of organizing re-teaching may have reflected, to some extent, the types
and levels of support available to teachers. Individual remediation during class time was
rare among the Philadelphia teachers in our study, due in part to lack of classroom
support for practices like conferencing. In Cumberland, the lowest performing students
could be referred to the curriculum specialist for learning support. Therefore, while the
Cumberland ECS might see the same group of students over time for remediation,
grouping within the classrooms could be responsive to student understandings that
changed over time.
We were also interested in teachers’ understanding of why students respond to
mathematical problems in certain ways. When presented with a set of interim
assessment items with typical student errors embedded in the responses and asked
what the student might be thinking, teachers offered various diagnoses. In Philadelphia,
responses tended to initially fall along a procedural-conceptual continuum,1 with
procedural diagnoses being by far the most common. Cumberland teachers’ diagnoses,
however, tended to range along a symptom-etiology continuum. For example, in light of
1 In the mathematics education literature, procedural knowledge has been largely defined as “how to” and conceptual knowledge has been defined as “why” (Hiebert & Lefevre, 1986). Without joining current debates on the relationship between the two knowledge types (Baroody, Feil, & Johnson, 2007; Rittle-Johnson & Sigler, 1998), we adopt Hiebert and Lefevre’s straightforward distinction as our definition for the purposes of this study. Of course, we acknowledge that both knowledge types are necessary for the development of mathematical competence.
Chapter 7: Summary and Policy Implications
231
student errors on problems involving fractions, teacher responses ranged from
symptomatic (e.g., “they tend to isolate either the denominator or the numerator”) to
etiological (e.g., “truly do they understand that the denominator has a role here?”). This
trend differed from the responses of the Philadelphia teachers, which largely consisted
of procedural explanations of student error (e.g., “they added the two numerators
together”).
In both districts, many teachers also attributed student errors to other cognitive
weaknesses. These included a list of possible causes for student underperformance,
including, but not limited to, weak reading ability, difficulty maintaining attention, and low
levels of English language proficiency. Finally, teachers in both districts also offered
contextual or external diagnoses, according to which student mathematical performance
fell short due to factors that were seen to be outside of the teacher’s or school’s realm of
influence. These tended to consist of perceived distal causes of the other proximal
diagnoses. For example, several teachers mentioned students’ lack of background
knowledge as contributing to difficulties in comprehending word problems.
Furthermore, we found that what teachers planned to teach was related to how
they diagnosed student error. While we saw variation among teachers’ responses within
each district, teachers in Philadelphia largely emphasized re-teaching procedural steps
in their instructional planning. In classrooms, we observed that this approach often took
the form of teachers reworking examples (often problems from the interim assessments)
with either the whole class or with a small group. In Cumberland, many teachers
mentioned that part of re-teaching involves re-teaching a mathematical concept;
however, we also observed and heard about more procedurally oriented approaches as
well. Some Cumberland teachers made a distinction between re-teaching and
“completely re-teaching,” where the former might include follow-up lessons or student-
worked examples on the board and the latter referred to direct instruction on a concept
Chapter 7: Summary and Policy Implications
232

or skill that was already taught. This response may be related to the symptom-etiology
interpretive continuum in that teachers who understand the etiology of a
misunderstanding may be more likely to know when, what, and how to “completely re-
teach.” The distinction between reviewing and re-teaching is an important one, as re-
teaching that emphasizes “ritualized skills and applications” is unlikely to lead to
increased student learning (McMillan, 2010, p. 45). It is important to note that while
teachers used the IMS to help with data interpretation, use of the IMS for more complex
tasks, such as generating supplemental assessments or identifying curriculum, was far
less common among teachers in our study.
Interim Assessments in Context
When we began to look at teachers’ interim assessment use within a broader
formative assessment context, a more complicated picture of teacher use emerged.
First, we discovered that teachers’ interpretation of interim assessments informed their
other types of formative assessment in very particular ways. The most commonly
observed patterns showed teachers moving from interpretation of interim assessment
data to collection of short-cycle (Wiliam & Leahy, 2006), or minute-by-minute,
information. For example, several of our teachers questioned students on their
responses to individual interim assessment items and then used this information to plan
further instruction. This sequence was observed for roughly half (18 of 32) study
teachers included in this analysis and served several purposes. Most often, short-cycle
practices were used to elicit more information about students’ answers on interim
assessment items. Slightly less common (13 of 32 teachers) was the sequencing of
interpretation of interim assessment data with collection of information from teacher-
developed assessments. Ten teachers reported that, like short-cycle practices, these
assessments were used to gather more information about student problem-solving
Chapter 7: Summary and Policy Implications
233

processes. And, as discussed below, teacher-developed assessments were used to
gauge student progress or mastery of re-taught content (post-assessment) or to make
pacing decisions.
When we considered teacher practice across assessment types, we found that
teachers who focused on conceptual understanding using one type of formative
assessment were more likely to do so for all types of assessment. This suggests that
analytic or diagnostic capacity underlies effective formative assessment, regardless of
whether those assessments are embedded within instruction, developed by teachers, or
externally designed.
We then considered the different ways in which teachers respond instructionally
to formative assessment information. Nearly all of the teachers acted on formative
assessment information with organizational strategies (identifying what content to re-
teach and to which students), with roughly half (17of 32 teachers) using it primarily or
only in this way. For these teachers, formative assessment information was used to
determine: what content to re-teach; which students need additional support; whether
and how students should be grouped during re-teaching; and when to move on to the
next concept or topic. About half of the teachers in our sample also employed
instructional change strategies—modifications in how they intended to re-teach specific
content or students—in response to formative assessment information. Many of these
teachers simply opted for teaching content “a different way,” or made greater use of
manipulatives in the hope that an alternate presentation might help students to grasp
material with which they had struggled. While the use of multiple representations is an
important part of mathematical development, teachers’ use of these approaches did not
seem to depend on the content being taught, or even the errors that were made but
rather, the belief that variety of presentation, or exposure to multiple representations, is
beneficial to learning.
Chapter 7: Summary and Policy Implications
234

Teachers who assessed for conceptual understanding were far more likely to
employ instructional change strategies than those who did not. Examples of these
strategies included use of additional representations or models of mathematical
concepts (e.g., the introduction of arrays for multiplication or set models for fractions)
and connecting students’ prior knowledge to current learning goals (e.g., relating
algorithms for double-digit subtraction to triple-digit subtraction). While we cannot say
for certain why this might be the case, we can hypothesize that assessing students’
mathematical understanding (and not simply success or failure with procedures) affords
teachers better opportunities to assess students’ learning needs. Many times, these
needs are inconsistent with past instructional approaches. It is also possible that
teachers who are able to assess for conceptual understanding are also more likely to
have the capacity to respond with a varied instructional repertoire. While the following
section of this chapter will begin to address teacher capacity for formative assessment
practice, we believe that further research into this relationship is vital to developing
effective supports for formative assessment.
In sum, there was considerable evidence that interim assessments structure and
guide other types of formative assessment. In themselves, interim assessments appear
limited in their capacity to inform teachers about students’ thinking or problem solving,
but they give direction to short-cycle and teacher-developed assessments that may be
better suited to that purpose. Furthermore, while it is clear that teachers interpret and act
on the information generated through formative assessment of all types, those
interpretations do not always lead to instructional change.
Teacher Capacity
We found substantial variation in the ways teachers use interim assessment
results and in their instructional response to formative assessment information more
Chapter 7: Summary and Policy Implications
235

generally. These findings hint at a possible underlying capacity to make sense of
students’ mathematical understandings and to respond to such with appropriate
instruction. Previous research has indicated that teachers’ mathematical knowledge for
teaching (MKT) explains variation in instructional quality in mathematics (Hill, et al.,
2008). In our study, we examined the relationship between MKT, defined as what
mathematical knowledge teachers need to help children learn mathematics (Hill, et al.,
2004), and teachers’ formative assessment practices in the classroom.
Our first finding confirmed that, even among our sample of teachers from
average and above-average performing schools, there is great variation in teachers’
MKT. While Cumberland teachers had higher MKT on average than Philadelphia
teachers, we also saw great variation within each district with substantial overlap in the
MKT scores of Philadelphia and Cumberland teachers. We also saw great variation in
MKT within schools in both districts.
Our second finding was surprising: there was greater difference in MKT between
3rd- and 5th-grade teachers than between Philadelphia and Cumberland teachers.
Teachers scoring at the 75th percentile among 3rd-grade teachers demonstrated weaker
mathematical knowledge for teaching than those scoring at the 25th percentile of 5th-
grade teachers. While we may expect, for various reasons, higher grade teachers to
have greater MKT than lower grade teachers, we did not expect this difference to be so
large.
In spite of great differences in MKT among the teachers in our sample, we found
no differences between High-, Medium-, and Low-MKT groups in their reported
approaches to learning about students’ mathematical understanding. Specifically,
teachers in the Low-, Medium-, and High-MKT groups reported the same number of
techniques and approaches designed to learn more about how their students think about
mathematics, or ways of “knowing student thinking” (KST). In addition, teachers in the
Chapter 7: Summary and Policy Implications
236

three groups reported the same mix of these activities (as adapted from An, Kulm, & Wu,
2004); they divided their reported activities similarly between: addressing student
misunderstandings, building on students’ mathematical understanding, engaging
students in mathematics, and promoting students’ mathematical thinking.
Although MKT did not affect the number and type of classroom activities that
teachers reported, we hypothesized that MKT would impact the quality of classroom
formative assessment practice in mathematics. We conducted an in-depth examination
of six teachers who had reported an average number of KST practices: two with High
MKT; two with Medium MKT; and two with Low MKT. We found that the instruction and
formative assessment practice of teachers with high levels of MKT was generally
centered around student understanding: the teachers actively sought to learn how
students think and they responded to student understandings. The level of mathematics
in these rooms was relatively high, and student engagement was maintained. The
teaching in the Medium-MKT classes was less consistent. These teachers seemed to
want to engage students in mathematics, but appeared to be less successful in doing so
than the High-MKT teachers. The lack of small-group and individual student work in
these rooms, coupled with mathematically superficial questioning routines, was an
obstacle to learning about student understanding. In the Low-MKT rooms we also saw
only whole-group instruction and a near total lack of discussion about what students
know. While these findings are based on data from only six teachers, they allow us to
explore possible relationships between MKT and teachers’ formative assessment
practice in mathematics.
Implications for Policy and Research
Research literature about the impact of interim assessments on student learning
is at best inconclusive. Optimism about its potential largely derives from research on
Chapter 7: Summary and Policy Implications
237

short-cycle formative assessment, which has been shown to improve both instruction
and student learning. The critical question for policymakers, then, is whether interim
assessments can be used formatively. Put another way, can teachers use interim
assessment data to make instructional changes that are likely to improve student
achievement?
Our study showed that interim assessments are useful but not sufficient to inform
instructional improvement. When linked directly to a district’s curriculum, interim
assessments helped teachers make decisions about what content to re-teach and to
whom by identifying areas in which specific students or the class as a whole were
performing poorly. Where resources were available, interim assessments also allowed
teachers to help students in need of additional, individualized supports.
Use of interim assessments for these purposes was facilitated by several district
and school factors, including alignment of interim assessment content with standards
and curriculum; expectations that interim assessment results would be used to inform
instruction; a quality and accessible IMS that focused teachers’ attention on content as
well as on items; time to re-teach content and skills to students; and instructional
supports for struggling students and professional supports for teachers in data analysis
and instruction. School leadership and a culture of data use were also critical factors in
supporting teachers’ use of data.
We found little evidence, however, that the interim assessments we studied
helped teachers develop a deeper understanding of students’ mathematical learning—a
precursor to instructional improvement. Most items in the assessments did not provide
actionable information on students’ misunderstandings. In addition, teachers’ capacity to
interpret assessment data played a major role in how they used the results of interim,
and even formative, assessment. Many teachers focused on procedural rather than
conceptual sources of student errors on test items, diagnoses that appeared to inform
Chapter 7: Summary and Policy Implications
238

their instructional planning during re-teaching. Teachers who assessed for conceptual
understanding were more likely to use instructional change strategies that those who did
not. Teachers’ mathematical knowledge for teaching also appeared to contribute to
teachers’ instructional and assessment practices.
The findings from our study, along with those from related research on formative
assessment and data-driven decision making, lead us to make the following
recommendations about the design of assessment systems, supporting the use of
interim assessments, and future research.
Focus, align and inform. The design of interim assessments must reflect their
intended use. While this study focused on the ways in which teachers used interim
assessments formatively (i.e., to change instruction), interim assessments can also have
predictive and/or evaluative purposes. Assessments should be chosen to serve a single
purpose. If interim assessments are to be used formatively, they must be designed for
instructional purposes. This may mean using other tests to meet predictive or evaluative
goals. Assessments designed for instructional purposes must be closely aligned with
district curriculum as well as district and state standards. This principle applies not only
to the constructs that are assessed and the formats of the test, but to any supplemental
components of the assessment. For example, recommended instructional strategies
need to align to the instructional approach of the curriculum. Similarly, districts need to
verify claims that multiple-choice item distractors carry instructionally useful information.
Mathematics items should be written so that distractors represent common errors in both
procedure and conceptual understanding.
Support teachers and students. Even if interim assessments are focused,
aligned with curriculum, and of high quality, their impact on teaching and learning
depends on how their adoption and use is supported at the district and school level.
District and school leaders need to communicate consistent and clear messages about
Chapter 7: Summary and Policy Implications
239

the purpose and use of interim assessment. School leaders should model effective data
use for teachers and other support staff and should allocate school-level resources to
support interim assessment use for instructional purposes.
District IMS must return interim assessment data to teachers in a manner that is
both timely and accessible; teachers must in turn be trained to use the IMS to its full
capabilities. The goal should be to have teachers invest their time in interpreting results
and planning instruction rather than navigating the IMS or entering data. Another critical
factor is time. Whether highly structured or flexible, pacing schedules must allow time for
re-teaching to occur. Additionally, teachers should have regular time in their schedules
to analyze interim assessment results and discuss potential instructional responses.
While a major goal of interim assessment is to improve classroom instruction, our
findings also suggest that a secondary use of such assessments may be to identify
students in need of additional support, such as added instructional time or tutoring.
Schools that already have these resources in place should consider using interim
assessments (together with teacher input) to identify students in need of support. Where
such supports are limited, schools should consider how to best respond to individual
students who continue to struggle. This is an urgent issue given the multiple demands
placed on teachers during regularly scheduled instructional time.
Build instructional capacity. Building a high-quality assessment system that is
supported at the district and school levels is necessary for teachers to access, analyze
and discuss data. How well teachers use such data in the classroom, however, reflects
their capacity to assess and teach for mathematical understanding. Teachers who
assess for conceptual understanding do so across multiple test formats, and appear to
be more apt to enact instructional change strategies than those who pay attention to
students’ procedural skills alone. Likewise, formative assessment, as a process, is
heavily dependent on teacher capacity.
Chapter 7: Summary and Policy Implications
240

When looking to increase teacher capacity to use data for instructional
improvement, districts and schools should consider that teachers need more
professional development and support on interpreting data (e.g., diagnosing student
error) and on connecting this evidence to specific instructional approaches and
strategies. Part of using evidence of student learning to improve instruction is knowing
how mathematical understanding develops and how to support students’ progress
toward a learning goal. Thus, in mathematics, professional development for teachers
should focus as well on teacher content knowledge, developing teachers’ instructional
repertoires, and capacity to assess for students’ mathematical learning. Professional
development for interim assessment use should go beyond using “point and click” to
locate and organize data and should emphasize analysis of student results in the context
of standards and curriculum. Likewise, analysis should incorporate information from
other types of assessment (e.g., in-class student work, teacher observation, etc.).
The curriculum must be designed to allow for integration of assessment
information from multiple sources and provide guidance for instructional response. In
some cases, the potential for this opportunity lies within the current curriculum; for
example, the program used by our study districts offers multiple types of assessment
embedded within the curriculum as well as instructional suggestions for remediation and
enrichment built into every lesson. In other cases, more appropriate programs or
supplemental materials may need to be adopted. In addition, tools are being developed
to enable the connection between interpretation and action; for example, newer
technology platforms aim to link information gleaned from assessments with potential
instructional responses.
However, adopting the right curriculum and tools are not, in themselves,
sufficient to enable teachers to adjust instruction in response to assessment results. An
extended research base supports the value of regular, facilitated teachers’ analysis of
Chapter 7: Summary and Policy Implications
241

student work to inform instructional decision-making. One such model features groups of
teachers examining student work in collaboration with a content area expert (e.g.,
mathematics coach or curriculum specialist) on a regular basis throughout the school
year. Teachers return to their classrooms with a list of possible instructional strategies
developed by the group. The next meeting begins with teachers’ reporting on the
success and challenges of implementing instructional change. This information, along
with new student work, forms the basis for the next discussion. It is this kind of ongoing,
supported capacity-building that gives teachers the best chance at turning assessment
results into increased student learning.
Research implications. This was an exploratory study focused on how teachers
actually interpret and act on data from interim assessments. Below we make
suggestions for further developing the field of research on interim assessments.
First, we see a need to develop a more comprehensive body of research that
focuses on actual assessment use. We believe that the most potential lies in examining
assessment use within particular content areas (e.g., reading, writing, mathematics,
science, etc.). In this way, we can identify trends and relationships that exist within
content areas as well as others that may apply more generally (e.g., the importance of
timeliness of assessment results). Likewise, the role of teacher capacity for teaching and
assessing within particular content areas is an important variable to consider when
researching teacher assessment use.
Second, there needs to be research on the quality of data generated by interim
assessments. This is a severely neglected area of research, yet poor data precludes
effective data use. Claims about the validity of interim assessment results for
instructional use need to be investigated as a matter of course.
Finally, research on assessment should examine interim assessment use in the
context of the broader system of assessment. Current research tends to focus on
Chapter 7: Summary and Policy Implications
242

individual assessments and not on the relationship among assessments. There is a
need to examine the degree to which assessments of different types inform each other.
For example, do teachers scaffold the information received from different assessments?
To what degree do the characteristics of these assessments influence teacher use?
Answering these questions necessitates observing the instruction that is part of the
assessment cycle.
Chapter 7: Summary and Policy Implications
243

References
An, S., Kulm, G., & Wu, Z. (2004). The pedagogical content knowledge of middle school mathematics teachers in China and the U.S. Journal of Mathematics Teacher Education, 7, 145-172.
Baroody, A.J., Feil, Y., & Johnson, A.R. (2007). An alternative reconceptualization of
conceptual and procedural knowledge. Journal for Research in Mathematics Education, 38, 115-131.
Christman, J., Neild, R., Bulkley, K., Blanc, S., Liu, R., Mitchell, C., & Travers, E. (2009).
Making the most of interim assessment data. Lessons from Philadelphia. Philadelphia, PA: Research for Action.
Clune, W. H., & White, P. A. (2008). Policy effectiveness of interim assessments in
Providence public schools (WCER Working Paper No. 2008-10). Madison, WI: University of Wisconsin-Madison, Wisconsin Center for Education Research.
Hiebert, J., & Lefevre, P. (1986). Conceptual and procedural knowledge in mathematics: An introductory analysis. In J. Hiebert (Ed.), Conceptual and procedural
knowledge: The case of mathematics. Hillsdale, NJ: Erlbaum. (pp. 1-27). Hill, H.C., Schilling, S.G., & Ball, D.L. (2004). Developing measures of teachers’
mathematics knowledge for teaching. The Elementary School Journal, 105, 11- 30.
Hill, H.C., Blunk, M.L., Charalambous, C.Y., Lewise, J.M., Phelps, G.C., Sleep, L., &
Ball, D.L. (2008). Mathematical knowledge for teaching and the mathematical quality of instruction: An exploratory study. Cognition and Instruction, 26, 430-511.
McMillan, J.H. (2010). The practical implications of educational aims and contexts for
formative assessment. In H.L. Andrade & G.J. Cizek (Eds.). Handbook of formative assessment. New York: Routledge. (pp. 41-58).
Rittle-Johnson, B., & Siegler, R.S. (1998). The relation between conceptual and
procedural knowledge in learning mathematics: A review. In C. Donlan (Ed.), The development of mathematical skill. Hove, UK: Psychology Press. (pp. 75-110)
Stecher, B., Epstein, S., Hamilton, L. S., Marsh, J. A., Robyn, A., McCombs, J. S.,
Russell, J., & Naftel, S. (2008). Pain and gain: Implementing No Child Left Behind in three states, 2004-2006. Santa Monica, CA: RAND.
Wiliam, D., & Leahy, S. (April, 2006). A theoretical foundation for formative assessment.
Paper presented at the American Educational Research Association annual meeting, San Francisco, CA.
Chapter 7: Summary and Policy Implications
244

Nondiscrimination Statement
The University of Pennsylvania values diversity and seeks talented students, faculty and staff from diverse backgrounds. The University of Pennsylvania does not discriminate on the basis of race, color, sex, sexual orientation, gender identity, religion, creed, national or ethnic origin, citizenship status, age, disability, veteran status or any other legally protected class status in the administration of its admissions, financial aid, educational or athletic programs, or other University-administered programs or in its employment practices. Questions or complaints regarding this policy should be directed to the Executive Director of the Office of Affirmative Action and Equal Opportunity Programs, Sansom Place East, 3600 Chestnut Street, Suite 228, Philadelphia, PA 19104-6106; or (215) 898-6993 (Voice) or (215) 898-7803 (TDD).