Embed Size (px)
Citation preview
From Technology to Knowledge Development in UAE
Dr. Eesa Mohammed BastakiChairman, Emirates Science Club
13 December 2012
2nd International Platform on Integrating Arab e-InfrastructureIn a Global Environment, eAGE2012
December 12-13, 2012, Zayed University, Dubai, UAE

Contents
Introduction…
What is Venture Capital?
Patents Registered in the Arab World
ICT Economy Driving Forces
ICT Incubation Center.. A VC Requirement
Research & Business Development (R&BD)
An Initiative to Create an Eco-System through Funding ICT value chain
Appendix

INTRODUCTION…
4
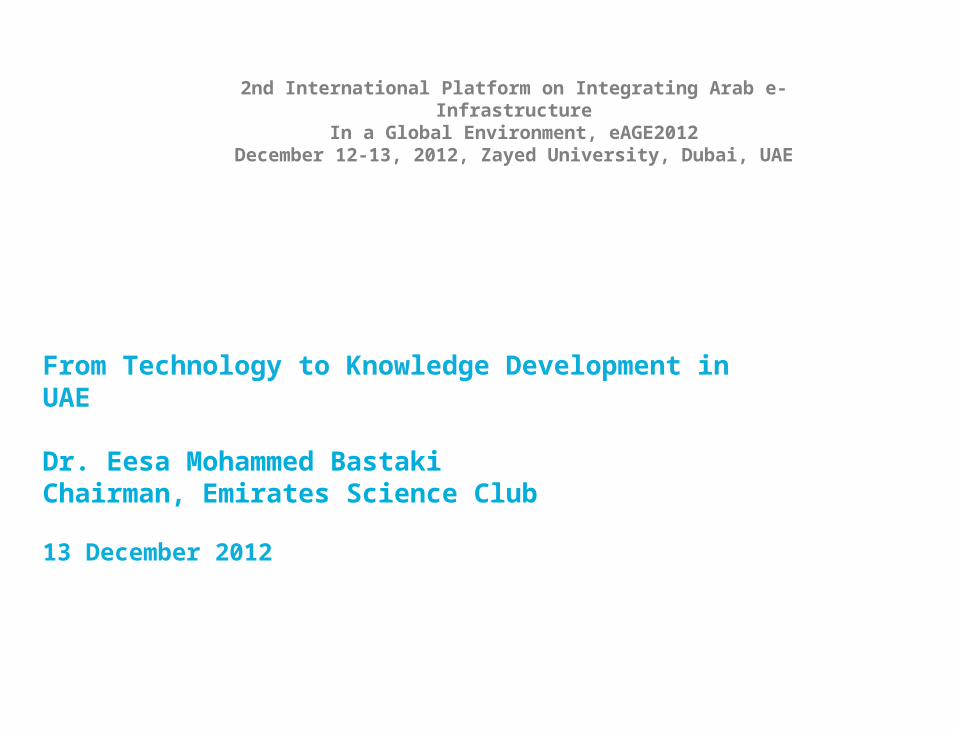
Introduction: Silicon Valley: Recipe of Success..
The Success Recipe of Silicon Valley:1. Universities and R&D: Stanford University & UC Berkeley
2. Skilled Knowledge Workers: Graduates of the aforementioned universities
3. Early Adopters: US military were too willing to buy new and unproven products
4. Service Infrastructure: Interconnected network of firms such as law firms, investment banks, recruitment agencies, marketing agencies, accountancy firms and other highly specialized service providers
5. Available Venture Capital: By 1974 there were more than 150 VC firms in Silicon Valley
6. Complementary Organizations: Outsourcing is easy & possible
Source: “Sand to Silicon,” Jeffrey Sampler & Saeb Eigner
© Copyright ICT Fund 2011
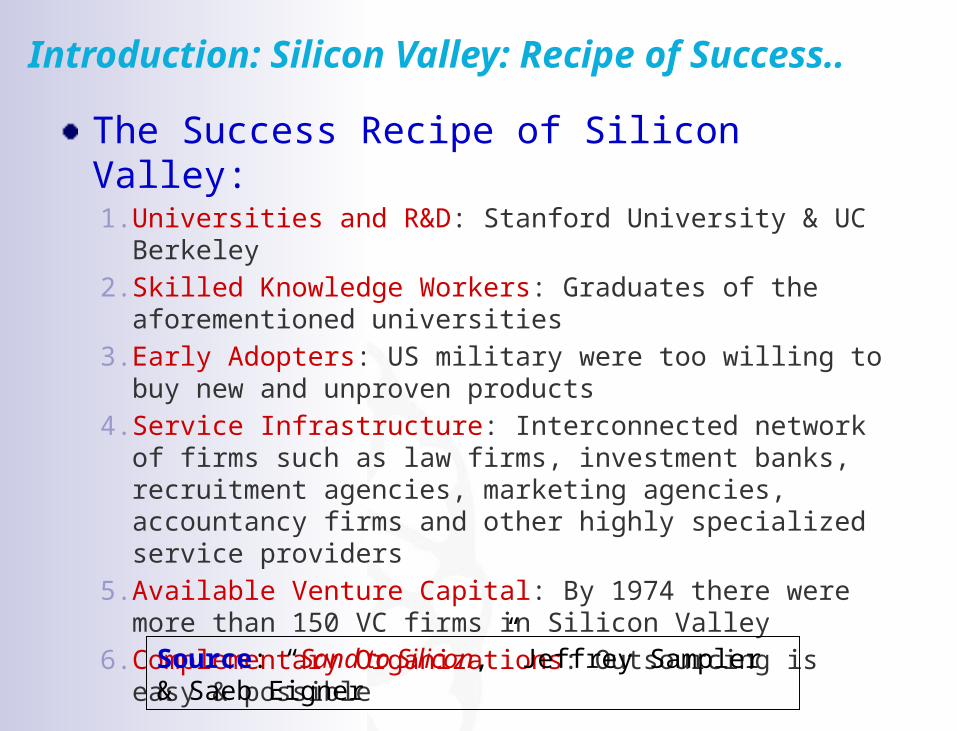
Intellectual Capital
Incubating Innovative
Ideas
Smart Research
Nurturing Start-ups
Technology Leadership
What should be done to achieve a Knowledge-Based ICT sector for the UAE?
7
Strategic Vision: After Oil
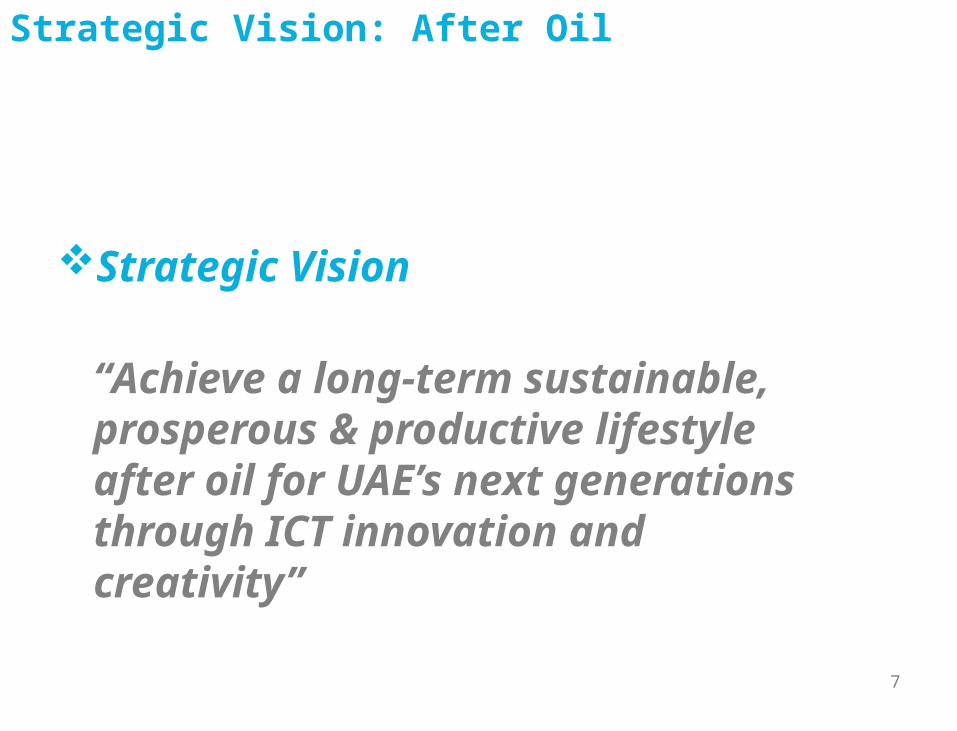
Strategic Vision
“Achieve a long-term sustainable, prosperous & productive lifestyle after oil for UAE’s next generations through ICT innovation and creativity”
PATENTS REGISTERED IN THE ARAB WORLD

9
Patents Registered in the Arab World
Data Source: Arab Human Development Reports
Number of patents registered in the United States from Arab countries during the period 1980-2000
Country Number of patents registered in the United States from Arab countries during the period 1980-2000
Bahrain 6
Egypt 77
Jordan 15
Kuwait 52
Oman 5
Saudi Arabia 171
Syria 10
UAE 32
Yemen 2
10
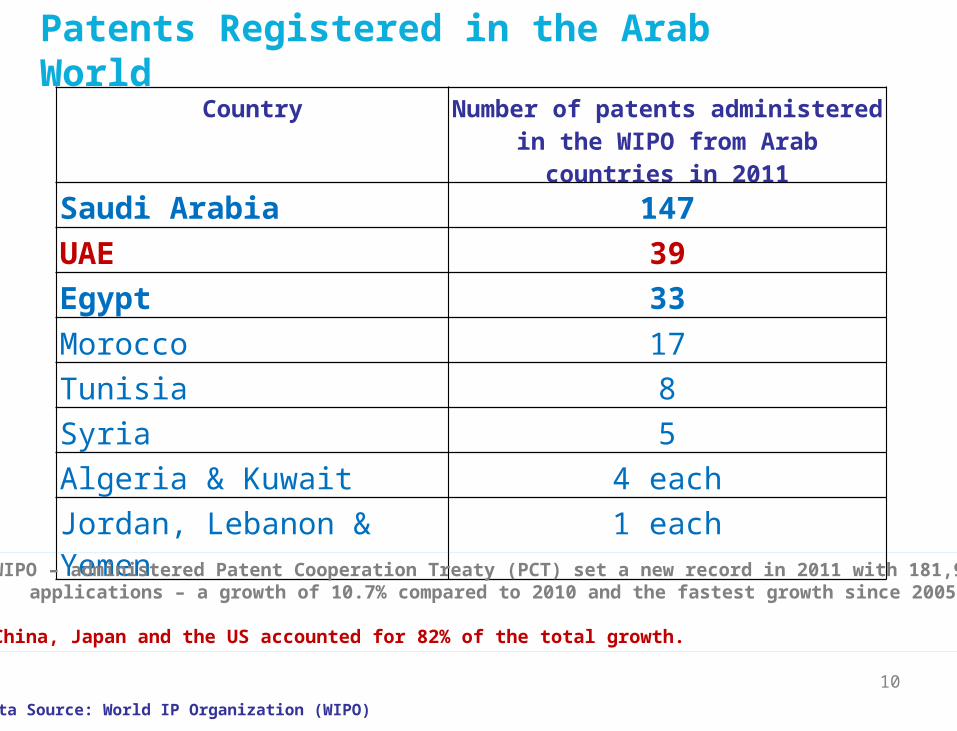
Patents Registered in the Arab World
Data Source: World IP Organization (WIPO)
Country Number of patents administered in the WIPO from Arab countries in 2011
Saudi Arabia 147
UAE 39
Egypt 33
Morocco 17
Tunisia 8
Syria 5
Algeria & Kuwait 4 each
Jordan, Lebanon & Yemen 1 each
• WIPO – administered Patent Cooperation Treaty (PCT) set a new record in 2011 with 181,900 applications – a growth of 10.7% compared to 2010 and the fastest growth since 2005.
• China, Japan and the US accounted for 82% of the total growth.
ICT ECONOMY DRIVING FORCES
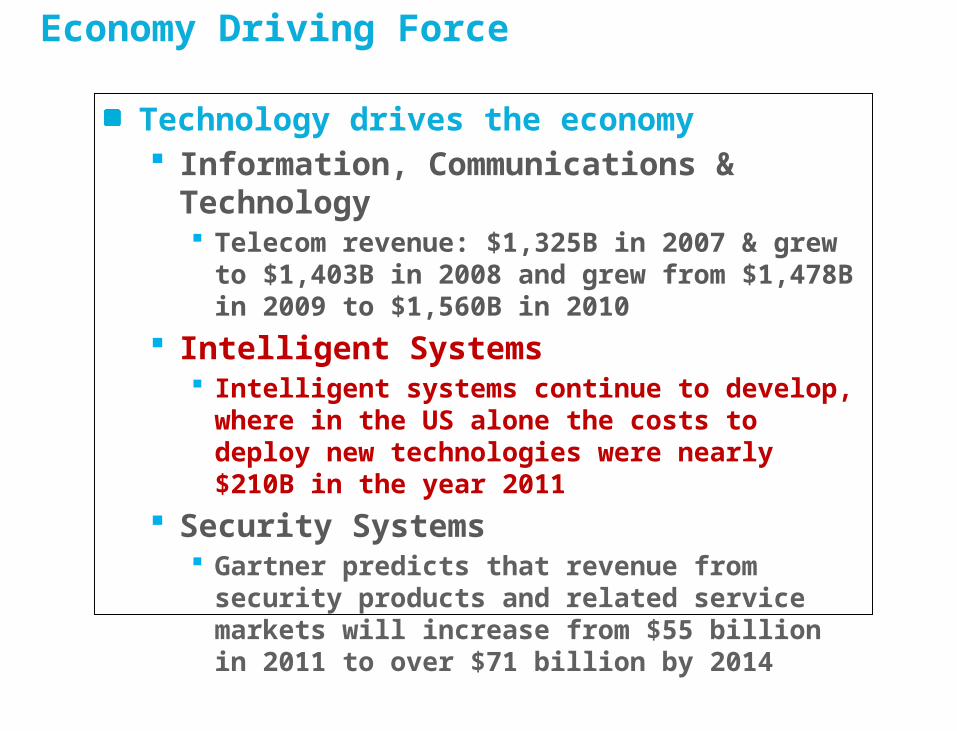
Economy Driving Force
Technology drives the economy Information, Communications & Technology
Telecom revenue: $1,325B in 2007 & grew to $1,403B in 2008 and grew from $1,478B in 2009 to $1,560B in 2010
Intelligent Systems Intelligent systems continue to develop, where in
the US alone the costs to deploy new technologies were nearly $210B in the year 2011
Security Systems Gartner predicts that revenue from security
products and related service markets will increase from $55 billion in 2011 to over $71 billion by 2014

Economy Driving Force
RegionalIDI
Rank
Europe
Global IDI Ran
k
Asia & Pacific
Global IDI Ran
k
Americas
Global IDI Ran
k
Arab State
s
Global IDI Ran
k
CIS
Global IDI Ran
k
Africa
Global IDI Ran
k
1Swede
n1
Korea (Rep)
2
United
States
17 UAE 32 Russia 50Seychelles
57
2Denma
rk3
Hong Kong, China
11Canad
a19
Bahrain
42Ukrain
e51
Mauritius
62
3Netherl
ands4 Japan 12
Argentina
47Qata
r44 Belarus 54
South Africa
87
4 Iceland 5Austra
lia14 Chile 48
Saudi
Arabia
55Moldov
a68
Cape Verde
105
5 Norway 6Singap
ore15
Uruguay
49Kuwa
it57
Kazakhstan
69 Gabon 107
ITU’s Ranks in ICT Development Index (IDI)

Top Worldwide Smartphone Operating System Markey Share
Worldwide smartphone operating system (OS) market share in 2009-2015, according to Gartner
Smartphone OS market share and compound annual growth rate 2011-2015, according to IDC
OS(listed
alphabetically)
2009market share
2010market share
2011market share
2015market Share
2011market share
2015market Share
2011-2015CAGR
Android 3.9% 22.7% 38.5% 48.8% 39.5% 45.4% 23.8%
BlackBerry 19.9% 16.0% 13.4% 11.1% 14.9% 13.7% 17.1%
iOS 14.4% 15.7% 19.4% 17.2% 15.7% 15.3% 18.8%Symbian 46.9% 37.6% 19.2% 0.1% 20.9% 0.2% -65.0%Windows
Phone/Mobile 8.7% 4.2% 5.6% 19.5% 5.5% 20.9% 67.1%
Others 6.1% 3.8% 3.9% 3.3% 3.5% 4.6% 28.0%Total
smartphones sold
172 million
297 million
468 million
631 million 450 million N/A 19.6%
Source: Gartner (April 2011)Source: IDC (March 2011)
via: mobiThinking

Wireless Revolution
Voice
Yesterday- 1999
Millions of wireless devices
SMS
Last Year- 2011
Billions of wireless devices
Mobile TV
Video
Internet
WiFi
ICT Economy Driving Force
Source: Dr. Khaled Ben Letaief, HKUST, 2009
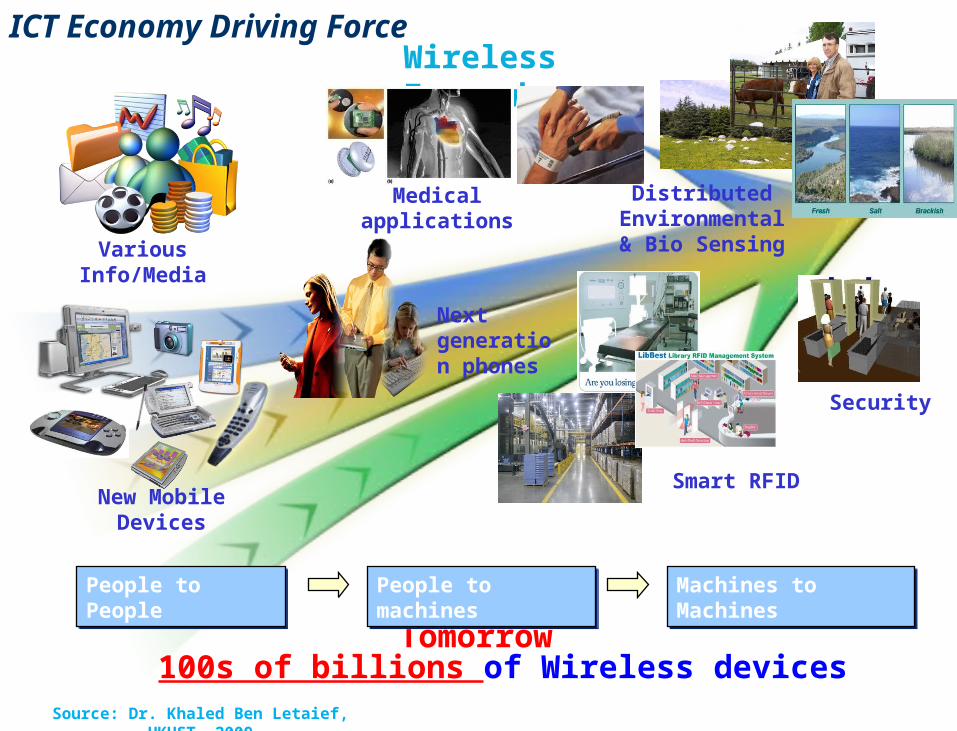
Wireless Everywhere
Tomorrow100s of billions of Wireless devices
VariousInfo/Media
New MobileDevices
Distributed Environmental& Bio Sensing
Smart RFID
People to PeoplePeople to People People to machinesPeople to machines Machines to MachinesMachines to Machines
Next generation phones
Medical applications
Security
ICT Economy Driving Force
Source: Dr. Khaled Ben Letaief, HKUST, 2009

Economy Driving Force
Country KEI (Knowledge Economy Index) [2009]
Algeria 3.22
Bahrain 6.04
Djibouti 1.47
Egypt 4.08
Jordan 5.54
Kuwait 5.85
Lebanon 4.81
Mauritania 2.36
Morocco 3.54
Oman 5.36
Qatar 6.73
Saudi Arabia 5.31
Sudan 1.78
Syria 3.09
Tunisia 4.42
UAE 6.73
Yemen 2.2
Data Source: World Bank
KEI (Knowledge Economy Index) [2009]
KEI (Knowledge Economy Index): The knowledge Economy Index takes into account whether the environment is conducive for knowledge to be used effectively for economic development. The KEI is calculated based on the average of the normalized scores of a country or region on all four pillars related to knowledge economy - economic incentive and institutional regime, education, innovation and ICT. (0 is the lowest score and 10 is the maximum score).
Four pillars related to knowledge economy:1. Economic incentive and institutional regime2. Education3. Innovation4. ICT
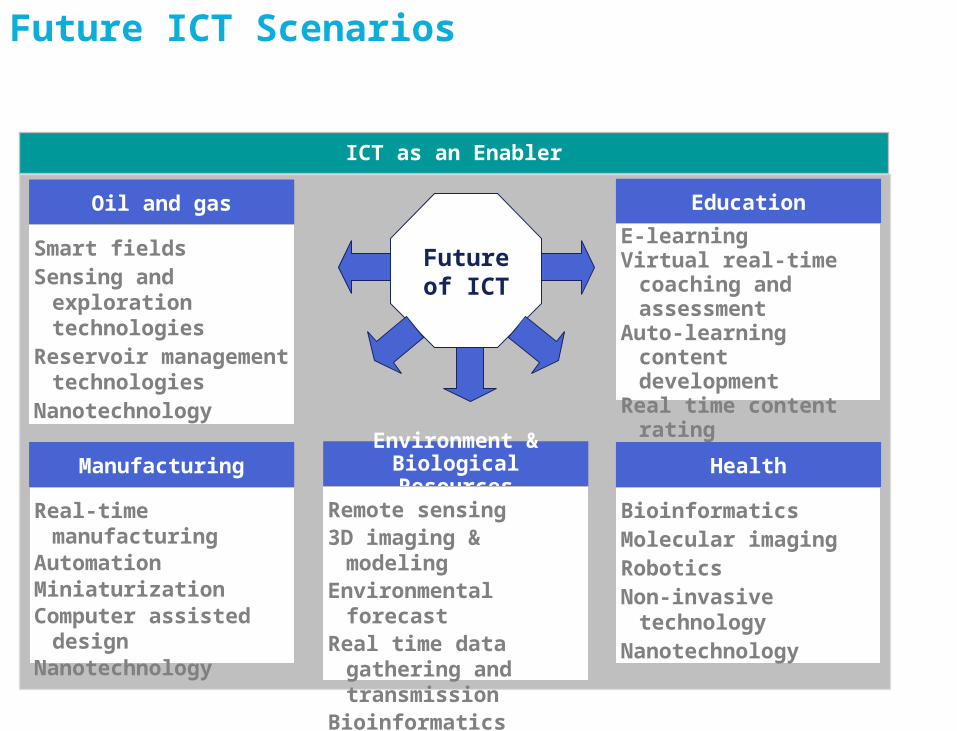
ICT as an Enabler
Future of ICT
Oil and gas
Smart fieldsSensing and exploration
technologiesReservoir management
technologiesNanotechnology
Manufacturing
Real-time manufacturingAutomation MiniaturizationComputer assisted
design Nanotechnology
Education
E-learningVirtual real-time
coaching and assessment
Auto-learning content development
Real time content rating
Environment & Biological Resources
Remote sensing3D imaging & modeling Environmental forecastReal time data gathering
and transmissionBioinformatics
Health
BioinformaticsMolecular imagingRoboticsNon-invasive technologyNanotechnology
Future ICT Scenarios

ICT INCUBATION CENTER..A VC REQUIREMENT…
© Copyright ICT Fund 2012

Why Incubation in UAE?
An ICT Incubation Center for UAE Creating an R&BD culture is one of the three
paths to: Diversifying UAE economy Creating advanced technology Enabling knowledge-based economy
Enabling knowledge transfer requires incentives due to the fact that All VCs are multinationals They are willing to relocate to areas that offer either
innovative or financial advantage Success stories open doors to Emirati VCs who are
interested in entering into the ICT area of innovation
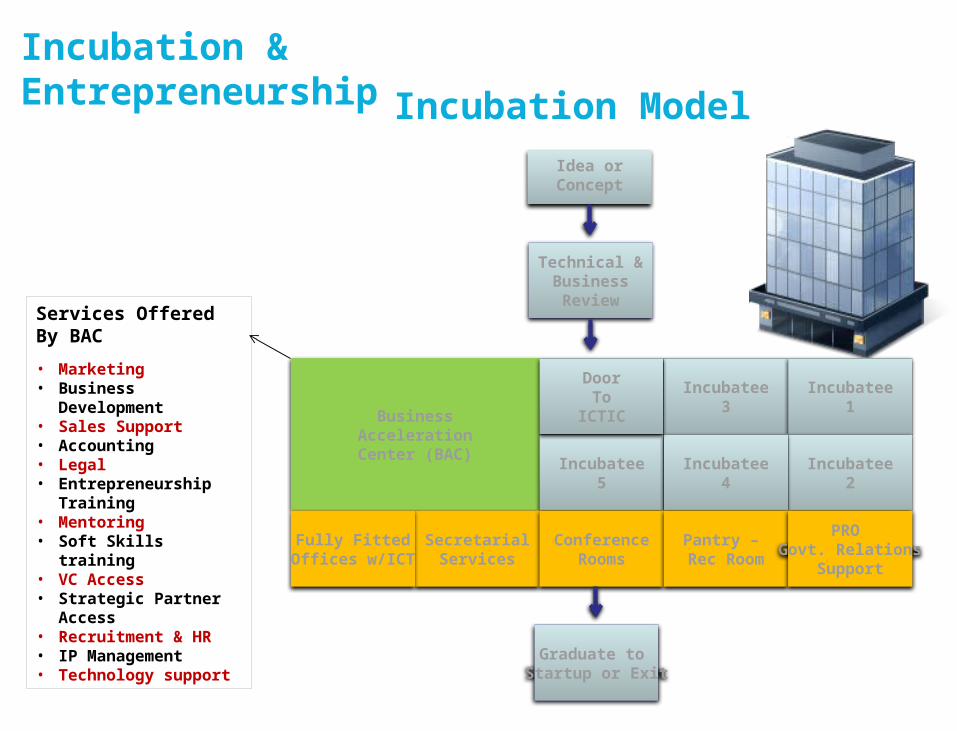
Incubation & Entrepreneurship
Idea orConcept
Technical &BusinessReview
Services Offered By BAC
• Marketing• Business Development• Sales Support• Accounting• Legal• Entrepreneurship
Training• Mentoring• Soft Skills training• VC Access• Strategic Partner
Access• Recruitment & HR• IP Management• Technology support
Incubatee3
Incubatee1
BusinessAccelerationCenter (BAC)
Incubatee2
Incubatee5
Incubatee4
SecretarialServices
ConferenceRooms
Pantry – Rec Room
PRO Govt. Relations
Support
Fully FittedOffices w/ICT
DoorTo
ICTIC
Graduate to Startup or Exit
Incubation Model
RESEARCH & BUSINESS DEVELOPMENT (R&BD)

R&BD: A Value-Added Concept
Element One Element Two Element Three
AcademiaCulture Industry
• Identify the constituents
• Plan for ac-tivities and events to adapt the R&D culture
• Find research ar-eas applicable to all the con-stituents
• Collaborate with local & interna-tional institutes for technical cre-ation
• Set mechanisms for knowledge transfer initia-tives (e.g labs, R&D, TIC, etc)
• Identify in-dustrial needs & re-quirements
• Link them with the academia
• Create the R&BD Culture: Through well prepared Strategic plans & actions
• Create the R&BD Culture: Through well prepared Strategic plans & actions
R&BD Constituents
Private
Element Four
• Government is a very es-sential con-stituent to initiate funds and create the culture
Government
Element Five• The pri-vate sector should play the role of what is known in the indus-try as: VC or CSR (Corporate Social Re-sponsibil-ity)

© Copyright ICT Fund 2007
AN INITIATIVE TO CREATE AN ECO-SYSTEM THROUGH FUNDING ICT VALUE CHAIN

ICT Fund Eco-System – Business Model
25
Scholarships

© Copyright ICT Fund 2007
www.bastaki.aewww.bastaki.comwww.bastaki.netwww.bastaki.org
IF YOUR AMBITION MATCHES OUR INTEREST…COME TALK TO ME!
© Copyright ICT Fund 2007
APPENDIX
Some ICT Incubation Statistics
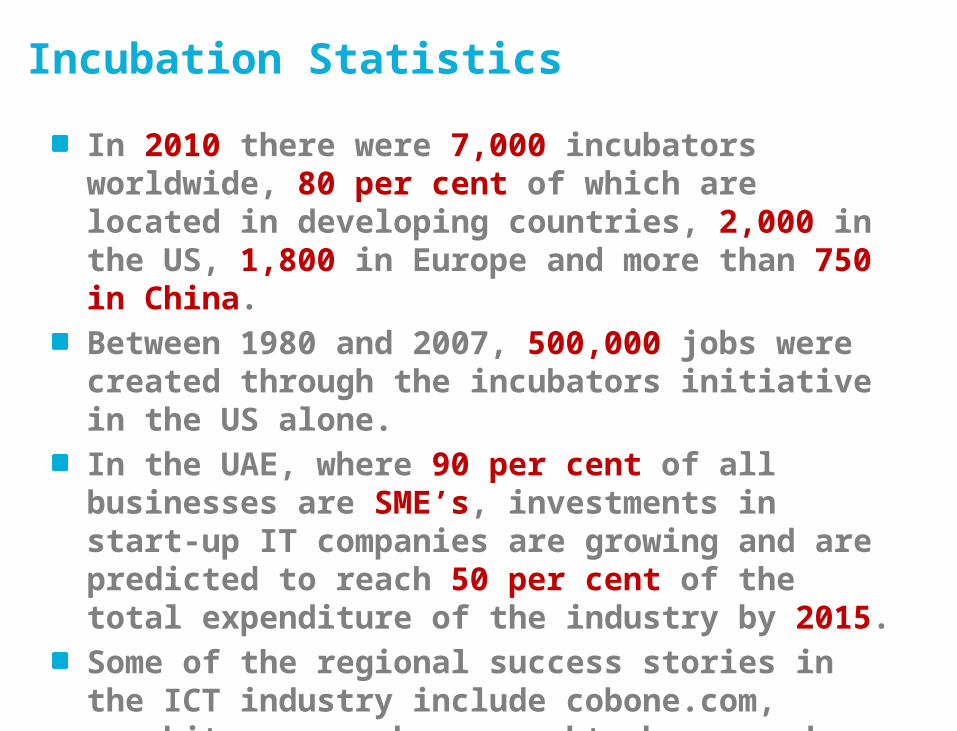
Incubation Statistics
In 2010 there were 7,000 incubators worldwide, 80 per cent of which are located in developing countries, 2,000 in the US, 1,800 in Europe and more than 750 in China.
Between 1980 and 2007, 500,000 jobs were created through the incubators initiative in the US alone.
In the UAE, where 90 per cent of all businesses are SME’s, investments in start-up IT companies are growing and are predicted to reach 50 per cent of the total expenditure of the industry by 2015.
Some of the regional success stories in the ICT industry include cobone.com, gonabit.com, souk.com. maktoob.com and bayt.com.

Green ICT…Smarter technology use could reduce global emissions by 15 per cent and save global industry US$800 billion in annual energy costs by 2020
ICT sector’s carbon footprint is about 2% of global emissions and will grow about 6%per year (CAGR)
PC ownership will quadruple between 2007 and 2020 to four billion devices; emissions will double over the same period, with laptops overtaking desktops as the main source of global ICT emissions (22 per cent)
Carbon footprint of Internet is around 300m tons of CO2 per year
Sources: Climate Group, Global e-Sustainability Initiative (GeSI) & Gartner
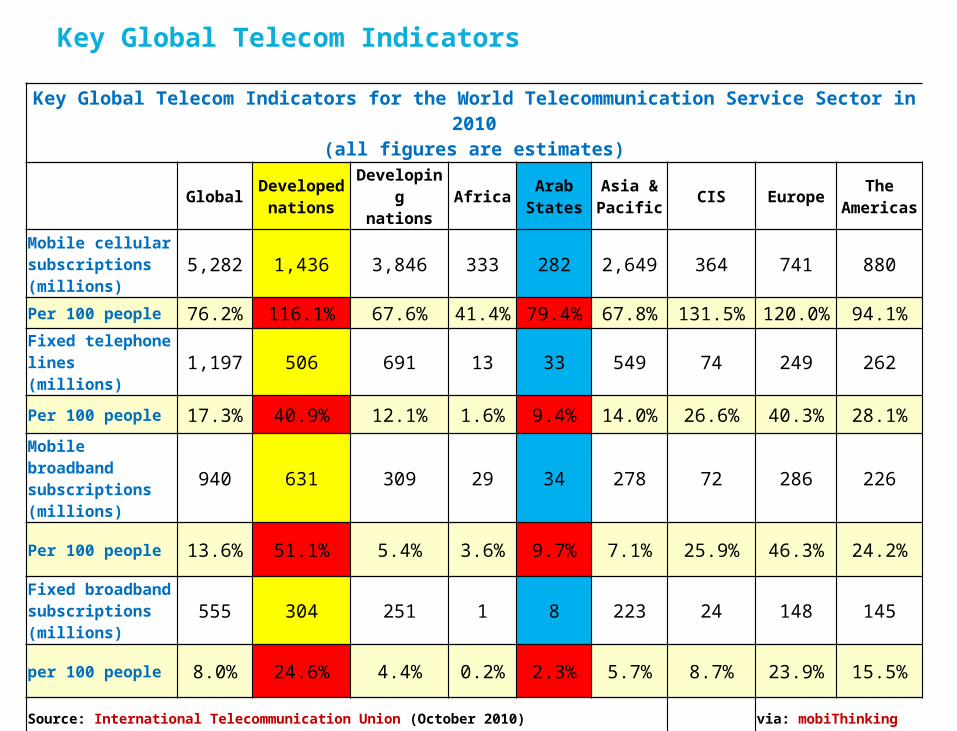
Key Global Telecom Indicators
Key Global Telecom Indicators for the World Telecommunication Service Sector in 2010
(all figures are estimates)
GlobalDevelope
dnations
Developing
nationsAfrica
ArabStates
Asia & Pacific
CIS EuropeThe
Americas
Mobile cellular subscriptions(millions)
5,282 1,436 3,846 333 282 2,649 364 741 880
Per 100 people 76.2% 116.1% 67.6% 41.4% 79.4% 67.8% 131.5% 120.0% 94.1%Fixed telephone lines(millions)
1,197 506 691 13 33 549 74 249 262
Per 100 people 17.3% 40.9% 12.1% 1.6% 9.4% 14.0% 26.6% 40.3% 28.1%
Mobile broadband subscriptions(millions)
940 631 309 29 34 278 72 286 226
Per 100 people 13.6% 51.1% 5.4% 3.6% 9.7% 7.1% 25.9% 46.3% 24.2%
Fixed broadband subscriptions(millions)
555 304 251 1 8 223 24 148 145
per 100 people 8.0% 24.6% 4.4% 0.2% 2.3% 5.7% 8.7% 23.9% 15.5%
Source: International Telecommunication Union (October 2010) via: mobiThinking