Embed Size (px)
Citation preview
Marginalization in education
From research to policy
Kevin Watkins Senior Fellow Brookings Institution
Why it matters
• Highly predictable failure rooted in structural disadvantage - ‘clearly remediable injustice’ linked to poverty, gender, ethnicity, disability, location and wider markers for disadvantage
• A brake on progress towards the EFA goals on access + learning
• Intrinsic importance and links from education to wider inequalities – and to wider debates
Current approaches
• OECD – data rich longitudinal studies, disaggregated learning outcomes, and school vs. pupil characteristics
• Education Gini and composite indices (e.g. HDI) – years in school
• World Bank – ‘pre-determined circumstance’ and inequality of opportunity
• Group-based analysis
• Overlapping dimensions of marginalization- UNESCO Global Monitoring Report
• Learning disparities – regional assessments/EGRA
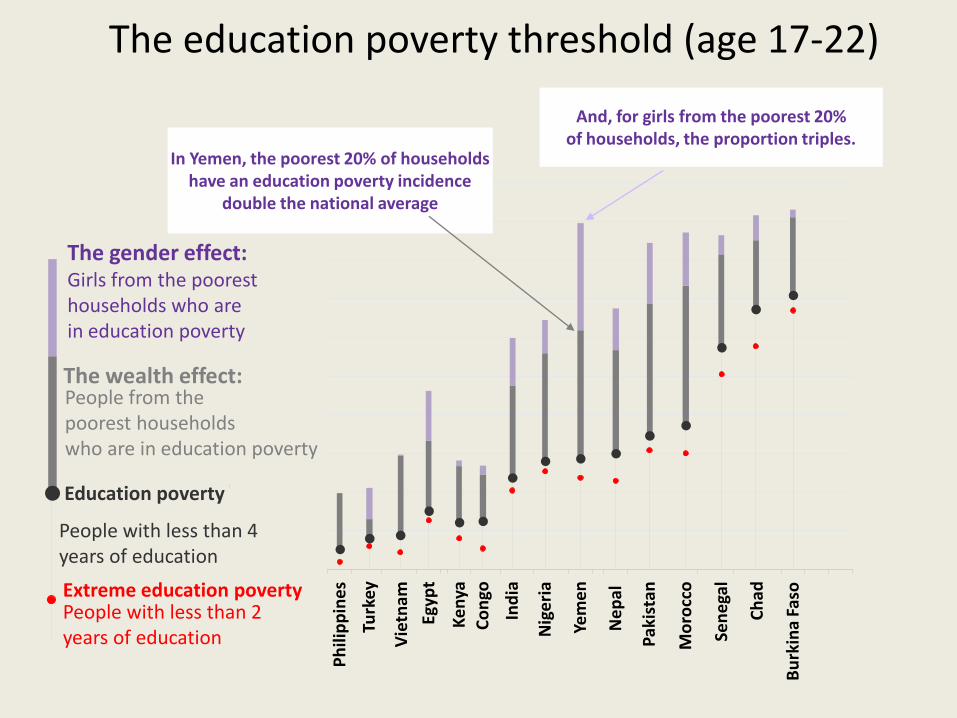
The wealth effect: People from the poorest households who are in education poverty
0%
10%
20%
30%
40%
50%
60%
70%
80%
90%
100%
Ph
ilip
pin
es
Turk
ey
Vie
tnam
Egyp
t
Ke
nya
Co
ngo
Ind
ia
Nig
eri
a
Yem
en
Ne
pal
Pak
ista
n
Mo
rocc
o
Sen
ega
l
Ch
ad
Bu
rkin
a Fa
so Sh
are
of
the
po
pu
lati
on
wit
h le
ss t
han
4 a
nd
less
th
an 2
ye
ars
of
ed
uca
tio
n
Extreme education poverty People with less than 2 years of education
Education poverty
People with less than 4 years of education
The gender effect: Girls from the poorest households who are in education poverty
In Yemen, the poorest 20% of households have an education poverty incidence
double the national average
And, for girls from the poorest 20% of households, the proportion triples.
The education poverty threshold (age 17-22)
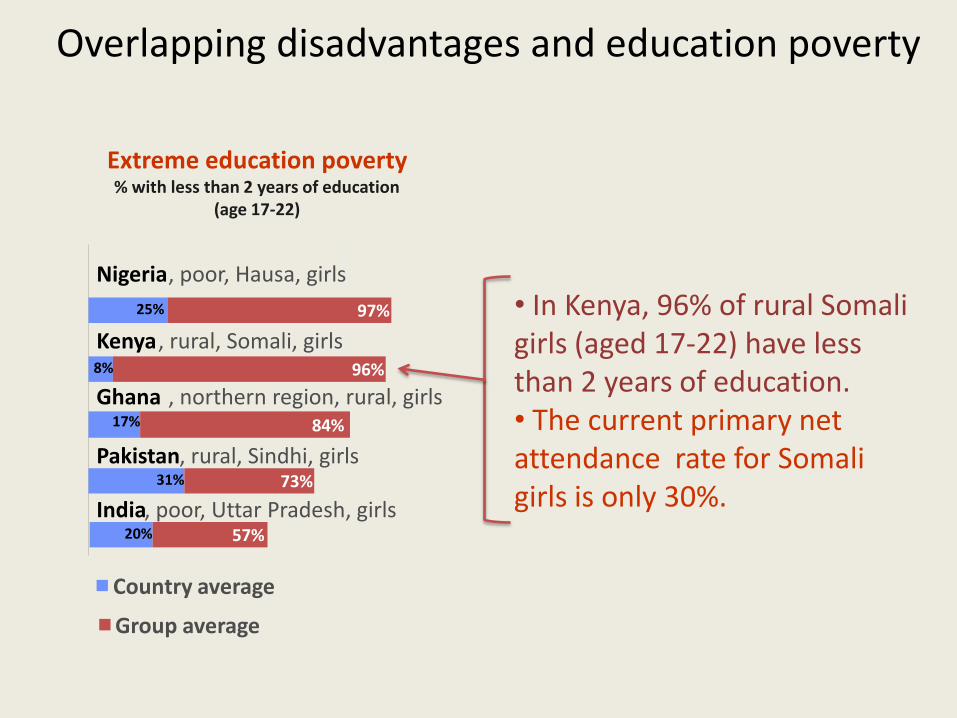
• In Kenya, 96% of rural Somali girls (aged 17-22) have less than 2 years of education. • The current primary net attendance rate for Somali girls is only 30%.
20%
31%
17%
8%
25%
57%
73%
84%
96%
97%
Nigeria
Kenya
Ghana
Pakistan
India
Group average
Country average
Extreme education poverty % with less than 2 years of education
(age 17-22)
, poor, Hausa, girls
, rural, Somali, girls
, northern region, rural, girls
, rural, Sindhi, girls
, poor, Uttar Pradesh, girls
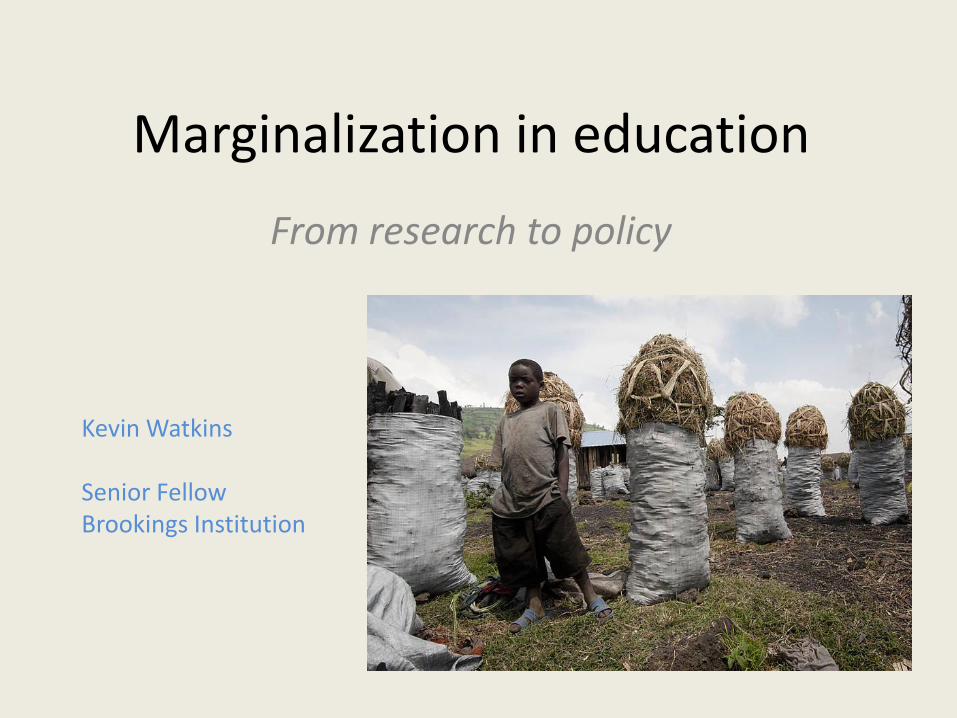
Overlapping disadvantages and education poverty
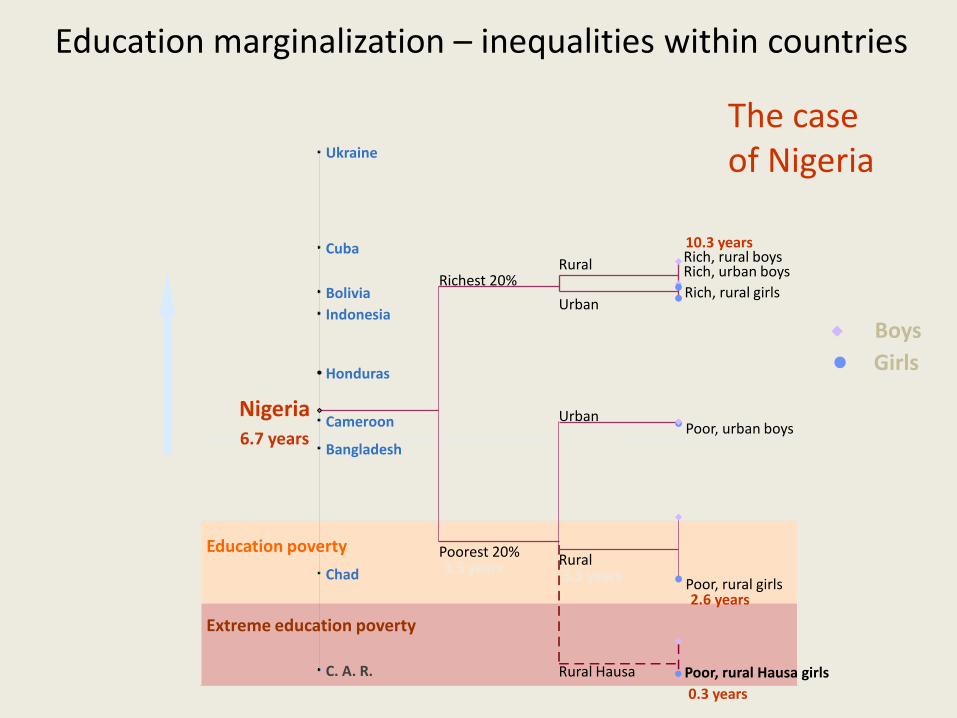
Richest 20%
Poorest 20%
Poor, rural Hausa girls
Rich, rural girls
Poor, urban boys
Poor, rural girls
Nigeria
Rural Hausa
Rich, urban boys
Urban
Rural
Urban
Rural
Rich, rural boys
C. A. R.
Chad
Bangladesh
Cameroon
Honduras
Indonesia
Bolivia
Cuba
Ukraine
0
2
4
6
8
10
12
14
Ave
rage
nu
mb
er
of
year
s o
f sc
ho
olin
g
Education poverty
Extreme education poverty
3.3 years
6.4 years
3.5 years
9.7 years
0.5 years
10.3 years
2.6 years
0.3 years
Boys
Girls
6.7 years
10 years
Education marginalization – inequalities within countries
The case of Nigeria
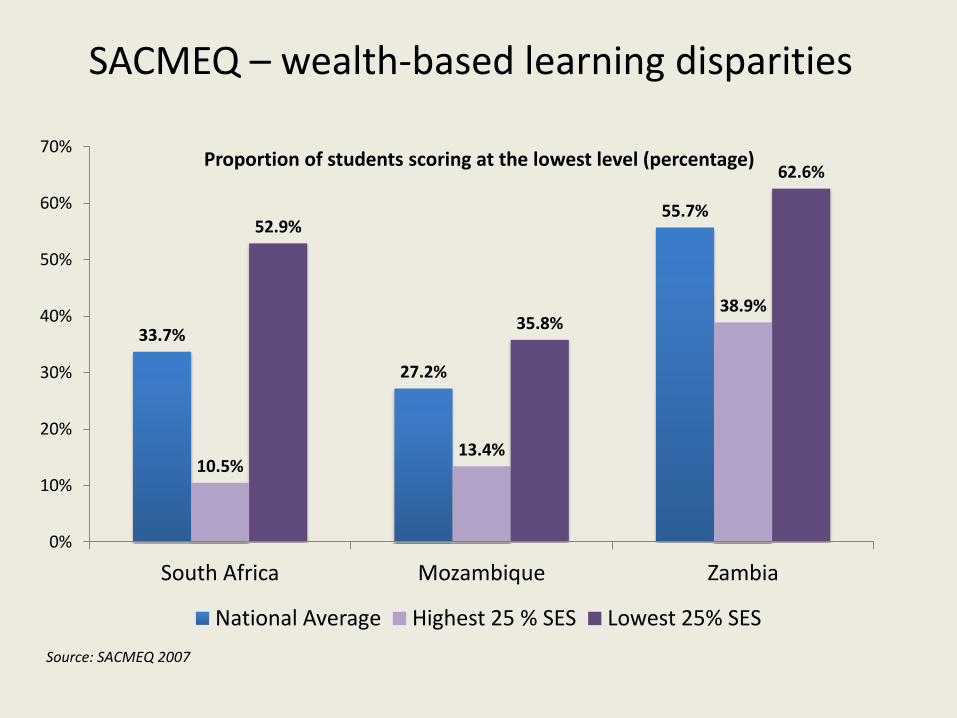
SACMEQ – wealth-based learning disparities
33.7%
27.2%
55.7%
10.5% 13.4%
38.9%
52.9%
35.8%
62.6%
0%
10%
20%
30%
40%
50%
60%
70%
South Africa Mozambique Zambia
Proportion of students scoring at the lowest level (percentage)
National Average Highest 25 % SES Lowest 25% SES
Source: SACMEQ 2007
0%
10%
20%
30%
40%
50%
60%
70%
80%
90%
100%
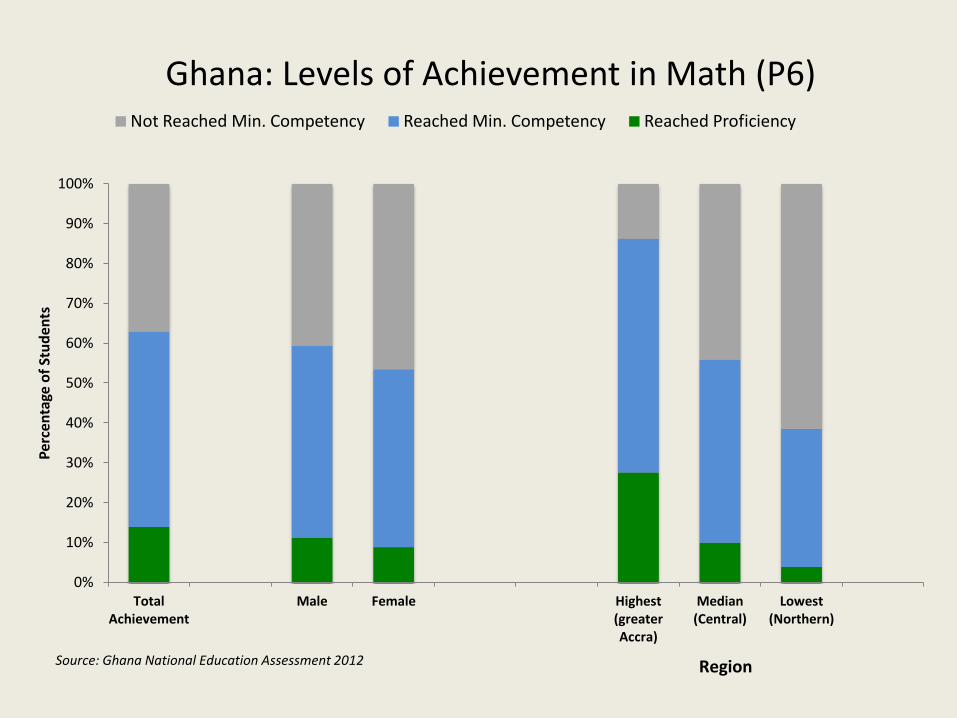
Total Achievement
Male Female Highest (greater Accra)
Median (Central)
Lowest (Northern)
Per
cen
tage
of
Stu
den
ts
Ghana: Levels of Achievement in Math (P6) Not Reached Min. Competency Reached Min. Competency Reached Proficiency
Source: Ghana National Education Assessment 2012
Region
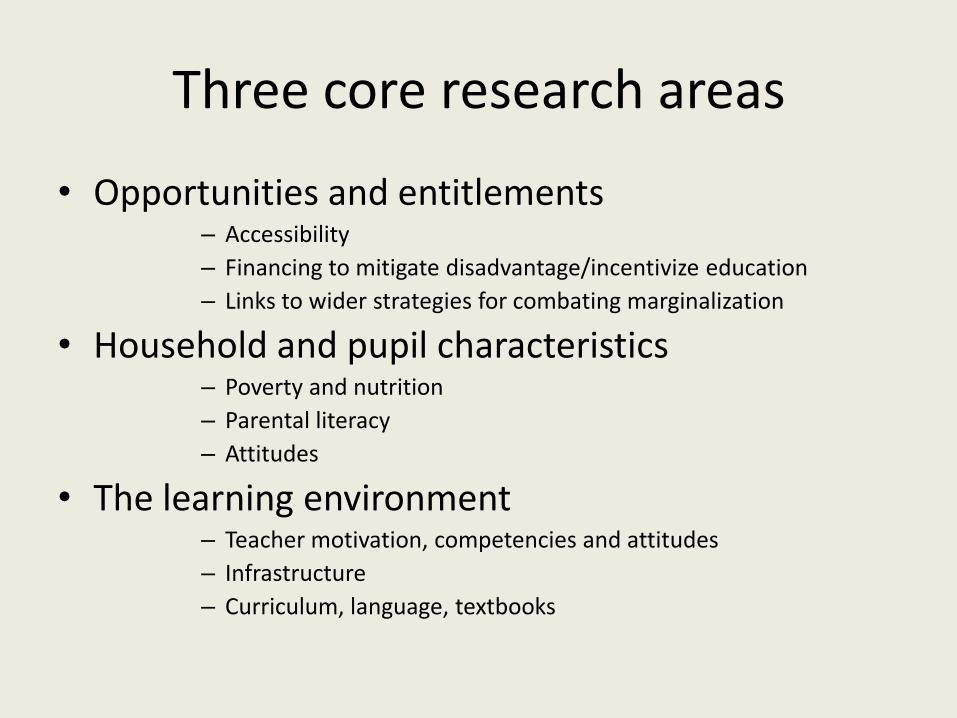
Three core research areas
• Opportunities and entitlements – Accessibility
– Financing to mitigate disadvantage/incentivize education
– Links to wider strategies for combating marginalization
• Household and pupil characteristics – Poverty and nutrition
– Parental literacy
– Attitudes
• The learning environment – Teacher motivation, competencies and attitudes
– Infrastructure
– Curriculum, language, textbooks
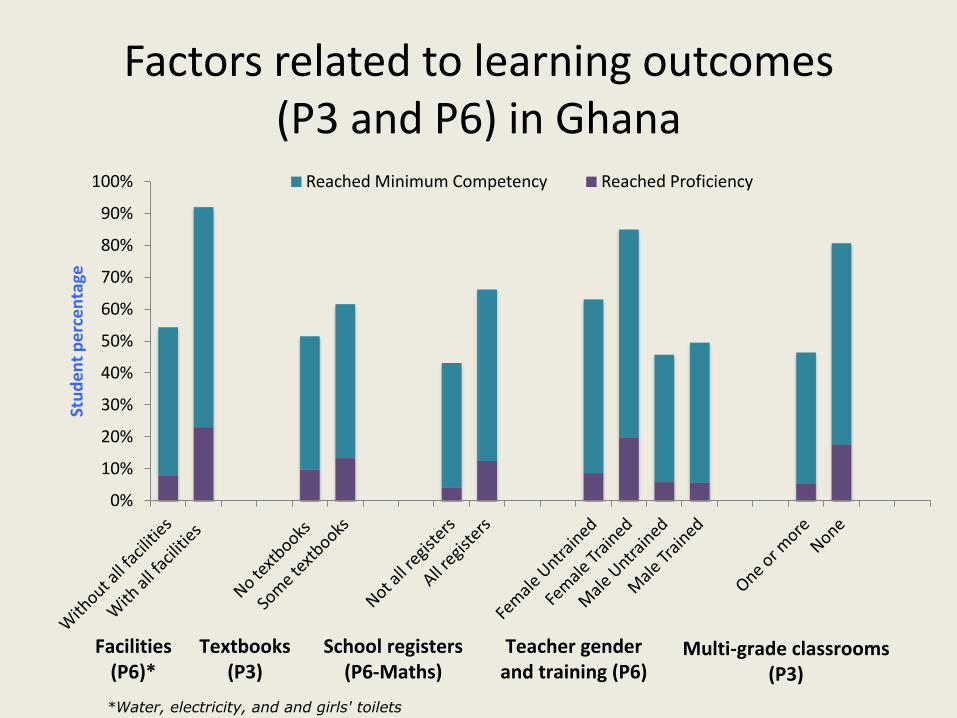
Factors related to learning outcomes (P3 and P6) in Ghana
0%
10%
20%
30%
40%
50%
60%
70%
80%
90%
100%
Stu
de
nt
pe
rce
nta
ge
Reached Minimum Competency Reached Proficiency
Facilities (P6)*
Textbooks (P3)
School registers (P6-Maths)
Teacher gender and training (P6)
Multi-grade classrooms (P3)
*Water, electricity, and and girls' toilets
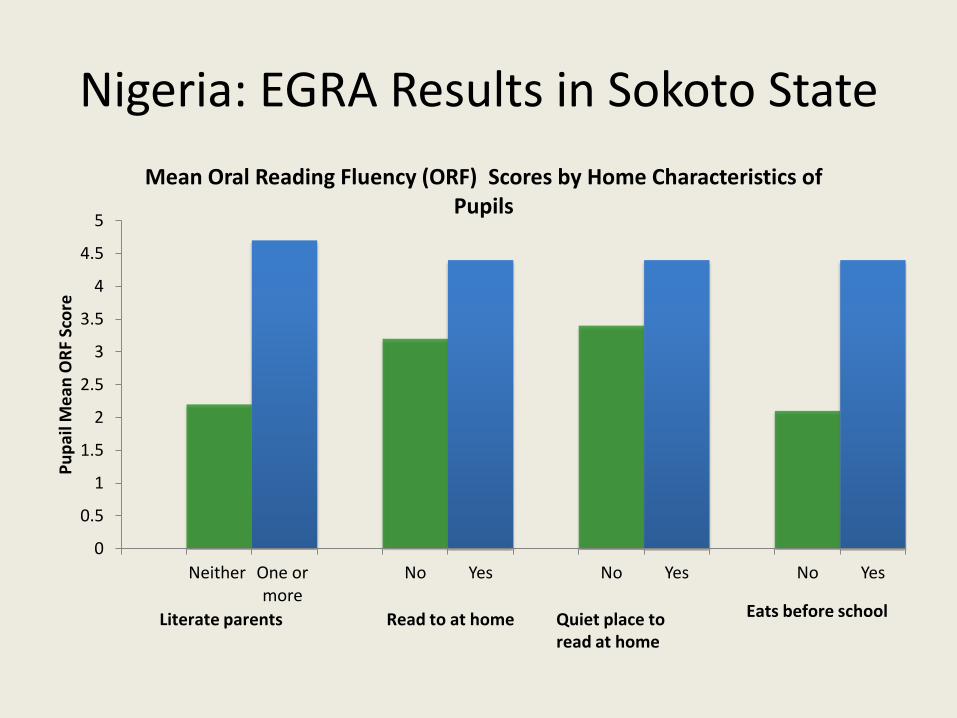
Nigeria: EGRA Results in Sokoto State
0
0.5
1
1.5
2
2.5
3
3.5
4
4.5
5
Neither One or more
No Yes No Yes No Yes
Pu
pai
l Me
an O
RF
Sco
re
Mean Oral Reading Fluency (ORF) Scores by Home Characteristics of Pupils
Literate parents Read to at home
Quiet place to read at home
Eats before school
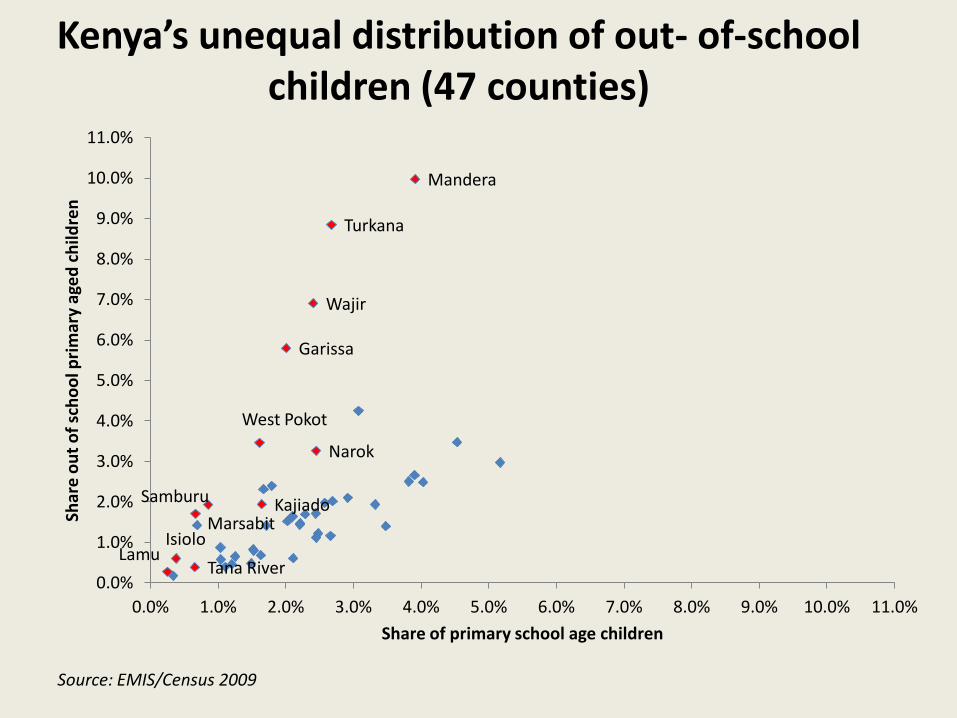
Kenya’s unequal distribution of out- of-school children (47 counties)
Mandera
Turkana
Wajir
Garissa
West Pokot
Narok
Kajiado Marsabit
Samburu
Isiolo
Tana River Lamu
0.0%
1.0%
2.0%
3.0%
4.0%
5.0%
6.0%
7.0%
8.0%
9.0%
10.0%
11.0%
0.0% 1.0% 2.0% 3.0% 4.0% 5.0% 6.0% 7.0% 8.0% 9.0% 10.0% 11.0%
Shar
e o
ut
of
sch
oo
l pri
mar
y ag
ed
ch
ildre
n
Share of primary school age children
Source: EMIS/Census 2009
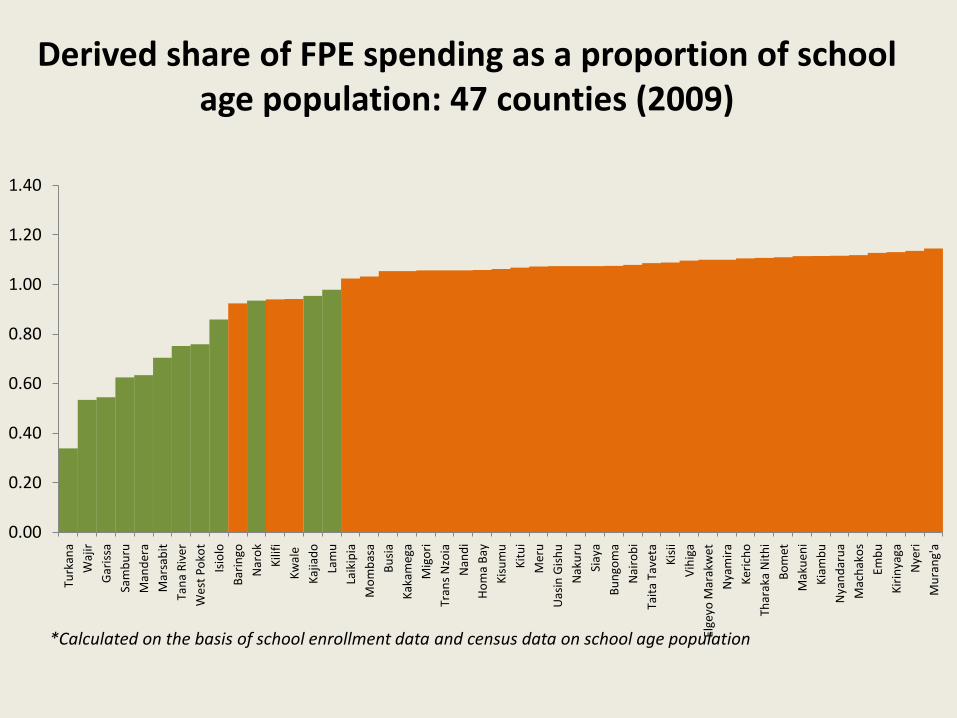
Derived share of FPE spending as a proportion of school age population: 47 counties (2009)
0.00
0.20
0.40
0.60
0.80
1.00
1.20
1.40
Turk
ana
Waj
ir
Gar
issa
Sam
bu
ru
Man
der
a
Mar
sab
it
Tan
a R
iver
Wes
t P
oko
t
Isio
lo
Bar
ingo
Nar
ok
Kili
fi
Kw
ale
Kaj
iad
o
Lam
u
Laik
ipia
Mo
mb
asa
Bu
sia
Kak
ameg
a
Mig
ori
Tran
s N
zoia
Nan
di
Ho
ma
Bay
Kis
um
u
Kit
ui
Mer
u
Uas
in G
ish
u
Nak
uru
Siay
a
Bu
ngo
ma
Nai
rob
i
Tait
a Ta
veta
Kis
ii
Vih
iga
Elge
yo M
arak
wet
Nya
mir
a
Ker
ich
o
Thar
aka
Nit
hi
Bo
met
Mak
uen
i
Kia
mb
u
Nya
nd
aru
a
Mac
hak
os
Emb
u
Kir
inya
ga
Nye
ri
Mu
ran
g'a
*Calculated on the basis of school enrollment data and census data on school age population
Research agenda discussion
• Need for more policy-oriented research on who is being left behind – and why.
• Identifying what works • Focused research on specific groups to inform
national strategies – eg UCW on child labor • The role of state and non-state providers • Beyond the school – linkages to wider sources of
marginalization • Strengthening disaggregated data and re-coupling
quantitative with qualitative analysis