Embed Size (px)
Citation preview
i
SEAF Your Global Investment PartnerConnecting Local Enterprises with the World
October 2007
From Poverty to Prosperity:Understanding the Impact of Investing in Small and Medium EnterprisesData Survey and Case Study Analysis of SEAF Investments
ii
From Poverty to Prosperity:Understanding the Impact of Investing in Small and Medium Enterprises
Data Survey and Case Study Analysis of SEAF Investments
It has long been recognized that small and medium enterprises (SMEs) are a potentially powerful tool for economic growth and poverty reduction. There have been several broad brush studies conducted in recent years that seek to examine this insight for the entire SME sector. However, these studies are not based on actual analyses of how growing SMEs actually effect such development. As an SME investor in challenging and emerging markets over the last 18 years, SEAF offers a global portfolio that is ideally suited for investigating this impact based on actual “on-the-ground” data.
In 2004, SEAF published a report that measured and analyzed the developmental impacts of ten of its SME investments in emerging markets. The report looked beyond traditional financial returns to assess the impacts of growing SMEs on the lives of employees and other stakeholders in the local economy. Based on positive feedback on the report and an expressed interest in seeing SEAF expand its analysis to a broader pool of companies, SEAF has prepared this report, which presents the cumulative analysis of almost 50 SMEs in the SEAF portfolio.
Building on the experience of the 2004 Study, SEAF has been able to collect new and broader data. As opposed to the 2004 Study, which was backwards looking, SEAF has been able to establish monitoring criteria on an ex ante basis, allowing for a more direct insight into how investments in SMEs throughout the world have reduced poverty and improved the lives of the many stakeholders affected by the SMEs in question. The new analysis has also permitted SEAF to better understand and document the multiplier effect of SME investing and the benefits going especially to poor and low-skilled workers. It has also helped SEAF to better quantify and understand other significant impacts of SMEs, the most compelling being the role that SMEs can play in building the capacity of local suppliers and micro-entrepreneurs, by serving as an “aggregator” of such suppliers that would otherwise lack access to larger, even global markets.
iii
About SEAFHeadquartered in Washington, D.C. with 19 offices worldwide, SEAF is a global investment management firm that provides risk capital to small and medium enterprises (SMEs) in emerging markets. SEAF selectively invests in locally-owned SMEs with high growth potential through equity participation and appropriate fixed-term risk capital instruments. As an active, long-term partner with its investees, SEAF also provides appropriate business support through its local staff and global network. SEAF’s objective is to generate commercial returns for its investors by leveraging its investment approach, institutional experience, and the insights of local staff, while achieving superior development impact in the communities and countries in which it is engaged.
SEAF-sponsored investment funds focus on SMEs in areas of the global economy that commercial venture funds typically overlook because of their relatively remote location, small market size, lack of other investors and perceived exit opportunities in the market, cultural differences, or other comparatively high market risks. SEAF has repeatedly found that with its investment experience and a solid understanding of the local market, attention to smaller, high potential companies in developing economies can generate positive returns. SEAF’s experience demonstrates that SMEs frequently have significant competitive advantages—including an ability to build leadership positions through differentiated products and services, as well as sustainable cost advantages derived from local human and other resources.
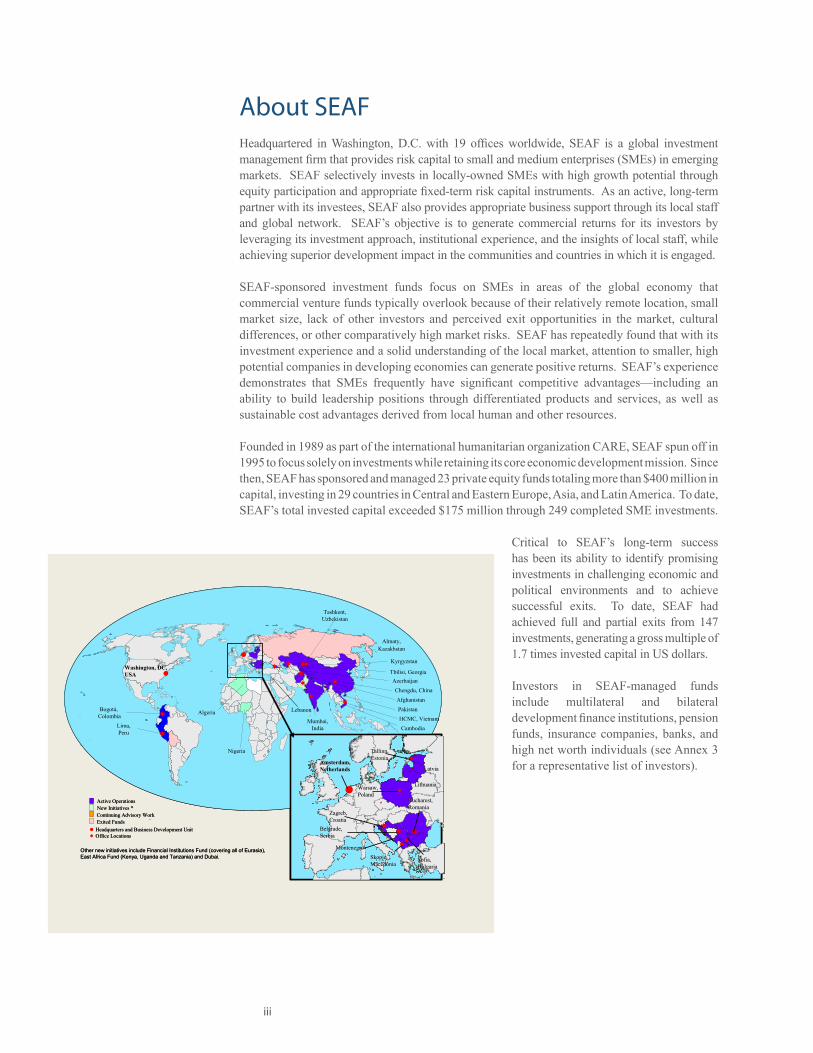
Founded in 1989 as part of the international humanitarian organization CARE, SEAF spun off in 1995 to focus solely on investments while retaining its core economic development mission. Since then, SEAF has sponsored and managed 23 private equity funds totaling more than $400 million in capital, investing in 29 countries in Central and Eastern Europe, Asia, and Latin America. To date, SEAF’s total invested capital exceeded $175 million through 249 completed SME investments.
Critical to SEAF’s long-term success has been its ability to identify promising investments in challenging economic and political environments and to achieve successful exits. To date, SEAF had achieved full and partial exits from 147 investments, generating a gross multiple of 1.7 times invested capital in US dollars.
Investors in SEAF-managed funds include multilateral and bilateral development finance institutions, pension funds, insurance companies, banks, and high net worth individuals (see Annex 3 for a representative list of investors).
Mumbai, India
Tashkent, Uzbekistan
Almaty, Kazakhstan
Lima, Peru
Chengdu, China
Nigeria
Bogotá, Colombia
Kyrgyzstan
Headquarters and Business Development UnitOffice Locations
Active OperationsNew Initiatives *
Continuing Advisory WorkExited Funds
Tbilisi, Georgia
Zagreb, Zagreb, CroatiaCroatia
Warsaw, Warsaw, PolandPoland
Tallinn, Estonia
LatviaLatvia
LithuaniaLithuania
Sofia, Sofia, BulgariaBulgaria
Skopje, Skopje, MacedoniaMacedonia
Belgrade, Belgrade, SerbiaSerbia
Bucharest, Bucharest, RomaniaRomania
MontenegroMontenegro
Lebanon
Washington, DC, Washington, DC, USAUSA
Amsterdam, Amsterdam, NetherlandsNetherlands
AfghanistanPakistanHCMC, Vietnam
Azerbaijan
Cambodia
Algeria
Other new initiatives include Financial Institutions Fund (covering all of Eurasia), East Africa Fund (Kenya, Uganda and Tanzania) and Dubai.
iv
Table of Contents
Acknowledgments 1
Executive Summary 2
Chapter 1. Data Survey Results 10
Overview 10
Survey Pool 11
Growth in Job Opportunities 11
Wage Growth 12
Non-Salary Benefits 14
Increasing Job Opportunities Suitable for the Poor 15
Developing Job Skills 16
Creating Opportunities for Women 17
Impact on Suppliers 19
Benefits for Customers 20
Impact on National Governments 22
Growth in Exports 22
Impact on Business Practices and Corporate Governance 23
Contributions to Local Communities 23
Improvement in Access to Capital 24
Conclusion 25
Chapter 2. Case Studies: Estimating the Multiplier Effect 26
Overview 26
Methodology 27
Selection of Case Studies 28
Results 31
Chapter 3. Case Studies: Stories of Economic Transformations 35
Introduction 35
Case Study Summaries 37
Chapter 4. Conclusions and Policy Implications 55
Investing in High-Growth SMEs 56
The Value of Systematic Measurement of Development Performance:Combining Case Studies with Data Surveys 57
Maximizing Development Impact: Targeting Investments and Motivating Fund Managers 58
Use of “Market Aggregator” Fund Approach to Link Micro-Borrowers to Larger Markets 60
Conclusion 61
Annex 1. Data Survey Form 62
Annex 2. Case Study Methodology 65
Annex 3. Representative List of SEAF Investors 68
1
AcknowledgmentsSEAF gratefully acknowledges the State Secretariat for Economic Affairs of Switzerland (SECO) and the United States Agency for International Development (USAID), which provided grants to make this study possible. SECO, the Ford Foundation, and the Department for International Development (DFID) provided grants for the 2004 Study.
Special thanks are due to all of the investors in SEAF funds (listed in Annex 3), which have invested in SEAF funds worldwide. Their continuous support has enabled SEAF to carry out its commercial and developmental mission.
This report has been prepared by SEAF headquarters staff in Washington D.C., led by Stephanie Komsa (Project Manager), with support from SEAF country offices. Special thanks are due to SEAF Chief Executive Officer Bert van der Vaart, SEAF Chief Operating Officer Mildred Callear, and former SEAF Executive Vice President of New Business Development MinhChau Nguyen, all of whom provided valuable guidance and support to make this report possible. SEAF also gratefully acknowledges Claudia Berg (Research Analyst) and Constantine Bogdan (Deputy Director, SEAF Trans-Balkan Romania Fund), who assisted with the design of the survey and preparation of survey materials from the SEAF-Romania office, and all other SEAF staff members in the field who assisted with interviews and data collection.
2
Executive SummaryIt has long been recognized that SMEs can be a potentially powerful tool for economic growth and poverty reduction. Several studies conducted in recent years have taken a relatively undifferentiated view of the entire SME sector, often including micro-enterprises and spanning various countries. However, none of these studies examines specific experiences at the actual SME level and how SMEs actually effect economic development. SEAF believes that without a specific understanding of what happens at the SME level, any top-down correlation analysis risks misunderstanding the mechanism by which SMEs grow and impact their communities. SEAF in particular believes that there is a subset of SMEs that are extraordinarily growth-oriented; namely, those SMEs willing to accept third party capital in order to grow. It is this subset of SMEs that SEAF believes has a profound impact on the economy. As an SME investor in challenging and emerging markets over the last 18 years, SEAF offers a broad portfolio that is ideally suited for investigating this impact based on actual “on-the-ground” data. In 2004, SEAF published a report that measured and analyzed the development impacts of ten of its SME investments, five rural and five urban, in Latin America and Central Europe.1 The report deployed methodology, developed by the International Finance Corporation (IFC) for project finance appraisal, that looks beyond traditional financial returns to assess the impacts of growing SMEs on the lives of employees and other stakeholders in the local economy. The 2004 Study showed that, on average, every dollar invested in the companies generated an additional ten dollars in the local economy. It also demonstrated that SMEs tend to hire and train low-skilled workers and promote from within, demonstrating that SMEs generate jobs appropriate for the low-skilled poor, which can be a very effective tool for poverty alleviation.
Baed on positive feedback on the value of the first study and an expressed interest in seeing SEAF expand the study to a broader pool of companies, SEAF has since conducted a data survey of 40 companies and 8 new in-depth case studies. The report herein presents the combined results of the data survey, the original case studies, and the new case studies—in total, a pool of 49 companies.2
The results of SEAF’s efforts support the conclusions of the 2004 Study: investing in SMEs can result in significant economic development and poverty alleviation. Building on the experience of the first study, however, SEAF has been able to collect broader and more meaningful data that in fact demonstrate a stronger impact than previously understood. The new analysis has led to improved figures delineating the multiplier effect of SME investing and the benefits going particularly to low-skilled workers. This analysis has helped SEAF to better quantify and capture other significant impacts of SMEs, particularly the role that SMEs can play in building the capacity of local suppliers and micro-entrepreneurs and in providing them with access to larger and higher value-added markets. The following summarizes these new and improved findings:
1 This report is published on SEAF’s website, www.seaf.com. It is hereinafter referred to as the “2004 Study”.2 Forty companies in the data survey, 10 original in-depth case studies, and 8 new in-depth case studies. Some of the case studies overlap with the data survey.
3
Greater Multiplier Effect Than Previously Understood
The combined set of 18 case studies shows that every dollar invested generates, on average, ■an additional 12 dollars in the local economy.
The results can also be presented in terms of an Internal Rate of Return (IRR). The 18 ■companies profiled generated an average Economic Rate of Return (ERR), which includes both the financial and quantifiable social returns, of 66 percent, versus an average Financial Rate of Return (FRR), which includes returns to financiers only, of 21 percent.
This multiplier effect is experienced among multiple stakeholders—including employees, ■suppliers, competitors, producers of complementary goods, the local community, and the broader local economy—to a greater extent than captured previously.
Improved Data on the Impact on the Lives of Employees
The data survey and the additional cases have reinforced the conclusion that SMEs tend ■to hire and train low-skilled workers and promote from within, demonstrating that SMEs can generate jobs appropriate for the poor and can be an effective vehicle for achieving poverty alleviation.
The 2004 Study concluded that approximately two-thirds of employees are unskilled or ■semi-skilled, but the more recent data survey shows that in fact 72 percent of new jobs generated go to unskilled or semi-skilled employees.
The data survey also shows that SEAF companies have sustained an average annual • employment growth rate of 26 percent and a wage growth rate of 25 percent in US dollar terms, by far surpassing national growth rates for each country.
Almost all employees at the surveyed companies ( ■ 83 percent) receive health and pension contributions from their employers. This is because SMEs are formal companies that contribute on behalf of their employees to social programs, in countries in which such programs exist, and in many cases provide ancillary discretionary benefits.
85 percent ■ of the SMEs surveyed provide formal internal or external training to their employees.
Case study interviews confirm that employees are grateful for the stability and security of ■their jobs. Employees have been able to provide a better life for their families, qualify for loans against their predictable salaries that allow them to invest in their homes or education for their children, or save for the future. A major factor in this asset accumulation is the perceived stability of their jobs, the training and promotions they have received, and their confidence in their enhanced job skills and the future of their employers.
Better Understanding of the Role of SMEs as “Aggregators” of
Micro-Suppliers
Through the data survey, SEAF found that each SME—through its purchase of inputs— ■supports an average of 331 other local businesses, broken down as follows: 18 manufacturers, 10 distributors, 20 service providers, 3 equipment suppliers, and 280 micro-suppliers and farmers, with a high of 6000 farmers and micro-suppliers for one investee.
4
Moreover, the SMEs surveyed generated an annual average of ■ $3 million in business for domestic suppliers in 2005, representing an average of 45 percent of revenues.
Of the companies surveyed, ■ 27 percent have extended trade credit or other forms of financing to their local suppliers—a generally underestimated multiplier effect.
Case study interviews with the management of SEAF investees and their suppliers provide ■numerous examples of SMEs serving to address the barriers that micro-suppliers face by operating as collection centers, value-added processors, and distributors to higher value markets, as well as by providing their suppliers with technical and financial support.
The above data demonstrate that SMEs truly function as “market aggregators” for farmers, ■micro-entrepreneurs, and other small suppliers; in other words, SMEs serve as a critical link to connect smaller suppliers with customers farther up in the value chain.
Meaningful Benefits to Other Stakeholders
Armed with the experience of the 2004 Study, SEAF has better captured the benefits that SME ■investing generates for other stakeholders. Based on the 18 case studies, of the 12 dollars generated per dollar invested, more than $4.92—or 41 percent—benefits those outside the enterprise: consumers, competitors, producers of complementary goods, local communities, and local governments.
Rooted in their local communities, the entrepreneurs and their SMEs are positioned to identify ■unmet local consumer demands and, with the help of financing and strategic support, work with other stakeholders to address market deficiencies. Case studies have provided numerous examples in which customers receive greater choice, improved quality, or lower prices and in which competitors benefit from demonstration and spillover effects.
SMEs make valuable contributions to their surrounding communities—as a percentage of ■revenues, these contributions are on par with Fortune 100 companies. Based on the survey, each SME contributed an annual average of almost $3,000 to charities and other local community causes in 2005.3 Such support has included contributions to local infrastructure and support for orphanages, community events, and other charitable causes.
As formal enterprises, all surveyed companies contribute taxes to local governments, in the ■form of corporate income tax, net VAT, and other taxes—averaging 7 percent of revenues in the year 2005.
Other Impacts of SEAF’s Investments
Companies surveyed have shown significant improvements in formalization and corporate ■governance through their involvement with SEAF.
As a condition of SEAF’s investment, • 30 percent of the companies surveyed adopted formal corporate structures with boards of directors or equivalent oversight bodies for the first time (the remaining 70 percent had such structures before partnering with SEAF).
3 This represents approximately 0.1 percent of their revenues in 2005. While at first glance this may seem insignificant, it is comparable to the corporate giving of the Fortune 100 companies. Among 40 members of the Fortune 100 that completed a corporate giving survey, the total median giving (cash and in-kind donations) in 2005 as a percentage of revenues was 0.14 percent. See http://www.corporatephilanthropy. org/research/pubs/GivinginNumbers2006.pdf.
5
SEAF prompted • 26 percent of the companies surveyed to obtain third party audits (with the other companies receiving audits by SEAF or already having third party audit practices in effect).
As a result of SEAF’s investments, many companies have gained access to global markets ■for the first time. Since SEAF’s investments in the surveyed companies, there has been a 75 percent increase in the number of companies that export.
Among the companies that export, a number have been able to acquire ISO, organic, or ■other industry certifications with the help of SEAF and have been able to export higher value products to a new and expanded customer base.
On average, every dollar invested by SEAF has leveraged an additional ■ $1.63 from other financiers (debt and equity). We believe this leverage is a result of each SME’s formalization, improved performance, and the added equity cushion from SEAF’s investments.
Conclusions and Policy Implications
As with the findings from the 2004 Study, the results of the data survey and additional case studies suggest that when private investors, socially responsible investors, or development institutions invest in SMEs, there are quantifiable and substantial improvements in terms of socioeconomic growth, stability, and poverty reduction.
The 2004 Study proposed that Development Finance Institutions (DFIs) could undertake a mixed approach to development—targeting both development and financial returns—by expanding their support for private investment focused specifically on local SMEs. The report also offered ways in which policy makers and investors could leverage the beneficial effects of SMEs on economic growth and poverty reduction, such as using SME entrepreneurs as a cost effective channel to deliver poverty-reducing services, identifying effective poverty programs, and cultivating socially responsible entrepreneurs and sectors. The findings from our recent data surveys and further case studies also support these recommendations.
Additionally, this report presents the following specific guidelines for those DFIs and socially responsible investors that are interested in pursuing such a two-pronged approach:
Invest in enterprises with high growth potential. ■ 4 The results presented herein demonstrate that supporting SMEs with high growth potential can generate significant and sustainable development impact. Whether or not the existence of a vibrant SME sector as a whole is an important foundation for economic growth and poverty alleviation, SEAF’s studies show that its portfolio of companies (those that pass the review and due diligence of a seasoned fund manager and are willing to accept third party capital to pursue growth) generate attractive financial returns, demonstrate strong development performance in terms of indicators related to employees, suppliers, and other stakeholders, and make other important developmental contributions that are less easily quantified, such as addressing market deficiencies, bringing micro-suppliers into the value chain, and making profound differences in the lives of employees. It is hoped that DFIs and other investors can benefit from this study in designing their strategies for identifying, investing, and supporting the more promising, growth-oriented SMEs.
4 By “high growth potential”, we are not targeting, for example, conventional “high growth” sectors such as telecommunications and software, although such sectors may be very positive as well. Rather, we are referring to SMEs whose owners/entrepreneurs are interested in growing their businesses and demonstrate the potential to do so, regardless of the sector, whether it be fish farming, distribution of fast moving consumer goods, or other sectors in which opportunity presents itself.
6
Use the combination of the data survey and case study approach to measure development ■impact. If SME investing is done to achieve development impact, it is imperative that the impacts be measured. There is an interest and growing effort in the SME development field to develop a common methodology for measuring the social value of investments. SEAF has already designed, tested, and institutionalized a data survey tool that allows important impacts to be quantified. Complemented by the case study approach, we believe we have also been able to capture significant non-quantifiable impacts, of which policy makers in development should equally be aware. We hope that the experience and results of SEAF’s development impact initiative will serve the enterprise development community in creating common metrics and approaches for measuring the social impact of SME investment and SME support programs. For this purpose, SEAF discusses its methodology in Chapters 1 and 2 and includes the form used to collect survey data in Annex 1
Explore the possibilities of targeting investments to achieve development goals and ■motivating fund managers to meet development benchmarks. Based on the data survey and case studies, we have a solid understanding of the concrete (and quantifiable) impacts that SMEs can have on stakeholders in the local economy. This information can allow development-oriented investors to maximize development impact by incentivizing the targeting of SMEs with specific characteristics, depending on specific development priorities and goals (for instance, impact on suppliers and micro-suppliers versus impact on employees, tax collection, or impact on consumers). Moreover, with a system to track and measure development indicators, it is now possible for investors to establish development benchmarks that a fund should be expected to achieve.5 Such quantifiable objectives allow investors to measure and reward specific achievements, not just financial returns. In Chapter 4 we discuss how to appropriately structure such incentives.
By focusing attention on the “Market Aggregator” concept, this report suggests a specific ■poverty reduction mechanism, which may sustainably link microfinance borrowers with scalable and sustainable growth. There has been increasing concern that micro-borrowers are unable to scale up and sustainably improve their revenues. Given the amount of capital now flowing into microfinance institutions (MFIs), the Market Aggregator model suggests a specific channel that would connect micro-borrowers to growing regional and even international markets. Such a channel would allow many micro-suppliers to expand their revenues and profits, and ultimately join the formal sector. With this report, SEAF aims to help policy makers, donors, investors, and others working in the development community better understand SMEs and their potential as drivers of economic growth and development. SMEs are often referred to as “the missing middle”. SEAF hopes that this report demonstrates more tangibly the meaning, as well as the significance, of this concept. As this report shows, SMEs provide reliable and quality employment within their local communities, function as a critical link and aggregator for smaller local suppliers, reliably address market deficiencies and customer needs in the local economy from the “bottom up”, serve as an example to other companies, and ultimately become the drivers of tomorrow’s economy.
5 SEAF’s 2004 Study was taken into account by the Millennium Challenge Georgia, working in concert with the Millennium Challenge Cor-poration (MCC), in devising explicit development criteria, which together with a financial carried interest incentive, provided SEAF (as the Fund Manager selected to manage the Georgia Regional Development Fund) with tangible incentives to maximize desired development objectives. See website, Millennium Challenge Georgia (www.mcg.ge).
7
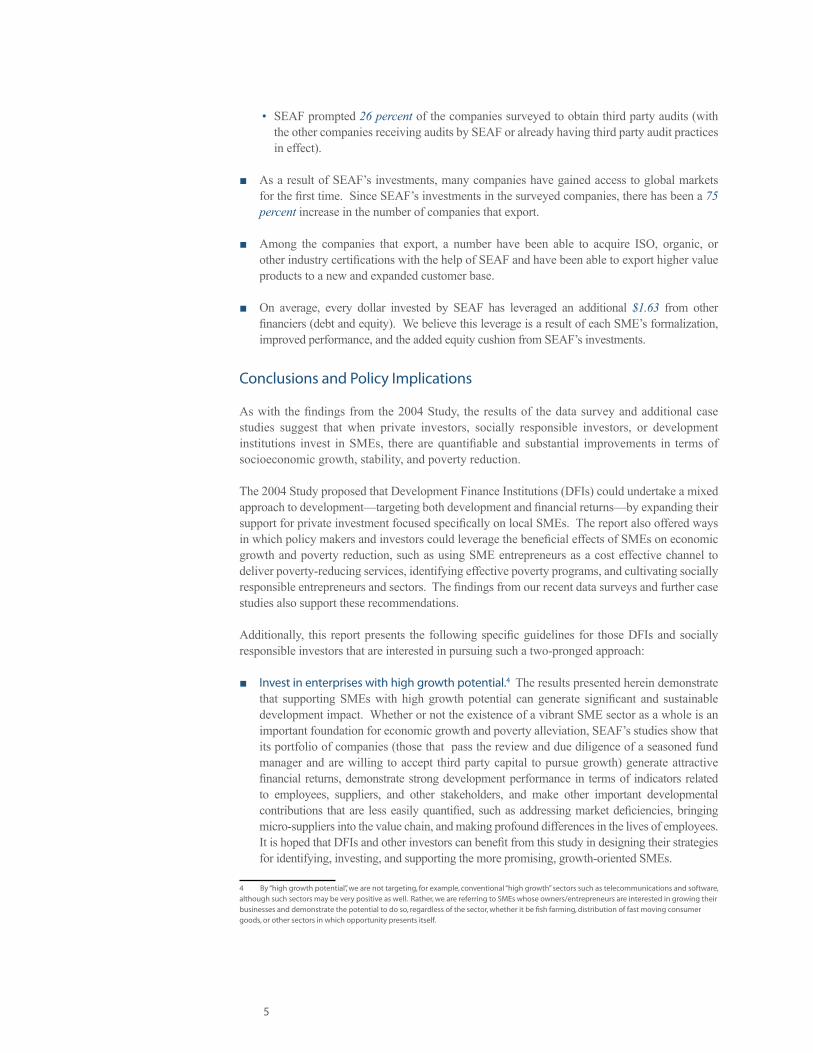
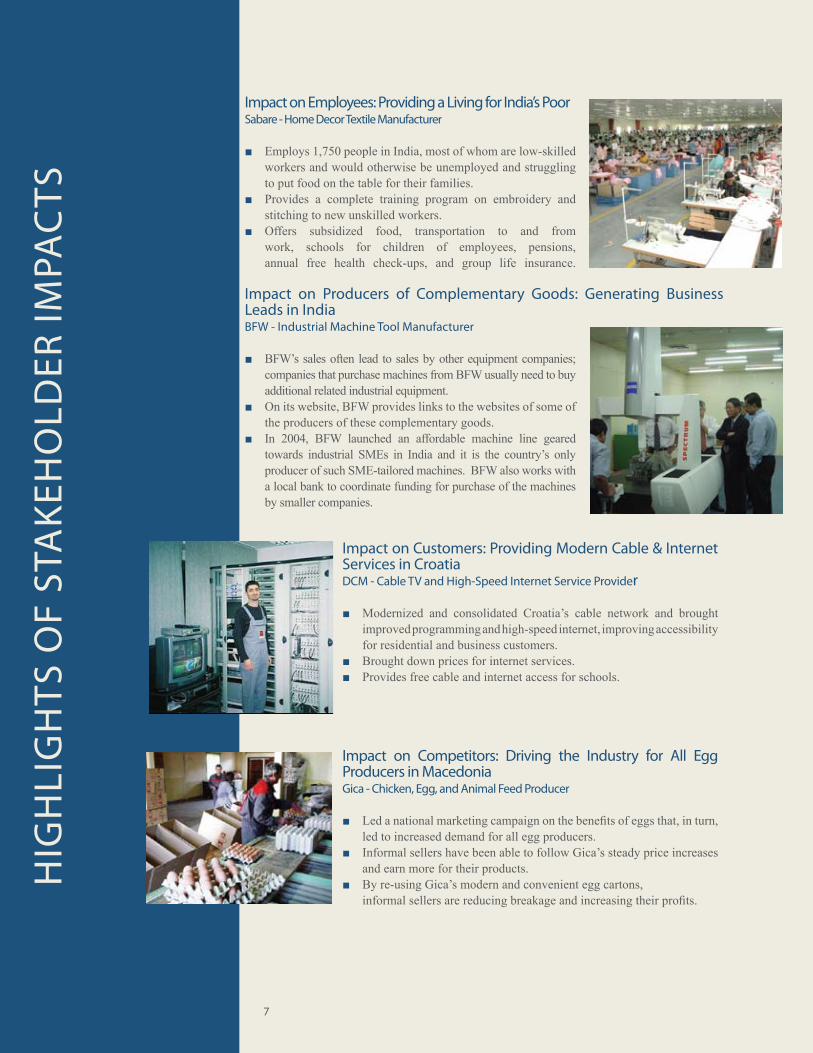
Impact on Employees: Providing a Living for India’s PoorSabare - Home Decor Textile Manufacturer
Employs 1,750 people in India, most of whom are low-skilled ■workers and would otherwise be unemployed and struggling to put food on the table for their families.Provides a complete training program on embroidery and ■stitching to new unskilled workers.Offers subsidized food, transportation to and from ■work, schools for children of employees, pensions, annual free health check-ups, and group life insurance.
Impact on Producers of Complementary Goods: Generating Business Leads in IndiaBFW - Industrial Machine Tool Manufacturer
BFW’s sales often lead to sales by other equipment companies; ■companies that purchase machines from BFW usually need to buy additional related industrial equipment.On its website, BFW provides links to the websites of some of ■the producers of these complementary goods.In 2004, BFW launched an affordable machine line geared ■towards industrial SMEs in India and it is the country’s only producer of such SME-tailored machines. BFW also works with a local bank to coordinate funding for purchase of the machines by smaller companies.
Impact on Customers: Providing Modern Cable & Internet Services in CroatiaDCM - Cable TV and High-Speed Internet Service Provider
Modernized and consolidated Croatia’s cable network and brought ■improved programming and high-speed internet, improving accessibility for residential and business customers.Brought down prices for internet services. ■Provides free cable and internet access for schools. ■
Impact on Competitors: Driving the Industry for All Egg Producers in MacedoniaGica - Chicken, Egg, and Animal Feed Producer
Led a national marketing campaign on the benefits of eggs that, in turn, ■led to increased demand for all egg producers.Informal sellers have been able to follow Gica’s steady price increases ■and earn more for their products.By re-using Gica’s modern and convenient egg cartons, ■informal sellers are reducing breakage and increasing their profits.
HIG
HLI
GH
TS O
F ST
AK
EHO
LDER
IMPA
CTS
8
HIG
HLIG
HTS O
F STAK
EHO
LDER
IMPA
CTS
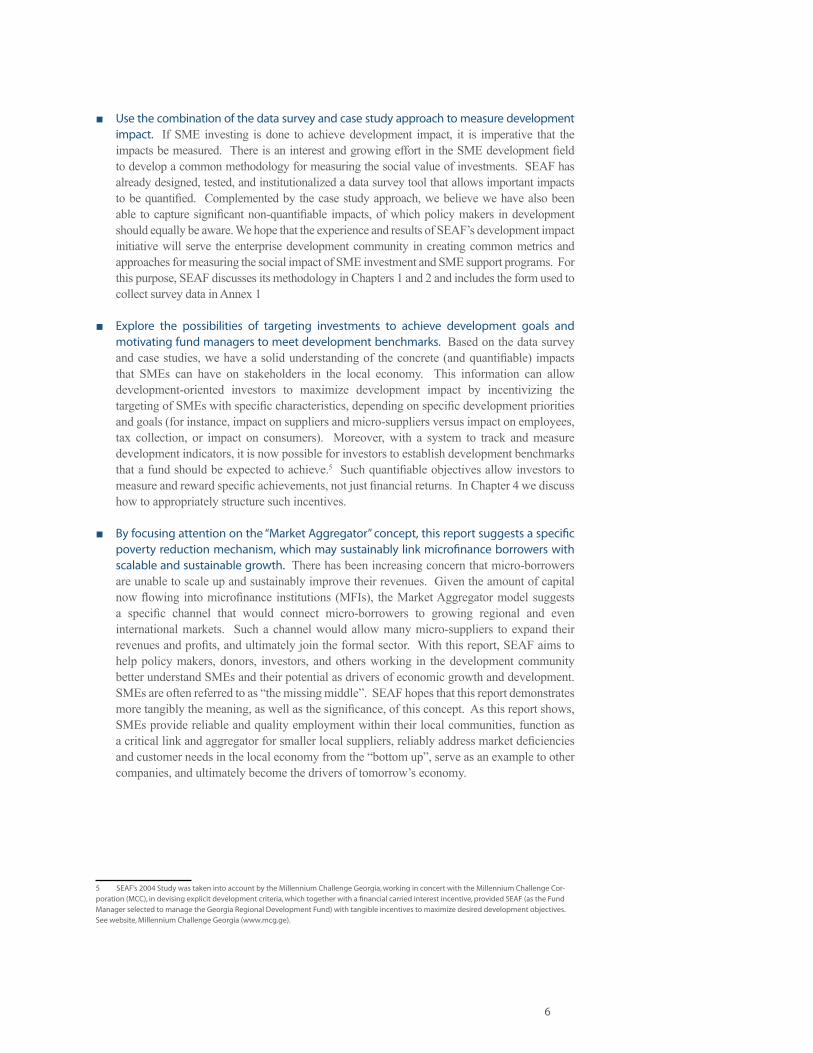
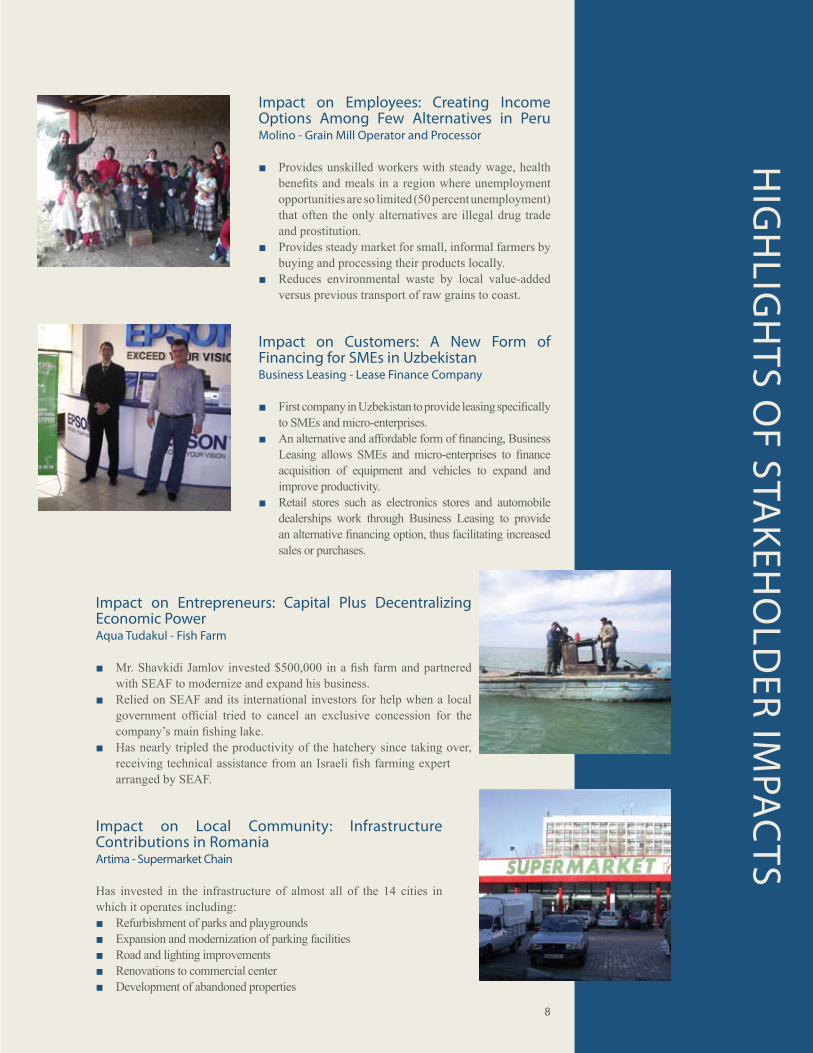
Impact on Employees: Creating Income Options Among Few Alternatives in Peru Molino - Grain Mill Operator and Processor
Provides unskilled workers with steady wage, health ■benefits and meals in a region where unemployment opportunities are so limited (50 percent unemployment) that often the only alternatives are illegal drug trade and prostitution.Provides steady market for small, informal farmers by ■buying and processing their products locally.Reduces environmental waste by local value-added ■versus previous transport of raw grains to coast.
Impact on Customers: A New Form of Financing for SMEs in UzbekistanBusiness Leasing - Lease Finance Company
First company in Uzbekistan to provide leasing specifically ■to SMEs and micro-enterprises. An alternative and affordable form of financing, Business ■Leasing allows SMEs and micro-enterprises to finance acquisition of equipment and vehicles to expand and improve productivity. Retail stores such as electronics stores and automobile ■dealerships work through Business Leasing to provide an alternative financing option, thus facilitating increased sales or purchases.
Impact on Entrepreneurs: Capital Plus Decentralizing Economic PowerAqua Tudakul - Fish Farm
Mr. Shavkidi Jamlov invested $500,000 in a fish farm and partnered ■with SEAF to modernize and expand his business.Relied on SEAF and its international investors for help when a local ■government official tried to cancel an exclusive concession for the company’s main fishing lake. Has nearly tripled the productivity of the hatchery since taking over, ■receiving technical assistance from an Israeli fish farming expert arranged by SEAF.
Impact on Local Community: Infrastructure Contributions in Romania Artima - Supermarket Chain
Has invested in the infrastructure of almost all of the 14 cities in which it operates including:
Refurbishment of parks and playgrounds ■Expansion and modernization of parking facilities ■Road and lighting improvements ■Renovations to commercial center ■Development of abandoned properties ■
9
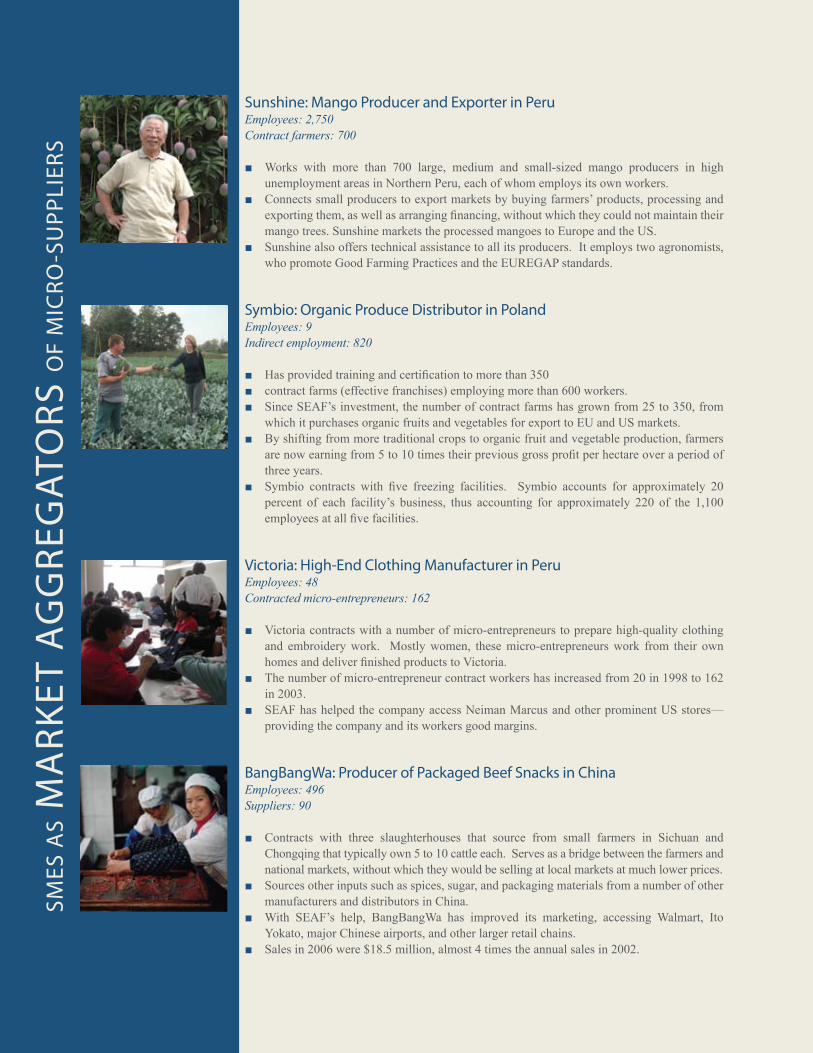
Sunshine: Mango Producer and Exporter in PeruEmployees: 2,750Contract farmers: 700
Works with more than 700 large, medium and small-sized mango producers in high ■unemployment areas in Northern Peru, each of whom employs its own workers.Connects small producers to export markets by buying farmers’ products, processing and ■exporting them, as well as arranging financing, without which they could not maintain their mango trees. Sunshine markets the processed mangoes to Europe and the US. Sunshine also offers technical assistance to all its producers. It employs two agronomists, ■who promote Good Farming Practices and the EUREGAP standards.
Symbio: Organic Produce Distributor in PolandEmployees: 9Indirect employment: 820
Has provided training and certification to more than 350 ■contract farms (effective franchises) employing more than 600 workers. ■Since SEAF’s investment, the number of contract farms has grown from 25 to 350, from ■which it purchases organic fruits and vegetables for export to EU and US markets.By shifting from more traditional crops to organic fruit and vegetable production, farmers ■are now earning from 5 to 10 times their previous gross profit per hectare over a period of three years.Symbio contracts with five freezing facilities. Symbio accounts for approximately 20 ■percent of each facility’s business, thus accounting for approximately 220 of the 1,100 employees at all five facilities.
Victoria: High-End Clothing Manufacturer in PeruEmployees: 48Contracted micro-entrepreneurs: 162
Victoria contracts with a number of micro-entrepreneurs to prepare high-quality clothing ■and embroidery work. Mostly women, these micro-entrepreneurs work from their own homes and deliver finished products to Victoria.The number of micro-entrepreneur contract workers has increased from 20 in 1998 to 162 ■in 2003.SEAF has helped the company access Neiman Marcus and other prominent US stores— ■providing the company and its workers good margins.
BangBangWa: Producer of Packaged Beef Snacks in ChinaEmployees: 496Suppliers: 90
Contracts with three slaughterhouses that source from small farmers in Sichuan and ■Chongqing that typically own 5 to 10 cattle each. Serves as a bridge between the farmers and national markets, without which they would be selling at local markets at much lower prices.Sources other inputs such as spices, sugar, and packaging materials from a number of other ■manufacturers and distributors in China.With SEAF’s help, BangBangWa has improved its marketing, accessing Walmart, Ito ■Yokato, major Chinese airports, and other larger retail chains.Sales in 2006 were $18.5 million, almost 4 times the annual sales in 2002. ■
SMES
AS
MA
RK
ET A
GG
REG
ATO
RS
OF
MIC
RO
-SU
PP
LIER
S
10
Chapter 1. Data Survey ResultsOverview
In late 2004, SEAF launched an ongoing data survey to track socioeconomic indicators for its investees. On a semi-annual basis, we sent SEAF’s data collection form (see Annex 1) to SEAF’s field offices in Eastern Europe, Asia, and Latin America. To date, three rounds of historical data have been collected from 40 companies in ten countries. To best capture the various economic impacts of SME investment, SEAF collected data on employment, wages, benefits, training, suppliers, customers, taxes, community development, formalization, and corporate governance. In this chapter, we provide an overview of the pool of companies surveyed and present the results of the latest survey (in which SEAF collected data through calendar year 2005) as follows:
Growth in job opportunities ■Wage growth ■Provision of non-salary benefits ■Impact on the poor ■Development of job skills ■
Opportunities for women ■Impact on suppliers ■Benefits for customers ■Contributions to local communities ■Impact on rest of society ■
Some of the most compelling findings are summarized in the box below:
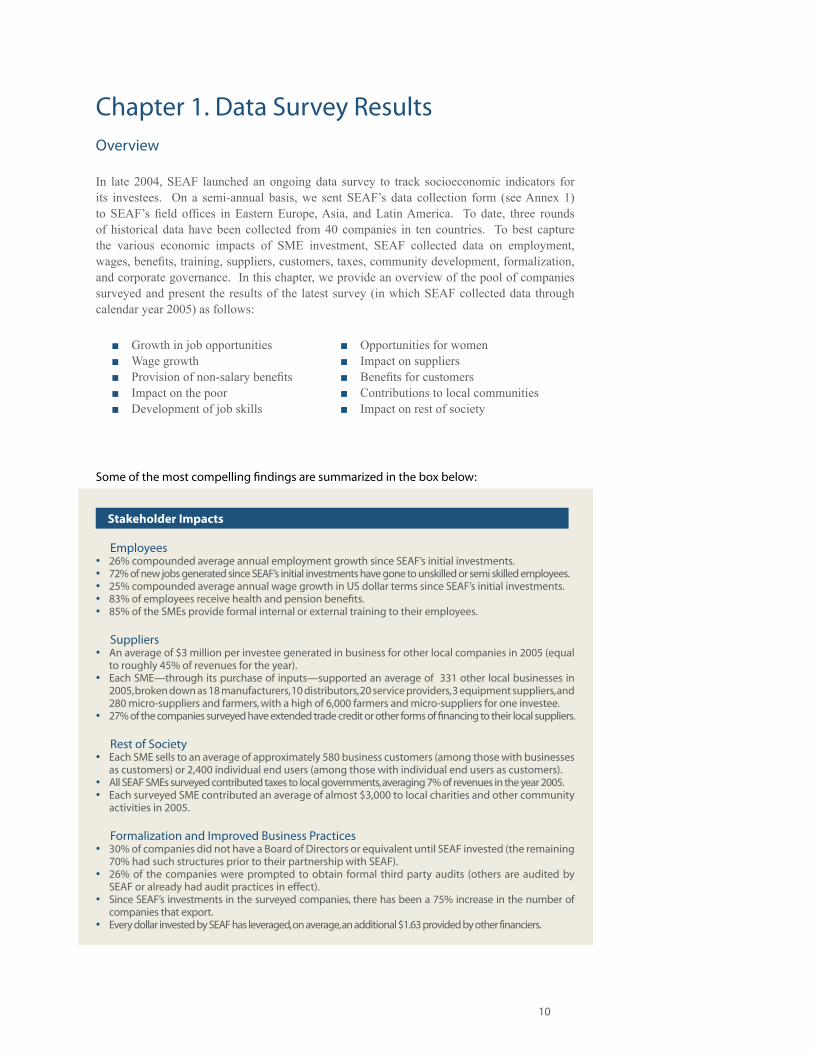
Stakeholder Impacts
Employees26% compounded average annual employment growth since SEAF’s initial investments.• 72% of new jobs generated since SEAF’s initial investments have gone to unskilled or semi skilled employees.• 25% compounded average annual wage growth in US dollar terms since SEAF’s initial investments.• 83% of employees receive health and pension benefits.• 85% of the SMEs provide formal internal or external training to their employees.•
SuppliersAn average of $3 million per investee generated in business for other local companies in 2005 (equal • to roughly 45% of revenues for the year).Each SME—through its purchase of inputs—supported an average of 331 other local businesses in • 2005, broken down as 18 manufacturers, 10 distributors, 20 service providers, 3 equipment suppliers, and 280 micro-suppliers and farmers, with a high of 6,000 farmers and micro-suppliers for one investee.27% of the companies surveyed have extended trade credit or other forms of financing to their local suppliers.•
Rest of SocietyEach SME sells to an average of approximately 580 business customers (among those with businesses • as customers) or 2,400 individual end users (among those with individual end users as customers).All SEAF SMEs surveyed contributed taxes to local governments, averaging 7% of revenues in the year 2005.• Each surveyed SME contributed an average of almost $3,000 to local charities and other community • activities in 2005.
Formalization and Improved Business Practices30% of companies did not have a Board of Directors or equivalent until SEAF invested (the remaining • 70% had such structures prior to their partnership with SEAF).26% of the companies were prompted to obtain formal third party audits (others are audited by • SEAF or already had audit practices in effect).Since SEAF’s investments in the surveyed companies, there has been a 75% increase in the number of • companies that export.Every dollar invested by SEAF has leveraged, on average, an additional $1.63 provided by other financiers.•
11
Survey Pool
SEAF surveyed a total pool of 40 companies spanning 10 countries, collecting historical socioeconomic indicators for each year beginning with the year prior to investment through the end of the year 2005. The pool of companies used in each analysis presented in Table 1 ranges from 28 to 40, depending on the availability and reliability of data for each company for a given indicator. In all cases when we compare initial data with year 2005 data to assess change over time, we exclude two new companies for which we have data for only one period.
When analyzing what we refer to as “Initial Year” data, we are using the year prior to SEAF’s investment or, in cases in which that is not available, the year of investment or a more recent year. When analyzing what we refer to as “Year 2005” data, we use 2005 data for active companies, but for exited companies we use the most recent year of data collected (usually the year of exit, which is the year 2005 or earlier).
Data from SEAF’s more mature funds (i.e., the countries with the longest average number of years invested), such as Croatia, Romania, and Macedonia, may provide a better sense of the long-term impact of SME investments. SEAF notes the specific results for these countries for some of the analyses in this report.
Growth in Job Opportunities
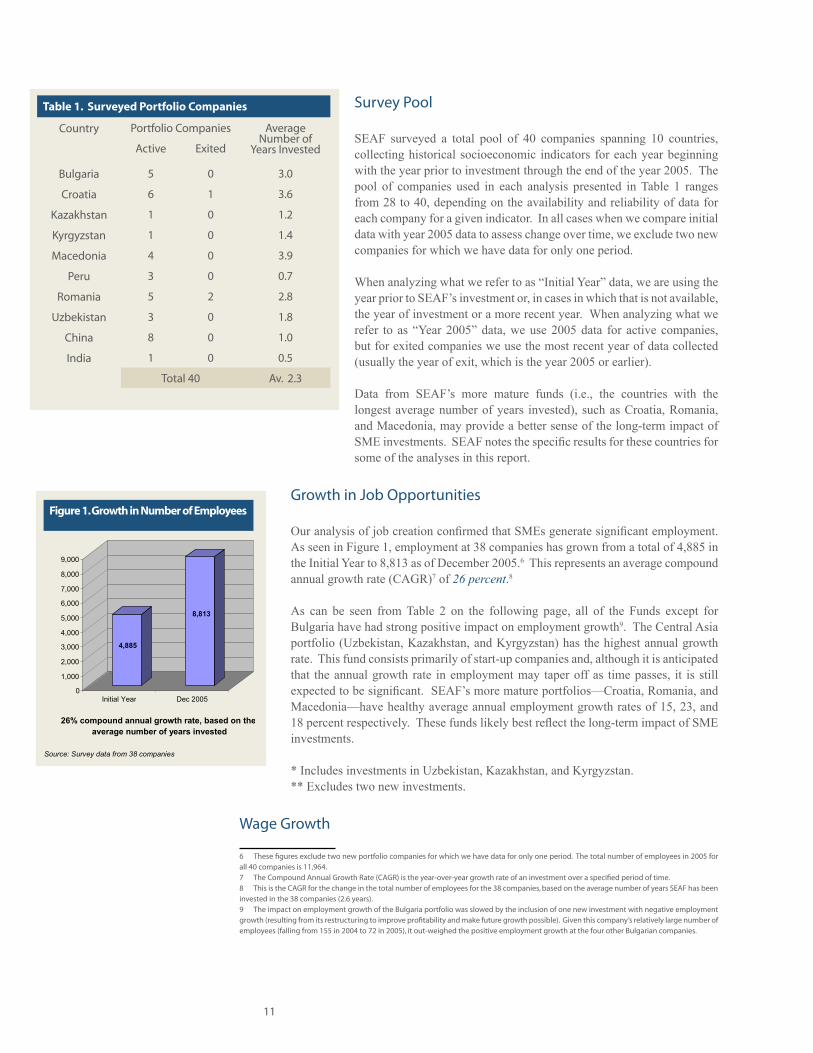
Our analysis of job creation confirmed that SMEs generate significant employment. As seen in Figure 1, employment at 38 companies has grown from a total of 4,885 in the Initial Year to 8,813 as of December 2005.6 This represents an average compound annual growth rate (CAGR)7 of 26 percent.8
As can be seen from Table 2 on the following page, all of the Funds except for Bulgaria have had strong positive impact on employment growth9. The Central Asia portfolio (Uzbekistan, Kazakhstan, and Kyrgyzstan) has the highest annual growth rate. This fund consists primarily of start-up companies and, although it is anticipated that the annual growth rate in employment may taper off as time passes, it is still expected to be significant. SEAF’s more mature portfolios—Croatia, Romania, and Macedonia—have healthy average annual employment growth rates of 15, 23, and 18 percent respectively. These funds likely best reflect the long-term impact of SME investments.
* Includes investments in Uzbekistan, Kazakhstan, and Kyrgyzstan.** Excludes two new investments.
Wage Growth
6 These figures exclude two new portfolio companies for which we have data for only one period. The total number of employees in 2005 for all 40 companies is 11,964. 7 The Compound Annual Growth Rate (CAGR) is the year-over-year growth rate of an investment over a specified period of time. 8 This is the CAGR for the change in the total number of employees for the 38 companies, based on the average number of years SEAF has been invested in the 38 companies (2.6 years). 9 The impact on employment growth of the Bulgaria portfolio was slowed by the inclusion of one new investment with negative employment growth (resulting from its restructuring to improve profitability and make future growth possible). Given this company’s relatively large number of employees (falling from 155 in 2004 to 72 in 2005), it out-weighed the positive employment growth at the four other Bulgarian companies.
4,885
8,813
0 1,000 2,000 3,000 4,000 5,000 6,000 7,000 8,000 9,000
Initial Year Dec 2005
26% compound annual growth rate, based on the average number of years invested
Source: Survey data from 38 companies
Table 1. Surveyed Portfolio Companies
Country Portfolio Companies Average Number of
Years InvestedActive Exited
Bulgaria 5 0 3.0
Croatia 6 1 3.6
Kazakhstan 1 0 1.2
Kyrgyzstan 1 0 1.4
Macedonia 4 0 3.9
Peru 3 0 0.7
Romania 5 2 2.8
Uzbekistan 3 0 1.8
China 8 0 1.0
India 1 0 0.5
Total 40 Av. 2.3
Figure 1. Growth in Number of Employees
12
In analyzing the direct benefit of wages paid and wage growth history at SEAF’s portfolio companies, we examined two main aspects: wage growth since the time of SEAF’s investments and how the companies’ wages compare to the national average. We compare how wages differ by skill and gender in later sections entitled “Increasing Job Opportunities Suitable for the Poor” and “Creating Opportunities for Women”.
Wage Growth Sustained Since SEAF Invested
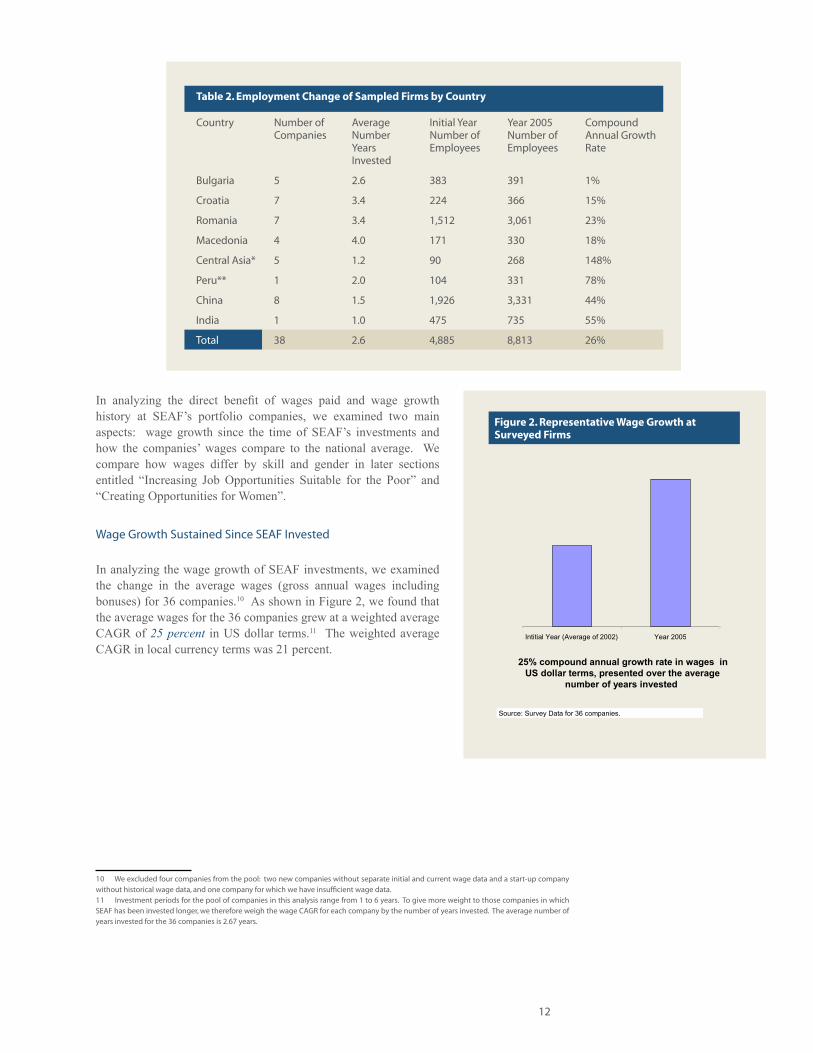
In analyzing the wage growth of SEAF investments, we examined the change in the average wages (gross annual wages including bonuses) for 36 companies.10 As shown in Figure 2, we found that the average wages for the 36 companies grew at a weighted average CAGR of 25 percent in US dollar terms.11 The weighted average CAGR in local currency terms was 21 percent.
10 We excluded four companies from the pool: two new companies without separate initial and current wage data and a start-up company without historical wage data, and one company for which we have insufficient wage data.11 Investment periods for the pool of companies in this analysis range from 1 to 6 years. To give more weight to those companies in which SEAF has been invested longer, we therefore weigh the wage CAGR for each company by the number of years invested. The average number of years invested for the 36 companies is 2.67 years.
Table 2. Employment Change of Sampled Firms by Country
Country Number of Companies
Average Number Years Invested
Initial Year Number of Employees
Year 2005 Number of Employees
Compound Annual Growth Rate
Bulgaria 5 2.6 383 391 1%
Croatia 7 3.4 224 366 15%
Romania 7 3.4 1,512 3,061 23%
Macedonia 4 4.0 171 330 18%
Central Asia* 5 1.2 90 268 148%
Peru** 1 2.0 104 331 78%
China 8 1.5 1,926 3,331 44%
India 1 1.0 475 735 55%
Total 38 2.6 4,885 8,813 26%
Figure 2. Representative Wage Growth at Surveyed Firms
Intitial Year (Average of 2002) Year 2005
Source: Survey Data for 36 companies.
25% compound annual growth rate in wages in US dollar terms, presented over the average
number of years invested
13
All but three of the 36 companies (an exited company in Romania, a start-up company in Uzbekistan, and a company in China) have experienced steady upward trends in average wages since the time of SEAF’s investments. Even for these three companies, while the wage impact appears to be negative, a closer analysis demonstrates that it is not. Wage growth within each skill group (unskilled, semi-skilled, and skilled) was positive within each of the three companies, but only because the number of unskilled employees increased so significantly at these companies over the investment period (at a rate of more than twice than that of semi-skilled and skilled employees), the overall average wage went down. Thus, we consider the wage impact for these three companies to be positive because they have created new jobs along with steady wage increases for each set of skill levels. This data reflects SEAF’s findings from the case studies that SMEs tend to hire more unskilled workers than larger companies or government/NGOs, and that SMEs have to train these employees to become productive (see “Developing Job Skills” section). As employees become more productive, entrepreneurs also begin to pay them more. As the rate of hiring new employees slows down at these firms, we expect that the overall wage growth will become positive as well.
Company vs. National Average Wage
Besides wage growth, we compared the average wage for each company to national average wages. We found that for a pool of 38 companies,12 the companies’ wages were, on average, approximately 37 percent higher than the national average wage in 2005.13 We found that 20 companies (or 53 percent) have wages above the national average wage, 15 (or 39 percent) are below the national average wage, and 3 (or 8 percent) are on par with the national average wage. In analyzing the characteristics of the companies with average wages below the national average, we found that these companies have high proportions of unskilled and semi-skilled workers. These companies have an average of 80 percent semi-skilled and unskilled-skilled workers, and unskilled workers alone comprise the majority of employees at five of these companies. Given our findings that SMEs tend to hire unskilled workers and train and promote from within (and thus provide wage increases), we expect that, as the rate of hiring new employees slows down, the average wages at these companies will increase and eventually surpass the national average wage.
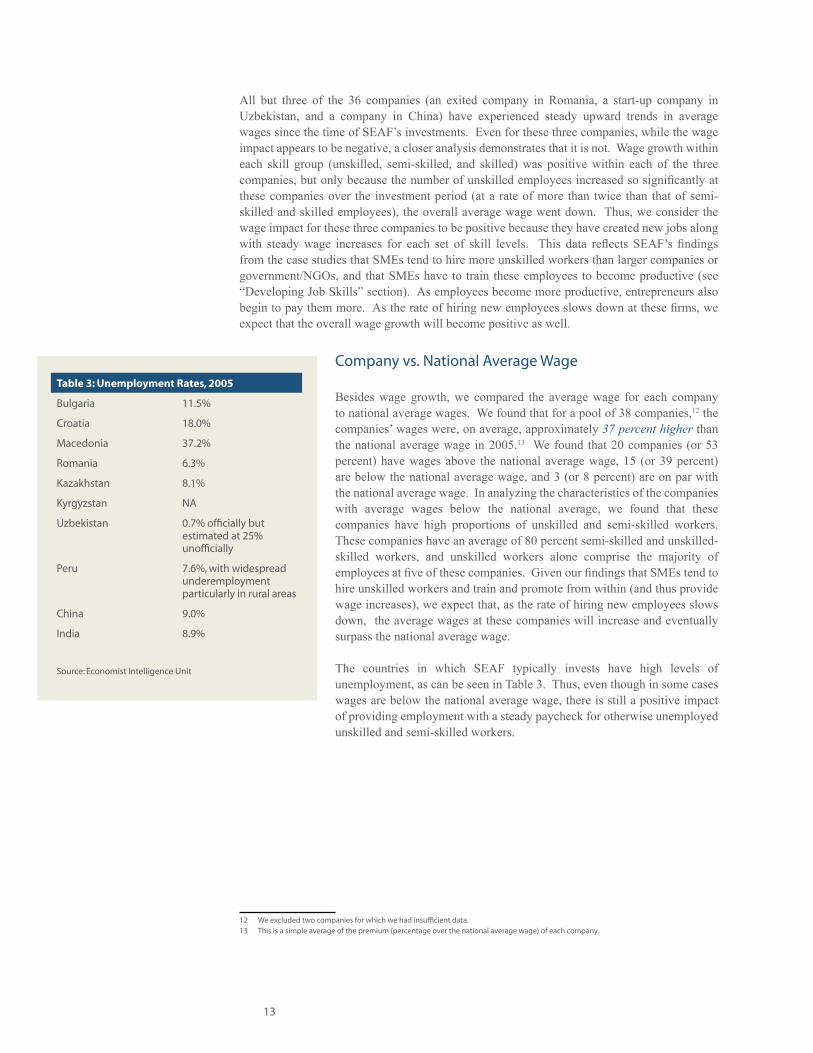
The countries in which SEAF typically invests have high levels of unemployment, as can be seen in Table 3. Thus, even though in some cases wages are below the national average wage, there is still a positive impact of providing employment with a steady paycheck for otherwise unemployed unskilled and semi-skilled workers.
12 We excluded two companies for which we had insufficient data.13 This is a simple average of the premium (percentage over the national average wage) of each company.
Table 3: Unemployment Rates, 2005
Bulgaria 11.5%
Croatia 18.0%
Macedonia 37.2%
Romania 6.3%
Kazakhstan 8.1%
Kyrgyzstan NA
Uzbekistan 0.7% officially but estimated at 25% unofficially
Peru 7.6%, with widespread underemployment particularly in rural areas
China 9.0%
India 8.9%
Source: Economist Intelligence Unit
14
Non-Salary Benefits
As with formal enterprises in the West, it is expected that many of the surveyed SMEs would provide their employees with health, pension, and other benefits, as well as stable salaries that cover vacation and sick time.
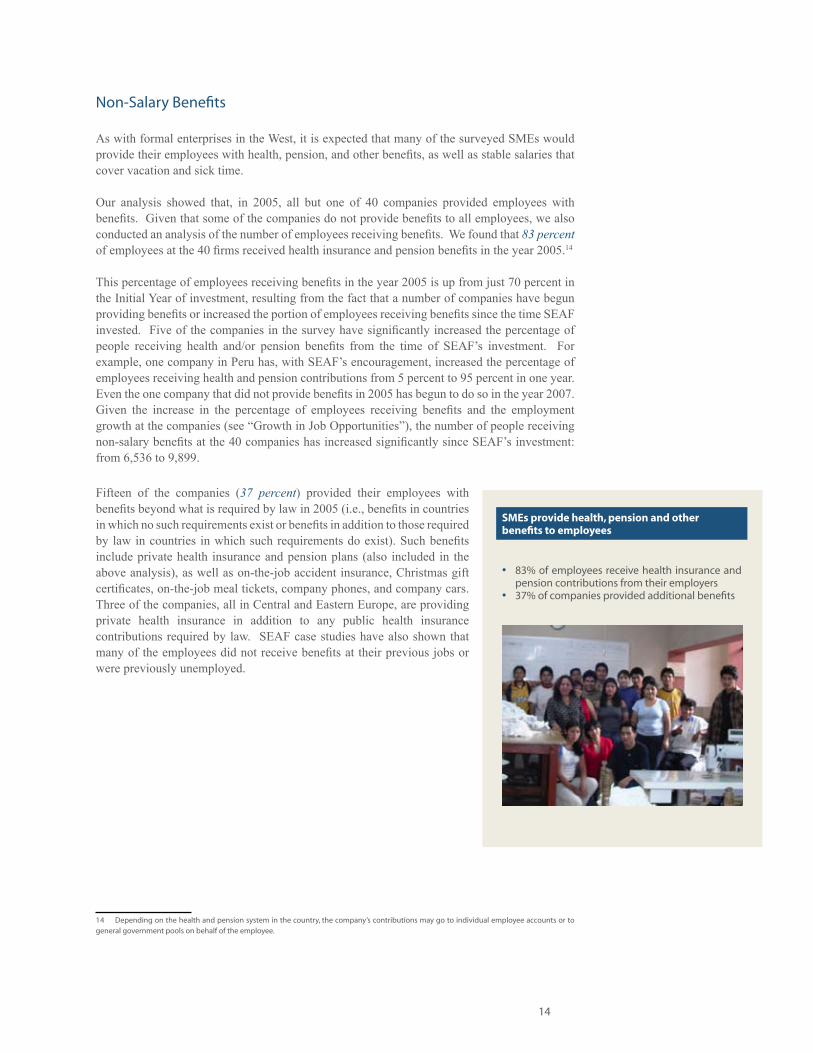
Our analysis showed that, in 2005, all but one of 40 companies provided employees with benefits. Given that some of the companies do not provide benefits to all employees, we also conducted an analysis of the number of employees receiving benefits. We found that 83 percent of employees at the 40 firms received health insurance and pension benefits in the year 2005.14
This percentage of employees receiving benefits in the year 2005 is up from just 70 percent in the Initial Year of investment, resulting from the fact that a number of companies have begun providing benefits or increased the portion of employees receiving benefits since the time SEAF invested. Five of the companies in the survey have significantly increased the percentage of people receiving health and/or pension benefits from the time of SEAF’s investment. For example, one company in Peru has, with SEAF’s encouragement, increased the percentage of employees receiving health and pension contributions from 5 percent to 95 percent in one year. Even the one company that did not provide benefits in 2005 has begun to do so in the year 2007. Given the increase in the percentage of employees receiving benefits and the employment growth at the companies (see “Growth in Job Opportunities”), the number of people receiving non-salary benefits at the 40 companies has increased significantly since SEAF’s investment: from 6,536 to 9,899.
Fifteen of the companies (37 percent) provided their employees with benefits beyond what is required by law in 2005 (i.e., benefits in countries in which no such requirements exist or benefits in addition to those required by law in countries in which such requirements do exist). Such benefits include private health insurance and pension plans (also included in the above analysis), as well as on-the-job accident insurance, Christmas gift certificates, on-the-job meal tickets, company phones, and company cars. Three of the companies, all in Central and Eastern Europe, are providing private health insurance in addition to any public health insurance contributions required by law. SEAF case studies have also shown that many of the employees did not receive benefits at their previous jobs or were previously unemployed.
14 Depending on the health and pension system in the country, the company’s contributions may go to individual employee accounts or to general government pools on behalf of the employee.
SMEs provide health, pension and other benefits to employees
83% of employees receive health insurance and • pension contributions from their employers37% of companies provided additional benefits•

15
Increasing Job Opportunities Suitable for the Poor
As of December 2005, 84 percent of the jobs at the 40 surveyed firms go to unskilled and semi-skilled workers (see Figure 3 to the right). This percentage has been generally consistent since the Initial Year of investments.
Moreover, most of the new jobs created since the Initial Year have gone to unskilled and semi-skilled workers. For the 38 companies, 72 percent of new jobs went to unskilled and semi-skilled workers. 15 Figure 4 demonstrates visually the new jobs generated per skill level. These data demonstrate that SMEs generate jobs suitable for the poor, and then train many of these employees on the job.
We also found that wages for unskilled and semi-skilled employees have been steadily increasing since the time that SEAF invested, partially attributable, we believe, to the fact that SMEs train unskilled and semi-skilled employees, making them more productive and leading to higher wages. All but 4 of 34 companies16 had positive wage growth for unskilled employees. Of these 4 exceptions, 2 had no change and 2 had only a slight decline of approximately 5 percent per year. All but 5 of the companies had positive wage growth for semi-skilled employees, and of these 5 exceptions, 2 had no change and 3 had negative growth. Overall, unskilled and semi-skilled average wages grew at a CAGR in US dollar terms of 18 percent and 19 percent respectively.17
15 Excludes the two new Peru companies. 16 Six companies were excluded from the skill wage analysis: one did not provide reliable wage data, two exited and did not supply gross wage data broken down by skill, and three were recent investments with only one year of data available. 17 This is the average of the CAGR for each company weighted by the number of years invested and by the number of employees.
Figure 3. Skill Breakdown of Employees, Year 2005
Semi- skilled 29%
Skilled 16%
Unskilled 55%
Source: Survey Data from 40 companies.
Unskilled: 6,580 Semi-Skilled: 3,470 Skilled: 1,914 Total Employees: 11,964 Includes full-time, part- time, and seasonal.
Figure 4. Employment Growth by Skill: Number of Employees by Skill in Initial Year & 2005
0 500
1,000 1,500 2,000 2,500 3,000 3,500 4,000
Employees
Unskilled Semi- skilled
Skilled
Initial Dec-05
Source: Survey Data from 40 companies
16
Developing Job Skills
Training received during employment is a substantial asset for employees as it permits wage increases and a skill mobility premium. All of the surveyed companies provide training to their employees. The cost of training varies and is not always easily quantifiable.
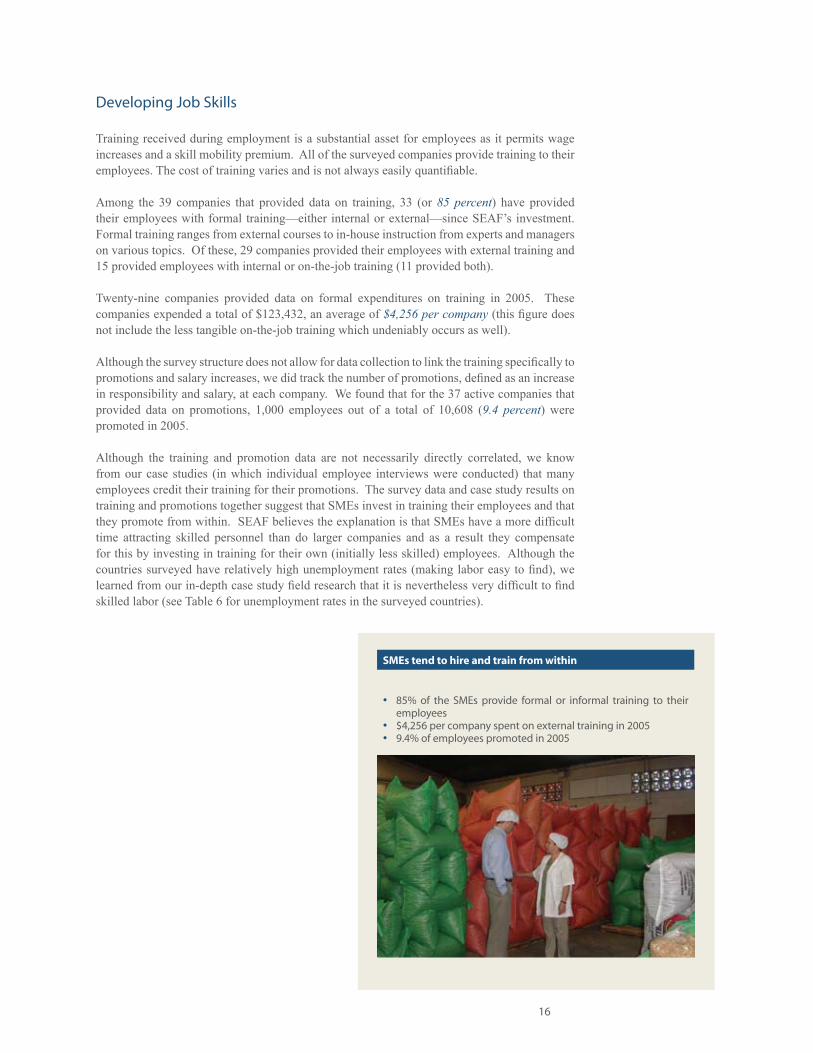
Among the 39 companies that provided data on training, 33 (or 85 percent) have provided their employees with formal training—either internal or external—since SEAF’s investment. Formal training ranges from external courses to in-house instruction from experts and managers on various topics. Of these, 29 companies provided their employees with external training and 15 provided employees with internal or on-the-job training (11 provided both).
Twenty-nine companies provided data on formal expenditures on training in 2005. These companies expended a total of $123,432, an average of $4,256 per company (this figure does not include the less tangible on-the-job training which undeniably occurs as well).
Although the survey structure does not allow for data collection to link the training specifically to promotions and salary increases, we did track the number of promotions, defined as an increase in responsibility and salary, at each company. We found that for the 37 active companies that provided data on promotions, 1,000 employees out of a total of 10,608 (9.4 percent) were promoted in 2005. Although the training and promotion data are not necessarily directly correlated, we know from our case studies (in which individual employee interviews were conducted) that many employees credit their training for their promotions. The survey data and case study results on training and promotions together suggest that SMEs invest in training their employees and that they promote from within. SEAF believes the explanation is that SMEs have a more difficult time attracting skilled personnel than do larger companies and as a result they compensate for this by investing in training for their own (initially less skilled) employees. Although the countries surveyed have relatively high unemployment rates (making labor easy to find), we learned from our in-depth case study field research that it is nevertheless very difficult to find skilled labor (see Table 6 for unemployment rates in the surveyed countries).
SMEs tend to hire and train from within
85% of the SMEs provide formal or informal training to their • employees$4,256 per company spent on external training in 2005• 9.4% of employees promoted in 2005•
17
Creating Opportunities for Women
Access to Capital and Leadership Positions
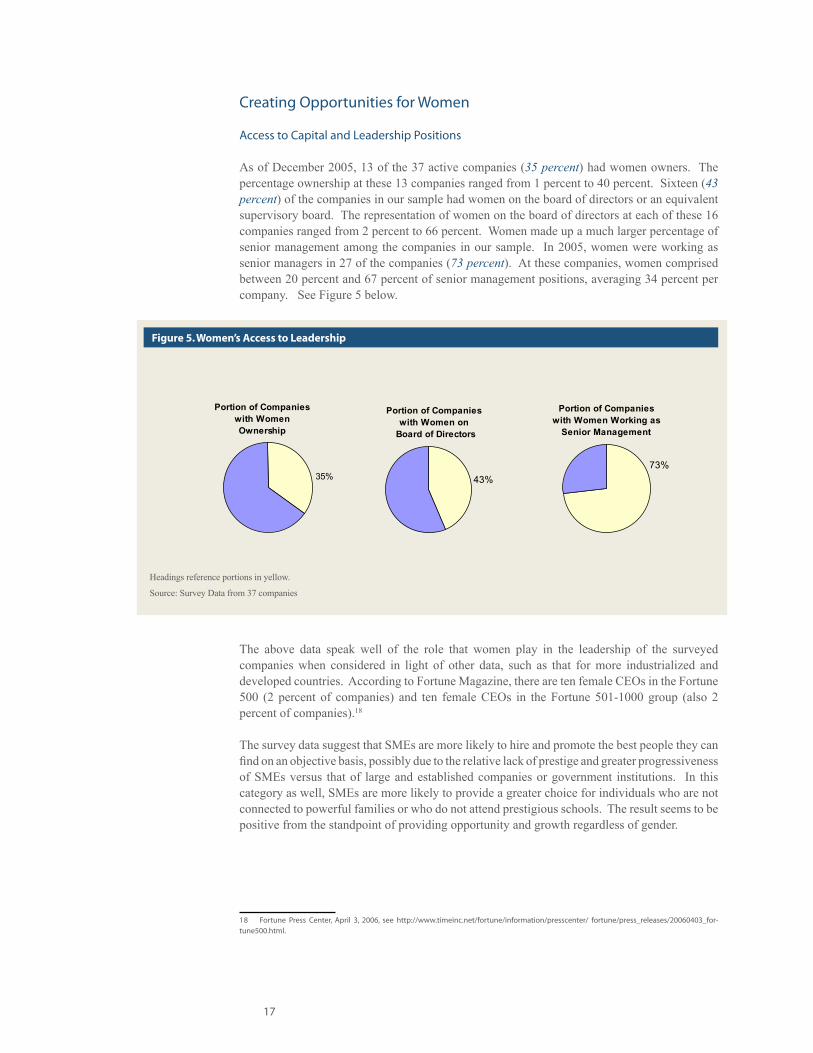
As of December 2005, 13 of the 37 active companies (35 percent) had women owners. The percentage ownership at these 13 companies ranged from 1 percent to 40 percent. Sixteen (43 percent) of the companies in our sample had women on the board of directors or an equivalent supervisory board. The representation of women on the board of directors at each of these 16 companies ranged from 2 percent to 66 percent. Women made up a much larger percentage of senior management among the companies in our sample. In 2005, women were working as senior managers in 27 of the companies (73 percent). At these companies, women comprised between 20 percent and 67 percent of senior management positions, averaging 34 percent per company. See Figure 5 below.
The above data speak well of the role that women play in the leadership of the surveyed companies when considered in light of other data, such as that for more industrialized and developed countries. According to Fortune Magazine, there are ten female CEOs in the Fortune 500 (2 percent of companies) and ten female CEOs in the Fortune 501-1000 group (also 2 percent of companies).18
The survey data suggest that SMEs are more likely to hire and promote the best people they can find on an objective basis, possibly due to the relative lack of prestige and greater progressiveness of SMEs versus that of large and established companies or government institutions. In this category as well, SMEs are more likely to provide a greater choice for individuals who are not connected to powerful families or who do not attend prestigious schools. The result seems to be positive from the standpoint of providing opportunity and growth regardless of gender.
18 Fortune Press Center, April 3, 2006, see http://www.timeinc.net/fortune/information/presscenter/ fortune/press_releases/20060403_for-tune500.html.
Figure 5. Women’s Access to Leadership
Headings reference portions in yellow.
Source: Survey Data from 37 companies
Portion of Companies with Women on
Board of Directors
43%
Portion of Companies with Women Ownership
35%
Portion of Companies with Women Working as
Senior Management
73%
18
Access to Employment Opportunities
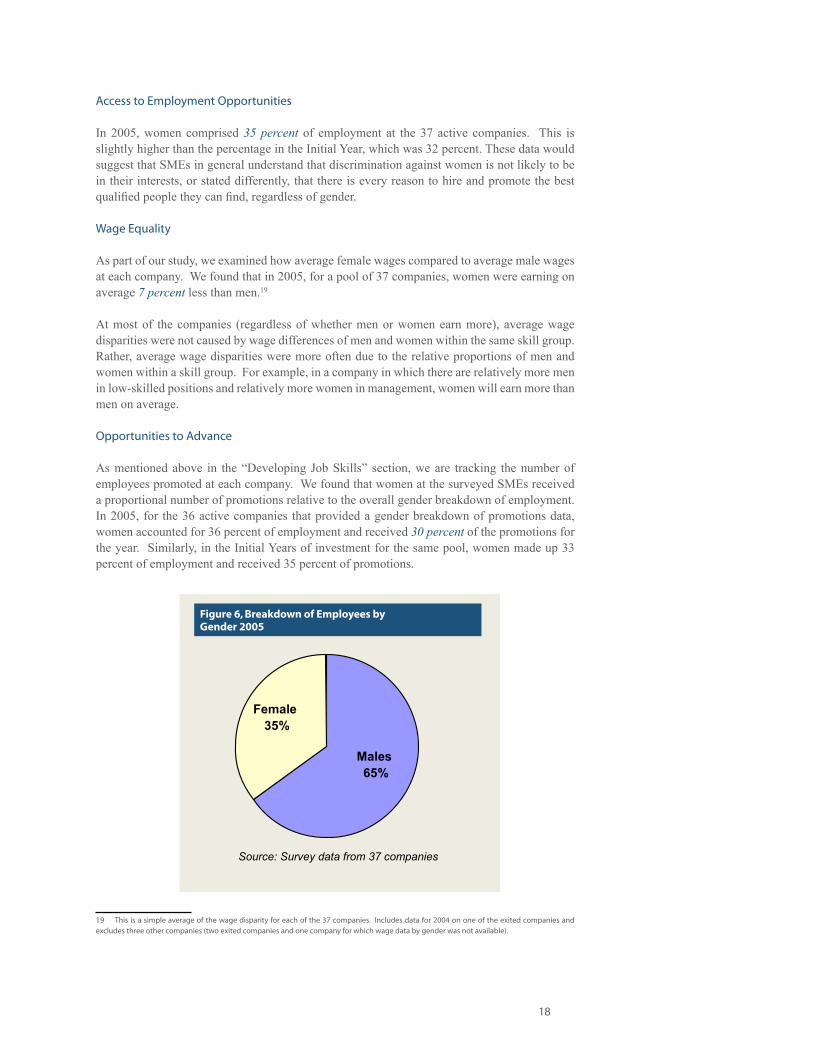
In 2005, women comprised 35 percent of employment at the 37 active companies. This is slightly higher than the percentage in the Initial Year, which was 32 percent. These data would suggest that SMEs in general understand that discrimination against women is not likely to be in their interests, or stated differently, that there is every reason to hire and promote the best qualified people they can find, regardless of gender. Wage Equality
As part of our study, we examined how average female wages compared to average male wages at each company. We found that in 2005, for a pool of 37 companies, women were earning on average 7 percent less than men.19
At most of the companies (regardless of whether men or women earn more), average wage disparities were not caused by wage differences of men and women within the same skill group. Rather, average wage disparities were more often due to the relative proportions of men and women within a skill group. For example, in a company in which there are relatively more men in low-skilled positions and relatively more women in management, women will earn more than men on average.
Opportunities to Advance
As mentioned above in the “Developing Job Skills” section, we are tracking the number of employees promoted at each company. We found that women at the surveyed SMEs received a proportional number of promotions relative to the overall gender breakdown of employment. In 2005, for the 36 active companies that provided a gender breakdown of promotions data, women accounted for 36 percent of employment and received 30 percent of the promotions for the year. Similarly, in the Initial Years of investment for the same pool, women made up 33 percent of employment and received 35 percent of promotions.
19 This is a simple average of the wage disparity for each of the 37 companies. Includes data for 2004 on one of the exited companies and excludes three other companies (two exited companies and one company for which wage data by gender was not available).
Figure 6, Breakdown of Employees byGender 2005
Males 65%
Female 35%
Source: Survey data from 37 companies
19
Impact on Suppliers
Through our survey, we found that SEAF’s investments have generated business for other companies in the local economy. In our data collection form (see Annex 1), we track the percentage of cost of goods sold (COGS) and capital expenditures going to other domestic businesses20 and the number of domestic suppliers by type. Generating Revenues for Other Local Companies
For the 32 portfolio companies that provided data on the topic, we found that approximately 59 percent of COGS and capital expenditures went to other domestic businesses in 2005. The remainder of cost of goods sold and capital expenditures went to internal wage bills and to purchases of goods and services directly from abroad. In absolute dollar terms, these 32 companies generated $98 million in business for other domestic companies in the year 2005, or an average of approximately $3 million per portfolio company. Given the relatively small per company
turnover for each of the SMEs surveyed, this constitutes a significant amount. In percentage terms, 45 percent of revenues of the surveyed companies goes to other domestic businesses (i.e., every dollar of sales generates approximately $0.45 for other domestic companies). Overall, the data demonstrate a significant spillover effect of SEAF’s investments to other domestic companies. When combined with the larger portion of expenditure taken up by the internal SG&A, SMEs would seem to provide a powerful domestic economic multiplier effect.
Aggregation of Suppliers
We found that a wide range of domestic companies benefits from business generated. The 35 companies on which SEAF has a breakdown of number of suppliers (30 survey companies plus 5 case study companies from the 2004 Study) sourced from over 11,500 domestic suppliers. Each SME supports, through its purchase of inputs, an average of 331 domestic companies, broken down as followsThese results demonstrate that SMEs truly serve as “market aggregators” for farmers, micro-entrepreneurs, and other small suppliers; in other words, SMEs
serve as a critical link to connect smaller suppliers with customers further along in the value chain. As stated in the introduction, micro-entrepreneurs and smallholder farmers generally face challenges in accessing markets, understanding the sophisticated and changing demands of global consumers, and producing and distributing products competitive for global supply chains. Without the larger SMEs acting as processors and marketers to access these larger markets, it may be questioned whether these micro-suppliers would be able to take advantage of the positive business opportunities that exist in a global market.
20 Among COGS and capital expenditures going to other domestic businesses, we include purchases of goods and services from any domestic company and exclude only purchases (goods and services) directly from companies located abroad. We include local importers/distributors of imported goods because there is still a financial benefit going to these companies. We found it is also clearer to exclude only items and services purchased directly from abroad, rather than setting guidelines on what imported goods to include or exclude based on value added by other domestic companies.
18 ■ manufacturers; 10 ■ distributors;20 ■ service providers;
3 ■ suppliers of equipment; and280 ■ farmers and micro-suppliers, ranging as high as 6,000 for one of SEAF’s investees.
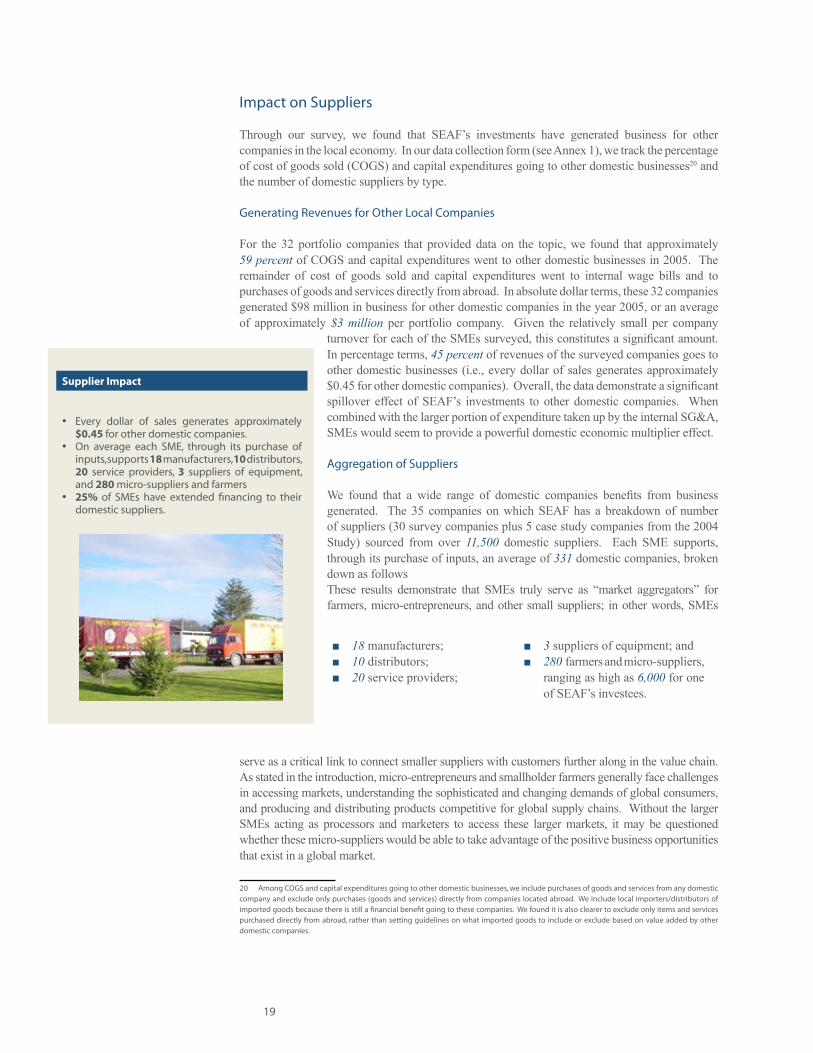
Supplier Impact
Every dollar of sales generates approximately • $0.45 for other domestic companies.On average each SME, through its purchase of • inputs, supports 18 manufacturers, 10 distributors, 20 service providers, 3 suppliers of equipment, and 280 micro-suppliers and farmers25%• of SMEs have extended financing to their domestic suppliers.
20
Providing Support to Domestic Suppliers
Lastly, 27 percent of the companies in our sample (10 out of 37 portfolio companies that provided data on the topic) have extended trade credit or other forms of financing to their domestic suppliers. Support has included trade financing and cash advances. In addition, we know from our in-depth case studies that some of our companies have provided technical assistance to suppliers and have helped them to improve the quality of their products (see Chapter 2).
Benefits for Customers
From an economic perspective, the impact on customers is properly measured by consumer surplus. Formally, however, consumer surplus is difficult to quantify because it requires estimation of price elasticity and the demand and supply curves for the overall market. To at least understand the scope of customers impacted, rather than the scope of impact on each type of customer, SEAF tracks the number and types of domestic customers. Among the companies surveyed that sell to business customers (i.e., sale of goods or services to corporate customers or intermediary businesses21), each sells to an average of approximately 580 companies. Among the companies surveyed that sell directly to individual end users, each sells to an average of approximately 2,400 customers.22
21 For instance, a producer or distributor that sells to retail stores rather than directly to end consumers.22 Thirty six of the 40 surveyed companies serve business customers. Of the 37, we exclude from the calculation 5 companies without data and 1 company that is a startup not yet with customers. Two of the companies export 100 percent of their products to foreign businesses, but we do not exclude them from the calculation of the average (they are counted as having zero domestic business customers). Twelve of the 40 surveyed companies sell directly to individual end consumers. Of the 12, we exclude from the calculation two companies without data and two companies that are outliers (a company with approximately 50,000 customers and another with approximately 440,000 customers). Eight companies are included in both pools because they have both business and individual customers.
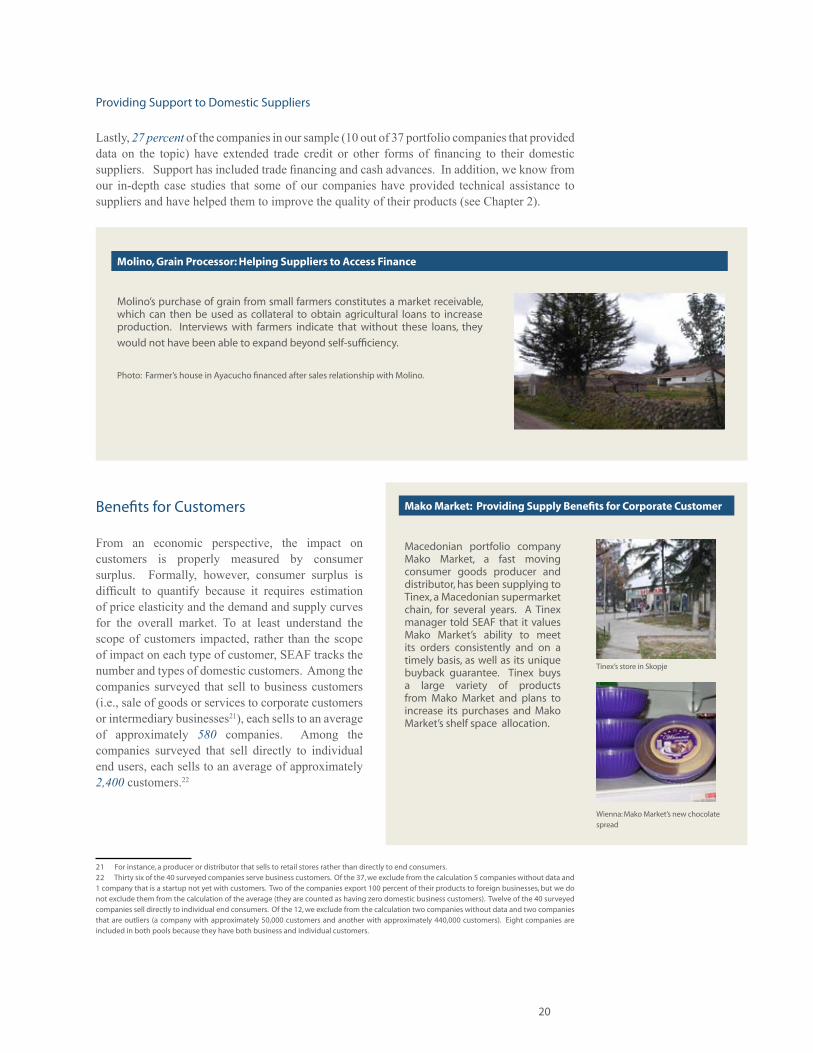
Molino, Grain Processor: Helping Suppliers to Access Finance
Molino’s purchase of grain from small farmers constitutes a market receivable, which can then be used as collateral to obtain agricultural loans to increase production. Interviews with farmers indicate that without these loans, they
would not have been able to expand beyond self-sufficiency.
Photo: Farmer’s house in Ayacucho financed after sales relationship with Molino.
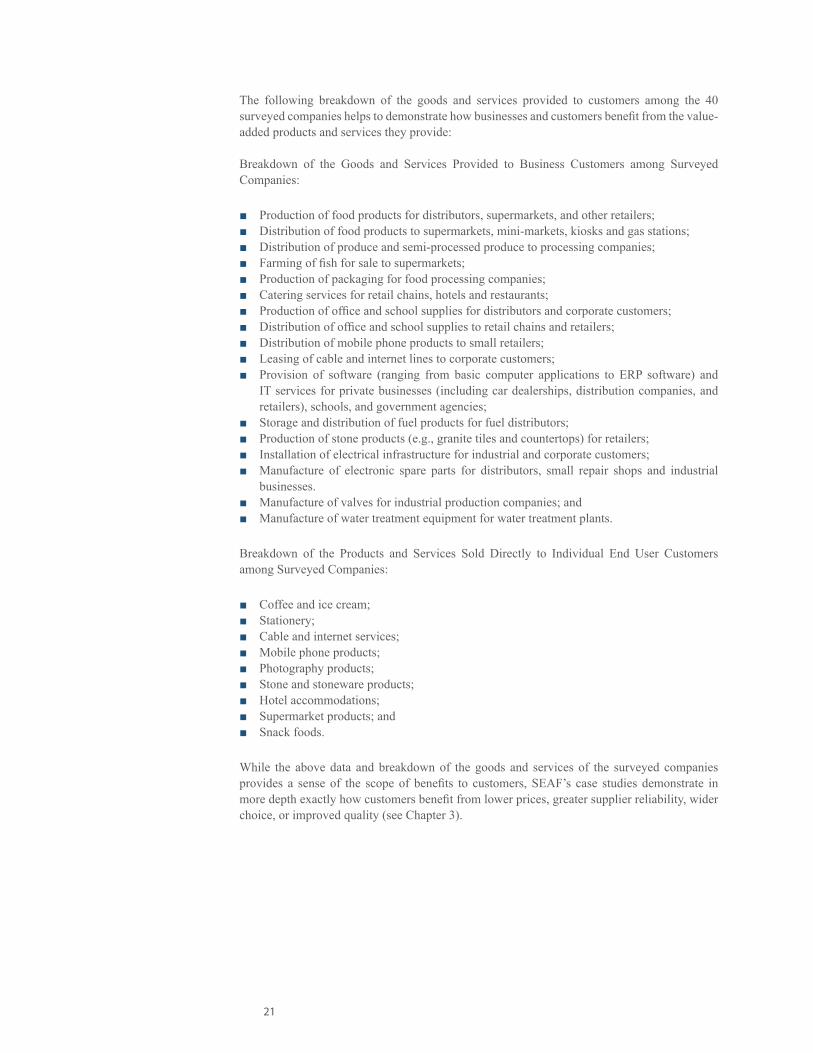
Mako Market: Providing Supply Benefits for Corporate Customer
Macedonian portfolio company Mako Market, a fast moving consumer goods producer and distributor, has been supplying to Tinex, a Macedonian supermarket chain, for several years. A Tinex manager told SEAF that it values Mako Market’s ability to meet its orders consistently and on a timely basis, as well as its unique buyback guarantee. Tinex buys a large variety of products from Mako Market and plans to increase its purchases and Mako Market’s shelf space allocation.
Tinex’s store in Skopje
Wienna: Mako Market’s new chocolate spread
21
The following breakdown of the goods and services provided to customers among the 40 surveyed companies helps to demonstrate how businesses and customers benefit from the value- added products and services they provide:
Breakdown of the Goods and Services Provided to Business Customers among Surveyed Companies:
Production of food products for distributors, supermarkets, and other retailers; ■Distribution of food products to supermarkets, mini-markets, kiosks and gas stations; ■Distribution of produce and semi-processed produce to processing companies; ■Farming of fish for sale to supermarkets; ■Production of packaging for food processing companies; ■Catering services for retail chains, hotels and restaurants; ■Production of office and school supplies for distributors and corporate customers; ■Distribution of office and school supplies to retail chains and retailers; ■Distribution of mobile phone products to small retailers; ■Leasing of cable and internet lines to corporate customers; ■Provision of software (ranging from basic computer applications to ERP software) and ■IT services for private businesses (including car dealerships, distribution companies, and retailers), schools, and government agencies;Storage and distribution of fuel products for fuel distributors; ■Production of stone products (e.g., granite tiles and countertops) for retailers; ■Installation of electrical infrastructure for industrial and corporate customers; ■Manufacture of electronic spare parts for distributors, small repair shops and industrial ■businesses.Manufacture of valves for industrial production companies; and ■Manufacture of water treatment equipment for water treatment plants. ■
Breakdown of the Products and Services Sold Directly to Individual End User Customers among Surveyed Companies:
Coffee and ice cream; ■Stationery; ■Cable and internet services; ■Mobile phone products; ■Photography products; ■Stone and stoneware products; ■Hotel accommodations; ■Supermarket products; and ■Snack foods. ■
While the above data and breakdown of the goods and services of the surveyed companies provides a sense of the scope of benefits to customers, SEAF’s case studies demonstrate in more depth exactly how customers benefit from lower prices, greater supplier reliability, wider choice, or improved quality (see Chapter 3).
22
Impact on National Governments
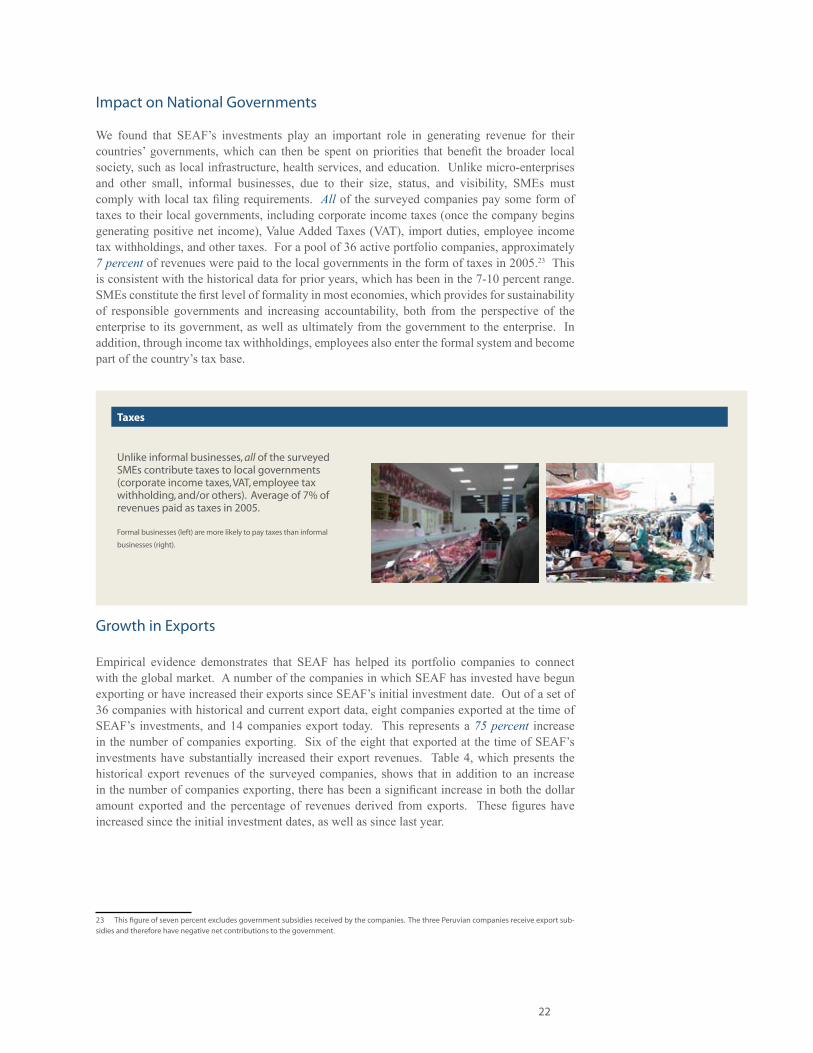
We found that SEAF’s investments play an important role in generating revenue for their countries’ governments, which can then be spent on priorities that benefit the broader local society, such as local infrastructure, health services, and education. Unlike micro-enterprises and other small, informal businesses, due to their size, status, and visibility, SMEs must comply with local tax filing requirements. All of the surveyed companies pay some form of taxes to their local governments, including corporate income taxes (once the company begins generating positive net income), Value Added Taxes (VAT), import duties, employee income tax withholdings, and other taxes. For a pool of 36 active portfolio companies, approximately 7 percent of revenues were paid to the local governments in the form of taxes in 2005.23 This is consistent with the historical data for prior years, which has been in the 7-10 percent range. SMEs constitute the first level of formality in most economies, which provides for sustainability of responsible governments and increasing accountability, both from the perspective of the enterprise to its government, as well as ultimately from the government to the enterprise. In addition, through income tax withholdings, employees also enter the formal system and become part of the country’s tax base.
Growth in Exports
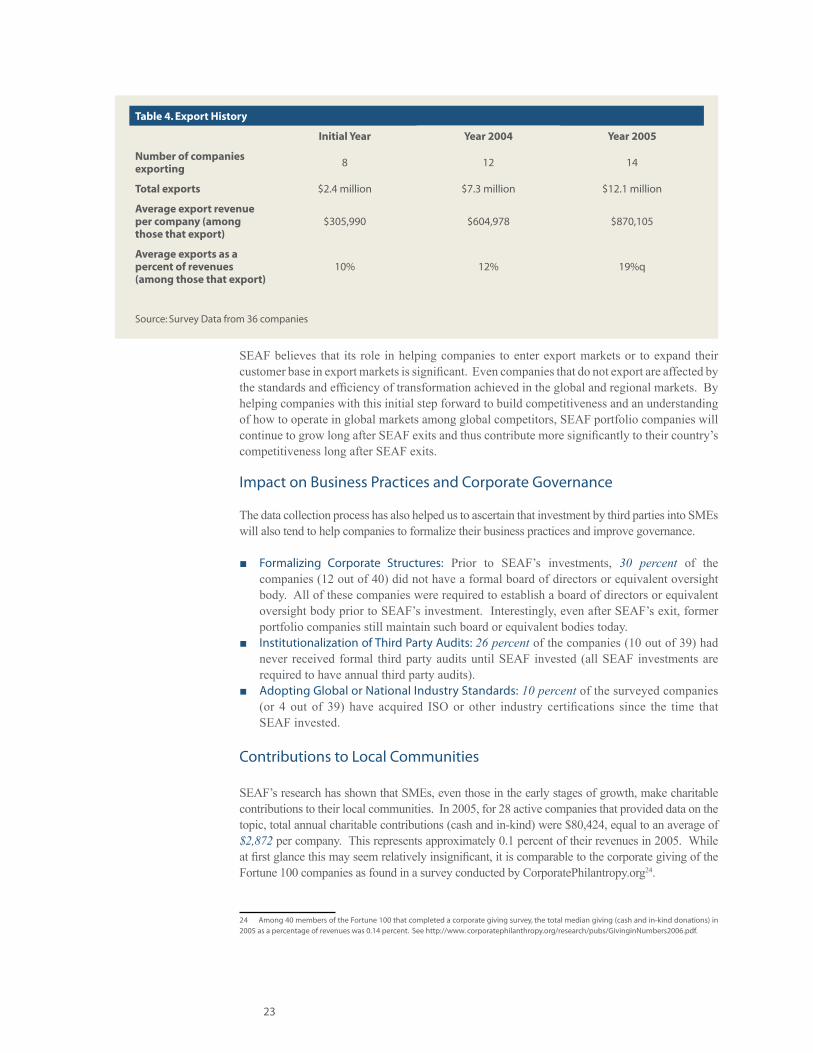
Empirical evidence demonstrates that SEAF has helped its portfolio companies to connect with the global market. A number of the companies in which SEAF has invested have begun exporting or have increased their exports since SEAF’s initial investment date. Out of a set of 36 companies with historical and current export data, eight companies exported at the time of SEAF’s investments, and 14 companies export today. This represents a 75 percent increase in the number of companies exporting. Six of the eight that exported at the time of SEAF’s investments have substantially increased their export revenues. Table 4, which presents the historical export revenues of the surveyed companies, shows that in addition to an increase in the number of companies exporting, there has been a significant increase in both the dollar amount exported and the percentage of revenues derived from exports. These figures have increased since the initial investment dates, as well as since last year.
23 This figure of seven percent excludes government subsidies received by the companies. The three Peruvian companies receive export sub-sidies and therefore have negative net contributions to the government.
Taxes
Unlike informal businesses, all of the surveyed SMEs contribute taxes to local governments (corporate income taxes, VAT, employee tax withholding, and/or others). Average of 7% of revenues paid as taxes in 2005.
Formal businesses (left) are more likely to pay taxes than informal
businesses (right).
23
SEAF believes that its role in helping companies to enter export markets or to expand their customer base in export markets is significant. Even companies that do not export are affected by the standards and efficiency of transformation achieved in the global and regional markets. By helping companies with this initial step forward to build competitiveness and an understanding of how to operate in global markets among global competitors, SEAF portfolio companies will continue to grow long after SEAF exits and thus contribute more significantly to their country’s competitiveness long after SEAF exits.
Impact on Business Practices and Corporate Governance
The data collection process has also helped us to ascertain that investment by third parties into SMEs will also tend to help companies to formalize their business practices and improve governance.
Formalizing Corporate Structures: ■ Prior to SEAF’s investments, 30 percent of the companies (12 out of 40) did not have a formal board of directors or equivalent oversight body. All of these companies were required to establish a board of directors or equivalent oversight body prior to SEAF’s investment. Interestingly, even after SEAF’s exit, former portfolio companies still maintain such board or equivalent bodies today. Institutionalization of Third Party Audits: ■ 26 percent of the companies (10 out of 39) had never received formal third party audits until SEAF invested (all SEAF investments are required to have annual third party audits).Adopting Global or National Industry Standards: ■ 10 percent of the surveyed companies (or 4 out of 39) have acquired ISO or other industry certifications since the time that SEAF invested.
Contributions to Local Communities
SEAF’s research has shown that SMEs, even those in the early stages of growth, make charitable contributions to their local communities. In 2005, for 28 active companies that provided data on the topic, total annual charitable contributions (cash and in-kind) were $80,424, equal to an average of $2,872 per company. This represents approximately 0.1 percent of their revenues in 2005. While at first glance this may seem relatively insignificant, it is comparable to the corporate giving of the Fortune 100 companies as found in a survey conducted by CorporatePhilantropy.org24.
24 Among 40 members of the Fortune 100 that completed a corporate giving survey, the total median giving (cash and in-kind donations) in 2005 as a percentage of revenues was 0.14 percent. See http://www. corporatephilanthropy.org/research/pubs/GivinginNumbers2006.pdf.
Table 4. Export History
Initial Year Year 2004 Year 2005
Number of companies exporting
8 12 14
Total exports $2.4 million $7.3 million $12.1 million
Average export revenue per company (among those that export)
$305,990 $604,978 $870,105
Average exports as a percent of revenues (among those that export)
10% 12% 19%q
Source: Survey Data from 36 companies
24
Contributions have included donations of cash and in-kind support for orphanages, retirement homes, anti-drug programs, sports events and sports clubs, town festivals, cultural events, and other good causes. For example, Perpetuum, an information technology company in Croatia, sponsors the Dubrovnik Summer Arts Festival, an association for the blind, and a local youth soccer team.
From the case studies, we found that SMEs make other valuable contributions to local communities through their operational activities, which are not captured in the figures above. Examples include: Artima, a Romanian supermarket chain which has contributed to the local infrastructure in the areas surrounding its stores; Gica, a Macedonian egg producer that restored an abandoned farm and built an access road shared by the local neighborhood; and PPZP, a Polish breeder of pigs that has made its own clean water system accessible to the neighboring village in rural northwest Poland. These examples and others are expanded upon in Chapter 3.
Despite the fact that SMEs are small, we believe they make contributions to their local communities because they are rooted in their communities and understand where even limited contributions can make a meaningful impact.
Improvement in Access to Capital
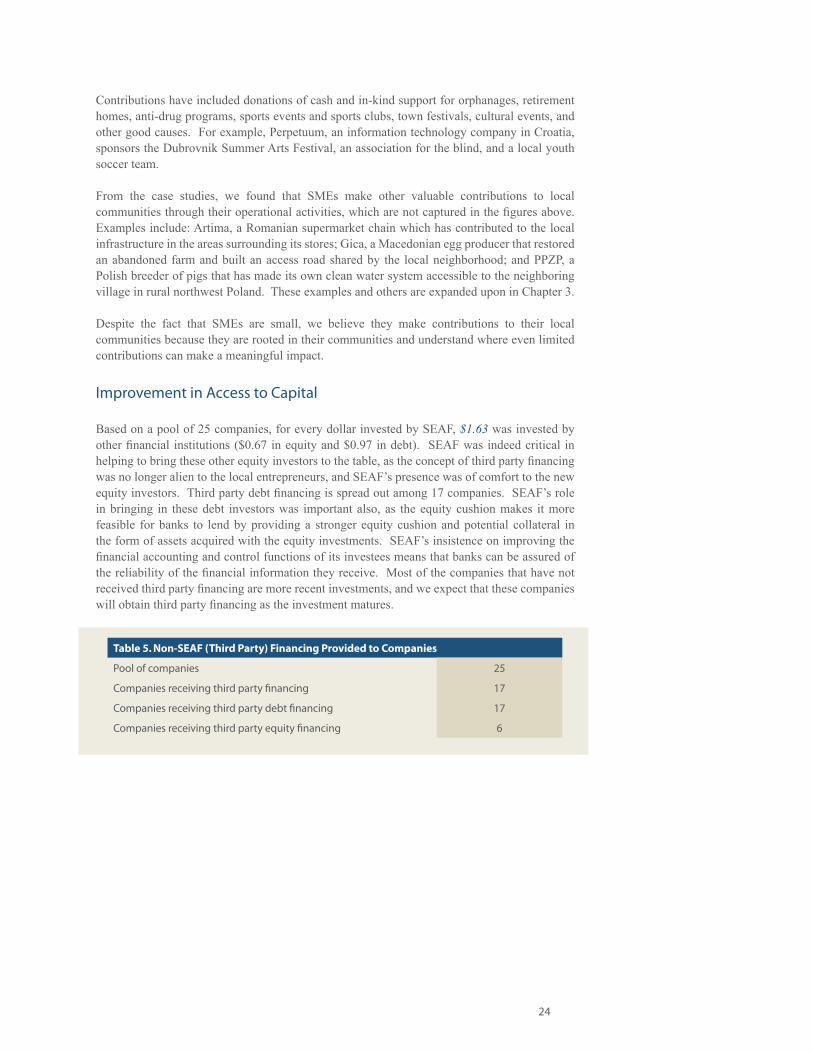
Based on a pool of 25 companies, for every dollar invested by SEAF, $1.63 was invested by other financial institutions ($0.67 in equity and $0.97 in debt). SEAF was indeed critical in helping to bring these other equity investors to the table, as the concept of third party financing was no longer alien to the local entrepreneurs, and SEAF’s presence was of comfort to the new equity investors. Third party debt financing is spread out among 17 companies. SEAF’s role in bringing in these debt investors was important also, as the equity cushion makes it more feasible for banks to lend by providing a stronger equity cushion and potential collateral in the form of assets acquired with the equity investments. SEAF’s insistence on improving the financial accounting and control functions of its investees means that banks can be assured of the reliability of the financial information they receive. Most of the companies that have not received third party financing are more recent investments, and we expect that these companies will obtain third party financing as the investment matures.
Table 5. Non-SEAF (Third Party) Financing Provided to Companies
Pool of companies 25
Companies receiving third party financing 17
Companies receiving third party debt financing 17
Companies receiving third party equity financing 6
25
Conclusion
The portfolio-wide data collection project is proving to be an effective means to verify on a larger scale the conclusions from our 2004 Study and to further quantify and understand the development impact of investing in SMEs on a routine and efficient basis. The case studies explore in detail the impact across stakeholders for a select set of companies, and these broader data collection results help to demonstrate that the case study conclusions do likely hold on a wider scale. By continuing to track this data on a yearly basis and gradually increasing the pool of companies that SEAF monitors, we hope to build an even deeper understanding of the role that SMEs can play in development.
The picture that has emerged from the data is that growth-oriented SMEs are able to perform effectively within the political and economic contexts in which they operate and, in doing so, connect employees, suppliers, customers, and governments. As the first stage of formality, SMEs are critical to their local and national governments, not only as payers of taxes and social security, but also as accountable counterparties for compliance with environmental, health and safety, and labor regulations. SMEs tend to hire unskilled and low-skilled people—often those without family connections or coming from poorer backgrounds. SMEs must train these employees to be able to compete with larger and global rivals, with the result that its employees gain skills, and therefore substantial increases in compensation. As demonstrated by SEAF’s financial performance (see “About SEAF” at the beginning of this report), SMEs—particularly SMEs that are open to accepting third party financing and the corporate governance and accountability that comes with such capital—can achieve high growth rates. In becoming successful and sustainable enterprises, they provide increasing value and choice to their customers, suppliers, and to people seeking employment in the communities in which they are located. In each of the foregoing ways, as well as those detailed throughout this chapter, SMEs are critical in providing greater hope and stability for the future of the developing world.
26
Chapter 2. Case Studies: Estimating the Multiplier EffectOverview
In the venture capital and private equity industries, returns to investors are typically measured with an Internal Rate of Return (IRR), which is a type of annual rate of return on the amount initially invested.25 Returns to investors can also be expressed as Net Present Value (NPV), which is the dollar amount generated over the life of the investment expressed in present value terms.26 While the results of the Data Survey provide valuable measures of the socioeconomic impact of SEAF’s investments beyond the financial returns, they do not clearly demonstrate to investors the full return or multiplier effect that they are achieving with their investments (that is, the financial return plus the additional, external social returns) in terms of the traditional industry measurements.
It was with this in mind that SEAF, thanks to the generosity of the Swiss Secretariat for Economic Cooperation and Development (SECO), the Ford Foundation, and the UK Department for International Development (DFID), conducted its case study work for the 2004 Study. SEAF conducted 10 in-depth case studies allowing it to estimate the social impact of its investees, incorporate them into a financial cash flow model for each company, and estimate the multiplier effect of SME investments in financial terms. The 2004 case study results showed that every dollar invested in the profiled companies generates on average an additional 10 dollars in the local economy27. Since 2004, SEAF has conducted 8 additional in-depth case studies. The combined result of the original 10 case studies and the 8 new case studies confirms the significant multiplier effect of the 2004 Study: On average, for all 18 cases, every dollar invested in the profiled companies generates 12 dollars in the local economy28. This reaffirms that SME investment can be a powerful vehicle for economic growth and poverty reduction
Each case study includes both a qualitative and quantitative component—the former to better understand the role that SMEs can play in the local economy and what the specific impacts of SMEs are, particularly those that are not quantifiable, and the latter to understand the scope of the impact, or the multiplier effect, vis a vis traditional financial returns. This chapter presents the methodology used for the quantitative component of the case studies, the selection of companies profiled, and further details and analysis of the quantitative results. The qualitative impacts are covered in Chapter 3.
25 Internal Rate of Return: The rate of return that would make the present value of future cash flows plus the final market value of an invest-ment equal the current market price of the investment.26 Net Present Value: The present value of an investment’s future net cash flows minus the initial investment.27 The case studies demonstrated a number of other benefits which were too difficult to quantify reliably, but which were nevertheless real benefits of the investment. SEAF used conservative assumptions for many of the key quantified benefits as well.28 At a zero percent discount rate.
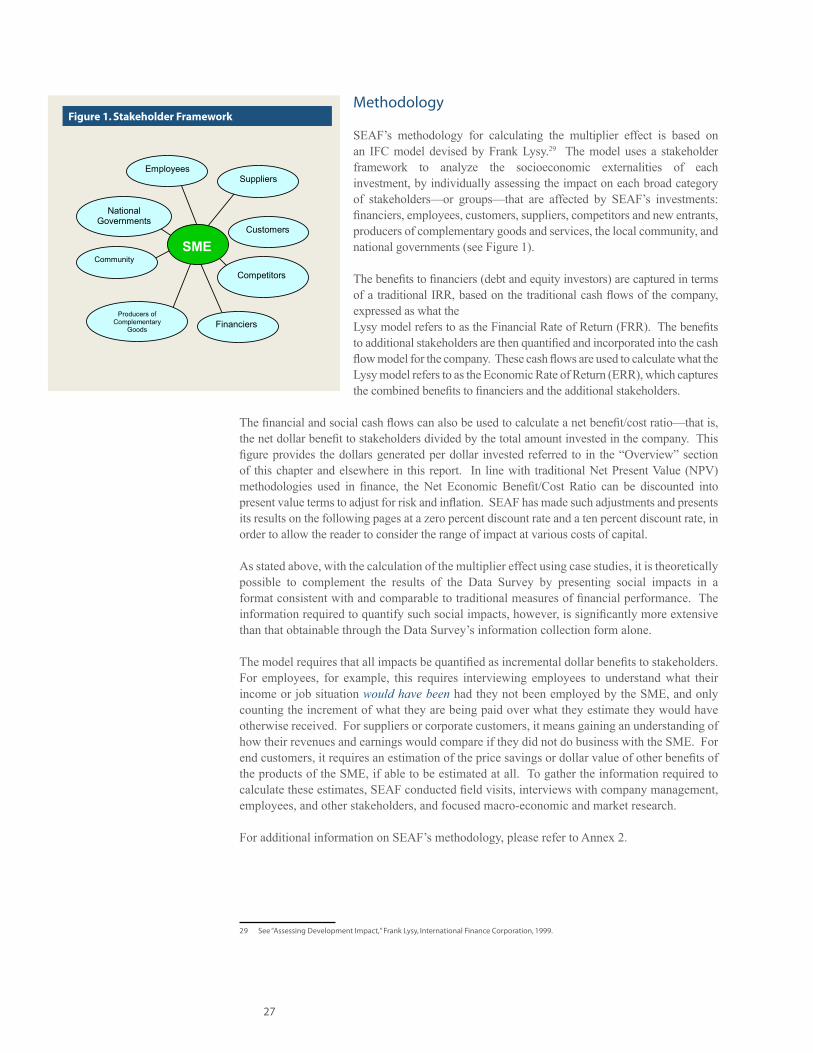
27
Methodology
SEAF’s methodology for calculating the multiplier effect is based on an IFC model devised by Frank Lysy.29 The model uses a stakeholder framework to analyze the socioeconomic externalities of each investment, by individually assessing the impact on each broad category of stakeholders—or groups—that are affected by SEAF’s investments: financiers, employees, customers, suppliers, competitors and new entrants, producers of complementary goods and services, the local community, and national governments (see Figure 1).
The benefits to financiers (debt and equity investors) are captured in terms of a traditional IRR, based on the traditional cash flows of the company, expressed as what theLysy model refers to as the Financial Rate of Return (FRR). The benefits to additional stakeholders are then quantified and incorporated into the cash flow model for the company. These cash flows are used to calculate what the Lysy model refers to as the Economic Rate of Return (ERR), which captures the combined benefits to financiers and the additional stakeholders.
The financial and social cash flows can also be used to calculate a net benefit/cost ratio—that is, the net dollar benefit to stakeholders divided by the total amount invested in the company. This figure provides the dollars generated per dollar invested referred to in the “Overview” section of this chapter and elsewhere in this report. In line with traditional Net Present Value (NPV) methodologies used in finance, the Net Economic Benefit/Cost Ratio can be discounted into present value terms to adjust for risk and inflation. SEAF has made such adjustments and presents its results on the following pages at a zero percent discount rate and a ten percent discount rate, in order to allow the reader to consider the range of impact at various costs of capital.
As stated above, with the calculation of the multiplier effect using case studies, it is theoretically possible to complement the results of the Data Survey by presenting social impacts in a format consistent with and comparable to traditional measures of financial performance. The information required to quantify such social impacts, however, is significantly more extensive than that obtainable through the Data Survey’s information collection form alone.
The model requires that all impacts be quantified as incremental dollar benefits to stakeholders. For employees, for example, this requires interviewing employees to understand what their income or job situation would have been had they not been employed by the SME, and only counting the increment of what they are being paid over what they estimate they would have otherwise received. For suppliers or corporate customers, it means gaining an understanding of how their revenues and earnings would compare if they did not do business with the SME. For end customers, it requires an estimation of the price savings or dollar value of other benefits of the products of the SME, if able to be estimated at all. To gather the information required to calculate these estimates, SEAF conducted field visits, interviews with company management, employees, and other stakeholders, and focused macro-economic and market research.
For additional information on SEAF’s methodology, please refer to Annex 2.
29 See “Assessing Development Impact,” Frank Lysy, International Finance Corporation, 1999.
Figure 1. Stakeholder Framework
Employees Suppliers
Financiers
Customers
Competitors
Producers of Complementary
Goods
Community
National Governments
SME
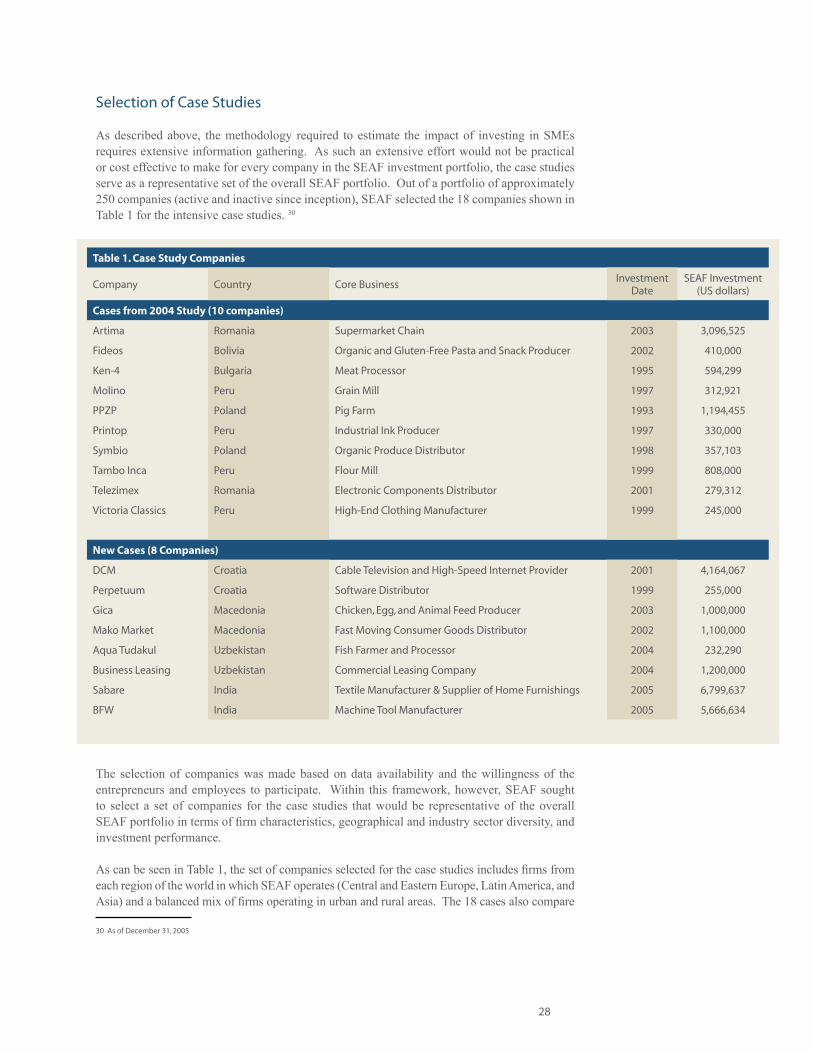
28
Selection of Case Studies
As described above, the methodology required to estimate the impact of investing in SMEs requires extensive information gathering. As such an extensive effort would not be practical or cost effective to make for every company in the SEAF investment portfolio, the case studies serve as a representative set of the overall SEAF portfolio. Out of a portfolio of approximately 250 companies (active and inactive since inception), SEAF selected the 18 companies shown in Table 1 for the intensive case studies. 30
The selection of companies was made based on data availability and the willingness of the entrepreneurs and employees to participate. Within this framework, however, SEAF sought to select a set of companies for the case studies that would be representative of the overall SEAF portfolio in terms of firm characteristics, geographical and industry sector diversity, and investment performance.
As can be seen in Table 1, the set of companies selected for the case studies includes firms from each region of the world in which SEAF operates (Central and Eastern Europe, Latin America, and Asia) and a balanced mix of firms operating in urban and rural areas. The 18 cases also compare
30 As of December 31, 2005
Table 1. Case Study Companies
Company Country Core BusinessInvestment
DateSEAF Investment
(US dollars)
Cases from 2004 Study (10 companies)
Artima Romania Supermarket Chain 2003 3,096,525
Fideos Bolivia Organic and Gluten-Free Pasta and Snack Producer 2002 410,000
Ken-4 Bulgaria Meat Processor 1995 594,299
Molino Peru Grain Mill 1997 312,921
PPZP Poland Pig Farm 1993 1,194,455
Printop Peru Industrial Ink Producer 1997 330,000
Symbio Poland Organic Produce Distributor 1998 357,103
Tambo Inca Peru Flour Mill 1999 808,000
Telezimex Romania Electronic Components Distributor 2001 279,312
Victoria Classics Peru High-End Clothing Manufacturer 1999 245,000
New Cases (8 Companies)
DCM Croatia Cable Television and High-Speed Internet Provider 2001 4,164,067
Perpetuum Croatia Software Distributor 1999 255,000
Gica Macedonia Chicken, Egg, and Animal Feed Producer 2003 1,000,000
Mako Market Macedonia Fast Moving Consumer Goods Distributor 2002 1,100,000
Aqua Tudakul Uzbekistan Fish Farmer and Processor 2004 232,290
Business Leasing Uzbekistan Commercial Leasing Company 2004 1,200,000
Sabare India Textile Manufacturer & Supplier of Home Furnishings 2005 6,799,637
BFW India Machine Tool Manufacturer 2005 5,666,634
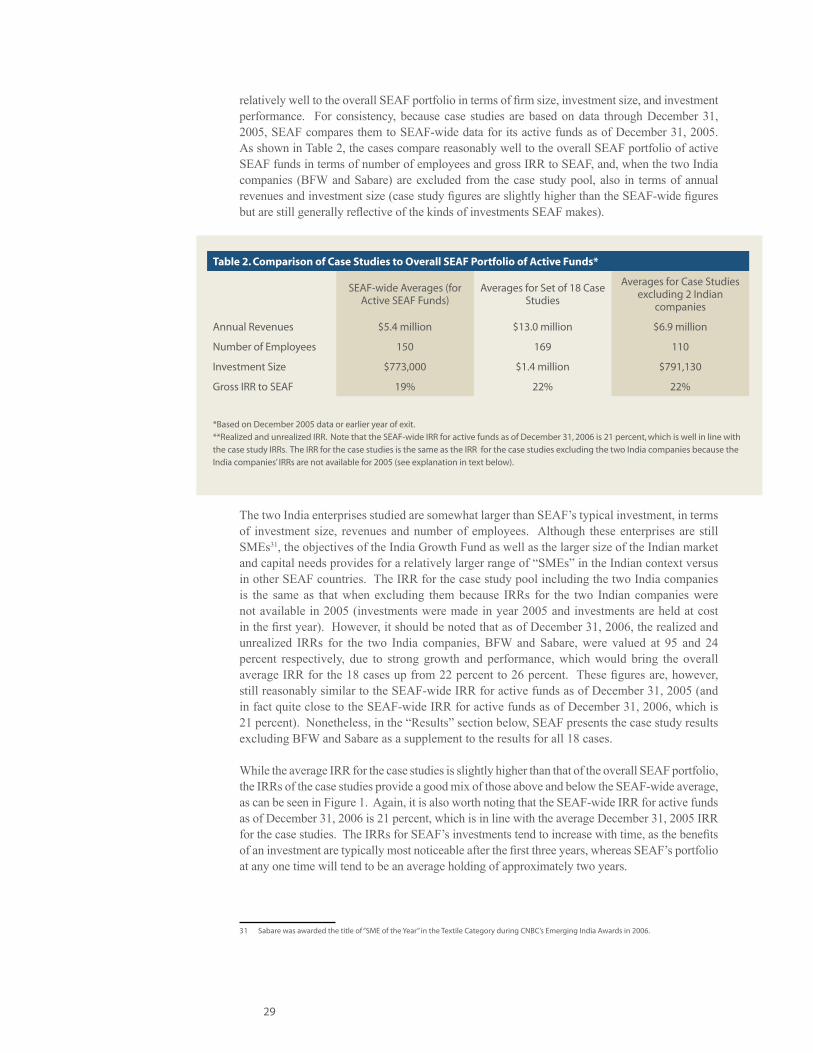
29
relatively well to the overall SEAF portfolio in terms of firm size, investment size, and investment performance. For consistency, because case studies are based on data through December 31, 2005, SEAF compares them to SEAF-wide data for its active funds as of December 31, 2005. As shown in Table 2, the cases compare reasonably well to the overall SEAF portfolio of active SEAF funds in terms of number of employees and gross IRR to SEAF, and, when the two India companies (BFW and Sabare) are excluded from the case study pool, also in terms of annual revenues and investment size (case study figures are slightly higher than the SEAF-wide figures but are still generally reflective of the kinds of investments SEAF makes).
The two India enterprises studied are somewhat larger than SEAF’s typical investment, in terms of investment size, revenues and number of employees. Although these enterprises are still SMEs31, the objectives of the India Growth Fund as well as the larger size of the Indian market and capital needs provides for a relatively larger range of “SMEs” in the Indian context versus in other SEAF countries. The IRR for the case study pool including the two India companies is the same as that when excluding them because IRRs for the two Indian companies were not available in 2005 (investments were made in year 2005 and investments are held at cost in the first year). However, it should be noted that as of December 31, 2006, the realized and unrealized IRRs for the two India companies, BFW and Sabare, were valued at 95 and 24 percent respectively, due to strong growth and performance, which would bring the overall average IRR for the 18 cases up from 22 percent to 26 percent. These figures are, however, still reasonably similar to the SEAF-wide IRR for active funds as of December 31, 2005 (and in fact quite close to the SEAF-wide IRR for active funds as of December 31, 2006, which is 21 percent). Nonetheless, in the “Results” section below, SEAF presents the case study results excluding BFW and Sabare as a supplement to the results for all 18 cases.
While the average IRR for the case studies is slightly higher than that of the overall SEAF portfolio, the IRRs of the case studies provide a good mix of those above and below the SEAF-wide average, as can be seen in Figure 1. Again, it is also worth noting that the SEAF-wide IRR for active funds as of December 31, 2006 is 21 percent, which is in line with the average December 31, 2005 IRR for the case studies. The IRRs for SEAF’s investments tend to increase with time, as the benefits of an investment are typically most noticeable after the first three years, whereas SEAF’s portfolio at any one time will tend to be an average holding of approximately two years.
31 Sabare was awarded the title of “SME of the Year” in the Textile Category during CNBC’s Emerging India Awards in 2006.
Table 2. Comparison of Case Studies to Overall SEAF Portfolio of Active Funds*
SEAF-wide Averages (for Active SEAF Funds)
Averages for Set of 18 Case Studies
Averages for Case Studies excluding 2 Indian
companies
Annual Revenues $5.4 million $13.0 million $6.9 million
Number of Employees 150 169 110
Investment Size $773,000 $1.4 million $791,130
Gross IRR to SEAF 19% 22% 22%
*Based on December 2005 data or earlier year of exit.
**Realized and unrealized IRR. Note that the SEAF-wide IRR for active funds as of December 31, 2006 is 21 percent, which is well in line with
the case study IRRs. The IRR for the case studies is the same as the IRR for the case studies excluding the two India companies because the
India companies’ IRRs are not available for 2005 (see explanation in text below).
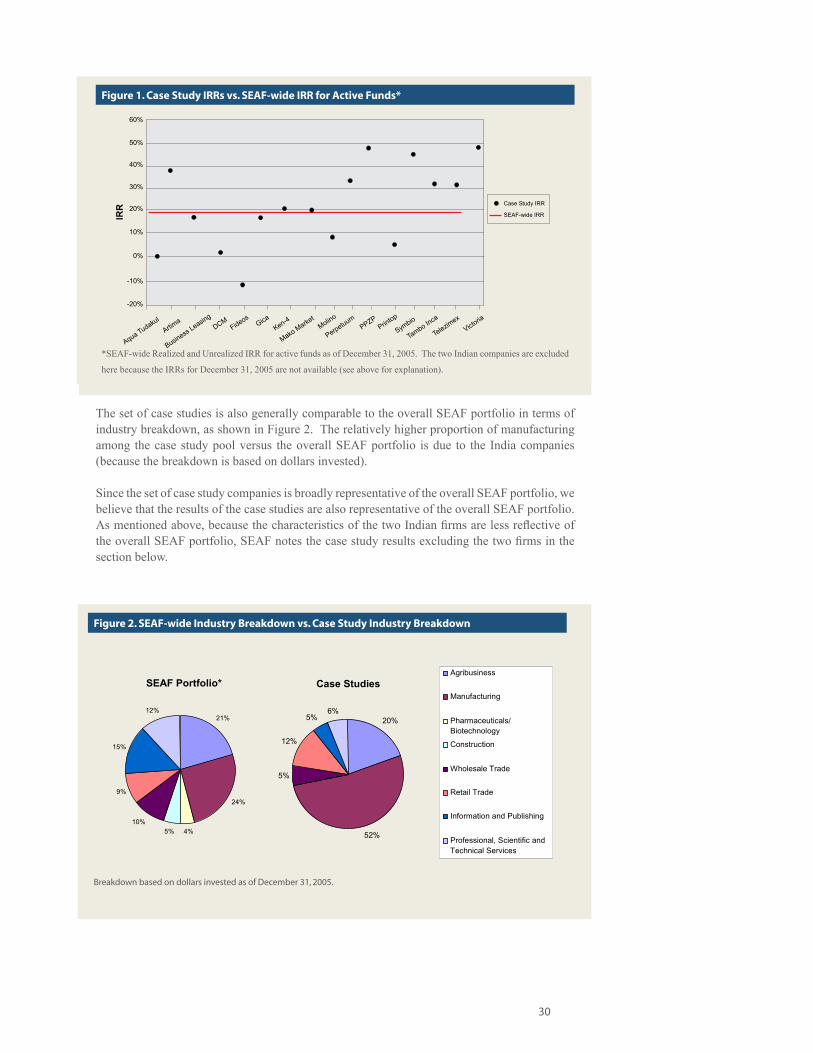
30
The set of case studies is also generally comparable to the overall SEAF portfolio in terms of industry breakdown, as shown in Figure 2. The relatively higher proportion of manufacturing among the case study pool versus the overall SEAF portfolio is due to the India companies (because the breakdown is based on dollars invested).
Since the set of case study companies is broadly representative of the overall SEAF portfolio, we believe that the results of the case studies are also representative of the overall SEAF portfolio. As mentioned above, because the characteristics of the two Indian firms are less reflective of the overall SEAF portfolio, SEAF notes the case study results excluding the two firms in the section below.
Figure 2. SEAF-wide Industry Breakdown vs. Case Study Industry Breakdown
Breakdown based on dollars invested as of December 31, 2005.
Case Studies
20%
52%
5%
12%
5% 6%
Agribusiness
Manufacturing
Pharmaceuticals/ Biotechnology Construction
Wholesale Trade
Retail Trade
Information and Publishing
Professional, Scientific and Technical Services
SEAF Portfolio*
21%
24%
4% 5% 10%
9%
15%
12%
Figure 1. Case Study IRRs vs. SEAF-wide IRR for Active Funds*
*SEAF-wide Realized and Unrealized IRR for active funds as of December 31, 2005. The two Indian companies are excluded
here because the IRRs for December 31, 2005 are not available (see above for explanation).
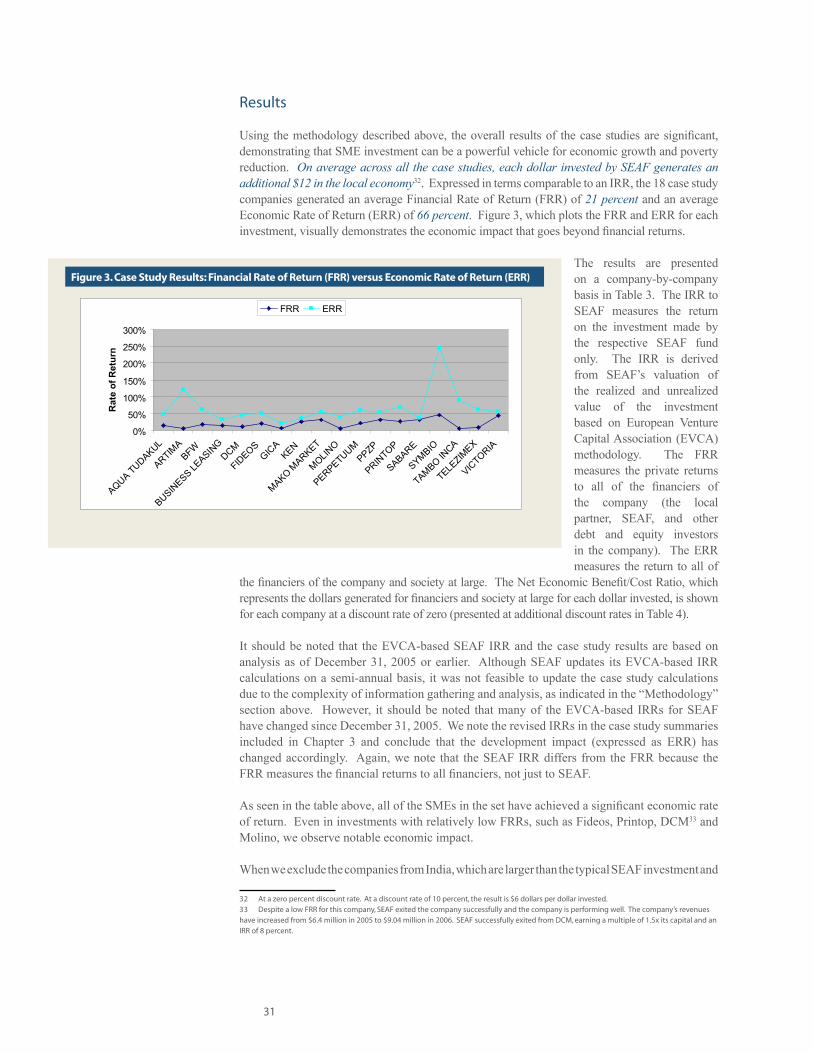
31
Results
Using the methodology described above, the overall results of the case studies are significant, demonstrating that SME investment can be a powerful vehicle for economic growth and poverty reduction. On average across all the case studies, each dollar invested by SEAF generates an additional $12 in the local economy32. Expressed in terms comparable to an IRR, the 18 case study companies generated an average Financial Rate of Return (FRR) of 21 percent and an average Economic Rate of Return (ERR) of 66 percent. Figure 3, which plots the FRR and ERR for each investment, visually demonstrates the economic impact that goes beyond financial returns.
The results are presented on a company-by-company basis in Table 3. The IRR to SEAF measures the return on the investment made by the respective SEAF fund only. The IRR is derived from SEAF’s valuation of the realized and unrealized value of the investment based on European Venture Capital Association (EVCA) methodology. The FRR measures the private returns to all of the financiers of the company (the local partner, SEAF, and other debt and equity investors in the company). The ERR measures the return to all of
the financiers of the company and society at large. The Net Economic Benefit/Cost Ratio, which represents the dollars generated for financiers and society at large for each dollar invested, is shown for each company at a discount rate of zero (presented at additional discount rates in Table 4).
It should be noted that the EVCA-based SEAF IRR and the case study results are based on analysis as of December 31, 2005 or earlier. Although SEAF updates its EVCA-based IRR calculations on a semi-annual basis, it was not feasible to update the case study calculations due to the complexity of information gathering and analysis, as indicated in the “Methodology” section above. However, it should be noted that many of the EVCA-based IRRs for SEAF have changed since December 31, 2005. We note the revised IRRs in the case study summaries included in Chapter 3 and conclude that the development impact (expressed as ERR) has changed accordingly. Again, we note that the SEAF IRR differs from the FRR because the FRR measures the financial returns to all financiers, not just to SEAF.
As seen in the table above, all of the SMEs in the set have achieved a significant economic rate of return. Even in investments with relatively low FRRs, such as Fideos, Printop, DCM33 and Molino, we observe notable economic impact.
When we exclude the companies from India, which are larger than the typical SEAF investment and
32 At a zero percent discount rate. At a discount rate of 10 percent, the result is $6 dollars per dollar invested.33 Despite a low FRR for this company, SEAF exited the company successfully and the company is performing well. The company’s revenues have increased from $6.4 million in 2005 to $9.04 million in 2006. SEAF successfully exited from DCM, earning a multiple of 1.5x its capital and an IRR of 8 percent.
Figure 3. Case Study Results: Financial Rate of Return (FRR) versus Economic Rate of Return (ERR)
0%
50%
100%
150%
200%
250%
300%
AQUA TUDAKUL
ARTIMA
BFW
BUSINESS LE
ASING
DCM
FIDEOS
GICA
KEN
MAKO MARKET
MOLINO
PERPETUUMPPZP
PRINTOP
SABARE
SYMBIO
TAMBO INCA
TELEZIMEX
VICTORIA
Rat
e of
Ret
urn
FRR ERR
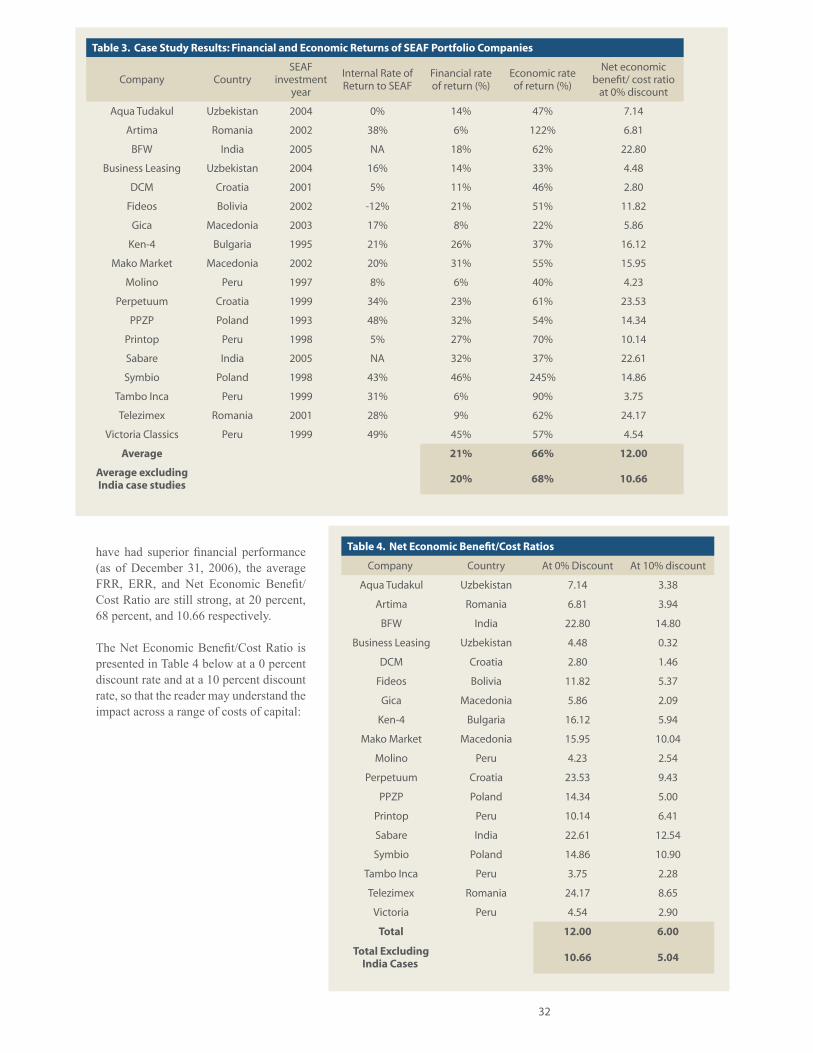
32
have had superior financial performance (as of December 31, 2006), the average FRR, ERR, and Net Economic Benefit/Cost Ratio are still strong, at 20 percent, 68 percent, and 10.66 respectively.
The Net Economic Benefit/Cost Ratio is presented in Table 4 below at a 0 percent discount rate and at a 10 percent discount rate, so that the reader may understand the impact across a range of costs of capital:
Table 3. Case Study Results: Financial and Economic Returns of SEAF Portfolio Companies
Company CountrySEAF
investment year
Internal Rate of Return to SEAF
Financial rate of return (%)
Economic rate of return (%)
Net economic benefit/ cost ratio
at 0% discount
Aqua Tudakul Uzbekistan 2004 0% 14% 47% 7.14
Artima Romania 2002 38% 6% 122% 6.81
BFW India 2005 NA 18% 62% 22.80
Business Leasing Uzbekistan 2004 16% 14% 33% 4.48
DCM Croatia 2001 5% 11% 46% 2.80
Fideos Bolivia 2002 -12% 21% 51% 11.82
Gica Macedonia 2003 17% 8% 22% 5.86
Ken-4 Bulgaria 1995 21% 26% 37% 16.12
Mako Market Macedonia 2002 20% 31% 55% 15.95
Molino Peru 1997 8% 6% 40% 4.23
Perpetuum Croatia 1999 34% 23% 61% 23.53
PPZP Poland 1993 48% 32% 54% 14.34
Printop Peru 1998 5% 27% 70% 10.14
Sabare India 2005 NA 32% 37% 22.61
Symbio Poland 1998 43% 46% 245% 14.86
Tambo Inca Peru 1999 31% 6% 90% 3.75
Telezimex Romania 2001 28% 9% 62% 24.17
Victoria Classics Peru 1999 49% 45% 57% 4.54
Average 21% 66% 12.00
Average excluding India case studies
20% 68% 10.66
Table 4. Net Economic Benefit/Cost Ratios
Company Country At 0% Discount At 10% discount
Aqua Tudakul Uzbekistan 7.14 3.38
Artima Romania 6.81 3.94
BFW India 22.80 14.80
Business Leasing Uzbekistan 4.48 0.32
DCM Croatia 2.80 1.46
Fideos Bolivia 11.82 5.37
Gica Macedonia 5.86 2.09
Ken-4 Bulgaria 16.12 5.94
Mako Market Macedonia 15.95 10.04
Molino Peru 4.23 2.54
Perpetuum Croatia 23.53 9.43
PPZP Poland 14.34 5.00
Printop Peru 10.14 6.41
Sabare India 22.61 12.54
Symbio Poland 14.86 10.90
Tambo Inca Peru 3.75 2.28
Telezimex Romania 24.17 8.65
Victoria Peru 4.54 2.90
Total 12.00 6.00
Total Excluding India Cases
10.66 5.04
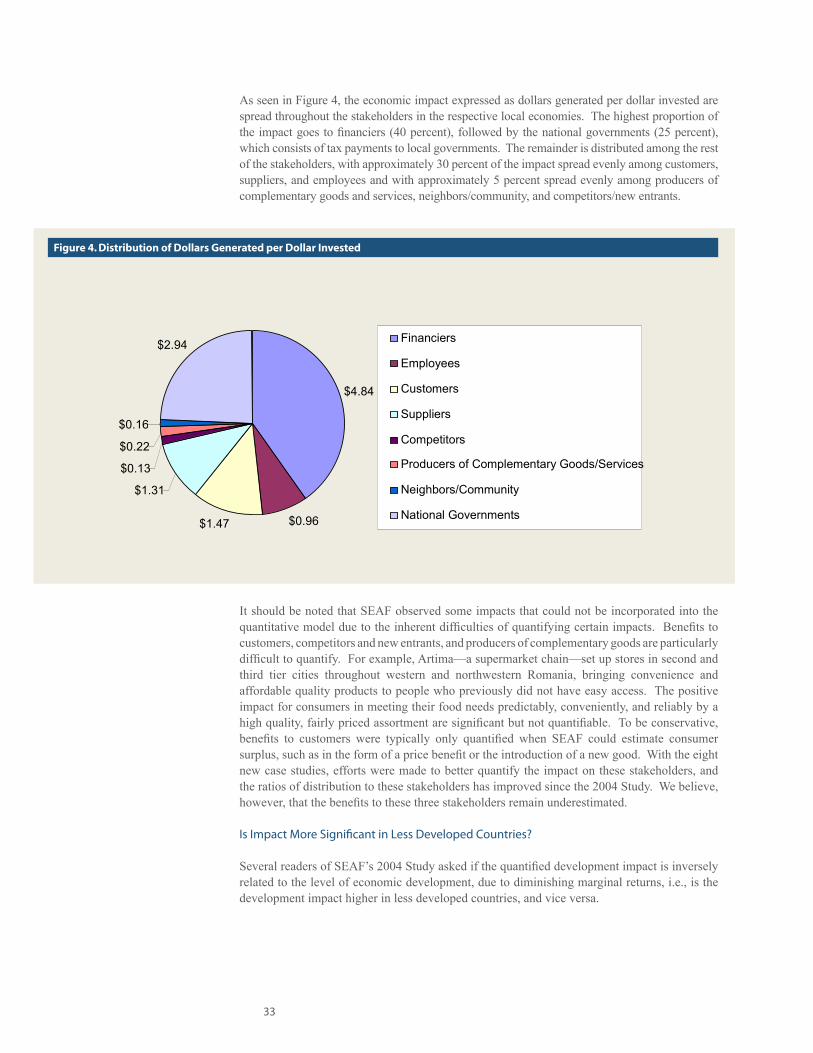
33
As seen in Figure 4, the economic impact expressed as dollars generated per dollar invested are spread throughout the stakeholders in the respective local economies. The highest proportion of the impact goes to financiers (40 percent), followed by the national governments (25 percent), which consists of tax payments to local governments. The remainder is distributed among the rest of the stakeholders, with approximately 30 percent of the impact spread evenly among customers, suppliers, and employees and with approximately 5 percent spread evenly among producers of complementary goods and services, neighbors/community, and competitors/new entrants.
It should be noted that SEAF observed some impacts that could not be incorporated into the quantitative model due to the inherent difficulties of quantifying certain impacts. Benefits to customers, competitors and new entrants, and producers of complementary goods are particularly difficult to quantify. For example, Artima—a supermarket chain—set up stores in second and third tier cities throughout western and northwestern Romania, bringing convenience and affordable quality products to people who previously did not have easy access. The positive impact for consumers in meeting their food needs predictably, conveniently, and reliably by a high quality, fairly priced assortment are significant but not quantifiable. To be conservative, benefits to customers were typically only quantified when SEAF could estimate consumer surplus, such as in the form of a price benefit or the introduction of a new good. With the eight new case studies, efforts were made to better quantify the impact on these stakeholders, and the ratios of distribution to these stakeholders has improved since the 2004 Study. We believe, however, that the benefits to these three stakeholders remain underestimated.
Is Impact More Significant in Less Developed Countries?
Several readers of SEAF’s 2004 Study asked if the quantified development impact is inversely related to the level of economic development, due to diminishing marginal returns, i.e., is the development impact higher in less developed countries, and vice versa.
Figure 4. Distribution of Dollars Generated per Dollar Invested
$4.84
$0.96 $1.47
$1.31 $0.13 $0.22 $0.16
$2.94 Financiers Employees Customers Suppliers Competitors Producers of Complementary Goods/Services Neighbors/Community National Governments
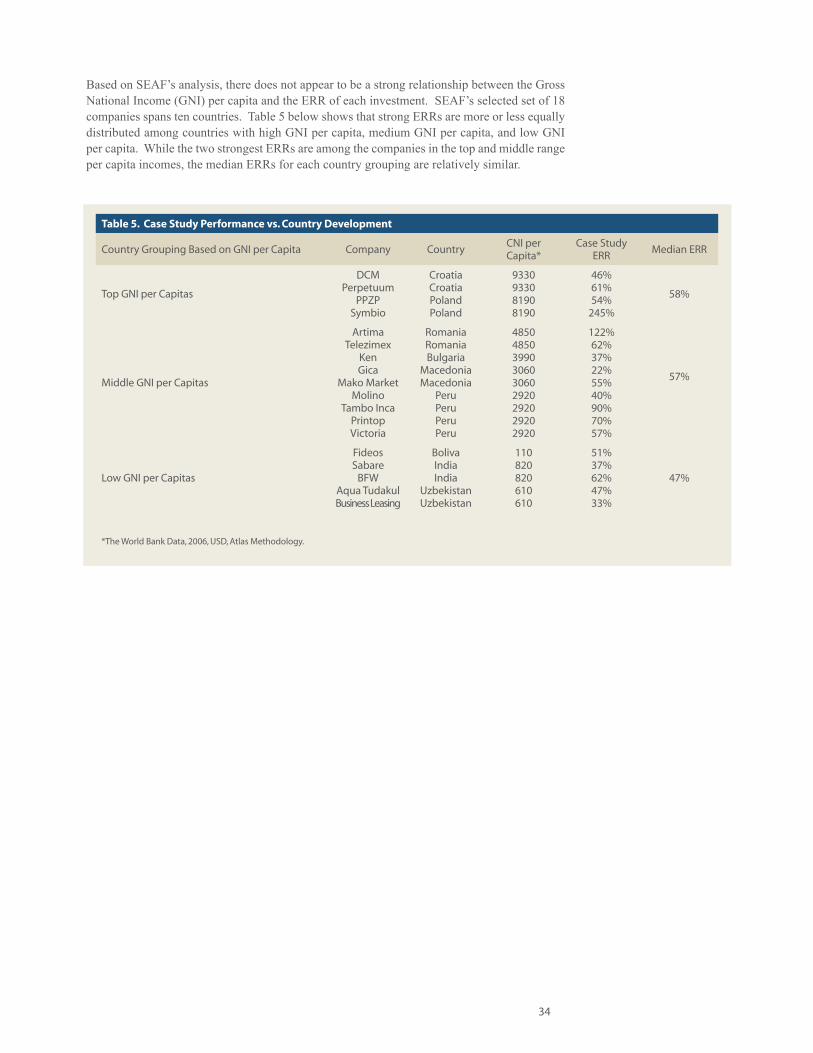
34
Based on SEAF’s analysis, there does not appear to be a strong relationship between the Gross National Income (GNI) per capita and the ERR of each investment. SEAF’s selected set of 18 companies spans ten countries. Table 5 below shows that strong ERRs are more or less equally distributed among countries with high GNI per capita, medium GNI per capita, and low GNI per capita. While the two strongest ERRs are among the companies in the top and middle range per capita incomes, the median ERRs for each country grouping are relatively similar.
Table 5. Case Study Performance vs. Country Development
Country Grouping Based on GNI per Capita Company CountryCNI per Capita*
Case Study ERR
Median ERR
Top GNI per Capitas
DCMPerpetuum
PPZPSymbio
CroatiaCroatiaPolandPoland
9330933081908190
46%61%54%
245%
58%
Middle GNI per Capitas
ArtimaTelezimex
KenGica
Mako MarketMolino
Tambo IncaPrintopVictoria
RomaniaRomaniaBulgaria
MacedoniaMacedonia
PeruPeruPeruPeru
485048503990306030602920292029202920
122%62%37%22%55%40%90%70%57%
57%
Low GNI per Capitas
FideosSabare
BFWAqua TudakulBusiness Leasing
BolivaIndiaIndia
UzbekistanUzbekistan
110820820610610
51%37%62%47%33%
47%
*The World Bank Data, 2006, USD, Atlas Methodology.
35
Chapter 3. Case Studies: Stories of Economic TransformationsIntroduction
SEAF’s case studies capture not only quantifiable impacts from the case study multiplier effect estimate, but also personal stories and other impacts. Through an extensive information gathering process, including field work, interviews with employees and other stakeholders, and market research, SEAF has collected numerous testimonies about the transformations that have resulted from investments into SMEs:
Improving Lives of Employees
Employees of the profiled SMEs truly value the stability of their employment and payment ■of health and social welfare benefits. Previously, many employees were either unemployed or working informally, often without regular pay or benefits.
Confident about the stability of their jobs, employees are able to provide for their families, ■invest in tangible assets, and save for their children’s future.
Most of the SMEs invest heavily in employee training, thus helping employees to advance ■to higher skill levels, earn higher salaries, and gain the security of skill mobility. While our research shows that unemployment rates in the profiled companies are high, managers of the profiled companies explained that it is nevertheless very difficult to find appropriately skilled labor and that they face a more difficult time attracting skilled personnel than do larger companies. It is as a result of this that SME mangers compensate by investing in training for their own, initially less skilled employees.
Creating Business and New Opportunities for Suppliers
Suppliers benefit not only from increased business from SMEs, but also from the support ■and incentives provided to help them improve their performance and expand capacity.
Micro-suppliers and micro-entrepreneurs profit from the supply-chain linkages provided by ■SMEs. By purchasing and aggregating the products of micro-suppliers and providing them with market expertise and other value-added services and support, SMEs serve as a point of access for micro-suppliers and micro-entrepreneurs to revenue streams from larger urban, national or regional enterprises and to regional and even global export markets.
Spreading New Technologies and Innovative Practices to Other Players in the Market
Positive impacts on customers can include more choice, better quality goods, and lower prices. ■Entrepreneurs of local SME are uniquely rooted in their local communities and as such are well positioned to identify unmet local consumer demands and, with the help of financing and strategic support, work with other stakeholders to address market deficiencies.
Competitors can profit from demonstration and network effects, while producers of ■complementary goods may see an increase in demand for their products resulting from an investee’s success and growth.
36
Benefit to Local Communities and the Rest of Society
As part of formalization, SMEs play a role in tackling community problems by contributing ■to local tax revenues. Depending on local government priorities, these could include infrastructure, education, or public health.
Most often as prominent, formal businesses in their local communities, entrepreneurs and ■their SMEs contribute actively to community activities and charities, and are typically well respected as investors in community development. Examples include contributions to infrastructure (roads or parks), or to local causes (orphanages, schools, or cultural activities).
The case study summaries on the following pages provide testimony, through company-specific examples, of the transformations described above.
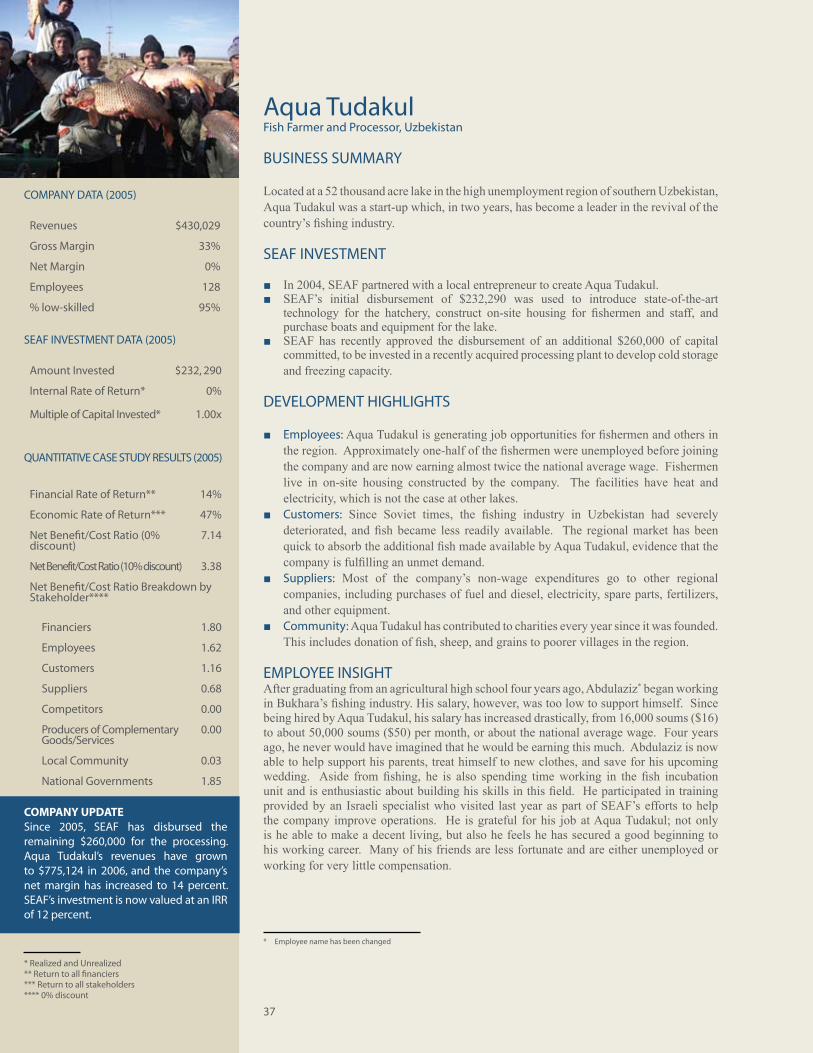
37
Aqua Tudakul Fish Farmer and Processor, Uzbekistan
BUSINESS SUMMARY
Located at a 52 thousand acre lake in the high unemployment region of southern Uzbekistan, Aqua Tudakul was a start-up which, in two years, has become a leader in the revival of the country’s fishing industry.
SEAF INVESTMENT
In 2004, SEAF partnered with a local entrepreneur to create Aqua Tudakul. ■SEAF’s initial disbursement of $232,290 was used to introduce state-of-the-art ■technology for the hatchery, construct on-site housing for fishermen and staff, and purchase boats and equipment for the lake.SEAF has recently approved the disbursement of an additional $260,000 of capital ■committed, to be invested in a recently acquired processing plant to develop cold storage and freezing capacity.
DEVELOPMENT HIGHLIGHTS
Employees: ■ Aqua Tudakul is generating job opportunities for fishermen and others in the region. Approximately one-half of the fishermen were unemployed before joining the company and are now earning almost twice the national average wage. Fishermen live in on-site housing constructed by the company. The facilities have heat and electricity, which is not the case at other lakes. Customers: ■ Since Soviet times, the fishing industry in Uzbekistan had severely deteriorated, and fish became less readily available. The regional market has been quick to absorb the additional fish made available by Aqua Tudakul, evidence that the company is fulfilling an unmet demand. Suppliers: ■ Most of the company’s non-wage expenditures go to other regional companies, including purchases of fuel and diesel, electricity, spare parts, fertilizers, and other equipment. Community: ■ Aqua Tudakul has contributed to charities every year since it was founded. This includes donation of fish, sheep, and grains to poorer villages in the region.
EMPLOYEE INSIGHTAfter graduating from an agricultural high school four years ago, Abdulaziz* began working in Bukhara’s fishing industry. His salary, however, was too low to support himself. Since being hired by Aqua Tudakul, his salary has increased drastically, from 16,000 soums ($16) to about 50,000 soums ($50) per month, or about the national average wage. Four years ago, he never would have imagined that he would be earning this much. Abdulaziz is now able to help support his parents, treat himself to new clothes, and save for his upcoming wedding. Aside from fishing, he is also spending time working in the fish incubation unit and is enthusiastic about building his skills in this field. He participated in training provided by an Israeli specialist who visited last year as part of SEAF’s efforts to help the company improve operations. He is grateful for his job at Aqua Tudakul; not only is he able to make a decent living, but also he feels he has secured a good beginning to his working career. Many of his friends are less fortunate and are either unemployed or working for very little compensation.
COMPANY DATA (2005)
Revenues $430,029
Gross Margin 33%
Net Margin 0%
Employees 128
% low-skilled 95%
SEAF INVESTMENT DATA (2005)
Amount Invested $232, 290
Internal Rate of Return* 0%
Multiple of Capital Invested* 1.00x
QUANTITATIVE CASE STUDY RESULTS (2005)
Financial Rate of Return** 14%
Economic Rate of Return*** 47%
Net Benefit/Cost Ratio (0% discount)
7.14
Net Benefit/Cost Ratio (10% discount) 3.38
Net Benefit/Cost Ratio Breakdown by Stakeholder****
Financiers 1.80
Employees 1.62
Customers 1.16
Suppliers 0.68
Competitors 0.00
Producers of Complementary Goods/Services
0.00
Local Community 0.03
National Governments 1.85
COMPANY UPDATESince 2005, SEAF has disbursed the remaining $260,000 for the processing. Aqua Tudakul’s revenues have grown to $775,124 in 2006, and the company’s net margin has increased to 14 percent. SEAF’s investment is now valued at an IRR of 12 percent.
* Realized and Unrealized** Return to all financiers*** Return to all stakeholders**** 0% discount
* Employee name has been changed
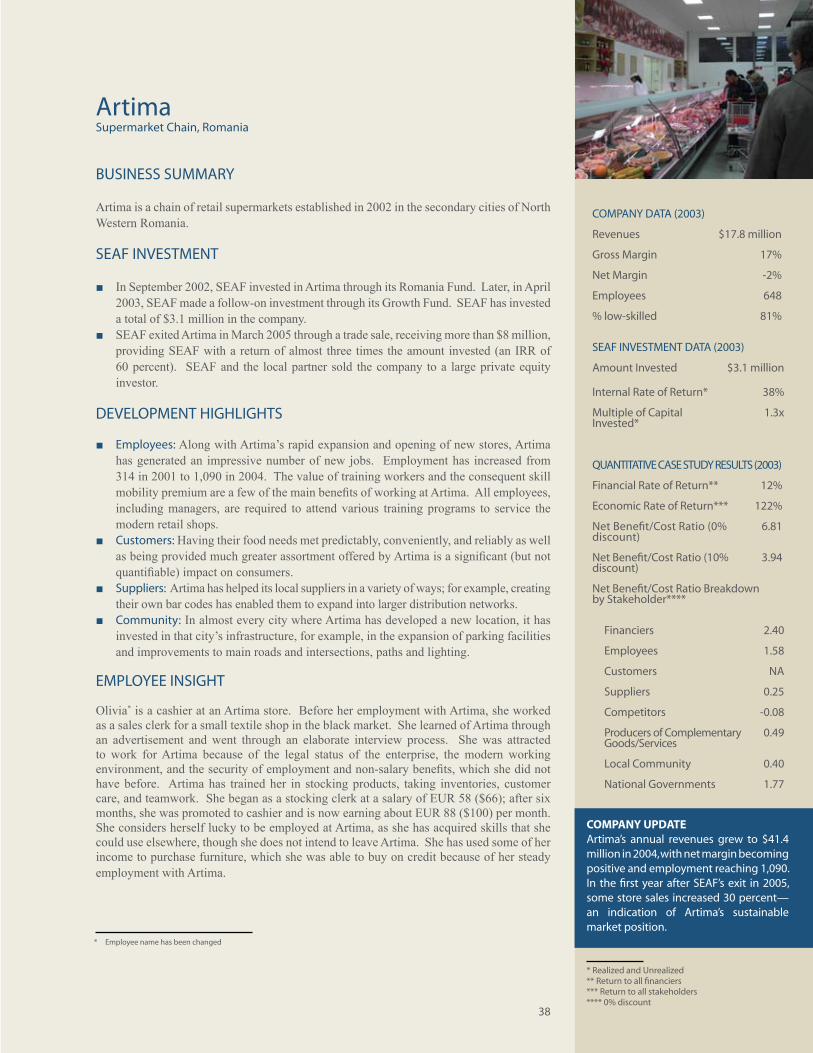
38
ArtimaSupermarket Chain, Romania
BUSINESS SUMMARY
Artima is a chain of retail supermarkets established in 2002 in the secondary cities of North Western Romania.
SEAF INVESTMENT
In September 2002, SEAF invested in Artima through its Romania Fund. Later, in April ■2003, SEAF made a follow-on investment through its Growth Fund. SEAF has invested a total of $3.1 million in the company. SEAF exited Artima in March 2005 through a trade sale, receiving more than $8 million, ■providing SEAF with a return of almost three times the amount invested (an IRR of 60 percent). SEAF and the local partner sold the company to a large private equity investor.
DEVELOPMENT HIGHLIGHTS
Employees: ■ Along with Artima’s rapid expansion and opening of new stores, Artima has generated an impressive number of new jobs. Employment has increased from 314 in 2001 to 1,090 in 2004. The value of training workers and the consequent skill mobility premium are a few of the main benefits of working at Artima. All employees, including managers, are required to attend various training programs to service the modern retail shops.Customers: ■ Having their food needs met predictably, conveniently, and reliably as well as being provided much greater assortment offered by Artima is a significant (but not quantifiable) impact on consumers. Suppliers: ■ Artima has helped its local suppliers in a variety of ways; for example, creating their own bar codes has enabled them to expand into larger distribution networks. Community: ■ In almost every city where Artima has developed a new location, it has invested in that city’s infrastructure, for example, in the expansion of parking facilities and improvements to main roads and intersections, paths and lighting.
EMPLOYEE INSIGHT
Olivia* is a cashier at an Artima store. Before her employment with Artima, she worked as a sales clerk for a small textile shop in the black market. She learned of Artima through an advertisement and went through an elaborate interview process. She was attracted to work for Artima because of the legal status of the enterprise, the modern working environment, and the security of employment and non-salary benefits, which she did not have before. Artima has trained her in stocking products, taking inventories, customer care, and teamwork. She began as a stocking clerk at a salary of EUR 58 ($66); after six months, she was promoted to cashier and is now earning about EUR 88 ($100) per month. She considers herself lucky to be employed at Artima, as she has acquired skills that she could use elsewhere, though she does not intend to leave Artima. She has used some of her income to purchase furniture, which she was able to buy on credit because of her steady employment with Artima.
COMPANY DATA (2003)
Revenues $17.8 million
Gross Margin 17%
Net Margin -2%
Employees 648
% low-skilled 81%
SEAF INVESTMENT DATA (2003)
Amount Invested $3.1 million
Internal Rate of Return* 38%
Multiple of Capital Invested*
1.3x
QUANTITATIVE CASE STUDY RESULTS (2003)
Financial Rate of Return** 12%
Economic Rate of Return*** 122%
Net Benefit/Cost Ratio (0% discount)
6.81
Net Benefit/Cost Ratio (10% discount)
3.94
Net Benefit/Cost Ratio Breakdownby Stakeholder****
Financiers 2.40
Employees 1.58
Customers NA
Suppliers 0.25
Competitors -0.08
Producers of Complementary Goods/Services
0.49
Local Community 0.40
National Governments 1.77
COMPANY UPDATEArtima’s annual revenues grew to $41.4 million in 2004, with net margin becoming positive and employment reaching 1,090. In the first year after SEAF’s exit in 2005, some store sales increased 30 percent—an indication of Artima’s sustainable market position.
* Realized and Unrealized** Return to all financiers*** Return to all stakeholders**** 0% discount
* Employee name has been changed
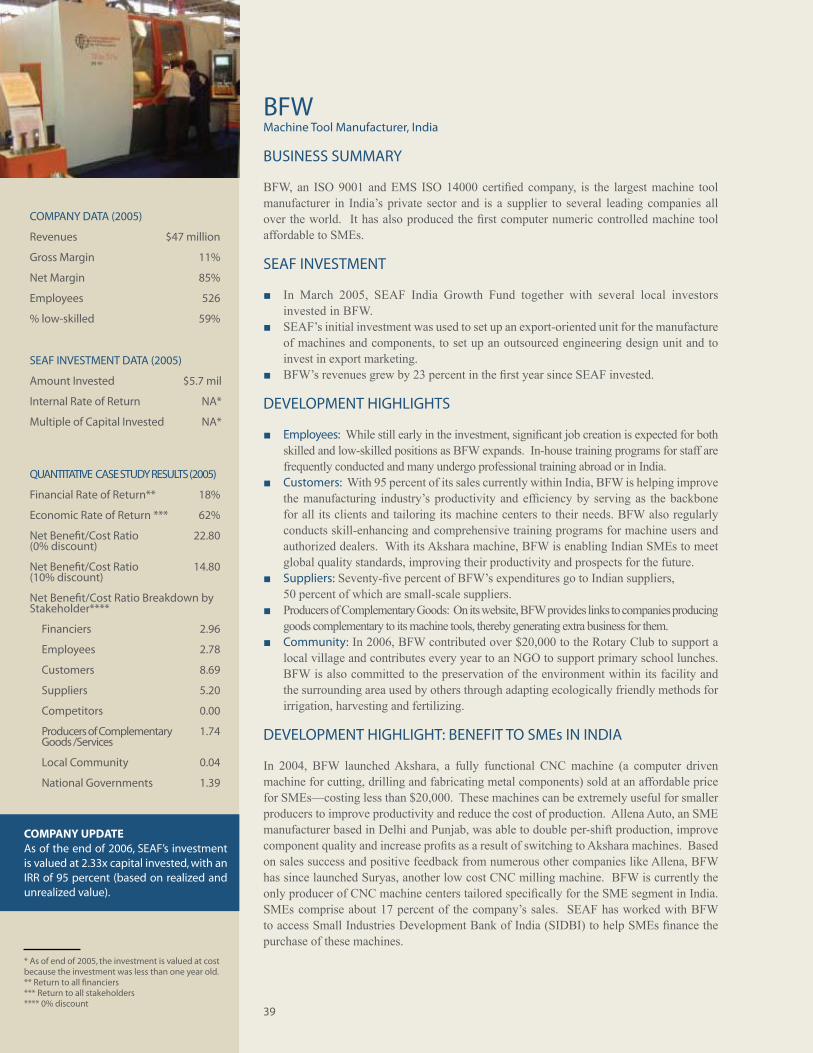
39
BFW Machine Tool Manufacturer, India
BUSINESS SUMMARY
BFW, an ISO 9001 and EMS ISO 14000 certified company, is the largest machine tool manufacturer in India’s private sector and is a supplier to several leading companies all over the world. It has also produced the first computer numeric controlled machine tool affordable to SMEs.
SEAF INVESTMENT
In March 2005, SEAF India Growth Fund together with several local investors ■invested in BFW.SEAF’s initial investment was used to set up an export-oriented unit for the manufacture ■of machines and components, to set up an outsourced engineering design unit and to invest in export marketing.BFW’s revenues grew by 23 percent in the first year since SEAF invested. ■
DEVELOPMENT HIGHLIGHTS
Employees: ■ While still early in the investment, significant job creation is expected for both skilled and low-skilled positions as BFW expands. In-house training programs for staff are frequently conducted and many undergo professional training abroad or in India.Customers: ■ With 95 percent of its sales currently within India, BFW is helping improve the manufacturing industry’s productivity and efficiency by serving as the backbone for all its clients and tailoring its machine centers to their needs. BFW also regularly conducts skill-enhancing and comprehensive training programs for machine users and authorized dealers. With its Akshara machine, BFW is enabling Indian SMEs to meet global quality standards, improving their productivity and prospects for the future.Suppliers: ■ Seventy-five percent of BFW’s expenditures go to Indian suppliers, 50 percent of which are small-scale suppliers.Producers of Complementary Goods: On its website, BFW provides links to companies producing ■goods complementary to its machine tools, thereby generating extra business for them.Community: ■ In 2006, BFW contributed over $20,000 to the Rotary Club to support a local village and contributes every year to an NGO to support primary school lunches. BFW is also committed to the preservation of the environment within its facility and the surrounding area used by others through adapting ecologically friendly methods for irrigation, harvesting and fertilizing.
DEVELOPMENT HIGHLIGHT: BENEFIT TO SMEs IN INDIA
In 2004, BFW launched Akshara, a fully functional CNC machine (a computer driven machine for cutting, drilling and fabricating metal components) sold at an affordable price for SMEs—costing less than $20,000. These machines can be extremely useful for smaller producers to improve productivity and reduce the cost of production. Allena Auto, an SME manufacturer based in Delhi and Punjab, was able to double per-shift production, improve component quality and increase profits as a result of switching to Akshara machines. Based on sales success and positive feedback from numerous other companies like Allena, BFW has since launched Suryas, another low cost CNC milling machine. BFW is currently the only producer of CNC machine centers tailored specifically for the SME segment in India. SMEs comprise about 17 percent of the company’s sales. SEAF has worked with BFW to access Small Industries Development Bank of India (SIDBI) to help SMEs finance the purchase of these machines.
COMPANY DATA (2005)
Revenues $47 million
Gross Margin 11%
Net Margin 85%
Employees 526
% low-skilled 59%
SEAF INVESTMENT DATA (2005)
Amount Invested $5.7 mil
Internal Rate of Return NA*
Multiple of Capital Invested NA*
QUANTITATIVE CASE STUDY RESULTS (2005)
Financial Rate of Return** 18%
Economic Rate of Return *** 62%
Net Benefit/Cost Ratio(0% discount)
22.80
Net Benefit/Cost Ratio(10% discount)
14.80
Net Benefit/Cost Ratio Breakdown by Stakeholder****
Financiers 2.96
Employees 2.78
Customers 8.69
Suppliers 5.20
Competitors 0.00
Producers of Complementary Goods /Services
1.74
Local Community 0.04
National Governments 1.39
COMPANY UPDATEAs of the end of 2006, SEAF’s investment is valued at 2.33x capital invested, with an IRR of 95 percent (based on realized and unrealized value).
* As of end of 2005, the investment is valued at cost because the investment was less than one year old.** Return to all financiers*** Return to all stakeholders**** 0% discount
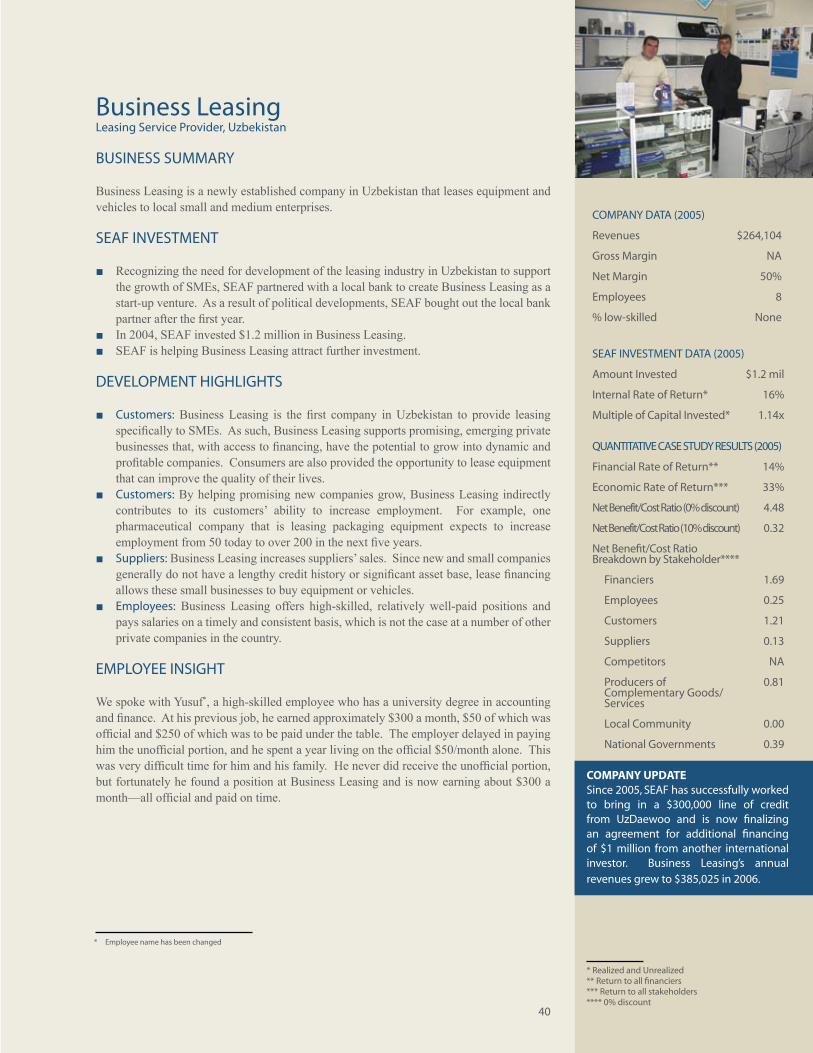
40
Business Leasing Leasing Service Provider, Uzbekistan
BUSINESS SUMMARY
Business Leasing is a newly established company in Uzbekistan that leases equipment and vehicles to local small and medium enterprises.
SEAF INVESTMENT
Recognizing the need for development of the leasing industry in Uzbekistan to support ■the growth of SMEs, SEAF partnered with a local bank to create Business Leasing as a start-up venture. As a result of political developments, SEAF bought out the local bank partner after the first year. In 2004, SEAF invested $1.2 million in Business Leasing. ■SEAF is helping Business Leasing attract further investment. ■
DEVELOPMENT HIGHLIGHTS
Customers: ■ Business Leasing is the first company in Uzbekistan to provide leasing specifically to SMEs. As such, Business Leasing supports promising, emerging private businesses that, with access to financing, have the potential to grow into dynamic and profitable companies. Consumers are also provided the opportunity to lease equipment that can improve the quality of their lives. Customers: ■ By helping promising new companies grow, Business Leasing indirectly contributes to its customers’ ability to increase employment. For example, one pharmaceutical company that is leasing packaging equipment expects to increase employment from 50 today to over 200 in the next five years.Suppliers: ■ Business Leasing increases suppliers’ sales. Since new and small companies generally do not have a lengthy credit history or significant asset base, lease financing allows these small businesses to buy equipment or vehicles. Employees: ■ Business Leasing offers high-skilled, relatively well-paid positions and pays salaries on a timely and consistent basis, which is not the case at a number of other private companies in the country.
EMPLOYEE INSIGHT
We spoke with Yusuf*, a high-skilled employee who has a university degree in accounting and finance. At his previous job, he earned approximately $300 a month, $50 of which was official and $250 of which was to be paid under the table. The employer delayed in paying him the unofficial portion, and he spent a year living on the official $50/month alone. This was very difficult time for him and his family. He never did receive the unofficial portion, but fortunately he found a position at Business Leasing and is now earning about $300 a month—all official and paid on time.
COMPANY DATA (2005)
Revenues $264,104
Gross Margin NA
Net Margin 50%
Employees 8
% low-skilled None
SEAF INVESTMENT DATA (2005)
Amount Invested $1.2 mil
Internal Rate of Return* 16%
Multiple of Capital Invested* 1.14x
QUANTITATIVE CASE STUDY RESULTS (2005)
Financial Rate of Return** 14%
Economic Rate of Return*** 33%
Net Benefit/Cost Ratio (0% discount) 4.48
Net Benefit/Cost Ratio (10% discount) 0.32
Net Benefit/Cost Ratio Breakdown by Stakeholder****
Financiers 1.69
Employees 0.25
Customers 1.21
Suppliers 0.13
Competitors NA
Producers of Complementary Goods/Services
0.81
Local Community 0.00
National Governments 0.39
COMPANY UPDATESince 2005, SEAF has successfully worked to bring in a $300,000 line of credit from UzDaewoo and is now finalizing an agreement for additional financing of $1 million from another international investor. Business Leasing’s annual revenues grew to $385,025 in 2006.
* Realized and Unrealized** Return to all financiers*** Return to all stakeholders**** 0% discount
* Employee name has been changed
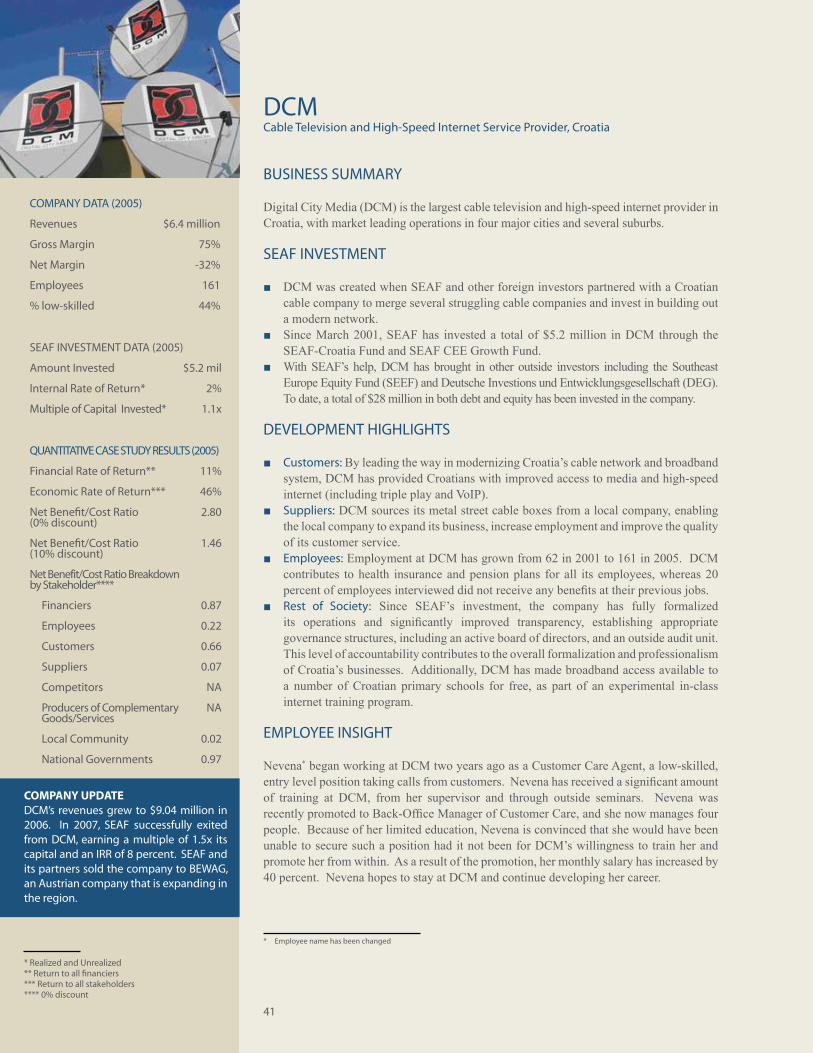
41
DCM Cable Television and High-Speed Internet Service Provider, Croatia
BUSINESS SUMMARY
Digital City Media (DCM) is the largest cable television and high-speed internet provider in Croatia, with market leading operations in four major cities and several suburbs.
SEAF INVESTMENT
DCM was created when SEAF and other foreign investors partnered with a Croatian ■cable company to merge several struggling cable companies and invest in building out a modern network.Since March 2001, SEAF has invested a total of $5.2 million in DCM through the ■SEAF-Croatia Fund and SEAF CEE Growth Fund. With SEAF’s help, DCM has brought in other outside investors including the Southeast ■Europe Equity Fund (SEEF) and Deutsche Investions und Entwicklungsgesellschaft (DEG). To date, a total of $28 million in both debt and equity has been invested in the company.
DEVELOPMENT HIGHLIGHTS
Customers: ■ By leading the way in modernizing Croatia’s cable network and broadband system, DCM has provided Croatians with improved access to media and high-speed internet (including triple play and VoIP).Suppliers: ■ DCM sources its metal street cable boxes from a local company, enabling the local company to expand its business, increase employment and improve the quality of its customer service.Employees: ■ Employment at DCM has grown from 62 in 2001 to 161 in 2005. DCM contributes to health insurance and pension plans for all its employees, whereas 20 percent of employees interviewed did not receive any benefits at their previous jobs. Rest of Society: ■ Since SEAF’s investment, the company has fully formalized its operations and significantly improved transparency, establishing appropriate governance structures, including an active board of directors, and an outside audit unit. This level of accountability contributes to the overall formalization and professionalism of Croatia’s businesses. Additionally, DCM has made broadband access available to a number of Croatian primary schools for free, as part of an experimental in-class internet training program.
EMPLOYEE INSIGHT
Nevena* began working at DCM two years ago as a Customer Care Agent, a low-skilled, entry level position taking calls from customers. Nevena has received a significant amount of training at DCM, from her supervisor and through outside seminars. Nevena was recently promoted to Back-Office Manager of Customer Care, and she now manages four people. Because of her limited education, Nevena is convinced that she would have been unable to secure such a position had it not been for DCM’s willingness to train her and promote her from within. As a result of the promotion, her monthly salary has increased by 40 percent. Nevena hopes to stay at DCM and continue developing her career.
COMPANY DATA (2005)
Revenues $6.4 million
Gross Margin 75%
Net Margin -32%
Employees 161
% low-skilled 44%
SEAF INVESTMENT DATA (2005)
Amount Invested $5.2 mil
Internal Rate of Return* 2%
Multiple of Capital Invested* 1.1x
QUANTITATIVE CASE STUDY RESULTS (2005)
Financial Rate of Return** 11%
Economic Rate of Return*** 46%
Net Benefit/Cost Ratio(0% discount)
2.80
Net Benefit/Cost Ratio(10% discount)
1.46
Net Benefit/Cost Ratio Breakdown by Stakeholder****
Financiers 0.87
Employees 0.22
Customers 0.66
Suppliers 0.07
Competitors NA
Producers of Complementary Goods/Services
NA
Local Community 0.02
National Governments 0.97 COMPANY UPDATEDCM’s revenues grew to $9.04 million in 2006. In 2007, SEAF successfully exited from DCM, earning a multiple of 1.5x its capital and an IRR of 8 percent. SEAF and its partners sold the company to BEWAG, an Austrian company that is expanding in the region.
* Realized and Unrealized** Return to all financiers*** Return to all stakeholders**** 0% discount
* Employee name has been changed
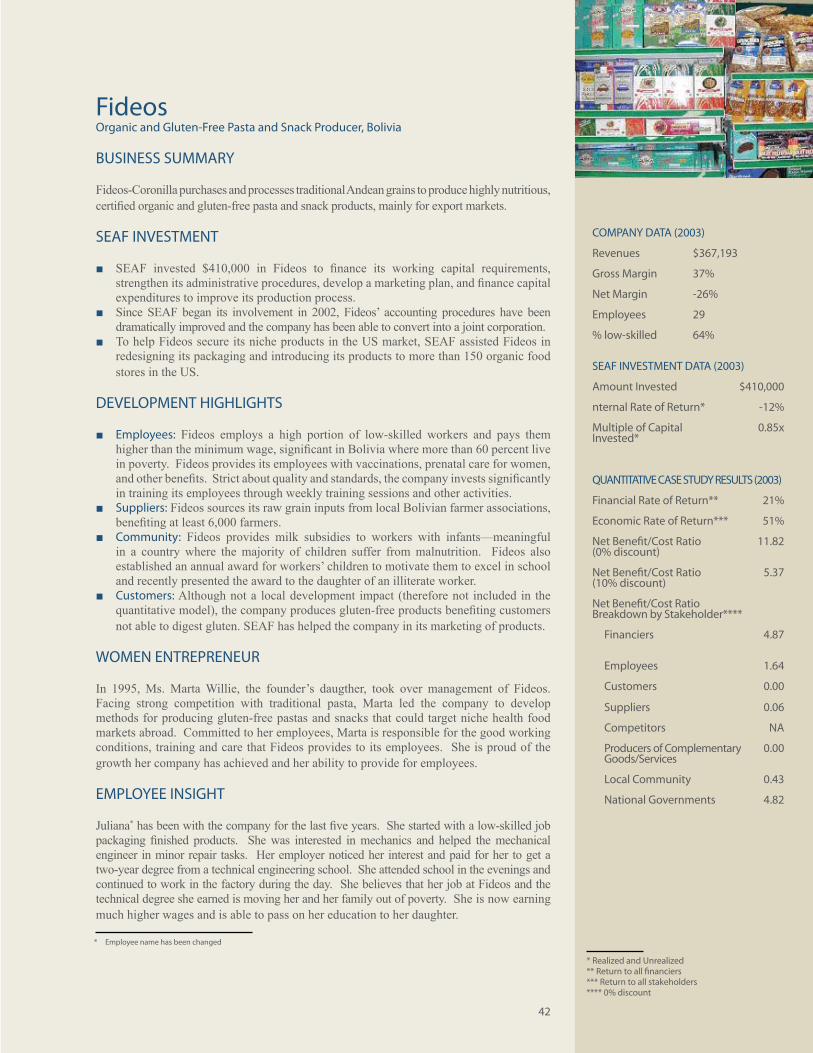
42
Fideos Organic and Gluten-Free Pasta and Snack Producer, Bolivia
BUSINESS SUMMARY
Fideos-Coronilla purchases and processes traditional Andean grains to produce highly nutritious, certified organic and gluten-free pasta and snack products, mainly for export markets.
SEAF INVESTMENT
SEAF invested $410,000 in Fideos to finance its working capital requirements, ■strengthen its administrative procedures, develop a marketing plan, and finance capital expenditures to improve its production process. Since SEAF began its involvement in 2002, Fideos’ accounting procedures have been ■dramatically improved and the company has been able to convert into a joint corporation. To help Fideos secure its niche products in the US market, SEAF assisted Fideos in ■redesigning its packaging and introducing its products to more than 150 organic food stores in the US.
DEVELOPMENT HIGHLIGHTS
Employees: ■ Fideos employs a high portion of low-skilled workers and pays them higher than the minimum wage, significant in Bolivia where more than 60 percent live in poverty. Fideos provides its employees with vaccinations, prenatal care for women, and other benefits. Strict about quality and standards, the company invests significantly in training its employees through weekly training sessions and other activities. Suppliers: ■ Fideos sources its raw grain inputs from local Bolivian farmer associations, benefiting at least 6,000 farmers. Community: ■ Fideos provides milk subsidies to workers with infants—meaningful in a country where the majority of children suffer from malnutrition. Fideos also established an annual award for workers’ children to motivate them to excel in school and recently presented the award to the daughter of an illiterate worker.Customers: ■ Although not a local development impact (therefore not included in the quantitative model), the company produces gluten-free products benefiting customers not able to digest gluten. SEAF has helped the company in its marketing of products.
WOMEN ENTREPRENEUR
In 1995, Ms. Marta Willie, the founder’s daugther, took over management of Fideos. Facing strong competition with traditional pasta, Marta led the company to develop methods for producing gluten-free pastas and snacks that could target niche health food markets abroad. Committed to her employees, Marta is responsible for the good working conditions, training and care that Fideos provides to its employees. She is proud of the growth her company has achieved and her ability to provide for employees.
EMPLOYEE INSIGHT
Juliana* has been with the company for the last five years. She started with a low-skilled job packaging finished products. She was interested in mechanics and helped the mechanical engineer in minor repair tasks. Her employer noticed her interest and paid for her to get a two-year degree from a technical engineering school. She attended school in the evenings and continued to work in the factory during the day. She believes that her job at Fideos and the technical degree she earned is moving her and her family out of poverty. She is now earning much higher wages and is able to pass on her education to her daughter.
COMPANY DATA (2003)
Revenues $367,193
Gross Margin 37%
Net Margin -26%
Employees 29
% low-skilled 64%
SEAF INVESTMENT DATA (2003)
Amount Invested $410,000
nternal Rate of Return* -12%
Multiple of Capital Invested*
0.85x
QUANTITATIVE CASE STUDY RESULTS (2003)
Financial Rate of Return** 21%
Economic Rate of Return*** 51%
Net Benefit/Cost Ratio(0% discount)
11.82
Net Benefit/Cost Ratio(10% discount)
5.37
Net Benefit/Cost Ratio Breakdown by Stakeholder****
Financiers 4.87
Employees 1.64
Customers 0.00
Suppliers 0.06
Competitors NA
Producers of Complementary Goods/Services
0.00
Local Community 0.43
National Governments 4.82
* Realized and Unrealized** Return to all financiers*** Return to all stakeholders**** 0% discount
* Employee name has been changed
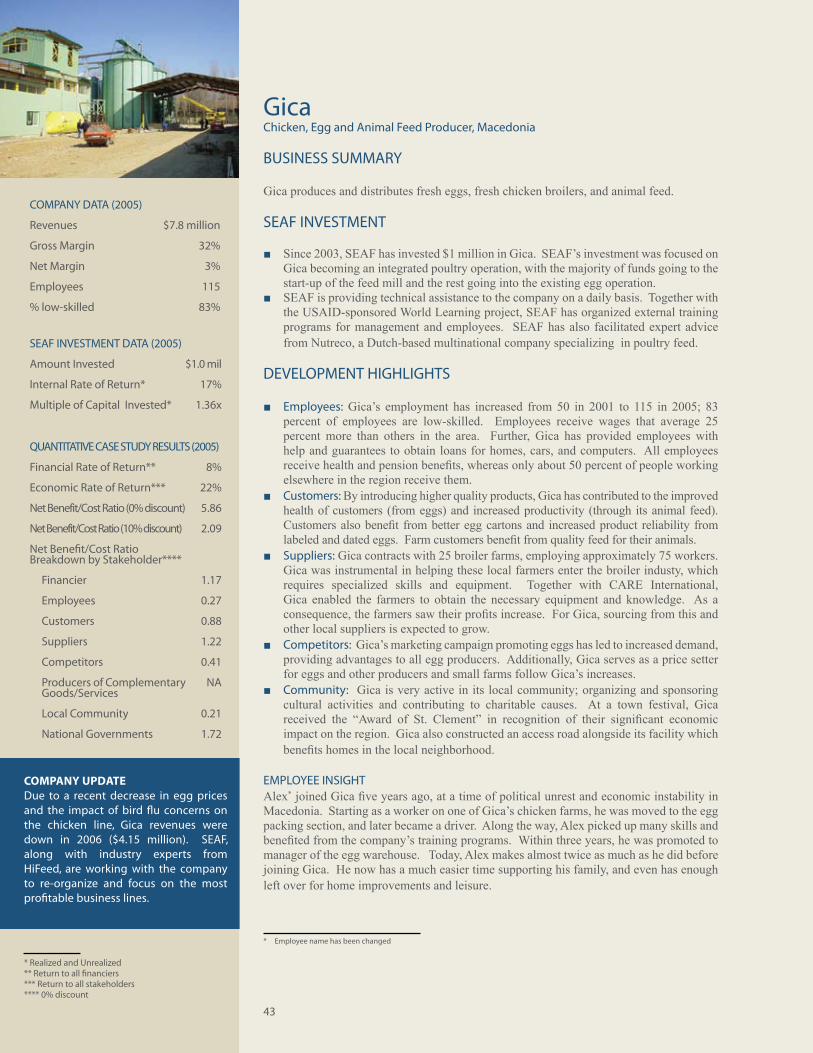
43
Gica Chicken, Egg and Animal Feed Producer, Macedonia
BUSINESS SUMMARY
Gica produces and distributes fresh eggs, fresh chicken broilers, and animal feed.
SEAF INVESTMENT
Since 2003, SEAF has invested $1 million in Gica. SEAF’s investment was focused on ■Gica becoming an integrated poultry operation, with the majority of funds going to the start-up of the feed mill and the rest going into the existing egg operation. SEAF is providing technical assistance to the company on a daily basis. Together with ■the USAID-sponsored World Learning project, SEAF has organized external training programs for management and employees. SEAF has also facilitated expert advice from Nutreco, a Dutch-based multinational company specializing in poultry feed.
DEVELOPMENT HIGHLIGHTS
Employees: ■ Gica’s employment has increased from 50 in 2001 to 115 in 2005; 83 percent of employees are low-skilled. Employees receive wages that average 25 percent more than others in the area. Further, Gica has provided employees with help and guarantees to obtain loans for homes, cars, and computers. All employees receive health and pension benefits, whereas only about 50 percent of people working elsewhere in the region receive them.Customers: ■ By introducing higher quality products, Gica has contributed to the improved health of customers (from eggs) and increased productivity (through its animal feed). Customers also benefit from better egg cartons and increased product reliability from labeled and dated eggs. Farm customers benefit from quality feed for their animals. Suppliers: ■ Gica contracts with 25 broiler farms, employing approximately 75 workers. Gica was instrumental in helping these local farmers enter the broiler industy, which requires specialized skills and equipment. Together with CARE International, Gica enabled the farmers to obtain the necessary equipment and knowledge. As a consequence, the farmers saw their profits increase. For Gica, sourcing from this and other local suppliers is expected to grow. Competitors: ■ Gica’s marketing campaign promoting eggs has led to increased demand, providing advantages to all egg producers. Additionally, Gica serves as a price setter for eggs and other producers and small farms follow Gica’s increases.Community: ■ Gica is very active in its local community; organizing and sponsoring cultural activities and contributing to charitable causes. At a town festival, Gica received the “Award of St. Clement” in recognition of their significant economic impact on the region. Gica also constructed an access road alongside its facility which benefits homes in the local neighborhood.
EMPLOYEE INSIGHTAlex* joined Gica five years ago, at a time of political unrest and economic instability in Macedonia. Starting as a worker on one of Gica’s chicken farms, he was moved to the egg packing section, and later became a driver. Along the way, Alex picked up many skills and benefited from the company’s training programs. Within three years, he was promoted to manager of the egg warehouse. Today, Alex makes almost twice as much as he did before joining Gica. He now has a much easier time supporting his family, and even has enough left over for home improvements and leisure.
COMPANY DATA (2005)
Revenues $7.8 million
Gross Margin 32%
Net Margin 3%
Employees 115
% low-skilled 83%
SEAF INVESTMENT DATA (2005)
Amount Invested $1.0 mil
Internal Rate of Return* 17%
Multiple of Capital Invested* 1.36x
QUANTITATIVE CASE STUDY RESULTS (2005)
Financial Rate of Return** 8%
Economic Rate of Return*** 22%
Net Benefit/Cost Ratio (0% discount) 5.86
Net Benefit/Cost Ratio (10% discount) 2.09
Net Benefit/Cost Ratio Breakdown by Stakeholder****
Financier 1.17
Employees 0.27
Customers 0.88
Suppliers 1.22
Competitors 0.41
Producers of Complementary Goods/Services
NA
Local Community 0.21
National Governments 1.72
COMPANY UPDATEDue to a recent decrease in egg prices and the impact of bird flu concerns on the chicken line, Gica revenues were down in 2006 ($4.15 million). SEAF, along with industry experts from HiFeed, are working with the company to re-organize and focus on the most profitable business lines.
* Realized and Unrealized** Return to all financiers*** Return to all stakeholders**** 0% discount
* Employee name has been changed
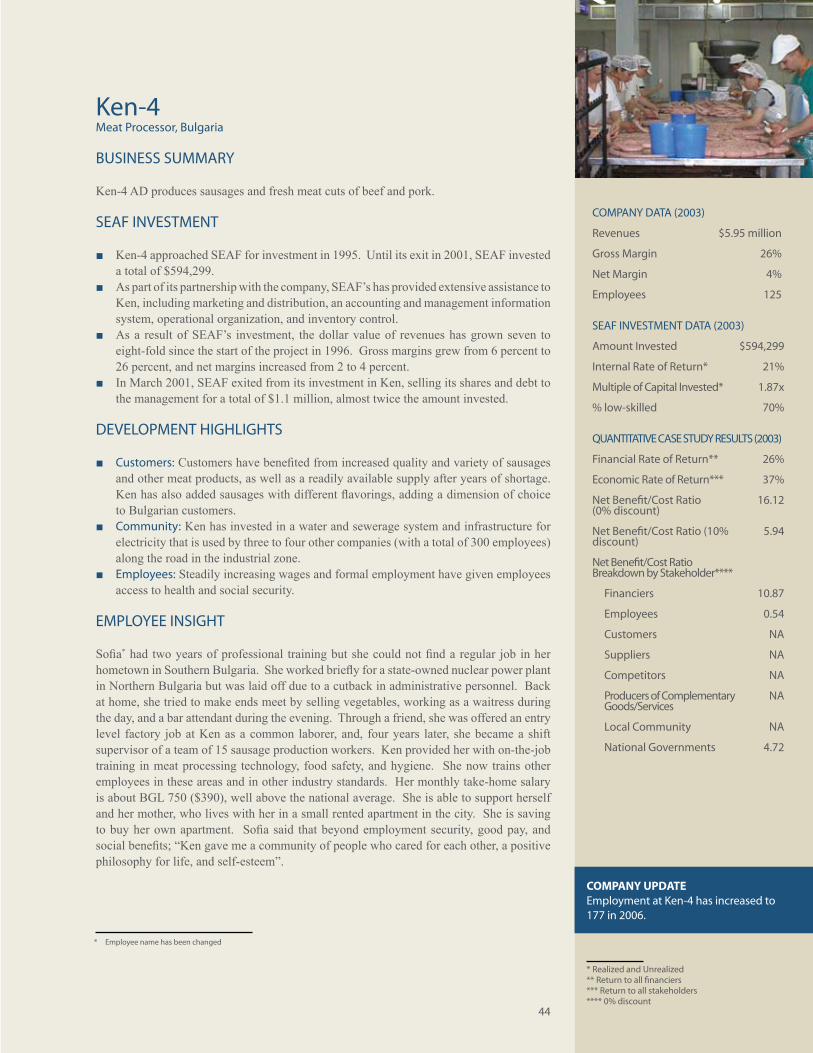
44
Ken-4 Meat Processor, Bulgaria
BUSINESS SUMMARY
Ken-4 AD produces sausages and fresh meat cuts of beef and pork.
SEAF INVESTMENT
Ken-4 approached SEAF for investment in 1995. Until its exit in 2001, SEAF invested ■a total of $594,299. As part of its partnership with the company, SEAF’s has provided extensive assistance to ■Ken, including marketing and distribution, an accounting and management information system, operational organization, and inventory control. As a result of SEAF’s investment, the dollar value of revenues has grown seven to ■eight-fold since the start of the project in 1996. Gross margins grew from 6 percent to 26 percent, and net margins increased from 2 to 4 percent. In March 2001, SEAF exited from its investment in Ken, selling its shares and debt to ■the management for a total of $1.1 million, almost twice the amount invested.
DEVELOPMENT HIGHLIGHTS
Customers: ■ Customers have benefited from increased quality and variety of sausages and other meat products, as well as a readily available supply after years of shortage. Ken has also added sausages with different flavorings, adding a dimension of choice to Bulgarian customers.Community: ■ Ken has invested in a water and sewerage system and infrastructure for electricity that is used by three to four other companies (with a total of 300 employees) along the road in the industrial zone. Employees: ■ Steadily increasing wages and formal employment have given employees access to health and social security.
EMPLOYEE INSIGHT
Sofia* had two years of professional training but she could not find a regular job in her hometown in Southern Bulgaria. She worked briefly for a state-owned nuclear power plant in Northern Bulgaria but was laid off due to a cutback in administrative personnel. Back at home, she tried to make ends meet by selling vegetables, working as a waitress during the day, and a bar attendant during the evening. Through a friend, she was offered an entry level factory job at Ken as a common laborer, and, four years later, she became a shift supervisor of a team of 15 sausage production workers. Ken provided her with on-the-job training in meat processing technology, food safety, and hygiene. She now trains other employees in these areas and in other industry standards. Her monthly take-home salary is about BGL 750 ($390), well above the national average. She is able to support herself and her mother, who lives with her in a small rented apartment in the city. She is saving to buy her own apartment. Sofia said that beyond employment security, good pay, and social benefits; “Ken gave me a community of people who cared for each other, a positive philosophy for life, and self-esteem”.
COMPANY DATA (2003)
Revenues $5.95 million
Gross Margin 26%
Net Margin 4%
Employees 125
SEAF INVESTMENT DATA (2003)
Amount Invested $594,299
Internal Rate of Return* 21%
Multiple of Capital Invested* 1.87x
% low-skilled 70%
QUANTITATIVE CASE STUDY RESULTS (2003)
Financial Rate of Return** 26%
Economic Rate of Return*** 37%
Net Benefit/Cost Ratio(0% discount)
16.12
Net Benefit/Cost Ratio (10% discount)
5.94
Net Benefit/Cost Ratio Breakdown by Stakeholder****
Financiers 10.87
Employees 0.54
Customers NA
Suppliers NA
Competitors NA
Producers of Complementary Goods/Services
NA
Local Community NA
National Governments 4.72
COMPANY UPDATEEmployment at Ken-4 has increased to 177 in 2006.
* Realized and Unrealized** Return to all financiers*** Return to all stakeholders**** 0% discount
* Employee name has been changed
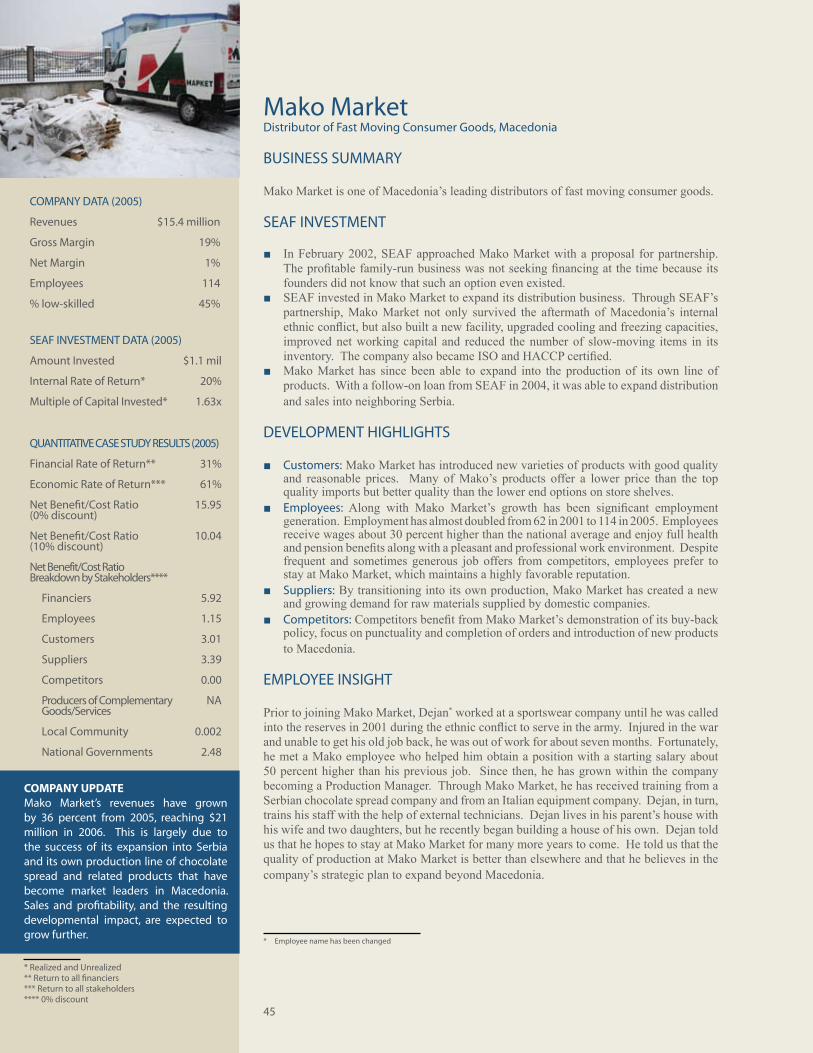
45
Mako Market Distributor of Fast Moving Consumer Goods, Macedonia
BUSINESS SUMMARY
Mako Market is one of Macedonia’s leading distributors of fast moving consumer goods.
SEAF INVESTMENT
In February 2002, SEAF approached Mako Market with a proposal for partnership. ■The profitable family-run business was not seeking financing at the time because its founders did not know that such an option even existed.SEAF invested in Mako Market to expand its distribution business. Through SEAF’s ■partnership, Mako Market not only survived the aftermath of Macedonia’s internal ethnic conflict, but also built a new facility, upgraded cooling and freezing capacities, improved net working capital and reduced the number of slow-moving items in its inventory. The company also became ISO and HACCP certified. Mako Market has since been able to expand into the production of its own line of ■products. With a follow-on loan from SEAF in 2004, it was able to expand distribution and sales into neighboring Serbia.
DEVELOPMENT HIGHLIGHTS
Customers: ■ Mako Market has introduced new varieties of products with good quality and reasonable prices. Many of Mako’s products offer a lower price than the top quality imports but better quality than the lower end options on store shelves. Employees: ■ Along with Mako Market’s growth has been significant employment generation. Employment has almost doubled from 62 in 2001 to 114 in 2005. Employees receive wages about 30 percent higher than the national average and enjoy full health and pension benefits along with a pleasant and professional work environment. Despite frequent and sometimes generous job offers from competitors, employees prefer to stay at Mako Market, which maintains a highly favorable reputation.Suppliers: ■ By transitioning into its own production, Mako Market has created a new and growing demand for raw materials supplied by domestic companies. Competitors: ■ Competitors benefit from Mako Market’s demonstration of its buy-back policy, focus on punctuality and completion of orders and introduction of new products to Macedonia.
EMPLOYEE INSIGHT
Prior to joining Mako Market, Dejan* worked at a sportswear company until he was called into the reserves in 2001 during the ethnic conflict to serve in the army. Injured in the war and unable to get his old job back, he was out of work for about seven months. Fortunately, he met a Mako employee who helped him obtain a position with a starting salary about 50 percent higher than his previous job. Since then, he has grown within the company becoming a Production Manager. Through Mako Market, he has received training from a Serbian chocolate spread company and from an Italian equipment company. Dejan, in turn, trains his staff with the help of external technicians. Dejan lives in his parent’s house with his wife and two daughters, but he recently began building a house of his own. Dejan told us that he hopes to stay at Mako Market for many more years to come. He told us that the quality of production at Mako Market is better than elsewhere and that he believes in the company’s strategic plan to expand beyond Macedonia.
COMPANY DATA (2005)
Revenues $15.4 million
Gross Margin 19%
Net Margin 1%
Employees 114
% low-skilled 45%
SEAF INVESTMENT DATA (2005)
Amount Invested $1.1 mil
Internal Rate of Return* 20%
Multiple of Capital Invested* 1.63x
QUANTITATIVE CASE STUDY RESULTS (2005)
Financial Rate of Return** 31%
Economic Rate of Return*** 61%
Net Benefit/Cost Ratio(0% discount)
15.95
Net Benefit/Cost Ratio(10% discount)
10.04
Net Benefit/Cost Ratio Breakdown by Stakeholders****
Financiers 5.92
Employees 1.15
Customers 3.01
Suppliers 3.39
Competitors 0.00
Producers of Complementary Goods/Services
NA
Local Community 0.002
National Governments 2.48 COMPANY UPDATEMako Market’s revenues have grown by 36 percent from 2005, reaching $21 million in 2006. This is largely due to the success of its expansion into Serbia and its own production line of chocolate spread and related products that have become market leaders in Macedonia. Sales and profitability, and the resulting developmental impact, are expected to grow further.
* Realized and Unrealized** Return to all financiers*** Return to all stakeholders**** 0% discount
* Employee name has been changed
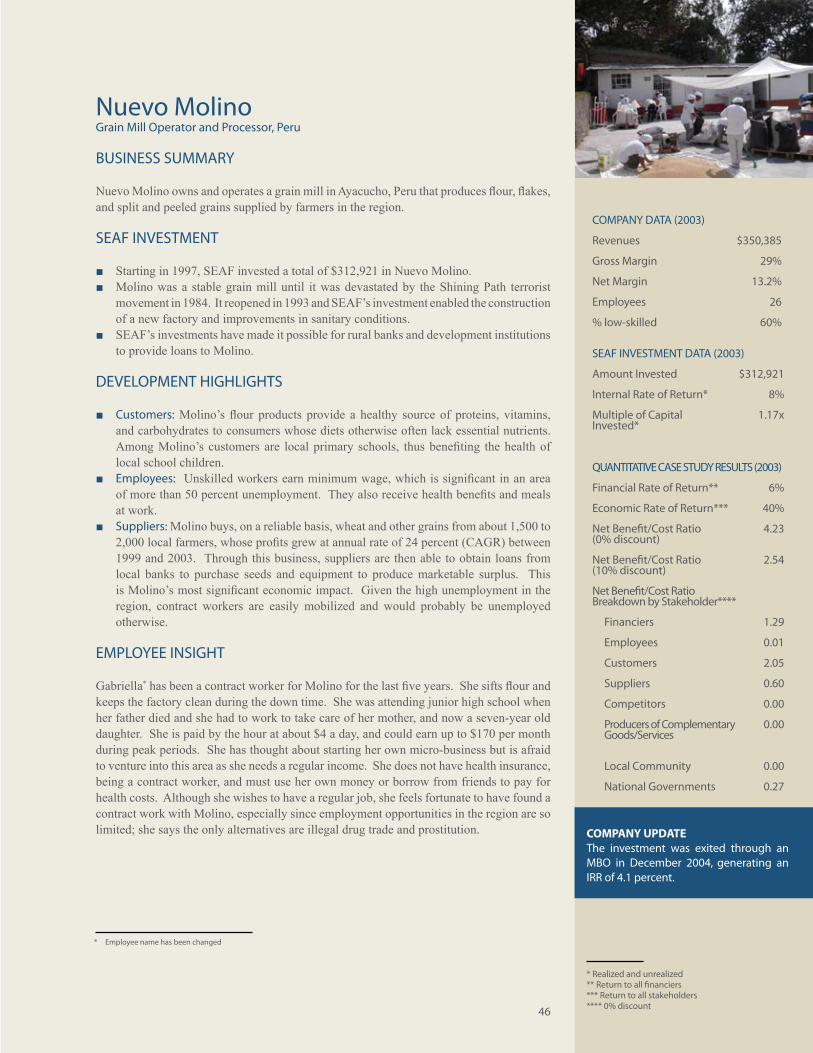
46
Nuevo MolinoGrain Mill Operator and Processor, Peru
BUSINESS SUMMARY
Nuevo Molino owns and operates a grain mill in Ayacucho, Peru that produces flour, flakes, and split and peeled grains supplied by farmers in the region.
SEAF INVESTMENT
Starting in 1997, SEAF invested a total of $312,921 in Nuevo Molino. ■Molino was a stable grain mill until it was devastated by the Shining Path terrorist ■movement in 1984. It reopened in 1993 and SEAF’s investment enabled the construction of a new factory and improvements in sanitary conditions.SEAF’s investments have made it possible for rural banks and development institutions ■to provide loans to Molino.
DEVELOPMENT HIGHLIGHTS
Customers: ■ Molino’s flour products provide a healthy source of proteins, vitamins, and carbohydrates to consumers whose diets otherwise often lack essential nutrients. Among Molino’s customers are local primary schools, thus benefiting the health of local school children. Employees: ■ Unskilled workers earn minimum wage, which is significant in an area of more than 50 percent unemployment. They also receive health benefits and meals at work.Suppliers: ■ Molino buys, on a reliable basis, wheat and other grains from about 1,500 to 2,000 local farmers, whose profits grew at annual rate of 24 percent (CAGR) between 1999 and 2003. Through this business, suppliers are then able to obtain loans from local banks to purchase seeds and equipment to produce marketable surplus. This is Molino’s most significant economic impact. Given the high unemployment in the region, contract workers are easily mobilized and would probably be unemployed otherwise.
EMPLOYEE INSIGHT
Gabriella* has been a contract worker for Molino for the last five years. She sifts flour and keeps the factory clean during the down time. She was attending junior high school when her father died and she had to work to take care of her mother, and now a seven-year old daughter. She is paid by the hour at about $4 a day, and could earn up to $170 per month during peak periods. She has thought about starting her own micro-business but is afraid to venture into this area as she needs a regular income. She does not have health insurance, being a contract worker, and must use her own money or borrow from friends to pay for health costs. Although she wishes to have a regular job, she feels fortunate to have found a contract work with Molino, especially since employment opportunities in the region are so limited; she says the only alternatives are illegal drug trade and prostitution.
COMPANY DATA (2003)
Revenues $350,385
Gross Margin 29%
Net Margin 13.2%
Employees 26
% low-skilled 60%
SEAF INVESTMENT DATA (2003)
Amount Invested $312,921
Internal Rate of Return* 8%
Multiple of Capital Invested*
1.17x
QUANTITATIVE CASE STUDY RESULTS (2003)
Financial Rate of Return** 6%
Economic Rate of Return*** 40%
Net Benefit/Cost Ratio(0% discount)
4.23
Net Benefit/Cost Ratio(10% discount)
2.54
Net Benefit/Cost Ratio Breakdown by Stakeholder****
Financiers 1.29
Employees 0.01
Customers 2.05
Suppliers 0.60
Competitors 0.00
Producers of Complementary Goods/Services
0.00
Local Community 0.00
National Governments 0.27
COMPANY UPDATEThe investment was exited through an MBO in December 2004, generating an IRR of 4.1 percent.
* Realized and unrealized** Return to all financiers*** Return to all stakeholders**** 0% discount
* Employee name has been changed
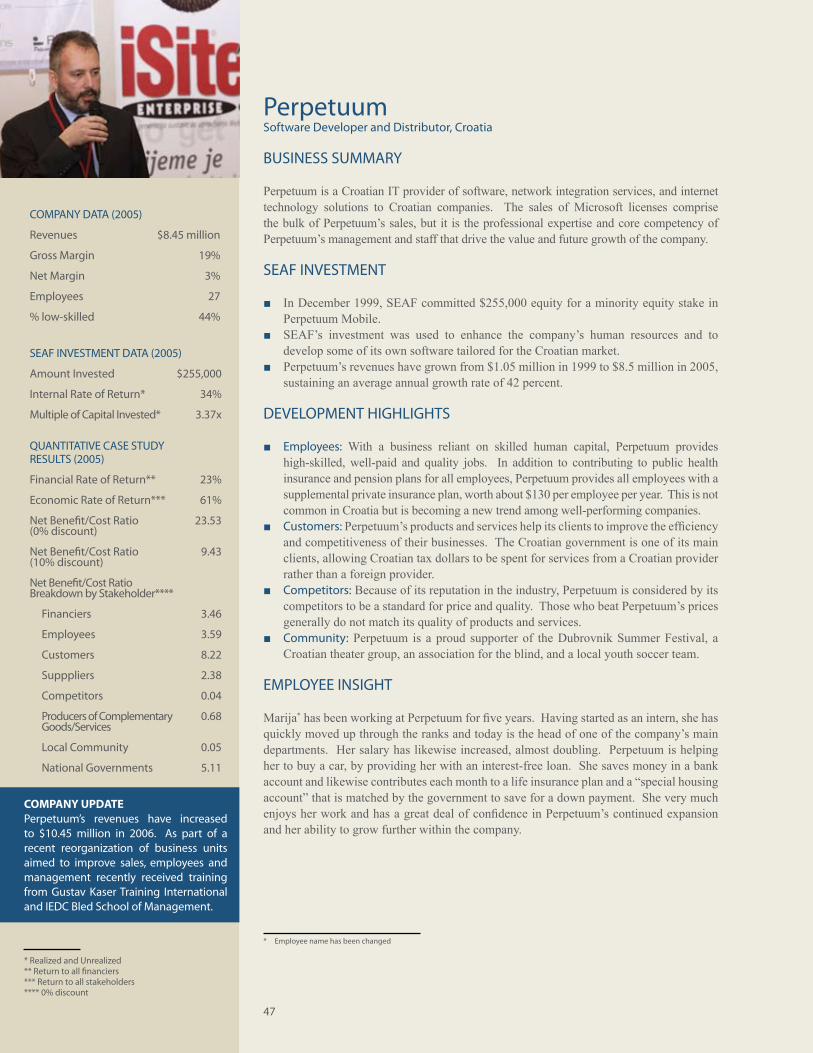
47
Perpetuum Software Developer and Distributor, Croatia
BUSINESS SUMMARY
Perpetuum is a Croatian IT provider of software, network integration services, and internet technology solutions to Croatian companies. The sales of Microsoft licenses comprise the bulk of Perpetuum’s sales, but it is the professional expertise and core competency of Perpetuum’s management and staff that drive the value and future growth of the company.
SEAF INVESTMENT
In December 1999, SEAF committed $255,000 equity for a minority equity stake in ■Perpetuum Mobile. SEAF’s investment was used to enhance the company’s human resources and to ■develop some of its own software tailored for the Croatian market. Perpetuum’s revenues have grown from $1.05 million in 1999 to $8.5 million in 2005, ■sustaining an average annual growth rate of 42 percent.
DEVELOPMENT HIGHLIGHTS
Employees: ■ With a business reliant on skilled human capital, Perpetuum provides high-skilled, well-paid and quality jobs. In addition to contributing to public health insurance and pension plans for all employees, Perpetuum provides all employees with a supplemental private insurance plan, worth about $130 per employee per year. This is not common in Croatia but is becoming a new trend among well-performing companies. Customers: ■ Perpetuum’s products and services help its clients to improve the efficiency and competitiveness of their businesses. The Croatian government is one of its main clients, allowing Croatian tax dollars to be spent for services from a Croatian provider rather than a foreign provider.Competitors: ■ Because of its reputation in the industry, Perpetuum is considered by its competitors to be a standard for price and quality. Those who beat Perpetuum’s prices generally do not match its quality of products and services. Community: ■ Perpetuum is a proud supporter of the Dubrovnik Summer Festival, a Croatian theater group, an association for the blind, and a local youth soccer team.
EMPLOYEE INSIGHT
Marija* has been working at Perpetuum for five years. Having started as an intern, she has quickly moved up through the ranks and today is the head of one of the company’s main departments. Her salary has likewise increased, almost doubling. Perpetuum is helping her to buy a car, by providing her with an interest-free loan. She saves money in a bank account and likewise contributes each month to a life insurance plan and a “special housing account” that is matched by the government to save for a down payment. She very much enjoys her work and has a great deal of confidence in Perpetuum’s continued expansion and her ability to grow further within the company.
COMPANY DATA (2005)
Revenues $8.45 million
Gross Margin 19%
Net Margin 3%
Employees 27
% low-skilled 44%
SEAF INVESTMENT DATA (2005)
Amount Invested $255,000
Internal Rate of Return* 34%
Multiple of Capital Invested* 3.37x
QUANTITATIVE CASE STUDY RESULTS (2005)
Financial Rate of Return** 23%
Economic Rate of Return*** 61%
Net Benefit/Cost Ratio(0% discount)
23.53
Net Benefit/Cost Ratio(10% discount)
9.43
Net Benefit/Cost Ratio Breakdown by Stakeholder****
Financiers 3.46
Employees 3.59
Customers 8.22
Supppliers 2.38
Competitors 0.04
Producers of Complementary Goods/Services
0.68
Local Community 0.05
National Governments 5.11
COMPANY UPDATEPerpetuum’s revenues have increased to $10.45 million in 2006. As part of a recent reorganization of business units aimed to improve sales, employees and management recently received training from Gustav Kaser Training International and IEDC Bled School of Management.
* Realized and Unrealized** Return to all financiers*** Return to all stakeholders**** 0% discount
* Employee name has been changed
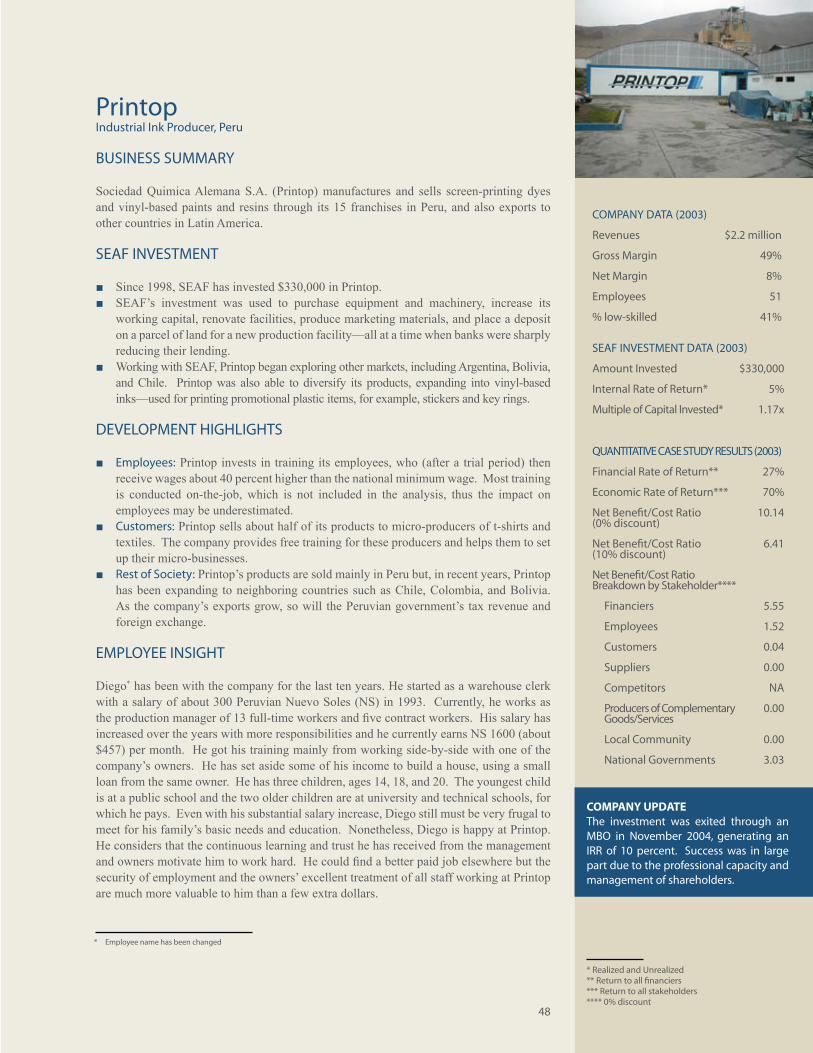
48
PrintopIndustrial Ink Producer, Peru
BUSINESS SUMMARY
Sociedad Quimica Alemana S.A. (Printop) manufactures and sells screen-printing dyes and vinyl-based paints and resins through its 15 franchises in Peru, and also exports to other countries in Latin America.
SEAF INVESTMENT
Since 1998, SEAF has invested $330,000 in Printop. ■SEAF’s investment was used to purchase equipment and machinery, increase its ■working capital, renovate facilities, produce marketing materials, and place a deposit on a parcel of land for a new production facility—all at a time when banks were sharply reducing their lending. Working with SEAF, Printop began exploring other markets, including Argentina, Bolivia, ■and Chile. Printop was also able to diversify its products, expanding into vinyl-based inks—used for printing promotional plastic items, for example, stickers and key rings.
DEVELOPMENT HIGHLIGHTS
Employees: ■ Printop invests in training its employees, who (after a trial period) then receive wages about 40 percent higher than the national minimum wage. Most training is conducted on-the-job, which is not included in the analysis, thus the impact on employees may be underestimated. Customers: ■ Printop sells about half of its products to micro-producers of t-shirts and textiles. The company provides free training for these producers and helps them to set up their micro-businesses. Rest of Society: ■ Printop’s products are sold mainly in Peru but, in recent years, Printop has been expanding to neighboring countries such as Chile, Colombia, and Bolivia. As the company’s exports grow, so will the Peruvian government’s tax revenue and foreign exchange.
EMPLOYEE INSIGHT
Diego* has been with the company for the last ten years. He started as a warehouse clerk with a salary of about 300 Peruvian Nuevo Soles (NS) in 1993. Currently, he works as the production manager of 13 full-time workers and five contract workers. His salary has increased over the years with more responsibilities and he currently earns NS 1600 (about $457) per month. He got his training mainly from working side-by-side with one of the company’s owners. He has set aside some of his income to build a house, using a small loan from the same owner. He has three children, ages 14, 18, and 20. The youngest child is at a public school and the two older children are at university and technical schools, for which he pays. Even with his substantial salary increase, Diego still must be very frugal to meet for his family’s basic needs and education. Nonetheless, Diego is happy at Printop. He considers that the continuous learning and trust he has received from the management and owners motivate him to work hard. He could find a better paid job elsewhere but the security of employment and the owners’ excellent treatment of all staff working at Printop are much more valuable to him than a few extra dollars.
COMPANY DATA (2003)
Revenues $2.2 million
Gross Margin 49%
Net Margin 8%
Employees 51
% low-skilled 41%
SEAF INVESTMENT DATA (2003)
Amount Invested $330,000
Internal Rate of Return* 5%
Multiple of Capital Invested* 1.17x
QUANTITATIVE CASE STUDY RESULTS (2003)
Financial Rate of Return** 27%
Economic Rate of Return*** 70%
Net Benefit/Cost Ratio(0% discount)
10.14
Net Benefit/Cost Ratio(10% discount)
6.41
Net Benefit/Cost Ratio Breakdown by Stakeholder****
Financiers 5.55
Employees 1.52
Customers 0.04
Suppliers 0.00
Competitors NA
Producers of Complementary Goods/Services
0.00
Local Community 0.00
National Governments 3.03
COMPANY UPDATEThe investment was exited through an MBO in November 2004, generating an IRR of 10 percent. Success was in large part due to the professional capacity and management of shareholders.
* Realized and Unrealized** Return to all financiers*** Return to all stakeholders**** 0% discount
* Employee name has been changed
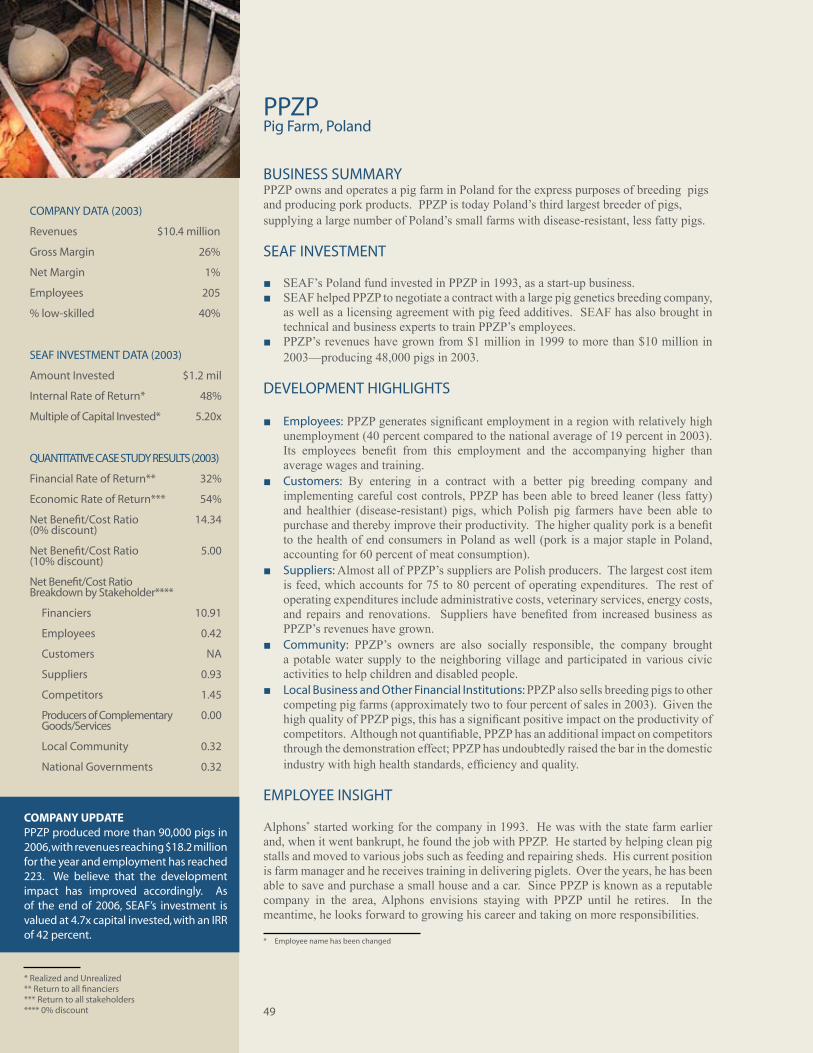
49
PPZPPig Farm, Poland
BUSINESS SUMMARYPPZP owns and operates a pig farm in Poland for the express purposes of breeding pigs and producing pork products. PPZP is today Poland’s third largest breeder of pigs, supplying a large number of Poland’s small farms with disease-resistant, less fatty pigs.
SEAF INVESTMENT
SEAF’s Poland fund invested in PPZP in 1993, as a start-up business. ■SEAF helped PPZP to negotiate a contract with a large pig genetics breeding company, ■as well as a licensing agreement with pig feed additives. SEAF has also brought in technical and business experts to train PPZP’s employees.PPZP’s revenues have grown from $1 million in 1999 to more than $10 million in ■2003—producing 48,000 pigs in 2003.
DEVELOPMENT HIGHLIGHTS
Employees: ■ PPZP generates significant employment in a region with relatively high unemployment (40 percent compared to the national average of 19 percent in 2003). Its employees benefit from this employment and the accompanying higher than average wages and training. Customers: ■ By entering in a contract with a better pig breeding company and implementing careful cost controls, PPZP has been able to breed leaner (less fatty) and healthier (disease-resistant) pigs, which Polish pig farmers have been able to purchase and thereby improve their productivity. The higher quality pork is a benefit to the health of end consumers in Poland as well (pork is a major staple in Poland, accounting for 60 percent of meat consumption).Suppliers: ■ Almost all of PPZP’s suppliers are Polish producers. The largest cost item is feed, which accounts for 75 to 80 percent of operating expenditures. The rest of operating expenditures include administrative costs, veterinary services, energy costs, and repairs and renovations. Suppliers have benefited from increased business as PPZP’s revenues have grown.Community: ■ PPZP’s owners are also socially responsible, the company brought a potable water supply to the neighboring village and participated in various civic activities to help children and disabled people.Local Business and Other Financial Institutions: ■ PPZP also sells breeding pigs to other competing pig farms (approximately two to four percent of sales in 2003). Given the high quality of PPZP pigs, this has a significant positive impact on the productivity of competitors. Although not quantifiable, PPZP has an additional impact on competitors through the demonstration effect; PPZP has undoubtedly raised the bar in the domestic industry with high health standards, efficiency and quality.
EMPLOYEE INSIGHT
Alphons* started working for the company in 1993. He was with the state farm earlier and, when it went bankrupt, he found the job with PPZP. He started by helping clean pig stalls and moved to various jobs such as feeding and repairing sheds. His current position is farm manager and he receives training in delivering piglets. Over the years, he has been able to save and purchase a small house and a car. Since PPZP is known as a reputable company in the area, Alphons envisions staying with PPZP until he retires. In the meantime, he looks forward to growing his career and taking on more responsibilities.
COMPANY DATA (2003)
Revenues $10.4 million
Gross Margin 26%
Net Margin 1%
Employees 205
% low-skilled 40%
SEAF INVESTMENT DATA (2003)
Amount Invested $1.2 mil
Internal Rate of Return* 48%
Multiple of Capital Invested* 5.20x
QUANTITATIVE CASE STUDY RESULTS (2003)
Financial Rate of Return** 32%
Economic Rate of Return*** 54%
Net Benefit/Cost Ratio(0% discount)
14.34
Net Benefit/Cost Ratio(10% discount)
5.00
Net Benefit/Cost Ratio Breakdown by Stakeholder****
Financiers 10.91
Employees 0.42
Customers NA
Suppliers 0.93
Competitors 1.45
Producers of Complementary Goods/Services
0.00
Local Community 0.32
National Governments 0.32
COMPANY UPDATEPPZP produced more than 90,000 pigs in 2006, with revenues reaching $18.2 million for the year and employment has reached 223. We believe that the development impact has improved accordingly. As of the end of 2006, SEAF’s investment is valued at 4.7x capital invested, with an IRR of 42 percent.
* Realized and Unrealized** Return to all financiers*** Return to all stakeholders**** 0% discount
* Employee name has been changed
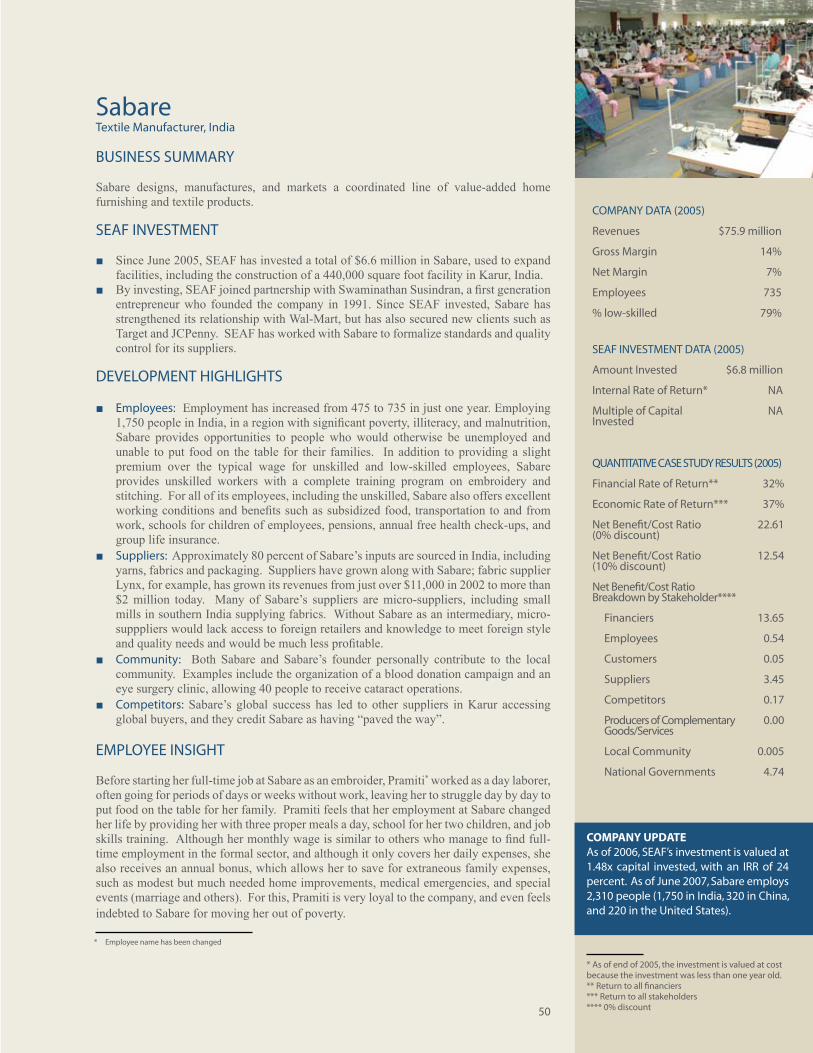
50
SabareTextile Manufacturer, India
BUSINESS SUMMARY
Sabare designs, manufactures, and markets a coordinated line of value-added home furnishing and textile products.
SEAF INVESTMENT
Since June 2005, SEAF has invested a total of $6.6 million in Sabare, used to expand ■facilities, including the construction of a 440,000 square foot facility in Karur, India. By investing, SEAF joined partnership with Swaminathan Susindran, a first generation ■entrepreneur who founded the company in 1991. Since SEAF invested, Sabare has strengthened its relationship with Wal-Mart, but has also secured new clients such as Target and JCPenny. SEAF has worked with Sabare to formalize standards and quality control for its suppliers.
DEVELOPMENT HIGHLIGHTS
Employees: ■ Employment has increased from 475 to 735 in just one year. Employing 1,750 people in India, in a region with significant poverty, illiteracy, and malnutrition, Sabare provides opportunities to people who would otherwise be unemployed and unable to put food on the table for their families. In addition to providing a slight premium over the typical wage for unskilled and low-skilled employees, Sabare provides unskilled workers with a complete training program on embroidery and stitching. For all of its employees, including the unskilled, Sabare also offers excellent working conditions and benefits such as subsidized food, transportation to and from work, schools for children of employees, pensions, annual free health check-ups, and group life insurance.Suppliers: ■ Approximately 80 percent of Sabare’s inputs are sourced in India, including yarns, fabrics and packaging. Suppliers have grown along with Sabare; fabric supplier Lynx, for example, has grown its revenues from just over $11,000 in 2002 to more than $2 million today. Many of Sabare’s suppliers are micro-suppliers, including small mills in southern India supplying fabrics. Without Sabare as an intermediary, micro-supppliers would lack access to foreign retailers and knowledge to meet foreign style and quality needs and would be much less profitable.Community: ■ Both Sabare and Sabare’s founder personally contribute to the local community. Examples include the organization of a blood donation campaign and an eye surgery clinic, allowing 40 people to receive cataract operations.Competitors: ■ Sabare’s global success has led to other suppliers in Karur accessing global buyers, and they credit Sabare as having “paved the way”.
EMPLOYEE INSIGHT
Before starting her full-time job at Sabare as an embroider, Pramiti* worked as a day laborer, often going for periods of days or weeks without work, leaving her to struggle day by day to put food on the table for her family. Pramiti feels that her employment at Sabare changed her life by providing her with three proper meals a day, school for her two children, and job skills training. Although her monthly wage is similar to others who manage to find full-time employment in the formal sector, and although it only covers her daily expenses, she also receives an annual bonus, which allows her to save for extraneous family expenses, such as modest but much needed home improvements, medical emergencies, and special events (marriage and others). For this, Pramiti is very loyal to the company, and even feels indebted to Sabare for moving her out of poverty.
COMPANY DATA (2005)
Revenues $75.9 million
Gross Margin 14%
Net Margin 7%
Employees 735
% low-skilled 79%
SEAF INVESTMENT DATA (2005)
Amount Invested $6.8 million
Internal Rate of Return* NA
Multiple of Capital Invested
NA
QUANTITATIVE CASE STUDY RESULTS (2005)
Financial Rate of Return** 32%
Economic Rate of Return*** 37%
Net Benefit/Cost Ratio(0% discount)
22.61
Net Benefit/Cost Ratio(10% discount)
12.54
Net Benefit/Cost Ratio Breakdown by Stakeholder****
Financiers 13.65
Employees 0.54
Customers 0.05
Suppliers 3.45
Competitors 0.17
Producers of Complementary Goods/Services
0.00
Local Community 0.005
National Governments 4.74
COMPANY UPDATEAs of 2006, SEAF’s investment is valued at 1.48x capital invested, with an IRR of 24 percent. As of June 2007, Sabare employs 2,310 people (1,750 in India, 320 in China, and 220 in the United States).
* As of end of 2005, the investment is valued at cost because the investment was less than one year old.** Return to all financiers*** Return to all stakeholders**** 0% discount
* Employee name has been changed
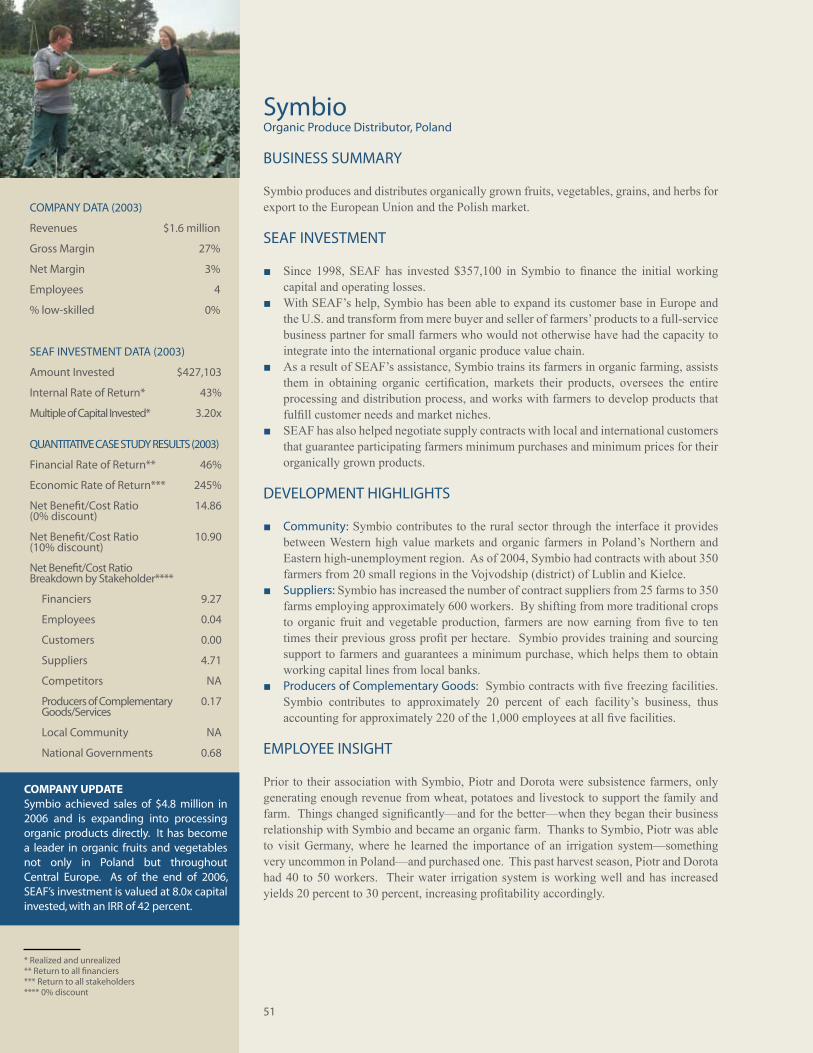
51
SymbioOrganic Produce Distributor, Poland
BUSINESS SUMMARY
Symbio produces and distributes organically grown fruits, vegetables, grains, and herbs for export to the European Union and the Polish market.
SEAF INVESTMENT
Since 1998, SEAF has invested $357,100 in Symbio to finance the initial working ■capital and operating losses. With SEAF’s help, Symbio has been able to expand its customer base in Europe and ■the U.S. and transform from mere buyer and seller of farmers’ products to a full-service business partner for small farmers who would not otherwise have had the capacity to integrate into the international organic produce value chain.As a result of SEAF’s assistance, Symbio trains its farmers in organic farming, assists ■them in obtaining organic certification, markets their products, oversees the entire processing and distribution process, and works with farmers to develop products that fulfill customer needs and market niches.SEAF has also helped negotiate supply contracts with local and international customers ■that guarantee participating farmers minimum purchases and minimum prices for their organically grown products.
DEVELOPMENT HIGHLIGHTS
Community: ■ Symbio contributes to the rural sector through the interface it provides between Western high value markets and organic farmers in Poland’s Northern and Eastern high-unemployment region. As of 2004, Symbio had contracts with about 350 farmers from 20 small regions in the Vojvodship (district) of Lublin and Kielce. Suppliers: ■ Symbio has increased the number of contract suppliers from 25 farms to 350 farms employing approximately 600 workers. By shifting from more traditional crops to organic fruit and vegetable production, farmers are now earning from five to ten times their previous gross profit per hectare. Symbio provides training and sourcing support to farmers and guarantees a minimum purchase, which helps them to obtain working capital lines from local banks.Producers of Complementary Goods: ■ Symbio contracts with five freezing facilities. Symbio contributes to approximately 20 percent of each facility’s business, thus accounting for approximately 220 of the 1,000 employees at all five facilities.
EMPLOYEE INSIGHT
Prior to their association with Symbio, Piotr and Dorota were subsistence farmers, only generating enough revenue from wheat, potatoes and livestock to support the family and farm. Things changed significantly—and for the better—when they began their business relationship with Symbio and became an organic farm. Thanks to Symbio, Piotr was able to visit Germany, where he learned the importance of an irrigation system—something very uncommon in Poland—and purchased one. This past harvest season, Piotr and Dorota had 40 to 50 workers. Their water irrigation system is working well and has increased yields 20 percent to 30 percent, increasing profitability accordingly.
COMPANY DATA (2003)
Revenues $1.6 million
Gross Margin 27%
Net Margin 3%
Employees 4
% low-skilled 0%
SEAF INVESTMENT DATA (2003)
Amount Invested $427,103
Internal Rate of Return* 43%
Multiple of Capital Invested* 3.20x
QUANTITATIVE CASE STUDY RESULTS (2003)
Financial Rate of Return** 46%
Economic Rate of Return*** 245%
Net Benefit/Cost Ratio(0% discount)
14.86
Net Benefit/Cost Ratio(10% discount)
10.90
Net Benefit/Cost Ratio Breakdown by Stakeholder****
Financiers 9.27
Employees 0.04
Customers 0.00
Suppliers 4.71
Competitors NA
Producers of Complementary Goods/Services
0.17
Local Community NA
National Governments 0.68
COMPANY UPDATESymbio achieved sales of $4.8 million in 2006 and is expanding into processing organic products directly. It has become a leader in organic fruits and vegetables not only in Poland but throughout Central Europe. As of the end of 2006, SEAF’s investment is valued at 8.0x capital invested, with an IRR of 42 percent.
* Realized and unrealized** Return to all financiers*** Return to all stakeholders**** 0% discount
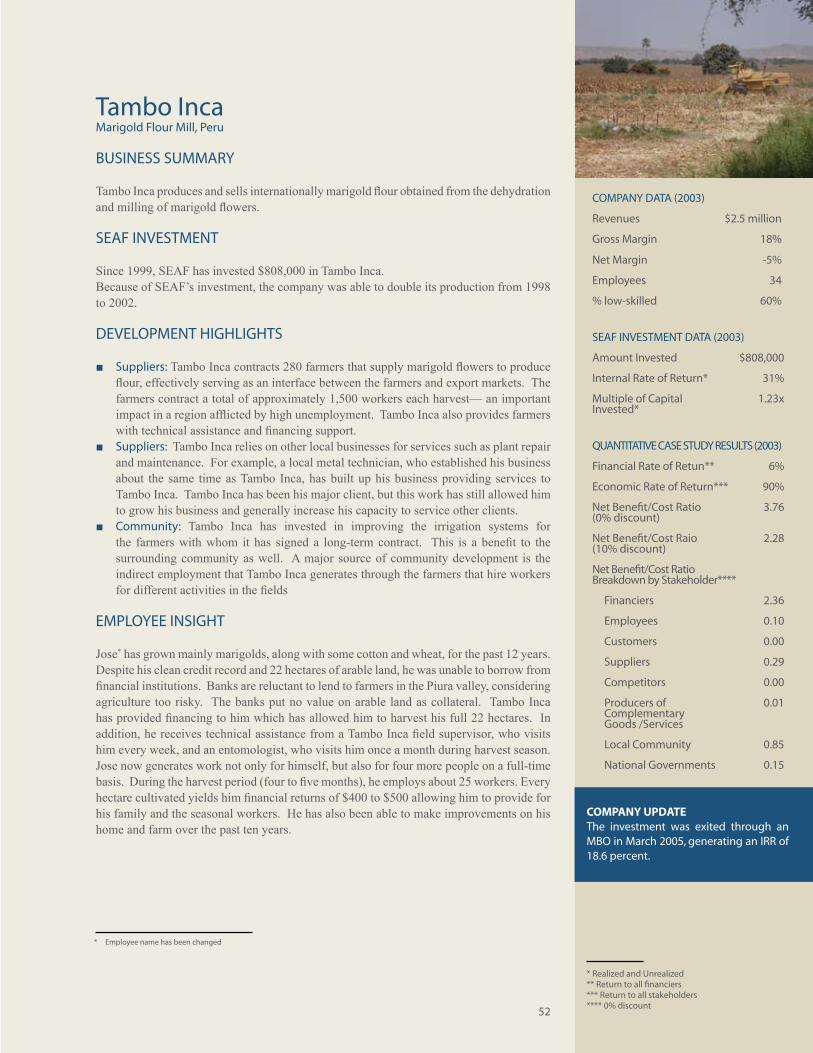
52
Tambo IncaMarigold Flour Mill, Peru
BUSINESS SUMMARY
Tambo Inca produces and sells internationally marigold flour obtained from the dehydration and milling of marigold flowers.
SEAF INVESTMENT
Since 1999, SEAF has invested $808,000 in Tambo Inca. Because of SEAF’s investment, the company was able to double its production from 1998 to 2002.
DEVELOPMENT HIGHLIGHTS
Suppliers: ■ Tambo Inca contracts 280 farmers that supply marigold flowers to produce flour, effectively serving as an interface between the farmers and export markets. The farmers contract a total of approximately 1,500 workers each harvest— an important impact in a region afflicted by high unemployment. Tambo Inca also provides farmers with technical assistance and financing support.Suppliers: ■ Tambo Inca relies on other local businesses for services such as plant repair and maintenance. For example, a local metal technician, who established his business about the same time as Tambo Inca, has built up his business providing services to Tambo Inca. Tambo Inca has been his major client, but this work has still allowed him to grow his business and generally increase his capacity to service other clients.Community: ■ Tambo Inca has invested in improving the irrigation systems for the farmers with whom it has signed a long-term contract. This is a benefit to the surrounding community as well. A major source of community development is the indirect employment that Tambo Inca generates through the farmers that hire workers for different activities in the fields
EMPLOYEE INSIGHT
Jose* has grown mainly marigolds, along with some cotton and wheat, for the past 12 years. Despite his clean credit record and 22 hectares of arable land, he was unable to borrow from financial institutions. Banks are reluctant to lend to farmers in the Piura valley, considering agriculture too risky. The banks put no value on arable land as collateral. Tambo Inca has provided financing to him which has allowed him to harvest his full 22 hectares. In addition, he receives technical assistance from a Tambo Inca field supervisor, who visits him every week, and an entomologist, who visits him once a month during harvest season. Jose now generates work not only for himself, but also for four more people on a full-time basis. During the harvest period (four to five months), he employs about 25 workers. Every hectare cultivated yields him financial returns of $400 to $500 allowing him to provide for his family and the seasonal workers. He has also been able to make improvements on his home and farm over the past ten years.
COMPANY DATA (2003)
Revenues $2.5 million
Gross Margin 18%
Net Margin -5%
Employees 34
% low-skilled 60%
SEAF INVESTMENT DATA (2003)
Amount Invested $808,000
Internal Rate of Return* 31%
Multiple of Capital Invested*
1.23x
QUANTITATIVE CASE STUDY RESULTS (2003)
Financial Rate of Retun** 6%
Economic Rate of Return*** 90%
Net Benefit/Cost Ratio(0% discount)
3.76
Net Benefit/Cost Raio(10% discount)
2.28
Net Benefit/Cost Ratio Breakdown by Stakeholder****
Financiers 2.36
Employees 0.10
Customers 0.00
Suppliers 0.29
Competitors 0.00
Producers of ComplementaryGoods /Services
0.01
Local Community 0.85
National Governments 0.15
COMPANY UPDATEThe investment was exited through an MBO in March 2005, generating an IRR of 18.6 percent.
* Realized and Unrealized** Return to all financiers*** Return to all stakeholders**** 0% discount
* Employee name has been changed
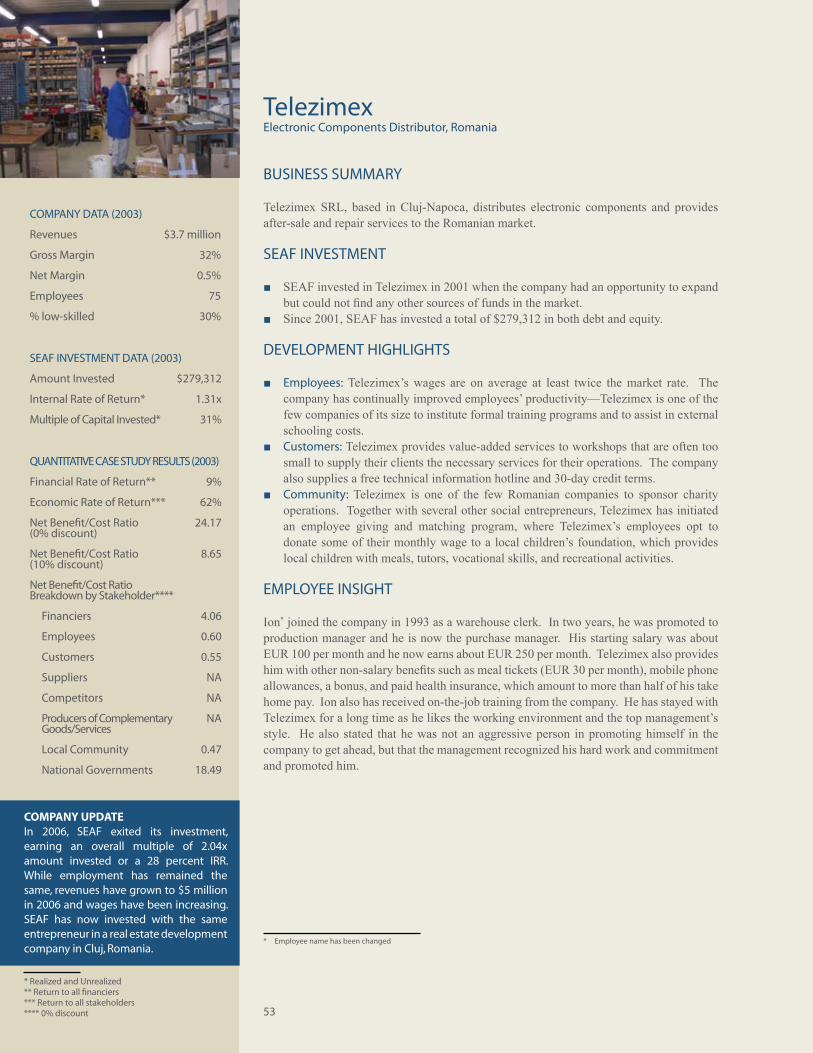
53
TelezimexElectronic Components Distributor, Romania
BUSINESS SUMMARY
Telezimex SRL, based in Cluj-Napoca, distributes electronic components and provides after-sale and repair services to the Romanian market.
SEAF INVESTMENT
SEAF invested in Telezimex in 2001 when the company had an opportunity to expand ■but could not find any other sources of funds in the market. Since 2001, SEAF has invested a total of $279,312 in both debt and equity. ■
DEVELOPMENT HIGHLIGHTS
Employees: ■ Telezimex’s wages are on average at least twice the market rate. The company has continually improved employees’ productivity—Telezimex is one of the few companies of its size to institute formal training programs and to assist in external schooling costs. Customers: ■ Telezimex provides value-added services to workshops that are often too small to supply their clients the necessary services for their operations. The company also supplies a free technical information hotline and 30-day credit terms. Community: ■ Telezimex is one of the few Romanian companies to sponsor charity operations. Together with several other social entrepreneurs, Telezimex has initiated an employee giving and matching program, where Telezimex’s employees opt to donate some of their monthly wage to a local children’s foundation, which provides local children with meals, tutors, vocational skills, and recreational activities.
EMPLOYEE INSIGHT
Ion* joined the company in 1993 as a warehouse clerk. In two years, he was promoted to production manager and he is now the purchase manager. His starting salary was about EUR 100 per month and he now earns about EUR 250 per month. Telezimex also provides him with other non-salary benefits such as meal tickets (EUR 30 per month), mobile phone allowances, a bonus, and paid health insurance, which amount to more than half of his take home pay. Ion also has received on-the-job training from the company. He has stayed with Telezimex for a long time as he likes the working environment and the top management’s style. He also stated that he was not an aggressive person in promoting himself in the company to get ahead, but that the management recognized his hard work and commitment and promoted him.
COMPANY DATA (2003)
Revenues $3.7 million
Gross Margin 32%
Net Margin 0.5%
Employees 75
% low-skilled 30%
SEAF INVESTMENT DATA (2003)
Amount Invested $279,312
Internal Rate of Return* 1.31x
Multiple of Capital Invested* 31%
QUANTITATIVE CASE STUDY RESULTS (2003)
Financial Rate of Return** 9%
Economic Rate of Return*** 62%
Net Benefit/Cost Ratio(0% discount)
24.17
Net Benefit/Cost Ratio(10% discount)
8.65
Net Benefit/Cost Ratio Breakdown by Stakeholder****
Financiers 4.06
Employees 0.60
Customers 0.55
Suppliers NA
Competitors NA
Producers of Complementary Goods/Services
NA
Local Community 0.47
National Governments 18.49
COMPANY UPDATEIn 2006, SEAF exited its investment, earning an overall multiple of 2.04x amount invested or a 28 percent IRR. While employment has remained the same, revenues have grown to $5 million in 2006 and wages have been increasing. SEAF has now invested with the same entrepreneur in a real estate development company in Cluj, Romania.
* Realized and Unrealized** Return to all financiers*** Return to all stakeholders**** 0% discount
* Employee name has been changed
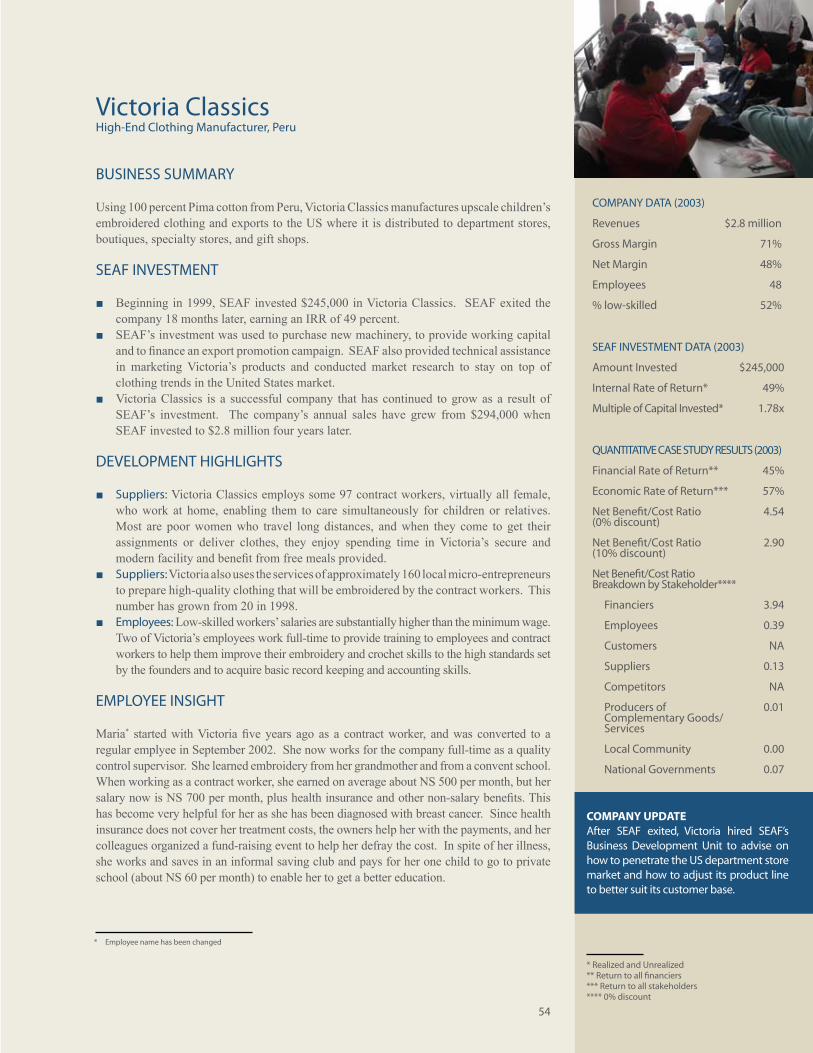
54
Victoria ClassicsHigh-End Clothing Manufacturer, Peru
BUSINESS SUMMARY
Using 100 percent Pima cotton from Peru, Victoria Classics manufactures upscale children’s embroidered clothing and exports to the US where it is distributed to department stores, boutiques, specialty stores, and gift shops.
SEAF INVESTMENT
Beginning in 1999, SEAF invested $245,000 in Victoria Classics. SEAF exited the ■company 18 months later, earning an IRR of 49 percent.SEAF’s investment was used to purchase new machinery, to provide working capital ■and to finance an export promotion campaign. SEAF also provided technical assistance in marketing Victoria’s products and conducted market research to stay on top of clothing trends in the United States market.Victoria Classics is a successful company that has continued to grow as a result of ■SEAF’s investment. The company’s annual sales have grew from $294,000 when SEAF invested to $2.8 million four years later.
DEVELOPMENT HIGHLIGHTS
Suppliers: ■ Victoria Classics employs some 97 contract workers, virtually all female, who work at home, enabling them to care simultaneously for children or relatives. Most are poor women who travel long distances, and when they come to get their assignments or deliver clothes, they enjoy spending time in Victoria’s secure and modern facility and benefit from free meals provided.Suppliers: ■ Victoria also uses the services of approximately 160 local micro-entrepreneurs to prepare high-quality clothing that will be embroidered by the contract workers. This number has grown from 20 in 1998.Employees: ■ Low-skilled workers’ salaries are substantially higher than the minimum wage. Two of Victoria’s employees work full-time to provide training to employees and contract workers to help them improve their embroidery and crochet skills to the high standards set by the founders and to acquire basic record keeping and accounting skills.
EMPLOYEE INSIGHT
Maria* started with Victoria five years ago as a contract worker, and was converted to a regular emplyee in September 2002. She now works for the company full-time as a quality control supervisor. She learned embroidery from her grandmother and from a convent school. When working as a contract worker, she earned on average about NS 500 per month, but her salary now is NS 700 per month, plus health insurance and other non-salary benefits. This has become very helpful for her as she has been diagnosed with breast cancer. Since health insurance does not cover her treatment costs, the owners help her with the payments, and her colleagues organized a fund-raising event to help her defray the cost. In spite of her illness, she works and saves in an informal saving club and pays for her one child to go to private school (about NS 60 per month) to enable her to get a better education.
COMPANY DATA (2003)
Revenues $2.8 million
Gross Margin 71%
Net Margin 48%
Employees 48
% low-skilled 52%
SEAF INVESTMENT DATA (2003)
Amount Invested $245,000
Internal Rate of Return* 49%
Multiple of Capital Invested* 1.78x
QUANTITATIVE CASE STUDY RESULTS (2003)
Financial Rate of Return** 45%
Economic Rate of Return*** 57%
Net Benefit/Cost Ratio(0% discount)
4.54
Net Benefit/Cost Ratio(10% discount)
2.90
Net Benefit/Cost Ratio Breakdown by Stakeholder****
Financiers 3.94
Employees 0.39
Customers NA
Suppliers 0.13
Competitors NA
Producers of Complementary Goods/Services
0.01
Local Community 0.00
National Governments 0.07
COMPANY UPDATEAfter SEAF exited, Victoria hired SEAF’s Business Development Unit to advise on how to penetrate the US department store market and how to adjust its product line to better suit its customer base.
* Realized and Unrealized** Return to all financiers*** Return to all stakeholders**** 0% discount
* Employee name has been changed
55
Chapter 4. Conclusions and Policy Implications
SEAF’s data survey and case study analysis suggests that investing in SMEs with two distinct attributes can result in substantial social returns. These attributes are: (1) owner/entrepreneur demonstrates strong interest in and potential to grow the business; and (2) owner/entrepreneur is willing to accept third party capital and the accountability that accompanies outside financing. SEAF’s hands-on experience suggests that when these two attributes are present, SEAF is able to forge a strong investment partnership. SEAF brings to this partnership not only its capital but its substantial experience in helping companies improve both business operations and strategy. As a result, these SMEs provide reliable and growing salaries to their employees, serve as points of access for smaller local and micro-suppliers to reach larger markets, and address market deficiencies and local customer needs. They are significant partners of local and national governments, and to a quantifiable extent, contribute to “civil society” in their communities. Such benefits generally arise not because of any consciously altruistic intent of the entrepreneurs, but because of the sustainable, formal business strategies that entrepreneurs, with the help of SEAF’s partnership, pursue. Enterprises accepting third party capital must implement good governance to satisfy their investor partners and to maintain appropriate checks and balances on the parties. They must hire, train and promote the best employees they can find regardless of gender. They must comply with environmental, health and safety codes, and must become reliable and competitive counterparts for their customers. While SEAF does not wish to challenge the positive contributions of so-called “social entrepreneurs”, SEAF believes that the above factors are a necessary part of the growth and development of sustainable SMEs, and that therefore investing in such SMEs is likely to provide a more reliable and scalable means to achieve the development impact detailed in this report. We concluded from our 2004 Study that Development Finance Institutions (DFIs) and other investors can achieve a dual mandate—targeting both development and financial returns—by expanding their support for SMEs. The report also suggested ways in which policy makers and investors could leverage the beneficial effects of SMEs on economic growth and poverty reduction,34 such as using SME entrepreneurs to deliver poverty-reducing services, health coverage, training, and networking, and in targeting certain sectors of activity likely to yield higher multiplier effects. These conclusions still stand.
With this study, however, we have also concluded that SEAF, DFIs, and other responsible investors in SMEs could have an even greater impact on economic growth and poverty reduction by (1) investing in enterprises with high growth potential; (2) using the combination of the data survey and the case study approach to measure development impact; and (3) targeting investments to the types of SMEs that can achieve specific development goals, including by giving fund managers financial incentives to meet development benchmarks or focusing funds on the types of investments that can have a particularly profound impact (e.g., the “Market Aggregator” concept). These conclusions are reviewed in more detail below.
34 SEAF’s 2004 Study is available on SEAF’s website, www.seaf.com.
56
Investing in High-Growth SMEs
Our cumulative studies show that when SMEs with high growth potential35 are selected for investment (i.e., those that pass the review and due diligence of a seasoned fund manager and are willing to accept third party capital to pursue growth), they can generate not only significant financial returns), but important socioeconomic returns as well. Traditional financial markets have largely overlooked the SME sector, especially in emerging markets. There are many reasons for this; chief among them is the perceived risk of SME investment and of the emerging market in question. SEAF’s investment experience, however, has demonstrated that investing in SMEs with high growth potential can bring about financial success (for SEAF’s financial performance, see “About SEAF” at the beginning of this report) as well as much broader economic growth and poverty alleviation. With this in mind, Development Finance Institutions (DFIs) and other interested investors could achieve both development and financial returns by devising strategies that identify, invest in, and support the more promising, growth-oriented SMEs.
From SEAF’s experience, it is clear that “not all SMEs are alike”; that is, any SME development initiative should seek to find and promote, first and foremost, the growth of precisely those SMEs which have the greatest potential for growth and therefore sustainability (the section “Maximizing Development Impact” covers how, additionally, specific development impacts can be targeted depending on the objectives of the investors). From a strategic point of view, SEAF has found that its most financially successful investments meet one or more of the following criteria:
Growth-Minded Entrepreneurs Willing to be Held Accountable. ■ SEAF looks for companies managed by entrepreneurs who are interested in and committed to realizing capital appreciation over the next three to five years. Entrepreneurs should also be ready to commit to a relatively higher degree of corporate transparency than the local norm (and preferably the global standard). An entrepreneur willing to accept accountability in pushing towards the realization of a growth plan and who is willing to accept third party capital to achieve growth is the kind of entrepreneur that will be willing to take the other key steps needed to achieve sustainable growth.
Business Models that Address Market Deficiencies and Unmet Local Demand. ■ Entrepreneurs who seek in the first instance to address local market deficiencies and meet local demand are in SEAF’s experience both realistic and correctly focused on achieving results which will also achieve the developmental results identified by this Study.
Desire to Achieve Market Leadership. ■ SEAF seeks to identify entrepreneurs that wish to achieve market leadership, albeit in a narrowly defined but sustainable niche.
Multiples Growth. ■ SEAF targets entrepreneurs active in industry sectors with price/earnings or other acquisition multiples that SEAF believes are likely to grow substantially given the stage of development of a given economy.
Willingness to Exit Jointly or Buy Back at Approved Value. ■ Ideally, the entrepreneur is ready to work to exit the business with SEAF in three to five years. Alternatively, he or she must be ready to negotiate an acceptable buy back of SEAF’s interest that recognizes both the growth in value of the company and SEAF’s role in helping achieve it.
35 By “high growth potential”, we are not targeting, for example, conventional “high growth” sectors such as telecommunications and software, although such sectors may be very positive as well. Rather, we are referring to SMEs whose owners/entrepreneurs are interested in growing their businesses and demonstrate potential to do so, regardless of whether the industry is fish farming, distribution of fast moving consumer goods, or other sectors, and are willing and open to taking on third party equity capital, together with the greater accountability that is entailed.
57
The aforementioned criteria are in addition to due diligence and other prerequisites for investment, including a good local reputation for integrity and respect for people (including his or her employees), a viable business plan, a capacity to manage human resources, a willingness to contemplate improving the company through the use of technology, and a willingness to become accountable to a Board of Directors.
Only a company that can operate on a sustainable basis can continue to make a positive impact in the economy, and the selection and review process described above will help to ensure the financial success of investments and the profitability and sustainability of investees. 36
The Value of Systematic Measurement of Development Performance: Combining Case Studies with Data Surveys
Until the 2004 Study, there had been few rigorous assessments of the development impact of investments in SMEs. Empirical evidence supporting the claim that SME investment can be an effective tool for economic growth and poverty reduction is especially important to SEAF’s investors. Indeed, the study was motivated and funded in large part by development institutions (SECO, DFID, Ford Foundation, and USAID) for this purpose. In seeking to make such an assessment, SEAF was advised by outside economists to work both through a data survey as well as a “bottom-up” intensive case study method.
Taken together, this approach provides a concrete understanding of the economic and more “human” transformations resulting from SME investments. As we have seen, the data survey enables tracking and analysis of key impact indicators while the case studies allow us to quantify the impact in IRR terms (FRR and ERR) and net present value terms (Net Economic Benefit/Cost Ratio). The more intensive approach of the case studies also allows the capture of less quantifiable impacts on the lives of employees and other local stakeholders—these are the qualitative impacts that policymakers want to identify and assess. As we have seen, the data findings have been broadly consistent with the in-depth case studies, providing added credibility. Though costs prohibit SEAF from expanding the case study analysis, we will scale up the data survey to capture the effects of an ever increasing pool of SEAF investments. Going forward, SEAF intends to broaden its socioeconomic data collection to encompass its entire active portfolio. Having data on the kind of employment growth or wage growth that an SME portfolio can sustain is valuable and, we believe, will be even more revealing if continued over the life of the investments.
The ability to monitor and measure development impact is important not only so that policymakers understand the role that SMEs can play in development, but also because it gives managers and auditors of development institutions the capability to measure their success in achieving specific development goals.
There is an interest and growing effort in the development community to develop a common methodology for measuring the social value of investing in SMEs. On the basis of SEAF’s study, SEAF believes that it has “beta-tested” a replicable tool that development institutions could use to assess how SME investment activities can contribute to overall development goals. SEAF hopes that other investors, development institutions, and donors will consider this methodology in order to better understand and enhance the impact of their resources devoted to SMEs.
36 An additional benefit of an approach that prioritizes financial success, even for a donor that is not interested in financial returns, is that the SME fund then has the potential to return capital invested and generate returns that could be used for other developmental purposes. For example, USAID has invested in a number of SEAF funds in Central Europe. As it is receiving returns on its investment in these SME funds, it has decided to support the Center for Entrepreneurship and Executive Development—an organization active in Bulgaria, Romania, Slovenia, and Montenegro—which provides practical training and networking opportunities for SMEs in the Balkan region (see www.ceed-global.org). This program would not have come into existence without the reflows from investment in SMEs in SEAF’s funds in the region or SEAF’s experiences with SMEs and their areas of weakness in which training and networking could make a great difference. USAID has recognized the merits of this program with exceptional support and encouragement.
58
Maximizing Development Impact: Targeting Investments and Motivating Fund Managers
With an understanding of the specific, concrete and quantifiable development impacts that SMEs can have, development institutions and other investors can devise approaches that focus on or even enhance these impacts. All investments should be motivated by certain minimum bottom line financial returns, but development impact can be maximized by specifying—and, as we shall examine below, motivating investment managers to achieve—investment criteria to include additional measurable developmental characteristics. For example, investors with a development bias may want to incentivize fund managers to identify and invest in SMEs with one or more of the following characteristics, depending on the specific development priorities or goals of the investors:
Employ a significant proportion of people whose labor opportunity cost is low (unemployed ■and underemployed, usually represented by a high percentage of low-skilled labor and women), thus generating additional incomes with large multiplier effects.
Provide substantial non-salary benefits or implement employee benefit programs as a ■strategy to attract and retain employees;
Provide skill development and training or invest in training to meet the human resource ■needs of the company;
Work with local suppliers to improve the quality, value-added nature, or flow of inputs from ■local suppliers to the processing or distributing SME;
Engage in active compliance with local tax, labor, environmental, health and safety ■requirements and regulations; or
Engage the local community by participating in local business associations or other ■partnerships or by supporting community activities and charities in recognition that it helps to build firm reputation.
59
Examples of Development Funds
SEAF’s experience has shown that significant impact can be made by investment funds that strive to achieve development impact. For example, SEAF’s first Peru fund (FAPE) was guided in its establishment by social objectives, in which the investment parameters were to invest no more than $350,000 in SMEs preferably engaged in nontraditional exports or located in poor regions of the country. As demonstrated by the case profiles on Molino and Printop (see Chapter 2 for quantified development impact and Chapter 3 for case study highlights), the social impacts of the companies in the FAPE portfolio has been profound37. Similarly, SEAF’s North Fund was established to invest in the high unemployment regions of northern Poland. To assess the development impact of the North Fund on increasing employment in the region, SEAF’s local office tracked employment at each portfolio company. Likewise, SEAF’s newest fund, the Georgia Regional Development Fund, focuses on companies operating in the regions outside the capital city with specific measurable developmental impacts identified and compensated, while allowing a lower financial rate of return as the hurdle rate for the fund manager (see discussion below).
Motivating Fund Managers to Meet Developmental Benchmarks
Not only can investment funds achieve development goals by targeting certain investment criteria, but with a functional system to track and measure development indicators in place, investors have an opportunity to establish benchmarks that a fund should be expected to achieve. SEAF’s experience is that investors interested in the achievement of specific development benchmarks can devise an incentive structure that motivates fund managers to achieve such benchmarks.
As mentioned above, Millennium Challenge Georgia (MCG), with support from the Millennium Challenge Corporation (MCC), has recently established the Georgia Regional Development Fund (GRDF), which SEAF was selected to manage by open tender. This is the first investment fund that incorporates formal incentives to achieve development goals. Launched in late 2006, the GRDF is part of the MCG’s overall initiative to develop Georgia’s local economy. The objectives of the fund include making investments in local SMEs that will grow and expand on a sustained basis, serve as models for other Georgian entrepreneurial activities, further the development of the economy specifically outside of the capital city, Tbilisi, and contribute to the reduction of poverty in Georgia. Instrumental to achieving these objectives is the incentive structure that has been established for SEAF as the fund manger. Aside from a traditional management fee, a carried interest in the returns generated by the fund has been established which begins even when the Fund Manager has returned only 70 percent of the principal (although the carried interest becomes more meaningful only after the principal is fully returned). In addition, an annual performance bonus has been set that rewards SEAF and its management team to achieve specific development impacts. The bonus is based on the extent to which SEAF exceeds annually projected hurdles for select development performance indicators, including investees’ gross revenues (proxy for growth), aggregate wages (proxy for productivity), taxes paid (proxy for formality), and expenditures on locally sourced goods and services (proxy for multiplier effect). SEAF’s 2004 Study was taken into account when MCG established this approach, and it is hoped that this new report provides additional insights to help investors to pursue similarly structured funds.
37 However, the failure of the investors to identify quantifiable developmental objectives up front ultimately led to dissatisfaction with the fund’s results, as the shareholders increasingly focused on the financial returns as the only quantifiable measure.
60
Use of “Market Aggregator” Fund Approach to Link Micro-Borrowers to Larger Markets
As one final example of how this report can help policymakers and investors maximize the development impact of their investment and yet still achieve potentially attractive financial returns, this report provides evidence that SMEs can serve as effective “Market Aggregators”. In particular, SMEs can positively impact poor farmers or suppliers of semi-finished goods by serving as collection centers, value-added processors, and/or distributors to larger markets, as well as by providing suppliers with technical assistance (designs, instruction on growing organic fruits and vegetables, certifications, etc.) and (limited) financial support. This evidence suggests a possible role for certain SMEs to act as a mechanism for sustainably linking microfinance borrowers with growing regional and global markets.
There is increasing concern about the apparent inability of the vast majority of micro-borrowers to scale up and sustainably improve their revenues. While micro-borrowers may seek to access larger regional and global markets, numerous barriers often prevent them from doing so. These include language differences, lack of know-how, lack of working capital, a lack of understanding of consumer demands related to quality and design, lack of scale, and concerns about business risks and sustainability. Yet without accessing these markets, micro-suppliers are often taken advantage of by multiple layers of middlemen, themselves often unscrupulous, ignorant, or undercapitalized. It is hardly a wonder that the fruits of globalization, in which high value added markets could in fact be located and pay substantially higher prices for micro-suppliers, are not felt at the level of individual farmers or piece work producers. Given the amount of capital now flowing into microfinance institutions (MFIs), the need has never been greater to connect micro-borrowers to markets that they would otherwise be unable to access. A properly executed Market Aggregator fund or facility would use SMEs as a vehicle through which many micro-suppliers could expand their revenues, profits and ultimately join the formal sector. For example, SEAF’s Polish investment in Symbio permitted that company to identify and then train more than 350 small farms in rural eastern Poland in production methods for organic fruits and vegetables. By aggregating their product, and later processing such products, Symbio has been able to serve as a reliable counterparty to such large purchasers of organic product as Cascadia and Pro Natura. The result, as described in the case study on Symbio, is not only a profitable investment for SEAF’s investors and the entrepreneur, but also markedly increased profitability for the small farmers in eastern Poland. These small farmers have increased their gross profit per hectare by five to ten times their previous levels.
A Market Aggregator fund could potentially be synergistic with the needs of multinational corporations as well. While sourcing from emerging markets is potentially a cost effective way to solve the growing input needs of multinationals, the lack of organization, formality, quality and reliability of micro-suppliers poses significant risks. Multinationals obviously prefer to work though a minimum of suppliers or intermediaries who will reliably deliver consistent quality products. Market Aggregating SMEs can be an attractive intermediary through which multinationals can source from emerging market micro-suppliers.
Lastly, SEAF’s monitoring and evaluation program, with a focus on measurement of supplier impact, could be a critical component for a Market Aggregator fund. The ability to measure and monitor supplier impact, as well as the extent of impact possible as demonstrated from this report, has been the driver for this concept and would provide investors with a mechanism for measuring their intended impact.
61
Conclusion
SEAF hopes that this report will help donors, investors, and others working in the area of development better understand SMEs and their capacity to serve as drivers of economic growth and development. As is hopefully demonstrated in the Report, SMEs not only generate quality employment opportunities – sustainable jobs with increasing salaries as employees become more valuable through training and specialization – within their local communities, but also serve as a crucial link to regional and international markets for smaller local suppliers. SMEs quite literally address market deficiencies and customer needs in the local economy, thereby improving people’s lives. They make critical contributions to local government and local communities, and play a key role in the development of a stable, civil society in the developing world.
SMEs are often referred to as “the missing middle”, yet few have understood fully how critical SMEs are as the pathway to prosperity. Even fewer have sought to harness the power that these companies have to drive growth, poverty reduction, and development.
SEAF believes that the demonstrated high development impact of SMEs warrants greater attention to devising sustainable financing schemes which focus on providing risk capital in combination with integrated business assistance to SMEs. When the developmental returns are included with the purely commercial returns, there can be few investments as economically profitable in the developing world.
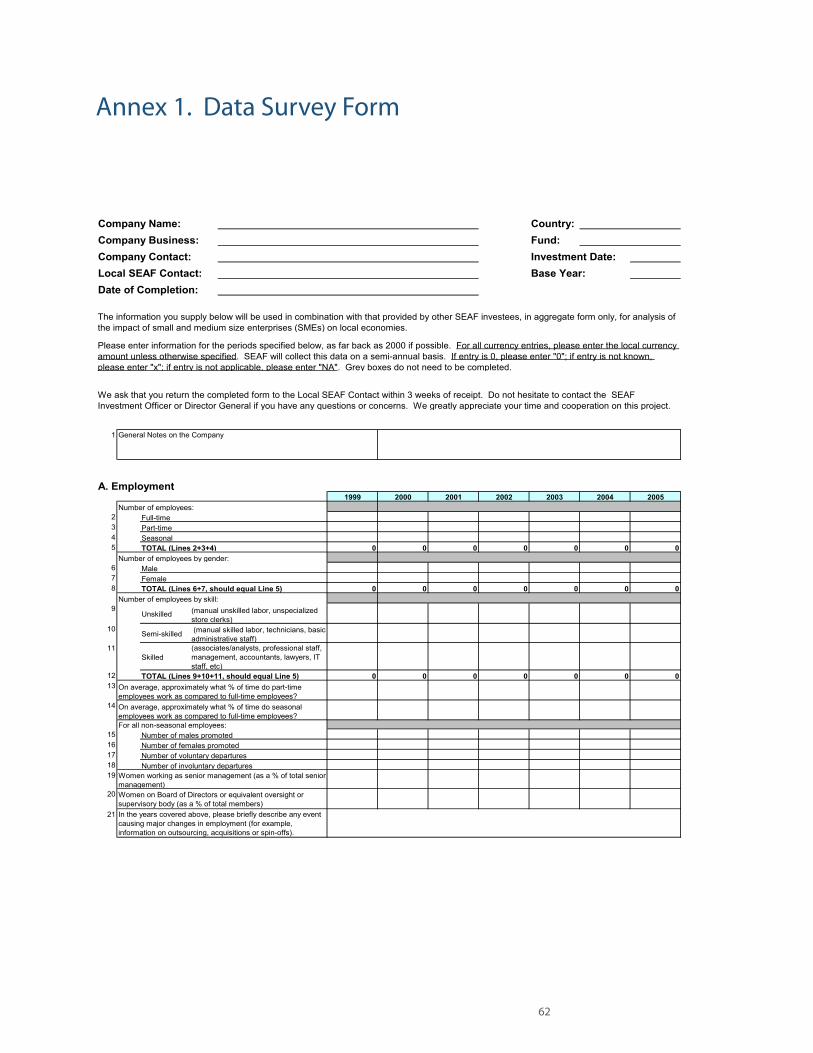
62
Annex 1. Data Survey Form
Company Name: Country:Company Business: Fund:Company Contact: Investment Date:Local SEAF Contact: Base Year:Date of Completion:
1
A. Employment1999 2000 2001 2002 2003 2004 2005
2 Full-time3 Part-time4 Seasonal5 TOTAL (Lines 2+3+4) 0 0 0 0 0 0 0
6 Male7 Female8 TOTAL (Lines 6+7, should equal Line 5) 0 0 0 0 0 0 0
9Unskilled
10Semi-skilled
11Skilled
12 TOTAL (Lines 9+10+11, should equal Line 5) 0 0 0 0 0 0 013
14
1516171819
20
21
The information you supply below will be used in combination with that provided by other SEAF investees, in aggregate form only, for analysis of the impact of small and medium size enterprises (SMEs) on local economies.
Please enter information for the periods specified below, as far back as 2000 if possible. For all currency entries, please enter the local currency amount unless otherwise specified. SEAF will collect this data on a semi-annual basis. If entry is 0, please enter "0"; if entry is not known, please enter "x"; if entry is not applicable, please enter "NA". Grey boxes do not need to be completed.
We ask that you return the completed form to the Local SEAF Contact within 3 weeks of receipt. Do not hesitate to contact the SEAF Investment Officer or Director General if you have any questions or concerns. We greatly appreciate your time and cooperation on this project.
Number of employees by gender:
On average, approximately what % of time do part-time employees work as compared to full-time employees?
Women working as senior management (as a % of total senior management)
Number of females promotedNumber of voluntary departuresNumber of involuntary departures
Women on Board of Directors or equivalent oversight or supervisory body (as a % of total members)In the years covered above, please briefly describe any event causing major changes in employment (for example, information on outsourcing, acquisitions or spin-offs).
Number of employees:
For all non-seasonal employees:
General Notes on the Company
Number of employees by skill:
Number of males promoted
(associates/analysts, professional staff, management, accountants, lawyers, IT staff, etc)
(manual skilled labor, technicians, basic administrative staff)
(manual unskilled labor, unspecialized store clerks)
On average, approximately what % of time do seasonal employees work as compared to full-time employees?
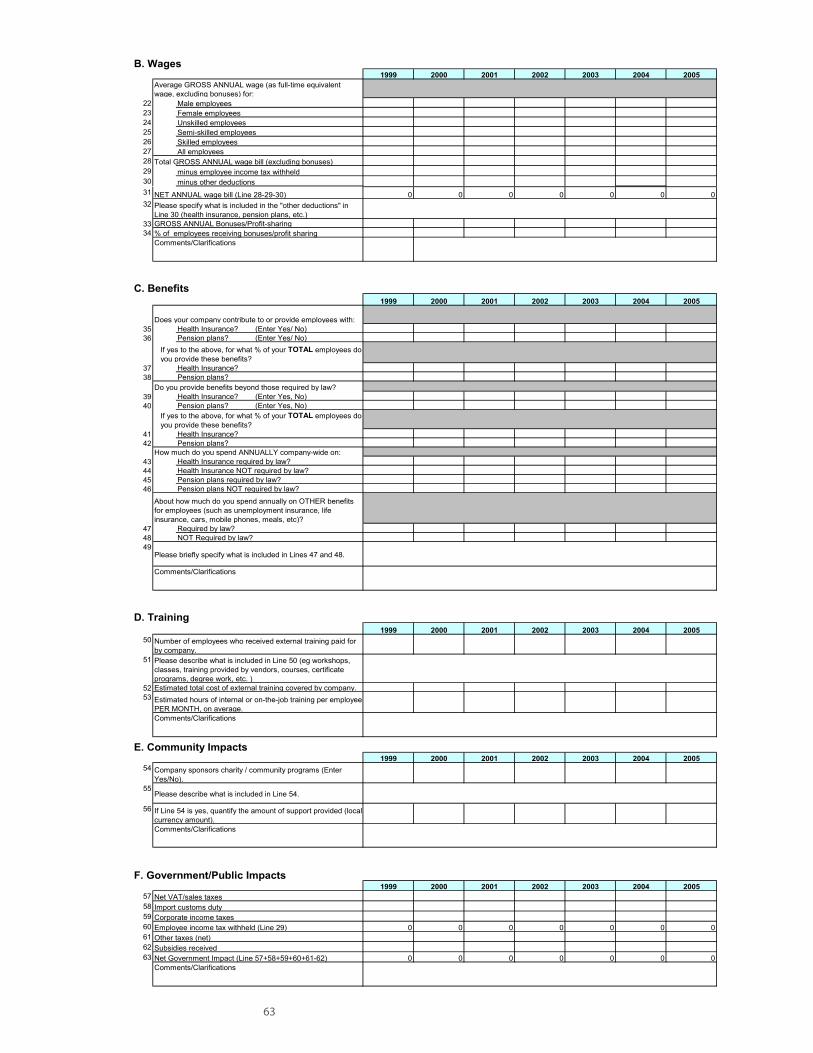
63
B. Wages1999 2000 2001 2002 2003 2004 2005
22232425262728 Total GROSS ANNUAL wage bill (excluding bonuses)29 minus employee income tax withheld30 minus other deductions
Average GROSS ANNUAL wage (as full-time equivalent wage, excluding bonuses) for:
All employeesSkilled employees
Male employees
Semi-skilled employees
Female employeesUnskilled employees
31 NET ANNUAL wage bill (Line 28-29-30) 0 0 0 0 0 0 032
3334 % of employees receiving bonuses/profit sharing
C. Benefits1999 2000 2001 2002 2003 2004 2005
35 Health Insurance? (Enter Yes/ No)36 Pension plans? (Enter Yes/ No)
37 Health Insurance?38 Pension plans?
39 Health Insurance? (Enter Yes, No)40 Pension plans? (Enter Yes, No)
41 Health Insurance?42 Pension plans?
How much do you spend ANNUALLY company-wide on:43 Health Insurance required by law?44 Health Insurance NOT required by law?45 Pension plans required by law?46 Pension plans NOT required by law?
47 Required by law?48 NOT Required by law?49
Please briefly specify what is included in Lines 47 and 48.
D. Training1999 2000 2001 2002 2003 2004 2005
50
51
5253
Does your company contribute to or provide employees with:
Number of employees who received external training paid for by company.
Comments/Clarifications
Please specify what is included in the "other deductions" in Line 30 (health insurance, pension plans, etc.)GROSS ANNUAL Bonuses/Profit-sharing
Do you provide benefits beyond those required by law?
Comments/Clarifications
If yes to the above, for what % of your TOTAL employees do you provide these benefits?
If yes to the above, for what % of your TOTAL employees do you provide these benefits?
Please describe what is included in Line 50 (eg workshops, classes, training provided by vendors, courses, certificate programs, degree work, etc. )
Comments/Clarifications
About how much do you spend annually on OTHER benefits for employees (such as unemployment insurance, life insurance, cars, mobile phones, meals, etc)?
Estimated total cost of external training covered by company.Estimated hours of internal or on-the-job training per employee PER MONTH, on average.
E. Community Impacts1999 2000 2001 2002 2003 2004 2005
54
55Please describe what is included in Line 54.
56
F. Government/Public Impacts1999 2000 2001 2002 2003 2004 2005
57 Net VAT/sales taxes58 Import customs duty5960 0 0 0 0 0 0 06162 Subsidies received63 Net Government Impact (Line 57+58+59+60+61-62) 0 0 0 0 0 0 0
Other taxes (net)
Corporate income taxes
Comments/Clarifications
If Line 54 is yes, quantify the amount of support provided (local currency amount).Comments/Clarifications
Company sponsors charity / community programs (Enter Yes/No).
Employee income tax withheld (Line 29)
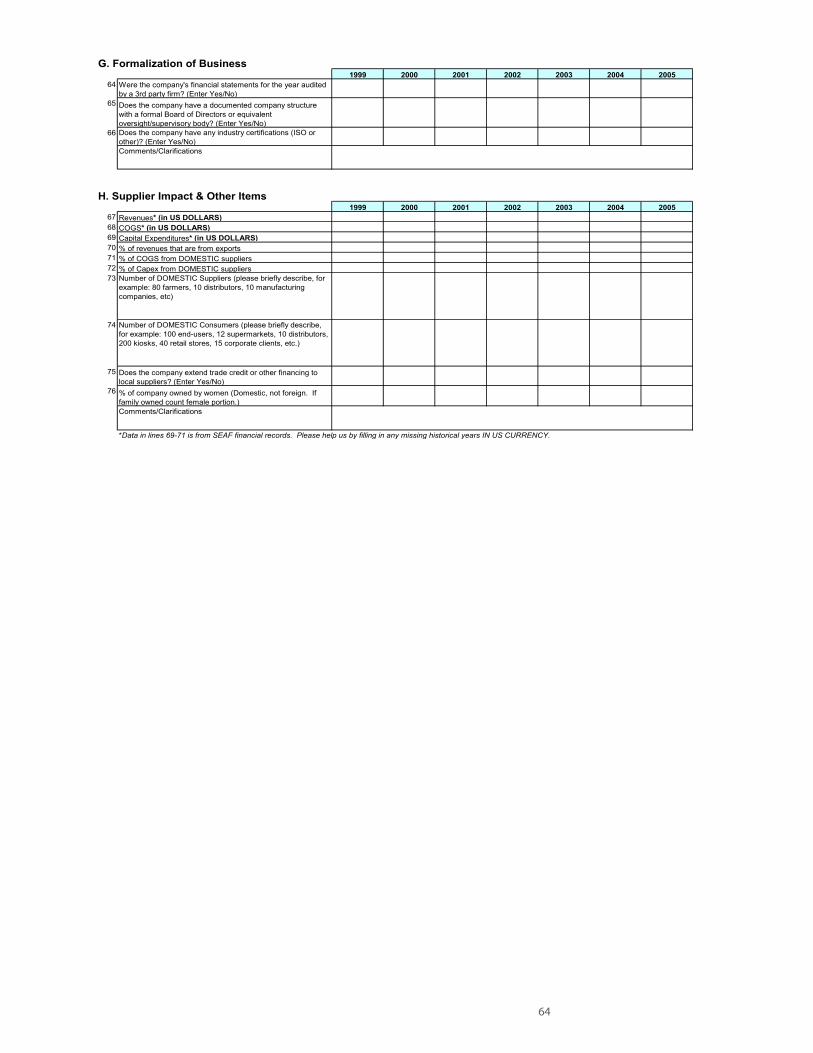
64
G. Formalization of Business1999 2000 2001 2002 2003 2004 2005
64
65
66
H. Supplier Impact & Other Items1999 2000 2001 2002 2003 2004 2005
67 Revenues* (in US DOLLARS)68 COGS* (in US DOLLARS)69 Capital Expenditures* (in US DOLLARS)70 % of revenues that are from exports71 % of COGS from DOMESTIC suppliers72 % of Capex from DOMESTIC suppliers73
74
75
76
Comments/Clarifications
% of company owned by women (Domestic, not foreign. If family owned count female portion.)
Does the company extend trade credit or other financing to local suppliers? (Enter Yes/No)
Does the company have any industry certifications (ISO or other)? (Enter Yes/No)Comments/Clarifications
Number of DOMESTIC Suppliers (please briefly describe, for example: 80 farmers, 10 distributors, 10 manufacturing companies, etc)
Number of DOMESTIC Consumers (please briefly describe, for example: 100 end-users, 12 supermarkets, 10 distributors, 200 kiosks, 40 retail stores, 15 corporate clients, etc.)
*Data in lines 69-71 is from SEAF financial records. Please help us by filling in any missing historical years IN US CURRENCY.
Does the company have a documented company structure with a formal Board of Directors or equivalent oversight/supervisory body? (Enter Yes/No)
Were the company's financial statements for the year audited by a 3rd party firm? (Enter Yes/No)
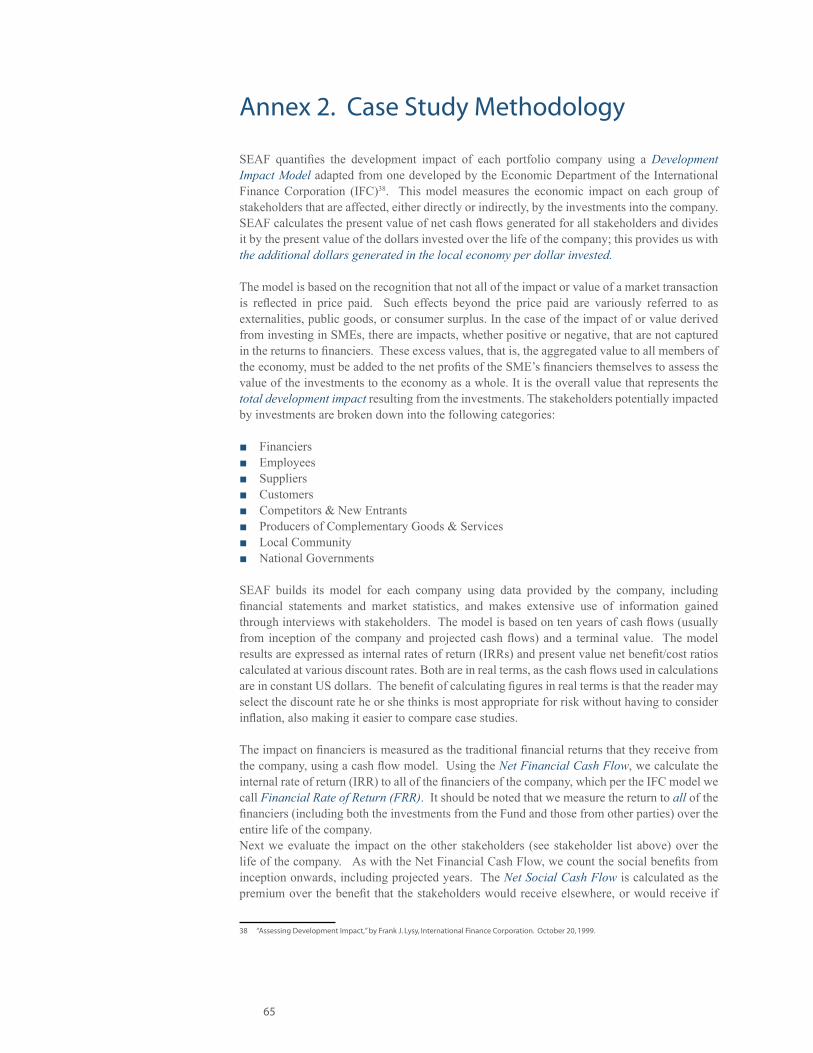
65
Annex 2. Case Study Methodology
SEAF quantifies the development impact of each portfolio company using a Development Impact Model adapted from one developed by the Economic Department of the International Finance Corporation (IFC)38. This model measures the economic impact on each group of stakeholders that are affected, either directly or indirectly, by the investments into the company. SEAF calculates the present value of net cash flows generated for all stakeholders and divides it by the present value of the dollars invested over the life of the company; this provides us with the additional dollars generated in the local economy per dollar invested.
The model is based on the recognition that not all of the impact or value of a market transaction is reflected in price paid. Such effects beyond the price paid are variously referred to as externalities, public goods, or consumer surplus. In the case of the impact of or value derived from investing in SMEs, there are impacts, whether positive or negative, that are not captured in the returns to financiers. These excess values, that is, the aggregated value to all members of the economy, must be added to the net profits of the SME’s financiers themselves to assess the value of the investments to the economy as a whole. It is the overall value that represents the total development impact resulting from the investments. The stakeholders potentially impacted by investments are broken down into the following categories:
Financiers ■Employees ■Suppliers ■Customers ■Competitors & New Entrants ■Producers of Complementary Goods & Services ■Local Community ■National Governments ■
SEAF builds its model for each company using data provided by the company, including financial statements and market statistics, and makes extensive use of information gained through interviews with stakeholders. The model is based on ten years of cash flows (usually from inception of the company and projected cash flows) and a terminal value. The model results are expressed as internal rates of return (IRRs) and present value net benefit/cost ratios calculated at various discount rates. Both are in real terms, as the cash flows used in calculations are in constant US dollars. The benefit of calculating figures in real terms is that the reader may select the discount rate he or she thinks is most appropriate for risk without having to consider inflation, also making it easier to compare case studies.
The impact on financiers is measured as the traditional financial returns that they receive from the company, using a cash flow model. Using the Net Financial Cash Flow, we calculate the internal rate of return (IRR) to all of the financiers of the company, which per the IFC model we call Financial Rate of Return (FRR). It should be noted that we measure the return to all of the financiers (including both the investments from the Fund and those from other parties) over the entire life of the company. Next we evaluate the impact on the other stakeholders (see stakeholder list above) over the life of the company. As with the Net Financial Cash Flow, we count the social benefits from inception onwards, including projected years. The Net Social Cash Flow is calculated as the premium over the benefit that the stakeholders would receive elsewhere, or would receive if
38 “Assessing Development Impact,” by Frank J. Lysy, International Finance Corporation. October 20, 1999.
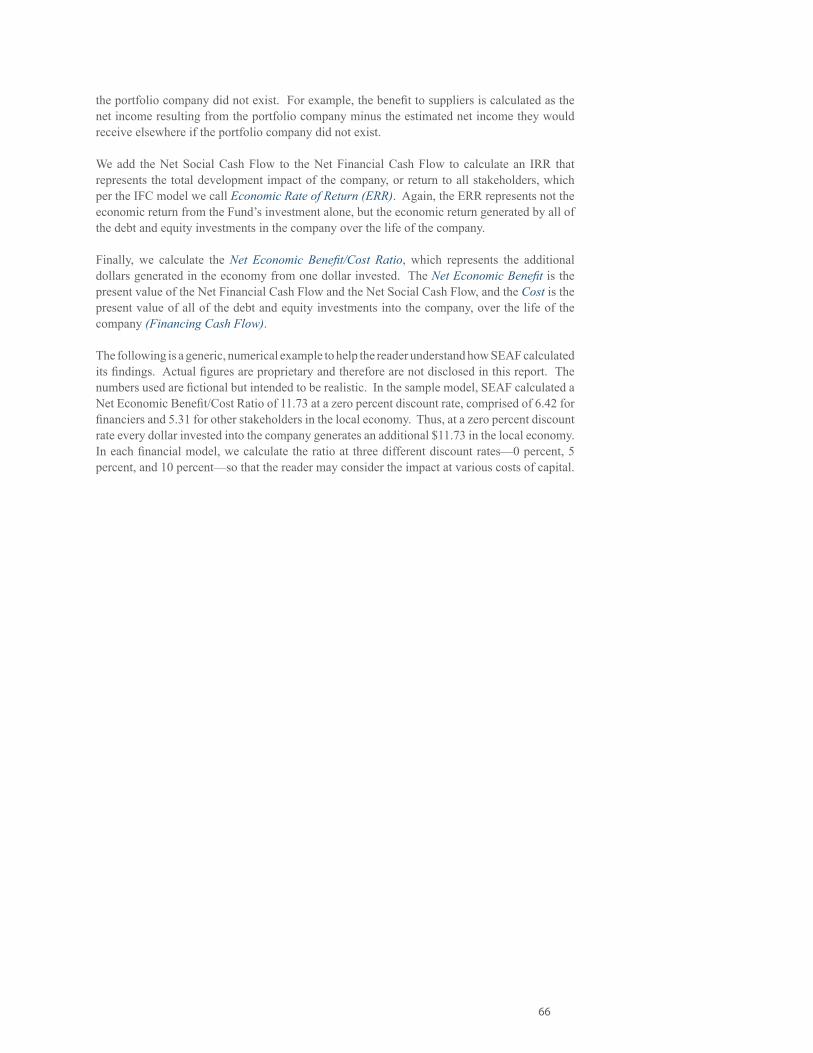
66
the portfolio company did not exist. For example, the benefit to suppliers is calculated as the net income resulting from the portfolio company minus the estimated net income they would receive elsewhere if the portfolio company did not exist.
We add the Net Social Cash Flow to the Net Financial Cash Flow to calculate an IRR that represents the total development impact of the company, or return to all stakeholders, which per the IFC model we call Economic Rate of Return (ERR). Again, the ERR represents not the economic return from the Fund’s investment alone, but the economic return generated by all of the debt and equity investments in the company over the life of the company.
Finally, we calculate the Net Economic Benefit/Cost Ratio, which represents the additional dollars generated in the economy from one dollar invested. The Net Economic Benefit is the present value of the Net Financial Cash Flow and the Net Social Cash Flow, and the Cost is the present value of all of the debt and equity investments into the company, over the life of the company (Financing Cash Flow).
The following is a generic, numerical example to help the reader understand how SEAF calculated its findings. Actual figures are proprietary and therefore are not disclosed in this report. The numbers used are fictional but intended to be realistic. In the sample model, SEAF calculated a Net Economic Benefit/Cost Ratio of 11.73 at a zero percent discount rate, comprised of 6.42 for financiers and 5.31 for other stakeholders in the local economy. Thus, at a zero percent discount rate every dollar invested into the company generates an additional $11.73 in the local economy. In each financial model, we calculate the ratio at three different discount rates—0 percent, 5 percent, and 10 percent—so that the reader may consider the impact at various costs of capital.
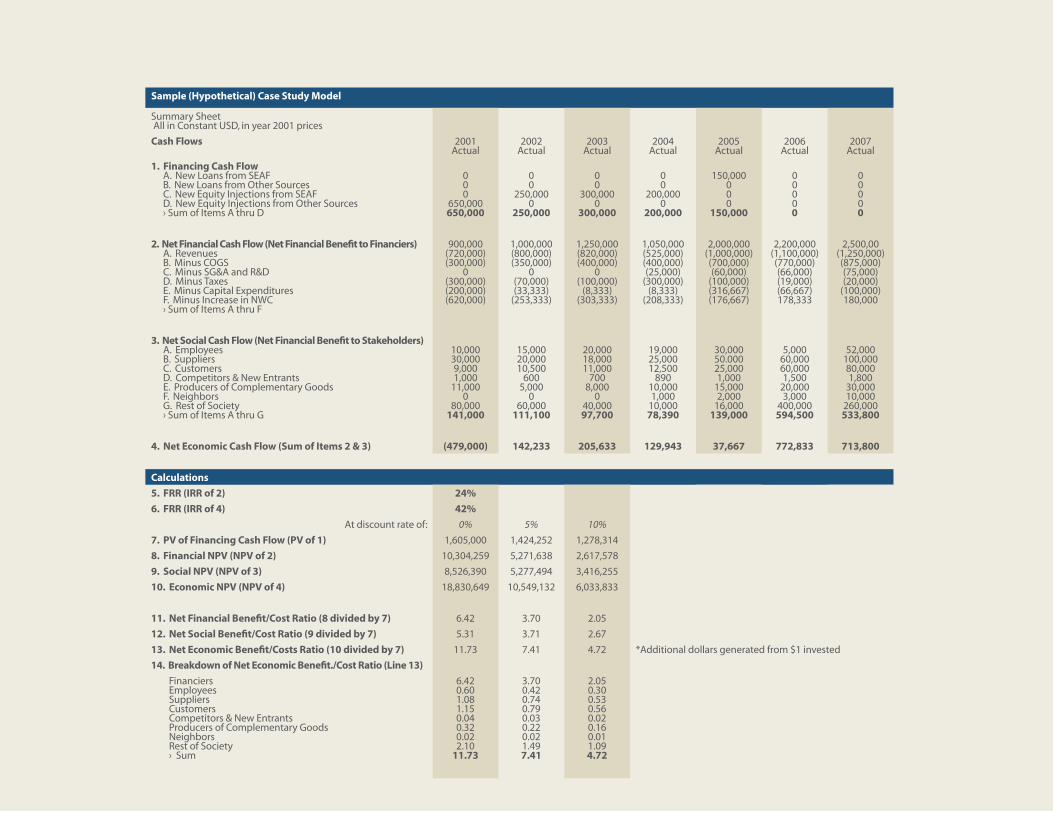
67
Sample (Hypothetical) Case Study Model
Summary Sheet All in Constant USD, in year 2001 prices
Cash Flows 2001Actual
2002Actual
2003Actual
2004Actual
2005Actual
2006Actual
2007Actual
1. Financing Cash FlowA. New Loans from SEAFB. New Loans from Other SourcesC. New Equity Injections from SEAFD. New Equity Injections from Other Sources› Sum of Items A thru D
000
650,000650,000
00
250,0000
250,000
00
300,0000
300,000
00
200,0000
200,000
150,000000
150,000
00000
00000
2. Net Financial Cash Flow (Net Financial Benefit to Financiers)A. RevenuesB. Minus COGSC. Minus SG&A and R&DD. Minus TaxesE. Minus Capital ExpendituresF. Minus Increase in NWC› Sum of Items A thru F
900,000(720,000)(300,000)
0(300,000)(200,000)(620,000)
1,000,000(800,000)(350,000)
0(70,000)(33,333)
(253,333)
1,250,000(820,000)(400,000)
0(100,000)
(8,333)(303,333)
1,050,000(525,000)(400,000)(25,000)
(300,000)(8,333)
(208,333)
2,000,000(1,000,000)(700,000)(60,000)
(100,000)(316,667)(176,667)
2,200,000(1,100,000)(770,000)(66,000)(19,000)(66,667)178,333
2,500,00(1,250,000)(875,000)(75,000)(20,000)
(100,000)180,000
3. Net Social Cash Flow (Net Financial Benefit to Stakeholders)A. EmployeesB. SuppliersC. CustomersD. Competitors & New EntrantsE. Producers of Complementary GoodsF. NeighborsG. Rest of Society› Sum of Items A thru G
10,00030,0009,0001,000
11,0000
80,000141,000
15,00020,00010,500
6005,000
060,000
111,100
20,00018,00011,000
7008,000
040,00097,700
19,00025,00012,500
89010,0001,000
10,00078,390
30,00050.00025,0001,000
15,0002,000
16,000139,000
5,00060,00060,0001,500
20,0003,000
400,000594,500
52,000100,00080,0001,800
30,00010,000
260,000533,800
4. Net Economic Cash Flow (Sum of Items 2 & 3) (479,000) 142,233 205,633 129,943 37,667 772,833 713,800
Calculations
5. FRR (IRR of 2) 24%
6. FRR (IRR of 4) 42%
At discount rate of: 0% 5% 10%
7. PV of Financing Cash Flow (PV of 1) 1,605,000 1,424,252 1,278,314
8. Financial NPV (NPV of 2) 10,304,259 5,271,638 2,617,578
9. Social NPV (NPV of 3) 8,526,390 5,277,494 3,416,255
10. Economic NPV (NPV of 4) 18,830,649 10,549,132 6,033,833
11. Net Financial Benefit/Cost Ratio (8 divided by 7) 6.42 3.70 2.05
12. Net Social Benefit/Cost Ratio (9 divided by 7) 5.31 3.71 2.67
13. Net Economic Benefit/Costs Ratio (10 divided by 7) 11.73 7.41 4.72 *Additional dollars generated from $1 invested
14. Breakdown of Net Economic Benefit./Cost Ratio (Line 13)
FinanciersEmployeesSuppliersCustomersCompetitors & New EntrantsProducers of Complementary GoodsNeighborsRest of Society› Sum
6.420.601.081.150.040.320.022.10
11.73
3.700.420.740.790.030.220.021.497.41
2.050.300.530.560.020.160.011.094.72
68
Annex 3. Representative List of SEAF Investors
AFP Integra ■AFP Prima ■Baltics American Enterprise Fund (BalAEF) ■Belgian Investment Office (BIO) ■Black Sea Trade and Development Bank (BSTDB) ■Calvert Social Investment Fund ■Calvert World Values International Equity Fund ■Colfondos ■Deutsche Investions- und Entwicklungsgesellschaft (DEG) ■Evangelische Kirche in Hesse and Nassau (EKHN) (Pension Fund) ■European Bank for Reconstruction and Development (EBRD) ■FMO ■Finnish Fund for Industrial Cooperation (Finnfund) ■Ford Foundation ■Foundation for the Development of Polish Agriculture (FDPA) ■International Finance Corporation (IFC) ■Kazakh National Innovation Fund (KIF) ■Kotak Mahindra Bank ■Life Insurance Corporation of India (LIC) ■Millennium Challenge Georgia Fund (MCG) ■New York Life International, Inc. ■Norwegian Investment Fund for Developing Countries (Norfund) ■Polish Cooperation Fund ■Pound Capital ■Proteccion ■Provenir ■Seguros Suramericana ■Small Industries Development Bank of India (SIDBI) ■State Secretariat for Economic Affairs (SECO) ■Swedfund International AB of Sweden ■Swiss Investment Fund for Emerging Markets (SIFEM) ■U.S. Agency for International Development (USAID) ■
69
SEAF1050 17th Street NWSuite 1150Washington, D.C. 20036USA
Tel: (202) 737-8463 Fax: (202) 737-5536www.seaf.com