Embed Size (px)
Citation preview

Mälardalen University Press DissertationsNo. 202
FROM PASSIVE TO ACTIVE ELECTRIC DISTRIBUTION NETWORKS
Javier Campillo
2016
School of Business, Society and Engineering
Mälardalen University Press DissertationsNo. 202
FROM PASSIVE TO ACTIVE ELECTRIC DISTRIBUTION NETWORKS
Javier Campillo
2016
School of Business, Society and Engineering

Copyright © Javier Campillo,2016ISBN 978-91-7485-271-4ISSN 1651-4238Printed by Arkitektkopia, Västerås, Sweden

Copyright © Javier Campillo,2016ISBN 978-91-7485-271-4ISSN 1651-4238Printed by Arkitektkopia, Västerås, Sweden
Mälardalen University Press DissertationsNo. 202
FROM PASSIVE TO ACTIVE ELECTRIC DISTRIBUTION NETWORKS
Javier Campillo
Akademisk avhandling
som för avläggande av teknologie doktorsexamen i energi- och miljöteknik vidAkademin för ekonomi, samhälle och teknik kommer att offentligen försvaras
fredagen den 17 juni 2016, 09.15 i Paros, Mälardalens högskola, Västerås.
Fakultetsopponent: Professor Wu Jianzhong, Cardiff University
Akademin för ekonomi, samhälle och teknik
Mälardalen University Press DissertationsNo. 202
FROM PASSIVE TO ACTIVE ELECTRIC DISTRIBUTION NETWORKS
Javier Campillo
Akademisk avhandling
som för avläggande av teknologie doktorsexamen i energi- och miljöteknik vidAkademin för ekonomi, samhälle och teknik kommer att offentligen försvaras
fredagen den 17 juni 2016, 09.15 i Paros, Mälardalens högskola, Västerås.
Fakultetsopponent: Ph.D. Ritwik Majumder, ABB Corporate Research
Akademin för ekonomi, samhälle och teknik

AbstractLarge penetration of distributed generation from variable renewable energy sources, increasedconsumption flexibility on the demand side and the electrification of transportation pose greatchallenges to existing and future electric distribution networks. This thesis studies the roles of severalactors involved in electric distribution systems through electricity consumption data analysis andsimulation models. Results show that real-time electricity pricing adoption in the residential sectoroffers economic benefits for end consumers. This occurs even without the adoption of demand-side management strategies, while real-time pricing also brings new opportunities for increasingconsumption flexibility. This flexibility will play a critical role in the electrification of transportation,where scheduled charging will be required to allow large penetration of EVs without compromisingthe network's reliability and to minimize upgrades on the existing grid. All these issues add significantcomplexity to the existing infrastructure and conventional passive components are no longer sufficientto guarantee safe and reliable network operation. Active distribution networks are therefore required,and consequently robust and flexible modelling and simulation computational tools are needed fortheir optimal design and control. The modelling approach presented in this thesis offers a viablesolution by using an equation-based object-oriented language that allows developing open sourcenetwork component models that can be shared and used unambiguously across different simulationenvironments.
ISBN 978-91-7485-271-4 ISSN 1651-4238

To my wife and all my family

Acknowledgements
This thesis was carried out at the School of Business, Society and En-gineering at Mlardalen University in Vasteras, Sweden. First, I wouldlike to thank my main supervisor, Erik Dahlquist for all his support andguidance throughout these years as well as Fredrik Wallin for all thefruitful discussions. I would also like to thank the Tecnologica de Bo-livar University, in Colombia, for all your support to start my doctoralstudies as well as my colleagues there for encouraging my research.
Furthermore, thanks to all the members of the PLEEC project foreverything you taught me about how to make our cities more sustain-able and all the great memories from our workshops. I want to expressmy gratitude to Alberto Traverso, Stefano Barberis and the amazingteam at the thermochemical power group at Genoa University, for theirhospitality during my research stay, all the stimulating discussions andpizza Tuesdays!.
My most sincere thanks to Iana Vassileva for her invaluable support,Ivo Krustok and Richard Thygesen for our endless talks that sometimesended up in productive collaboration. To Nathan, Lukas, Pietro and allthe fellow PhD students and colleagues at MDH for all the fun moments,fikas and of course, random conversations that helped taking the edgeo↵ where simulations were not working out.
Special thanks to my family: my mother, for encouraging me topursue my dreams, my father, for teaching me to always move forward,my sisters and niece, Carolina, Elizabeth and Gabriela, for their funpresence via Facetime, Nurys, for her unconditional support and mycousin, Patricia, for being a role model who taught me how to enjoy life.
I would also like to thank all of my friends in Colombia for theirsupport over the distance and those in Sweden who became my familyhere and helped me stay sane throughout these years.
Last but not least, I would like to thank my beloved wife, Lisette,for being my partner in crime, who spent sleepless nights while I waswriting and always motivated me to strive towards my goal.
Summary
Existing and future electric distribution networks face great technicalchallenges from several directions: on one hand, increased penetration ofdistributed generation (DG) changes the top-down unidirectional powerflow; on the other, electricity markets are becoming more flexible to re-spond to price fluctuations introduced by larger penetration of variablerenewable energy sources, which in turn offers new possibilities for cus-tomers to play an active role by adjusting their consumption patternsto market variations; finally, the electrification of transportation willincrease the electricity demand rapidly, and therefore an active infras-tructure that can supply reliable power at all times must be available.
This thesis studies the roles of two major actors involved in the de-velopment of these new active distribution networks: active customersand DG. Making use of data obtained from the mature automated me-ter reading infrastructure available in Sweden, this work started with ananalysis of electricity consumption patterns in a large residential arealocated in Sollentuna, near Stockholm, with two distinct groups of cus-tomers; one group connected to the district heating network and anothergroup with its own heat pump based heating system. This informationallowed electricity consumption patterns of both customer groups to beevaluated. Furthermore, in order to determine strategies that wouldincrease consumers’ demand flexibility, the Swedish electricity marketwas studied to identify opportunities from existing electricity contractoptions that offered variable pricing schemes. Different pricing schemeswere evaluated, with special focus on real-time pricing (RTP), to deter-mine the economic impact on customers from both groups. It was foundthat RTP offered economic benefits on both groups, especially on thosethat used heat pumps, even without adopting demand-side managementstrategies.
Additionally, a library was built using the open source, object-orientedmodelling language Modelica, to carry out steady-state simulations oflow-voltage distribution networks with large penetration of DG. Fur-

thermore, this library was used to simulate different penetration levelsof electric vehicles (EVs) to evaluate the impact of different scenarioson electricity consumption and network performance. It was found thatwith uncontrolled charging, voltage violations occurred with EV pene-tration levels as low as 30%. Therefore, optimal load shifting strategiesshould be developed in order to prevent overloading the distributionnetwork during peak hours. Furthermore, the approach used opens newpossibilities for unambiguous modelling and simulation of active distri-bution networks by allowing reuse of model components and sharing oflibraries across different simulation platforms.

Sammanfattning
Dagens elnät står inför stora utmaningar: ökad andel distribuerad pro-duktion gör att dagens enkelriktade kraftflöden allt oftare kommer varadubbelriktat; elmarknaden behöver bli mer flexibel för att svara på för-väntade ökade prisfluktuationer på grund av ökad lokal förnybar elpro-duktion, vilket i sin tur ger nya möjligheter för kunden att spela en meraaktiv roll genom att anpassa sitt konsumtionsmönster till marknadensökade prisvariationer; slutligen kommer den förväntade elektrifiering avfordon att öka efterfrå gan på el och behovet av en aktiv infrastruktursom kan leverera vid alla tillfällen.
Denna avhandling studerar de två främsta aktörerna som är engage-rade i utvecklingen av allt mera aktiva distributionsnät: aktiva kunderoch distribuerad elproduktion. Detta arbete började med att analyseraelförbrukningsmönster i ett stort bostadsområ de som ligger i Sollentu-na utanför Stockholm, med en blandad grupp av konsumenter. Konsu-menterna klassificerades i en grupp som är anslutna till fjärrvärmenätetoch en andra grupp som har egen värmepump. Elförbrukningsmönst-ret utvärderades på skilt för dessa bå da kundgrupperna. I syfte attfastställa strategier som kan öka konsumenternas förbrukningsflexibili-tet, har kontrakt tillgängliga på den svenska elmarknaden undersökts.De elkontraktens olika prissättningssystemen utvärderades, med fokuspå realtidsprissättning, för att fastställa de ekonomiska konsekvensernaför konsumenterna frå n de bå da undersökta grupperna. Det konsta-terades att realtidsprissättning erbjuder ekonomiska fördelar för bå dagrupperna, särskilt för de konsumtenter som använder värmepumpar.
För att analysera den roll som distribuerad elproduktion har i ak-tiva distributionsnät, har ett modell-bibliotek utvecklats med hjälp avdet objektorienterade och öppna källkodssprå ket Modelica. Modeller-na används för att utföra jämvikts (steady-state) simuleringar av låg-spänningsdistributionsnät med stor andel av distribuerad elproduktion.Därtill har modellerna använts för att simulera olika penetrationsnivåer av elfordon, för att utvärdera effekterna av olika scenarier på elför-

brukning och distributionsnätets stabilitets. Resultatet visar på att medokontrollerad laddning av elfordon inträffar spänningsstörningar redanvid penetrationsnivå er så lå ga som 30 %. Strategier för att flytta endel laster behöver utvecklas för att förhindra överbelastning av distribu-tionsnätet under topplastperioder. Därtill öppnar den använda metodenför nya möjligheter för modellering och simulering av aktiva distribu-tionsnät, genom å teranvändning av modell-komponenter och delning avmodell-bibliotek mellan olika simuleringsplattformar.

List of Papers
Publications Included in the Thesis
I J. Campillo, E. Dahlquist, F. Wallin, I. Vassileva. (2016). Real-Time Electricity Pricing in Sweden: is it economically viable forusers without demand-side management? Energy JournalDOI:10.1016/j.energy.2016.04.105
II J. Campillo, I. Vassileva, E. Dahlquist, and L. Lundstrm. (2016).Beyond the Building Understanding Building Renovations in Rela-tion to Urban Energy Systems. Journal of Settlements and SpatialPlanning, vol. 2016, pp. 3139, DOI:10.19188/04JSSPSI052016
III J. Campillo, F. Wallin, I. Vassileva, and E. Dahlquist.(2012). Elec-tricity demand impact from increased use of ground sourced heatpumps. in 2012 3rd IEEE PES Innovative Smart Grid TechnologiesEurope (ISGT Europe), 2012, pp. 17.DOI:10.1109/ISGTEurope.2012.6465876
IV I. Vassileva, J. Campillo. (2016). Adoption barriers for Electric Ve-hicles: Experiences from early Adopters in Sweden. Energy Journal.(*Submitted Feb 2016)
V J. Campillo, S. Barberis, A. Traverso, K. Kyprianidis, I. Vassileva(2015). Open-Source Modelling and Simulation of Microgrids andActive Distribution Networks. In Sustainable Places 2015 (pp.9199). Sigma Orionis.
VI I. Vassileva, R. Thygesen, J. Campillo and S. Schwede. (2015).From Goals to Action: The Efforts for Increasing Energy Efficiencyand Integration of Renewable Sources in Eskilstuna, Sweden. Re-sources 2015, 4, 548-565; DOI:10.3390/resources4030548
Publications not included in the Thesis
I Vassileva, I., & Campillo, J. (2016). Consumers Perspective onFull-Scale Adoption of Smart Meters: A Case Study in V asteras,Sweden. Resources, 5(1), 3. DOI:10.3390/resources5010003
II J. Campillo, E. Dahlquist, E. Lindhult and I. Vassileva. (2016).Technology Capacity Assessment for Developing City Action Plansto Increase Energy Efficiency in Mid Sized Cities in Europe. EnergyProcedia, 2016.
III I. Vassileva, E. Lindhult, J. Campillo (2016). The Citizen’s Role inSmart City Development. Energy Procedia, 2016.
IV M. Kullman, J. Campillo, E. Dahlquist, C. Fertner, J. Grosse, N.B. Groth, G. Haindlmaier, F. Strohmayer, J. Haselberger (2016).Note : The PLEEC Project Planning for Energy Efficient Cities,Journal of Settlements and Spatial Planning, vol. 2016, no. 8992,p. 3, 2016. DOI:10.19188/09JSSPSI052016
V Qie Sun, Zhanyu Ma, Hailong Li, Chao Wang, Javier Campillo,Fredrik Wallin, J. G. (2015). A Comprehensive Review of SmartMeters in Intelligent Energy Networks. IEEE Internet of ThingsJournal, 4662 (Special Issue on Large-Scale IoT), 16.DOI:10.1109/JIOT.2015.2512325
VI J. Campillo, N. Ghaviha, N. Zimmerman and E. Dahlquist. (2015).”Flow batteries use potential in heavy vehicles,” Electrical Systemsfor Aircraft, Railway, Ship Propulsion and Road Vehicles (ESARS),2015 International Conference on, Aachen, 2015, pp. 1-6.DOI:10.1109/ESARS.2015.7101496
VII I. Vassileva and J. Campillo. (2014). Increasing energy efficiency inlow-income households through targeting awareness and behavioralchange. Renewable Energy, 67, 5963.DOI:10.1016/j.renene.2013.11.046
VIII I. Vassileva and J. Campillo. (2014). Eskilstuna (Sweden) as an ex-ample of a smart city from an energy efficiency perspective. WorldRenewable Energy Congress. University of Kingston, London 3-8August, 2014.
IX J. Campillo, E. Dahlquist and I. Vassileva. (2014). Smart GridFlexible Modeling and Simulation using Modelica. World Renew-

able Energy Congress. University of Kingston, London 3-8 August,2014.
X J. Campillo, E. Dahlquist and R. Spath. (2014). Smart Homesas Integrated Living Environments. Volume 4 Intelligent EnergySystems. Handbook of Clean Energy Systems. John Wiley andSons. DOI:10.1002/9781118991978
XI I. Vassileva, F. Wallin, E. Dahlquist and J. Campillo. (2013). En-ergy consumption feedback devices impact evaluation on domesticenergy use. Applied Energy, 106, 314320. DOI:10.1016/j.apenergy.2013.01.059
XII I. Vassileva, J. Campillo, F. Wallin and E. Dahlquist. (2013) Com-paring the characteristics of Different High-Income Households inOrder to Improve Energy Awareness Strategies. 5th InternationalConference on Applied Energy Pretoria, South Africa, 1-4 July,2013
XIII J. Campillo, F. Wallin, I. Vassileva and E. Dahlquist. (2013). Eco-nomic Impact of Dynamic Electricity Pricing Mechanisms Adoptionfor Households in Sweden. In World Renewable Energy Congress2013. Perth, Australia.
XIV I. Vassileva, J. Campillo, E. Dahlquist. (2013). Increasing en-ergy efficiency in low- income Swedish households through targetingawareness and behavior. World Renewable Energy Congress 2013,Murdoch University, Western Australia, 14-18 July, 2013.
XV J. Campillo, D. Torstensson, F. Wallin, I. Vassileva. (2012). EnergyDemand Model Design for Forecasting Electricity Consumption andSimulating Demand Response Scenarios in Sweden. July 5-8, 2012,Suzhou, China.
XVI D. Torstensson, F. Wallin, I. Vassileva, J. Campillo. (2012). Large-Scale Energy Intervention Scenarios as a Method Investigating De-mand Response Potentials. July 5-8, 2012, Suzhou, China.

Contents
1 Introduction 1
1.1 Background and motivation . . . . . . . . . . . . . . . . . 1
1.2 Main Research Question . . . . . . . . . . . . . . . . . . . 3
1.3 Research Questions . . . . . . . . . . . . . . . . . . . . . . 4
1.4 Structure of the Thesis . . . . . . . . . . . . . . . . . . . . 4
2 Literature Review 6
2.1 Active Electric Distribution Networks . . . . . . . . . . . 6
2.1.1 Main Components . . . . . . . . . . . . . . . . . . 7
2.1.2 Topologies . . . . . . . . . . . . . . . . . . . . . . . 8
2.1.3 Network Operation and Control . . . . . . . . . . 9
2.2 Distributed Generation . . . . . . . . . . . . . . . . . . . . 10
2.2.1 Solar Photovoltaic . . . . . . . . . . . . . . . . . . 10
2.2.2 Micro-gas turbines . . . . . . . . . . . . . . . . . . 11
2.3 Demand side Management . . . . . . . . . . . . . . . . . . 11
2.3.1 Electricity Markets . . . . . . . . . . . . . . . . . . 11
2.3.2 Smart Metering . . . . . . . . . . . . . . . . . . . . 12
2.3.3 Variable Electricity Pricing . . . . . . . . . . . . . 13
2.3.4 Demand side Management Strategies . . . . . . . . 14
2.3.5 Heat Pumps . . . . . . . . . . . . . . . . . . . . . . 14
2.3.6 Electric Vehicles . . . . . . . . . . . . . . . . . . . 15
2.4 Mathematical Modelling . . . . . . . . . . . . . . . . . . . 16
2.4.1 Modelica Language . . . . . . . . . . . . . . . . . . 16
2.4.2 Power Systems Modelling in Modelica . . . . . . . 17
3 Methodology 18
3.1 Demographic and Consumer-related Data . . . . . . . . . 18
3.2 Case Studies . . . . . . . . . . . . . . . . . . . . . . . . . 19
3.3 Electricity Consumption & Pricing Data . . . . . . . . . . 19
3.4 Modelling & Simulation . . . . . . . . . . . . . . . . . . . 19
3.5 Data Processing . . . . . . . . . . . . . . . . . . . . . . . 20
4 Results and Discussion 234.1 Electricity Demand . . . . . . . . . . . . . . . . . . . . . . 23
4.1.1 Heat Pumps . . . . . . . . . . . . . . . . . . . . . . 234.1.2 Impact on the Energy Supply System . . . . . . . 25
4.2 Opportunities from Electricity RTP . . . . . . . . . . . . 264.2.1 Electricity Time of Use (TOU) . . . . . . . . . . . 284.2.2 Annual Analysis . . . . . . . . . . . . . . . . . . . 29
4.3 Electric Vehicles Adoption in Sweden . . . . . . . . . . . . 304.4 Distributed Generation . . . . . . . . . . . . . . . . . . . . 32
5 Conclusions 36
A Appendix. Included Papers 47

List of Figures
1.1 Structure of the thesis . . . . . . . . . . . . . . . . . . . . 5
2.1 Radial topology . . . . . . . . . . . . . . . . . . . . . . . . 82.2 Loop topology . . . . . . . . . . . . . . . . . . . . . . . . 92.3 Price formation in the Nordpool Spot Market . . . . . . . 13
4.1 Annual electricity consumption for DH-based householdsand GSHP-based households. . . . . . . . . . . . . . . . . 24
4.2 Monthly electricity consumption for DH and GSHP-basedhouseholds . . . . . . . . . . . . . . . . . . . . . . . . . . . 25
4.3 Monthly cost difference between pricing contracts 2001-2007 for customers with District Heating . . . . . . . . . . 27
4.4 Monthly cost difference between pricing contracts 2001-2007 for customers with Heat Pumps . . . . . . . . . . . . 27
4.5 Total cost difference between pricing contracts 2001-2007for DH . . . . . . . . . . . . . . . . . . . . . . . . . . . . . 29
4.6 Total cost difference between pricing contracts 2001-2007for HP . . . . . . . . . . . . . . . . . . . . . . . . . . . . . 30
4.7 Correlation between cost difference with standard devia-tion and annual energy usage . . . . . . . . . . . . . . . . 31
4.8 Load increase with different levels of EV penetration . . . 324.9 Impact of charge scheduling . . . . . . . . . . . . . . . . . 334.10 Simulated (solid) vs real (dotted) results for a daily profile
for the C65 ICHP . . . . . . . . . . . . . . . . . . . . . . . 344.11 Simulated (Solid) vs Real (doted) power (in kW) output
from the PV array . . . . . . . . . . . . . . . . . . . . . . 34
Abbreviations
AMR Automated Meter ReadingAVR Automated Voltage RegulationBACS Building Automation and Control SystemsCHP Combined Heat and PowerCVR Conservative Voltage RegulationDSM Demand-side ManagementDER Distributed Energy ResourcesDG Distributed GenerationDSO Distribution System OperatorEV Electric VehicleECM Energy Conservation MeasuresEMS Energy Management SystemsGHG Green House GasGSHP Ground Sourced Heat PumpsHV High VoltageIEA International Energy AgencykWe Kilowatt ElectrickWp Kilowatt PeakLV Low VoltageMV Medium VoltageuGT Micro Gas TurbineOECD Organization for Economic Co-operation and DevelopmentPHEV Plug-in Hybrid Electric VehiclesPF Power FactorRTP Real-Time PricingPV Solar PhotovoltaicTOU Time of UseTSO Transmission System OperatorvRES Variable Renewable Energy SourcesV2G Vehicle to Grid

Chapter 1
Introduction
1.1 Background and motivation
Electric power has been described by the National Academy of Engineer-ing as the greatest engineering achievement of the 20th century, becausethe use of electricity has changed our societies to the extent that liv-ing without it is almost unthinkable [1]. We need electricity to operatemost of our buildings’ subsystems, route our traffic, provide security atnight, run our factories, preserve our food and filter our water, amongother basic needs. Furthermore, in the last decade, our communicationsneeds and the explosion of Internet-connected mobile devices have in-creased the electricity usage in this sector significantly. If all the servercentres required to run existing cloud services were put together, theirconsumption would rank sixth among all countries [2].
This intertwined relationship creates a direct connection betweenelectricity demand and economic growth. From 1990 to 2013, both globalelectricity demand and global gross domestic product (GDP) doubled,and so too did coal and gas demand in the power sector, and with that,the related carbon dioxide (CO2) emissions. In 2013 alone, the powersector accounted for over 60% of the coal and 40% of gas global demand,producing 42% of global energy-related CO2 emissions. Consequently,the power sector plays a critical role, not just in economic growth, butalso in global climate change and local air pollution [3].
Furthermore, according to the International Energy Agency, electric-ity demand and its associated CO2 emissions are expected to increase bymore than 70% by 2040 compared to 2013 levels [3]. In order to mitigatethis impact, renewable energy has received strong support in a growingnumber of countries, for instance as governmental incentives, tax re-
1

2 Introduction
ductions, feed-in tariffs (FiTs) and changes in the electricity markets,among others.
As a result, renewable power is expected to be the largest contributorof net additions to power capacity over the medium term. As a matterof fact, it experienced its largest growth to date, 130 GW in 2014, andaccounted for more than 45% of the net additions to the world’s powercapacity [4]. While this trend can help mitigate the environmental im-pact of electricity generation, it does not come without challenges forthe system; large penetration of utility-scale variable renewable energysources (vRES) introduces larger fluctuations on the supply side, andtherefore existing prime movers have to ramp up and down their pro-duction capacity, often operating in derated mode at lower efficiencies.This operation can lead to increased operation costs and in general,adds more complexity to the operation and control of the power system[5, 6, 7].
On the consumer side, the reduced cost of solar photovoltaic (PV)combined with local incentives for end users (e.g. FiT) has facilitated thepenetration of solar PV in residential and commercial areas, connectedto low-voltage distribution networks. In 2014, the global PV installedcapacity was 176.2 GWp, and it is expected to reach 429 GWp by 2020[8]. Slightly over 40% of this corresponds to utility-scale PV while nearly60% corresponds to residential and commercial installations [4].
While the trend is to increase the share of utility-scale PVs in devel-oping markets, such as Western China, India, the Middle East, Africaand countries in the Americas that are not member of the Organiza-tion for Economic Co-operation and Development (OECD), in Europe,development is more likely to focus on residential and commercial in-stallations. For instance, in Germany, the share of utility-scale PV isonly about 15%, while the remaining 85% corresponds to residentialand commercial rooftop mounted installations connected to Low Volt-age (LV) and Medium Voltage (MV) distribution networks [9].
These medium and low-voltage distribution networks were originallydesigned as passive networks to allow power transfer from the transmis-sion network to the end consumer. Distribution networks will containincreasing amounts of distributed generation (DG), which will result ina paradigm shift in the operation of these networks, since the power flowbecomes bi-directional and thus active measures such as voltage controlusing power generation from the PV inverters and automated demandresponse for increasing self-consumption of PV power during peak hours,among others, should be included [10, 11].

1.2 Main Research Question 3
While all these active systems are not yet in place, in the last fewyears several countries have started the large scale deployment of digitalelectric meters with bidirectional communication capabilities or smartmeters in order to measure hourly electricity consumption and transmitthe information back to the distribution system operator (DSO) everyday and in some cases, in near real time. These, in combination withderegulated electricity markets have provided electricity customers withhigh contract flexibility and multiple retailer options. For example, resi-dential customers in Sweden can choose different pricing contracts fromapproximately 200 different retailers, including, in some cases, real-timepricing contracts, where the cost per kWh is determined by the Nordicspot market price.
This brings new possibilities for customers as an active component ofdistribution networks. Customers can supply power to the network fromrooftop PV systems, but in addition, can adjust their own consumptiondemand based on the output of the PV system (e.g. to maximize self-consumption of electricity) or according to the electricity market spotprice. Moreover, customers can make use of demand side management(DSM) automation equipment, such as smart thermostats connected tothe spot price and weather forecasts, for controlling the operation ofheating systems.
Furthermore, similar technological advances to those that favouredthe development of renewable energy technology have also provided asignificant boost for the electrification of transportation. For instance,battery technology has improved while its cost has reduced. Similar ad-vances have occurred in power electronics and electric motor technology.
Additionally, primary energy reduction and emission reduction tar-gets have also helped increase the interest in adopting electric vehicles forurban transportation (both private and public). All these new electricvehicles represent itinerant loads that will require a robust and activedistributed recharging infrastructure, thus adding extra complexity tothe LV distribution network.
1.2 Main Research Question
The main objective of this thesis is to understand the role of the differ-ent actors involved in electric distribution systems, and develop simula-tion models that will enable evaluation of different future scenarios thatinclude large penetration of distributed generation, active customers,demand-side management and the inclusion of new itinerant loads in
4 Introduction
the system, (e.g. electric vehicles).
1.3 Research Questions
The research questions studied in the included papers were as follows:
1. What are the main advantages for households from adopting hourlyspot market electricity pricing agreements? (Paper I)
2. Could households benefit from hourly spot market electricity pric-ing agreements without adopting demand-side management (DSM)strategies? (Paper I)
3. What are the main impacts on the energy supply system fromadopting different energy conservation measures and increasingDG penetration in residential areas? (Paper II)
4. What is the electricity demand impact on detached households inSweden from using ground-sourced heat pumps? (Paper III)
5. What can be learned from early EV adopters in Sweden, to de-velop strategies that support the penetration of electric vehicles inother countries and what are the potential impacts on local electricdistribution grids from large adoption of EVs? (Paper IV)
6. What are the benefits and challenges from using an equation-based, object-oriented modelling language to model DG compo-nents in LV distribution networks? (Paper V)
7. What are the best strategies to integrate DG and e-mobility toincrease urban sustainability in mid-sized cities in Sweden and itsimplications on the existing distribution infrastructure? (PaperVI)
1.4 Structure of the Thesis
The doctoral thesis is comprised of six scientific papers (papers I-VI).The main topic of the thesis is Active Distribution Networks, which inturn, is divided in two domains: Demand Side Management (DSM) andDistributed Generation (DG).
Papers I-IV fall in the domain of Demand Side Management (DSM),where the impact on the distribution system was analyzed from the end

1.4 Structure of the Thesis 5
consumer point of view. Two sub-domains were identified: consumer-based DSM and technology-based DSM, based on the active motivatorfor DSM. Papers I and IV correspond to the first subdomain, whilepapers II and III correspond to the second subdomain.
Papers V and VI correspond to the domain of Distributed Genera-tion, where the analysis was focused on the interaction between differentenergy sources and local distribution networks.
A general diagram showing how the papers are related is presentedin Figure 1.1.
Figure 1.1: Structure of the thesis

Chapter 2
Literature Review
2.1 Active Electric Distribution Networks
The main function of electric distribution networks is to transfer powerbetween the bulk power system and end customers as well as to carry outthe required voltage transformations. This section of the power systemis also responsible for integrating the power supply from distributedgenerators and maintaining the voltage levels and power quality withinregulatory limits. Consequently, this section of the power system playsthe largest role in the power quality perceived by the consumers [12].
More recently, this network has gained a more active role and has be-come responsible for integrating the power production from distributedgenerators installed across the network. Moreover, further developmentsare expected, including automated voltage regulation (AVR), extensiveuse of distributed energy storage devices (e.g. electric vehicle-to-gridconcept) and more importantly, bi-directional power flow as shown inFigure 1.1.
The term smart grid has also been used extensively to refer to theevolution of electric distribution networks. While both terms can be usedinterchangeably, active distribution networks focus on the integration,operation and control of large penetration of DGs and storage in electricdistribution networks. The term smart grids is often used to addressa larger domain including bulk generation, transmission and the useof advanced monitoring systems (e.g. synchrophasors) for early faultdetection that can provide the network with self-healing capabilities tominimize outages.
6

2.1 Active Electric Distribution Networks 7
2.1.1 Main Components
The main components of an active distribution network are [12]:
• Distribution substations
• Primary distribution feeder
• Distribution transformers
• Distribution cabling
• Metering & Control equipment
• Distributed generators
The distribution substation connects the main transmission to thesub-transmission network and converts the HV to MV for use on theprimary distribution feeder, where several distribution transformers areconnected to convert from MV to LV, suitable for connecting residentialand commercial users in the secondary distribution system. This net-work is connected using a combination of four-wire, three-phase over-head and underground cables according to the required topology andoperation voltage and current.
All the variables involved in the operation of the distribution systemare measured and monitored in multiple locations across the network;all electric variables (e.g. maximum power, voltage and current, etc.)are continuously measured in the substation, and it is becoming morecommon to extend the monitoring system down to the distribution trans-formers, secondary feeders and end-of-line points in order to facilitateoutage detection and monitor the power quality on the entire network atall times. Moreover, changes in metering requirements from electricitymarket regulations, increased contract flexibility and the reduced cost ofmicro-controllers and communication technologies have made it possibleto deploy automated meter reading (AMR) systems where power andenergy usage is measured and recorded at every consumption point inreal time.
While the primary purpose of AMR is for billing, several authorshave suggested using the additional capabilities of the infrastructure toprovide operational data in real time from each consumption point foronline diagnostics, outage detection and network management [13, 14,15].

8 Literature Review
Figure 2.1: Radial topology
2.1.2 Topologies
In secondary distribution networks operating at LV, overhead and under-ground lines connect end consumers with primary MV feeders throughdistribution transformers, switches, section breakers and other equip-ment, mounted on poles or in distribution cabinets. The most commontopologies used in these distribution systems are radial, loop and severalcombinations of both [12].
Radial Topology: This topology is the simplest and most econom-ical, and is often used in low-density areas (e.g rural distribution net-works). Its main limitation is that in case of failure in any point of thenetwork, all the customers connected to the branch would suffer a poweroutage. In order to reduce the duration of interruptions, automatic re-closers can be used along the network together with sectionalizing fuseson branches, to allow unaffected sections to remain in service in case oftemporary failure. A simple radial topology is shown in figure 2.1. Morecomplex radial feeder models are presented by Kersting et al. [16].
Loop Topology: Loop topologies offer a higher level of service reli-ability, but also require the use of redundant equipment which can makeit more expensive to implement. In its most basic form, two feeders forma closed loop, open at one point so that in case of a failure, the section-alizer switch closes in one location while another opens at a differentlocation. This topology offers higher reliability and it is commonly usedin urban MV distribution networks and some LV networks in dense res-idential and commercial areas. A diagram of this topology is shown inFigure 2.2.

2.1 Active Electric Distribution Networks 9
Figure 2.2: Loop topology
2.1.3 Network Operation and Control
The distribution system was designed to operate as a perfectly balancedthree-phase system. This means that the voltage of each phase is equalin magnitude but 120 degrees out of phase from the others. In reality,unbalanced loads, large penetration of DG, power electronics and othercomponents connected to the network introduce perturbations that re-quire the use of active and passive components to maintain the systemoperation as close to nominal conditions as possible. When these condi-tions are not met, the reduction in power quality can a↵ect satisfactoryoperation of the network components (e.g. overheating of transform-ers, faulty tripping, etc.) as well as customers’ equipment (e.g. faultyoperation of heat pumps).
Voltage is one of the parameters that has to be controlled and main-tained within a narrow operating range. In Europe and the US, thevoltage levels in primary and secondary distribution networks should bemaintained within ± 5% - 10%, based on national regulations [17, 18].
Several voltage control techniques are typically used. For instance,the DSO regulates the primary voltage at the substation and the feederthat connects to the first group of customers, usually by employing tapchangers in the transformers that connect the primary and secondarydistribution levels. These tap changers can be changed manually (forseasonal load variations) or automatically (using automatic voltage regu-lators, AVRs). Furthermore, if AVRs are not sufficient, shunt capacitorsare installed in order to provide the additional reactive power requiredto maintain the operation voltage within the required limits. Lately, alarge penetration of inverters from DG has introduced additional volt-age fluctuations that were not originally accounted for. For instance,in networks designed to control the voltage operation using AVRs, largepenetration of DG and the increased demand from electric vehicles (EVs)have forced AVRs to switch hundreds of times per day, instead of just

10 Literature Review
a few times as they were designed for. This has caused some of thesesystems to reduce their operation lifetime substantially [19].
Consequently, in large distribution networks with large penetrationof DG and EVs, AVR and shunt capacitors alone may no longer be suffi-cient to provide the required support to maintain the operation voltagewithin the required limits. Fortunately, the same equipment that hasintroduced these perturbances can also help mitigate them. Several au-thors have investigated the potential use of the PV systems inverters’capabilities to inject reactive power into the system, in order to providethe required support to maintain its operation within the required lim-its [20, 10, 21, 22]. Therefore, new active distribution networks needto use these capabilities to maintain the networks’ reliability, as well asto allow larger DG penetration. On the demand side, new technologiescan also provide grid support by controlling their demand according tothe network’s operation conditions. On one hand, building automationtechnologies (e.g. lighting control, smart thermostats, etc.) can adjusttheir operation in response to weather forecasts, price signals or simplynetwork signals. On the other, EVs can control their charging process,according to the network’s capacity, and in some cases, supply powerfrom the batteries in what is known as vehicle-to-grid (V2G) operation.
2.2 Distributed Generation
Distributed generators (DG) produce energy locally and can use eitherconventional or renewable energy technologies. Several reasons motivatetheir wide adoption: DG increases distribution efficiency by reducing thedistance and power conversions between production and consumption;it can also help postpone upgrades on the existing grid by increasing thelocally available power capacity; but ultimately, the strongest motivatorfor large DG adoption is their ability to effectively integrate renewableenergy technologies, with the environmental advantages they offer, suchas the reduction of greenhouse gases (SOx, NOx, CO2), pollution re-duction from large production plants as well as reduced environmentalimpact for extraction, refining and transportation of fossil fuels [23].
2.2.1 Solar Photovoltaic
Solar photovoltaic (PV) is a technology that converts light directly intoelectricity. The individual photovoltaic element is the solar cell, whichis made out of semiconductor materials.

2.3 Demand side Management 11
Depending on their power output capacity, solar PV system instal-lations can be classified as utility scale or commercial/residential. Theformer are characterized by being centralized and offering large poweroutput capacities (>1MWp), and are often connected to the transmis-sion grid at MV or HV. Residential and commercial installations offersmaller power output capacities (<20kWp for residential and <1MWpfor commercial) and are scattered, usually located close to the consump-tion loads and directly connected to LV or MV distribution networks.
2.2.2 Micro-gas turbines
Micro-gas turbines are small energy generators usually ranging from 15to 300 kWe, and are based on the standalone joule cycle [24]. Micro-gas turbines are commonly used as backup generators, with an averagefuel to electricity conversion efficiency between 22-30%, although severalmodels can operate in combined heat-and-power (CHP) mode to pro-duce both electricity and heat, increasing the overall efficiency to over80%. This characteristic makes them very attractive for applicationswhere both electricity and heat are required, for instance in residentialneighbourhoods, hospitals, commercial facilities, etc. In general, micro-gas turbines offer several advantages, for instance: high-speed operation,high reliability, low maintenance and low NOx emissions [25].
2.3 Demand side Management
Demand side management usually refers to changes on the consumptionside of the network in response to requests from the system’s operator,for instance, to shut off non critical loads during peak power consump-tion times. However, newly introduced flexible pricing contracts offercustomers the possibility to voluntarily modify their electricity consump-tion patterns in response to changes in the market by shifting heavyconsumption loads to low-cost times.
2.3.1 Electricity Markets
Different power sources have to be dispatched based on demand fluctu-ations in order to maintain the balance between load and supply at alltimes. Each power source has a different cost structure and runs un-der different operation conditions. The transmission system operators(TSOs) and balance providers decide which power sources to include in

12 Literature Review
the system at any given time based on several parameters: running costs,electricity demand forecast, weather conditions and reservoir capacities.
These power production costs are highly variable and thus, effec-tive ways to charge end users for a product that is highly variable innature, has been debated since the beginning of the electric power in-dustry itself. DSOs defined the optimal pricing regime for this service asHopkinson’s differentiated rates based on time-of-day use [26] and sincethen, additional dynamic pricing schemes have been developed. Today,different pricing methods include critical peak pricing (CPP), criticalpeak rebate (CPR), demand based tariff and real time pricing (RTP)[27, 28, 29, 30, 31].
In Scandinavia, the electricity market was deregulated on January 11996, meaning that both electricity production and retail have been sub-ject to competition since the reform. The wholesale price of electricityis determined by supply and demand on an hourly basis on NordPool’sspot market (Elspot) for the next 24 hour period. Due to physical trans-mission restrictions between countries, the Nordic electricity market isdivided into bidding areas (Elspot areas) [32]. The network operationstill remains as a regulated monopoly in Sweden. The distribution net-works are operated by about 160 different distribution system opera-tors and the transmission network is governed and operated by SvenskaKraftnat, the Swedish TSO.
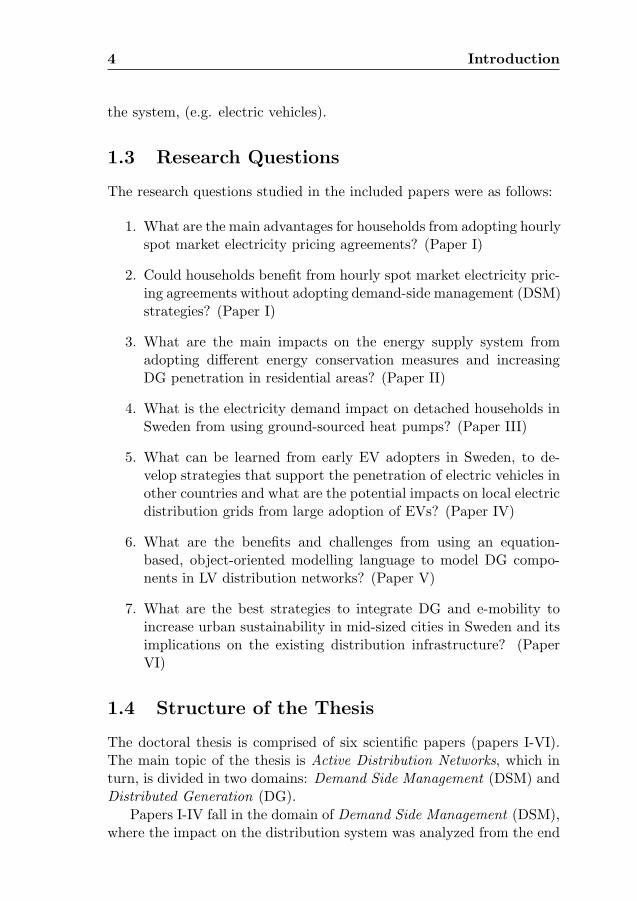
For each hour of the following day, the players in the spot marketspecify the amount of electricity they wish to sell or buy. All the bidsare aggregated both as price and quantities and the demand curve isbuilt from the sum of all purchase bids. The combination of price andquantities where supply and demand curves match establish the marketprice as shown in Figure 2.3 [32].
NordPool Spot’s market share of all the electricity traded in theNordic and Baltic area in 2014 was 501 TWh [33], the largest part of allthe electricity produced and consumed in the area. In Sweden, the totalelectricity produced in 2014 was 149.5 TWh, with a net export of 10TWh, leaving a total of 139.5 TWh of electricity for domestic use [34].Almost all electricity generated and consumed in Sweden was tradedthrough NordPool Spot.
2.3.2 Smart Metering
Smart meters are electronic devices that measure and record electricityconsumption mainly for billing purposes. Most modern smart meters of-fer two-way communication capabilities to send electricity consumption
2.3 Demand side Management 13
Figure 2.3: Price formation in the Nordpool Spot Market
and production (e.g with installed PV systems) information back to theDSO, as well as additional parameters (e.g. power quality, alarms, etc.)that can be used for advanced network monitoring.
2.3.3 Variable Electricity Pricing
Variable pricing schemes are implemented to encourage users to shiftpower consumption from peak use to lower use times, in order to helpbalance the load in the power system. This is accomplished by applyingdynamic pricing mechanisms that are closer to the real cost of electricitysupply. The most common methods are: monthly variable pricing, wherethe cost per kWh is based on the electricity spot market average pricefor the month; Time-of-Use (TOU), where two or more tariffs are usedfor high peak and low peak times; Critical Peak Pricing (CPP), wherea flat rate is used unless there is a high peak critical situation when avery high price per kWh is applied; Critical Peak Rebate (CPR), whereusers are paid to lower their consumption under critical peak times; andReal Time Pricing (RTP), where an hourly spot market price is applied.
One of the main advantages for residential users of a deregulatedmarket together with smart metering technology is the contract flexi-bility and options provided by electricity retailers [35]. Residential cus-

14 Literature Review
tomers in Sweden can choose different pricing contracts from approx-imately 200 different suppliers. The most common types of contractschosen by the customers are: variable pricing contract, where the costper kWh is based on NordPool Spot’s monthly average spot price plusa retailer fee; fixed price contract, where the user pays a predeterminedelectricity price agreed between the retailer and the customer which re-mains fixed for the duration of the contract (1, 2 and 3 years); defaultcontract, which is selected by the local network owner if the customerdoes not make an active choice; hourly RTP, where the cost per kWhis determined by the spot market price; other contracts options includedemand based pricing options and mixed rates (e.g 50% fixed, 50% vari-able) [36].
2.3.4 Demand side Management Strategies
Examples of DSM strategies include: conservative voltage regulation(CVR), where the operation voltage in secondary distribution networksis reduced to minimize losses and the energy demand in the system;smart appliance controllers that react to electricity market prices andonly operate during low-price hours; and the use of building automationand control systems (BACS), due to their great potential to adjust thebuildings’ power consumption in real time.
BACS apply the principles of linear control theory to monitor andefficiently control the equipment that interacts with the multiple sub-systems involved in building operations. Modern BACS make stronguse of communication technologies, and more recently, use wireless sen-sors that provide real time variable monitoring, which combined withreal time electricity price information and energy management systems(EMS), provide great opportunities for optimizing the buildings’ energyusage in real time.
Other demand side management strategies include the use of smartthermostats for the operation of heating systems; residential EMS; con-trolled charging mechanisms for EVs and the participation of activeelectricity customers with great awareness and knowledge about the im-pact of their activities on energy consumption to react and make demandchanges when required.
2.3.5 Heat Pumps
Heat pumps transfer heat from a low temperature source to a high tem-perature source by heating and compressing a refrigerant with a low

2.3 Demand side Management 15
temperature boiling point. The heat from the refrigerant is transferredto the heat sink using a heat exchanger where the refrigerant is con-densed back to liquid form.
A particular type of heat pumps is the ground sourced heat pump(GSHP), which can achieve a 1:3 electricity to heat conversion ratio[37]. This means that from 1 unit of electricity it is possible to obtain3 units of heat. Consequently, its growth facilitates the reduction notonly of fossil based heating, but also direct electric heating, increasingthe overall electricity to heat conversion.
In Sweden, installations of GSHP have been steadily increasing overseveral years, up to the point that the country boasts the largest numberof GSHPs installed in Europe.
2.3.6 Electric Vehicles
In conventional vehicles, fuels with very high energy density (mainly hy-drocarbons) are stored in a tank and burned in an internal combustionengine to produce the required power to provide the vehicle’s propulsion.In an electric vehicle, an electric motor is used to provide the requiredpropulsion, and takes the required energy from an onboard electrochem-ical or electrostatic energy storage device [38].
Typically, the term EV is used indistinctly to refer to plug-in hy-brid electric vehicles (PHEV), extended range battery electric vehicles,battery electric vehicles and hybrid electric vehicles.
The two major battery technologies used in electric vehicles today aremetal hydride (NiMH) and Li-ion. Most PHEV available in the markethave used NiMH because it is a more mature technology. However,thanks to the higher specific energy and energy density, the adoption ofLi-ion technology is increasing in all EV types [39].
The battery capacity determines a vehicle’s driving range: a largebattery provides a long range at the expense of lower overall efficiency(due to the increased weight) and a higher capital cost. Conversely, asmall battery may not increase the vehicle’s weight significantly, but ifit does not provide the required range, it may not be worth the extracost and weight of the electric motors and power electronics.
The increased number of EVs can severely affect existing electricityconsumption profiles by increasing the evening peak which, accordingto a survey carried out among private EV owners in Sweden, is whencustomers are most likely to charge their vehicles. Masum et al [40]investigated this consumption peak increase on a 1200 node test systemtopology and found out that voltage violations would occur during the

16 Literature Review
night peak with EV penetrations as low as 17%. Furthermore, a sim-ulated EV penetration of 62% (the maximum penetration simulated)would increase total distribution losses by 500%.
Most EVs currently on the market use batteries with capacities thatvary between 12 and 24 kWh, which provides an average driving rangeof about 160 km [41]. In Europe, however, the average EV owner drivesa considerable shorter distance daily [42]. Furthermore, common driv-ing patterns show that most private EVs spent the majority of the timeparked, thus opening new possibilities for vehicle-to-grid (V2G) inte-gration schemes. A large distributed energy storage network can allowlarger penetration of DGs without the need for additional upgrades ofthe distribution network’s capacity since excess power could be storedin the vehicle’s batteries to be used at peak time.
2.4 Mathematical Modelling
Mathematical modelling allows us to represent the behaviour of a phys-ical system with a set of equations, so that a specific set of experimentscan be simulated on a virtual system rather than on a real one.
There are several reasons to perform simulations instead of carryingout experiments on real systems. For instance, it can be too expensiveor too dangerous (e.g. testing different operation conditions on a nuclearpower plant); the system that we want to conduct experiments on maynot yet exist (e.g. a new blade design for a wind turbine); the timescale of the system is not compatible with that of the experimenter (e.g.celestial objects trajectory analysis); and more freedom to manipulatethe variables of the model, among others.
2.4.1 Modelica Language
Developed in 1996, Modelica is an non-proprietary, open source, object-oriented language for modelling large, complex, and heterogeneous phys-ical systems. The language uses mathematical equations and object-oriented constructs to facilitate the reuse of models, which allows effec-tive library development and model exchanges [43].
Unlike specialized simulation tools, the Modelica language is suitedfor multi-domain modelling such as complex systems that involve me-chanical, hydraulic, electric, state machines, process control etc. Suchsystems can be built together into a single model by using the appro-priate algebraic equations that represent the physical behaviour of eachsubsystem.

2.4 Mathematical Modelling 17
Modelica is based on equations instead of assignment statements,which means that it allows for acausal modelling, because equations donot define a specific data flow direction and the global equation systemis solved simultaneously.
2.4.2 Power Systems Modelling in Modelica
In Modelica, models are mathematically described by differential, alge-braic and discrete equations. Variables do not need to be solved manu-ally and unlike modelling and simulation languages that use sequentialsolving, Modelica allows simultaneous equation solving of large, complexequation systems. This ability facilitates the process of prototyping andtesting models.
This approach allows easily reusing models, since each model is de-fined as a set of equations. When connected together with other mod-els, Modelica’s compiler puts all the equations together, extracts theunknown variables and known parameters, and optimizes the simulta-neous solving process automatically.
Moreover, Modelica’s open source standard library contains about1280 model components and 910 functions from multiple domains, toprovide a set of models that help develop larger and more complex phys-ical systems [44].
The complexity of power systems and their associated dynamics re-quire the use of robust modelling and simulation tools. Several ap-proaches have been used in the past, from using simplified numericalmethods to complex specialized transient analysis software packages thatuse proprietary code. This approach has led to inconsistencies betweendifferent simulation and modelling methods from different platforms.Equation-based languages allow for model exchange and unambiguousmodelling and simulation across different platforms [45]. Moreover, byrepresenting models with their equivalent mathematical equations, itbecomes easier to understand the systems’ dynamics, to modify andreuse models, and build more complex systems on a common standardmodelling language.

Chapter 3
Methodology
3.1 Demographic and Consumer-related Data
A survey was sent out in a residential area of the Sollentuna munici-pality in Sweden. The questionnaire was sent out to 735 householdsand comprised of 37 questions regarding housing and energy consump-tion characteristics. A total of 528 households responded, from which agroup of 322 (response rate of 43%) was selected, made up of householdswith GSHP installed at least four years before the survey. The infor-mation from the survey was tabulated and analyzed in order to classifyhouseholds and extract characteristics as well as to find patterns. Thisinformation is presented in papers I and III.
In paper IV, a paper survey was developed and sent out to electricvehicle owners registered as private users in Sweden. A total of 399surveys were sent out in March 2015, and after a period of 3 weeks,247 responses had been received, a response rate of 62%. The surveycontained several questions with free text answers (e.g. average income)although the majority of the questions consisted of multiple-choice an-swers. The questions included in the survey could be divided into fourdifferent groups. The first group comprised of questions regarding thedrivers personal and household characteristics; the second group of ques-tions targeted the EV drivers motivation and use of their electric vehicle;the third group of question was intended to gather information on EVdrivers driving and charging patterns; the last group targeted informa-tion about the technical specifications of the EVs.
18

3.2 Case Studies 19
3.2 Case Studies
In paper II, five case studies were carried out in which different energyconservation measures (ECMs) were implemented in building renova-tions in Sweden. These cases were selected based on the data availablefor the projects, technologies used, ECMs impact on the energy supplynetwork and the populations in the cities where the projects were carriedout.
In paper VI, the energy goals and actions established by the munici-pality of Eskilstuna in Sweden were evaluated, with special focus on theuse and integration of renewable energy sources (mainly wind and PV),transport and the building sector. The evaluation used data provided bythe local municipality and was complemented with simulation models.
3.3 Electricity Consumption & Pricing Data
The electricity consumption data between 2001 and 2007 used in pa-pers I and III was obtained from the local distribution system operator(DSO), who provided access to the automatic meter reading (AMR)data from the Sollentuna area. For each customer and measurement,each row in the dataset contained the meter identification (ID), timestamp (YY:MM:DD HH:MM) and hourly electricity consumption value(in kWh). Additionally, information about the main energy source usedfor heating was also provided for each user ID. There were two main usergroups: those connected to the district heating (DH) network and thosethat used ground sourced heat pumps (GSHP) as their main heatingsource.
Spot-based electricity price data for real time pricing (RTP) con-tracts cost calculation was obtained directly from NordPool’s databasefor Elspot’s prices of the physical market area. Hourly electricity valuesfor the 4 bidding areas in Sweden were available at 1 hour intervals.
Fixed electricity prices of one year contracts for each customer grouptype (DH or with GSHP) were obtained from Statistics Sweden (SCB)[46].
3.4 Modelling & Simulation
In paper V, two models were developed using the Modelica language fortwo generators of the Savona’s Polygeneration Microgrid (SPM) labora-tory from the University of Genoa in Italy. The first generator was a 65

20 Methodology
kWe integrated combined heat and power (ICHP) natural gas microtur-bine, and the second was a 49 kWp roof-mounted PV system.
The first model was developed in a top-down scheme using the man-ufacturers data to build the equation system. From the basic equationsystem, different performance derating curves were added from the man-ufacturer’s data [47] in order to determine the microturbines maximumperformance under different operation conditions (outdoor temperature,humidity, altitude, etc.). The second model used the equivalent electriccircuit model proposed by Sera and Teodorescu [48] for a photovoltaiccell. The hourly solar irradiance required in the model was composedof the main, diffuse and ground-reflected beams; the main beam wascalculated from the equation models proposed by Mehleri et al. [49] andneither the diffuse nor ground-reflected beams were included.
The validation dataset for the ICHP consisted of 3997 1 min reso-lution operation data points. The validation dataset for the PV sys-tem consisted of 8865 operation data points at the same resolution.Both were taken from the SPM’s energy management system SCADA.Weather data was obtained from the nearest weather station to thecampus, located 15 kilometers north-west of Savona, where the SPMwas located.
In paper IV, the survey information was used in combination with asimulation model developed in Dymola using Modelica language to esti-mate the impact of larger adoption of EVs on local distribution networks.The mathematical equations used to build the EV battery model andcharging mechanism were obtained from the battery models presentedin [39, 50, 51, 52].
3.5 Data Processing
In papers I and III, the hourly electricity consumption entries were for-matted into MATLAB time series for processing and any missing valueswere linearly interpolated. Each user’s time series was adjusted for day-light saving time (DST) for each year and all data entries were indexedusing a common time vector. This vector was formatted in a serial dataformat that represents, in a single number, the amount of time thathas passed since 01/01/0000 to facilitate the data compilation for allcustomers into a single matrix.
To calculate each individual customer’s electricity costs in the caseof a fixed price contract, the fixed cost was determined by the annualelectricity usage, therefore, customers with GSHP had lower cost per

3.5 Data Processing 21
kWh. In the case of RTP, electricity costs were calculated by multiplyingthe hourly electricity consumption matrix and the spot price matrixto obtain a new matrix representing the hourly costs. Monthly andannual electricity costs were calculated from the hourly costs matrix.The hourly electricity price was the same for every customer, regardlessof whether the customer used electric heating or they were connected tothe district heating network.
In addition to the electricity supply cost, the network charge, retailerfee, electricity tax and VAT were added and calculated monthly for everycustomer during the studied time period.
The network charge depends on the customer’s fuse size and peakdemand. Therefore, this charge was calculated by estimating the fusesize from the historical peak power consumed over the 7 year period,extracting the maximum current at an average power factor of 0.85.This is explained in more detail in paper I.
While the retailer fee for fixed price contracts was included in thecost per kWh, the fee for RTP contracts was obtained from the tencompanies in Sweden that offered this service as of March 11th 2014and added to the calculation of the cost per kWh.
Electricity tax for the seven year studied period was obtained fromSvensk Energy [53] and VAT of 25% was added to the total for eachcustomer.
The general equations used for both fixed and RTP contracts areshown in equations 3.1 and 3.2.
ElcostFixed = (EkWh ∗ (N + T )) ∗ (1 + V AT ) (3.1)
ElcostRTP = (EhkWh ∗RTP + EkWh ∗N +Rf) ∗ (1 + V AT ) (3.2)
Where:
ElcostFixed = Monthly electricity cost in SEKElcostRTP = Monthly electricity cost in SEKEkWh = Monthly electricity consumption in kWhEhkWh = Hourly electricity consumption vector in kWhRTP = RTP vector in SEK/kWh for every hour of the monthRf = Monthly retailer feeN = Network tariff in SEK/kWhT = Fixed fee tariff in SEK/kWh incl. the retailer feeV AT = Value added tax

22 Methodology
The datasets used for validating both generator models used in paperV had its timestamps synchronized with the weather data samples inorder to simulate all components with the same time steps. Additionally,each atasets was formatted in a 2-dimension table (timestamp, data) tobe imported and used in Modelica.

Chapter 4
Results and Discussion
4.1 Electricity Demand
4.1.1 Heat Pumps
The results presented in paper III show that the majority of householdshad their own heating system (e.g. not connected to the district heatingnetwork) before the GSHP installation. Only 10% of the respondentshad heat pumps before the year of installation (23 households had GSHPwhile 9 had air-air heat pumps). During the period when the question-naire was sent, 320 households had GSHP installed while 12 had air-airheat pumps.
Cost Analysis
The average investment made by the homeowners was 120150 SEK(13000 EUR) (N=208) for a new GSHP system. When comparing theoperation costs between DH and GSHP, the former are more expensiveto run during March and April, while the latter are more expensive torun between October and February. While this makes GSHP a better al-ternative in a one year analysis, GSHPs have a limited lifetime while DHdoes not require new investments, which would make it more economicalin the long run unless electricity prices are low and smart thermostatsare used to operate the GSHP to reduce its operation costs even further.
The average annual electricity consumption for households with DHand GSHP during the studied period are shown in Figure 4.1.
Results revealed that the minimum additional electricity consump-tion for GSHP-based households was 11.9% in 2002, and the maximumadditional electricity consumption was 76.5% in 2006, when the highest
23

24 Results and Discussion
Figure 4.1: Annual electricity consumption for DH-based householdsand GSHP-based households.
number of continuous sub-zero temperature days of the 5 year studyperiod also took place.
Additionally, it was found that the annual consumption for GSHP-based households was more stable over the 5 year period with an averageof 133.2 kWh/m2/year. Households using DH experienced a continuousdecrease in electricity consumption from 124.4 kWh/m2/year in 2002to 71.76 kWh/m2/year in 2006, a reduction of almost 43% due to in-vestments in energy efficient lighting and appliances, according to theanswers in the questionnaire.
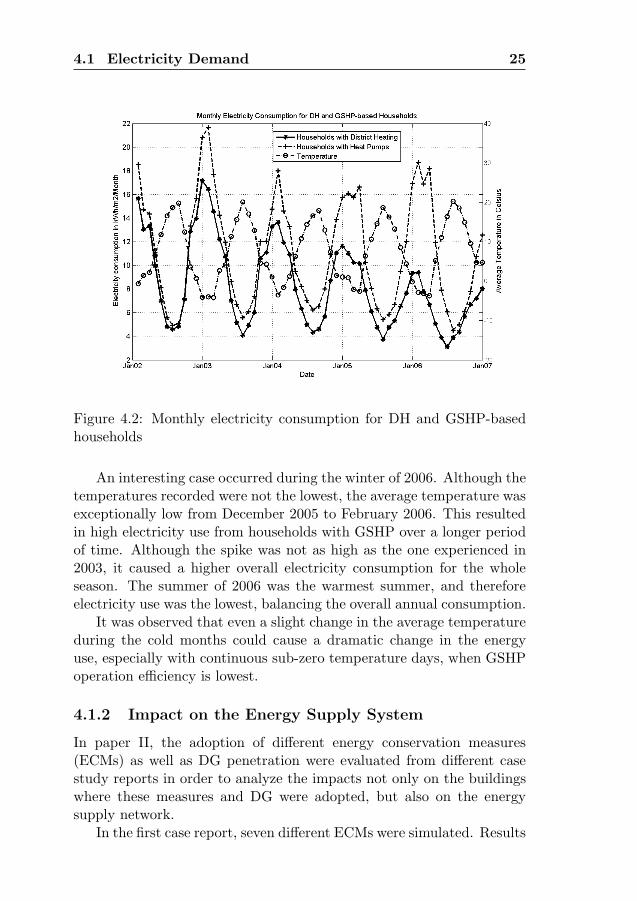
The monthly electricity consumption was compared between DH-based and GSHP-based households over the 5 year period. Results areshown in Figure 4.2.
The monthly analysis provided more detailed information about thetemperature impact on households with GSHP compared to those withDH. The difference in electricity consumption between DH and GSHPbased households was very small during the Spring and Autumn months,when nearly no heating or cooling is required. However the differencewas larger during the other seasons, particularly during Winter.
The Winter of 2003 had the lowest average temperature of the 5years analysed, and therefore had the greatest impact on the electricityuse of GSHP based households. In contrast, the winter of 2005 was thewarmest and consequently, the electricity use was lowest.
4.1 Electricity Demand 25
Figure 4.2: Monthly electricity consumption for DH and GSHP-basedhouseholds
An interesting case occurred during the winter of 2006. Although thetemperatures recorded were not the lowest, the average temperature wasexceptionally low from December 2005 to February 2006. This resultedin high electricity use from households with GSHP over a longer periodof time. Although the spike was not as high as the one experienced in2003, it caused a higher overall electricity consumption for the wholeseason. The summer of 2006 was the warmest summer, and thereforeelectricity use was the lowest, balancing the overall annual consumption.
It was observed that even a slight change in the average temperatureduring the cold months could cause a dramatic change in the energyuse, especially with continuous sub-zero temperature days, when GSHPoperation efficiency is lowest.
4.1.2 Impact on the Energy Supply System
In paper II, the adoption of different energy conservation measures(ECMs) as well as DG penetration were evaluated from different casestudy reports in order to analyze the impacts not only on the buildingswhere these measures and DG were adopted, but also on the energysupply network.
In the first case report, seven different ECMs were simulated. Results

26 Results and Discussion
showed that when residual biomass fuels (e.g. waste) are used in the DHsystem, reducing electricity consumption and improving the buildings’envelopes are the only favourable ECMs for improving primary energyefficiency and reducing GHGs.
The second case report studied installing rooftop PV systems onbuildings combined with energy storage systems. The results indicatedthat using electric storage systems provided the highest level of PV self-consumption, but also offered the highest levelized cost of electricity;while using heat storage provided similar self-consumption levels withalmost half of the levelized cost of electricity.
The third case evaluated a renovation project carried out in Allingsas,Sweden, where 16 buildings were renovated using different ECMs tobring them to near-zero passive building standards. The investmentcosts varied between 133-570 /m2 and the calculated energy consump-tion savings ranged between 62-85%.
The fourth case study report presented consumer driven ECMs. Re-sults showed that it is possible to reduce energy consumption by upto 33%. However, whether the savings would remain without periodicfollow-up from energy efficiency advisors is uncertain.
The fifth case study report considered electricity usage in householdswith GSHP and variable-pricing electricity contracts. It concluded thatwhile GSHP is the best option for detached households, it is impor-tant to consider electricity price fluctuations during the Winter seasonwhen GSHP requires the highest amount of electricity. The adoption ofsmart thermostats or energy management systems (EMS) was thereforerecommended.
In general, results from the case studies showed the importance ofconsidering the characteristics of existing energy supply networks aroundthe buildings where ECMs are adopted, in order to select the strategiesthat provide the greatest benefits both for the buildings and the energysupply system.
4.2 Opportunities from Electricity RTP
In paper I, the impact on electricity bills after switching from a fixedprice per kWh contract to RTP was studied for 400 households (200connected to the DH network and 200 with HP).
Results for the 7 year period analysis are shown in Figure 4.3 forusers connected to the DH network and in Figure 4.4 for users withHP, together with the monthly average temperature. In the figures, the

4.2 Opportunities from Electricity RTP 27
10 20 30 40 50 60 70 80
Months 2001-2007
-300
-250
-200
-150
-100
-50
0
50
100
Co
st
Diffe
ren
ce
Fix
ed
vs S
po
t C
on
tra
ct
[EU
R/M
on
th]
Monthly Comparison for Fixed vs Spot Based Contracts for DH Users 2001-2007
0
5
10
15
20
Mo
nth
ly a
ve
rag
e t
em
pe
ratu
re [
Ce
lsiu
s]
Figure 4.3: Monthly cost difference between pricing contracts 2001-2007for customers with District Heating
10 20 30 40 50 60 70 80
Months 2001-2007
-350
-300
-250
-200
-150
-100
-50
0
50
100
150
Cost Difference Fixed vs Spot Contract [EUR/Month]
Monthly Comparison for Fixed vs Spot Based Contracts for HP Users 2001-2007
0
5
10
15
20
Monthly average temperature [Celsius]
Figure 4.4: Monthly cost difference between pricing contracts 2001-2007for customers with Heat Pumps
plots show a positive value for each month when RTP contract offers alower price. A negative value is shown when the RTP contract is moreexpensive.
While both figures follow the same trend, customers with HP experi-enced larger fluctuations, on both the positive y-axis (more economical
28 Results and Discussion
Table 4.1: Electricity consumption peak times
Morning Peak Afternoon PeakDH Users HP Users DH Users HP Users
2001 9:00 9:00 20:00 20:002002 9:00 9:00 20:00 20:002003 9:00 9:00 20:00 20:002004 9:00 9:00 21:00 20:002005 9:00 9:00 21:00 21:002006 9:00 9:00 21:00 21:002007 9:00 9:00 20:00 21:00
for RTP) and on the negative y-axis (more economical for 1 year fixedprice).
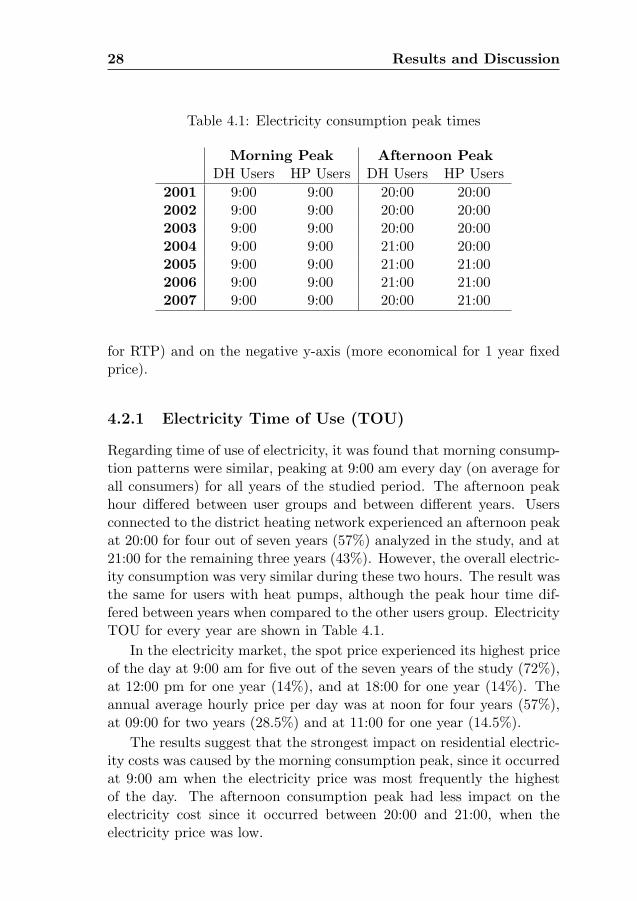
4.2.1 Electricity Time of Use (TOU)
Regarding time of use of electricity, it was found that morning consump-tion patterns were similar, peaking at 9:00 am every day (on average forall consumers) for all years of the studied period. The afternoon peakhour differed between user groups and between different years. Usersconnected to the district heating network experienced an afternoon peakat 20:00 for four out of seven years (57%) analyzed in the study, and at21:00 for the remaining three years (43%). However, the overall electric-ity consumption was very similar during these two hours. The result wasthe same for users with heat pumps, although the peak hour time dif-fered between years when compared to the other users group. ElectricityTOU for every year are shown in Table 4.1.
In the electricity market, the spot price experienced its highest priceof the day at 9:00 am for five out of the seven years of the study (72%),at 12:00 pm for one year (14%), and at 18:00 for one year (14%). Theannual average hourly price per day was at noon for four years (57%),at 09:00 for two years (28.5%) and at 11:00 for one year (14.5%).
The results suggest that the strongest impact on residential electric-ity costs was caused by the morning consumption peak, since it occurredat 9:00 am when the electricity price was most frequently the highestof the day. The afternoon consumption peak had less impact on theelectricity cost since it occurred between 20:00 and 21:00, when theelectricity price was low.

4.2 Opportunities from Electricity RTP 29
0 2 4 6 8 10 12 14 16 18
Electricity Consumption (kWh) ×104
-600
-400
-200
0
200
400
600
800
1000
1200
Tota
l diffe
rence b
etw
een p
ricin
g C
ontr
acts
2001-2
007 in E
UR
Difference between pricing contracts vs Energy Consumption & σ 2001-2007 for DH
0.2
0.4
0.6
0.8
1
1.2
1.4
1.6
1.8
2
2.2
σ, kWh
Figure 4.5: Total cost difference between pricing contracts 2001-2007 forDH
4.2.2 Annual Analysis
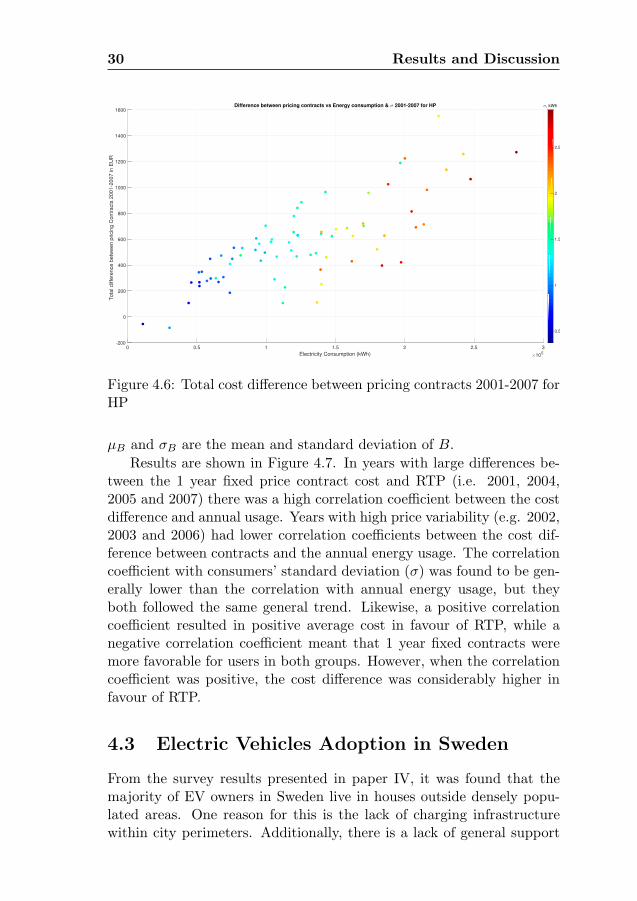
Results obtained from the 7 year period showed that for most consumersin both user groups it was more economical to adopt a RTP contractinstead of a 1 year fixed price contract. Although the end result looksscattered in Figures 4.5 and 4.6, the average savings for DH users was162,3 EUR and 569 EUR for HP users, both in favour of RTP (positiveside of the axis). A maximum of 1551 EUR in savings was obtained inthe HP user group and 1066 EUR in the DH user group. There wereonly two users (2,6%) in the HP group and seventeen (10,4%) in theDH group for which the RTP contract was more expensive. The largestprice difference in favour of the 1 year fixed price contract was 84 EURin the HP group and 458 EUR in the DH group.
Two correlation coefficients were obtained in order to determine therelationship between the cost difference and the customers’ consumptionstandard deviation (σ), and between the cost difference and the annualenergy usage. These coefficients were defined using the Pearson correla-tion coefficient [54] for N scalar observations, calculated as follows:
ρ(A,B) =1
N − 1
N∑i=1
(Ai − µA
σA
)(Bi − µB
σB
)(4.1)
Where µA and σA are the mean and standard deviation of A, and
30 Results and Discussion
0 0.5 1 1.5 2 2.5 3
Electricity Consumption (kWh) ×105
-200
0
200
400
600
800
1000
1200
1400
1600T
ota
l diffe
rence b
etw
een p
ricin
g C
ontr
acts
2001-2
007 in E
UR
Difference between pricing contracts vs Energy consumption & σ 2001-2007 for HP
0.5
1
1.5
2
2.5
σ, kWh
Figure 4.6: Total cost difference between pricing contracts 2001-2007 forHP
µB and σB are the mean and standard deviation of B.
Results are shown in Figure 4.7. In years with large differences be-tween the 1 year fixed price contract cost and RTP (i.e. 2001, 2004,2005 and 2007) there was a high correlation coefficient between the costdifference and annual usage. Years with high price variability (e.g. 2002,2003 and 2006) had lower correlation coefficients between the cost dif-ference between contracts and the annual energy usage. The correlationcoefficient with consumers’ standard deviation (σ) was found to be gen-erally lower than the correlation with annual energy usage, but theyboth followed the same general trend. Likewise, a positive correlationcoefficient resulted in positive average cost in favour of RTP, while anegative correlation coefficient meant that 1 year fixed contracts weremore favorable for users in both groups. However, when the correlationcoefficient was positive, the cost difference was considerably higher infavour of RTP.
4.3 Electric Vehicles Adoption in Sweden
From the survey results presented in paper IV, it was found that themajority of EV owners in Sweden live in houses outside densely popu-lated areas. One reason for this is the lack of charging infrastructurewithin city perimeters. Additionally, there is a lack of general support

4.3 Electric Vehicles Adoption in Sweden 31
2001 2002 2003 2004 2005 2006 2007
Year
-1
-0.8
-0.6
-0.4
-0.2
0
0.2
0.4
0.6
0.8
1C
orr
ela
tio
n C
oe
ffic
ien
tFor DH-Connected Users
-20
-18
-16
-14
-12
-10
-8
-6
-4
-2
0
2
4
6
8
10
12
14
16
18
20
Ave
rag
e C
ost
Diffe
ren
ce
, E
UR
/Ye
ar
with σ
With annual energy usage
Average Cost Difference [EUR/Yr]
2001 2002 2003 2004 2005 2006 2007
Year
-1
-0.8
-0.6
-0.4
-0.2
0
0.2
0.4
0.6
0.8
1
Co
rre
latio
n C
oe
ffic
ien
t
For Users with HP
-40
-36
-32
-28
-24
-20
-16
-12
-8
-4
0
4
8
12
16
20
24
28
32
36
40
Ave
rag
e C
ost
Diffe
ren
ce
, E
UR
/Ye
ar
with σ
With annual energy usage
Average Cost Difference [EUR/Yr]
Figure 4.7: Correlation between cost difference with standard deviationand annual energy usage
for charging points besides the funding provided for R&D [55]. Ana-lyzing existing charging locations and the time of the day when electricvehicles are charged plays an important role in the preparation for sce-narios with high EV market penetration.
The majority of the respondents (64%) drive their electric vehiclefor distances between 30 and 100 km/day. Moreover, 173 (70%) of theEV owners stated that they only charge their vehicles at home; while12 (5%) use the charging spots at their work places. Only 1% of therespondents charge their vehicles while doing errands and the majorityof the EV owners charge their cars at night; 57% during weekdays, and62% during the weekend.
The total number of EVs that are connected to the grid in Sweden isexpected to reach approximately 18 000 at the end of 2016 [56] and 162500 in 2030 [57]. While the overall electricity consumption increase couldbe met by Sweden’s generation capacity projections of 175 TWh by 2030[58], the increased number of EVs can severely affect today’s electricityconsumption profile by increasing the evening peak, which, accordingto the survey carried out in this paper, is when the survey respondentsstate that they charge their cars. This peak increase, in combinationwith existing available variable pricing schemes (real time pricing anddemand based pricing) could lead to a system peak that requires the useof fossil fueled peaking power plants. The use of these power stations

32 Results and Discussion
Figure 4.8: Load increase with different levels of EV penetration
increases the CO2/kWh in the electricity mix, and consequently therunning cost per km of EVs due to an increased system electricity price.
Results obtained from the simulation model built in Dymola usingModelica language showed that with the majority of vehicles chargingat night at home (corresponding to the residential evening consump-tion peak), voltage violations occurred with EV penetration levels over30% and losses in the LV distribution network increased significantly, asshown in Figure 4.8. These results are similar to those found by Masumet al. [40], who suggested that scheduled charging would be required tosupport large penetration of EVs without requiring significant upgradeson the existing infrastructure.
To test this hypothesis, the charging start time was shifted 2 hoursahead for different numbers of EVs, to determine the number needed toshift to create a second consumption peak. It was found that a secondpeak, similar to the nightly residential peak, was obtained when over70% of the EVs shifted their charging start time (Figure 4.9). Additionalsimulations are presented in [59].
4.4 Distributed Generation
Active distribution networks offer a promising alternative towards amore sustainable power system, due to their ability to effectively inte-grate DGs from different energy sources, including renewables. Results

4.4 Distributed Generation 33
Figure 4.9: Impact of charge scheduling
presented in paper V show not only that the object-oriented mathemat-ical models built in Modelica are valid for simulating DG components,but also that they can be integrated with existing open source libraries(e.g PowerSystems Modelica Library [60]).
Simulation results for the capstone C65 turbine model show thatthe fuel consumption data matches the measurements obtained fromthe SCADA system, as shown in Figure 4.10. The x-axis shows eachdata sample taken every minute and the y-axis represents the gas con-sumption in m3/h. A one to two sample delay was found, especiallynoticeable during ramping up and ramping down of the C65 turbine. Inorder to reduce this delay, thermal and mechanical inertia parametersshould be included in the model and the data acquisition system shouldbe checked for delays between the SCADA and the database, where atimestamp is assigned to each data sample.
Simulation results from the PV model are shown in Figure 4.11. Thex-axis shows each data sample taken at every minute and the y-axisrepresents the power output in kW. The model captures the behaviourof the PV array well, as shown in Figure 4.11 (left), however, results areless accurate during cloudy days, as shown in Figure 4.11 (right), dueto the effect of refraction and reflection from passing clouds. In order toimprove the performance of the model under these circumstances, thediffused and ground-reflected irradiance parameters should be includedin the PV model’s equation system.
In paper VI, the climate action plan of the city of Eskilstuna in Swe-den was analyzed in order to evaluate the local integration of renewable

34 Results and Discussion
Figure 4.10: Simulated (solid) vs real (dotted) results for a daily profilefor the C65 ICHP
Figure 4.11: Simulated (Solid) vs Real (doted) power (in kW) outputfrom the PV array

4.4 Distributed Generation 35
energy sources in the municipal area as well as the required infrastruc-ture to support larger penetration of EVs, among other issues. It wasfound that to reach the expected goals, several adjustments should becarried out. For instance, to achieve the renewable energy goals in thecity, a detailed analysis of the most suitable rooftops for installing PVsystems should be performed and more funds should be allocated for therequired investments. Furthermore, specific information on the distri-bution network’s capacity and self-consumption goals should be defined,to determine the correct size of the PV systems required.
Regarding the CO2 reduction targets in the transport sector, al-though large EV penetration is not the top priority, it would contributesignificantly to reaching these goals. For this, a larger recharging infras-tructure would be required to support the increased adoption of EVs.Additionally, the climate action plan would need to take into accountthe transportation needs of the city as well as citizens’ driving patternsand integrate them with the local production of renewable electricitythrough an actively controlled distribution network.

Chapter 5
Conclusions
This thesis studied the roles of several actors involved in electric distri-bution systems through electricity consumption data analysis and simu-lation models. Several research questions were formulated and addressedthrough six papers, presented in this work. These research questions areaddressed in this section.
What are the main advantages for households from adoptinghourly spot market electricity pricing agreements? (Paper I)
A high RTP customer share can enable large adoption of technology-based solutions designed to take advantage of electricity price fluctua-tions. For example, customers with heat pumps or any other type ofelectric-based heating system can adopt smart temperature controllersthat react to price signals. With such systems, the operation of theheating system can react to price variations in the spot market, andthus optimize operation costs while maintaining adequate indoor condi-tions. In this study, GSHP users experienced the larger benefits fromthe use of RTP. Therefore, adopting these technology-based solutionswould help increase economic savings even further.
Additionally, mass RTP adoption can enable further adoption ofsmart grid technologies at the residential level. For instance, deploy-ment of energy storage technologies combined with solar PV systemscan increase, due to the associated benefits of storing energy duringlow-price hours to be used during peak hours. Similarly, RTP can alsohelp boost the adoption of EVs, since users can implement chargingcontrol schemes where the vehicle’s battery is only charged when theelectricity price is low, thereby reducing its mobility-associated costs.
36

37
Could households benefit from hourly spot market electricitypricing agreements without adopting DSM strategies? (PaperI)
Most users experienced economic benefits over the 7 year study periodwhen using a RTP contract despite spikes in electricity prices, includingthe critical fluctuations in the Winter of 2002-2003. These results sug-gest that customers in Sweden could shift to RTP contracts and still gaineconomic benefits even without changing their electricity usage patterns(e.g adopting DSM strategies).
What are the main impacts on the energy supply system fromadopting different energy conservation measures and increas-ing DG penetration in residential areas? (Paper II)
The results discussed in the thesis suggest that it is critical to ana-lyze the characteristics of the existing energy supply networks that feedbuildings before undertaking large building renovations. This analysiscan help city planners decide in which areas different ECMs would havethe highest system impact on energy efficiency and greenhouse gasesreduction. Moreover, it is important to consider additional measuresbesides conventional building envelope improvements, such as buildingautomation, distributed generation (e.g. solar thermal, PV, micro CHPetc.), efficient outdoor lighting and energy storage.
What is the electricity demand impact on detached householdsin Sweden from using ground-sourced heat pumps? (Paper III)
GSHP households can use up to 76.5% more electricity per m2 thantheir DH counterparts. This implies that GSHP-based users may beless likely to obtain rapid reductions in electricity use from increaseduse of energy-efficient appliances and lighting systems, since GSHPs’energy use is heavily influenced by outdoor temperatures, substantiallyaffecting the overall electricity consumption.
However, intensive use of GSHP also increases the possibilities forstimulating automatic demand side management (ADSM) systems, wherethe temperature settings of the GSHP are controlled based on weatherforecasts, network operation and real time electricity price information,in order to provide a more stable demand-supply balance during peak-time conditions. In order to make good use of ADSM systems whilemaintaining the temperature comfort of the users, the use of energy

38 Conclusions
storage systems should be encouraged, as well as investments in ther-mal insulation which will increase the effectiveness of ADSM systems.Furthermore, large electricity demand from GSHPs makes it absolutelynecessary to use efficient dynamic pricing schemes that would encourageusers to make the best use of their GSHPs.
What can be learned from early EV adopters in Sweden todevelop strategies that support the penetration of electric ve-hicles in other countries, and what are the potential impactson local electric distribution grids from large adoption of EVs?(Paper IV)
The results presented in this thesis characterize the typical EV ownerin Sweden as male, with medium-high income, highly educated, livingin a 2 or 4 member family in a house usually located in an area withlow population density, with daily driving patterns between 30km and100km, far below the average range of current EVs. Based on the in-sights provided in this study regarding the location and time of daycharging, future business models and information strategies should en-courage communication and information exchange between EV ownersand electricity suppliers to increase the benefits for the two sectors.
Moreover, in order to achieve a sustainable use of EVs, nationaland local governments should focus on providing the required charginginfrastructure in densely populated areas. However, before deployingthis infrastructure, the implications and potential impact on primaryand secondary distribution networks should be analyzed.
Furthermore, regarding the EV impact on the distribution network,the results showed that the majority of EV owners charge their vehiclesat night. This coincides with the residential evening consumption peak,resulting in voltage violations with EV penetration levels over 30%. Sim-ple load shifting strategies (e.g. 2 hours ahead shifting) created a secondconsumption peak for the EVs, shifting over 70% of the consumption.Thus, optimal load shifting strategies should be developed in order toprevent overloading the distribution network during evening peak hours.Additionally, since vehicles spend a large amount of time plugged in, andaverage daily driving distances are far below the vehicle’s battery capac-ity, vehicle owners could benefit from adopting strategies that allow theircars to be part of network controlling agreements (e.g. V2G).

39
What are the benefits and challenges from using an equation-based, object-oriented modelling language to model DG com-ponents in LV distribution networks? (Paper V)
Large adoption of microgrids and active distribution networks offer apromising solution towards a more sustainable power system, mainlythanks to their ability to effectively integrate DGs from different energysources, including renewables. One of the main challenges for thesenetworks to become more popular is that the conventional distributionsystem was not designed to include large penetration of DGs, and thusthe existing planning, modelling and simulation software packages werealso not designed to handle these new networks.
The results demonstrate that as well as the presented modelling ap-proach being valid for simulating DGs, the models can also be success-fully integrated with existing open-source libraries. Future work will in-clude developing more components and testing the model’s performancewith other libraries in order to perform more complex simulations, for in-stance to combine the operation of the power system with a local districtheating network, where both the electrical and thermal performance canbe simulated and evaluated under different operation conditions.
What are the best strategies to integrate DG and e-mobilityto increase urban sustainability in mid-sized cities in Swedenand its implications on the existing distribution infrastructure?(Paper VI)
To increase renewable energy electricity production in urban areas, priordetailed analysis of the physical capabilities of the city should be per-formed. For instance, the most suitable rooftops for installing PV sys-tems should be identified and specific information about the distributionnetwork’s capacity and self-consumption goals should be established inorder to select PV systems with the correct specifications. Regardingthe CO2 reduction targets in the transport sector, larger recharging in-frastructure to support increased adoption of EVs would be required.This infrastructure needs to consider the mobility patterns in the cityas well as citizens’ driving habits in order to integrate them with thelocal production of renewable electricity through an actively controlleddistribution network.

Bibliography
[1] George Constable and Bob Somerville, editors. A Century of In-novation: Twenty Engineering Achievements that Transformed ourLives. The National Academies Press, Washington, DC, 2003.
[2] Gary Cook, Tom Dowdall, David Pomerantz, and Yifei Wang.Clicking Clean : How Companies are Creating the Green Internet.Technical report, 2014.
[3] International Energy Agency. World Energy Outlook 2015. WorldEnergy Outlook. OECD Publishing, nov 2015.
[4] IEA NEA and OECD. Medium-Term Renewable Energy Market Re-port 2015. Medium-Term Renewable Energy Market Report. OECDPublishing, Paris, oct 2015.
[5] E. Heydarian-Forushani, M.P. Moghaddam, M.K. Sheikh-El-Eslami, M. Shafie-khah, and J.P.S. Catalao. A stochastic frameworkfor the grid integration of wind power using flexible load approach.Energy Conversion and Management, 88:985–998, 2014.
[6] G. M. Shafiullah, Amanullah M.t. Oo, a. B M Shawkat Ali, andPeter Wolfs. Potential challenges of integrating large-scale windenergy into the power grid-A review. Renewable and SustainableEnergy Reviews, 20:306–321, 2013.
[7] Katrin Schaber, Florian Steinke, Pascal Muhlich, and ThomasHamacher. Parametric study of variable renewable energy inte-gration in Europe: Advantages and costs of transmission grid ex-tensions. Energy Policy, 42:498–508, 2012.
[8] International Energy Agency. OECD - Net capacity of renewables.IEA Renewables Information Statistics (database), 2016.
40

BIBLIOGRAPHY 41
[9] Matthias Eichelbronner and Jan-benjamin Spitzley. German Expe-rience on the Support Mechanism and Technical Aspects of GridConnectivity of Solar PV Rooftop-Systems. Technical Report 1,GIZ, 2012.
[10] Radu Dan Lazar and Adrian Constantin. Voltage balancing inLV residential networks by means of three phase pv inverters. In27th European Photovoltaic Solar Energy Conference and Exhibi-tion, pages 4068–4071, 2012.
[11] Georg Kerber, Rolf Witzmann, and Hannes Sappl. Voltage limita-tion by autonomous reactive power control of grid connected pho-tovoltaic inverters. In 2009 Compatability and Power Electronics,pages 129–133, 2009.
[12] Jack Casazza and Frank Delea. Understanding Electric Power Sys-tems. John Wiley & Sons, Inc., Hoboken, NJ, USA, oct 2003.
[13] Martin Abdel-Majeed, Ahmad; Tenbohlen, Stefan ; Schollhorn,Daniel ; Braun. Development of State Estimator for Low Volt-age Networks using Smart Meters Measurement Data. PowerTech(POWERTECH), 2013 IEEE Grenoble, pages 2–7, 2013.
[14] Soma Shekara Sreenadh Reddy Depuru, Lingfeng Wang, and VijayDevabhaktuni. Smart meters for power grid: Challenges, issues,advantages and status. Renewable and Sustainable Energy Reviews,15(6):2736–2742, aug 2011.
[15] J Anderson, A Sadhanala, and R Cox. Using Smart Meters for LoadMonitoring and Active Power-Factor Correction. IECON 2012-38thAnnual . . . , 2012.
[16] W.H. Kersting. Radial distribution test feeders. IEEE Transactionson Power Systems, 6(3):975–985, 1991.
[17] Math Bollen, Yvonne Beyer, Emmanouil Styvactakis, JasminaTrhulj, Riccardo Vailati, and Werner Friedl. A European bench-marking of voltage quality regulation. Proceedings of InternationalConference on Harmonics and Quality of Power, ICHQP, pages45–52, 2012.
[18] American National Standards Institute. ANSI C84.1-2011: Electricpower systems and equipmentVoltage ratings (60 Hertz), 2011.

42 BIBLIOGRAPHY
[19] John McDonald. Solar Power Impacts Power Electronics In TheSmart Grid, 2013.
[20] Rakibuzzaman Shah, N. Mithulananthan, R.C. Bansal, and V.K.Ramachandaramurthy. A review of key power system stability chal-lenges for large-scale PV integration. Renewable and SustainableEnergy Reviews, 41:1423–1436, 2015.
[21] Case Bornholm, Adrian Constantin, Radu Dan Lazar, andSøren Bækhøj Kjær. Voltage control in low voltage networks by.(December), 2012.
[22] a. Marinopoulos, F. Papandrea, M. Reza, S. Norrga, F. Spertino,and R. Napoli. Grid integration aspects of large solar PV installa-tions: LVRT capability and reactive power/voltage support require-ments. 2011 IEEE Trondheim PowerTech, pages 1–8, jun 2011.
[23] Wen Shan Tan, Mohammad Yusri Hassan, Md Shah Majid, andHasimah Abdul Rahman. Optimal distributed renewable genera-tion planning: A review of different approaches. Renewable andSustainable Energy Reviews, 18:626–645, 2013.
[24] Paul Saravanamuttoo, H.I.H, Rogers, G.F.C. Cohen, H.,Straznicky. Gas Turbine Theory. Pearson Education Canada, 6theditio edition, 2008.
[25] Resource Dynamics Corporation. Assessment of Distributed Gen-eration Technology Applications. Technical Report February, 2001.
[26] J. L. Hausman, W. J.,Neufeld. Time-of-Day Pricing in the U.S.Electric Power Industry at the Turn of the Century. InternationalLibrary Of Critical Writings In Economics, pages 235–245, 2006.
[27] F. Wallin, C. Bartusch, E. Thorin, T. Bdckstrom, and E. Dahlquist.The Use of Automatic Meter Readings for a Demand-Based Tar-iff. In 2005 IEEE/PES Transmission & Distribution Conference &Exposition: Asia and Pacific, pages 1–6. IEEE, August 2005.
[28] Severin Borenstein, Michael Jaske, and Arthur Rosenfeld. Dynamicpricing, advanced metering, and demand response in electricitymarkets. Center for the Study of Energy Markets, 2002.
[29] Samuel Gyamfi and Susan Krumdieck. Price, environment and se-curity: Exploring multi-modal motivation in voluntary residentialpeak demand response. Energy Policy, 39(5):2993–3004, May 2011.

BIBLIOGRAPHY 43
[30] P. Faria and Z. Vale. Demand response in electrical energy supply:An optimal real time pricing approach. Energy, 36(8):5374–5384,August 2011.
[31] NordREG. NordREG report on the price peaks in the Nordic whole-sale market during winter 2009-2010. Technical report, Nordic En-ergy Regulators, 2011.
[32] Energimyndigheten. Price Formation and Competition in theSwedish Electricity Market. Technical report, Swedish EnergyAgency, 2006.
[33] NordPool Spot. Europe’s Leading Power Markets. Technical report,Nordpool Spot, Oslo, Norway, 2015.
[34] Energy Markets Inspectorate. The Swedish electricity and naturalgas markets 2013. Technical report, Energy Markets Inspectorate,Eskilstuna, Sweden, 2013.
[35] J. Vassileva, I. Campillo. Consumers Perspective on Full-ScaleAdoption of Smart Meters: A Case Study in Vasteras, Sweden.Resources, 5(1):3, jan 2016.
[36] Energy Markets Inspectorate. The Swedish electricity and naturalgas markets 2014. Technical report, Energy Markets Inspectorate,Eskilstuna, Sweden, 2014.
[37] William Goetzler, Robert Zogg, Heather Lisle, and Javier Burgos.Ground-Source Heat Pumps: Overview of Market Status, Barri-ers to Adoption, and Options for Overcoming Barriers. Technicalreport, U.S. Department of Energy, 2009.
[38] Lino Guzzella and Antonio Sciarretta. Vehicle Propulsion Systems- Introduction to Modeling and Optimization. 2013.
[39] Kwo Young, Caisheng Wang, Le Yi Wang, and Kai Strunz. ElectricVehicle Integration into Modern Power Networks. 2013.
[40] A.S. Masoum, S. Deilami, P.S. Moses, M.a.S. Masoum, and a. Abu-Siada. Smart load management of plug-in electric vehicles in dis-tribution and residential networks with charging stations for peakshaving and loss minimisation considering voltage regulation. IETGeneration, Transmission & Distribution, 5(8):877, 2011.
[41] Consumer Reports. ELECTRIC CARS 101, 2016.

44 BIBLIOGRAPHY
[42] Ernst&Young. Gauging interest for plug-in hybrid and electric ve-hicles in select markets Contents. pages 1–32, 2010.
[43] Peter Fritzson and Vadim Engelson. Modelica A Unified Object-Oriented Language for Physical Systems Modeling Language Spec-ification. Technical report, 2013.
[44] Modelica Association. Modelica A unified object-oriented languagefor physical systems modeling. Technical report, Linkoping Univer-sity, Linkoping, Sweden, 2012.
[45] Luigi Vanfretti, Wei Li, Tetiana Bogodorova, and P. Panciatici. Un-ambiguous power system dynamic modeling and simulation usingmodelica tools. pages 1–5, 2013.
[46] Statistics Sweden. Prices on electricity for different kind of con-sumers and agreements, time serie, 2013.
[47] Capstone Turbine Corporation. 410048 Rev B. Technical Reference:Capstone Model C65 Performance, 2008.
[48] Dezso Sera and Remus Teodorescu. PV panel model based ondatasheet values. Electronics, 2007. ISIE, (4):2392–2396, 2007.
[49] E. D. Mehleri, P. L. Zervas, H. Sarimveis, J. a. Palyvos, and N. C.Markatos. Determination of the optimal tilt angle and orientationfor solar photovoltaic arrays. Renewable Energy, 35(11):2468–2475,2010.
[50] Hongwen He, Rui Xiong, and Jinxin Fan. Evaluation of Lithium-IonBattery Equivalent Circuit Models for State of Charge Estimationby an Experimental Approach. Energies, 4(12):582–598, mar 2011.
[51] Bor Yann Liaw, Rudolph G. Jungst, Ganesan Nagasubramanian,Herbert L. Case, and Daniel H. Doughty. Modeling capacity fade inlithium-ion cells. Journal of Power Sources, 140(1):157–161, 2005.
[52] Kotub Uddin, Alessandro Picarelli, Christopher Lyness, Nigel Tay-lor, and James Marco. An Acausal Li-Ion Battery Pack Model forAutomotive Applications. Energies, 7(9):5675–5700, 2014.
[53] Svensk Energi. Electricity tax history 1954 - 2014. Technical report,Svensk Energi, 2014.

[54] Ronald Aylmer Sir Fisher. Statistical methods for research workers.Edinburgh Oliver and Boyd, 13th ed. edition, 1958.
[55] McKinsey & Company. Electric vehicles in Europe: Gearing up fora new phase? Technical report, Amsterdam, 2014.
[56] PowerCircle AB. Flera nya rekord for de laddbara fordonen, 2016.
[57] Swedish Energy Agency. Kunskapsunderlag Angaende Marknadenfor Elfordon och Laddhybrider, ER 2009:20. Technical report, 2009.
[58] North European Power Perspectives. Roadmap for a fossil-independent transport system by 2030. Technical Report June 2013,2013.
[59] Ida Simonyan and Johanna Odhall. Future Scenario SimulationsFor Smart Grids: Modeling and simulation of load demand changesimpact on low-voltage distribution networks. Technical report,Malardalen University, 2014.
[60] Rudiger Franke and Germany Ruedigerfrankedeabbcom. Flexiblemodeling of electrical power systems the Modelica PowerSystemslibrary. pages 515–522, 2014.