Embed Size (px)
Citation preview

Ecological Monographs, 83(2), 2013, pp. 239–261� 2013 by the Ecological Society of America
From local monitoring to a broad-scale viability assessment:a case study for the Bonelli’s Eagle in western Europe
ANTONIO HERNANDEZ-MATIAS,1,16 JOAN REAL,1 MARCOS MOLEON,2 LUIS PALMA,3 JOSE ANTONIO SANCHEZ-ZAPATA,4
ROGER PRADEL,5 MARTINA CARRETE,6 JOSE MARIA GIL-SANCHEZ,7 PEDRO BEJA,3 JAVIER BALBONTIN,8
NICOLAS VINCENT-MARTIN,9 ALAIN RAVAYROL,10 JOSE RAMON BENITEZ,11 BERNARDO ARROYO,12
CARMELO FERNANDEZ,13 ERNESTO FERREIRO,14 AND JAVIER GARCIA15
1Conservation Biology Group, Departament de Biologia Animal, Universitat de Barcelona, Av. Diagonal 643, 08028 Barcelona,Catalonia, Spain
2Centre for African Ecology, School of Plant, Animal and Environmental Sciences, University of the Witwatersrand, Wits 2050,Johannesburg, South Africa
3CIBIO, Centro de Investigacao em Biodiversidade e Recursos Geneticos, Universidade do Porto, Campus Agrario de Vairao,4485-601 Vairao, Portugal
4Department of Applied Biology, University Miguel Hernandez, Carretera de Beniel km 3.2, 33012 Orihuela, Alicante, Spain5Centre d’Ecologie Fonctionnelle et Evolutive, Centre National de la Recherche Scientifique, 1919 Route de Mende,
34293 Montpellier Cedex 5, France6Department of Physical, Chemical and Natural Systems, Universidad Pablo de Olavide, Carretera de Utrera km 1,
41013 Sevilla, Spain7Empresa de Gestion Medioambiental-Consejerıa de Medio Ambiente, Junta de Andalucıa, Calle Joaquina Eguaras, 10,
18013 Granada, Spain8Departamento de Zoologıa, Facultad de Biologıa, Avenida Reina Merecedes s/n. Universidad de Sevilla, Sevilla 41012 Spain
9Conservatoire-Etudes des Ecosystemes de Provence, Ecomusee de la Crau, 13310 Saint Martin de Crau, France10La Salsepareille, 3 bis rue Vieille commune, 34800 Clermont l’Herault, France
11Colectivo Ornitologico Ciguena Negra, Carretera N 340 km. 78.5, Tarifa, 11380 Cadiz, Spain12Paseo de la Florida n8 28, Esc 2, 88 E, 28008 Madrid, Spain
13Calle Castillar 18, 31392 Pitillas, Navarra, Spain14Bioma TBC SLL, Calle Ceuta 10, 28260 Madrid, Spain
15Fundacion Tierra Iberica, Camino de Sariegos, Azadinos, 24121 Leon, Spain
Abstract. Population viability analysis (PVA) has become a basic tool of current conservation practice. However, ifnot accounted for properly, the uncertainties inherent to PVA predictions can decrease the reliability of this type ofanalysis. In the present study, we performed a PVA of the whole western European population (France, Portugal, andSpain) of the endangered Bonelli’s Eagle (Aquila fasciata), in which we thoroughly explored the consequences ofuncertainty in population processes and parameters on PVA predictions. First, we estimated key vital rates (survival,fertility, recruitment, and dispersal rates) using monitoring, ringing, and bibliographic data from the period 1990–2009from 12 populations found throughout the studied geographic range. Second, we evaluated the uncertainty about modelstructure (i.e., the assumed processes that govern individual fates and population dynamics) by comparing the observedgrowth rates of the studied populations with model predictions for the same period. Third, using the model structuressuggested in the previous step, we assessed the viability of both the local populations and the overall population. Finally,we analyzed the effects of model and parameter uncertainty on PVA predictions. Our results strongly support the ideathat all local populations in western Europe belong to a single, spatially structured population operating as a source–sink system, whereby the populations in the south of the Iberian Peninsula act as sources and, thanks to dispersal,sustain all other local populations, which would otherwise decline. Predictions regarding population dynamics variedconsiderably, and models assuming more constrained dispersal predicted more pessimistic population trends thanmodels assuming greater dispersal. Model predictions accounting for parameter uncertainty revealed a marked increasein the risk of population declines over the next 50 years. Sensitivity analyses indicated that adult and pre-adult survivalare the chief vital rates regulating these populations, and thus, the conservation efforts aimed at improving these survivalrates should be strengthened in order to guarantee the long-term viability of the European populations of thisendangered species. Overall, the study provides a framework for the implementation of multi-site PVAs and highlightsthe importance of dispersal processes in shaping the population dynamics of long-lived birds distributed acrossheterogeneous landscapes.
Key words: bird predator; birds of prey; dispersal; Hieraaetus fasciatus; metapopulation; model uncertainty; parameteruncertainty; population viability analysis; raptors; source–sink models; spatially structured population; stochastic population dynamics.
Manuscript received 19 July 2012; revised 15 November 2012; accepted 21 November 2012. Corresponding Editor: A. M.Ellison.
16 E-mail: [email protected]
239
INTRODUCTION
Population viability analysis (PVA), the use ofquantitative methods to predict the likely future status
of a population, has become a basic, widely used tool incurrent conservation practice (Gilpin and Soule 1986,
Boyce 1992, Brook et al. 2000, Morris and Doak 2002,Lindenmayer et al. 2003). One of the major contribu-
tions of this type of mathematical method is its ability toprovide technical and scientific information for guiding
decision makers working with populations of conserva-tion target species. However, the uncertainties inherent
to PVA predictions may decrease the reliability ofpredictions if not accounted for properly and thus may
limit their applied value (Bakker et al. 2009, McGowanet al. 2011).
Two crucial elements in the formulation of a usefulPVA are, firstly, an accurate estimation of the vital rates
on which the PVA is based and, secondly, a model thatmimics the real world well enough to carry out its stated
purpose (Reed et al. 2002). In particular, vital ratesshould ideally be estimated using large sample sizes
derived from long-term data sets, thereby ensuringrepresentative information for the studied population,as well as a reduction in sampling variances around
parameter estimates and the reliable capture of the effectof environmental variation (Brook and Kikkawa 1998,
Crone et al. 2011). However, the demographic datarequired for a detailed simulation of PVA models is
often scarce in the case of rare or endangered species,and therefore, accounting for uncertainties on the
estimation of these parameters is nearly always neces-sary in order to increase the reliability of PVA
predictions (Doak et al. 2005).Uncertainty about model structure, the assumed
processes that govern individual fates and populationdynamics, may be much harder to evaluate, but can also
be a great source of uncertainty in model predictions(Burgman et al. 2005, Valle et al. 2009). A reliable
method for testing the validity of the assumptionsimplicit in the model structure is to compare past
population trends and model predictions over the sameperiod of time (Brook et al. 2000, Lindenmayer et al.2001, Schtickzelle and Baguette 2004). To do so, it is
necessary to have information on viability measuresbased on past population trends and estimated indepen-
dently of the vital rates used to make model predictions.Unfortunately, information on past population trends is
rarely available for endangered species, and therefore,most published PVAs do not fulfill this criterion. When
data is available, however, model validity evaluationwas conducted using several viability metrics such as
quasi-extinction risk, patch occupancy, and populationsize (e.g., Brook et al. 2000, Coulson et al. 2001);
nevertheless, few studies have made use of populationgrowth rates, one of the most basic measures of mean
population performance (Bierzychudek 1999, Crone etal. 2011). More than other viability metrics, this measure
may be a better indicator of possible future problems
than an extinction probability if the short-term risk of
extinction is low (Morris and Doak 2002). Additionally,
this measure may be reliably estimated with incomplete
or short-term population size data. In order to validate
model structure, observed trends are usually compared
to the predictions of just a single model (e.g., Schtick-
zelle and Baguette 2004). Models can be also ‘‘calibrat-
ed’’ by comparing the predictions of the initially
assumed model and subsequently modifying model
assumptions in order to improve the match between
predicted and observed population trends (e.g., Mc-
Carthy et al. 2000). Despite the practical usefulness of
this procedure, it is preferable to select the most
plausible of a set of a priori-defined models with
different assumptions, which should be based on general
theory and the characteristics of the study species
(Hilborn and Mangel 1997).
Model structure may be inaccurate if knowledge of
the species’ life-history traits or of the ecological drivers
behind the variation in its vital rates is incomplete, or if
the spatial structure of the population is either not taken
into account or is inaccurately portrayed in the model
(Lindenmayer et al. 2001, Schtickzelle et al. 2005,
Bakker et al. 2009). However, these inaccuracies may
be of little relevance if they do not compromise PVA
predictions. For example, the effect of ecological drivers
may be obviated if past variation in vital rates correctly
accounts for their future variation. Similarly, in a
collection of populations distributed over a geographical
area, very low or very high movement rates between
local populations are expected to have little effect on
PVA predictions if all the local populations are treated
as a single population (Morris and Doak 2002).
However, low to medium movement rates may explicitly
need to take into account the spatial structure of the
populations if they are to properly predict their overall
demographic fate. On theoretical grounds, the meta-
population paradigm has played a significant role in the
development of general theory in population ecology
(Levins 1969, Hanski 1999). Essentially, this paradigm
assumes that species occur in habitable patches, some of
which may be occupied by local populations connected
by dispersal. In heterogeneous habitats, the population
growth rate of these local populations differs and thus
may generate source–sink dynamics, characterized by
the existence of sink populations (in which deaths
outnumber births) whose persistence depends on dis-
persal from source populations (in which births out-
number deaths) (Pulliam 1988). Although empirical data
have provided strong support for the main assumptions
behind the metapopulation paradigm, metapopulation
viability analyses still only represent a minority of the
PVAs that are carried out (but see McCarthy et al. 2000,
Lindenmayer et al. 2003, Schtickzelle et al. 2005) and
rarely have they accounted for metapopulations ranging
over broad geographical areas (Gonzalez-Suarez et al.
2006, Bonnot et al. 2011). This gap is due in part to the
difficulties inherent in modeling complex spatially
ANTONIO HERNANDEZ-MATIAS ET AL.240 Ecological MonographsVol. 83, No. 2

structured populations, but also in part to the difficulty
of obtaining detailed demographic information from
multiple local populations arrayed across broad spatial
scales.
In the present study, we performed a viability
assessment of a spatially structured population of an
endangered avian predator, in which we thoroughly
evaluated model assumptions with empirical data on
past population trends and then assessed how uncer-
tainties affect the model’s predictions. The study focused
on the western European population of Bonelli’s Eagle
(Aquila fasciata; see Plate 1), which corresponds to a
fairly discrete demographic unit within a much larger
distribution range extending from southeast Asia
through the Middle East to the western Mediterranean
(del Hoyo et al. 1992). The European Bonelli’s Eagle
population is estimated at 920–1100 pairs, of which
;80% are found in the Iberian Peninsula (see Fig. 1 for
ranges and population codes; BirdLife International
2004). This species has undergone a dramatic decline in
numbers and range in recent decades and is now listed as
an endangered species in Europe (79/409/EEC; Roca-
mora 1994, BirdLife International 2004, Ontiveros et al.
2004, Real 2004). The main factor behind this decline is
thought to be a demographic imbalance related to
decreased fertility and, above all, increased adult and
pre-adult mortality (Real and Manosa 1997, Real et al.
2001, Carrete et al. 2002, 2005, Soutullo et al. 2008).
Other factors such as the loss of suitable habitat caused
by changes in land use (Balbontın 2005), the decline in
key prey populations (Real 1991, Moleon et al. 2009),
and interspecific competition with the Golden Eagle
Aquila chrysaetos (Fernandez and Insausti 1990, Lopez-
Lopez et al. 2004, Carrete et al. 2006) have also had
negative effects on Bonelli’s Eagle populations. Inter-
estingly, however, trends at local population scale within
western Europe have differed markedly over the last two
decades: whereas most populations in central and
northern Iberia have declined, those in southern Iberia
have remained stable or even increased (Real and
Manosa 1997, del Moral 2006, Beja and Palma 2008,
Soutullo et al. 2008). It remains unknown, however, to
what extent the dynamics of different populations are
linked and in particular what influence, if any, growing
populations have on the demography of declining
populations.
Previous demographic assessments of this species have
afforded researchers valuable information on the
dynamics of these populations and have suggested that
the survival of adults and pre-adults is the chief vital rate
regulating this eagle’s populations (Real and Manosa
1997, Carrete et al. 2005, Soutullo et al. 2008). Due to
the scarcity of information on dispersal patterns, these
previous studies assumed either that local populations
were closed or that the probability of dispersal between
populations was independent of distance. These simpli-
fications could have seriously affected results given that
empirical data indicates that, although Bonelli’s Eagles
tend to breed within or close to their population of
origin, medium- and long-distance natal dispersal
movements are not uncommon (Hernandez-Matıas et
al. 2010), suggesting that distance-dependent dispersal
patterns may play an important role in overall
population dynamics. Additionally, the multi-site model
used by Soutullo et al. (2008) does not account for the
role played by the non-studied local populations in the
overall trend of the whole population. Finally, uncer-
tainty in model structure or parameter estimates was not
accounted for in these studies and thus their effects on
viability predictions remain unknown.
The aims of the present study were to estimate the key
vital rates of 12 local populations located throughout
the distribution and demographic range of Bonelli’s
Eagle in western Europe (France, Portugal, and Spain)
FIG. 1. Distribution area and population codes of Bonelli’sEagle (Aquila fasciata) in western Europe (shown in the areas ofany gray darker than the light-gray background). Thedistribution area was drawn by buffering a 7-km area aroundthe exact location of nests (FRA, CAT, SPT, and ARR-NPT)and around the center of the occupied 103 10 UTM quadrantsgiven by Martı and Moral (2003) and del Moral (2006). Inpanel (A), the darker gray areas shows the local populationsthat were monitored, and in panel (B), the darker gray areasshows those considered in the viability assessment. Shades ofgray highlight the different local populations.
May 2013 241BROAD-SCALE PVA FOR BONELLI’S EAGLE

and use this information to develop a multi-site PVA to
evaluate the likely future status of the whole westernEuropean population of this eagle. We used PVA
predictions regarding past local population trends totest the model’s assumptions. We evaluated viability by
predicting the future demographic fate of populationsand their probabilities of declining as far as certain
population thresholds. We conducted a thoroughanalysis of the effects of both model and parameteruncertainties on the model predictions. Finally, we
performed sensitivity and elasticity analyses to identifythe key vital rates on which conservation efforts should
be strengthened to improve the conservation status ofthis endangered species.
METHODS
Definition of local populations
Bonelli’s Eagle has a generally continuous distributionwithin western Europe (longitude 98300 W to 58550 E;
latitude 368000 to 448240 N), although its range becomesmore patchy at its western and northern edges (Fig. 1).
Therefore, local populations cannot be defined straight-forwardly on a basis of spatial discontinuities in thedistribution of individuals. Nevertheless, available in-
formation highlights the existence of marked differencesacross the species’ range in key demographic parameters
such as survival, fertility, and local demographic trends(Real and Manosa 1997, del Moral 2006, Carrascal and
Seoane 2009). Therefore, we used as a general criterionfor defining local populations the existence of groups of
individuals sharing the same geographical area that havesimilar demographic characteristics. We delineated local
populations by combining existing demographic andenvironmental data (Real and Manosa 1997, Carrascal
and Seoane 2009, Galicia et al. 2010) with data from ourown field experience with the species. Despite not
corresponding to highly isolated patches, as is generallyused in metapopulation terminology, the local popula-
tions we identified did allow for spatial structure basedon demographically relevant units (also see Carrete et al.
2008, Bonnot et al. 2011). To address the questionsposed in our study, the following local populations were
considered: (1) 12 monitored populations located acrossthe western European range of Bonelli’s Eagle used toestimate vital rates (Fig. 1A), (2) 18 populations used to
evaluate uncertainty in the model structure and the nataldispersal kernel, and (3) 10 populations used for the
viability assessment. In all our simulations we consid-ered the whole population within the studied range. To
do so, we initially split the whole population into 10local populations based on their geographical proximity
and distribution gaps, as well as on their demographicand habitat characteristics (Fig. 1B, Table 1). In a
second step, we split the whole population into 18 localpopulations: the 12 monitored local populations (Fig.
1A) and the 6 non-monitored populations, which weredefined by redrawing the boundaries of the 10 initial
populations and the monitored populations (Fig.
1A, B). This was done to keep the 12 monitored
populations separate to be able to compare the observed
and predicted trends in the model uncertainty evalua-
tion. In our models, to estimate dispersal probabilities
between populations, we considered the location of
individual territories so that the shape of the boundaries
of the populations did not affect our ability to properly
estimate this probability (see Appendix B).
Life-history traits and life cycle of Bonelli’s Eagle
Bonelli’s Eagle is a long-lived territorial bird with
delayed maturity and low breeding rates. Like other
territorial raptors, Bonelli’s Eagles pass through a
transient nomadic phase (i.e., a dispersal period) after
the post-fledging dependence period and before territo-
rial recruitment. During the dispersal period, birds
perform medium- to long-distance movements and often
settle for extended periods in dispersal areas (geometric
mean is 101 km, range 1–1020 km; Real and Manosa
2001), where they apparently suffer high human-induced
mortality rates (Real et al. 2001, Moleon et al. 2007,
Cadahıa et al. 2010). Territorial recruitment mostly
occurs between three and four years of age (Hernandez-
Matıas et al. 2010). During the territorial phase,
individuals exhibit strong pair-bonding behavior and
establish home ranges of ;50 km2, with strong fidelity
to the breeding area throughout the year and from one
year to the next (Bosch et al. 2010, Hernandez-Matıas et
al. 2011a). Most eagles in western Europe nest on cliffs,
although in southern Portugal, most pairs nest in trees.
Egg-laying (one or two, rarely three, eggs) usually takes
place in January–March, and mean productivity rates
range between 0.6 and 1.4 fledglings per pair and year
(del Moral 2006).
The life cycle considered in our models was based on a
post-breeding census of females in five age classes (Fig.
2). We chose to structure the population into age classes
because age appears to be strongly correlated with the
main vital rates in Bonelli’s Eagle; this allowed us to
model appropriately the differing contribution to
population growth of individuals from different classes.
Specifically, this eagle progressively increases its survival
and fertility rates, and propensity for territorial behavior
until the age of four, at which point birds acquire their
adult plumage and these vital rates stabilize (Martınez et
al. 2008, Hernandez-Matıas et al. 2010, 2011b). The
main vital rates considered were survival (S1, S23, S4,
and SA, corresponding, respectively, to first-year,
second- and third-year, fourth-year, and adult survival
rates), fertility per female per year (F2, F3, FA,
corresponding, respectively, to second-year, third-year,
and adult fertility), and recruitment rates (R2, R3, R4,
corresponding, respectively, to second-year, third-year,
and fourth-year recruitment rates), which reflect the
increasing propensity of eagles to become territorial as
they age (see next section). We assumed an offspring sex
ratio of 1:1 (Real and Manosa 1997, Soutullo et al.
2008).
ANTONIO HERNANDEZ-MATIAS ET AL.242 Ecological MonographsVol. 83, No. 2

Vital-rate estimations
The estimation of vital rates was mainly based on: (1)
monitoring data from territorial pairs in all studied
populations (population size, adult survival, and fertil-
ities), (2) data on individually known eagles from long-
term ringing programs in certain populations (dispersal
patterns from birth to territorial recruitment), and (3)
previously published information on this species (pre-
adult survival and recruitment rates).
Monitoring (1990–2009; Table 2) consisted of repeat-
ed visits during the breeding season (January–July) to a
representative sample of territories (from 65% to 100%
of all known territories) in 12 of the western European
TABLE 1. Local Bonelli’s Eagle (Aquila fasciata) populations considered in the model structure evaluation (18 populations) andviability assessment (10 populations), vital rates shared by populations, their environmental characteristics, and the degree ofhumanization.
Populationsfor modelevaluation
S1,S2,S3 S4 SA F2
F3,FA
Populationsfor viabilityassessment
S1,S2,S3 S4 SA F2 F3, FA Environment Humanization
ANR� 1 1 1 1 1 ANR-BUR� 1 1-2� 1-2� 1-2� 1-2� A, B mediumBUR� 1 2 2 2 2 A, B mediumARA� 1 3 3 3 3 ARA-ECLM� 1 3-4� 3-4� 3 3-4-5� B, E lowGUA� 1 4 4 3 4 B, E lowRest of ECLM 1 4 4 3 5§ E lowARR� 1 5 5 4 6 ARR-NPT� 1 5 5 4 6 D lowNPT 1 5 5 4 6 D lowCAD� 2 6 6 3 7 AND� 2 6-7� 6-7� 3 7-8-9� C, F highGRA� 2 7 7 3 8 E, F mediumRest of AND 2 7 7 3 9§ C, E, F mediumCAS� 1 8 8 3 10 PVAL� 1 8 8 3 10-11� B, F mediumRest of PVAL 1 8 8 3 11§ B, E, F highCAT� 1 9 9 3 12 CAT� 1 9 9 3 12 B highFRA� 1 10 10 5 13 FRA� 1 10 10 5 13 B highMUR� 1 11 11 3 14 MUR� 1 11 11 3 14 F highSWP� 2 12 12 3 15 SPT� 2 12 12 3 15 C, F mediumEXT-WCLM 1 7 7 3 16§ EXT-WCLM 1 7 7 3 16 D, F lowRest of SPT 2 12 12 3 15 SPT� 2 12 12 3 15 C, F medium
Notes: See Fig. 1 for the location of populations. Vital rates are coded with numbers to illustrate which values are shared bypopulations. The same code corresponds to the same estimated parameter in columns with the same heading: S1, S2, S3, S4, and SA(first-, second-, third-, fourth-year, and adult survivals, respectively) and F2, F3, and FA (second-, third-year, and adult fertility,respectively). Environmental characteristics are based on the classification proposed by Galicia et al. (2010), which describes themain climatic and lithological features of the Iberian Peninsula; these are as follows: A, mountain ranges moderated by proximity tooceans; B, rugged limestone country in the northern part of the central Spanish plateau and around the Ebro depression; C, Baeticmountains moderated by proximity to oceans and plains around Gibraltar; D, rugged siliceous landscapes and depressions in thecentral Spanish plateau and siliceous mountains in the eastern half of the peninsula; E, the Ebro depression, southern half of thecentral Spanish plateau and calcareous Baetic mountains with continental environments; F, mid-course of the river Guadiana, basinof the river Guadalquivir, and littoral and sub-littoral areas located south of the river Ebro. The degree of humanization is dividedinto three categories based on the density of people in the regions where eagle populations are located: the values of densities rangefrom 16.0 to 43.6 inhabitants/km2 (low), from 56.5 to 92.4 inhabitants/km2 (medium), and from 129.9 to 272.1 inhabitants/km2
(high) (data sources for human population density: http://www.ine.pt, http://www.ine.es, and http://www.insee.fr/).� Monitored populations.� Weighted mean (according to population sizes).§ Based on del Moral (2006).
FIG. 2. Diagram of the Bonelli’s Eagle life cycle. The solid lines represent the transitions between age classes, while the dashedlines represent the connection between age classes due to reproduction. SR and F represent the sex ratio and fertilities, respectively,for any given age class (F2, F3, and FA being fertility of two- and three-year olds and adults, respectively). S represents the survivalrates of individuals during their first (S1), second and third (S23), fourth (S4), and fifth and subsequent (adult) years of life (SA). Rrepresents the propensity to become territorial in immature birds (R2), subadults (R3), and first-year adults (R4) (denoted as ai inthe text).
May 2013 243BROAD-SCALE PVA FOR BONELLI’S EAGLE

populations (see Fig. 1A). This allowed us to obtain the
occupation rates of territories, identity of individuals (if
marked), the plumage-age and sex of territorial birds,
and the number of fledged chicks in each territory. We
classified territorial birds according to their plumage-
ages as juvenile (first year), immature (second year),
subadult (third year), or adult (fourth year or older;
Parellada 1984). Populations from North Africa were
not monitored and were not considered in our models as
available data suggest that migration across the Straits
of Gibraltar is very uncommon and the few birds
observed during migration periods are mostly territorial
or dispersing birds that do not actually cross the Straits
(Programa Migres 2009; G. M. Arroyo, personal
communication).
Annual fertility was estimated for each local popula-
tion as the mean productivity of monitored territories
occupied by territorial pairs (i.e., mean number of
fledglings per pair and year). We estimated fertility
separately for immature, subadult, and adult females.
We estimated the mean fertility during the study period
to be the arithmetic mean of annual estimates. In cases
where the sample size for non-adult fertilities was small
and provided unreliable estimates, we used estimates
from other populations with reliable data for this
parameter (Tables 1 and 2). For adult fertility, we
obtained estimates of the environmental variance to be
taken into account in the models by applying White’s
method based on the code proposed by Morris and
Doak (2002), which allows the observation error due to
sampling variation to be discounted (White 2000).
Adult survival was estimated (except in France) from
turnover rates of territorial birds based on plumage
ages, but was corrected by the proportion of non-
observable replacements (NOR; i.e., the replacement of
an adult-plumaged territorial eagle by another adult-
plumaged eagle; see details in Hernandez-Matıas et al.
2011a and Appendix B). We estimated the adult survival
for each population as the geometric mean of annual
survival probabilities. Environmental variance on sur-
vival was estimated by White’s method (White 2000). In
France, we used the adult survival estimates given by
Hernandez-Matıas et al. (2011b) that were estimated
using capture–recapture multistate models on a long-
term data set of individually ringed birds (1990–2008; n
¼ 423 birds).
Survival during the first three years of life (pre-adult
survival) was also estimated for the French population
using Hernandez-Matıas et al. (2011b), and we assumed
this to be the same for all populations except those in
southern Spain and southern Portugal. This assumption
was based on data showing that dispersing birds from
several western European populations share the same
dispersal areas (Cheylan et al. 1996, Real and Manosa
2001, Cadahıa et al. 2010, Moleon et al. 2011) and thus
are exposed to similar environmental conditions. In
southern populations, however, published and unpub-
lished data suggests that birds tend to use nearby
dispersing areas intensively and that their survival rates
are considerably higher than in other populations
(Balbontın et al. 2003, Balbontın 2004, Pais 2005,
Consejerıa de Medio Ambiente 2008, Balbontın and
Ferrer 2009).
Recruitment rates were estimated as the proportion of
territorial birds (ai ) and were calculated on the basis of
the age-specific probability that a non-territorial bird
will attempt to recruit (ai ), as estimated by Hernandez-
Matıas et al. (2010) for the French population using the
formulas linking ai to ai in Pradel and Lebreton (1999).
It was necessary to use these two rates (ai and ai ) for our
models in order to correctly account for the number of
potential breeders in the event of saturated populations.
We assumed that ai applied to the territorial propensity
of birds of a given age from any given population. We
TABLE 2. Main vital rates of the local Bonelli’s Eagle populations estimated from monitoring dataand used to evaluate model assumptions during the period 1990–2005.
Population Period� SA Var(SA) F2 F3 FA var(FA)
ANR 1990–2008 0.916 0.0026 0.000 0.000 0.767 0.041ARA 1994–2008 0.910 0.0004 0.286� 0.308 0.957 0.027ARR 1993–2009 0.883 0.0030 0.000 0.000 0.605 0.065BUR 1990–2009 0.907 0.0023 0.000 0.000 0.613 0.100CAD 1991–2008 0.940 0.0008 0.286� 0.800 1.344 0.073CAS 1990–2009 0.868 0.0032 0.286� 0.800 0.958 0.065CAT 1990–2009 0.889 0.0013 0.286 0.400 1.129 0.024FRA 1990–2008 0.880 0.0020 0.454 0.454 0.979 0.045GRA 1994–2008 0.924 0.0006 0.286� 0.471 1.422 0.016GUA 1990–2008 0.902 0.0012 0.286� 0.333 1.008 0.110MUR 1990–2008 0.893 0.0016 0.286� 0.510 1.201 0.061SWP 1992–2008 0.937 0.0005 0.286� 0.500 0.830 0.033
Notes: Pre-adult survival rates were S1¼ 0.687, S2 and S3¼ 0.720 for CAD, GRA, and SWP;and S1 ¼ 0.480, S2 and S3 ¼ 0.574 for the other local populations. ‘‘Var’’ expresses temporalvariance after discounting sampling variance (see Methods: Vital-rate estimations). Populationcodes are as in Fig. 1.
� See details in Appendix A.� Estimated from Catalonia.
ANTONIO HERNANDEZ-MATIAS ET AL.244 Ecological MonographsVol. 83, No. 2

defined territorial propensity as the probability of
recruiting in a population below its carrying capacity.
In our models, propensity to recruit may not correspond
to actual recruitment in populations that have already
reached their carrying capacities (see next section). We
assumed that the observed ai values in France were
suitable for our purposes since recruitment is apparently
not constrained in this population by territorial avail-
ability (i.e., there is relatively high adult mortality and a
high proportion of non-adult territorial birds).
Natal dispersal patterns were analyzed from a sample
of 52 individuals from the French and Catalan
populations. These individuals correspond to all records
of birds equipped with darvic bands when fledglings that
are known to have been recruited into a territory during
the period 1986–2010; thus, for these birds, we knew the
distance between their natal and their recruitment
territories. Using maximum likelihood procedures we
estimated the dispersal kernel by fitting three different
distributions: negative exponential, gamma, and trun-
cated power law (see Appendix B).
Correlations among and between different vital rates
can have a substantial effect on predicted population
viability (Morris and Doak 2002). To analyze this
possibility, we used Pearson’s correlations at three
levels: spatial and temporal autocorrelation, and tem-
poral correlations between vital rates. Correlations were
only computed using vital-rate estimates that had been
independently estimated. These correlations were always
low (see Appendix C) and so we did not account for any
of these correlations in our models.
Definition of the model structure
The formulation of all our models followed the life
cycle described in Fig. 2: after each breeding cycle,
surviving females pass onto the next age class. Accord-
ing to recruitment rates, a fraction of the individuals in
age classes 2, 3, and �4 attempt to recruit as territorial
birds (i.e., they actually recruit if there are vacant
territories available). Density dependence was incorpo-
rated into the model by setting an absolute maximum
for the number of breeding pairs that each population
can sustain (i.e., the carrying capacity). We decided
against including declines in fertility or survival with
increasing population size, since the highest survival and
productivities were found in populations close to their
carrying capacity (also see Carrete et al. 2006, Martınez
et al. 2008). The carrying capacity for each population
was established as the historical maximum number of
pairs and, in the case of increasing populations, as 10%above the current population size. We chose this
conservative threshold in our viability assessment given
that growing populations act as sources in our system
and available information suggests that these popula-
tions will not be able to grow at high rates in the future
(see Discussion). In density-dependent models and in
populations with fewer vacant territories than eagles
seeking to recruit (based on recruitment rates), older
eagles were dominant over younger ones. This meant
that in our models, when a population reaches its
carrying capacity, the age of territorial recruitment may
be delayed just as has been seen to occur in natural
populations of long-lived territorial birds when the
number of breeding sites is limited. In models consid-
ering that local populations are connected by dispersal,
individuals were allowed to disperse at the time they
attempted to recruit. The probabilities of natal dispersal
between populations were calculated considering the
location and numbers of territories in each local
population, as well as the natal dispersal kernels we
estimated from observed dispersal events (see Appendix
B). In the models we used these probabilities to
randomly assign a dispersing individual from any given
population of origin to a given population of destina-
tion. Individuals that had dispersed from one popula-
tion to another (either birds attempting to recruit or
already-recruited birds) were subject to the vital rates of
the destination population. Once a bird becomes
territorial, no further dispersal was allowed for since
empirical data suggest that such behavior is extremely
rare in Bonelli’s Eagle (Hernandez-Matıas et al. 2011a).
All models accounted for demographic stochasticity in
all vital rates and environmental stochasticity in adult
survival and fertility, which was estimated from their
observed temporal variance. Model scripts were devel-
oped in MATLAB code (see Supplement), while scripts
provided by Morris and Doak (2002) were used to
simulate survivals (beta distribution) and productivities
(stretched beta distribution).
Evaluating uncertainty in the model structure
and the natal dispersal kernel
We compared the population trends observed in the
studied populations over the period 1990–2005 with
those predicted by six different models (Table 3, Fig. 3)
accounting for several sources of uncertainty: (1)
whether local populations were closed or connected by
dispersal (i.e., open); (2) if closed, whether or not local
populations were regulated by density dependence and,
if open, (3) the shape of the natal dispersal kernel in
multisite models (i.e., the exponential or power law);
and (4) the behavioral ‘‘rules’’ of dispersing birds in
multi-site models. The latter possibility was considered
because we still lack knowledge regarding how Bonelli’s
Eagles decide where to recruit, and so we explicitly
modeled two possible scenarios that we will refer to
hereafter as the ‘‘constrained’’ and ‘‘unconstrained’’
dispersal scenarios. Under constrained dispersal, once
an individual ‘‘decides’’ to settle in a given local
population (on the basis of recruitment rates and
dispersal kernels), it remains there, independently of
whether or not a site is available. Under unconstrained
dispersal, eligible breeders that cannot settle because
there is no site available remain in that population for
one year and if they survive, they then have priority over
eagles of the same age attempting to breed for the first
May 2013 245BROAD-SCALE PVA FOR BONELLI’S EAGLE

time when a territory becomes vacant; however, if there
are still no sites, they are allowed to disperse (based
again on the dispersal kernel). This unconstrained
dispersal scenario implicitly assumes density-dependent
dispersal as it allows individuals that do not find a
territory to settle in nearby areas in which territories are
available.
Observed population growth rates were estimated
from census data from the studied populations at the
beginning and the end of the study period. These
TABLE 3. Evaluation of model structure plausibility in terms of spatial structure of the populationand uncertainty in natal dispersal behavior of Bonelli’s Eagles.
Assumptions
Negativelog likelihoodSpatial structure
Dispersalkernel
Dispersalbehavior
Single spatially structured population power constrained 21.73unconstrained 22.73
exponential constrained 23.66unconstrained 28.28
Closed local populations no dispersal no dispersal 27.90Closed local populations no density dependence no dispersal no dispersal 50.17
Notes: Under constrained dispersal, once an individual ‘‘decides’’ to settle in a given localpopulation (on the basis of recruitment rates and dispersal kernels), it is deemed to remain there,independently of whether a site is available or not. Under unconstrained dispersal, individualsattempting to breed that cannot settle because there is no site available are allowed to disperseagain (see Methods: Evaluating uncertainty in the model structure and the natal dispersal kernel fordetails). We also used models assuming natal dispersal kernels with either exponential or power lawdistributions.
FIG. 3. Observed (dashed gray line) vs. predicted (solid circles) Bonelli’s Eagle population growth rates (lambda) underdifferent model assumptions for the local populations during the period 1990–2005. Abbreviations on the x-axes are as follows:CLO ND, closed local populations and no density dependence; CLO D, closed local population and density dependence; EXP C,exponential dispersal kernel and constrained dispersal; EXP U, exponential dispersal kernel and unconstrained dispersal; POW C,power-law dispersal kernel and constrained dispersal; and POW U, power-law dispersal kernel and unconstrained dispersal. Thepredicted values are means; the error bars are percentile 95% confidence intervals.
ANTONIO HERNANDEZ-MATIAS ET AL.246 Ecological MonographsVol. 83, No. 2

censuses consisted of counts of territorial pairs using the
methods described in Real and Manosa (1997) and in del
Moral (2006), and were independent of vital-rate
estimations. We estimated model growth rates from
10 000 replicates. We calculated the expected number of
breeding pairs as the mean and the corresponding 95%
interpercentile range between 2.5 and 97.5 percentiles
(hereafter referred to as the percentile 95% confidence
interval, 95% CI) of all the replicates at the end of the
period (McGowan et al. 2011). The population growth
rate, or lambda, was estimated as the geometric mean of
the population growth rates each year for each replicate.
Our approach to model choice relies on how likely the
observed lambdas are given each model’s set of
predictions. For each model and for each population
with an observed lambda, we binned the simulated
lambda values for that population using fairly fine bins
(0.01 bins). Then, we obtained the probability of the
simulated lambdas being within each bin as a means of
estimating the probability of seeing the observed lambda
for that population, P(ki ). Finally, we obtained the log-
likelihood of the observed lambdas for each model as
the sum of ln (P(ki )). Models were chosen by comparing
the negative log likelihoods for each considered model
(Hilborn and Mangel 1997; D. Doak, personal commu-
nication).
At this point in our analyses, we split the whole
population into 18 local populations (see Definition of
local populations) to be able to compare the observed
trends with the trends predicted by the models in the
monitored populations. For those populations lacking
monitoring data, we initially assumed that survival
(either pre-adult or adult) was the same as in nearby
monitored populations with similar environmental
characteristics (Table 1). Given the low temporal
variance observed in the studied populations, produc-
tivities could be based on those provided by del Moral
(2006) for 2005.
Evaluation of the assumptions regarding vital rates
with little available information
Based on the results from the previous section, we
used the most parsimonious model in Table 3 to test
whether or not our initial assumptions regarding vital
rates for which little information is available were
plausible. We thus considered models that assumed four
additional scenarios: (1) pre-adult survival in the
southern populations (CAD, GRA, SWP) is the same
as that in the remaining populations, (2) adult survival
in non-monitored populations is the same as the average
survival in monitored populations, (3) the carrying
capacity of all populations is the same as the 2005
census, and (4) a combination of scenarios (2) and (3).
Again, models were run 10 000 times and their predicted
lambda values were compared to those observed in the
local populations based on the negative log likelihoods
for each model.
Assessing population viability and the effect
of the sources of uncertainty
We assessed the viability of both the whole western
European population and the studied local populations.To do so, we ran models predicting the expected number
of breeding pairs over the next 50 years (10 000 runs foreach model) and estimated the predicted lambdas (and
their corresponding percentile 95% confidence intervals),as well as the probability of population decline to
thresholds of 75%, 50%, and 20% of the currentpopulation sizes. Based on our results, we only
accounted for model uncertainty for natal dispersalbehavior (constrained or unconstrained) when making
predictions regarding the fate of these populations.We also evaluated the effect of parameter uncertainty
on model predictions. On the basis of the samplevariance and the corresponding 95% confidence intervals
of the vital rates (see Appendix B), we generated a set of100 values using the beta and the stretched beta
distributions (see Morris and Doak 2002) for survivaland fertility, respectively. Next, we performed simula-
tions in which each trajectory (over a period of 50 years)took into account randomly chosen values of the 100values previously generated for each vital rate (McGo-
wan et al. 2011). Random values of adult survival andfertility were different for each local population.
Nevertheless, as in our previous models, pre-adultsurvival values were established as being the same for
two groups of local populations, AND and SPT, on theone hand, and the remaining populations, on the other.
The effects of environmental stochasticity were kept atthe best estimated values (Table 4).
Identifying conservation targets
We used four simulation-based methods to identifythe vital rates that had the strongest effects on
population dynamics. First, we simulated for each vitalrate 1000 replicates in which the values of the rates in
every local population were increased by 5%, and thencompared to either the absolute (sensitivity) or therelative (elasticity) increment in lambda in relation to the
increment in the vital rate (Morris and Doak 2002).Second, we generated a set of simulations to evaluate the
effect of the relative change in the vital rates on theabsolute change in the growth rate (see also Soutullo et
al. 2008). This is a measure that combines theadvantages of using the same units to compare the vital
rates of different magnitudes (like elasticity) with theability to visualize the absolute effects on the growth
rate of these changes. The increments in the values of thevital rates considered were�15,�10,�5,�4,�3,�2,�1,1, 2, 3, 4, 5, 10, and 15%. Third, we performed a set ofsimulations to investigate the sensitivity values across
the entire range of values that each vital rate may take(values ranging from 0.05 to 0.95 at 0.05 intervals). Wedid this separately for S1, S23, SA, and FA. In the case
of FA, the number of fledged females was considered inthe Results (FA 3 0.5). In this analysis, the vital rate
May 2013 247BROAD-SCALE PVA FOR BONELLI’S EAGLE

under investigation was established as the same for all
populations. Although this may seem at first unrealistic,
we believe that it is a useful way of identifying critical
values operating at the whole population scale that may
be a threat throughout the whole population of this
eagle. Finally, we carried out a simulation similar to the
previous one, but with the values reached by the vital
rate under analysis bounded to their actual observed
range. In this case, we compared the values of lambda
across the entire observed range of the vital rates
represented as a percentage, where 0% corresponded to
the lower limit and 100% to the upper limit of the
estimated vital rates. Here, our aim was to explicitly
address how the observed range of each vital rate might
affect the population trend.
RESULTS
Vital-rate estimations
Table 2 provides a summary of the main vital rates
estimated for 12 local populations. Annual adult
survival ranged from 0.868 to 0.940 (mean ¼ 0.904, SE
¼ 0.006, n ¼ 12 populations from 5851 bird-years of
observations), with temporal variance ranging from 4.43
3 10�4 to 3.18 3 10�3 (mean¼ 1.67 3 10�3, SE¼ 0.28 3
10�3, n ¼ 12 populations from 181 population-years).
Based on previously published information, pre-adult
survival was estimated at 0.480 (SE ¼ 0.064) for
fledglings (to one-year old), 0.574 (SE ¼ 0.055) for
one- and two-year olds, and 0.821 (SE ¼ 0.105) for
three-year olds in the French population (S1, S23, and
S4, respectively; Hernandez-Matıas et al. 2011b), and
0.69 (SE¼0.114) for fledglings and 0.72 (SE¼0.137) for
one- and two-year olds in Andalusia (S1, and S23,
respectively; based on Balbontın et al. [2003] and
Balbontın [2004]).
Adult productivity ranged from 0.60 to 1.42 (mean ¼0.984, SE ¼ 0.075, n ¼ 12 populations from 3840
territory-years), with temporal variance ranging from
1.61 3 10�2 to 10.97 3 10�2 (mean ¼ 5.51 3 10�2, SE ¼0.85 3 10�2, n ¼ 12 populations from 210 population-
years).
Recruitment rates (ai ) were estimated at 0.161 for
two-year olds, 0.680 for three-year olds, 0.934 for four-
year olds, and 1 for five-year olds and older.
In general, we found no correlation between adult
survival and productivity, no temporal autocorrelation
in these vital rates, and no geographical correlation of
the vital rates between local populations. In the few
cases in which we did detect significant correlations,
significance was lost after applying Bonferroni’s correc-
tion (see Appendix C).
In terms of the natal dispersal kernel, the negative
exponential model fits our data better (AICc weight ¼0.73, lambda¼9.75310�3, 95% CI¼6.823 10�3–1.303
10�2) than the gamma model (AICc weight¼ 0.26, shape
¼ 1.13, 95% CI ¼ 0.57–1.85; scale ¼ 89.76, 95% CI ¼51.89–224.57) or the truncated power law model (AICc
weight¼ 0.01; beta¼ 7.12 3 10�1, 95% CI¼ 5.24 3 10�1
to 8.88 3 10�1). It is worth noting, though, that the
gamma model is equivalent to an exponential distribu-
tion when the shape parameter equals 1; in our case, the
gamma model fits well because it adopted an exponen-
tial-like distribution. Therefore, we retained only the
exponential and the power law model to simulate
dispersal patterns.
Evaluating uncertainty in the model structure
and the natal dispersal kernel
The predictions of the models considering closed
populations and no density dependence revealed marked
differences between the predicted and the observed
lambdas during the period 1990–2005 (Fig. 3). Popula-
tions located close to the Mediterranean coast (from
France to southeast Spain) declined at a lower rate than
predicted by these models, thereby suggesting that these
populations received significant numbers of individuals
from other populations. The population in northwest
Spain in ARR exhibited a similar pattern. Most interior
populations in central Spain behaved in a broadly
similar fashion to the model predictions. Likewise, the
increasing population in SWP showed size variations
that were similar to the model predictions. Contrast-
TABLE 4. Vital rates considered in models used in the viability assessments.
Population K SA Var(SA) F2 F3 FA Var(FA) kC kU
ANR-BUR 52 0.914 0.0025 0.000 0.000 0.731 0.0547 0.974 (0.928–0.996) 1.001 (0.984–1.014)ARA-ECLM 116 0.908 0.0007 0.286 0.308 0.884 0.0528 0.995 (0.987–1.002) 1.004 (1.002–1.006)ARR-NPT 68 0.883 0.0030 0.000 0.000 0.605 0.0655 0.975 (0.955–0.989) 1.004 (0.994–1.014)AND 365 0.926 0.0006 0.286 0.615 1.231 0.0412 1.000 (1.000–1.000) 1.000 (1.000–1.000)PVAL 103 0.868 0.0032 0.286 0.800 1.046 0.0647 0.986 (0.977–0.994) 1.001 (0.999–1.004)CAT 85 0.889 0.0013 0.286 0.400 1.129 0.0245 0.987 (0.978–0.997) 1.004 (1.001–1.008)FRA 36 0.880 0.0020 0.454 0.454 0.979 0.0454 0.975 (0.953–0.992) 1.001 (0.991–1.007)MUR 42 0.893 0.0016 0.286 0.510 1.201 0.0608 1.000 (0.988–1.010) 1.007 (1.003–1.011)SPT 95 0.937 0.0005 0.286 0.500 0.830 0.0328 1.001 (1.000–1.003) 1.000 (1.000–1.002)EXT-WCLM 140 0.924 0.0006 0.286 0.333 0.936 0.0551 1.000 (1.000–1.001) 1.000 (1.000–1.000)
Notes: The vital rates presented are the assumed carrying capacity (K ), adult survival (SA), second-year (F2), third-year (F3),and adult (FA) fertility. Environmental variances are also shown for SA and FA as Var(SA) and Var(FA), respectively. Pre-adultsurvival rates were S1¼0.687, S2 and S3¼ 0.720 for AND and SPT, and S1¼ 0.480, S2 and S3¼0.574 for the rest. Also shown arethe predicted lambdas for the next 50 years under constrained (kC) and unconstrained (kU) dispersal, with 95% confidenceintervals in parentheses. See Fig. 1 for population codes.
ANTONIO HERNANDEZ-MATIAS ET AL.248 Ecological MonographsVol. 83, No. 2

ingly, the models revealed that the populations in
southern Spain in CAD and GRA increased at a lower
rate than predicted by the models. In these southern
areas, the models assuming negative density dependence
are better fitted to the observed lambdas.
Our results strongly support the idea that the local
populations studied constitute parts of a single spatially
structured population, and shows source–sink dynamics
(Table 3). Models assuming unconstrained dispersal
were less well supported than those assuming con-
strained dispersal. The results also provided better
support for power-law than for negative exponential
dispersal kernels. The mean lambdas predicted by the
best supported model in Table 3 explained 79% of the
observed variance, supporting the idea that our multi-
site model is sufficiently realistic to be able to make
reliable predictions regarding the fate of the study
populations.
Evaluation of the assumptions regarding vital rates
with little available information
The model assuming that adult survival in non-
monitored populations is the same as the average
survival in monitored populations (scenario 2) per-
formed slightly better than the model assuming that
adult survival in non-monitored populations is the same
as in similar nearby populations (scenario 0; Table 5).
By contrast, the models considering that the carrying
capacity of all local populations is the same as the 2005
census (scenarios 3 and 4), and the models assuming that
pre-adult survival in the southern populations is equal to
that of the rest of local populations (scenario 1)
performed less well.
Assessing population viability and the effect
of the sources of uncertainty
Predictions regarding future population dynamics
varied considerably in terms of the assumptions
regarding natal dispersal behavior in the eagles. Models
assuming constrained dispersal gave more pessimistic
population trends than models assuming unconstrained
dispersal, both at whole population (lambda of 0.997
[95% CI ¼ 0.996–0.998] vs. 1.001 [95% CI ¼ 1.000–
1.002]) and at local population levels (Table 4, Figs. 4
and 5). Models with constrained dispersal predicted an
mean reduction of 14.1% in the number of territorial
pairs for the whole population, while models with
unconstrained dispersal predicted an mean increase of
6.8% over the next 50 years. The main differences
between these two models appear in local populations
with population growth rates below 1 if they were
closed, which act as sink populations since their viability
depends on the number of immigrants arriving from the
southern local populations. The most isolated popula-
tions in France (FRA) and north and northwest Iberia
(ANR-BUR and ARR-NPT, respectively) are predicted
to decrease markedly under the scenario of constrained
dispersal, but remain stable or even increase under an
assumption of unconstrained dispersal. ‘‘Sink’’ popula-
tions located closer to ‘‘source’’ populations (e.g., ARA-
ECLM or MUR) remain almost stable under the
constrained dispersal scenario, but are expected to
increase rapidly to their carrying capacity under
unconstrained dispersal. Eastern populations (PVAL
and CAT) are intermediate in pattern, decreasing under
constrained dispersal, but increasing to near carrying
capacity under unconstrained dispersal. By contrast, the
populations in the south and southwest Iberian Penin-
sula have a positive demographic balance and behave as
source populations, and the numbers of territorial pairs
in these areas remain almost constant since they are
close to or have already reached their carrying capacity
(Table 4).
The cumulative probability of population reductionwas
highly dependent on both the local demographic balance
between births and deaths and the distance from source
populations (Fig. 6). The populations at greatest risk are
ARR-NPT, FRA, and ANR-BUR, all of which under
constrained dispersal have high probabilities of reduction
to 75% (0.99, 0.93, and 0.73, respectively), 50% (0.77, 0.60,
and 0.40), and 20% (0.07, 0.03, and 0.05), respectively, of
their current size over the next 25 years. InPVALandCAT
there is also a high probability of a reduction of 25% (0.89
and 0.63, respectively) or, to a lesser extent, of 50% (0.22
and 0.07, respectively) in the next 25 years. On the other
hand, in the other local populations there is a very low risk
of population reduction, either as a result of a positive
demographic balance (AND and SPT) or due to their
proximity to source populations (EXT-WCLM, MUR,
and ARA-ECLM).
TABLE 5. Evaluation of the plausibility of our initial assumptions regarding vital rates for populations for which we had littleinformation; we assumed power-law dispersal kernels and constrained dispersal in all models.
ScenarioAdult survival,non-monitored
Pre-adult survival ofsouthern populations� Carrying capacity
Negativelog-likelihood
2 equal to mean higher than in other populations historical maximum 20.950� equal to similar populations higher than in other populations historical maximum 21.733 equal to similar populations higher than in other populations equal to 2005 census 24.944 equal to mean higher than in other populations equal to 2005 census 23.931 equal to similar populations equal to other populations historical maximum 27.46
� Southern populations are CAD, GRA, Rest of AND, SWP, and Rest of SPT.� The most plausible model in Table 3.
May 2013 249BROAD-SCALE PVA FOR BONELLI’S EAGLE

As expected, parameter uncertainty provided predic-
tions that were slightly more pessimistic and revealed a
marked increase in the risk of overall population decline
given the wide percentile 95% confidence intervals of the
estimated growth rates (model assuming constrained
dispersal: 0.995 [95% CI¼ 0.958–1.003]; Fig. 7). Indeed,
the probability of overall population decline to 75%,
50%, and 20% of its current size was estimated at 0.20,
0.09, and 0.04, respectively. Similarly, the wide ampli-
tude of the predicted trajectories increased the predicted
risk of population decline in all local populations, except
in ANR-BUR, ARR-NPT, PVAL, and FRA (Fig. 6).
Identifying conservation targets
Sensitivity analyses show that adult survival had the
strongest effect on the overall population growth rate
(0.085), followed by pre-adult survival (0.055), adult
fertility (0.010), and carrying capacity (,0.001). Elas-
FIG. 4. Predicted Bonelli’s Eagle population trends for local populations (codes) over the next 50 years. Plots show the mean(solid line) and percentile 95% confidence intervals (dashed lines) of 10 000 population trajectories. We assumed in the models twotypes of possible natal dispersal behavior: constrained or unconstrained (see Methods: Evaluating uncertainty in the model structureand the natal dispersal kernel for details). See Fig. 1 for population code locations.
ANTONIO HERNANDEZ-MATIAS ET AL.250 Ecological MonographsVol. 83, No. 2

ticity analyses showed a similar pattern in the case of
adult (0.078) and pre-adult survival (0.034), although
contrastingly gave higher values for carrying capacity
(0.020) than for adult fertility (0.011; Fig. 8A).
Analyses of the relationships between the relative
change in vital rates (from �15% to 15%) and the
absolute change in the whole population lambda reveal
that these populations would crash if there was a
reduction in adult survival of 5% (Fig. 8B). Addition-
ally, the curve representing the variation in lambda with
adult survival flattens out noticeably for survival
increments .5%. This can be explained by the fact that,
on the one hand, we constrained the values of adult
survival up to a maximum of 0.98 and that, on the other,
the value to which we fixed the carrying capacity of the
system does not allow the population to grow any
further. By contrast, pre-adult survival and adult
fertility showed a fairly constant elasticity (i.e., slope
in Fig. 8B) over the range of relative changes in the vital
rates studied. While the slopes of the carrying capacity
were similar to adult fertility for relative decreases in its
values, for increases in its values it had steeper slopes.
Our third analyses, in which we studied the sensitiv-
ities of each vital rate that was set as constant for all the
local populations, showed marked declines in growth
rate for values in adult survival under 0.95 and for
second- and third-year survival under 0.65 (Fig. 8C).
Additionally, the whole population crashed for adult
survival under 0.90, for second- and third-year survival
under 0.50, for first-year survival under 0.35, and for
adult fertility under 0.60 fledglings per year (i.e., 0.3
females per year). On the other hand, the absolute
change in lambda across the entire observed range of the
vital rates illustrates much more subtle differences
between vital rates (Fig. 8D). By increasing vital rates
to their maximum observed value, the overall popula-
tion growth rate reached values of 1.0008, 1.0004,
1.0001, and 0.9994 for adult survival, second- and third
year survival, adult fertility, and first-year survival,
respectively. On the other hand, by decreasing vital rates
to their minimum observed value the growth rate
reached values of 0.9927, 0.9952, 0.9918, and 0.9954
for the same vital rates, respectively.
DISCUSSION
Our study focusing on the western European popu-
lation of Bonelli’s Eagle illustrates the presence of a
large-scale spatially structured population with source–
sink dynamics, in which the fate of local populations
located hundreds of kilometers apart are linked through
natal dispersal, and in which the survival of adults and
pre-adults are the most important vital rates governing
the viability of both the overall and local populations.
Achieving these results was possible thanks to the
implementation of a complex model, which required
large amounts of demographic data collected across a
large geographical area over nearly two decades; this
fact highlights the importance of large-scale and long-
term monitoring when attempting to assess the viability
of populations of long-lived species with complex spatial
structures.
Despite the extensive fieldwork carried out in this
study, uncertainty regarding model structure and vital
rates still exists, mainly in relation to aspects such as
dispersal behavior, migration rates, and pre-adult
survival that are all difficult to estimate. As in other
PVAs, we thus had to make a number of assumptions,
which could seriously affect model predictions (Burg-
man et al. 2005). We tested thoroughly the validity of
our assumptions using a novel approach (but see also
Brook et al. 2000, Lindenmayer et al. 2001, Schtickzelle
and Baguette 2004), which consisted of (1) predefining a
set of candidate models with different realistic assump-
tions, (2) evaluating the likelihood of observed popula-
tion growth rates given model predictions, and (3)
selecting the most plausible models for the PVA.
Furthermore, we evaluated the effects of uncertainty in
model structure and vital rates on population viability,
which revealed both the importance of detailed infor-
mation on dispersal processes as a means of providing
more reliable estimates of the viability of spatially
structured populations and the fact that accounting for
parameter uncertainty markedly increases the risk of
population declines predicted by the models. Our study
thus highlighted the importance of thoroughly testing
model assumptions and evaluating the effect of uncer-
tainties on model predictions, thereby providing an
analytic framework that can be widely used for
generating reliable conservation prescriptions for a
range of species and ecological contexts.
Population dynamics of Bonelli’s Eagle in western Europe
Our results strongly support the idea that local
Bonelli’s Eagle populations in western Europe belong
to a single, spatially structured population that exhibits
source–sink dynamics (Pulliam 1988). Although the
local populations we studied were not totally isolated
patches (in the typical metapopulation sense), they did
allow for spatial structure based on demographically
relevant units, which we defined on the basis of their
geographical proximity and environmental characteris-
tics (see Table 1). Essentially, the populations from
southern Iberia act as sources (births outnumber deaths)
and, thanks to dispersal, sustain all other local
populations that would otherwise decline. This mecha-
nism occurred in all our multisite models, including the
model assuming a common pre-adult survival rate for all
populations (scenario 1 in Table 5), and was mainly
explained by differences in adult survival between
populations. The dependence on immigrating eagles
appears particularly strong in the most isolated popu-
lations in north, northwest, and eastern Spain, and in
France. Nevertheless, the conservation problems in
these populations vary from one region to another.
Over the last three decades, the northern population
in BUR has suffered the most severe decline reported for
May 2013 251BROAD-SCALE PVA FOR BONELLI’S EAGLE
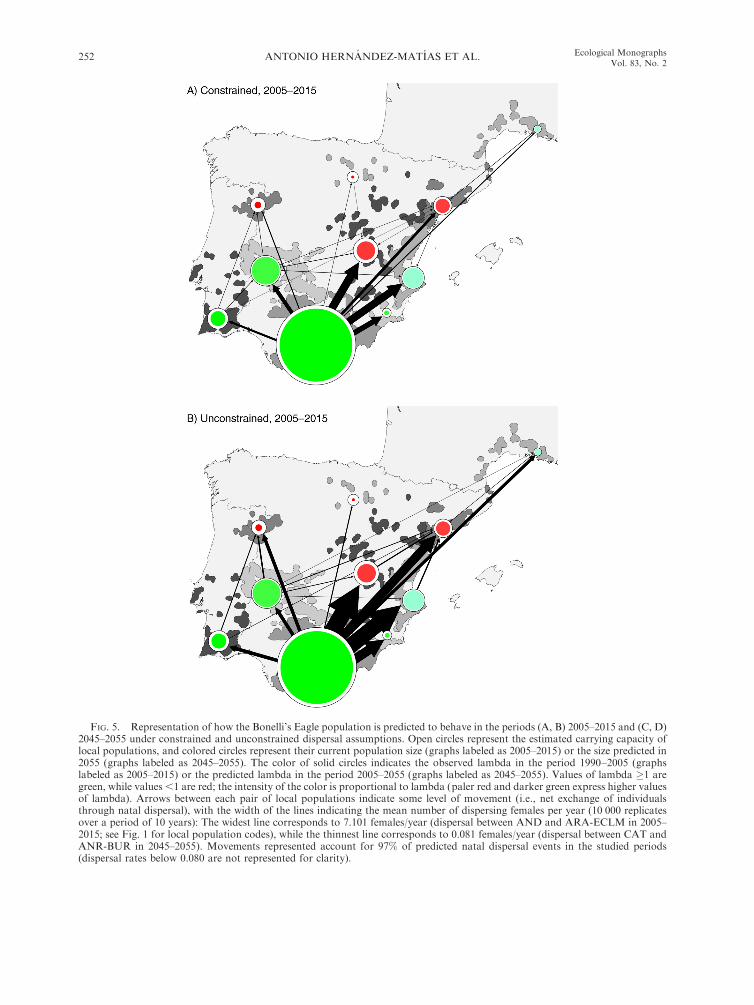
FIG. 5. Representation of how the Bonelli’s Eagle population is predicted to behave in the periods (A, B) 2005–2015 and (C, D)2045–2055 under constrained and unconstrained dispersal assumptions. Open circles represent the estimated carrying capacity oflocal populations, and colored circles represent their current population size (graphs labeled as 2005–2015) or the size predicted in2055 (graphs labeled as 2045–2055). The color of solid circles indicates the observed lambda in the period 1990–2005 (graphslabeled as 2005–2015) or the predicted lambda in the period 2005–2055 (graphs labeled as 2045–2055). Values of lambda �1 aregreen, while values ,1 are red; the intensity of the color is proportional to lambda (paler red and darker green express higher valuesof lambda). Arrows between each pair of local populations indicate some level of movement (i.e., net exchange of individualsthrough natal dispersal), with the width of the lines indicating the mean number of dispersing females per year (10 000 replicatesover a period of 10 years): The widest line corresponds to 7.101 females/year (dispersal between AND and ARA-ECLM in 2005–2015; see Fig. 1 for local population codes), while the thinnest line corresponds to 0.081 females/year (dispersal between CAT andANR-BUR in 2045–2055). Movements represented account for 97% of predicted natal dispersal events in the studied periods(dispersal rates below 0.080 are not represented for clarity).
ANTONIO HERNANDEZ-MATIAS ET AL.252 Ecological MonographsVol. 83, No. 2

any raptor in Europe (.90% from the 1970s to the
present day) and stands today on the brink of extinction
(Real and Manosa 1997). However, survival is relatively
high in this population and its problems can be traced
back to habitat loss due to an abandonment of
traditional land practices and a crash in the numbers
of its main prey species, which have led to very low
productivity and high rates of territorial abandonment
(Fernandez et al. 1998). To a lesser extent, the
population from ARR has also undergone a severe
decline, likewise related to low productivity; neverthe-
less, in this latter case, the fall in numbers can also be
attributed to low adult survival.
By contrast, the French and eastern Iberian popula-
tions (FRA, CAT, PVAL, and MUR) have fairly good
levels of productivity, but with the lowest survival rates
(Carrete et al. 2005, del Moral 2006, Hernandez-Matıas
et al. 2011a, b), which agrees with the view that, due to
both electrocution and direct persecution (the chief
causes of mortality in this species), the highest mortality
risk is to be found in highly humanized areas (Real et al.
2001). The populations from central Iberia (ARA and
FIG. 5. Continued.
May 2013 253BROAD-SCALE PVA FOR BONELLI’S EAGLE

GUA) are more self-sustainable because they have better
survival values than eastern populations, although
productivity is slightly lower given the poorer local
environmental conditions (Real 2004, Carrascal and
Seoane 2009).
In contrast to all the others, the three southern
populations (CAD, GRA, and SWP) have a notable
positive balance between births and deaths, mainly
because they exhibit the highest adult and pre-adult
survival values. The local population in CAD has
remained almost constant over the last two decades,
suggesting that this population has reached its carrying
capacity. GRA has increased its size, but at a much
lower rate than predicted by the model that does not
account for density dependence; additionally, in this
latter population, most recently occupied territories are
found in suboptimal areas for the species (i.e., in areas
that are highly humanized, have a low availability of
cliffs and are relatively cool), which suggests that the
population is approaching its carrying capacity (Moleon
and Gil-Sanchez 2006). Finally, SWP behaves rather
differently since eagle numbers have increased steadily
over the past two decades. This is the only population
throughout the species’ range in Europe to exhibit such
a positive trend, which has occurred at the same time as
an increase in its breeding range. Interestingly, this trend
can be attributed both to high survival values and to the
tendency of eagles from this population to nest in trees,
which allows them to occupy new territories even in
areas without cliffs (Palma et al. 2006, Beja and Palma
2008).
Effect of uncertainty on Bonelli’s Eagle
viability assessment
There was a marked degree of variation in viability
assessments associated with uncertainty in dispersal
behavior (i.e., constrained vs. unconstrained dispersal).
In general, our predictions were optimistic for most
populations from central and southern Iberia, which fits
fairly well with the observed stable–positive trend in
these populations in recent years (del Moral 2006,
Moleon and Gil-Sanchez 2006). By contrast, popula-
tions from France and eastern and northwestern Iberia
are predicted to decline under the constrained dispersal
scenario, but to remain stable or even increase under
unconstrained dispersal, which highlights the strong
dependence of these populations on immigration and
their ‘‘true’’ poor conservation status, mostly associated
with high levels of human-induced mortality in territo-
rial eagles (Real et al. 2001). Indeed, recent censuses
suggest that these populations have remained stable
despite the fact that, in some, the main vital rates such as
productivity and, especially, adult survival have pro-
gressively worsened. The most likely explanation for this
previous decline in these populations is that, in the past,
the number of immigrants was not sufficient to support
the size of the population, as our models suggest.
Additionally, it is also possible that environmental
conditions in the dispersal areas (where non-territorial
eagles are found) have improved in recent years as a
result of the concerted efforts to correct dangerous
power lines in the main dispersal areas in central (Guil et
al. 2011) and southern Spain (Gil-Sanchez et al. 2005,
Moleon et al. 2007) and the recent increase in rabbit
numbers (the preferred prey species of this eagle) after
their dramatic decline in the 1990s (Delibes-Mateos et
al. 2007, Moleon et al. 2009, Resano et al. 2011).
FIG. 6. Cumulative probabilities of Bonelli’s Eagle popula-tion decline to 75%, 50%, and 20% (black solid, black dashed,and gray solid lines, respectively) of current population sizesover the next 50 years under the scenario of constraineddispersal (black lines). The cumulative probability of 50%decline under parameter uncertainty in the constrained scenariois shown by gray dashed lines. See Fig. 1 for local populationcodes.
ANTONIO HERNANDEZ-MATIAS ET AL.254 Ecological MonographsVol. 83, No. 2

Despite these optimistic signs, when taking into
account uncertainty in parameter estimates, our models
predict a relatively high probability of population
decline. Interestingly, although the overall population
viability decreased markedly, this effect was more
complex at the level of each local population. In both
source populations and in sink populations located close
to source populations, the risk of population decline was
always greater under the uncertainty scenario. By
contrast, more isolated sink populations showed a
steeper increase in the short-term cumulative probability
of population decline, but an earlier flattening out of the
curve describing this probability. This means that in
some cases the probability of decline on a 50-year
horizon in models taking into account parameter
uncertainty was similar (PVAL) or lower than (ANR-
BUR, ARR-NPT, and FRA) in models that did not take
it into account. This pattern is due to the fact that the
confidence intervals of adult and, especially, pre-adult
survival were broad, thereby generating more optimistic
futures for a greater proportion of the simulated
trajectories. Indeed, for this eagle, we still lack robust
pre-adult survival estimations for most populations and
have little information on the yearly variation or the
spatial correlation of this important vital rate. Thus, it is
worth highlighting the need to maintain current
monitoring schemes, to extend them to include unmon-
itored populations, and to implement large-scale ringing
schemes (similar to that used in France).
Besides the sources of uncertainty considered in our
models, a number of other factors may also potentially
affect our model predictions. We assumed that popula-
tions were structured in age classes rather than
according to any other individual characteristics. Age
appears to be strongly correlated with the main vital
rates in Bonelli’s Eagle (Hernandez-Matıas et al. 2010,
2011b) and thus makes possible the modeling of the
different contributions of individuals in different classes
to population growth. In our models, the territorial
stage determined both the dispersal probabilities of
individuals and their fertility rates given that only
territorial eagles can breed. The territorial stage may
also have an effect on the survival probability, although
available data suggest that age is a better determinant of
survival than the territorial stage in Bonelli’s Eagle
(Hernandez-Matıas et al. 2011b). We also assumed that
the carrying capacity of the populations was the same as
the historical maximum number of pairs. Nevertheless,
it is possible that environmental conditions have
changed due to, for example, a decrease in prey
abundance or habitat loss as a result of land abandon-
ment or the construction of infrastructures, thereby
reducing the amount of habitat available (Carrete et al.
2005). In this sense, the results suggest that our
assumptions regarding the carrying capacity for the
period 1990–2005 were correct. Our models did not take
into account the presence of competitor species such as
the Golden Eagle. Although demographic analyses
suggest that competition with this larger eagle does not
threaten all Bonelli’s Eagle populations (Carrete et al.
2005), this output varies depending on the habitat
availability for each species (Carrete et al. 2005) and on
the size of the Golden Eagle population, which has been
shown to decrease productivity in Bonelli’s Eagle (Gil-
Sanchez et al. 2004, Carrete et al. 2006). In fact, our
elasticity analyses showed that the carrying capacity
FIG. 7. Predicted population trends for the western European Bonelli’s Eagle population over the next 50 years under thescenario of constrained dispersal. The mean (solid lines) and percentile 95% confidence intervals (dashed lines) of 10 000 populationtrajectories under parameter uncertainty (black lines) and no parameter uncertainty (gray lines) are represented.
May 2013 255BROAD-SCALE PVA FOR BONELLI’S EAGLE

(above all, in the case of source populations) is an
important demographic parameter in determining the
fate of the whole population; thus, uncertainty regarding
this parameter may increase considerably the uncertain-
ty of the model predictions.
Target vital rates in Bonelli’s Eagle conservation
Adult survival had the highest values in sensitivity and
elasticity (to be expected given the life strategy of this
species), which thus suggests that conservation efforts
should concentrate on improving this vital rate (Real
and Manosa 1997, Carrete et al. 2005). Bonelli’s Eagle
territories show notable environmental heterogeneity
both within and between populations, which can lead to
high variability in the causes and levels of mortality
between territories (e.g., Real et al. 2001). Additionally,
the territories with the greatest risks in the most used
areas of home ranges have the highest mortality rates
(Rollan et al. 2010). Thus, in terms of conservation, the
best strategy would be to identify territories with the
highest mortality rates, analyze the causes, and then
implement measures aimed at mitigating this mortality
(e.g., Tinto et al. 2010).
Our analyses disagree with a previous study by
Soutullo et al. (2008), who suggested that non-adult
survival was the chief vital rate regulating this eagle’s
populations. This discrepancy is probably due to the fact
that these authors used high natal dispersal levels within
local populations based on a small sample size of
dispersing birds, which does not agree with the dispersal
kernels used in our study. Additionally, Soutullo et al.
(2008) did not consider the role of all local populations
FIG. 8. Sensitivity and elasticity analyses. (A) Sensitivity and elasticity of adult (SA) and pre-adult (S123) survival, adultfertility (FA), and carrying capacity (K ). (B) Absolute change in population growth rates (lambda) in relation to relative changes invital rates. Lines were constructed by combining the values estimated as relative changes of minus and plus 1, 2, 3, 4, 5, 10, and15%: SA, solid line; S123, dash-dotted line; K, dashed line; and FA, dotted line. Survival rates were not allowed to reach values.0.98. (C) Sensitivity analysis assuming that the overall metapopulation reaches the same value for the perturbed vital rate, whileother vital rates vary according to their local populations. Lines show: SA, solid; S23, dashed; S1, dash-dot; and FA3 0.5, dotted.(D) Absolute change in lambda in relation to relative changes in vital rates. Each vital-rate range is represented in a 0–100% scale(with 0% being the minimum limit of estimated values for each vital rate, and 100% being the maximum limit of estimated values);as in panel (C), we assumed that the overall metapopulation reaches the same value for the perturbed vital rate. Lines show: SA,solid (range¼0.868–0.940); S23, dashed (range¼0.574–0.720); S1, dash-dot (range¼0.480–0.663); and FA, dotted (range¼0.591–1.422).
ANTONIO HERNANDEZ-MATIAS ET AL.256 Ecological MonographsVol. 83, No. 2

in western Europe, which probably also accentuated the
importance of survival during the dispersal period in
determining the overall fate of the population. Never-
theless, in agreement with these authors, we have shown
that the ratio of adult survival to non-adult survival
sensitivities is considerably lower than estimated in
previous studies in which no spatial structure was
considered, i.e., in which local populations were
assumed to be isolated (see Real and Manosa 1997),
and therefore, our results reveal that an increase in
juvenile and immature survival will also have a very
positive effect on the dynamics of Bonelli’s Eagle
populations. In this sense, we estimated under the
constrained dispersal scenario that the whole population
would remain stable under the scenario of a 3% increase
in adult survival or a 10% increase in pre-adult survival.
Our results also emphasize the fact that natal dispersal
plays a key role in guaranteeing the persistence of sink
populations. Given that all individuals pass through a
nomadic phase (i.e., a dispersal period) in which they use
specific dispersal areas intensively (e.g., Real and
Manosa 2001, Cadahıa et al. 2010, Moleon et al.
2011), the implementing of suitable conservation mea-
sures in these areas aimed at mitigating mortality (above
all, avoiding electrocution by power lines and illegal
persecution) would appear to be a key issue in securing
suitable survival rates amongst dispersers and in
guaranteeing the long-term persistence of these popula-
tions. Ideally, conservation measures should be able to
cope with the fact that the location of these dispersal
areas may change over time.
Our final analysis revealed that differences between
vital rates in their impact on the overall fate of the
population are smaller when the elasticity analyses are
restricted to their observed range of variation (also see
Wisdom et al. 2000). Again, increasing adult survival to
the maximum observed values had the greatest impact
on the overall growth rate of the population; neverthe-
less, in contrast to conventional sensitivity and elasticity
analyses, decreasing productivity to the lowest observed
values had the most negative impact on the population.
Therefore, it appears necessary for Bonelli’s Eagle
conservation strategies to work towards mitigating low
productivity levels, which in our populations are mainly
caused by habitat loss, decreases of main prey species,
and disturbances in the breeding areas caused by either
human outdoor activities or the construction of new
infrastructures.
Finally, and given that the carrying capacity may play
an important role in the fate of a population, it would be
desirable to implement conservation measures aimed at
preserving or restoring the suitability of territories as a
PLATE 1. Female Bonelli’s Eagle ringed as a chick in Catalonia (CAT) in spring 2008 and recruited as territorial in 2011 insouthern France (FRA), where this photo was taken. This bird and its mate disappeared from the territory in spring 2012 and havenot been observed since. The fact that five territorial eagles have been replaced in the past three years at this territory suggests thathuman-induced mortality, possibly persecution, lies behind the (likely) death of this eagle. Photo credit: Alain Marmasse.
May 2013 257BROAD-SCALE PVA FOR BONELLI’S EAGLE

means of maintaining or even improving the carrying
capacity of populations. In practice, this means allowing
southern populations to produce a suitable number of
dispersing eagles to sustain other populations and, in
northern populations, encouraging unused territories to
be reoccupied while avoiding the abandonment of
currently used territories.
General implications for population viability analysis
Our study highlights the challenges to be confronted
when undertaking viability analysis of long-lived species
occurring in spatially structured populations over broad
geographical areas, and thus provides a framework for
multi-site PVA application that may be useful under a
wide set of circumstances. In particular, our study
revealed the importance of testing model assumptions
and evaluating the consequences of uncertainty, which
are critical when generating useful conservation guide-
lines for endangered species.
The approach adopted herein for testing different
model assumptions using past population trends appears
to be reliable for evaluating the plausibility of consid-
ered scenarios (Brook et al. 2000, Lindenmayer et al.
2001, Arnold et al. 2006), and therefore, we believe that
this step should always be performed if data on past
population trends are available. We used the observed
and predicted population growth rates instead of other
measures of viability, which may be particularly useful
for species with a low short-term risk of extinction but
vulnerable current population sizes, as is the case of
many endangered long-lived species. To do so, growth
rate estimates for populations and the vital rate data
used in the models must be estimated independently.
When knowledge of the species’ biology permits, we also
advocate predefining a set of feasible models (consider-
ing different assumptions), and then selecting the most
plausible model using likelihood-based methods, thereby
providing a better theoretical basis and understanding of
the assumed processes governing population dynamics.
Even so, uncertainty in the model assumptions may still
be high and these sources of uncertainty must be
accounted for in order to increase the soundness of the
PVA predictions.
In our analyses, uncertainty in dispersal components
had a strong effect on model predictions. Despite being
a crucial element in most population models (MacAr-
thur and Wilson 1967, Levins 1969, Pulliam 1988,
Hanski 1999), there are still significant deficiencies in our
understanding of behavioral and spatial variation in
dispersal (MacDonald and Johnson 2001, Clobert et al.
2009). This gap in our knowledge means that only rarely
in population viability assessments has much attention
been paid to dispersal (but see McCarthy et al. 2000,
Lindenmayer et al. 2003, Schtickzelle et al. 2005, Bonnot
et al. 2011). In the case of long-lived species, in which
dispersal may occur across large geographical ranges
and over relatively long periods of time, the quantifica-
tion of dispersal is particularly challenging and, conse-
quently, this factor has been misrepresented in empirical
studies in the literature, illustrating the role of dispersal
in shaping the spatial structure of populations (Oro et al.
2004), especially over broad spatial scales. Here, we
show that, along with survival, dispersal may have a
profound effect on the population dynamics of long-
lived species such as Bonelli’s Eagle. Unlike in meta-
populations of short-lived or highly mobile long-lived
species, where local extinctions are prone to happen in
habitable patches over observable timescales, our sink
populations remain stable (or decrease slowly) and their
predicted extinction probabilities are relatively low in
the mid-term (at least when the uncertainty parameter is
not taken into account); in other words, the ‘‘rescue
effect’’ works continuously and local extinctions are
rarely seen to occur.
Our results also emphasize the fact that the overall
dynamics of our population are powerfully determined
by both the shape of the dispersal kernel and the
behavior of dispersing individuals. The dispersal kernel
that we fitted with observed natal dispersal distances was
better matched to a negative exponential function,
although the evaluation of past variation in local
population size strongly supports the idea that dispersal
followed a power-law function; this is understandable if
we bear in mind the fact that long-distance dispersers
may be misrepresented in our sample because the
monitoring effort was lower in more distant popula-
tions. Furthermore, these results highlight the crucial
importance of long-distant dispersers in rescuing sink
populations and exemplify the fact that assumptions
made on the spatial variation of dispersal may
substantially change the predictions deriving from
population models. In addition, the behavioral rules
governing dispersal decisions may also have a strong
effect on population dynamics (Clobert et al. 2009). If
floaters (i.e., potential breeders) change their dispersal
behavior during recruitment based on a perception of
territory availability, they are not expected to remain in
the same patch if they have little chance of recruiting, as
occurs in saturated populations. The aim of our
unconstrained dispersal was to recreate this scenario,
whose consequences are that the bulk of floaters, that
would otherwise remain in the source population under
constrained dispersal, now move into the surrounding
sink populations in order to recruit. Thus, they also
increase the number of floaters in these populations and
thus even allow very distant sink populations to receive
a significant number of immigrants. In other words, in
our system, density-dependent dispersal increases the
persistence probabilities of sink populations and ulti-
mately improves the overall viability of the whole
population.
Finally, we have illustrated that accounting for
parameter uncertainty may also cause a marked increase
in the probability of population decline, even when
PVAs rely on fairly detailed demographic data (Bakker
et al. 2009, McGowan et al. 2011). Assessing the effects
ANTONIO HERNANDEZ-MATIAS ET AL.258 Ecological MonographsVol. 83, No. 2

of uncertainty sources on the viability of target
populations enhances the detection of those parameters
for which available data is insufficient and on which
future research and/or monitoring should be concen-
trated, and also provides more reliable information on
the risk associated under different monitoring and
management scenarios (Bakker and Doak 2009). In
conclusion, we emphasize that it will always be necessary
to take into account the main sources of uncertainty
when looking to increase the reliability of population
viability analysis, particularly when the status of a
species of conservation concern is being evaluated. In
the case of endangered species showing a fragmented
distribution, it will be of great importance to account for
uncertainties in dispersal processes if we are to guide
management and conservation decision-making appro-
priately.
ACKNOWLEDGMENTS
We are indebted to D. Doak for his invaluable help in severalstages of this study, including statistical help and very usefulcomments in an earlier draft of the manuscript. We are verygrateful to E. Crone, D. Oro, and four anonymous referees fortheir helpful comments which greatly improved an earlier draftof the manuscript. J. Bort provided the monitoring data fromthe local population in Castello. F. Bartumeus kindly estimatedthe dispersal kernels we used here. We are also indebted to avast number of naturalists and/or scientists, who allowed andcoordinated the collection of field data, particularly S. Manosa,A. Tinto, R. Bosch, F. Pares, G. Rocamora, and R. Amo(Catalonia); G. Cheylan, J.-M. Cugnasse, N. Pierre, and M.Mure (France); J. Bort (Castello); J. Bautista, M. Otero, F.Molino, G. Valenzuela, J. F. Sanchez-Clemot, E. Avila, and J.Martın-Jaramillo (Granada); A. Gardiazabal (Aragon); M. A.Sanchez, J. E. Martınez, A. Ortuno, S. Eguıa, A. Mellado, andJ. A. Ballester (Murcia); and P. Azkona (Alava, Navarra, LaRioja). Monitoring was also possible thanks to the invaluablesupport of the agencies of local governments and privatecompanies: C. Castell from Oficina Tecnica de Planificacio iAnalisi Territorial—OTPAT (Diputacio de Barcelona) andFundacio Miquel Torres (Bodegas Miquel Torres; Catalonia);Ministere de l’Ecologie, de l’Energie, du Developpementdurable et de la Mer (MEEDDM) through ‘‘Plan Nationald’Action de l’Aigle Bonelli,’’ and with the collaboration of theEspaces Naturels de Provence (CEEP), CORA, and Conserva-toire des Espaces Naturels du Languedoc-Roussillon (France);A. Balmori from Consejerıa de Medio Ambienete from Juntade Castilla y Leon, Patrimonio Natural de Castilla y Leon, andL. Robles from Fundacion Tierra Iberica through Plan deConservacion del Aguila Perdicera en Castilla y Leon (Arribesdel Duero y Burgos); Consejerıa de Medio Ambiente de laJunta de Comunidades de Castilla-La Mancha (Guadalajara);Gobierno de La Rioja through Plan de Recuperacion delAguila-azor Perdicera en La Rioja (Decreto LR 19/2009; LaRioja); M. Alcantara from Servicio de Biodiversidad fromGobierno de Aragon (Aragon); J. de D. Cabezas fromDireccion General del Medio Natural (Murcia); and J. Jimenezfrom Servicio de Biodiversidad Generalitat Valenciana. Eagleswere tagged under the permission of Servei de Fauna (General-itat de Catalunya) and Centre de Recherches par le Baguage desPopulations d’Oiseaux (France). M. Lockwood revised theEnglish. M. Moleon benefited from a postdoctoral fellowshipfrom the Spanish Ministry of Education (Programa Nacionalde Movilidad de Recursos Humanos del Plan Nacional deIþDþi 2008–2011). This study was supported by the SpanishMinisterio de Educacion y Ciencia through projects CGL2007-64805/BOS, CGL2010-17056, and grant SAB-2006-0014/Roger
Pradel, Oficina Tecnica de Planificacio i Analisi Territorial—OTPAT (Diputacio de Barcelona), and Fundacio MiquelTorres (Bodegas Miquel Torres).
LITERATURE CITED
Arnold, J. M., B. Solange, and J. P. Croxall. 2006. Albatrosspopulations in peril: a population trajectory for Black-browed Albatrosses at South Georgia. Ecological Applica-tions 16:419–432.
Bakker, V. J., and D. F. Doak. 2009. Population viabilitymanagement: ecological standards to guide adaptive man-agement for rare species. Frontiers in Ecology and theEnvironment 7:158–165.
Bakker, V. J., D. F. Doak, G. W. Roemer, D. K. Garcelon,T. J. Coonan, S. A. Morrison, C. Lynch, K. Ralls, and R.Shaw. 2009. Incorporating ecological drivers and uncertaintyinto a demographic population viability analysis for theisland fox. Ecological Monographs 79:77–108.
Balbontın, J. 2004. El aguila perdicera en Andalucıa: ecologıa ydispersion juvenil. Dissertation. Universidad de Sevilla,Sevilla, Spain.
Balbontın, J. 2005. Identifying suitable habitat for dispersal inBonelli’s Eagle: an important issue in halting its decline inEurope. Biological Conservation 126:74–83.
Balbontın, J., and M. Ferrer. 2009. Movements of juvenileBonelli’s Eagles Aquila fasciata during dispersal. Bird Study56:86–95.
Balbontın, J., V. Penteriani, and M. Ferrer. 2003. Variations inthe age of mates as an early signal of changes in populationtrends. The case of Bonelli’s eagle in Andalusia. BiologicalConservation 109:417–423.
Beja, P., and L. Palma. 2008. Limitations of methods to testdensity-dependent fecundity hypothesis. Journal of AnimalEcology 77:335–340.
Bierzychudek, P. 1999. Looking backwards: assessing theprojections of a transition matrix model. Ecological Appli-cations 9:1278–1287.
BirdLife International. 2004. Birds in Europe: Populationestimates, trends and conservation status. BirdLife Conser-vation Series number 12. BirdLife International, Cambridge,UK.
Bonnot, T. W., F. R. Thompson III, and J. J. Millspaugh. 2011.Extension of landscape-based population viability models toecoregional scales for conservation planning. BiologicalConservation 144:2041–2053.
Bosch, R., J. Real, A. Tinto, E. Zozaya, and C. Castell. 2010.Home-ranges and patterns of spatial use in territorialBonelli’s Eagles Aquila fasciata. Ibis 152:105–117.
Boyce, M. S. 1992. Population viability analysis. AnnualReview of Ecology and Systematics 23:481–508.
Brook, B. W., and J. Kikkawa. 1998. Examining threats facedby island birds: a population viability analysis on theCapricorn silvereye using long-term data. Journal of AppliedEcology 35:491–503.
Brook, B. W., J. J. O’Grady, M. A. Burgman, H. R. Akcakaya,and R. Frankham. 2000. Predictive accuracy of populationviability analysis in conservation biology. Nature 404:385–387.
Burgman, M. A., D. B. Lindenmayer, and J. Elith. 2005.Managing landscapes for conservation under uncertainty.Ecology 86:2007–2017.
Cadahıa, L., P. Lopez-Lopez, V. Urios, and J. J. Negro. 2010.Satellite telemetry reveals individual variation in juvenileBonelli’s eagle dispersal areas. European Journal of WildlifeResearch 56:923–990.
Carrascal, L. M., and J. Seoane. 2009. Factors affecting large-scale distribution of the Bonelli’s eagle Aquila fasciata inSpain. Ecological Research 24:565–573.
Carrete, M., J. A. Sanchez-Zapata, F. Calvo, and R. Lande.2005. Demography and habitat availability in territorialoccupancy of two competing species. Oikos 108:125–136.
May 2013 259BROAD-SCALE PVA FOR BONELLI’S EAGLE

Carrete, M., J. A. Sanchez-Zapata, J. E. Martınez, M. A.Sanchez, and F. Calvo. 2002. Factors influencing the declineof a Bonelli’s eagle Hieraaetus fasciatus population insoutheastern Spain: demography, habitat or competition?Biodiversity and Conservation 6:975–985.
Carrete, M., J. A. Sanchez-Zapata, J. L. Tella, J. M. Gil-Sanchez, and M. Moleon. 2006. Components of breedingperformance in two competing species: habitat heterogeneity,individual quality and density-dependence. Oikos 112:680–690.
Carrete, M., J. L. Tella, J. A. Sanchez-Zapata, M. Moleon, andJ. M. Gil-Sanchez. 2008. Current caveats and furtherdirections in the analysis of density-dependent populationregulation. Oikos 117:1115–1119.
Cheylan, G., A. Ravayrol, J.-M. Cugnasse, J.-M. Billet, and C.Joulot. 1996. Dispersion des aigles de Bonelli Hieraaetusfasciatus juveniles bagues en France. Alauda 64:413–419.
Clobert, J., J.-F. Le Galliard, J. Cote, S. Meylan, and M.Massot. 2009. Informed dispersal, heterogeneity in animaldispersal syndromes and the dynamics of spatially structuredpopulations. Ecology Letters 12:197–209.
Consejerıa de Medio Ambiente. 2008. Programa de actuacionespara la conservacion del aguila perdicera en Andalucıa (II).Technical report. Egmasa-Consejerıa de Medio Ambiente,Junta de Andalucıa, Jaen, Spain.
Coulson, T., G. M. Mace, E. Hudson, and H. Possingham.2001. The use and abuse of population viability analysis.Trends in Ecology and Evolution 16:219–221.
Crone, E. E., et al. 2011. How do plant ecologists use matrixpopulation models? Ecology Letters 14:1–8.
del Hoyo, J., A. Elliott, and J. Sargatal, editors. 1992.Handbook of the birds of the world. Volume 2: New Worldvultures to guineafowl. Lynx Edicions, Barcelona, Spain.
Delibes-Mateos, M., S. M. Redpath, E. Angulo, and P.Ferreras. 2007. Rabbits as a keystone species in southernEurope. Biological Conservation 137:149–156.
del Moral, J. C. 2006. El aguila perdicera en Espana. Poblacionen 2005 y metodo de censo. SEO=BirdLife, Madrid, Spain.
Doak, D. F., K. Gross, and W. F. Morris. 2005. Understandingand predicting the effects of sparse data on demographicanalyses. Ecology 86:1154–1163.
Fernandez, A., J. Roman, J. A. de la Torre, L. M. Ansola, J.Santamarıa, R. Ventosa, F. Roman, and C. Palma. 1998.Demografıa y conservacion de una poblacion de aguilaperdicera (Hieraaetus fasciatus) en declive. Pages 305–321 inB. U. Meyburg, R. D. Chancellor, and J. J. Ferrero, editors.Holartic birds of prey. Actas del Congreso Internacionalsobre Rapaces del Holartico, Adenex-WWGBP, Merida,Spain.
Fernandez, C., and J. A. Insausti. 1990. Golden Eagles take upterritories abandoned by Bonelli’s Eagles. Journal of RaptorResearch 24:124–125.
Galicia, D., J. Hervas, R. Martınez, J. Seoane, and R. Hidalgo.2010. Ambientes terrestres de Espana, una propuesta declasificacion territorial dirigida a facilitar el analisis y lagestion de la biodiversidad. Ecosistemas 19:52–65.
Gilpin, M. E., and M. E. Soule. 1986. Minimum viablepopulations: processes of extinction. Pages 19–35 in M. E.Soule, editor. Conservation biology: the science of scarcityand diversity. Sinauer, Sunderland, Massachusetts, USA.
Gil-Sanchez, J. M., M. Moleon, J. Bautista, and M. Otero.2005. Differential composition in the age of mates in Bonelli’seagle populations: The role of spatial scale, non-naturalmortality reduction, and the age classes definition. BiologicalConservation 124:149–152.
Gil-Sanchez, J. M., M. Moleon, M. Otero, and J. Bautista.2004. A nine-year study of successful breeding in a Bonelli’seagle population in southeast Spain: a basis for conservation.Biological Conservation 118:685–694.
Gonzalez-Suarez, M., K. E. McCluney, D. Aurioles, and L. R.Gerber. 2006. Incorporating uncertainty in spatial structurefor viability predictions: a case study of California sea lions
(Zalophus californianus californianus). Animal Conservation9:219–227.
Guil, F., et al. 2011. Minimising mortality in endangeredraptors due to power lines: the importance of spatialaggregation to optimize the application of mitigationmeasures. PLoS ONE 6:e28212.
Hanski, I. 1999. Metapopulation ecology. Oxford UniversityPress, Oxford, UK.
Hernandez-Matıas, A., J. Real, and R. Pradel. 2011a. Quickmethods for evaluating survival of age-characterizable long-lived territorial birds. Journal of Wildlife Management75:856–866.
Hernandez-Matıas, A., J. Real, R. Pradel, A. Ravayrol, and N.Vincent-Martin. 2011b. Effects of age, territoriality andbreeding on survival of Bonelli’s Eagle Aquila fasciata. Ibis153:846–857.
Hernandez-Matıas, A., J. Real, R. Pradel, A. Ravayrol, N.Vincent-Martin, and F. Bosca. 2010. Determinants ofterritorial recruitment in Bonelli’s Eagle (Aquila fasciata)Populations. Auk 127:173–184.
Hilborn, R., and M. Mangel. 1997. The ecological detective:confronting models with data. Princeton University Press,Princeton, New Jersey, USA.
Levins, R. 1969. Some demographic and genetic consequencesof environmental heterogeneity for biological control.Bulletin of the Entomological Society of America 15:237–240.
Lindenmayer, D. B., I. Ball, H. P. Possingham, M. A.Mccarthy, and M. L. Pope. 2001. A landscape-scale test ofthe predictive ability of a spatially explicit model forpopulation viability analysis. Journal of Applied Ecology38:36–48.
Lindenmayer, D. B., H. P. Possingham, R. C. Lacy, M. A.Mccarthy, and M. L. Pope. 2003. How accurate arepopulation models? Lessons from landscape-scale tests in afragmented system. Ecology Letters 6:41–47.
Lopez-Lopez, P., C. Garcıa-Ripolles, F. Garcıa-Lopez, J. M.Aguilar, and J. Verdejo. 2004. Patron de distribucion delaguila real Aquila chrysaetos y del aguila-azor perdiceraHieraaetus fasciatus en la provincia de Castellon. Ardeola51:275–283.
MacArthur, R. H., and E. O. Wilson. 1967. The theory ofisland biogeography. Princeton University Press, Princeton,New Jersey, USA.
MacDonald, D. W., and D. D. P. Johnson. 2001. Dispersal intheory and practice: consequences for conservation biology.Pages 359–372 in J. Clobert, E. Danchin, A. Dhondt, andJ. D. Nichols, editors. Dispersal. Oxford University Press,Oxford, UK.
Martı, R., and J. C. del Moral, editors. 2003. Atlas de las AvesReproductoras de Espana. Direccion General de Conserva-cion de la Naturaleza-Sociedad Espanola de Ornitologıa,Madrid, Spain.
Martınez, J. A., J. F. Calvo, J. E. Martınez, I. Zuberogoitia, J.Zabala, and S. M. Redpath. 2008. Breeding performance, ageeffects and territory occupancy in a Bonelli’s Eagle Hier-aaetus fasciatus population. Ibis 150:223–233.
McCarthy, M. A., D. B. Lindenmayer, and H. P. Possingham.2000. Testing spatial PVA models of Australian treecreepers(Aves: Climacteridae) in fragmented forest. EcologicalApplications 10:1722–1731.
McGowan, C. P., M. C. Runge, and M. A. Larson. 2011.Incorporating parametric uncertainty into population viabil-ity analysis models. Biological Conservation 144:1400–1408.
Moleon, M., J. Bautista, J. R. Garrido, J. Martın-Jaramillo, E.Avila, and A. Madero. 2007. Correcting power lines indispersal areas of Bonelli’s eagle: potential positive effects onthe raptor community. Ardeola 54:319–325. [In Spanish.]
Moleon, M., J. Bautista, and A. Madero. 2011. Communalroosting in young Bonelli’s eagles (Aquila fasciata). Journalof Raptor Research 45:353–356.
ANTONIO HERNANDEZ-MATIAS ET AL.260 Ecological MonographsVol. 83, No. 2

Moleon, M., and J. M. Gil-Sanchez. 2006. Granada. Pages 37–40 in J. C. del Moral, editor. El aguila perdicera en Espana.Poblacion en 2005 y metodo de censo. SEO/Birdlife, Madrid,Spain.
Moleon, M., J. A. Sanchez-Zapata, J. Real, J. A. Garcıa-Charton, J. M. Gil-Sanchez, L. Palma, J. Bautista, and P.Bayle. 2009. Large-scale spatio-temporal shifts in the diet of apredator mediated by an emerging infectious disease of itsmain prey. Journal of Biogeography 36:1502–1515.
Morris, W. F., and D. F. Doak. 2002. Quantitative conserva-tion biology. Theory and practice of population viabilityanalysis. Sinauer, Sunderland, Massachusetts, USA.
Ontiveros, D., J. Real, J. Balbontın, M. Carrete, E. Ferreiro, M.Ferrer, S. Manosa, J. M. Pleguezuelos, and J. A. Sanchez-Zapata. 2004. Biologıa de la conservacion del AguilaPerdicera Hieraaetus fasciatus en Espana: investigacioncientıfica y gestion. Ardeola 51:461–470.
Oro, D., E. Cam, R. Pradel, and A. Martınez-Abraın. 2004.Influence of food availability on demography and localpopulation dynamics in a long-lived seabird. Proceedings ofthe Royal Society of London B 271:387–396.
Pais, M. 2005. Seleccao e utilizacao do habitat pela populacaonao reprodutora de Aguia de Bonelli no Sul de Portugal.Relatorio de actividades do 38 ano de trabalhos da BOLSASFRH/BD/2933/2000. Universidade do Algarve, Faro, Por-tugal.
Palma, L., P. Beja, M. Pais, and L. C. Fonseca. 2006. Why doraptors take domestic prey? The case of Bonelli’s eagles andpigeons. Journal of Applied Ecology 43:1075–1086.
Parellada, X. 1984. Variacio del plomatge i identificacio del’aliga cuabarrada (Hieraaetus fasciatus fasciatus). Pages 70–79 in O. Alamany, A. de Juan, X. Parellada, J. Ramon, and J.Tico, editors. Rapinyaires mediterranis. Volume 2. Centre deRecerca i Proteccio dels Rapinyaires (CRPR), Barcelona,Spain.
Pradel, R., and J.-D. Lebreton. 1999. Comparison of differentapproaches to the study of local recruitment of breeders. BirdStudy 46:74–81.
Programa Migres. 2009. Seguimiento de la migracion de lasaves en el Estrecho de Gibraltar: resultados del ProgramaMigres 2008. Migres, Revista de Ecologıa 1:83–101.
Pulliam, H. R. 1988. Sources, sinks, and population regulation.American Naturalist 132:652–661.
Real, J. 1991. L’Aguila perdiguera Hieraaetus fasciatus aCatalunya: estatus, ecologia trofica, biologia reproductora idemografia. Dissertation. Universitat de Barcelona, Barcelo-na, Spain.
Real, J. 2004. Aguila azor-perdicera, Hieraaetus fasciatus.Pages 154–157 in A. Madrono, C. Gonzalez, and J. C.Atienza, editors. Libro Rojo de las Aves de Espana.Direccion General para la Biodiversidad-SEO/Birdlife, Ma-drid, Spain.
Real, J., J. M. Grande, S. Manosa, and J. A. Sanchez-Zapata.2001. Causes of death in different areas for Bonelli’s EagleHieraaetus fasciatus in Spain. Bird Study 48:221–228.
Real, J., and S. Manosa. 1997. Demography and conservationof western European Bonelli’s eagle Hieraaetus fasciatuspopulations. Biological Conservation 79:59–66.
Real, J., and S. Manosa. 2001. Dispersal of juvenile andimmature Bonelli’s Eagles in northeastern Spain. Journal ofRaptor Research 35:9–14.
Reed, J. M., L. S. Mills, J. B. Dunning, E. S. Menges, K. S.McKelvey, R. Frye, S. R. Beissinger, M. C. Anstett, and P.Miller. 2002. Emerging issues in population viability analysis.Conservation Biology 16:7–19.
Resano, J., A. Hernandez-Matıas, J. Real, and F. Pares. 2011.Using stable isotopes to determine dietary patterns inBonelli’s eagle (Aquila fasciata) nestlings. Journal of RaptorResearch 45:342–352.
Rocamora, G. 1994. Bonelli’s Eagle Hieraaetus fasciatus. Pages184–185 in G. M. Tucker and M. F. Heath, editors. Birds inEurope: their conservation status. Birdlife ConservationSeries number 3. Birdlife International, Cambridge, UK.
Rollan, A., J. Real, R. Bosch, A. Tinto, and A. Hernandez-Matıas. 2010. Modelling the risk of collision with power linesin Bonelli’s Eagle Hieraaetus fasciatus and its conservationimplications. Bird Conservation International 20:279–294.
Schtickzelle, N., and M. Baguette. 2004. Metapopulationviability analysis of the bog fritillary butterfly usingRAMAS/GIS. Oikos 104:277–290.
Schtickzelle, N., J. Choutt, P. Goffart, V. Fichefet, and M.Baguette. 2005. Metapopulation dynamics and conservationof the marsh fritillary butterfly: Population viability analysisand management options for a critically endangered speciesin Western Europe. Biological Conservation 126:569–581.
Soutullo, A., P. Lopez-Lopez, and V. Urios. 2008. Incorporat-ing spatial structure and stochasticity in endangered Bonelli’seagle’s population models: Implications for conservation andmanagement. Biological Conservation 141:1013–1020.
Tinto, A., J. Real, and S. Manosa. 2010. Predicting andcorrecting electrocution of birds in Mediterranean areas.Journal of Wildlife Management 74:1852–1862.
Valle, D., C. L. Staudhammer, W. P. Cropper, Jr., and P. R.Gardingen. 2009. The importance of multimodel projectionsto assess uncertainty in projections from simulation models.Ecological Applications 19:1680–1692.
White, G. C. 2000. Population viability analysis: datarequirements and essential analyses. Pages 288–331 in L.Boitani and T. K. Fuller, editors. Research techniques inanimal ecology: controversies and consequences. ColumbiaUniversity Press, New York, New York, USA.
Wisdom, M. J., L. S. Mills, and D. F. Doak. 2000. Life stagesimulation analysis: estimating vital-rate effects on popula-tion growth for conservation. Ecology 81:628–641.
SUPPLEMENTAL MATERIAL
Appendix A
Summary of data from monitored populations (Ecological Archives M083-009-A1).
Appendix B
Estimation of vital rates and dispersal kernels (Ecological Archives M083-009-A2).
Appendix C
Estimation of correlations in vital rates (Ecological Archives M083-009-A3).
Supplement
Raw data used to estimate main vital rates and MATLAB code used in simulations (Ecological Archives M083-009-S1).
May 2013 261BROAD-SCALE PVA FOR BONELLI’S EAGLE