Embed Size (px)
Citation preview

From Lau to Unz:
An Anatomy of the Debate over Bilingual Education.
Kenji HakutaStanford University
http://www.stanford.edu/~hakuta
University of La VerneDecember 5, 2001
1974
1998

Lau v. Nichols 1974
Basic English skills are at the very core of what these publics schools teach. Imposition of a requirement that, before a child can effectively participate in the educational program, he must already have acquired those basic skills is to make a mockery of public education. We know that those who do not understand English are certain to find their classroom experiences wholly incomprehensible and in no way meaningful.

1974
The Federal Supreme Court ruled on the case Lau v. Nichols, basing their decision on Title VI of the Civil Rights Act. The ruling stated that:
There is no equality of treatment merely by providing students with the same facilities, textbooks, teachers and curriculum; for students who do not understand English are effectively foreclosed from any meaningful education.
No specific remedy is urged upon us. Teaching English to students of Chinese ancestry who do not speak the language is one choice. Giving instructions to this group in Chinese is another. There may be others. Petitioners ask only that the Board of Education be directed to apply its expertise to the problem and rectify the situation.

1975
Terrence Bell, the United States Commissioner of Education issued the “Lau Remedies”. These remedies went beyond the Lau decision and required that bilingual education be provided.
“Because an ESL program does not consider the affective or cognitive development of students [in the elementary and intermediate grades], an ESL program is not appropriate.”

Common Program Categories
•English as a second language (ESL)
•Structured immersion (or "sheltered instruction" in secondary grades)
•Transitional bilingual education
•Maintenance bilingual education
•Two-way bilingual programs


Reading Comprehension
0 1 2 3 4 5 6GRADE
3
4
5
6
7
8
9
10
11
12
Age
Eq
uiv
ale
nt S
core
English-OnlyBilingual
Program
0 1 2 3 4 5 63
6
9
12

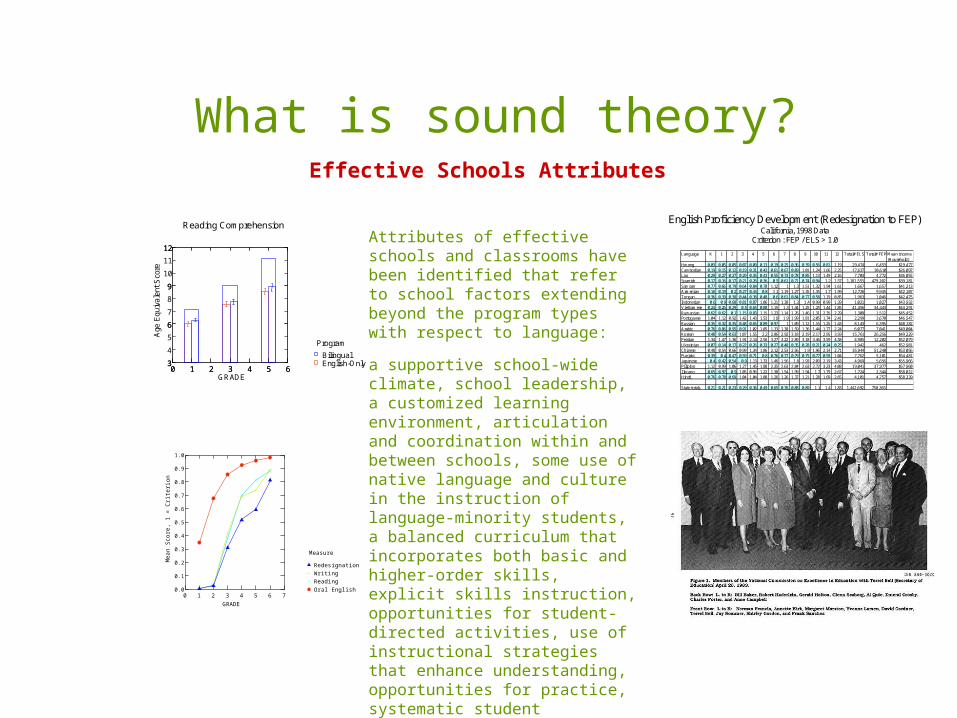
Castañeda v. Pickard, 1981
The U.S. 5th Circuit Court of Appeals ruling interpreted the Equal Education Opportunities Act of 1974 statement of "appropriate action" as requiring the meeting of three criteria:
(1) programs must be based on "sound educational theory";
(2) they must be "implemented effectively" with adequate resources and personnel, and
(3) after a trial period, the program must be evaluated as effective in overcoming language handicaps.

Theory Implementation Learning
modify
Castañeda Model

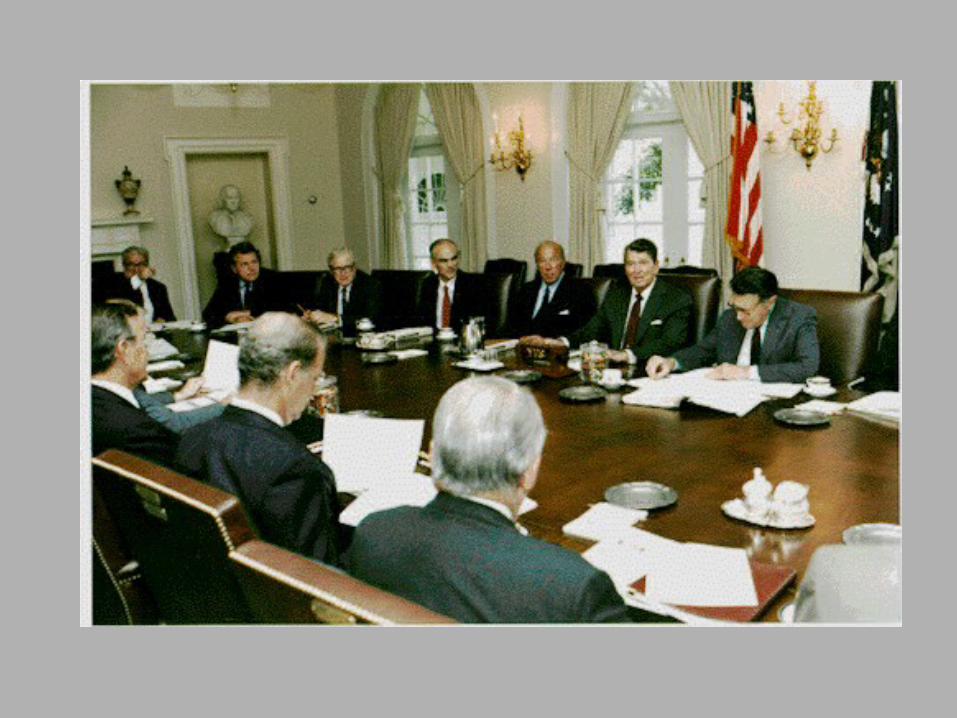
What is sound theory?
Reading Comprehension
0 1 2 3 4 5 6GRADE
3
4
5
6
7
8
9
10
11
12
Age
Eq
uiv
ale
nt S
core
English-OnlyBilingual
Program
0 1 2 3 4 5 63
6
9
12

Attributes of effective schools and classrooms have been identified that refer to school factors extending beyond the program types with respect to language:
a supportive school-wide climate, school leadership, a customized learning environment, articulation and coordination within and between schools, some use of native language and culture in the instruction of language-minority students, a balanced curriculum that incorporates both basic and higher-order skills, explicit skills instruction, opportunities for student-directed activities, use of instructional strategies that enhance understanding, opportunities for practice, systematic student assessment, staff development, and home and parent involvement.
Effective Schools Attributes

What is sound theory?
Reading Comprehension
0 1 2 3 4 5 6GRADE
3
4
5
6
7
8
9
10
11
12
Age
Eq
uiv
ale
nt S
core
English-OnlyBilingual
Program
0 1 2 3 4 5 63
6
9
12Attributes of effective schools and classrooms have been identified that refer to school factors extending beyond the program types with respect to language:
a supportive school-wide climate, school leadership, a customized learning environment, articulation and coordination within and between schools, some use of native language and culture in the instruction of language-minority students, a balanced curriculum that incorporates both basic and higher-order skills, explicit skills instruction, opportunities for student-directed activities, use of instructional strategies that enhance understanding, opportunities for practice, systematic student assessment, staff development, and home and parent involvement.
Effective Schools Attributes

How Long?

English oral proficiency, reading and writing development and redesignation probability from LEP to FEP as a function of grade level. District A.
0 1 2 3 4 5 6 7GRADE
0.0
0.1
0.2
0.3
0.4
0.5
0.6
0.7
0.8
0.9
1.0
Me
an
Sco
r e,
1 =
Cr i
ter i
on
Oral EnglishReadingWritingRedesignation
Measure
How Long Does It Take?

What is sound theory?
Reading Comprehension
0 1 2 3 4 5 6GRADE
3
4
5
6
7
8
9
10
11
12
Age
Eq
uiv
ale
nt S
core
English-OnlyBilingual
Program
0 1 2 3 4 5 63
6
9
12Attributes of effective schools and classrooms have been identified that refer to school factors extending beyond the program types with respect to language:
a supportive school-wide climate, school leadership, a customized learning environment, articulation and coordination within and between schools, some use of native language and culture in the instruction of language-minority students, a balanced curriculum that incorporates both basic and higher-order skills, explicit skills instruction, opportunities for student-directed activities, use of instructional strategies that enhance understanding, opportunities for practice, systematic student assessment, staff development, and home and parent involvement.
Effective Schools Attributes
0 1 2 3 4 5 6 7GRADE
0.0
0.1
0.2
0.3
0.4
0.5
0.6
0.7
0.8
0.9
1.0
Me
an
Sco
r e,
1 =
Cri
teri
on
Oral EnglishReadingWritingRedesignation
Measure

English Proficiency Development (Redesignation to FEP)California, 1998 Data
Criterion : FEP / ELS > 1.0
Language K 1 2 3 4 5 6 7 8 9 10 11 12 Total# ELS Total# FEP Mean income(Household)
Hmong 0.03 0.05 0.05 0.07 0.09 0.13 0.19 0.25 0.36 0.39 0.56 0.81 1.19 29,474 6,453 $19,477Cambodian 0.19 0.15 0.12 0.19 0.31 0.43 0.61 0.67 0.89 1.01 1.24 1.66 2.25 17,637 10,610 $26,097Lao 0.29 0.27 0.27 0.29 0.35 0.43 0.55 0.73 0.78 0.85 1.13 1.49 2.16 7,703 4,772 $36,055Spanish 0.17 0.16 0.17 0.21 0.26 0.36 0.5 0.61 0.71 0.74 0.94 1.2 1.57 1,181,553 479,102 $39,181Samoan 0.77 0.66 0.79 0.64 0.84 0.78 1.12 1 1.3 1.51 1.32 1.94 1.61 1,667 1,657 $41,213Armenian 0.16 0.19 0.2 0.27 0.44 0.8 1.1 1.19 1.27 1.35 1.35 1.7 1.99 12,726 9,945 $42,107Tongan 0.36 0.39 0.38 0.44 0.38 0.48 0.6 0.61 0.84 0.77 0.58 1.19 0.85 1,963 1,046 $42,475Indonesian 0.6 0.9 0.68 0.81 0.87 1.06 1.21 1.38 1.3 1.4 0.99 0.99 1.39 1,021 1,027 $43,932Vietnamese 0.24 0.26 0.29 0.5 0.65 0.88 1.15 1.3 1.44 1.25 1.25 1.44 1.85 41,456 34,443 $44,291Rumanian 0.62 0.62 0.7 1.15 0.83 1.15 1.23 1.14 1.76 1.46 1.31 2.35 2.29 1,309 1,512 $45,452Portuguese 1.04 1.12 0.92 1.42 1.43 1.53 1.8 1.9 1.99 1.81 2.05 1.74 2.41 2,299 3,670 $46,547Russian 0.35 0.32 0.35 0.48 0.65 0.89 0.97 1 1.09 1.12 1.16 1.25 1.43 8,143 6,395 $48,182Arabic 0.76 0.86 0.95 0.91 1.02 1.05 1.33 1.38 1.59 1.36 1.44 1.77 2.24 6,077 7,041 $49,004Korean 0.48 0.54 0.63 1.07 1.55 2.2 2.86 2.92 3.18 2.19 2.17 2.95 3.59 15,761 26,256 $49,229Persian 1.34 1.47 1.36 1.91 2.14 2.56 3.27 3.22 2.89 3.18 3.46 3.59 4.58 4,985 12,202 $52,079Ukrainian 0.07 0.14 0.17 0.22 0.26 0.33 0.27 0.48 0.35 0.28 0.21 0.24 0.25 1,942 462 $52,981Chinese 0.48 0.54 0.66 0.99 1.34 1.86 2.12 2.53 2.56 1.9 1.96 2.14 2.71 35,944 51,240 $53,056Punjabi 0.39 0.4 0.47 0.59 0.71 0.8 0.76 0.77 0.79 0.75 0.77 0.93 1.04 7,762 5,101 $54,481Japanese 0.4 0.42 0.54 0.9 1.13 1.33 1.46 1.56 1.8 1.93 2.03 2.19 3.43 4,969 5,656 $55,966Pilipino 1.12 0.99 1.06 1.27 1.45 1.88 2.35 2.63 2.84 2.63 2.72 3.23 4.08 19,041 37,977 $57,960Ilocano 0.65 0.97 0.9 1.05 0.96 1.22 1.38 1.54 1.99 1.94 1.7 1.79 2.67 1,724 2,344 $58,012Hindi 0.76 0.78 0.69 1.04 1.04 1.08 1.26 1.26 1.37 1.21 1.28 1.69 2.65 4,101 4,757 $58,339
State totals 0.21 0.21 0.23 0.29 0.36 0.49 0.65 0.76 0.88 0.89 1.1 1.4 1.83 1,442,692 758,363
SES

Norm-referenced English writing scores by parent educational level, District B.
< High SchoolSome High SchoolHigh School or GEDBeyond High School
Parent Education
Written Expression
0 1 2 3 4 5 6GRADE
3
4
5
6
7
8
9
10
11
12
Ag
e E
qui
vale
nt
Sco
r e
0 1 2 3 4 5 63
6
9
12
Basic Writing Skills
0 1 2 3 4 5 6GRADE
3
4
5
6
7
8
9
10
11
12
Ag
e E
qui
vale
nt
Sco
r e
0 1 2 3 4 5 63
6
9
12
Broad Written Language
0 1 2 3 4 5 6GRADE
3
4
5
6
7
8
9
10
11
12
Ag
e E
qu
ival
ent
Sco
r e
0 1 2 3 4 5 63
6
9
12

What is sound theory?
Reading Comprehension
0 1 2 3 4 5 6GRADE
3
4
5
6
7
8
9
10
11
12
Age
Eq
uiv
ale
nt S
core
English-OnlyBilingual
Program
0 1 2 3 4 5 63
6
9
12Attributes of effective schools and classrooms have been identified that refer to school factors extending beyond the program types with respect to language:
a supportive school-wide climate, school leadership, a customized learning environment, articulation and coordination within and between schools, some use of native language and culture in the instruction of language-minority students, a balanced curriculum that incorporates both basic and higher-order skills, explicit skills instruction, opportunities for student-directed activities, use of instructional strategies that enhance understanding, opportunities for practice, systematic student assessment, staff development, and home and parent involvement.
Effective Schools Attributes
0 1 2 3 4 5 6 7GRADE
0.0
0.1
0.2
0.3
0.4
0.5
0.6
0.7
0.8
0.9
1.0
Me
an
Sco
r e,
1 =
Cri
teri
on
Oral EnglishReadingWritingRedesignation
Measure
English Proficiency Development (Redesignation to FEP)California, 1998 Data
Criterion : FEP / ELS > 1.0
Language K 1 2 3 4 5 6 7 8 9 10 11 12 Total# ELS Total# FEP Mean income(Household)
Hmong 0.03 0.05 0.05 0.07 0.09 0.13 0.19 0.25 0.36 0.39 0.56 0.81 1.19 29,474 6,453 $19,477Cambodian 0.19 0.15 0.12 0.19 0.31 0.43 0.61 0.67 0.89 1.01 1.24 1.66 2.25 17,637 10,610 $26,097Lao 0.29 0.27 0.27 0.29 0.35 0.43 0.55 0.73 0.78 0.85 1.13 1.49 2.16 7,703 4,772 $36,055Spanish 0.17 0.16 0.17 0.21 0.26 0.36 0.5 0.61 0.71 0.74 0.94 1.2 1.57 1,181,553 479,102 $39,181Samoan 0.77 0.66 0.79 0.64 0.84 0.78 1.12 1 1.3 1.51 1.32 1.94 1.61 1,667 1,657 $41,213Armenian 0.16 0.19 0.2 0.27 0.44 0.8 1.1 1.19 1.27 1.35 1.35 1.7 1.99 12,726 9,945 $42,107Tongan 0.36 0.39 0.38 0.44 0.38 0.48 0.6 0.61 0.84 0.77 0.58 1.19 0.85 1,963 1,046 $42,475Indonesian 0.6 0.9 0.68 0.81 0.87 1.06 1.21 1.38 1.3 1.4 0.99 0.99 1.39 1,021 1,027 $43,932Vietnamese 0.24 0.26 0.29 0.5 0.65 0.88 1.15 1.3 1.44 1.25 1.25 1.44 1.85 41,456 34,443 $44,291Rumanian 0.62 0.62 0.7 1.15 0.83 1.15 1.23 1.14 1.76 1.46 1.31 2.35 2.29 1,309 1,512 $45,452Portuguese 1.04 1.12 0.92 1.42 1.43 1.53 1.8 1.9 1.99 1.81 2.05 1.74 2.41 2,299 3,670 $46,547Russian 0.35 0.32 0.35 0.48 0.65 0.89 0.97 1 1.09 1.12 1.16 1.25 1.43 8,143 6,395 $48,182Arabic 0.76 0.86 0.95 0.91 1.02 1.05 1.33 1.38 1.59 1.36 1.44 1.77 2.24 6,077 7,041 $49,004Korean 0.48 0.54 0.63 1.07 1.55 2.2 2.86 2.92 3.18 2.19 2.17 2.95 3.59 15,761 26,256 $49,229Persian 1.34 1.47 1.36 1.91 2.14 2.56 3.27 3.22 2.89 3.18 3.46 3.59 4.58 4,985 12,202 $52,079Ukrainian 0.07 0.14 0.17 0.22 0.26 0.33 0.27 0.48 0.35 0.28 0.21 0.24 0.25 1,942 462 $52,981Chinese 0.48 0.54 0.66 0.99 1.34 1.86 2.12 2.53 2.56 1.9 1.96 2.14 2.71 35,944 51,240 $53,056Punjabi 0.39 0.4 0.47 0.59 0.71 0.8 0.76 0.77 0.79 0.75 0.77 0.93 1.04 7,762 5,101 $54,481Japanese 0.4 0.42 0.54 0.9 1.13 1.33 1.46 1.56 1.8 1.93 2.03 2.19 3.43 4,969 5,656 $55,966Pilipino 1.12 0.99 1.06 1.27 1.45 1.88 2.35 2.63 2.84 2.63 2.72 3.23 4.08 19,041 37,977 $57,960Ilocano 0.65 0.97 0.9 1.05 0.96 1.22 1.38 1.54 1.99 1.94 1.7 1.79 2.67 1,724 2,344 $58,012Hindi 0.76 0.78 0.69 1.04 1.04 1.08 1.26 1.26 1.37 1.21 1.28 1.69 2.65 4,101 4,757 $58,339
State totals 0.21 0.21 0.23 0.29 0.36 0.49 0.65 0.76 0.88 0.89 1.1 1.4 1.83 1,442,692 758,363


Figure 10

Figure 11
What is sound theory?
Reading Comprehension
0 1 2 3 4 5 6GRADE
3
4
5
6
7
8
9
10
11
12
Age
Eq
uiv
ale
nt S
core
English-OnlyBilingual
Program
0 1 2 3 4 5 63
6
9
12Attributes of effective schools and classrooms have been identified that refer to school factors extending beyond the program types with respect to language:
a supportive school-wide climate, school leadership, a customized learning environment, articulation and coordination within and between schools, some use of native language and culture in the instruction of language-minority students, a balanced curriculum that incorporates both basic and higher-order skills, explicit skills instruction, opportunities for student-directed activities, use of instructional strategies that enhance understanding, opportunities for practice, systematic student assessment, staff development, and home and parent involvement.
Effective Schools Attributes
0 1 2 3 4 5 6 7GRADE
0.0
0.1
0.2
0.3
0.4
0.5
0.6
0.7
0.8
0.9
1.0
Me
an
Sco
r e,
1 =
Cri
teri
on
Oral EnglishReadingWritingRedesignation
Measure
English Proficiency Development (Redesignation to FEP)California, 1998 Data
Criterion : FEP / ELS > 1.0
Language K 1 2 3 4 5 6 7 8 9 10 11 12 Total# ELS Total# FEP Mean income(Household)
Hmong 0.03 0.05 0.05 0.07 0.09 0.13 0.19 0.25 0.36 0.39 0.56 0.81 1.19 29,474 6,453 $19,477Cambodian 0.19 0.15 0.12 0.19 0.31 0.43 0.61 0.67 0.89 1.01 1.24 1.66 2.25 17,637 10,610 $26,097Lao 0.29 0.27 0.27 0.29 0.35 0.43 0.55 0.73 0.78 0.85 1.13 1.49 2.16 7,703 4,772 $36,055Spanish 0.17 0.16 0.17 0.21 0.26 0.36 0.5 0.61 0.71 0.74 0.94 1.2 1.57 1,181,553 479,102 $39,181Samoan 0.77 0.66 0.79 0.64 0.84 0.78 1.12 1 1.3 1.51 1.32 1.94 1.61 1,667 1,657 $41,213Armenian 0.16 0.19 0.2 0.27 0.44 0.8 1.1 1.19 1.27 1.35 1.35 1.7 1.99 12,726 9,945 $42,107Tongan 0.36 0.39 0.38 0.44 0.38 0.48 0.6 0.61 0.84 0.77 0.58 1.19 0.85 1,963 1,046 $42,475Indonesian 0.6 0.9 0.68 0.81 0.87 1.06 1.21 1.38 1.3 1.4 0.99 0.99 1.39 1,021 1,027 $43,932Vietnamese 0.24 0.26 0.29 0.5 0.65 0.88 1.15 1.3 1.44 1.25 1.25 1.44 1.85 41,456 34,443 $44,291Rumanian 0.62 0.62 0.7 1.15 0.83 1.15 1.23 1.14 1.76 1.46 1.31 2.35 2.29 1,309 1,512 $45,452Portuguese 1.04 1.12 0.92 1.42 1.43 1.53 1.8 1.9 1.99 1.81 2.05 1.74 2.41 2,299 3,670 $46,547Russian 0.35 0.32 0.35 0.48 0.65 0.89 0.97 1 1.09 1.12 1.16 1.25 1.43 8,143 6,395 $48,182Arabic 0.76 0.86 0.95 0.91 1.02 1.05 1.33 1.38 1.59 1.36 1.44 1.77 2.24 6,077 7,041 $49,004Korean 0.48 0.54 0.63 1.07 1.55 2.2 2.86 2.92 3.18 2.19 2.17 2.95 3.59 15,761 26,256 $49,229Persian 1.34 1.47 1.36 1.91 2.14 2.56 3.27 3.22 2.89 3.18 3.46 3.59 4.58 4,985 12,202 $52,079Ukrainian 0.07 0.14 0.17 0.22 0.26 0.33 0.27 0.48 0.35 0.28 0.21 0.24 0.25 1,942 462 $52,981Chinese 0.48 0.54 0.66 0.99 1.34 1.86 2.12 2.53 2.56 1.9 1.96 2.14 2.71 35,944 51,240 $53,056Punjabi 0.39 0.4 0.47 0.59 0.71 0.8 0.76 0.77 0.79 0.75 0.77 0.93 1.04 7,762 5,101 $54,481Japanese 0.4 0.42 0.54 0.9 1.13 1.33 1.46 1.56 1.8 1.93 2.03 2.19 3.43 4,969 5,656 $55,966Pilipino 1.12 0.99 1.06 1.27 1.45 1.88 2.35 2.63 2.84 2.63 2.72 3.23 4.08 19,041 37,977 $57,960Ilocano 0.65 0.97 0.9 1.05 0.96 1.22 1.38 1.54 1.99 1.94 1.7 1.79 2.67 1,724 2,344 $58,012Hindi 0.76 0.78 0.69 1.04 1.04 1.08 1.26 1.26 1.37 1.21 1.28 1.69 2.65 4,101 4,757 $58,339
State totals 0.21 0.21 0.23 0.29 0.36 0.49 0.65 0.76 0.88 0.89 1.1 1.4 1.83 1,442,692 758,363

Figure 9

“-- learning subject matter content in a second language can begin to occur in a matter of weeks, starting with the subjects that can be partially understood through symbols (mathematics), active experiments and demonstrations (science), and progressing to the social science.”
Rosalie PorterDirector, READ Institute

Proposition 227
All minority language children will be placed in English language classrooms. Children who are limited English proficient will be taught through sheltered English immersion for a period not normally to exceed one year.

English Learning Students (2nd Grade, SAT9 2000 Reading)
Schools providing bilingual instruction
Schools using only English immersion
Oceanside USD
0
10
20
30
40
50
1998 1999 2000
Year
SA
T9
%

Schools providing bilingual instruction
Schools using only English immersion
Oceanside USD
English Learning Students (3rd Grade, SAT9 2000 Reading)
0
10
20
30
40
50
1998 1999 2000
Year
SA
T9
%

Reading, Grade 2
1997 1998 1999 2000 2001 2002Year of Testing
0
25
50
75
Per
c en t
il e R
a nk
of M
ean
Sc o
reReading, Grade 3
1997 1998 1999 2000 2001 2002Year of Testing
0
25
50
75
Per
c en t
il e R
a nk
of M
ean
Sc o
re
All Students
English Learners
Oceanside
Statewide
All Students
English Learners
Figure 1. SAT-9 reading scores for Oceanside and Statewide for 1998 thru 2000. Blue lines represent data for all students; red lines represent data for English Learners (LEP).

What is sound theory?
Reading Comprehension
0 1 2 3 4 5 6GRADE
3
4
5
6
7
8
9
10
11
12
Age
Eq
uiv
ale
nt S
core
English-OnlyBilingual
Program
0 1 2 3 4 5 63
6
9
12Attributes of effective schools and classrooms have been identified that refer to school factors extending beyond the program types with respect to language:
a supportive school-wide climate, school leadership, a customized learning environment, articulation and coordination within and between schools, some use of native language and culture in the instruction of language-minority students, a balanced curriculum that incorporates both basic and higher-order skills, explicit skills instruction, opportunities for student-directed activities, use of instructional strategies that enhance understanding, opportunities for practice, systematic student assessment, staff development, and home and parent involvement.
Effective Schools Attributes
0 1 2 3 4 5 6 7GRADE
0.0
0.1
0.2
0.3
0.4
0.5
0.6
0.7
0.8
0.9
1.0
Me
an
Sco
r e,
1 =
Cri
teri
on
Oral EnglishReadingWritingRedesignation
Measure
English Proficiency Development (Redesignation to FEP)California, 1998 Data
Criterion : FEP / ELS > 1.0
Language K 1 2 3 4 5 6 7 8 9 10 11 12 Total# ELS Total# FEP Mean income(Household)
Hmong 0.03 0.05 0.05 0.07 0.09 0.13 0.19 0.25 0.36 0.39 0.56 0.81 1.19 29,474 6,453 $19,477Cambodian 0.19 0.15 0.12 0.19 0.31 0.43 0.61 0.67 0.89 1.01 1.24 1.66 2.25 17,637 10,610 $26,097Lao 0.29 0.27 0.27 0.29 0.35 0.43 0.55 0.73 0.78 0.85 1.13 1.49 2.16 7,703 4,772 $36,055Spanish 0.17 0.16 0.17 0.21 0.26 0.36 0.5 0.61 0.71 0.74 0.94 1.2 1.57 1,181,553 479,102 $39,181Samoan 0.77 0.66 0.79 0.64 0.84 0.78 1.12 1 1.3 1.51 1.32 1.94 1.61 1,667 1,657 $41,213Armenian 0.16 0.19 0.2 0.27 0.44 0.8 1.1 1.19 1.27 1.35 1.35 1.7 1.99 12,726 9,945 $42,107Tongan 0.36 0.39 0.38 0.44 0.38 0.48 0.6 0.61 0.84 0.77 0.58 1.19 0.85 1,963 1,046 $42,475Indonesian 0.6 0.9 0.68 0.81 0.87 1.06 1.21 1.38 1.3 1.4 0.99 0.99 1.39 1,021 1,027 $43,932Vietnamese 0.24 0.26 0.29 0.5 0.65 0.88 1.15 1.3 1.44 1.25 1.25 1.44 1.85 41,456 34,443 $44,291Rumanian 0.62 0.62 0.7 1.15 0.83 1.15 1.23 1.14 1.76 1.46 1.31 2.35 2.29 1,309 1,512 $45,452Portuguese 1.04 1.12 0.92 1.42 1.43 1.53 1.8 1.9 1.99 1.81 2.05 1.74 2.41 2,299 3,670 $46,547Russian 0.35 0.32 0.35 0.48 0.65 0.89 0.97 1 1.09 1.12 1.16 1.25 1.43 8,143 6,395 $48,182Arabic 0.76 0.86 0.95 0.91 1.02 1.05 1.33 1.38 1.59 1.36 1.44 1.77 2.24 6,077 7,041 $49,004Korean 0.48 0.54 0.63 1.07 1.55 2.2 2.86 2.92 3.18 2.19 2.17 2.95 3.59 15,761 26,256 $49,229Persian 1.34 1.47 1.36 1.91 2.14 2.56 3.27 3.22 2.89 3.18 3.46 3.59 4.58 4,985 12,202 $52,079Ukrainian 0.07 0.14 0.17 0.22 0.26 0.33 0.27 0.48 0.35 0.28 0.21 0.24 0.25 1,942 462 $52,981Chinese 0.48 0.54 0.66 0.99 1.34 1.86 2.12 2.53 2.56 1.9 1.96 2.14 2.71 35,944 51,240 $53,056Punjabi 0.39 0.4 0.47 0.59 0.71 0.8 0.76 0.77 0.79 0.75 0.77 0.93 1.04 7,762 5,101 $54,481Japanese 0.4 0.42 0.54 0.9 1.13 1.33 1.46 1.56 1.8 1.93 2.03 2.19 3.43 4,969 5,656 $55,966Pilipino 1.12 0.99 1.06 1.27 1.45 1.88 2.35 2.63 2.84 2.63 2.72 3.23 4.08 19,041 37,977 $57,960Ilocano 0.65 0.97 0.9 1.05 0.96 1.22 1.38 1.54 1.99 1.94 1.7 1.79 2.67 1,724 2,344 $58,012Hindi 0.76 0.78 0.69 1.04 1.04 1.08 1.26 1.26 1.37 1.21 1.28 1.69 2.65 4,101 4,757 $58,339
State totals 0.21 0.21 0.23 0.29 0.36 0.49 0.65 0.76 0.88 0.89 1.1 1.4 1.83 1,442,692 758,363