Embed Size (px)
Citation preview
1
May 12, 2017
From: James E. Enstrom, Ph.D., M.P.H.
UCLA and Scientific Integrity Institute
907 Westwood Boulevard #200
Los Angeles, CA 90024-2904
(310) 472-4274
To: Environmental Protection Agency
Office of Policy Regulatory Reform
Mail Code 1803A
1200 Pennsylvania Avenue, NW
Washington, DC 20460
https://www.epa.gov/laws-regulations/regulatory-reform
Re: Docket ID: EPA-HQ-OA-2017-0190
Agency: Environmental Protection Agency (EPA)
Summary: Executive Order 13777, issued 2/24/17, directs agencies to establish a
Regulatory Reform Task Force to oversee the evaluation of existing regulations to
make recommendations about potential repeal, replacement, or modification.
https://www.regulations.gov/docket?D=EPA-HQ-OA-2017-0190
2
Item 1.
April 24, 2017 EPA Public Teleconference Statement by James E. Enstrom, Ph.D., M.P.H.,
asking EPA to reassess and modify the National Ambient Air Quality Standard (NAAQS) for
fine particulate matter (PM2.5).
https://www.epa.gov/clean-air-act-overview/oar-regulatory-reform
“My name is Dr. James E. Enstrom and I have doctoral-level training in both physics and
epidemiology and for the past 44 years I have conducted high quality peer-reviewed epidemiologic
research at UCLA. I am asking EPA to reassess and modify the National Ambient Air Quality
Standard (NAAQS) for fine particulate matter (PM2.5).
On March 28 I published a major peer-reviewed article showing that PM2.5 is not related to total
mortality or premature deaths in the United States. This null relationship, which is based on my
analysis of the large 1982 American Cancer Society Cancer Prevention Study cohort, contradicts the
positive relationship in the same cohort that was published in 1995 by Pope and that was the primary
justification for the establishment of the PM2.5 NAAQS by EPA in 1997. The difference in findings
occurred because the 1995 Pope analysis used inferior PM2.5 measurements and used only a selected
portion of the available ACS data. My findings are also supported by the null findings in a 2016
article that analyzed the large national NIH AARP cohort.
My independent analysis of the otherwise still secret ACS data demonstrates the importance of
basing EPA regulations on transparent and reproducible science, as required by the HONEST Act.
H.R. 1340 has been approved by the House of Representatives and is awaiting action in the Senate.
Since March 10 I have requested that Pope, Krewski, and the Health Effects Institute confirm my
null findings and they have provided no evidence that my findings are incorrect.
Thus, EPA must immediately reassess the validity of the PM2.5 NAAQS and all regulations, such as,
the Clean Power Plan, that are justified by alleged PM2.5-related premature deaths. The initial focus
must be on my new findings, on the apparently incorrect findings of Pope, Krewski, and HEI, and on
the extensive evidence that healthy levels of PM2.5 have already been achieved in America. EPA
must not approve any further California Waivers, State Implementation Plans, or Air Quality
Management Plans until this PM2.5 NAAQS reassessment has been done.
Thank you for listening to my testimony and reading my submitted comments.”
3
Item 2.
My attached comments contain overwhelming and uncontested evidence that there is NO
relationship between PM2.5 and total mortality (“premature deaths”) in the American Cancer Society
(ACS) Cancer Prevention Study II (CPS II) cohort. There is NO relationship in California or in the
United States as a whole. Based this CPS II evidence and additional evidence that “Particulate
Matter Does Not Cause Premature Deaths,” I request EPA to completely reassess and modify the
National Ambient Air Quality Standard (NAAQS) for fine particulate matter (PM2.5).
My 90-page attachment contains the following:
May 12, 2017 Enstrom Comments to EPA, Including Description of Items 1 and 2 (pages 1-3)
March 28, 2017 Dose-Response article by James E. Enstrom “Fine Particulate Matter and Total
Mortality in Cancer Prevention Study Cohort Reanalysis” (pages 4-15)
http://journals.sagepub.com/doi/full/10.1177/1559325817693345
March 23, 2017 Heartland Twelfth International Conference on Climate Change Lecture
“PM2.5 Does Not Cause Premature Deaths” (pages 16-35)
http://climateconferences.heartland.org/james-enstrom-iccc12/
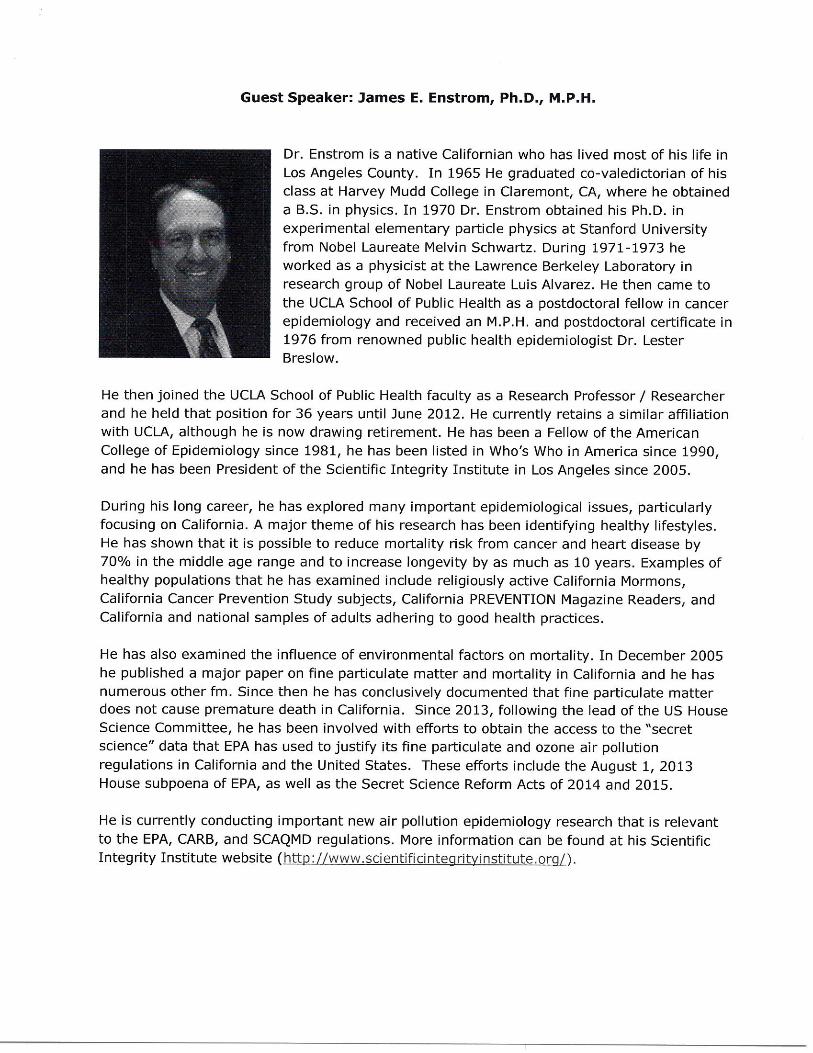
July 19, 2016 Los Angeles County Business Federation Enstrom Summary Biography (page 36)
http://www.scientificintegrityinstitute.org/SCBCJEEB071916.pdf
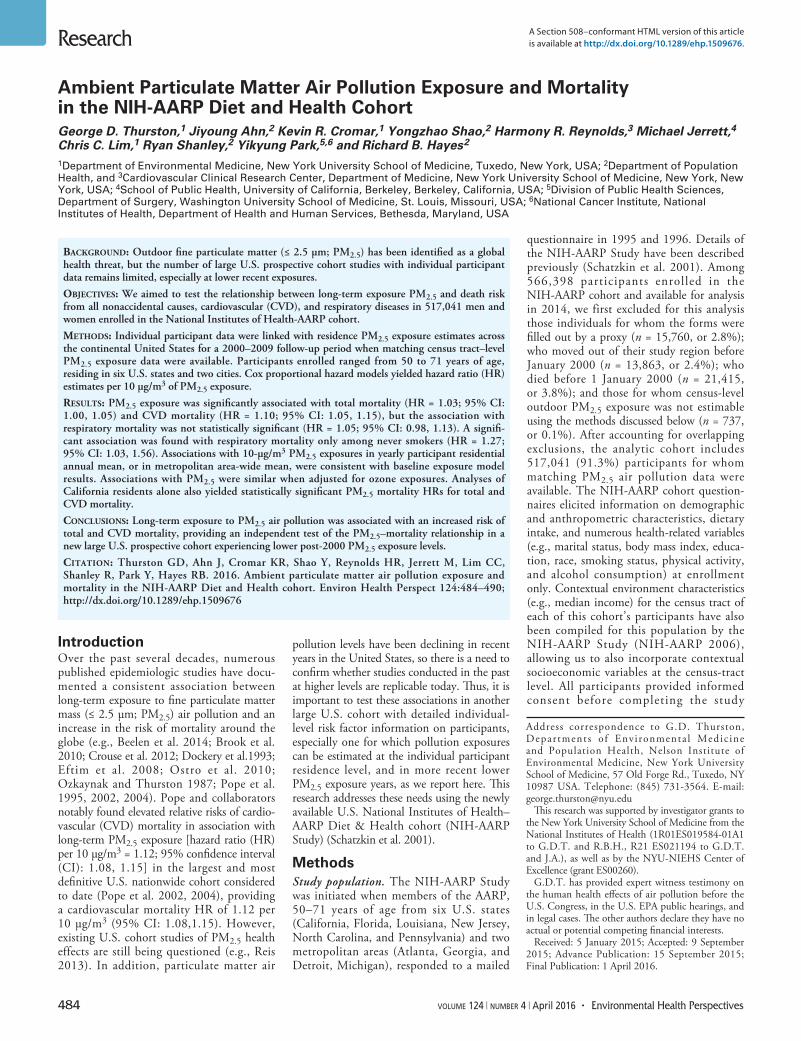
April 1, 2016 Environmental Health Perspectives article by George D. Thurston, et al.
“Ambient Particulate Matter Air Pollution Exposure and Mortality in the NIH-AARP Diet and
Health Cohort” (pages 37-43)
http://ehp.niehs.nih.gov/1509676/
August 17, 2015 Science Perspective Manuscript “Particulate Matter Does Not Cause Premature
Deaths” Submission and Immediate Rejection (pages 44-53)
https://www.nas.org/articles/nas_letter and https://www.nas.org/images/documents/PM2.5.pdf
December 21, 2016 US Office of Research Integrity Hohmann Email to Enstrom Regarding
Alleged Research Misconduct by Jerrett et al. in 2013 AJRCCM Article (page 54)
http://www.scientificintegrityinstitute.org/Hohmann122116.pdf
November 11, 2016 US Office of Research Integrity Enstrom Submission of Alleged Research
Misconduct by Jerrett et al. in 2013 AJRCCM Article (pages 55-77)
http://www.scientificintegrityinstitute.org/ORIJerrett111116.pdf
December 1, 2014 Enstrom Comments to EPA Regarding PM2.5 Justification for Clean Power
Plan and PM2.5 Scientific Misconduct (pages 78-90)
http://www.scientificintegrityinstitute.org/JEECPP120114.pdf
Original Article
Fine Particulate Matter and TotalMortality in Cancer Prevention StudyCohort Reanalysis
James E. Enstrom1
Abstract
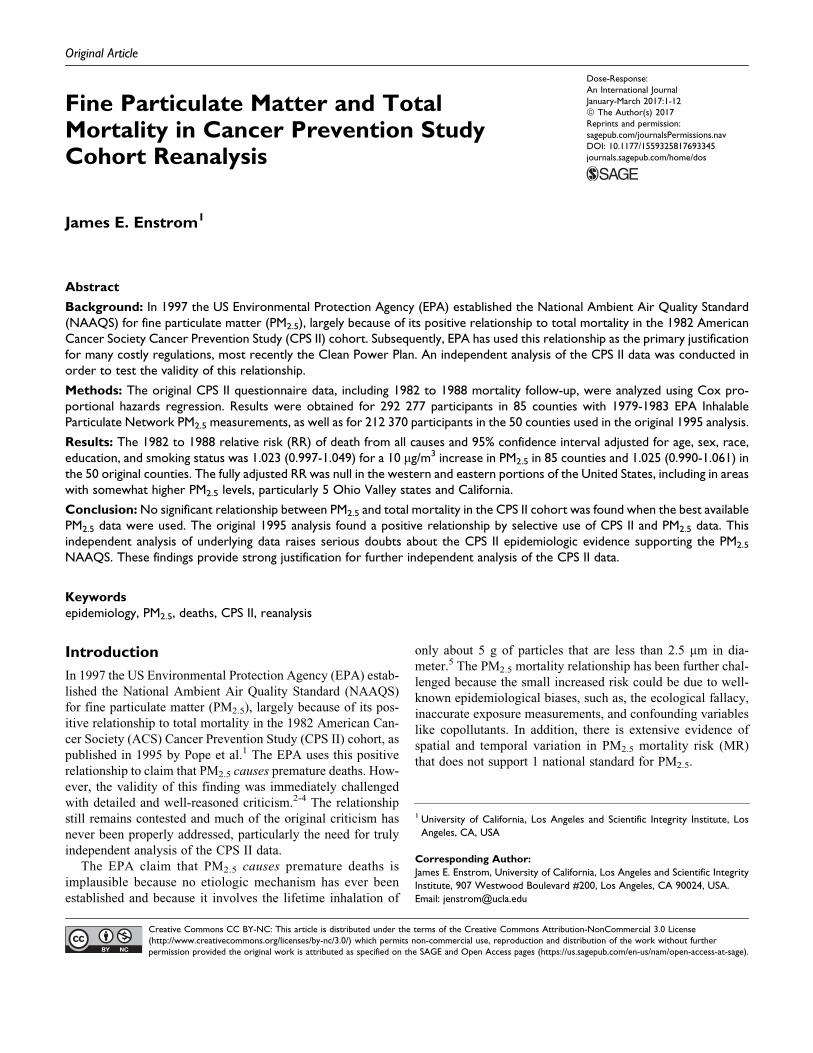
Background: In 1997 the US Environmental Protection Agency (EPA) established the National Ambient Air Quality Standard(NAAQS) for fine particulate matter (PM2.5), largely because of its positive relationship to total mortality in the 1982 AmericanCancer Society Cancer Prevention Study (CPS II) cohort. Subsequently, EPA has used this relationship as the primary justificationfor many costly regulations, most recently the Clean Power Plan. An independent analysis of the CPS II data was conducted inorder to test the validity of this relationship.
Methods: The original CPS II questionnaire data, including 1982 to 1988 mortality follow-up, were analyzed using Cox pro-portional hazards regression. Results were obtained for 292 277 participants in 85 counties with 1979-1983 EPA InhalableParticulate Network PM2.5 measurements, as well as for 212 370 participants in the 50 counties used in the original 1995 analysis.
Results: The 1982 to 1988 relative risk (RR) of death from all causes and 95% confidence interval adjusted for age, sex, race,education, and smoking status was 1.023 (0.997-1.049) for a 10 mg/m3 increase in PM2.5 in 85 counties and 1.025 (0.990-1.061) inthe 50 original counties. The fully adjusted RR was null in the western and eastern portions of the United States, including in areaswith somewhat higher PM2.5 levels, particularly 5 Ohio Valley states and California.
Conclusion: No significant relationship between PM2.5 and total mortality in the CPS II cohort was found when the best availablePM2.5 data were used. The original 1995 analysis found a positive relationship by selective use of CPS II and PM2.5 data. Thisindependent analysis of underlying data raises serious doubts about the CPS II epidemiologic evidence supporting the PM2.5
NAAQS. These findings provide strong justification for further independent analysis of the CPS II data.
Keywordsepidemiology, PM2.5, deaths, CPS II, reanalysis
Introduction
In 1997 the US Environmental Protection Agency (EPA) estab-
lished the National Ambient Air Quality Standard (NAAQS)
for fine particulate matter (PM2.5), largely because of its pos-
itive relationship to total mortality in the 1982 American Can-
cer Society (ACS) Cancer Prevention Study (CPS II) cohort, as
published in 1995 by Pope et al.1 The EPA uses this positive
relationship to claim that PM2.5 causes premature deaths. How-
ever, the validity of this finding was immediately challenged
with detailed and well-reasoned criticism.2-4 The relationship
still remains contested and much of the original criticism has
never been properly addressed, particularly the need for truly
independent analysis of the CPS II data.
The EPA claim that PM2.5 causes premature deaths is
implausible because no etiologic mechanism has ever been
established and because it involves the lifetime inhalation of
only about 5 g of particles that are less than 2.5 mm in dia-
meter.5 The PM2.5 mortality relationship has been further chal-
lenged because the small increased risk could be due to well-
known epidemiological biases, such as, the ecological fallacy,
inaccurate exposure measurements, and confounding variables
like copollutants. In addition, there is extensive evidence of
spatial and temporal variation in PM2.5 mortality risk (MR)
that does not support 1 national standard for PM2.5.
1 University of California, Los Angeles and Scientific Integrity Institute, Los
Angeles, CA, USA
Corresponding Author:
James E. Enstrom, University of California, Los Angeles and Scientific Integrity
Institute, 907 Westwood Boulevard #200, Los Angeles, CA 90024, USA.
Email: [email protected]
Dose-Response:An International JournalJanuary-March 2017:1-12ª The Author(s) 2017Reprints and permission:sagepub.com/journalsPermissions.navDOI: 10.1177/1559325817693345journals.sagepub.com/home/dos
Creative Commons CC BY-NC: This article is distributed under the terms of the Creative Commons Attribution-NonCommercial 3.0 License(http://www.creativecommons.org/licenses/by-nc/3.0/) which permits non-commercial use, reproduction and distribution of the work without furtherpermission provided the original work is attributed as specified on the SAGE and Open Access pages (https://us.sagepub.com/en-us/nam/open-access-at-sage).
In spite of these serious problems, EPA and the major PM2.5
investigators continue to assert that their positive findings are
sufficient proof that PM2.5 causes premature deaths. Their pre-
mature death claim has been used to justify many costly EPA
regulations, most recently, the Clean Power Plan.6 Indeed,
85% of the total estimated benefits of all EPA regulations
have been attributed to reductions in PM2.5-related premature
deaths. With the assumed benefits of PM2.5 reductions playing
such a major role in EPA regulatory policy, it is essential that
the relationship of PM2.5 to mortality be independently ver-
ified with transparent data and reproducible findings.
In 1998, the Health Effects Institute (HEI) in Boston was com-
missioned to conduct a detailed reanalysis of the original Pope
1995 findings. The July 2000 HEI Reanalysis Report (HEI 2000)
included “PART I: REPLICATION AND VALIDATION” and
“PART II: SENSITIVITY ANALYSES.”7 The HEI Reanaly-
sis Team lead by Daniel Krewski successfully replicated and
validated the 1995 CPS II findings, but they did not analyze the
CPS II data in ways that would determine whether the original
results remained robust using different sources of air pollution
data. For instance, none of their models used the best available
PM2.5 measurements as of 1995.
Particularly troubling is the fact that EPA and the major
PM2.5 investigators have ignored multiple null findings on the
relationship between PM2.5 and mortality in California. These
null findings include my 2005 paper,8 2006 clarification,9 2012
American Statistical Society Joint Statistical Meeting Proceed-
ings paper,10 and 2015 International Conference on Climate
Change presentation about the Clean Power Plan and PM2.5-
related cobenefits.6 There is now overwhelming evidence of a
null PM2.5 mortality relationship in California dating back to
2000. The problems with the PM2.5 mortality relationship have
generated substantial scientific and political concern.
During 2011 to 2013, the US House Science, Space, and
Technology Committee (HSSTC) repeatedly requested that EPA
provide access to the underlying CPS II data, particularly since
substantial Federal funding has been used for CPS II PM2.5
mortality research and publications. On July 22, 2013, the
HSSTC made a particularly detailed request to EPA that included
49 pages of letters dating back to September 22, 2011.11 When
EPA failed to provide the requested data, the HSSTC issued an
August 1, 2013 subpoena to EPA for the CPS II data.12 The ACS
refused to comply with the HSSTC subpoena, as explained in an
August 19, 2013 letter to EPA by Chief Medical Officer Otis W.
Brawley.13 Then, following the subpoena, ACS has refused to
work with me and 3 other highly qualified investigators regard-
ing collaborative analysis of the CPS II data.14 Finally, HEI has
refused to conduct my proposed CPS II analyses.15 However, my
recent acquisition of an original version of the CPS II data has
made possible this first truly independent analysis.
Methods
Computer files containing the original 1982 ACS CPS II dei-
dentified questionnaire data and 6-year follow-up data on
deaths from September 1, 1982 through August 31, 1988, along
with detailed documentation, were obtained from a source with
appropriate access to these data, as explained in the
“Acknowledgments.” This article presents my initial analysis
of the CPS II cohort and it is subject to the limitations of data
and documentation that is not as complete and current as the
data and documentation possessed by ACS.
The research described below is exempt from human parti-
cipants or ethics approval because it involved only statistical
analysis of existing deidentified data. Human participants’
approval was obtained by ACS in 1982 when each individual
enrolled in CPS II. Because of the epidemiologic importance of
this analysis, an effort will be made to post on my Scientific
Integrity Institute website a version of the CPS II data that fully
preserves the confidentiality of all of participants and that con-
tains enough information to verify my findings.
Of the 1.2 million total CPS II participants, analysis has
been done on 297 592 participants residing in 85 counties in
the continental United States with 1979 to 1983 EPA Inhal-
able Particulate Network (IPN) PM2.5 measurements.16,17
Among these participants, there were 18 612 total deaths from
September 1, 1982 through August 31, 1988; 17 329 of these
deaths (93.1%) had a known date of death. Of the 297 592
participants, 292 277 had age at entry of 30 to 99 years and sex
of male [1] or female [2]. Of the 292 277 participants, 269 766
had race of white [1,2,5] or black [3,4]; education level of no
or some high school [1,2], high school graduate [3], some
college [4,5], college graduate [6], or graduate school [7]; and
smoking status of never [1], former [5-8 for males and 3 for
females], or current [2-4 for males and 2 for females]. Those
participants reported to be dead [D, G, K] but without an exact
date of death have been assumed to be alive in this analysis.
The unconfirmed deaths were randomly distributed and did
not impact relative comparisons of death in a systematic way.
The computer codes for the above variables are shown in
brackets.
CPS II participants were entered into the master data file
geographically. Since this deidentified data file does not con-
tain home addresses, the Division number and Unit number
assigned by ACS to each CPS II participant have been used
to define their county of residence. For instance, ACS Division
39 represents the state of Ohio and its Unit 041 represents
Jefferson County, which includes the city of Steubenville,
where the IPN PM2.5 measurements were made. In other words,
most of the 575 participants in Unit 041 lived in Jefferson
County as of September 1, 1982. The IPN PM2.5 value of
29.6739 mg/m3, based on measurements made in Steubenville,
was assigned to all CPS II participants in Unit 041. This PM2.5
value is a weighted average of 53 measurements (mean of
33.9260 mg/m3) and 31 measurements (mean of 29.4884 mg/m3)
made during 1979 to 198216 and 53 measurements (mean of
27.2473 mg/m3) and 54 measurements (mean of 28.0676 mg/m3)
made during 1983.17 The IPN PM2.5 data were collected only
during 1979 to 1983, although some other IPN air pollution data
were collected through 1984. The values for each county that
includes a city with CPS II participants and IPN PM2.5 measure-
ments are shown in Appendix Table A1.
2 Dose-Response: An International Journal
To make the best possible comparison with Pope 1995 and
HEI 2000 results, the HEI PM2.5 value of 23.1 mg/m3 for Steu-
benville was assigned to all participants in Unit 041. This value
is the median of PM2.5 measurements made in Steubenville
and is shown in HEI 2000 Appendix D “Alternative Air
Pollution Data in the ACS Study.”7 Analyses were done for
the 50 counties containing the original 50 cities with CPS II
participants and HEI PM2.5 values used in Pope 1995 and HEI
2000. Additional analyses were done for all 85 counties con-
taining cities with both CPS II participants and IPN PM2.5 data.
Without explanation, Pope 1995 and HEI 2000 omitted from
their analyses, 35 cities with CPS II participants and IPN PM2.5
data. To be clear, these analyses are based on the CPS II
participants assigned to each Unit (county) that included a
city with IPN PM2.5 data. The original Pope 1995 and HEI
2000 analyses were based on the CPS II participants assigned
to each metropolitan area (MA) that included a city with HEI
PM2.5 data, as defined in HEI 2000 Appendix F “Definition of
Metropolitan Areas in the ACS Study.”7 The MA, which was
equivalent to the US Census Bureau Standard Metropolitan
Statistical Area (SMSA), always included the county contain-
ing the city with the HEI PM2.5 data and often included 1 or
more additional counties.
The SAS 9.4 procedure PHREG was used to conduct Cox
proportional hazards regression.18 Relative risks (RRs) for
death from all causes and 95% confidence intervals (CI) were
calculated using age–sex adjustment and full adjustment (age,
sex, race, education, and smoking status, as defined above).
Each of the 5 adjustment variables had a strong relationship
to total mortality. Race, education, and smoking status were the
3 adjustment variables that had the greatest impact on the age–
sex-adjusted RR. The Pope 1995 and HEI 2000 analyses used 4
additional adjustment variables that had a lesser impact on the
age–sex-adjusted RR.
In addition, county-level ecological analyses were done by
comparing IPN PM2.5 and HEI PM2.5 values to 1980 age-
adjusted white total death rates (DRs) determined by the Cen-
ters for Disease Control and Prevention (CDC) WONDER19
and mortality risks (MRs) as shown in Figures 5 and 21 of HEI
2000.7 Death rates are age adjusted to the 2000 US Standard
Population and are expressed as annual deaths per 100 000
persons. The SAS 9.4 procedure REGRESSION was used to
conduct linear regression of PM2.5 values with DRs and MRs.
Appendix Table A1 lists the 50 original cities used in Pope
1995 and HEI 2000 and includes city, county, state, ACS Divi-
sion and Unit numbers, Federal Information Processing Stan-
dards (FIPS) code, IPN average PM2.5 level, HEI median PM2.5
level, 1980 DR, and HEI MR. Appendix Table A1 also lists
similar information for the 35 additional cities with CPS II
participants and IPN PM2.5 data. However, HEI PM2.5 and HEI
MR data are not available for these 35 cities.
Results
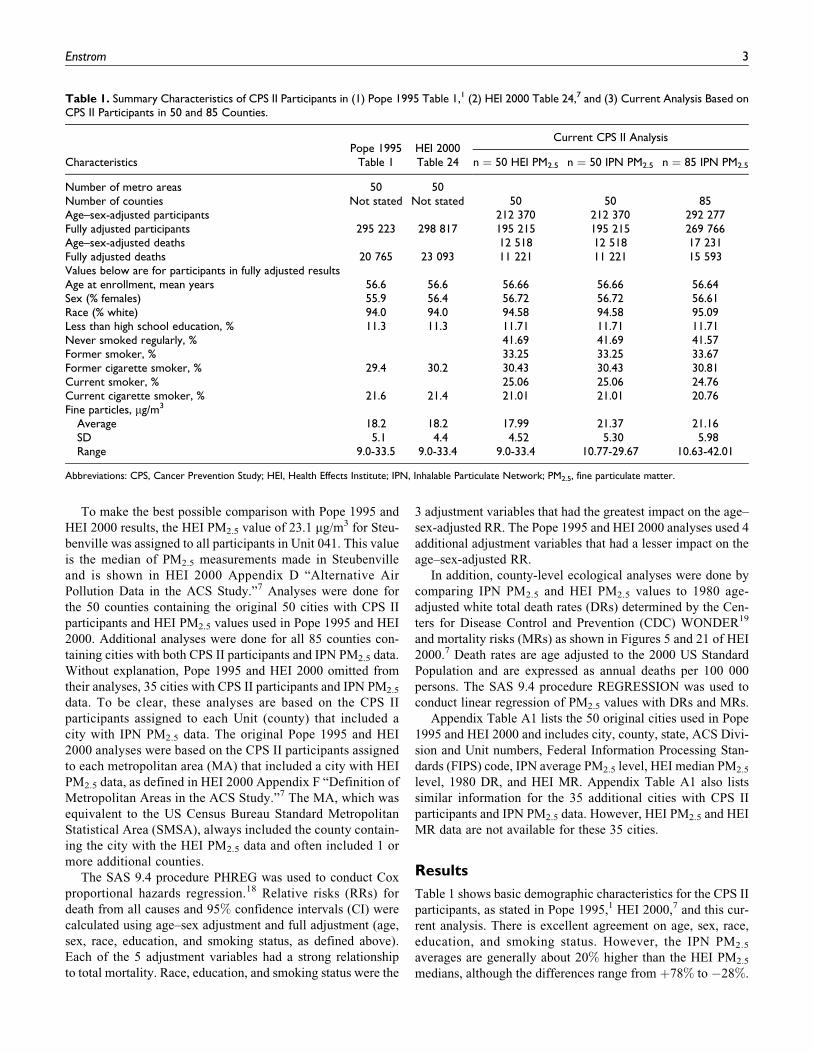
Table 1 shows basic demographic characteristics for the CPS II
participants, as stated in Pope 1995,1 HEI 2000,7 and this cur-
rent analysis. There is excellent agreement on age, sex, race,
education, and smoking status. However, the IPN PM2.5
averages are generally about 20% higher than the HEI PM2.5
medians, although the differences range from þ78% to �28%.
Table 1. Summary Characteristics of CPS II Participants in (1) Pope 1995 Table 1,1 (2) HEI 2000 Table 24,7 and (3) Current Analysis Based onCPS II Participants in 50 and 85 Counties.
CharacteristicsPope 1995
Table 1HEI 2000Table 24
Current CPS II Analysis
n ¼ 50 HEI PM2.5 n ¼ 50 IPN PM2.5 n ¼ 85 IPN PM2.5
Number of metro areas 50 50Number of counties Not stated Not stated 50 50 85Age–sex-adjusted participants 212 370 212 370 292 277Fully adjusted participants 295 223 298 817 195 215 195 215 269 766Age–sex-adjusted deaths 12 518 12 518 17 231Fully adjusted deaths 20 765 23 093 11 221 11 221 15 593Values below are for participants in fully adjusted resultsAge at enrollment, mean years 56.6 56.6 56.66 56.66 56.64Sex (% females) 55.9 56.4 56.72 56.72 56.61Race (% white) 94.0 94.0 94.58 94.58 95.09Less than high school education, % 11.3 11.3 11.71 11.71 11.71Never smoked regularly, % 41.69 41.69 41.57Former smoker, % 33.25 33.25 33.67Former cigarette smoker, % 29.4 30.2 30.43 30.43 30.81Current smoker, % 25.06 25.06 24.76Current cigarette smoker, % 21.6 21.4 21.01 21.01 20.76Fine particles, mg/m3
Average 18.2 18.2 17.99 21.37 21.16SD 5.1 4.4 4.52 5.30 5.98Range 9.0-33.5 9.0-33.4 9.0-33.4 10.77-29.67 10.63-42.01
Abbreviations: CPS, Cancer Prevention Study; HEI, Health Effects Institute; IPN, Inhalable Particulate Network; PM2.5, fine particulate matter.
Enstrom 3
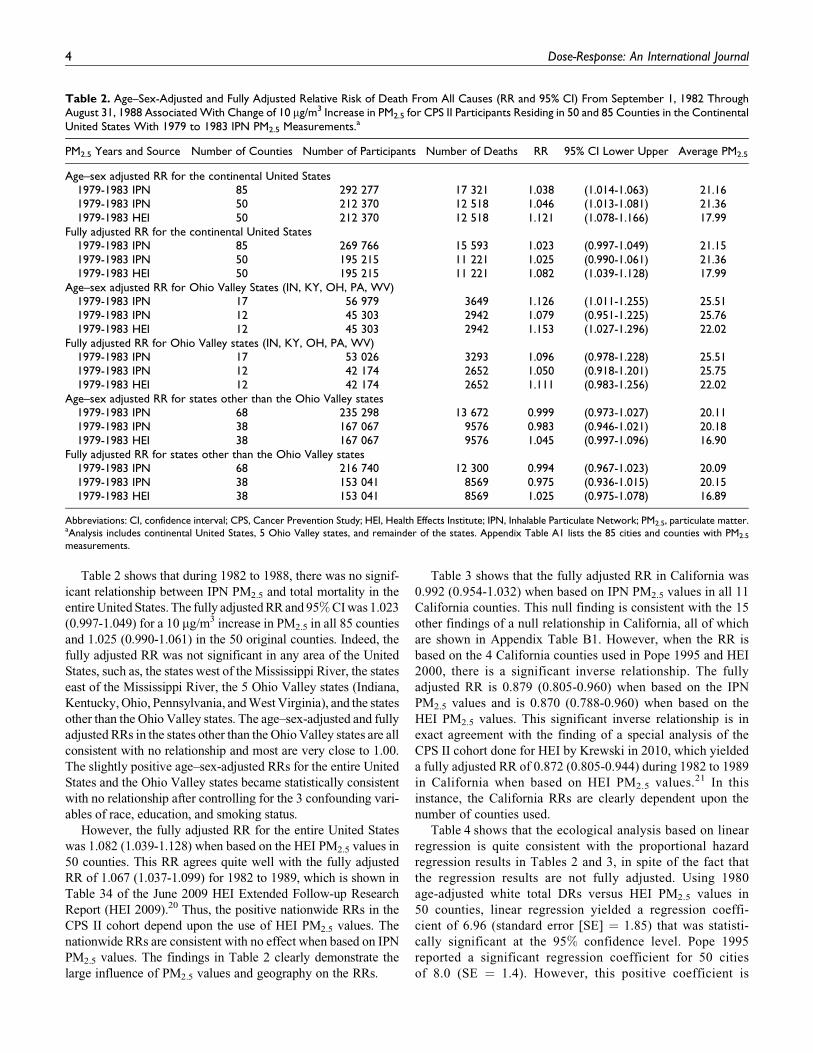
Table 2 shows that during 1982 to 1988, there was no signif-
icant relationship between IPN PM2.5 and total mortality in the
entire United States. The fully adjusted RR and 95% CI was 1.023
(0.997-1.049) for a 10 mg/m3 increase in PM2.5 in all 85 counties
and 1.025 (0.990-1.061) in the 50 original counties. Indeed, the
fully adjusted RR was not significant in any area of the United
States, such as, the states west of the Mississippi River, the states
east of the Mississippi River, the 5 Ohio Valley states (Indiana,
Kentucky, Ohio, Pennsylvania, and West Virginia), and the states
other than the Ohio Valley states. The age–sex-adjusted and fully
adjusted RRs in the states other than the Ohio Valley states are all
consistent with no relationship and most are very close to 1.00.
The slightly positive age–sex-adjusted RRs for the entire United
States and the Ohio Valley states became statistically consistent
with no relationship after controlling for the 3 confounding vari-
ables of race, education, and smoking status.
However, the fully adjusted RR for the entire United States
was 1.082 (1.039-1.128) when based on the HEI PM2.5 values in
50 counties. This RR agrees quite well with the fully adjusted
RR of 1.067 (1.037-1.099) for 1982 to 1989, which is shown in
Table 34 of the June 2009 HEI Extended Follow-up Research
Report (HEI 2009).20 Thus, the positive nationwide RRs in the
CPS II cohort depend upon the use of HEI PM2.5 values. The
nationwide RRs are consistent with no effect when based on IPN
PM2.5 values. The findings in Table 2 clearly demonstrate the
large influence of PM2.5 values and geography on the RRs.
Table 3 shows that the fully adjusted RR in California was
0.992 (0.954-1.032) when based on IPN PM2.5 values in all 11
California counties. This null finding is consistent with the 15
other findings of a null relationship in California, all of which
are shown in Appendix Table B1. However, when the RR is
based on the 4 California counties used in Pope 1995 and HEI
2000, there is a significant inverse relationship. The fully
adjusted RR is 0.879 (0.805-0.960) when based on the IPN
PM2.5 values and is 0.870 (0.788-0.960) when based on the
HEI PM2.5 values. This significant inverse relationship is in
exact agreement with the finding of a special analysis of the
CPS II cohort done for HEI by Krewski in 2010, which yielded
a fully adjusted RR of 0.872 (0.805-0.944) during 1982 to 1989
in California when based on HEI PM2.5 values.21 In this
instance, the California RRs are clearly dependent upon the
number of counties used.
Table 4 shows that the ecological analysis based on linear
regression is quite consistent with the proportional hazard
regression results in Tables 2 and 3, in spite of the fact that
the regression results are not fully adjusted. Using 1980
age-adjusted white total DRs versus HEI PM2.5 values in
50 counties, linear regression yielded a regression coeffi-
cient of 6.96 (standard error [SE] ¼ 1.85) that was statisti-
cally significant at the 95% confidence level. Pope 1995
reported a significant regression coefficient for 50 cities
of 8.0 (SE ¼ 1.4). However, this positive coefficient is
Table 2. Age–Sex-Adjusted and Fully Adjusted Relative Risk of Death From All Causes (RR and 95% CI) From September 1, 1982 ThroughAugust 31, 1988 Associated With Change of 10 mg/m3 Increase in PM2.5 for CPS II Participants Residing in 50 and 85 Counties in the ContinentalUnited States With 1979 to 1983 IPN PM2.5 Measurements.a
PM2.5 Years and Source Number of Counties Number of Participants Number of Deaths RR 95% CI Lower Upper Average PM2.5
Age–sex adjusted RR for the continental United States1979-1983 IPN 85 292 277 17 321 1.038 (1.014-1.063) 21.161979-1983 IPN 50 212 370 12 518 1.046 (1.013-1.081) 21.361979-1983 HEI 50 212 370 12 518 1.121 (1.078-1.166) 17.99
Fully adjusted RR for the continental United States1979-1983 IPN 85 269 766 15 593 1.023 (0.997-1.049) 21.151979-1983 IPN 50 195 215 11 221 1.025 (0.990-1.061) 21.361979-1983 HEI 50 195 215 11 221 1.082 (1.039-1.128) 17.99
Age–sex adjusted RR for Ohio Valley States (IN, KY, OH, PA, WV)1979-1983 IPN 17 56 979 3649 1.126 (1.011-1.255) 25.511979-1983 IPN 12 45 303 2942 1.079 (0.951-1.225) 25.761979-1983 HEI 12 45 303 2942 1.153 (1.027-1.296) 22.02
Fully adjusted RR for Ohio Valley states (IN, KY, OH, PA, WV)1979-1983 IPN 17 53 026 3293 1.096 (0.978-1.228) 25.511979-1983 IPN 12 42 174 2652 1.050 (0.918-1.201) 25.751979-1983 HEI 12 42 174 2652 1.111 (0.983-1.256) 22.02
Age–sex adjusted RR for states other than the Ohio Valley states1979-1983 IPN 68 235 298 13 672 0.999 (0.973-1.027) 20.111979-1983 IPN 38 167 067 9576 0.983 (0.946-1.021) 20.181979-1983 HEI 38 167 067 9576 1.045 (0.997-1.096) 16.90
Fully adjusted RR for states other than the Ohio Valley states1979-1983 IPN 68 216 740 12 300 0.994 (0.967-1.023) 20.091979-1983 IPN 38 153 041 8569 0.975 (0.936-1.015) 20.151979-1983 HEI 38 153 041 8569 1.025 (0.975-1.078) 16.89
Abbreviations: CI, confidence interval; CPS, Cancer Prevention Study; HEI, Health Effects Institute; IPN, Inhalable Particulate Network; PM2.5, particulate matter.aAnalysis includes continental United States, 5 Ohio Valley states, and remainder of the states. Appendix Table A1 lists the 85 cities and counties with PM2.5
measurements.
4 Dose-Response: An International Journal
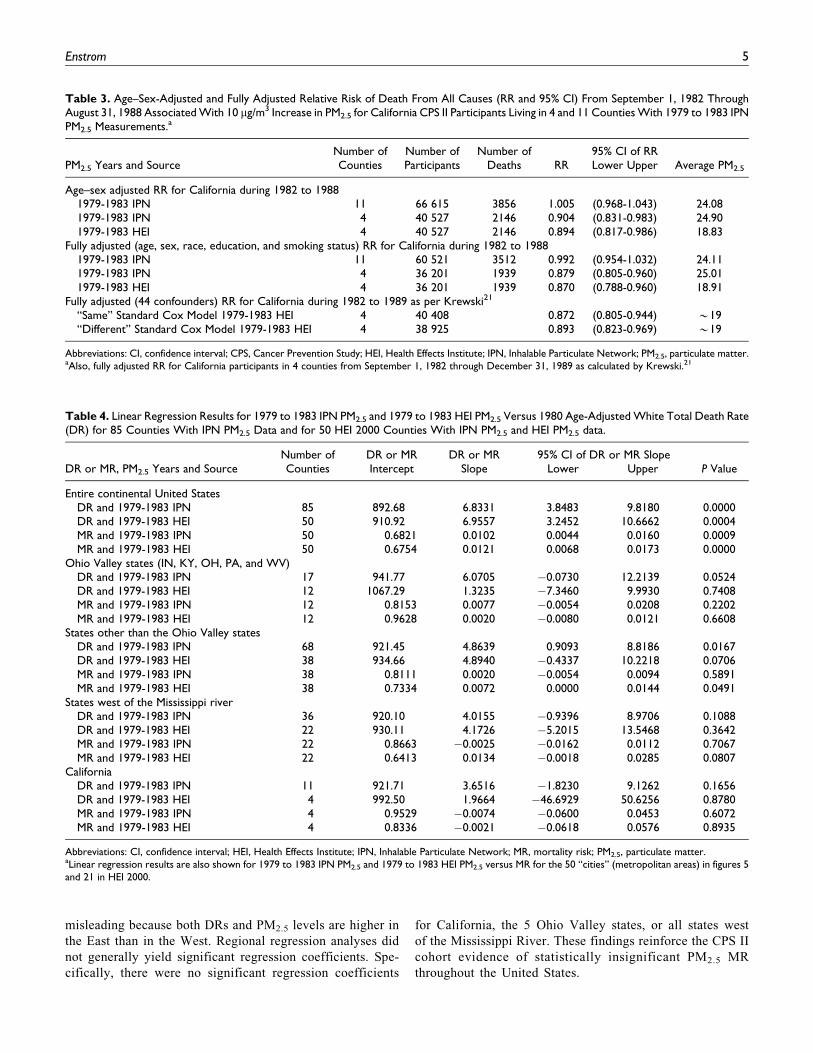
misleading because both DRs and PM2.5 levels are higher in
the East than in the West. Regional regression analyses did
not generally yield significant regression coefficients. Spe-
cifically, there were no significant regression coefficients
for California, the 5 Ohio Valley states, or all states west
of the Mississippi River. These findings reinforce the CPS II
cohort evidence of statistically insignificant PM2.5 MR
throughout the United States.
Table 4. Linear Regression Results for 1979 to 1983 IPN PM2.5 and 1979 to 1983 HEI PM2.5 Versus 1980 Age-Adjusted White Total Death Rate(DR) for 85 Counties With IPN PM2.5 Data and for 50 HEI 2000 Counties With IPN PM2.5 and HEI PM2.5 data.
DR or MR, PM2.5 Years and SourceNumber ofCounties
DR or MRIntercept
DR or MRSlope Lower
95% CI of DR or MR SlopeUpper P Value
Entire continental United StatesDR and 1979-1983 IPN 85 892.68 6.8331 3.8483 9.8180 0.0000DR and 1979-1983 HEI 50 910.92 6.9557 3.2452 10.6662 0.0004MR and 1979-1983 IPN 50 0.6821 0.0102 0.0044 0.0160 0.0009MR and 1979-1983 HEI 50 0.6754 0.0121 0.0068 0.0173 0.0000
Ohio Valley states (IN, KY, OH, PA, and WV)DR and 1979-1983 IPN 17 941.77 6.0705 �0.0730 12.2139 0.0524DR and 1979-1983 HEI 12 1067.29 1.3235 �7.3460 9.9930 0.7408MR and 1979-1983 IPN 12 0.8153 0.0077 �0.0054 0.0208 0.2202MR and 1979-1983 HEI 12 0.9628 0.0020 �0.0080 0.0121 0.6608
States other than the Ohio Valley statesDR and 1979-1983 IPN 68 921.45 4.8639 0.9093 8.8186 0.0167DR and 1979-1983 HEI 38 934.66 4.8940 �0.4337 10.2218 0.0706MR and 1979-1983 IPN 38 0.8111 0.0020 �0.0054 0.0094 0.5891MR and 1979-1983 HEI 38 0.7334 0.0072 0.0000 0.0144 0.0491
States west of the Mississippi riverDR and 1979-1983 IPN 36 920.10 4.0155 �0.9396 8.9706 0.1088DR and 1979-1983 HEI 22 930.11 4.1726 �5.2015 13.5468 0.3642MR and 1979-1983 IPN 22 0.8663 �0.0025 �0.0162 0.0112 0.7067MR and 1979-1983 HEI 22 0.6413 0.0134 �0.0018 0.0285 0.0807
CaliforniaDR and 1979-1983 IPN 11 921.71 3.6516 �1.8230 9.1262 0.1656DR and 1979-1983 HEI 4 992.50 1.9664 �46.6929 50.6256 0.8780MR and 1979-1983 IPN 4 0.9529 �0.0074 �0.0600 0.0453 0.6072MR and 1979-1983 HEI 4 0.8336 �0.0021 �0.0618 0.0576 0.8935
Abbreviations: CI, confidence interval; HEI, Health Effects Institute; IPN, Inhalable Particulate Network; MR, mortality risk; PM2.5, particulate matter.aLinear regression results are also shown for 1979 to 1983 IPN PM2.5 and 1979 to 1983 HEI PM2.5 versus MR for the 50 “cities” (metropolitan areas) in figures 5and 21 in HEI 2000.
Table 3. Age–Sex-Adjusted and Fully Adjusted Relative Risk of Death From All Causes (RR and 95% CI) From September 1, 1982 ThroughAugust 31, 1988 Associated With 10 mg/m3 Increase in PM2.5 for California CPS II Participants Living in 4 and 11 Counties With 1979 to 1983 IPNPM2.5 Measurements.a
PM2.5 Years and SourceNumber ofCounties
Number ofParticipants
Number ofDeaths RR
95% CI of RRLower Upper Average PM2.5
Age–sex adjusted RR for California during 1982 to 19881979-1983 IPN 11 66 615 3856 1.005 (0.968-1.043) 24.081979-1983 IPN 4 40 527 2146 0.904 (0.831-0.983) 24.901979-1983 HEI 4 40 527 2146 0.894 (0.817-0.986) 18.83
Fully adjusted (age, sex, race, education, and smoking status) RR for California during 1982 to 19881979-1983 IPN 11 60 521 3512 0.992 (0.954-1.032) 24.111979-1983 IPN 4 36 201 1939 0.879 (0.805-0.960) 25.011979-1983 HEI 4 36 201 1939 0.870 (0.788-0.960) 18.91
Fully adjusted (44 confounders) RR for California during 1982 to 1989 as per Krewski21
“Same” Standard Cox Model 1979-1983 HEI 4 40 408 0.872 (0.805-0.944) *19“Different” Standard Cox Model 1979-1983 HEI 4 38 925 0.893 (0.823-0.969) *19
Abbreviations: CI, confidence interval; CPS, Cancer Prevention Study; HEI, Health Effects Institute; IPN, Inhalable Particulate Network; PM2.5, particulate matter.aAlso, fully adjusted RR for California participants in 4 counties from September 1, 1982 through December 31, 1989 as calculated by Krewski.21
Enstrom 5
Conclusion
This independent analysis of the CPS II cohort found that there
was no significant relationship between PM2.5 and death from
all causes during 1982 to 1988, when the best available PM2.5
measurements were used for the 50 original counties and for all
85 counties with PM2.5 data and CPS II participants. However,
a positive relationship was found when the HEI PM2.5 measure-
ments were used for the 50 original counties, consistent with
the findings in Pope 1995 and HEI 2000. This null and positive
evidence demonstrates that the PM2.5 mortality relationship is
not robust and is quite sensitive to the PM2.5 data and CPS II
participants used in the analysis.
Furthermore, the following statement on page 80 of HEI
2000 raises serious doubts about the quality of the air pollu-
tion data used in Pope 1995 and HEI 2000: “AUDIT OF AIR
QUALITY DATA. The ACS study was not originally
designed as an air pollution study. The air quality monitoring
data used for the ACS analyses came from various sources,
some of which are now technologically difficult to access.
Documentation of the statistical reduction procedures has
been lost. Summary statistics for different groups of standard
metropolitan statistical areas had been derived by different
investigators. These data sources do not indicate whether the
tabulated values refer to all or a subset of monitors in a region
or whether they represent means or medians.”7
The Pope 1995 and HEI 2000 analyses were based on 50
median PM2.5 values shown in Appendix A of the 1988 Broo-
khaven National Laboratory Report 52122 by Lipfert et al.22
These analyses did not use or cite the high quality and widely
known EPA IPN PM2.5 data in spite of the fact that these data
have been available in 2 detailed EPA reports since 1986.16,17
Lipfert informed HEI about the IPN data in 1998: “During the
early stages of the Reanalysis Project, I notified HEI and the
reanalysis contractors of the availability of an updated version
of the IPN data from EPA, which they apparently obtained.
This version includes more locations and a slightly longer
period of time. It does not appear that the newer IPN data are
listed in Appendix G, and it is thus not possible to confirm if
SMSA assignments were made properly.”23
Thus, the HEI Reanalysis Team failed to properly
“evaluate the sensitivity of the original findings to the indi-
cators of exposure to fine particle air pollution used by the
Original Investigators” and failed to select “all participants
who lived within each MA for which data on sulfate or fine
particle pollution were available.”7 Furthermore, HEI 2009
did not use these data even though the investigators were
aware of my 2005 null PM2.5 mortality findings in Califor-
nia,8 which were based on the IPN data for 11 California
counties, instead of the 4 California counties used in Pope
1995 and HEI 2000. Indeed, HEI 2009 did not cite my 2005
findings, in spite of my personal discussion of these findings
with Pope, Jerrett, and Burnett on July 11, 2008.24 Finally,
HEI 2009 did not acknowledge or address my 2006 concerns
about the geographic variation in PM2.5 MR clearly shown in
HEI 2000 Figure 21,7 which is included here as Appendix
Figure C1. HEI 2009 entirely avoided the issue of geographic
variation in PM2.5 MR and omitted the equivalent to HEI 2000
Figure 21.
Since 2002, HEI has repeatedly refused to provide the city-
specific PM2.5-related MR for the 50 cities included in HEI
2000 Figure 21.15 I estimated these MRs in 2010 based on
visual measurements of HEI 2000 Figure 5, and my estimates
are shown in Appendix Table A1.25 Figure 21 and its MRs
represented early evidence that there was no PM2.5-related
MR in California. Appendix Table B1 shows the now over-
whelming 2000 to 2016 evidence from 6 different cohorts
that there is no relationship between PM2.5 and total mor-
tality in California. Indeed, the weighted average RR of the
latest results from the 6 California cohorts is RR ¼ 0.999
(0.988-1.010).26
The authors of the CPS II PM2.5 mortality publications, which
began with Pope 1995, have faced original criticism,2-4 my crit-
icism,6-10,14,15 and the criticism of the HSSTC and its sub-
poena.11-13 Now, my null findings represent a direct challenge
to the positive findings of Pope 1995. All of this criticism is
relevant to the EPA claim that PM2.5 has a causal relationship
to total mortality. The authors of Pope 1995, HEI 2000, and
HEI 2009 need to promptly address my findings, as well as the
earlier criticism. Then, they need to cooperate with critics on
transparent air pollution epidemiology analyses of the CPS II
cohort data.
Also, major scientific journals like the New England Jour-
nal of Medicine (NEJM) and Science, which have consistently
written about the positive relationship between PM2.5 and
total mortality, need to publish evidence of no relationship
when strong null evidence is submitted to them. In 2015,
Science immediately rejected without peer reviewing 3 ver-
sions of strong evidence that PM2.5 does not cause premature
deaths.5 In 2016, Science immediately rejected without peer
reviewing this article. Indeed, this article was rejected by
NEJM, Science, and 5 other major journals, as described in
a detailed compilation of relevant correspondence.27 Most
troubling is the rejection by the American Journal of Respira-
tory and Clinical Care Medicine, which has published Pope
1995 and several other PM2.5 mortality articles based on the
CPS II cohort data.
In summary, the null CPS II PM2.5 mortality findings in this
article directly challenge the original positive Pope 1995 find-
ings, and they raise serious doubts about the CPS II epidemio-
logic evidence supporting the PM2.5 NAAQS. These findings
demonstrate the importance of independent and transparent
analysis of underlying data. Finally, these findings provide
strong justification for further independent analysis of CPS II
cohort data.
6 Dose-Response: An International Journal
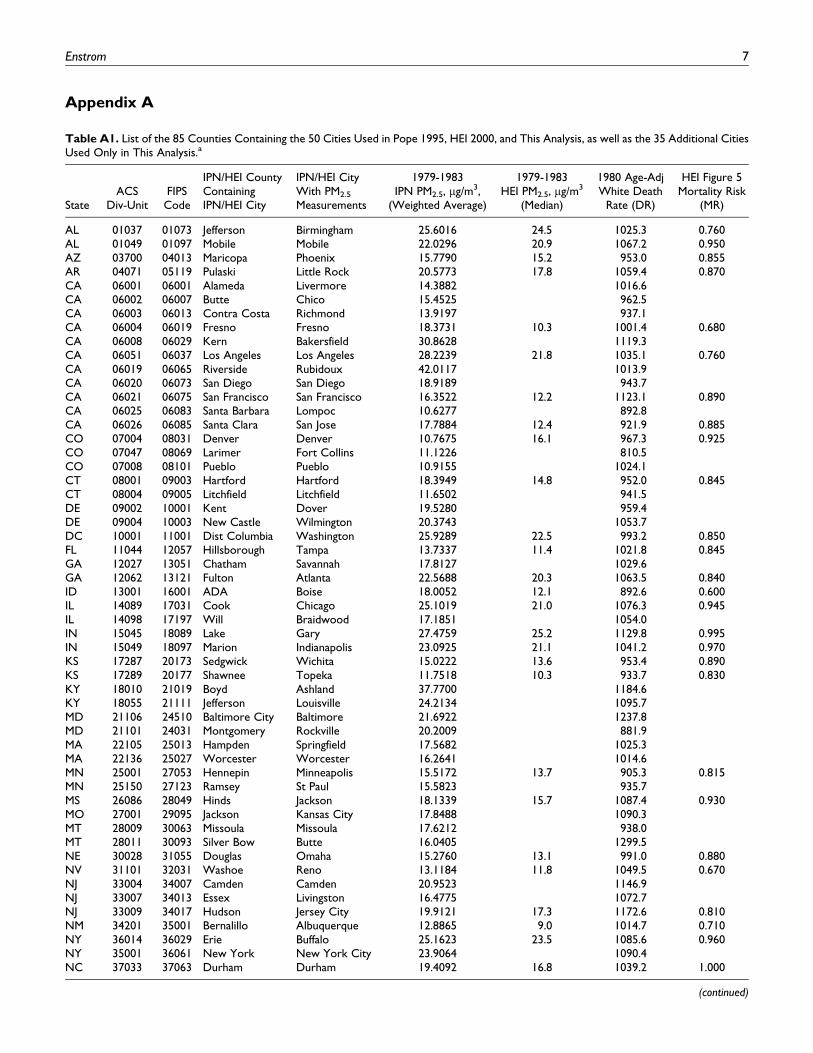
Appendix A
Table A1. List of the 85 Counties Containing the 50 Cities Used in Pope 1995, HEI 2000, and This Analysis, as well as the 35 Additional CitiesUsed Only in This Analysis.a
StateACS
Div-UnitFIPSCode
IPN/HEI CountyContainingIPN/HEI City
IPN/HEI CityWith PM2.5
Measurements
1979-1983IPN PM2.5, mg/m3,
(Weighted Average)
1979-1983HEI PM2.5, mg/m3
(Median)
1980 Age-AdjWhite Death
Rate (DR)
HEI Figure 5Mortality Risk
(MR)
AL 01037 01073 Jefferson Birmingham 25.6016 24.5 1025.3 0.760AL 01049 01097 Mobile Mobile 22.0296 20.9 1067.2 0.950AZ 03700 04013 Maricopa Phoenix 15.7790 15.2 953.0 0.855AR 04071 05119 Pulaski Little Rock 20.5773 17.8 1059.4 0.870CA 06001 06001 Alameda Livermore 14.3882 1016.6CA 06002 06007 Butte Chico 15.4525 962.5CA 06003 06013 Contra Costa Richmond 13.9197 937.1CA 06004 06019 Fresno Fresno 18.3731 10.3 1001.4 0.680CA 06008 06029 Kern Bakersfield 30.8628 1119.3CA 06051 06037 Los Angeles Los Angeles 28.2239 21.8 1035.1 0.760CA 06019 06065 Riverside Rubidoux 42.0117 1013.9CA 06020 06073 San Diego San Diego 18.9189 943.7CA 06021 06075 San Francisco San Francisco 16.3522 12.2 1123.1 0.890CA 06025 06083 Santa Barbara Lompoc 10.6277 892.8CA 06026 06085 Santa Clara San Jose 17.7884 12.4 921.9 0.885CO 07004 08031 Denver Denver 10.7675 16.1 967.3 0.925CO 07047 08069 Larimer Fort Collins 11.1226 810.5CO 07008 08101 Pueblo Pueblo 10.9155 1024.1CT 08001 09003 Hartford Hartford 18.3949 14.8 952.0 0.845CT 08004 09005 Litchfield Litchfield 11.6502 941.5DE 09002 10001 Kent Dover 19.5280 959.4DE 09004 10003 New Castle Wilmington 20.3743 1053.7DC 10001 11001 Dist Columbia Washington 25.9289 22.5 993.2 0.850FL 11044 12057 Hillsborough Tampa 13.7337 11.4 1021.8 0.845GA 12027 13051 Chatham Savannah 17.8127 1029.6GA 12062 13121 Fulton Atlanta 22.5688 20.3 1063.5 0.840ID 13001 16001 ADA Boise 18.0052 12.1 892.6 0.600IL 14089 17031 Cook Chicago 25.1019 21.0 1076.3 0.945IL 14098 17197 Will Braidwood 17.1851 1054.0IN 15045 18089 Lake Gary 27.4759 25.2 1129.8 0.995IN 15049 18097 Marion Indianapolis 23.0925 21.1 1041.2 0.970KS 17287 20173 Sedgwick Wichita 15.0222 13.6 953.4 0.890KS 17289 20177 Shawnee Topeka 11.7518 10.3 933.7 0.830KY 18010 21019 Boyd Ashland 37.7700 1184.6KY 18055 21111 Jefferson Louisville 24.2134 1095.7MD 21106 24510 Baltimore City Baltimore 21.6922 1237.8MD 21101 24031 Montgomery Rockville 20.2009 881.9MA 22105 25013 Hampden Springfield 17.5682 1025.3MA 22136 25027 Worcester Worcester 16.2641 1014.6MN 25001 27053 Hennepin Minneapolis 15.5172 13.7 905.3 0.815MN 25150 27123 Ramsey St Paul 15.5823 935.7MS 26086 28049 Hinds Jackson 18.1339 15.7 1087.4 0.930MO 27001 29095 Jackson Kansas City 17.8488 1090.3MT 28009 30063 Missoula Missoula 17.6212 938.0MT 28011 30093 Silver Bow Butte 16.0405 1299.5NE 30028 31055 Douglas Omaha 15.2760 13.1 991.0 0.880NV 31101 32031 Washoe Reno 13.1184 11.8 1049.5 0.670NJ 33004 34007 Camden Camden 20.9523 1146.9NJ 33007 34013 Essex Livingston 16.4775 1072.7NJ 33009 34017 Hudson Jersey City 19.9121 17.3 1172.6 0.810NM 34201 35001 Bernalillo Albuquerque 12.8865 9.0 1014.7 0.710NY 36014 36029 Erie Buffalo 25.1623 23.5 1085.6 0.960NY 35001 36061 New York New York City 23.9064 1090.4NC 37033 37063 Durham Durham 19.4092 16.8 1039.2 1.000
(continued)
Enstrom 7
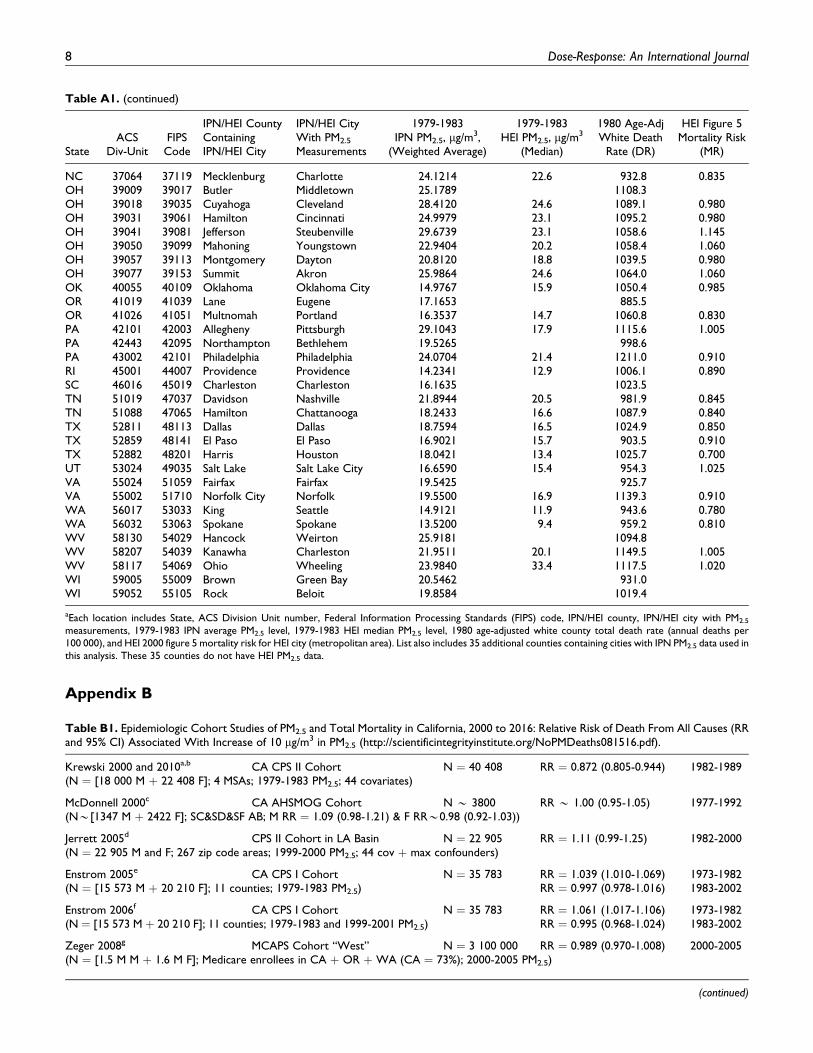
Appendix B
Table A1. (continued)
StateACS
Div-UnitFIPSCode
IPN/HEI CountyContainingIPN/HEI City
IPN/HEI CityWith PM2.5
Measurements
1979-1983IPN PM2.5, mg/m3,
(Weighted Average)
1979-1983HEI PM2.5, mg/m3
(Median)
1980 Age-AdjWhite Death
Rate (DR)
HEI Figure 5Mortality Risk
(MR)
NC 37064 37119 Mecklenburg Charlotte 24.1214 22.6 932.8 0.835OH 39009 39017 Butler Middletown 25.1789 1108.3OH 39018 39035 Cuyahoga Cleveland 28.4120 24.6 1089.1 0.980OH 39031 39061 Hamilton Cincinnati 24.9979 23.1 1095.2 0.980OH 39041 39081 Jefferson Steubenville 29.6739 23.1 1058.6 1.145OH 39050 39099 Mahoning Youngstown 22.9404 20.2 1058.4 1.060OH 39057 39113 Montgomery Dayton 20.8120 18.8 1039.5 0.980OH 39077 39153 Summit Akron 25.9864 24.6 1064.0 1.060OK 40055 40109 Oklahoma Oklahoma City 14.9767 15.9 1050.4 0.985OR 41019 41039 Lane Eugene 17.1653 885.5OR 41026 41051 Multnomah Portland 16.3537 14.7 1060.8 0.830PA 42101 42003 Allegheny Pittsburgh 29.1043 17.9 1115.6 1.005PA 42443 42095 Northampton Bethlehem 19.5265 998.6PA 43002 42101 Philadelphia Philadelphia 24.0704 21.4 1211.0 0.910RI 45001 44007 Providence Providence 14.2341 12.9 1006.1 0.890SC 46016 45019 Charleston Charleston 16.1635 1023.5TN 51019 47037 Davidson Nashville 21.8944 20.5 981.9 0.845TN 51088 47065 Hamilton Chattanooga 18.2433 16.6 1087.9 0.840TX 52811 48113 Dallas Dallas 18.7594 16.5 1024.9 0.850TX 52859 48141 El Paso El Paso 16.9021 15.7 903.5 0.910TX 52882 48201 Harris Houston 18.0421 13.4 1025.7 0.700UT 53024 49035 Salt Lake Salt Lake City 16.6590 15.4 954.3 1.025VA 55024 51059 Fairfax Fairfax 19.5425 925.7VA 55002 51710 Norfolk City Norfolk 19.5500 16.9 1139.3 0.910WA 56017 53033 King Seattle 14.9121 11.9 943.6 0.780WA 56032 53063 Spokane Spokane 13.5200 9.4 959.2 0.810WV 58130 54029 Hancock Weirton 25.9181 1094.8WV 58207 54039 Kanawha Charleston 21.9511 20.1 1149.5 1.005WV 58117 54069 Ohio Wheeling 23.9840 33.4 1117.5 1.020WI 59005 55009 Brown Green Bay 20.5462 931.0WI 59052 55105 Rock Beloit 19.8584 1019.4
aEach location includes State, ACS Division Unit number, Federal Information Processing Standards (FIPS) code, IPN/HEI county, IPN/HEI city with PM2.5
measurements, 1979-1983 IPN average PM2.5 level, 1979-1983 HEI median PM2.5 level, 1980 age-adjusted white county total death rate (annual deaths per100 000), and HEI 2000 figure 5 mortality risk for HEI city (metropolitan area). List also includes 35 additional counties containing cities with IPN PM2.5 data used inthis analysis. These 35 counties do not have HEI PM2.5 data.
Table B1. Epidemiologic Cohort Studies of PM2.5 and Total Mortality in California, 2000 to 2016: Relative Risk of Death From All Causes (RRand 95% CI) Associated With Increase of 10 mg/m3 in PM2.5 (http://scientificintegrityinstitute.org/NoPMDeaths081516.pdf).
Krewski 2000 and 2010a,b CA CPS II Cohort N ¼ 40 408 RR ¼ 0.872 (0.805-0.944) 1982-1989(N ¼ [18 000 M þ 22 408 F]; 4 MSAs; 1979-1983 PM2.5; 44 covariates)
McDonnell 2000c CA AHSMOG Cohort N * 3800 RR * 1.00 (0.95-1.05) 1977-1992(N*[1347 M þ 2422 F]; SC&SD&SF AB; M RR ¼ 1.09 (0.98-1.21) & F RR*0.98 (0.92-1.03))
Jerrett 2005d CPS II Cohort in LA Basin N ¼ 22 905 RR ¼ 1.11 (0.99-1.25) 1982-2000(N ¼ 22 905 M and F; 267 zip code areas; 1999-2000 PM2.5; 44 cov þ max confounders)
Enstrom 2005e CA CPS I Cohort N ¼ 35 783 RR ¼ 1.039 (1.010-1.069) 1973-1982(N ¼ [15 573 M þ 20 210 F]; 11 counties; 1979-1983 PM2.5) RR ¼ 0.997 (0.978-1.016) 1983-2002
Enstrom 2006f CA CPS I Cohort N ¼ 35 783 RR ¼ 1.061 (1.017-1.106) 1973-1982(N ¼ [15 573 M þ 20 210 F]; 11 counties; 1979-1983 and 1999-2001 PM2.5) RR ¼ 0.995 (0.968-1.024) 1983-2002
Zeger 2008g MCAPS Cohort “West” N ¼ 3 100 000 RR ¼ 0.989 (0.970-1.008) 2000-2005(N ¼ [1.5 M M þ 1.6 M F]; Medicare enrollees in CA þ OR þWA (CA ¼ 73%); 2000-2005 PM2.5)
(continued)
8 Dose-Response: An International Journal
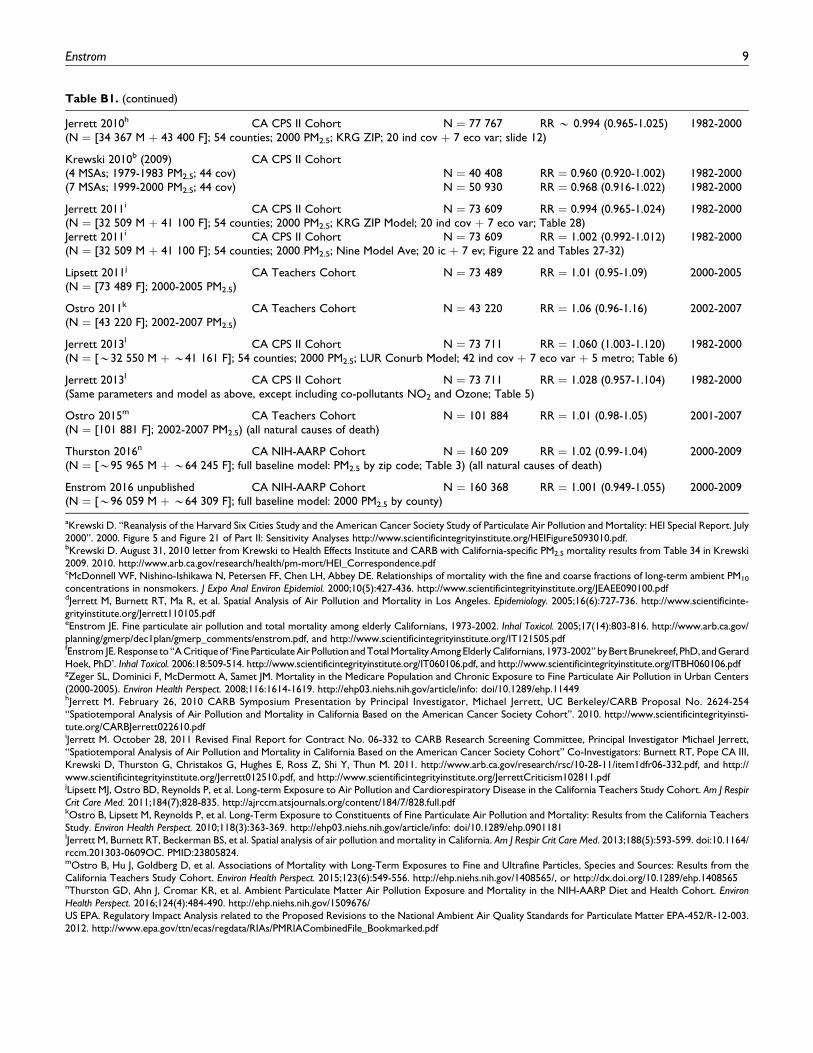
Table B1. (continued)
Jerrett 2010h CA CPS II Cohort N ¼ 77 767 RR * 0.994 (0.965-1.025) 1982-2000(N ¼ [34 367 M þ 43 400 F]; 54 counties; 2000 PM2.5; KRG ZIP; 20 ind cov þ 7 eco var; slide 12)
Krewski 2010b (2009) CA CPS II Cohort(4 MSAs; 1979-1983 PM2.5; 44 cov) N ¼ 40 408 RR ¼ 0.960 (0.920-1.002) 1982-2000(7 MSAs; 1999-2000 PM2.5; 44 cov) N ¼ 50 930 RR ¼ 0.968 (0.916-1.022) 1982-2000
Jerrett 2011i CA CPS II Cohort N ¼ 73 609 RR ¼ 0.994 (0.965-1.024) 1982-2000(N ¼ [32 509 M þ 41 100 F]; 54 counties; 2000 PM2.5; KRG ZIP Model; 20 ind cov þ 7 eco var; Table 28)Jerrett 2011i CA CPS II Cohort N ¼ 73 609 RR ¼ 1.002 (0.992-1.012) 1982-2000(N ¼ [32 509 M þ 41 100 F]; 54 counties; 2000 PM2.5; Nine Model Ave; 20 ic þ 7 ev; Figure 22 and Tables 27-32)
Lipsett 2011j CA Teachers Cohort N ¼ 73 489 RR ¼ 1.01 (0.95-1.09) 2000-2005(N ¼ [73 489 F]; 2000-2005 PM2.5)
Ostro 2011k CA Teachers Cohort N ¼ 43 220 RR ¼ 1.06 (0.96-1.16) 2002-2007(N ¼ [43 220 F]; 2002-2007 PM2.5)
Jerrett 2013l CA CPS II Cohort N ¼ 73 711 RR ¼ 1.060 (1.003-1.120) 1982-2000(N ¼ [*32 550 M þ *41 161 F]; 54 counties; 2000 PM2.5; LUR Conurb Model; 42 ind cov þ 7 eco var þ 5 metro; Table 6)
Jerrett 2013l CA CPS II Cohort N ¼ 73 711 RR ¼ 1.028 (0.957-1.104) 1982-2000(Same parameters and model as above, except including co-pollutants NO2 and Ozone; Table 5)
Ostro 2015m CA Teachers Cohort N ¼ 101 884 RR ¼ 1.01 (0.98-1.05) 2001-2007(N ¼ [101 881 F]; 2002-2007 PM2.5) (all natural causes of death)
Thurston 2016n CA NIH-AARP Cohort N ¼ 160 209 RR ¼ 1.02 (0.99-1.04) 2000-2009(N ¼ [*95 965 M þ *64 245 F]; full baseline model: PM2.5 by zip code; Table 3) (all natural causes of death)
Enstrom 2016 unpublished CA NIH-AARP Cohort N ¼ 160 368 RR ¼ 1.001 (0.949-1.055) 2000-2009(N ¼ [*96 059 M þ *64 309 F]; full baseline model: 2000 PM2.5 by county)
aKrewski D. “Reanalysis of the Harvard Six Cities Study and the American Cancer Society Study of Particulate Air Pollution and Mortality: HEI Special Report. July2000”. 2000. Figure 5 and Figure 21 of Part II: Sensitivity Analyses http://www.scientificintegrityinstitute.org/HEIFigure5093010.pdf.bKrewski D. August 31, 2010 letter from Krewski to Health Effects Institute and CARB with California-specific PM2.5 mortality results from Table 34 in Krewski2009. 2010. http://www.arb.ca.gov/research/health/pm-mort/HEI_Correspondence.pdfcMcDonnell WF, Nishino-Ishikawa N, Petersen FF, Chen LH, Abbey DE. Relationships of mortality with the fine and coarse fractions of long-term ambient PM10
concentrations in nonsmokers. J Expo Anal Environ Epidemiol. 2000;10(5):427-436. http://www.scientificintegrityinstitute.org/JEAEE090100.pdfdJerrett M, Burnett RT, Ma R, et al. Spatial Analysis of Air Pollution and Mortality in Los Angeles. Epidemiology. 2005;16(6):727-736. http://www.scientificinte-grityinstitute.org/Jerrett110105.pdfeEnstrom JE. Fine particulate air pollution and total mortality among elderly Californians, 1973-2002. Inhal Toxicol. 2005;17(14):803-816. http://www.arb.ca.gov/planning/gmerp/dec1plan/gmerp_comments/enstrom.pdf, and http://www.scientificintegrityinstitute.org/IT121505.pdffEnstrom JE. Response to“A Critiqueof ‘FineParticulate Air Pollution and Total Mortality Among Elderly Californians, 1973-2002” byBertBrunekreef, PhD, and GerardHoek, PhD’. Inhal Toxicol. 2006:18:509-514. http://www.scientificintegrityinstitute.org/IT060106.pdf, and http://www.scientificintegrityinstitute.org/ITBH060106.pdfgZeger SL, Dominici F, McDermott A, Samet JM. Mortality in the Medicare Population and Chronic Exposure to Fine Particulate Air Pollution in Urban Centers(2000-2005). Environ Health Perspect. 2008;116:1614-1619. http://ehp03.niehs.nih.gov/article/info: doi/10.1289/ehp.11449hJerrett M. February 26, 2010 CARB Symposium Presentation by Principal Investigator, Michael Jerrett, UC Berkeley/CARB Proposal No. 2624-254“Spatiotemporal Analysis of Air Pollution and Mortality in California Based on the American Cancer Society Cohort”. 2010. http://www.scientificintegrityinsti-tute.org/CARBJerrett022610.pdfiJerrett M. October 28, 2011 Revised Final Report for Contract No. 06-332 to CARB Research Screening Committee, Principal Investigator Michael Jerrett,“Spatiotemporal Analysis of Air Pollution and Mortality in California Based on the American Cancer Society Cohort” Co-Investigators: Burnett RT, Pope CA III,Krewski D, Thurston G, Christakos G, Hughes E, Ross Z, Shi Y, Thun M. 2011. http://www.arb.ca.gov/research/rsc/10-28-11/item1dfr06-332.pdf, and http://www.scientificintegrityinstitute.org/Jerrett012510.pdf, and http://www.scientificintegrityinstitute.org/JerrettCriticism102811.pdfjLipsett MJ, Ostro BD, Reynolds P, et al. Long-term Exposure to Air Pollution and Cardiorespiratory Disease in the California Teachers Study Cohort. Am J RespirCrit Care Med. 2011;184(7);828-835. http://ajrccm.atsjournals.org/content/184/7/828.full.pdfkOstro B, Lipsett M, Reynolds P, et al. Long-Term Exposure to Constituents of Fine Particulate Air Pollution and Mortality: Results from the California TeachersStudy. Environ Health Perspect. 2010;118(3):363-369. http://ehp03.niehs.nih.gov/article/info: doi/10.1289/ehp.0901181lJerrett M, Burnett RT, Beckerman BS, et al. Spatial analysis of air pollution and mortality in California. Am J Respir Crit Care Med. 2013;188(5):593-599. doi:10.1164/rccm.201303-0609OC. PMID:23805824.mOstro B, Hu J, Goldberg D, et al. Associations of Mortality with Long-Term Exposures to Fine and Ultrafine Particles, Species and Sources: Results from theCalifornia Teachers Study Cohort. Environ Health Perspect. 2015;123(6):549-556. http://ehp.niehs.nih.gov/1408565/, or http://dx.doi.org/10.1289/ehp.1408565nThurston GD, Ahn J, Cromar KR, et al. Ambient Particulate Matter Air Pollution Exposure and Mortality in the NIH-AARP Diet and Health Cohort. EnvironHealth Perspect. 2016;124(4):484-490. http://ehp.niehs.nih.gov/1509676/US EPA. Regulatory Impact Analysis related to the Proposed Revisions to the National Ambient Air Quality Standards for Particulate Matter EPA-452/R-12-003.2012. http://www.epa.gov/ttn/ecas/regdata/RIAs/PMRIACombinedFile_Bookmarked.pdf
Enstrom 9
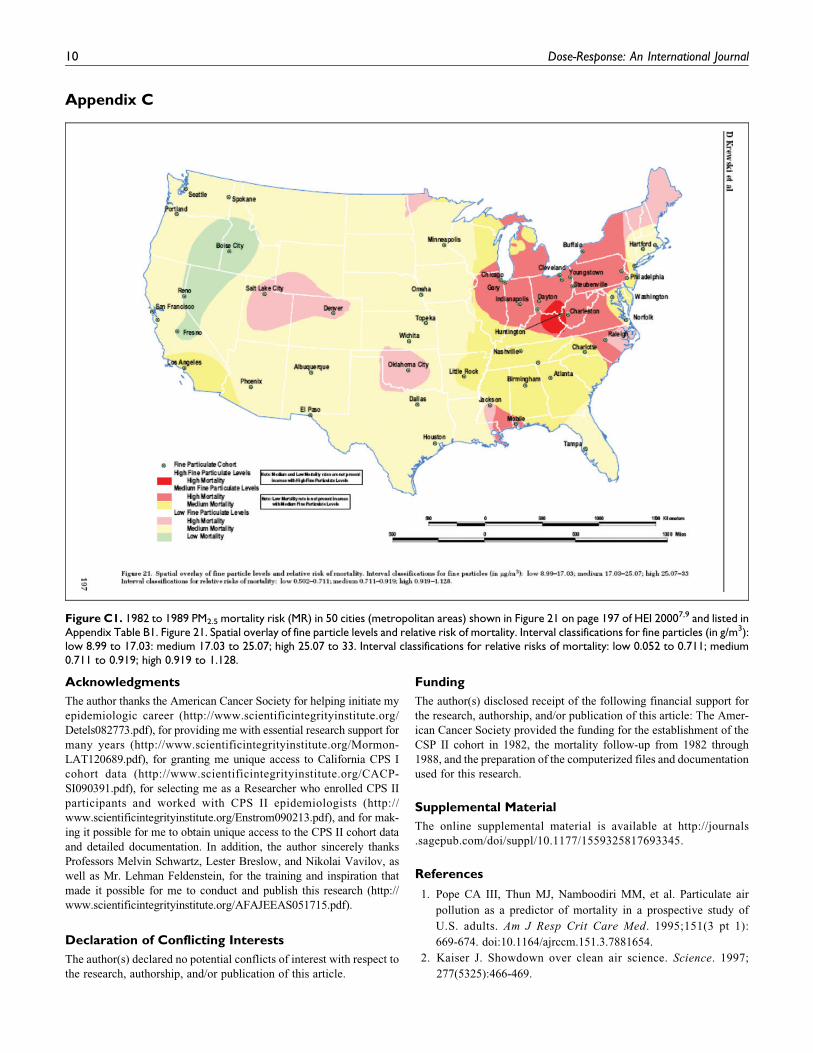
Appendix C
Acknowledgments
The author thanks the American Cancer Society for helping initiate my
epidemiologic career (http://www.scientificintegrityinstitute.org/
Detels082773.pdf), for providing me with essential research support for
many years (http://www.scientificintegrityinstitute.org/Mormon-
LAT120689.pdf), for granting me unique access to California CPS I
cohort data (http://www.scientificintegrityinstitute.org/CACP-
SI090391.pdf), for selecting me as a Researcher who enrolled CPS II
participants and worked with CPS II epidemiologists (http://
www.scientificintegrityinstitute.org/Enstrom090213.pdf), and for mak-
ing it possible for me to obtain unique access to the CPS II cohort data
and detailed documentation. In addition, the author sincerely thanks
Professors Melvin Schwartz, Lester Breslow, and Nikolai Vavilov, as
well as Mr. Lehman Feldenstein, for the training and inspiration that
made it possible for me to conduct and publish this research (http://
www.scientificintegrityinstitute.org/AFAJEEAS051715.pdf).
Declaration of Conflicting Interests
The author(s) declared no potential conflicts of interest with respect to
the research, authorship, and/or publication of this article.
Funding
The author(s) disclosed receipt of the following financial support for
the research, authorship, and/or publication of this article: The Amer-
ican Cancer Society provided the funding for the establishment of the
CSP II cohort in 1982, the mortality follow-up from 1982 through
1988, and the preparation of the computerized files and documentation
used for this research.
Supplemental Material
The online supplemental material is available at http://journals
.sagepub.com/doi/suppl/10.1177/1559325817693345.
References
1. Pope CA III, Thun MJ, Namboodiri MM, et al. Particulate air
pollution as a predictor of mortality in a prospective study of
U.S. adults. Am J Resp Crit Care Med. 1995;151(3 pt 1):
669-674. doi:10.1164/ajrccm.151.3.7881654.
2. Kaiser J. Showdown over clean air science. Science. 1997;
277(5325):466-469.
Figure C1. 1982 to 1989 PM2.5 mortality risk (MR) in 50 cities (metropolitan areas) shown in Figure 21 on page 197 of HEI 20007,9 and listed inAppendix Table B1. Figure 21. Spatial overlay of fine particle levels and relative risk of mortality. Interval classifications for fine particles (in g/m3):low 8.99 to 17.03: medium 17.03 to 25.07; high 25.07 to 33. Interval classifications for relative risks of mortality: low 0.052 to 0.711; medium0.711 to 0.919; high 0.919 to 1.128.
10 Dose-Response: An International Journal
3. Gamble JF. PM2.5 and mortality in long-term prospective cohort
studies: cause-effect or statistical associations? Environ Health
Perspect. 1998;106(9):535-549. doi:10.1289/ehp.98106535.
4. Phalen RF. The particulate air pollution controversy. Nonlinearity Biol
Toxicol Med. 2004;2(4):259-292. doi:10.1080/15401420490900245.
Accessed February 20, 2017.
5. Enstrom JE, Young SS, Dunn JD, et al. Particulate Matter Does
Not Cause Premature Deaths. August 17, 2015. https://www.nas.
org/images/documents/PM2.5.pdf Within Wood P. Concerns
about National Academy of Sciences and Scientific Dissent.
National Association of Scholars. December 15, 2015. https://
www.nas.org/articles/nas_letter. Accessed February 20, 2017.
6. Enstrom JE. EPA’s Clean Power Plan and PM2.5-related
Co-Benefits. Tenth International Conference on Climate Change.
Panel 8. Heartland Institute. Washington, DC: 2015. http://
climateconferences.heartland.org/james-enstrom-iccc10-panel-8/,
and http://www.scientificintegrityinstitute.org/JEEICCC061115.
pdf. Accessed February 20, 2017.
7. Krewski D, Burnett RT, Goldberg MS, et al. Reanalysis of the
Harvard Six Cities Study and the American Cancer Society Study
of Particulate Air Pollution and Mortality: Special Report.
Cambridge, MA: Health Effects Institute; 2000. Part I. Replica-
tion and Validation and Part II. Sensitivity Analyses, particularly
Figure 5 on page 161, Figure 13 on page 89, and Figure 21 on page
197 and Appendix D and Appendix F. https://www.healtheffects.
org/publication/reanalysis-harvard-six-cities-study-and-american-
cancer-society-study-particulate-air. Accessed February 20, 2017.
8. Enstrom JE. Fine particulate air pollution and total mortality
among elderly Californians, 1973-2002. Inhal Toxicol. 2005;
17(14):803-816. PMID:16282158. http://scientificintegrityinsti-
tute.org/IT121505.pdf
9. Enstrom JE. Response to “A Critique of ‘Fine Particulate Air Pol-
lution and Total Mortality Among Elderly Californians, 1973-
2002’” by Bert Brunekreef, PhD, and Gerald Hoek, PhD. Inhal
Toxicol. 2006;18(7):509-514. http://scientificintegrityinstitute.
org/IT060106.pdf
10. Enstrom JE. Particulate Matter is Not Killing Californians. Pro-
ceedings of the American Statistical Association 2012 Joint Sta-
tistical Meeting, Section on Risk Analysis, San Diego, CA: 2012:
pages 2324-2336. https://www.amstat.org/meetings/jsm/2012/
proceedings.cfm, and http://www.scientificintegrityinstitute.org/
ASAS092812.pdf
11. July 22, 2013 US House Science Committee Final Request to
EPA for ACS CPS II Data. https://science.house.gov/news/
press-releases/committee-threatens-subpoena-epa-secret-science,
and https://science.house.gov/sites/republicans.science.house
.gov/files/documents/07-22-2013%20Smith%20and%20Stewart
%20to%20McCarthy.pdf. Accessed February 20, 2017.
12. August 1, 2013 US House Science Committee Subpoena to EPA
Requesting ACS CPS II Data. https://science.house.gov/news/
press-releases/smith-subpoenas-epa-s-secret-science, and https://
science.house.gov/sites/republicans.science.house.gov/files/
documents/Subpoena%20link.pdf. Accessed February 20, 2017.
13. Brawley OW. August 19, 2013 ACS Brawley Letter to EPA
Refusing to Cooperate with August 1, 2013 US House Sci-
ence Committee Subpoena of ACS CPS II Data. http://www.
scientificintegrityinstitute.org/Brawley081913.pdf. Accessed
February 20, 2017.
14. Gapstur SP. September 20, 2013 ACS Letter to Enstrom Deny-
ing CPS II Collaboration as Proposed in September 16, 2013
Enstrom Email. http://www.scientificintegrityinstitute.org/
GapsturEns092013.pdf. Accessed February 20, 2017.
15. Greenbaum D. October 4, 2013 HEI Response to September 26,
2013 Enstrom Email Declining to Conduct Special Analyses of ACS
CPS II re 2000 HEI Reanalysis Report.http://scientificintegrityinsti-
tute.org/Greenbaum100413.pdf. Accessed February 20, 2017.
16. Hinton DO, Sune JM, Suggs JC, Barnard WF. Inhalable Particu-
late Network Report: Operation and Data Summary (Mass
Concentrations Only). Volume I. April 1979-December 1982.
EPA-600/4-84-088a. Research Triangle Park, NC: U.S. Environ-
mental Protection Agency, November 1984, particularly pages
102-160 of 210 total pages. http://nepis.epa.gov/Exe/ZyPDF.cgi/
20015OU3.PDF?Dockey¼20015OU3.PDF. Accessed February
20, 2017.
17. Hinton DO, Sune JM, Suggs JC, Barnard WF. Inhalable Particu-
late Network Report: Data Summary (Mass Concentrations
Only). Volume III. January 1983-December 1984. EPA-600/4-
86/019. Research Triangle Park, NC: U.S. Environmental Protec-
tion Agency; April 1986: particularly pages 51-80 of 227 total
pages. http://nepis.epa.gov/Exe/ZyPDF.cgi/9101R4L8.PDF?
Dockey¼9101R4L8.PDF
18. SAS, PHREG and REGRESSION Procedures, SAS/STAT 9.4 User’s
Guide. Cary, NC: SAS Institute Inc. http://support.sas.com/
documentation/94/index.html. Accessed February 20, 2017.
19. Centers for Disease Control. National Center for Health Statistics.
1980 CDC WONDER On-line Database, compiled from Com-
pressed Mortality File CMF 1968-1988. http://wonder.cdc.gov/
cmf-icd9.html. Assessed April 15, 2016.
20. Krewski D, Jerrett M, Burnett RT, et al. Extended Follow-Up and
Spatial Analysis of the American Cancer Society Study Linking
Particulate Air Pollution and Mortality. HEI Research Report 140,
Health Effects Institute, Boston, MA: 2009, particularly Table 34.
https://www.healtheffects.org/publication/extended-follow-and-
spatial-analysis-american-cancer-society-study-linking-particulate.
Accessed February 20, 2017.
21. Krewski D. August 31, 2010 Letter to HEI re Special Analysis of
California Subjects Within ACS CPS II Cohort Based on 2009
HEI Research Report 140 Methodology. http://www.arb.ca.gov/
research/health/pm-mort/HEI_Correspondence.pdf. Accessed
February 20, 2017.
22. Lipfert FW, Malone RG, Daum ML, Mendell NR, Yang CC. A
Statistical Study of the Macroepidemiology of Air Pollution and
Total Mortality. Brookhaven National Laboratory. Upton, NY.
Report No. BNL 52122, April 1988, 136 pages. http://www.osti.
gov/scitech/servlets/purl/7028097. Accessed February 20, 2017.
23. Lipfert F. Commentary on the HEI reanalysis of the Harvard Six
Cities Study and the American Cancer Society Study of Particu-
late Air Pollution and Mortality. J Toxicol Environ Health A.
2003;66(16-19):1705-1714; discussion 1715-1722. doi:10.1080/
15287390306443.
24. Enstrom JE. July 11, 2008 CARB PM2.5 Premature Deaths
Teleconference Involving Enstrom, Pope, Jerrett, and
Enstrom 11

Burnett. Transcript and Audio File. http://www.scientificin-
tegrityinstitute.org/CARB071108.pdf. Accessed February
20, 2017.
25. Enstrom JE. Analysis of HEI 2000 Figures 5 and 21 to Identify
PM2.5 Mortality Risk in 49 US Cities Used in Pope 1995 and HEI
2000. September 30, 2010. http://www.scientificintegrityinstitute.
org/HEIFigure5093010.pdf
26. Enstrom JE. Submission to UCLA Research Integrity Officer
Karagozian Challenging Jerrett et al. PM2.5 Mortality Findings
and Karagozian Response. December 19, 2016. http://scientificin-
tegrityinstitute.org/RIOJerrettAll121916.pdf
27. Enstrom Compilation of Rejections of This Paper by Seven
Major Journals. http://www.scientificintegrityinstitute.org/
CPSIIRej122716.pdf. Accessed February 20, 2017.
12 Dose-Response: An International Journal
1
PM2.5 Does Not Cause Premature Deaths
James E. Enstrom, Ph.D., M.P.H.Research Professor/Researcher (Retired)
Epidemiologist & Physicist
UCLA School of Public Health
PresidentScientific Integrity Institute
Los Angeles, CAhttp://www.scientificintegrityinstitute.org/
Twelfth International Conference on Climate ChangeWashington, DC
March 23, 2017
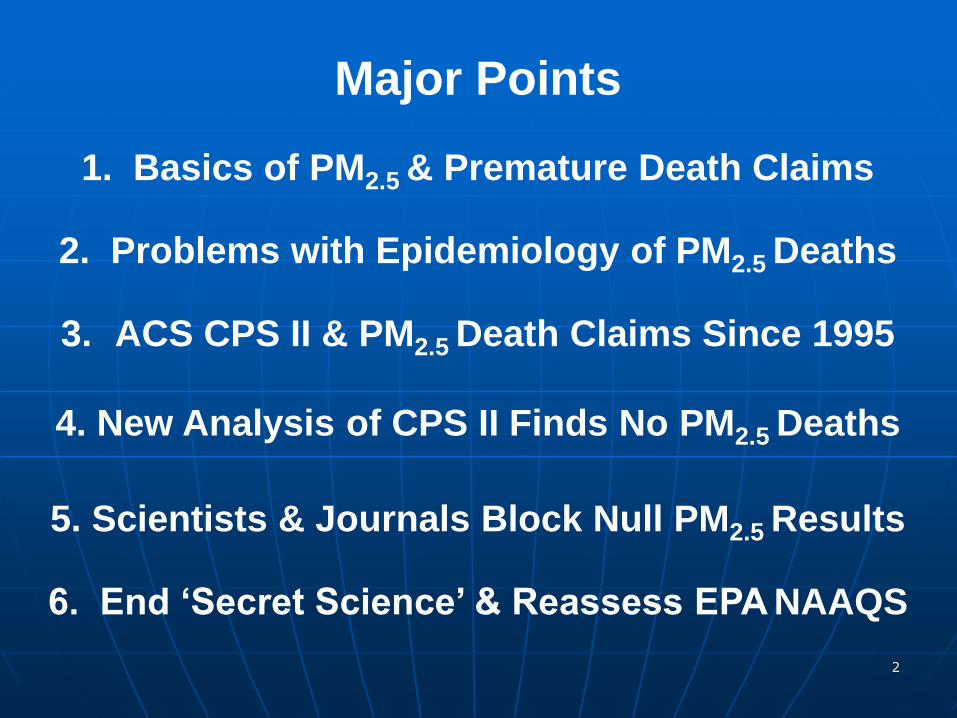
2
Major Points
1. Basics of PM2.5 & Premature Death Claims
2. Problems with Epidemiology of PM2.5 Deaths
3. ACS CPS II & PM2.5 Death Claims Since 1995
4. New Analysis of CPS II Finds No PM2.5 Deaths
5. Scientists & Journals Block Null PM2.5 Results
6. End ‘Secret Science’ & Reassess EPA NAAQS
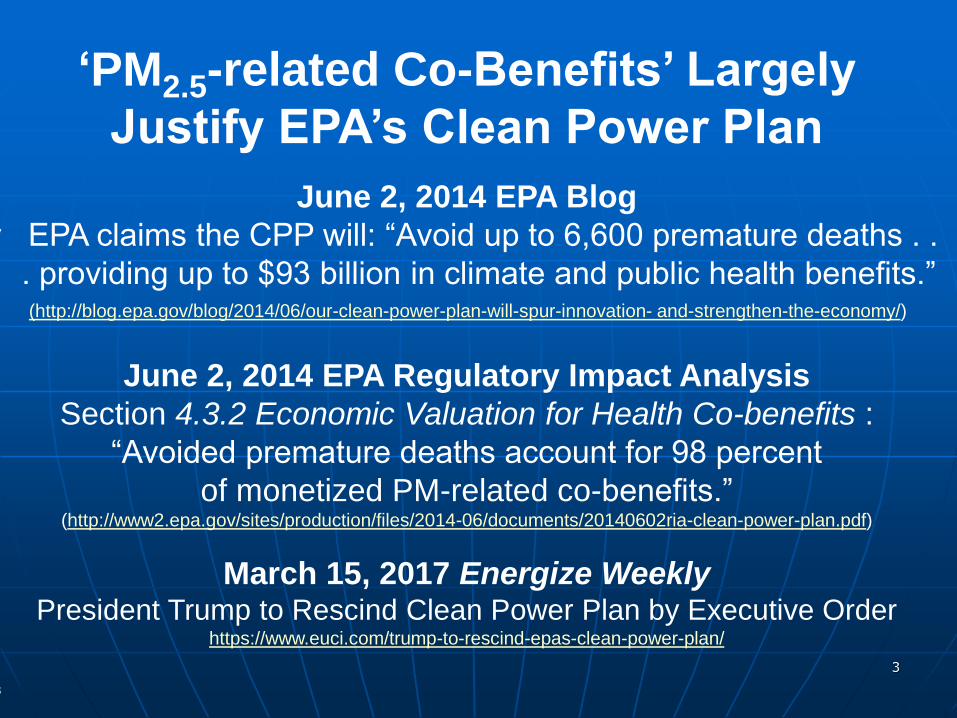
3
‘PM2.5-related Co-Benefits’ Largely
Justify EPA’s Clean Power Plan
June 2, 2014 EPA Blogy EPA claims the CPP will: “Avoid up to 6,600 premature deaths . .
. providing up to $93 billion in climate and public health benefits.”(http://blog.epa.gov/blog/2014/06/our-clean-power-plan-will-spur-innovation- and-strengthen-the-economy/)
June 2, 2014 EPA Regulatory Impact Analysis Section 4.3.2 Economic Valuation for Health Co-benefits :
“Avoided premature deaths account for 98 percent
of monetized PM-related co-benefits.”(http://www2.epa.gov/sites/production/files/2014-06/documents/20140602ria-clean-power-plan.pdf)
March 15, 2017 Energize WeeklyPresident Trump to Rescind Clean Power Plan by Executive Order
https://www.euci.com/trump-to-rescind-epas-clean-power-plan/
“
4
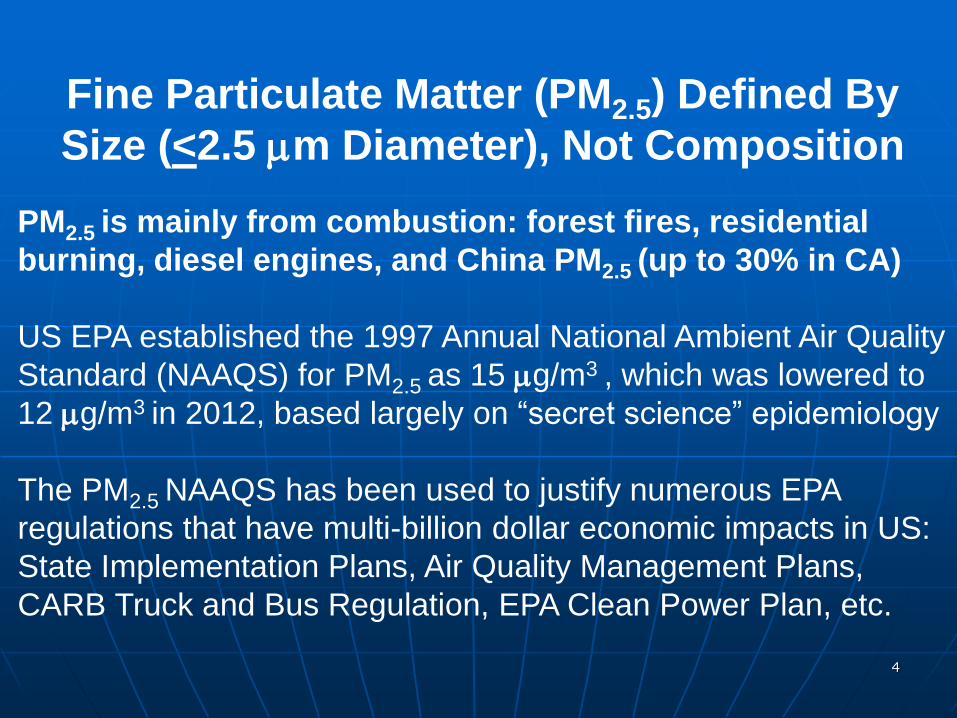
Fine Particulate Matter (PM2.5) Defined By Size (<2.5 m Diameter), Not Composition
PM2.5 is mainly from combustion: forest fires, residential burning, diesel engines, and China PM2.5 (up to 30% in CA)
US EPA established the 1997 Annual National Ambient Air Quality Standard (NAAQS) for PM2.5 as 15 g/m3 , which was lowered to 12 g/m3 in 2012, based largely on “secret science” epidemiology
The PM2.5 NAAQS has been used to justify numerous EPA regulations that have multi-billion dollar economic impacts in US: State Implementation Plans, Air Quality Management Plans, CARB Truck and Bus Regulation, EPA Clean Power Plan, etc.
5
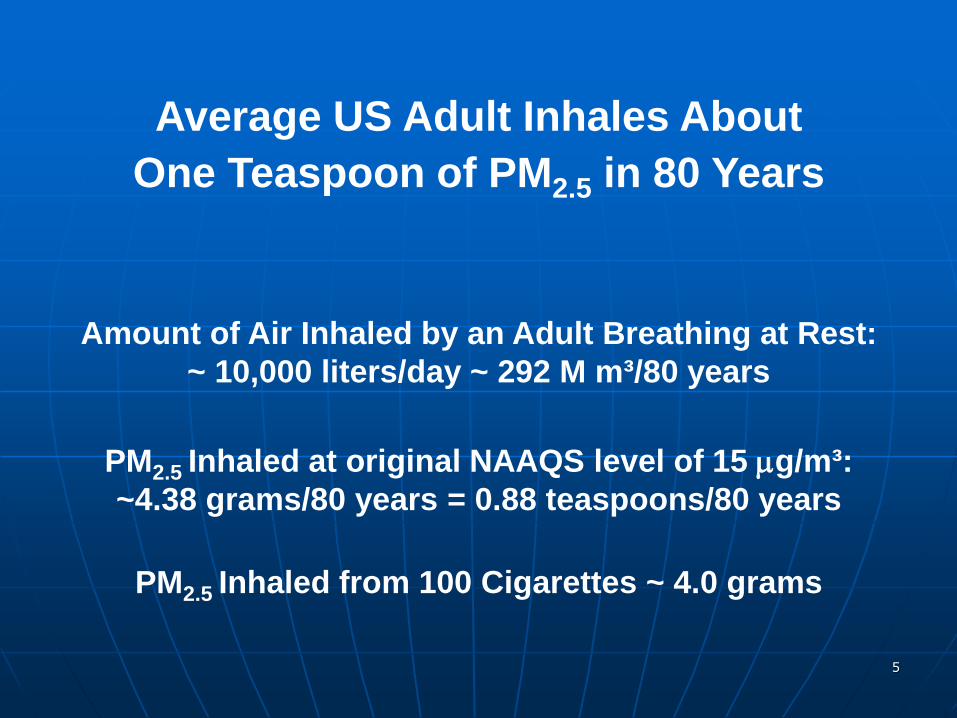
Average US Adult Inhales About One Teaspoon of PM2.5 in 80 Years
Amount of Air Inhaled by an Adult Breathing at Rest:~ 10,000 liters/day ~ 292 M m³/80 years
PM2.5 Inhaled at original NAAQS level of 15 g/m³: ~4.38 grams/80 years = 0.88 teaspoons/80 years
PM2.5 Inhaled from 100 Cigarettes ~ 4.0 grams
6
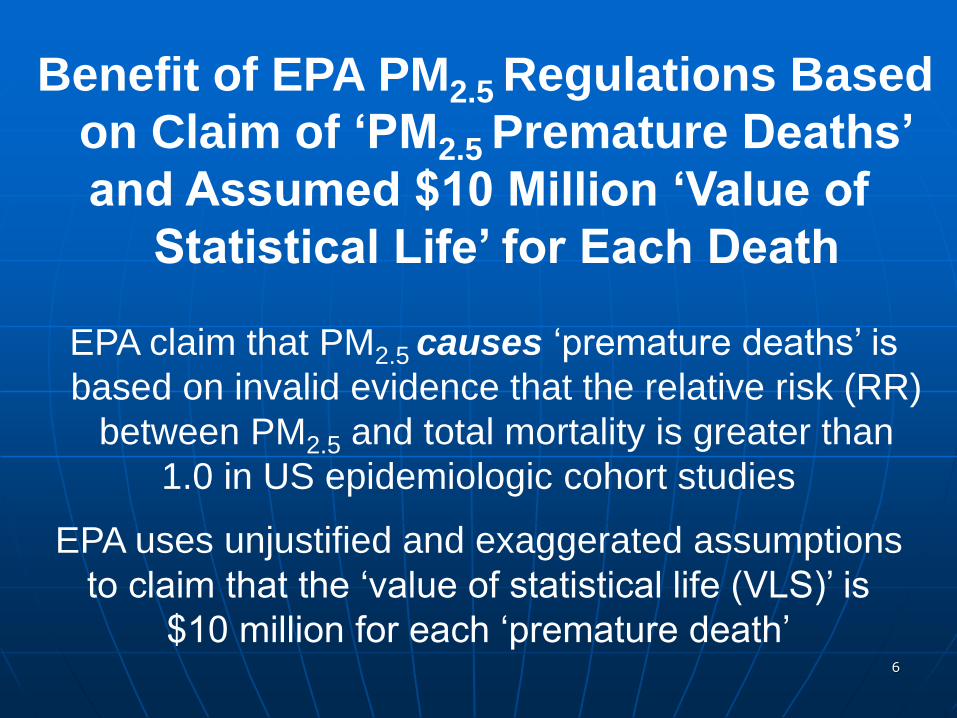
Benefit of EPA PM2.5 Regulations Based on Claim of ‘PM2.5 Premature Deaths’
and Assumed $10 Million ‘Value of
Statistical Life’ for Each Death
EPA claim that PM2.5 causes ‘premature deaths’ is
based on invalid evidence that the relative risk (RR) between PM2.5 and total mortality is greater than
1.0 in US epidemiologic cohort studies
EPA uses unjustified and exaggerated assumptions to claim that the ‘value of statistical life (VLS)’ is
$10 million for each ‘premature death’
7
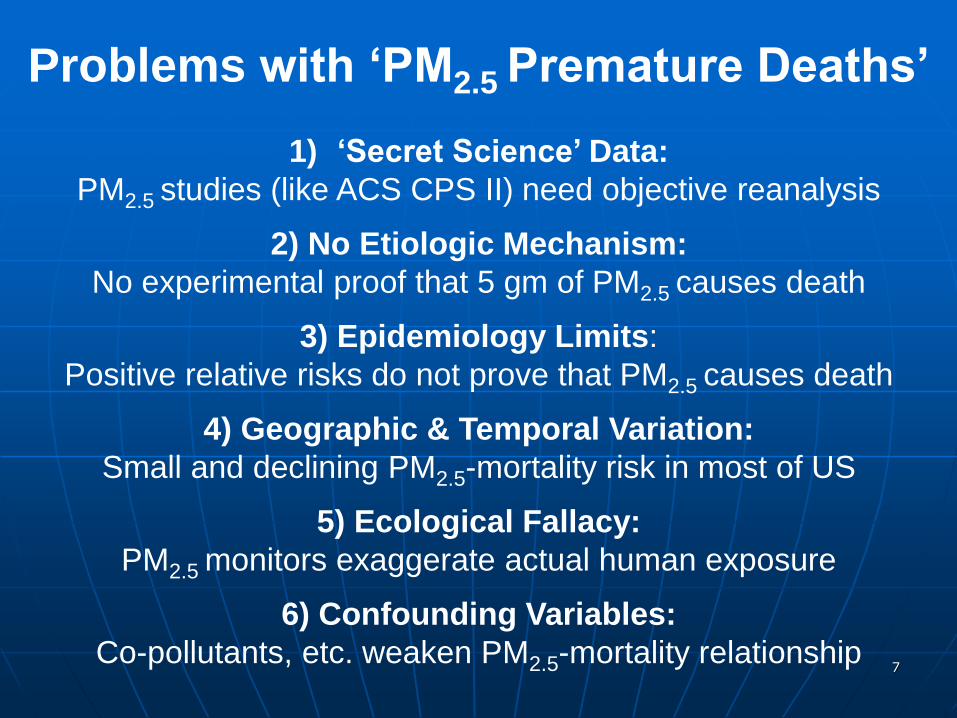
Problems with ‘PM2.5 Premature Deaths’
1) ‘Secret Science’ Data: PM2.5 studies (like ACS CPS II) need objective reanalysis
2) No Etiologic Mechanism: No experimental proof that 5 gm of PM2.5 causes death
3) Epidemiology Limits: Positive relative risks do not prove that PM2.5 causes death
4) Geographic & Temporal Variation: Small and declining PM2.5-mortality risk in most of US
5) Ecological Fallacy: PM2.5 monitors exaggerate actual human exposure
6) Confounding Variables: Co-pollutants, etc. weaken PM2.5-mortality relationship
8
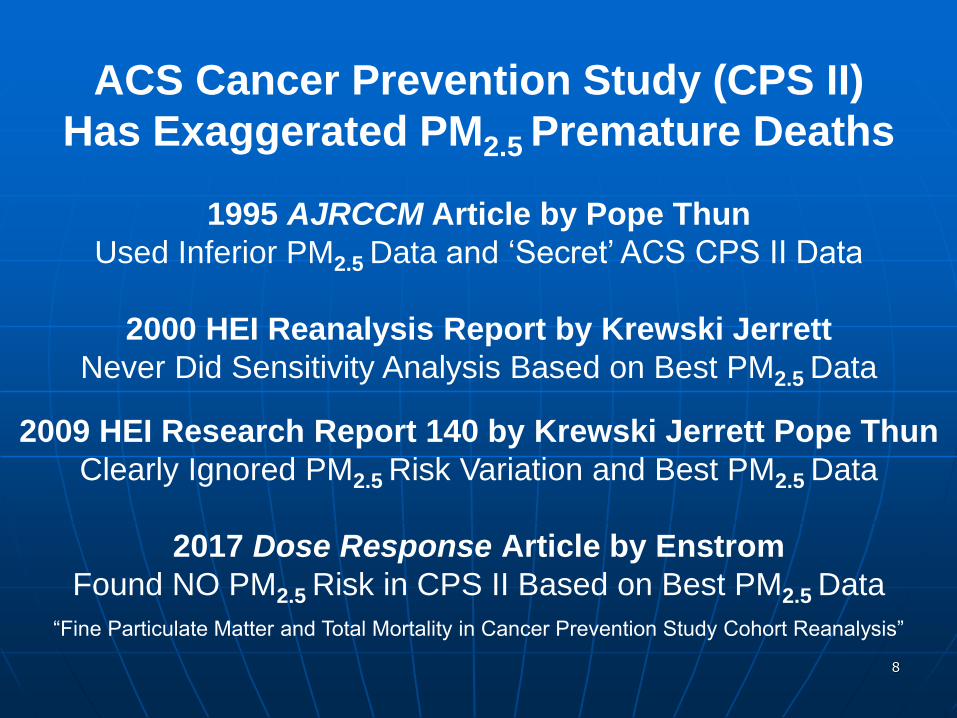
ACS Cancer Prevention Study (CPS II) Has Exaggerated PM2.5 Premature Deaths
1995 AJRCCM Article by Pope ThunUsed Inferior PM2.5 Data and ‘Secret’ ACS CPS II Data
2000 HEI Reanalysis Report by Krewski JerrettNever Did Sensitivity Analysis Based on Best PM2.5 Data
2009 HEI Research Report 140 by Krewski Jerrett Pope Thun Clearly Ignored PM2.5 Risk Variation and Best PM2.5 Data
2017 Dose Response Article by Enstrom Found NO PM2.5 Risk in CPS II Based on Best PM2.5 Data
“Fine Particulate Matter and Total Mortality in Cancer Prevention Study Cohort Reanalysis”
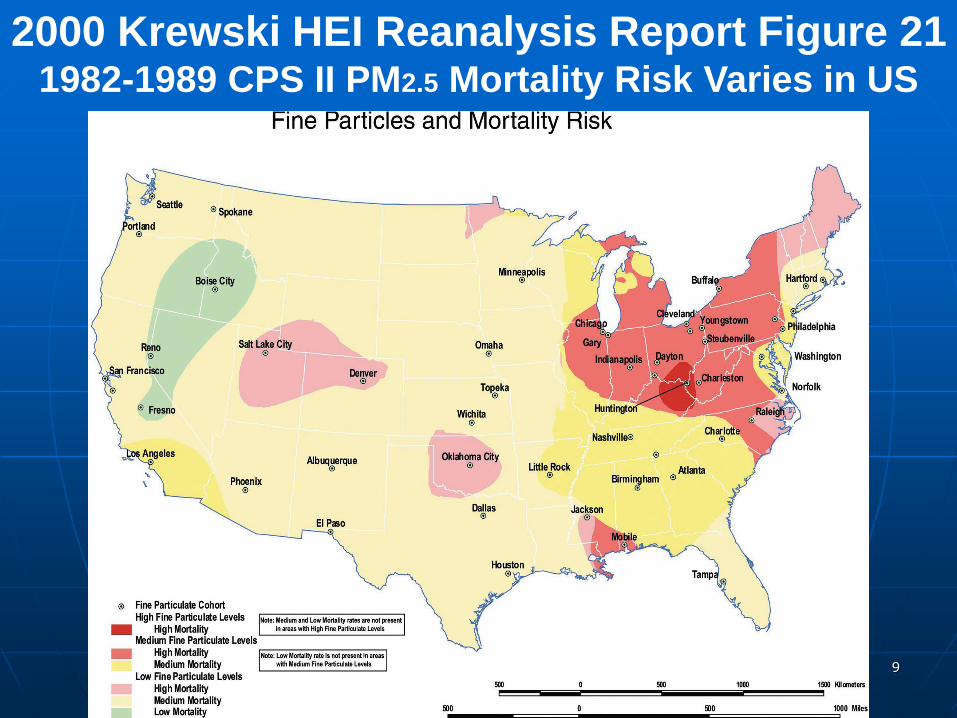
9
2000 Krewski HEI Reanalysis Report Figure 21 1982-1989 CPS II PM2.5 Mortality Risk Varies in US
10
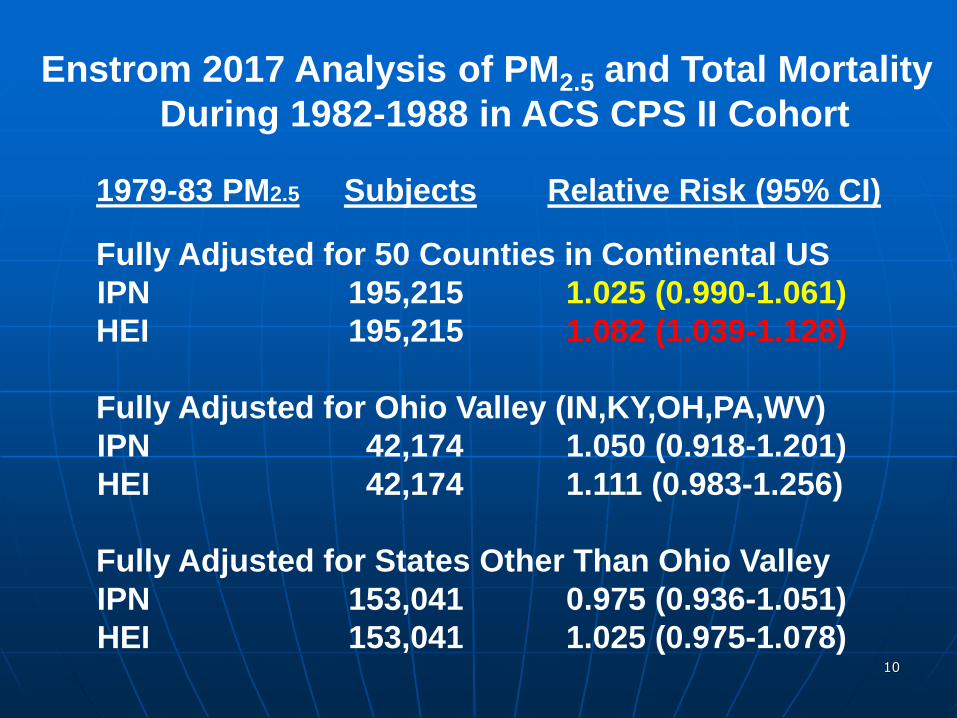
Enstrom 2017 Analysis of PM2.5 and Total Mortality During 1982-1988 in ACS CPS II Cohort
1979-83 PM2.5 Subjects Relative Risk (95% CI)
Fully Adjusted for 50 Counties in Continental USIPN 195,215 1.025 (0.990-1.061) HEI 195,215 1.082 (1.039-1.128)
Fully Adjusted for Ohio Valley (IN,KY,OH,PA,WV)IPN 42,174 1.050 (0.918-1.201) HEI 42,174 1.111 (0.983-1.256)
Fully Adjusted for States Other Than Ohio ValleyIPN 153,041 0.975 (0.936-1.051) HEI 153,041 1.025 (0.975-1.078)
11
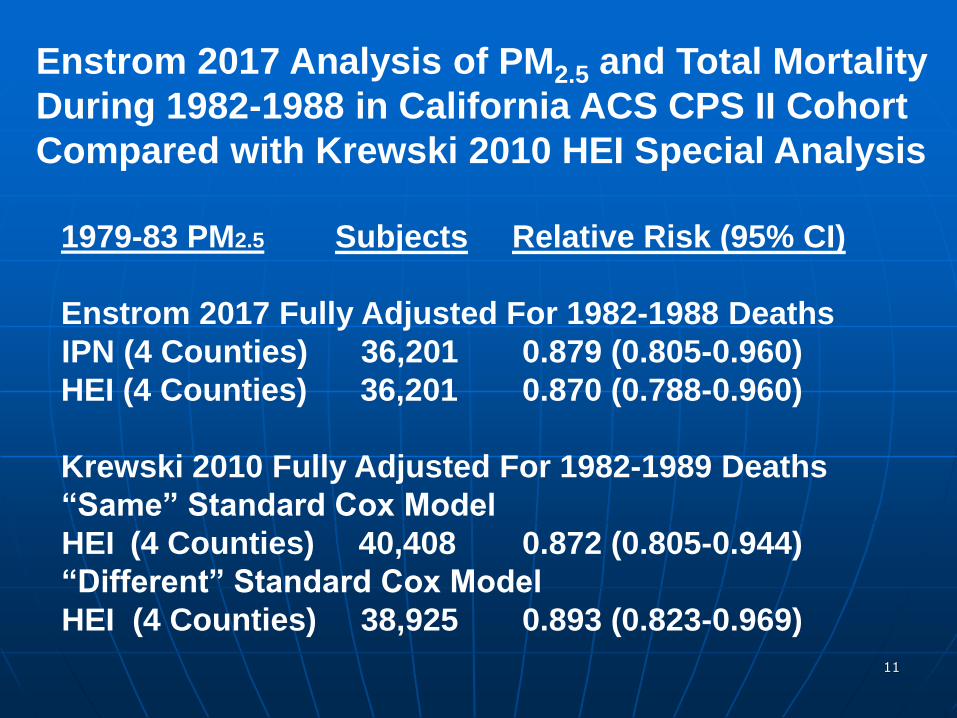
Enstrom 2017 Analysis of PM2.5 and Total MortalityDuring 1982-1988 in California ACS CPS II CohortCompared with Krewski 2010 HEI Special Analysis
1979-83 PM2.5 Subjects Relative Risk (95% CI)
Enstrom 2017 Fully Adjusted For 1982-1988 DeathsIPN (4 Counties) 36,201 0.879 (0.805-0.960) HEI (4 Counties) 36,201 0.870 (0.788-0.960)
Krewski 2010 Fully Adjusted For 1982-1989 Deaths“Same” Standard Cox Model
HEI (4 Counties) 40,408 0.872 (0.805-0.944)“Different” Standard Cox Model
HEI (4 Counties) 38,925 0.893 (0.823-0.969)
12
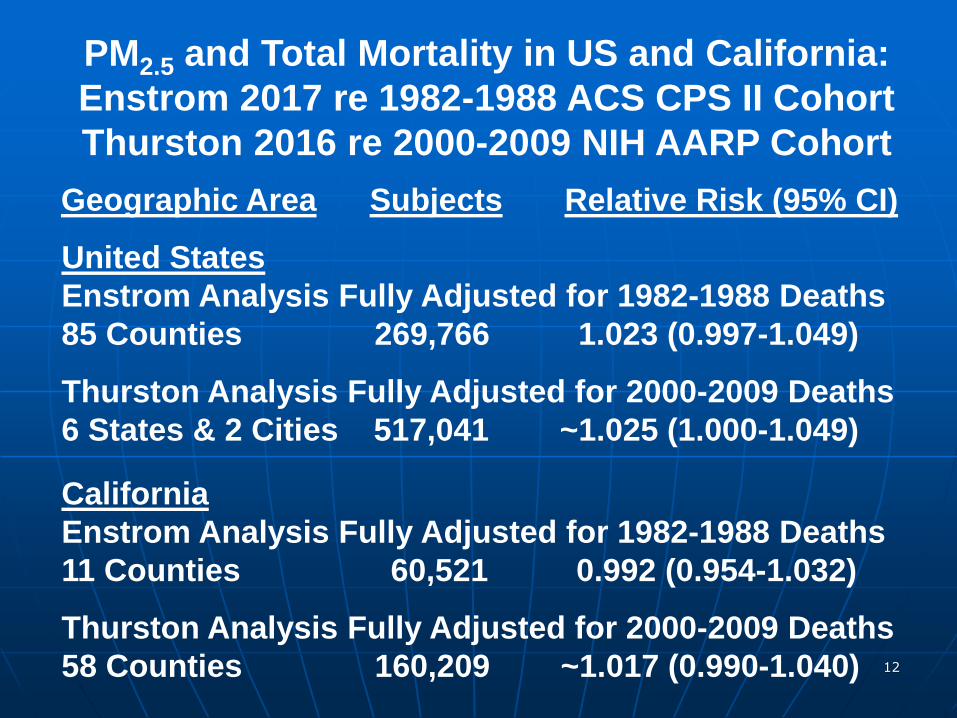
PM2.5 and Total Mortality in US and California:Enstrom 2017 re 1982-1988 ACS CPS II CohortThurston 2016 re 2000-2009 NIH AARP Cohort
Geographic Area Subjects Relative Risk (95% CI)
United StatesEnstrom Analysis Fully Adjusted for 1982-1988 Deaths85 Counties 269,766 1.023 (0.997-1.049)
Thurston Analysis Fully Adjusted for 2000-2009 Deaths6 States & 2 Cities 517,041 ~1.025 (1.000-1.049)
CaliforniaEnstrom Analysis Fully Adjusted for 1982-1988 Deaths 11 Counties 60,521 0.992 (0.954-1.032)
Thurston Analysis Fully Adjusted for 2000-2009 Deaths58 Counties 160,209 ~1.017 (0.990-1.040)
13
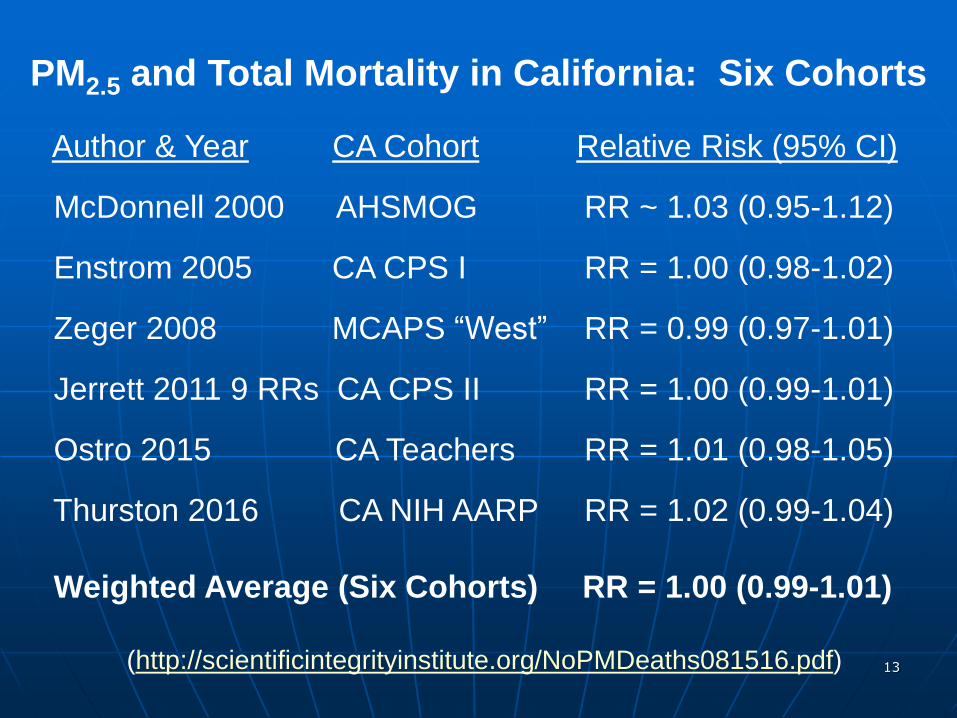
PM2.5 and Total Mortality in California: Six Cohorts
Author & Year CA Cohort Relative Risk (95% CI)
McDonnell 2000 AHSMOG RR ~ 1.03 (0.95-1.12)
Enstrom 2005 CA CPS I RR = 1.00 (0.98-1.02)
Zeger 2008 MCAPS “West” RR = 0.99 (0.97-1.01)
Jerrett 2011 9 RRs CA CPS II RR = 1.00 (0.99-1.01)
Ostro 2015 CA Teachers RR = 1.01 (0.98-1.05)
Thurston 2016 CA NIH AARP RR = 1.02 (0.99-1.04)
Weighted Average (Six Cohorts) RR = 1.00 (0.99-1.01)
(http://scientificintegrityinstitute.org/NoPMDeaths081516.pdf)
14
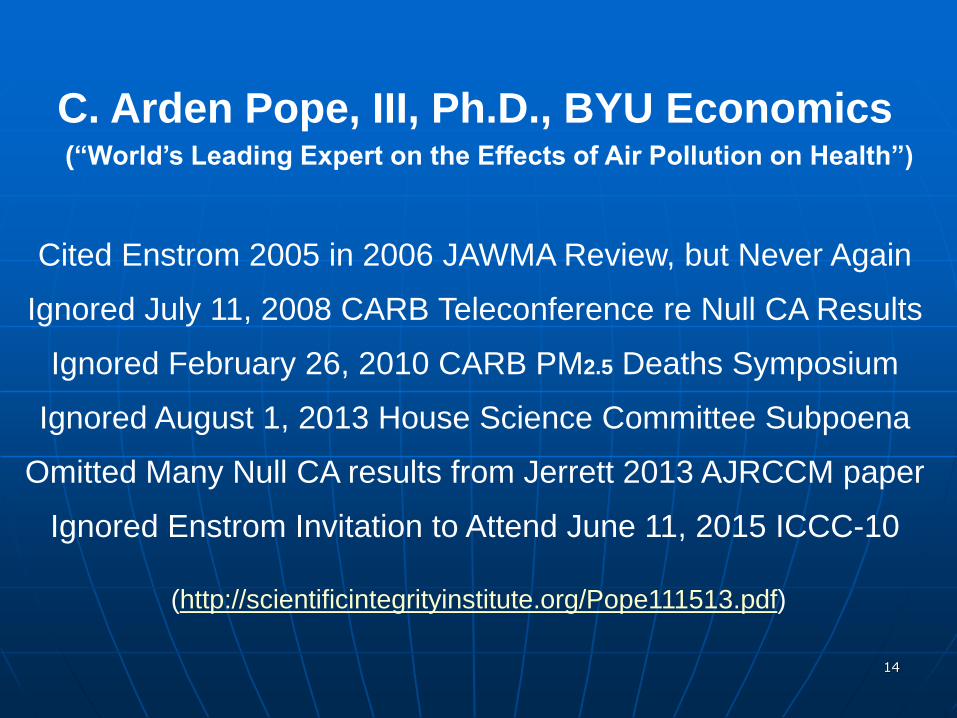
C. Arden Pope, III, Ph.D., BYU Economics(“World’s Leading Expert on the Effects of Air Pollution on Health”)
Cited Enstrom 2005 in 2006 JAWMA Review, but Never Again
Ignored July 11, 2008 CARB Teleconference re Null CA Results
Ignored February 26, 2010 CARB PM2.5 Deaths Symposium
Ignored August 1, 2013 House Science Committee Subpoena
Omitted Many Null CA results from Jerrett 2013 AJRCCM paper
Ignored Enstrom Invitation to Attend June 11, 2015 ICCC-10
(http://scientificintegrityinstitute.org/Pope111513.pdf)
15
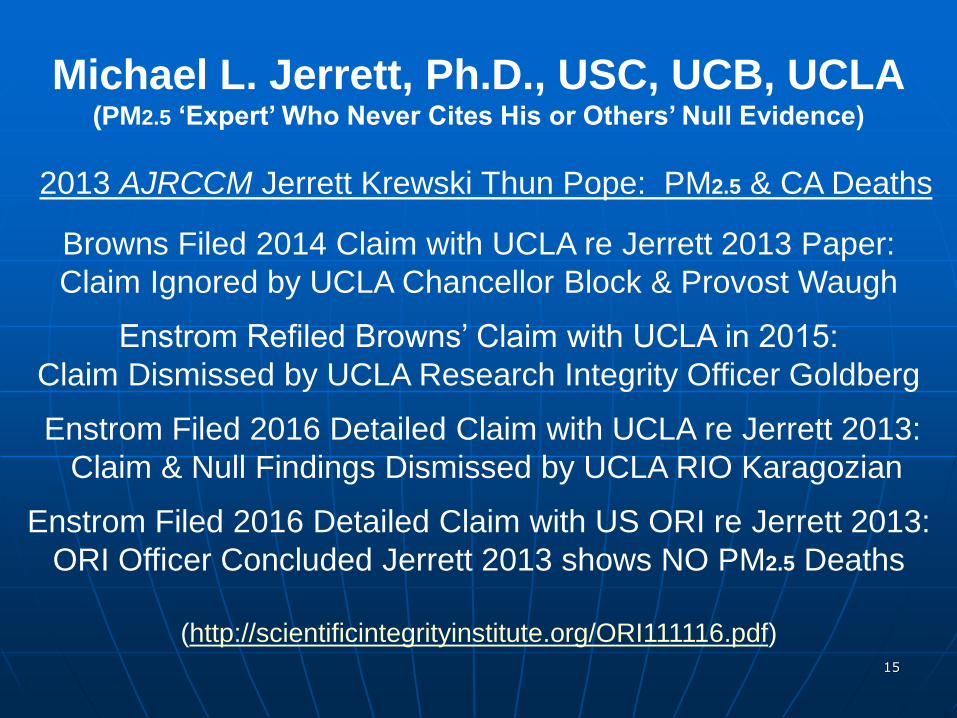
Michael L. Jerrett, Ph.D., USC, UCB, UCLA(PM2.5 ‘Expert’ Who Never Cites His or Others’ Null Evidence)
2013 AJRCCM Jerrett Krewski Thun Pope: PM2.5 & CA Deaths
Browns Filed 2014 Claim with UCLA re Jerrett 2013 Paper:Claim Ignored by UCLA Chancellor Block & Provost Waugh
Enstrom Refiled Browns’ Claim with UCLA in 2015:
Claim Dismissed by UCLA Research Integrity Officer Goldberg
Enstrom Filed 2016 Detailed Claim with UCLA re Jerrett 2013:Claim & Null Findings Dismissed by UCLA RIO Karagozian
Enstrom Filed 2016 Detailed Claim with US ORI re Jerrett 2013:ORI Officer Concluded Jerrett 2013 shows NO PM2.5 Deaths
(http://scientificintegrityinstitute.org/ORI111116.pdf)
16
American Cancer Society Epidemiologists Michael Thun, M.D. & Susan Gapstur, Ph.D. Refuse to Clarify CPS II Findings re PM2.5
ACS Has Misused the “Secret Science” CPS II Data Since 1995 to Claim PM2.5 Causes Premature Deaths
ACS Refused to Comply with 2013 House Subpoena and Has Provided NO CPS II Data for Independent Analysis
ACS Has Refused to Cooperate with Qualified Ph.D.-level PM2.5 Critics, including Enstrom, Young, and Briggs
ACS Continues to Participate in Falsification of PM2.5 Deaths in CPS II Cohort and WILL NOT Respond to Critics
(http://scientificintegrityinstitute.org/GapsturEns092013.pdf)
17
Health Effects Institute President Daniel W. Greenbaum and Chief Scientist
Aaron J. Cohen Have Never Clarifed2000 HEI Reanalysis Findings re CPS II
HEI 2000 Reanalysis Never Tested Sensitivity of PM2.5 Mortality Risk in Pope 1995 with best PM2.5 Data
Since 2002 HEI has not provided PM2.5 Mortality Risk for 50 Cities in Pope 1995 and HEI 2000 Figures 5 and 21
Krewski 2010 HEI Analysis: No PM2.5 Deaths in CA CPS II
HEI Has Not Conducted Requested Analysis of PM2.5
Mortality Risk in CPS II for Ohio Valley and Other States
(http://scientificintegrityinstitute.org/Greenbaum031017.pdf)
18
Science Rejection of PM2.5 Deaths Papers
Editor Marcia McNutt Rejected June 2015 Letter re Falisficationin Jerrett 2013 and Need for Secret Science Reform Act
July 2015 Policy Forum on PM2.5 Rejected Without Review
August 2015 Perspective on PM2.5 Rejected Without Review
June 2016 PM2.5 Deaths CPS II Paper Rejected Without Review
Enstrom 2017 Findings That PM2.5 Does Not Cause Deaths and Other Evidence Shows Publication Bias of Science
(https://www.nas.org/articles/nas_letter)
19
March 9, 2017 US House Science Committee
H.R. 1430 “Honest and Open New EPA
Science Treatment (HONEST) Act of 2017”
“To prohibit the Environmental Protection Agency from
proposing, finalizing, and disseminating regulationsor assessments based upon science that is
not transparent or reproducible.”
H.R. 1431 “EPA Science Advisory Board Reform Act of 2017”
“the scientific and technical points of view represented on and the functions to be performed by the Board
are fairly balanced among the members of the Board”
20
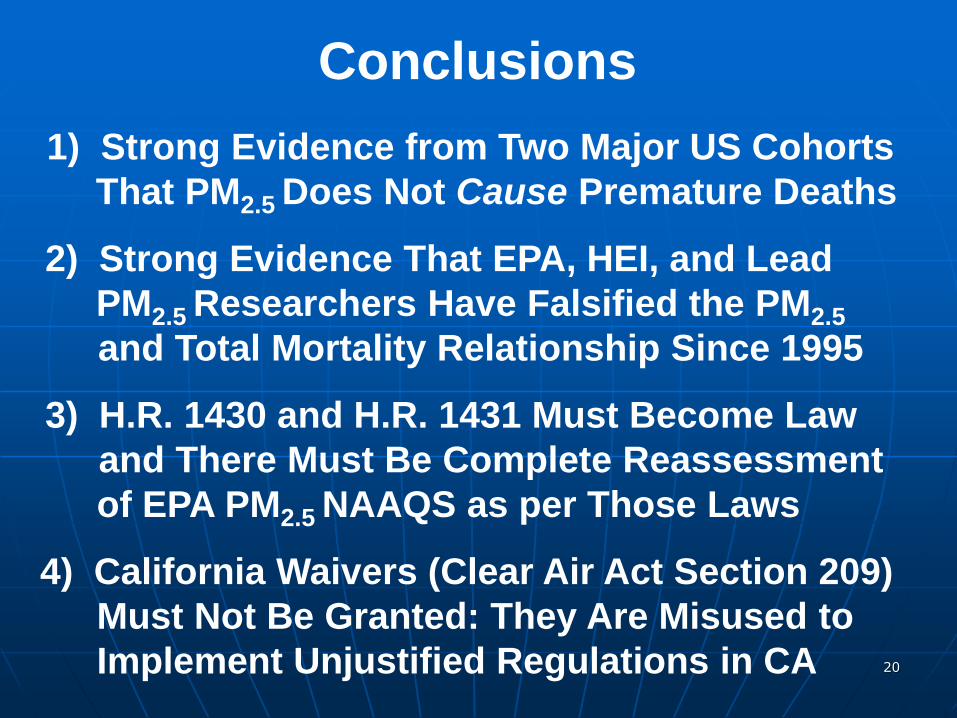
Conclusions
1) Strong Evidence from Two Major US Cohorts That PM2.5 Does Not Cause Premature Deaths
2) Strong Evidence That EPA, HEI, and Lead PM2.5 Researchers Have Falsified the PM2.5
and Total Mortality Relationship Since 1995
3) H.R. 1430 and H.R. 1431 Must Become Law and There Must Be Complete Reassessment of EPA PM2.5 NAAQS as per Those Laws
4) California Waivers (Clear Air Act Section 209)Must Not Be Granted: They Are Misused toImplement Unjustified Regulations in CA
484 volume 124 | number 4 | April 2016 • Environmental Health Perspectives
Research A Section 508–conformant HTML version of this article is available at http://dx.doi.org/10.1289/ehp.1509676.
IntroductionOver the past several decades, numerous published epidemiologic studies have docu-mented a consistent association between long-term exposure to fine particulate matter mass (≤ 2.5 μm; PM2.5) air pollution and an increase in the risk of mortality around the globe (e.g., Beelen et al. 2014; Brook et al. 2010; Crouse et al. 2012; Dockery et al.1993; Eftim et al. 2008; Ostro et al. 2010; Ozkaynak and Thurston 1987; Pope et al. 1995, 2002, 2004). Pope and collaborators notably found elevated relative risks of cardio-vascular (CVD) mortality in association with long-term PM2.5 exposure [hazard ratio (HR) per 10 μg/m3 = 1.12; 95% confidence interval (CI): 1.08, 1.15] in the largest and most definitive U.S. nationwide cohort considered to date (Pope et al. 2002, 2004), providing a cardio vascular mortality HR of 1.12 per 10 μg/m3 (95% CI: 1.08,1.15). However, existing U.S. cohort studies of PM2.5 health effects are still being questioned (e.g., Reis 2013). In addition, particulate matter air
pollution levels have been declining in recent years in the United States, so there is a need to confirm whether studies conducted in the past at higher levels are replicable today. Thus, it is important to test these associations in another large U.S. cohort with detailed individual-level risk factor information on participants, especially one for which pollution exposures can be estimated at the individual participant residence level, and in more recent lower PM2.5 exposure years, as we report here. This research addresses these needs using the newly available U.S. National Institutes of Health–AARP Diet & Health cohort (NIH-AARP Study) (Schatzkin et al. 2001).
MethodsStudy population. The NIH-AARP Study was initiated when members of the AARP, 50–71 years of age from six U.S. states (California, Florida, Louisiana, New Jersey, North Carolina, and Pennsylvania) and two metropolitan areas (Atlanta, Georgia, and Detroit, Michigan), responded to a mailed
questionnaire in 1995 and 1996. Details of the NIH-AARP Study have been described previously (Schatzkin et al. 2001). Among 566,398 participants enrolled in the NIH-AARP cohort and available for analysis in 2014, we first excluded for this analysis those individuals for whom the forms were filled out by a proxy (n = 15,760, or 2.8%); who moved out of their study region before January 2000 (n = 13,863, or 2.4%); who died before 1 January 2000 (n = 21,415, or 3.8%); and those for whom census-level outdoor PM2.5 exposure was not estimable using the methods discussed below (n = 737, or 0.1%). After accounting for overlapping exclusions, the analytic cohort includes 517,041 (91.3%) participants for whom matching PM2.5 air pollution data were available. The NIH-AARP cohort question-naires elicited information on demographic and anthropometric characteristics, dietary intake, and numerous health-related variables (e.g., marital status, body mass index, educa-tion, race, smoking status, physical activity, and alcohol consumption) at enrollment only. Contextual environment characteristics (e.g., median income) for the census tract of each of this cohort’s participants have also been compiled for this population by the NIH-AARP Study (NIH-AARP 2006), allowing us to also incorporate contextual socioeconomic variables at the census-tract level. All participants provided informed consent before completing the study
Address correspondence to G.D. Thurston, Depar tments o f Envi ronmenta l Medic ine and Population Health, Nelson Institute of Environmental Medicine, New York University School of Medicine, 57 Old Forge Rd., Tuxedo, NY 10987 USA. Telephone: (845) 731-3564. E-mail: [email protected]
This research was supported by investigator grants to the New York University School of Medicine from the National Institutes of Health (1R01ES019584-01A1 to G.D.T. and R.B.H., R21 ES021194 to G.D.T. and J.A.), as well as by the NYU-NIEHS Center of Excellence (grant ES00260).
G.D.T. has provided expert witness testimony on the human health effects of air pollution before the U.S. Congress, in the U.S. EPA public hearings, and in legal cases. The other authors declare they have no actual or potential competing financial interests.
Received: 5 January 2015; Accepted: 9 September 2015; Advance Publication: 15 September 2015; Final Publication: 1 April 2016.
Ambient Particulate Matter Air Pollution Exposure and Mortality in the NIH-AARP Diet and Health CohortGeorge D. Thurston,1 Jiyoung Ahn,2 Kevin R. Cromar,1 Yongzhao Shao,2 Harmony R. Reynolds,3 Michael Jerrett,4 Chris C. Lim,1 Ryan Shanley,2 Yikyung Park,5,6 and Richard B. Hayes2
1Department of Environmental Medicine, New York University School of Medicine, Tuxedo, New York, USA; 2Department of Population Health, and 3Cardiovascular Clinical Research Center, Department of Medicine, New York University School of Medicine, New York, New York, USA; 4School of Public Health, University of California, Berkeley, Berkeley, California, USA; 5Division of Public Health Sciences, Department of Surgery, Washington University School of Medicine, St. Louis, Missouri, USA; 6National Cancer Institute, National Institutes of Health, Department of Health and Human Services, Bethesda, Maryland, USA
Background: Outdoor fine particulate matter (≤ 2.5 μm; PM2.5) has been identified as a global health threat, but the number of large U.S. prospective cohort studies with individual participant data remains limited, especially at lower recent exposures.
oBjectives: We aimed to test the relationship between long-term exposure PM2.5 and death risk from all nonaccidental causes, cardiovascular (CVD), and respiratory diseases in 517,041 men and women enrolled in the National Institutes of Health-AARP cohort.
Methods: Individual participant data were linked with residence PM2.5 exposure estimates across the continental United States for a 2000–2009 follow-up period when matching census tract–level PM2.5 exposure data were available. Participants enrolled ranged from 50 to 71 years of age, residing in six U.S. states and two cities. Cox proportional hazard models yielded hazard ratio (HR) estimates per 10 μg/m3 of PM2.5 exposure.
results: PM2.5 exposure was significantly associated with total mortality (HR = 1.03; 95% CI: 1.00, 1.05) and CVD mortality (HR = 1.10; 95% CI: 1.05, 1.15), but the association with respiratory mortality was not statistically significant (HR = 1.05; 95% CI: 0.98, 1.13). A signifi-cant association was found with respiratory mortality only among never smokers (HR = 1.27; 95% CI: 1.03, 1.56). Associations with 10-μg/m3 PM2.5 exposures in yearly participant residential annual mean, or in metropolitan area-wide mean, were consistent with baseline exposure model results. Associations with PM2.5 were similar when adjusted for ozone exposures. Analyses of California residents alone also yielded statistically significant PM2.5 mortality HRs for total and CVD mortality.
conclusions: Long-term exposure to PM2.5 air pollution was associated with an increased risk of total and CVD mortality, providing an independent test of the PM2.5–mortality relationship in a new large U.S. prospective cohort experiencing lower post-2000 PM2.5 exposure levels.
citation: Thurston GD, Ahn J, Cromar KR, Shao Y, Reynolds HR, Jerrett M, Lim CC, Shanley R, Park Y, Hayes RB. 2016. Ambient particulate matter air pollution exposure and mortality in the NIH-AARP Diet and Health cohort. Environ Health Perspect 124:484–490; http://dx.doi.org/10.1289/ehp.1509676
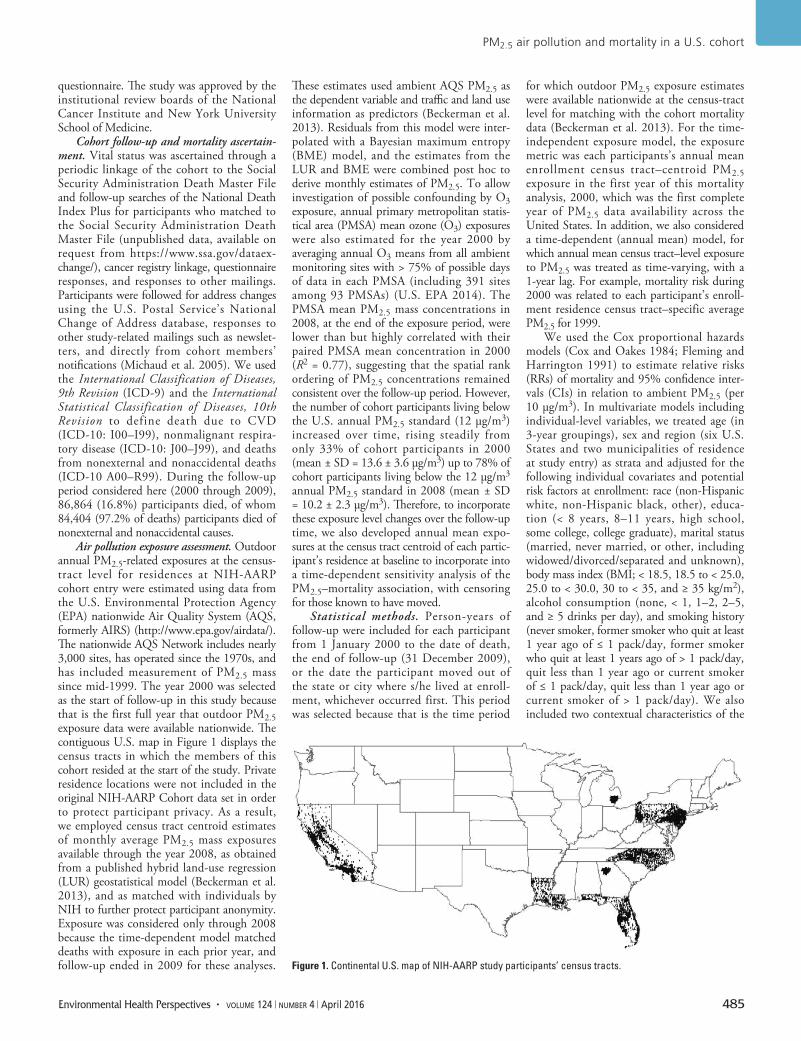
PM2.5 air pollution and mortality in a U.S. cohort
Environmental Health Perspectives • volume 124 | number 4 | April 2016 485
questionnaire. The study was approved by the institutional review boards of the National Cancer Institute and New York University School of Medicine.
Cohort follow-up and mortality ascertain-ment. Vital status was ascertained through a periodic linkage of the cohort to the Social Security Administration Death Master File and follow-up searches of the National Death Index Plus for participants who matched to the Social Security Administration Death Master File (unpublished data, available on request from https://www.ssa.gov/dataex-change/), cancer registry linkage, questionnaire responses, and responses to other mailings. Participants were followed for address changes using the U.S. Postal Service’s National Change of Address database, responses to other study-related mailings such as newslet-ters, and directly from cohort members’ notifications (Michaud et al. 2005). We used the International Classification of Diseases, 9th Revision (ICD-9) and the International Statistical Classification of Diseases, 10th Revision to define death due to CVD (ICD-10: I00–I99), nonmalignant respira-tory disease (ICD-10: J00–J99), and deaths from nonexternal and nonaccidental deaths (ICD-10 A00–R99). During the follow-up period considered here (2000 through 2009), 86,864 (16.8%) participants died, of whom 84,404 (97.2% of deaths) participants died of nonexternal and nonaccidental causes.
Air pollution exposure assessment. Outdoor annual PM2.5-related exposures at the census-tract level for residences at NIH-AARP cohort entry were estimated using data from the U.S. Environmental Protection Agency (EPA) nationwide Air Quality System (AQS, formerly AIRS) (http://www.epa.gov/airdata/). The nationwide AQS Network includes nearly 3,000 sites, has operated since the 1970s, and has included measurement of PM2.5 mass since mid-1999. The year 2000 was selected as the start of follow-up in this study because that is the first full year that outdoor PM2.5 exposure data were available nationwide. The contiguous U.S. map in Figure 1 displays the census tracts in which the members of this cohort resided at the start of the study. Private residence locations were not included in the original NIH-AARP Cohort data set in order to protect participant privacy. As a result, we employed census tract centroid estimates of monthly average PM2.5 mass exposures available through the year 2008, as obtained from a published hybrid land-use regression (LUR) geostatistical model (Beckerman et al. 2013), and as matched with individuals by NIH to further protect participant anonymity. Exposure was considered only through 2008 because the time-dependent model matched deaths with exposure in each prior year, and follow-up ended in 2009 for these analyses.
These estimates used ambient AQS PM2.5 as the dependent variable and traffic and land use information as predictors (Beckerman et al. 2013). Residuals from this model were inter-polated with a Bayesian maximum entropy (BME) model, and the estimates from the LUR and BME were combined post hoc to derive monthly estimates of PM2.5. To allow investigation of possible confounding by O3 exposure, annual primary metropolitan statis-tical area (PMSA) mean ozone (O3) exposures were also estimated for the year 2000 by averaging annual O3 means from all ambient monitoring sites with > 75% of possible days of data in each PMSA (including 391 sites among 93 PMSAs) (U.S. EPA 2014). The PMSA mean PM2.5 mass concentrations in 2008, at the end of the exposure period, were lower than but highly correlated with their paired PMSA mean concentration in 2000 (R2 = 0.77), suggesting that the spatial rank ordering of PM2.5 concentrations remained consistent over the follow-up period. However, the number of cohort participants living below the U.S. annual PM2.5 standard (12 μg/m3) increased over time, rising steadily from only 33% of cohort participants in 2000 (mean ± SD = 13.6 ± 3.6 μg/m3) up to 78% of cohort participants living below the 12 μg/m3 annual PM2.5 standard in 2008 (mean ± SD = 10.2 ± 2.3 μg/m3). Therefore, to incorporate these exposure level changes over the follow-up time, we also developed annual mean expo-sures at the census tract centroid of each partic-ipant’s residence at baseline to incorporate into a time-dependent sensitivity analysis of the PM2.5–mortality association, with censoring for those known to have moved.
Statistical methods. Person-years of follow-up were included for each participant from 1 January 2000 to the date of death, the end of follow-up (31 December 2009), or the date the participant moved out of the state or city where s/he lived at enroll-ment, whichever occurred first. This period was selected because that is the time period
for which outdoor PM2.5 exposure estimates were available nationwide at the census-tract level for matching with the cohort mortality data (Beckerman et al. 2013). For the time-independent exposure model, the exposure metric was each participants’s annual mean enrollment census tract–centroid PM2.5 exposure in the first year of this mortality analysis, 2000, which was the first complete year of PM2.5 data availability across the United States. In addition, we also considered a time-dependent (annual mean) model, for which annual mean census tract–level exposure to PM2.5 was treated as time-varying, with a 1-year lag. For example, mortality risk during 2000 was related to each participant’s enroll-ment residence census tract–specific average PM2.5 for 1999.
We used the Cox proportional hazards models (Cox and Oakes 1984; Fleming and Harrington 1991) to estimate relative risks (RRs) of mortality and 95% confidence inter-vals (CIs) in relation to ambient PM2.5 (per 10 μg/m3). In multivariate models including individual-level variables, we treated age (in 3-year groupings), sex and region (six U.S. States and two municipalities of residence at study entry) as strata and adjusted for the following individual covariates and potential risk factors at enrollment: race (non-Hispanic white, non-Hispanic black, other), educa-tion (< 8 years, 8–11 years, high school, some college, college graduate), marital status (married, never married, or other, including widowed/divorced/separated and unknown), body mass index (BMI; < 18.5, 18.5 to < 25.0, 25.0 to < 30.0, 30 to < 35, and ≥ 35 kg/m2), alcohol consumption (none, < 1, 1–2, 2–5, and ≥ 5 drinks per day), and smoking history (never smoker, former smoker who quit at least 1 year ago of ≤ 1 pack/day, former smoker who quit at least 1 years ago of > 1 pack/day, quit less than 1 year ago or current smoker of ≤ 1 pack/day, quit less than 1 year ago or current smoker of > 1 pack/day). We also included two contextual characteristics of the
Figure 1. Continental U.S. map of NIH-AARP study participants’ census tracts.
Thurston et al.
486 volume 124 | number 4 | April 2016 • Environmental Health Perspectives
participants’ residential census tracts found to modify the PM2.5–mortality HR estimates and have statistical significance in our analyses (data not shown): a) median census tract household income; and b) percent of census tract population with less than a high school education, based on the 2000 decennial census for the residence at study entry, as included in the cohort data set (NIH-AARP 2006). Potential effect modification was assessed by including multiplicative interaction terms between PM2.5 concentrations and each covariate [e.g., sex, age < 65 or ≥ 65 years, age and sex combined, education (< high school, high school, > high school), and smoking (never, former, current) at baseline] in the proportional hazards models. Likelihood ratio statistic p-values (two-sided) comparing model fit with and without interaction terms were used to test the statistical significance of each interaction, with p-values of < 0.05 defined as statistically significant. Statistical analyses were carried out in SAS (version 9.3; SAS Institute Inc.) and R (version 3.0.1), using the “survival” package (R Core Team 2013).
Additional sensitivity analyses were conducted, including models without adjusting for contextual variables; limiting the analysis to California residents; without censoring data after people moved; adjusting for O3, and using PM2.5 exposures estimated at the metro-politan area average level (rather than at the census tract level). In addition, other contextual characteristics were also considered: a) Gini coefficient, a metric of income inequality; b) percent of census tract population who are black; c) percent of census tract population who are unemployed; and d) percent of census tract population living below the poverty level, but were not included in the final model, as addition of these variables did not significantly affect results. To allow more direct compari-sons with past work applying random effects methods (e.g., Krewski et al. 2009), we also evaluated HRs in relation to baseline (2000) PM2.5 exposure levels while incorporating random effects for state of residence using the “coxme” package in R.
To show how the shape o f the PM2.5–mortality relationship response varies with concentration in this cohort, PM2.5 natural spline (ns) plots with 4 degrees of freedom (df) were prepared for both total (all cause) and cardiovascular mortality using standard Cox models for the baseline case, stratified by age and sex, and adjusted for all individual-level covariates and contextual variables, as described above.
ResultsThe cohort was exposed to a wide range of PM2.5 concentrations (Table 1), with a concentration range similar to the nation as a whole (U.S. EPA 2009). Except for race
(for which Table 1 indicates a rising exposure with increasing percentage of black partici-pants), cohort characteristics were generally similar across PM2.5 exposure level, limiting the potential for confounding in our PM2.5 mortality relationship analyses.
In our time-independent baseline exposure Cox model analyses of the selected cohort (using the study entry tract of residence PM2.5 mean as the exposure reference for each participant), higher levels of ambient PM2.5 exposure were significantly associated with increased mortality due to all causes of (nonaccidental) death (HR = 1.03 per 10 μg/m3 PM2.5; 95% CI: 1.00, 1.05) and cardiovascular disease (HR = 1.10; 95% CI: 1.05, 1.15), as presented in Table 2. Stratified analyses by sex, age, and education for this cohort did not indicate significant differences in PM2.5 effect estimates across categories (Table 2). However, although PM2.5 exposure was not significantly associated overall with increased risk of respiratory mortality (HR = 1.05; 95% CI: 0.98, 1.13), an associa-tion was found for never smokers (HR = 1.27; 95% CI: 1.03, 1.56). Figure 2 graphically demonstrates, for the time-independent model, the monotonically rising nature of the concentration–response curve for both all-cause and CVD mortality (vs. a referent HR = 1.0 at the mean level of exposure).
A number of sensitivity analyses for alter-native models were also conducted (Table 3). In general, associations were stronger and p-values were smaller when we did not adjust for census tract–level contextual environmental variables, including the asso-ciation with respiratory mortality (HR = 1.09; 95% CI: 1.02, 1.18). Adding random-effects terms to the time-independent model yielded very similar results to those without random-effects terms. Time-dependent yearly exposure models gave comparable results to the year 2000 time-independent baseline exposure model for total mortality (HR = 1.03; 95% CI: 0.99, 1.05), CVD mortality (HR = 1.11; 95% CI: 1.06, 1.16), and respiratory mortality (HR = 1.05; 95% CI: 0.97, 1.15). Limiting the analysis to only California (the state with the largest number of cohort participants) gave similar results to the entire cohort. To assess the extent to which our censoring of those who moved out of the study state/city might have affected the results, we also present overall results for participants without that censoring, retaining those who moved after 2000, finding that it gave similar results to our base model case with censoring (as shown in Table 2). In addition, in a model that simultaneously also included exposure to the gaseous pollutant O3 along with PM2.5, the PM2.5 effect estimate was found to be still significant and its CVD mortality effect
estimate not statistically different from the model without the addition of O3, indicating the PM2.5–CVD mortality association to be robust to the addition of O3.
DiscussionIn this large prospective cohort study with detailed baseline individual-level risk factor information on study participants (e.g., smoking, BMI, alcohol use), we confirmed a monotonically increasing, and statistically significant, relationship between long-term exposure to PM2.5 air pollution and both all-cause and CVD mortality, even at the decreased PM2.5 levels experienced in the United States since 2000. Comparisons by sex, age, and education for this cohort did not indicate statistically significant differ-ences in the mortality–PM2.5 association across categories.
With significant overall associations with all-cause and cardiovascular mortality, the results presented here are consistent with many, but not all, of the prior published results examining PM2.5 and mortality. We estimated a 3% increase (95% CI: 0, 5%) in all-cause mortality for a 10-μg/m3 annual increase in PM2.5 that, though statistically significant in this large cohort, is lower than many other past estimates. For example, a recent literature review reported a pooled effect estimate of 6% per 10 μg/m3 PM2.5 (95% CI: 4, 8%) for all-cause mortality (Hoek et al. 2013). Our overall estimate for CVD mortality (10% effect per 10 μg/m3; 95% CI: 5, 15%), agrees more closely with the pooled estimate for CVD mortality reported by Hoek et al. (2013) (11% per 10 μg/m3; 95% CI: 6, 16%).
Comparisons with the American Cancer Society (ACS) cohort, a similarly large nation-wide cohort, provides an opportunity to evaluate the issue of association consistency over time in the United States. Although participants in the ACS cohort (Pope et al. 2002) were somewhat younger (mean 56 years at recruitment, vs. mean 65 years in the NIH-AARP cohort in 2000), and were exposed during that study’s follow-up to pollution at an earlier period of time (when the mix of air pollution sources was likely different), it has a similar racial (> 90% white) and educational (> 50% post–high school education) composition, is of similar size (> 500,000 participants), and also spans the United States, making it probably the most similar U.S. cohort for comparison here. The ACS cohort reported that a 10-μg/m3 increase in PM2.5 was associated with a 4% increase in all-cause mortality (95% CI: 1, 8%) (Pope et al. 2002), which is consis-tent with the corresponding estimate from the present analysis (3% per 10 μg/m3; 95% CI: 0, 5%), as shown in Figure 3. Moreover,
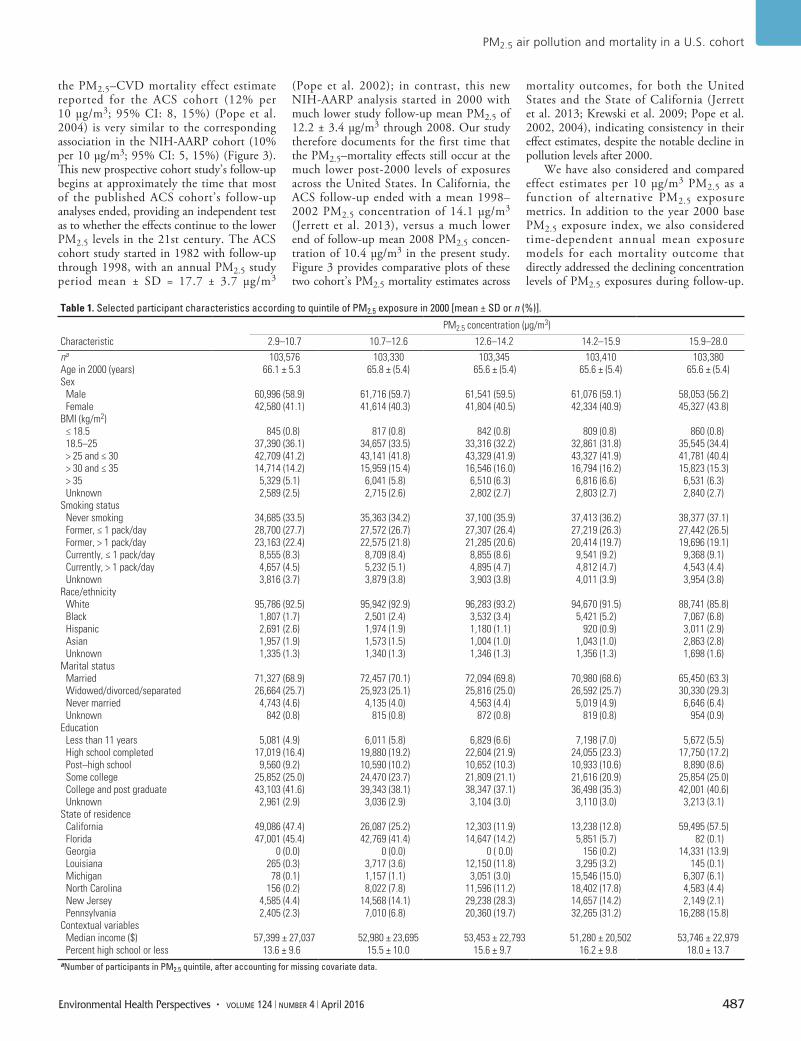
PM2.5 air pollution and mortality in a U.S. cohort
Environmental Health Perspectives • volume 124 | number 4 | April 2016 487
the PM2.5–CVD mortality effect estimate reported for the ACS cohort (12% per 10 μg/m3; 95% CI: 8, 15%) (Pope et al. 2004) is very similar to the corresponding association in the NIH-AARP cohort (10% per 10 μg/m3; 95% CI: 5, 15%) (Figure 3). This new prospective cohort study’s follow-up begins at approximately the time that most of the published ACS cohort’s follow-up analyses ended, providing an independent test as to whether the effects continue to the lower PM2.5 levels in the 21st century. The ACS cohort study started in 1982 with follow-up through 1998, with an annual PM2.5 study period mean ± SD = 17.7 ± 3.7 μg/m3
(Pope et al. 2002); in contrast, this new NIH-AARP analysis started in 2000 with much lower study follow-up mean PM2.5 of 12.2 ± 3.4 μg/m3 through 2008. Our study therefore documents for the first time that the PM2.5–mortality effects still occur at the much lower post-2000 levels of exposures across the United States. In California, the ACS follow-up ended with a mean 1998–2002 PM2.5 concentration of 14.1 μg/m3 (Jerrett et al. 2013), versus a much lower end of follow-up mean 2008 PM2.5 concen-tration of 10.4 μg/m3 in the present study. Figure 3 provides comparative plots of these two cohort’s PM2.5 mortality estimates across
mortality outcomes, for both the United States and the State of California (Jerrett et al. 2013; Krewski et al. 2009; Pope et al. 2002, 2004), indicating consistency in their effect estimates, despite the notable decline in pollution levels after 2000.
We have also considered and compared effect estimates per 10 μg/m3 PM2.5 as a function of alternative PM2.5 exposure metrics. In addition to the year 2000 base PM2.5 exposure index, we also considered time-dependent annual mean exposure models for each mortality outcome that directly addressed the declining concentration levels of PM2.5 exposures during follow-up.
Table 1. Selected participant characteristics according to quintile of PM2.5 exposure in 2000 [mean ± SD or n (%)].
Characteristic
PM2.5 concentration (μg/m3)
2.9–10.7 10.7–12.6 12.6–14.2 14.2–15.9 15.9–28.0na 103,576 103,330 103,345 103,410 103,380Age in 2000 (years) 66.1 ± 5.3 65.8 ± (5.4) 65.6 ± (5.4) 65.6 ± (5.4) 65.6 ± (5.4)Sex
Male 60,996 (58.9) 61,716 (59.7) 61,541 (59.5) 61,076 (59.1) 58,053 (56.2)Female 42,580 (41.1) 41,614 (40.3) 41,804 (40.5) 42,334 (40.9) 45,327 (43.8)
BMI (kg/m2)≤ 18.5 845 (0.8) 817 (0.8) 842 (0.8) 809 (0.8) 860 (0.8)18.5–25 37,390 (36.1) 34,657 (33.5) 33,316 (32.2) 32,861 (31.8) 35,545 (34.4)> 25 and ≤ 30 42,709 (41.2) 43,141 (41.8) 43,329 (41.9) 43,327 (41.9) 41,781 (40.4)> 30 and ≤ 35 14,714 (14.2) 15,959 (15.4) 16,546 (16.0) 16,794 (16.2) 15,823 (15.3)> 35 5,329 (5.1) 6,041 (5.8) 6,510 (6.3) 6,816 (6.6) 6,531 (6.3)Unknown 2,589 (2.5) 2,715 (2.6) 2,802 (2.7) 2,803 (2.7) 2,840 (2.7)
Smoking statusNever smoking 34,685 (33.5) 35,363 (34.2) 37,100 (35.9) 37,413 (36.2) 38,377 (37.1)Former, ≤ 1 pack/day 28,700 (27.7) 27,572 (26.7) 27,307 (26.4) 27,219 (26.3) 27,442 (26.5)Former, > 1 pack/day 23,163 (22.4) 22,575 (21.8) 21,285 (20.6) 20,414 (19.7) 19,696 (19.1)Currently, ≤ 1 pack/day 8,555 (8.3) 8,709 (8.4) 8,855 (8.6) 9,541 (9.2) 9,368 (9.1)Currently, > 1 pack/day 4,657 (4.5) 5,232 (5.1) 4,895 (4.7) 4,812 (4.7) 4,543 (4.4)Unknown 3,816 (3.7) 3,879 (3.8) 3,903 (3.8) 4,011 (3.9) 3,954 (3.8)
Race/ethnicityWhite 95,786 (92.5) 95,942 (92.9) 96,283 (93.2) 94,670 (91.5) 88,741 (85.8)Black 1,807 (1.7) 2,501 (2.4) 3,532 (3.4) 5,421 (5.2) 7,067 (6.8)Hispanic 2,691 (2.6) 1,974 (1.9) 1,180 (1.1) 920 (0.9) 3,011 (2.9)Asian 1,957 (1.9) 1,573 (1.5) 1,004 (1.0) 1,043 (1.0) 2,863 (2.8)Unknown 1,335 (1.3) 1,340 (1.3) 1,346 (1.3) 1,356 (1.3) 1,698 (1.6)
Marital status Married 71,327 (68.9) 72,457 (70.1) 72,094 (69.8) 70,980 (68.6) 65,450 (63.3)Widowed/divorced/separated 26,664 (25.7) 25,923 (25.1) 25,816 (25.0) 26,592 (25.7) 30,330 (29.3)Never married 4,743 (4.6) 4,135 (4.0) 4,563 (4.4) 5,019 (4.9) 6,646 (6.4)Unknown 842 (0.8) 815 (0.8) 872 (0.8) 819 (0.8) 954 (0.9)
Education Less than 11 years 5,081 (4.9) 6,011 (5.8) 6,829 (6.6) 7,198 (7.0) 5,672 (5.5)High school completed 17,019 (16.4) 19,880 (19.2) 22,604 (21.9) 24,055 (23.3) 17,750 (17.2)Post–high school 9,560 (9.2) 10,590 (10.2) 10,652 (10.3) 10,933 (10.6) 8,890 (8.6)Some college 25,852 (25.0) 24,470 (23.7) 21,809 (21.1) 21,616 (20.9) 25,854 (25.0)College and post graduate 43,103 (41.6) 39,343 (38.1) 38,347 (37.1) 36,498 (35.3) 42,001 (40.6)Unknown 2,961 (2.9) 3,036 (2.9) 3,104 (3.0) 3,110 (3.0) 3,213 (3.1)
State of residenceCalifornia 49,086 (47.4) 26,087 (25.2) 12,303 (11.9) 13,238 (12.8) 59,495 (57.5)Florida 47,001 (45.4) 42,769 (41.4) 14,647 (14.2) 5,851 (5.7) 82 (0.1)Georgia 0 (0.0) 0 (0.0) 0 ( 0.0) 156 (0.2) 14,331 (13.9)Louisiana 265 (0.3) 3,717 (3.6) 12,150 (11.8) 3,295 (3.2) 145 (0.1)Michigan 78 (0.1) 1,157 (1.1) 3,051 (3.0) 15,546 (15.0) 6,307 (6.1)North Carolina 156 (0.2) 8,022 (7.8) 11,596 (11.2) 18,402 (17.8) 4,583 (4.4)New Jersey 4,585 (4.4) 14,568 (14.1) 29,238 (28.3) 14,657 (14.2) 2,149 (2.1)Pennsylvania 2,405 (2.3) 7,010 (6.8) 20,360 (19.7) 32,265 (31.2) 16,288 (15.8)
Contextual variables Median income ($) 57,399 ± 27,037 52,980 ± 23,695 53,453 ± 22,793 51,280 ± 20,502 53,746 ± 22,979Percent high school or less 13.6 ± 9.6 15.5 ± 10.0 15.6 ± 9.7 16.2 ± 9.8 18.0 ± 13.7
aNumber of participants in PM2.5 quintile, after accounting for missing covariate data.
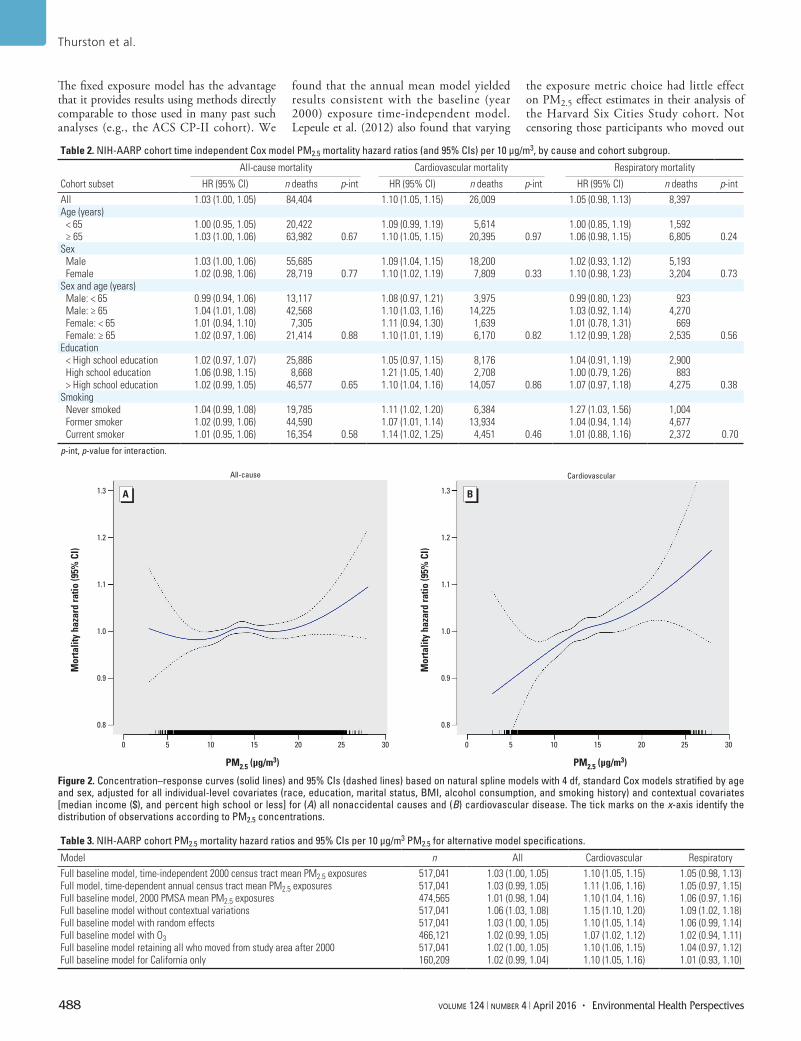
Thurston et al.
488 volume 124 | number 4 | April 2016 • Environmental Health Perspectives
The fixed exposure model has the advantage that it provides results using methods directly comparable to those used in many past such analyses (e.g., the ACS CP-II cohort). We
found that the annual mean model yielded results consistent with the baseline (year 2000) exposure time-independent model. Lepeule et al. (2012) also found that varying
the exposure metric choice had little effect on PM2.5 effect estimates in their analysis of the Harvard Six Cities Study cohort. Not censoring those participants who moved out
Table 2. NIH-AARP cohort time independent Cox model PM2.5 mortality hazard ratios (and 95% CIs) per 10 μg/m3, by cause and cohort subgroup.
Cohort subset
All-cause mortality Cardiovascular mortality Respiratory mortality
HR (95% CI) n deaths p-int HR (95% CI) n deaths p-int HR (95% CI) n deaths p-intAll 1.03 (1.00, 1.05) 84,404 1.10 (1.05, 1.15) 26,009 1.05 (0.98, 1.13) 8,397Age (years)
< 65 1.00 (0.95, 1.05) 20,422 1.09 (0.99, 1.19) 5,614 1.00 (0.85, 1.19) 1,592≥ 65 1.03 (1.00, 1.06) 63,982 0.67 1.10 (1.05, 1.15) 20,395 0.97 1.06 (0.98, 1.15) 6,805 0.24
SexMale 1.03 (1.00, 1.06) 55,685 1.09 (1.04, 1.15) 18,200 1.02 (0.93, 1.12) 5,193Female 1.02 (0.98, 1.06) 28,719 0.77 1.10 (1.02, 1.19) 7,809 0.33 1.10 (0.98, 1.23) 3,204 0.73
Sex and age (years)Male: < 65 0.99 (0.94, 1.06) 13,117 1.08 (0.97, 1.21) 3,975 0.99 (0.80, 1.23) 923Male: ≥ 65 1.04 (1.01, 1.08) 42,568 1.10 (1.03, 1.16) 14,225 1.03 (0.92, 1.14) 4,270Female: < 65 1.01 (0.94, 1.10) 7,305 1.11 (0.94, 1.30) 1,639 1.01 (0.78, 1.31) 669Female: ≥ 65 1.02 (0.97, 1.06) 21,414 0.88 1.10 (1.01, 1.19) 6,170 0.82 1.12 (0.99, 1.28) 2,535 0.56
Education< High school education 1.02 (0.97, 1.07) 25,886 1.05 (0.97, 1.15) 8,176 1.04 (0.91, 1.19) 2,900High school education 1.06 (0.98, 1.15) 8,668 1.21 (1.05, 1.40) 2,708 1.00 (0.79, 1.26) 883> High school education 1.02 (0.99, 1.05) 46,577 0.65 1.10 (1.04, 1.16) 14,057 0.86 1.07 (0.97, 1.18) 4,275 0.38
Smoking Never smoked 1.04 (0.99, 1.08) 19,785 1.11 (1.02, 1.20) 6,384 1.27 (1.03, 1.56) 1,004Former smoker 1.02 (0.99, 1.06) 44,590 1.07 (1.01, 1.14) 13,934 1.04 (0.94, 1.14) 4,677Current smoker 1.01 (0.95, 1.06) 16,354 0.58 1.14 (1.02, 1.25) 4,451 0.46 1.01 (0.88, 1.16) 2,372 0.70
p-int, p-value for interaction.
Figure 2. Concentration–response curves (solid lines) and 95% CIs (dashed lines) based on natural spline models with 4 df, standard Cox models stratified by age and sex, adjusted for all individual-level covariates (race, education, marital status, BMI, alcohol consumption, and smoking history) and contextual covariates [median income ($), and percent high school or less] for (A) all nonaccidental causes and (B) cardiovascular disease. The tick marks on the x-axis identify the distribution of observations according to PM2.5 concentrations.
1.3
1.2
1.1
1.0
0.9
0.8
1.3
1.2
1.1
1.0
0.9
0.8
Mor
talit
y ha
zard
ratio
(95%
CI)
All-cause Cardiovascular
Mor
talit
y ha
zard
ratio
(95%
CI)
0 5 10 15 20 25
PM2.5 (µg/m3) PM2.5 (µg/m3)
30 0 5 10 15 20 25 30
Table 3. NIH-AARP cohort PM2.5 mortality hazard ratios and 95% CIs per 10 μg/m3 PM2.5 for alternative model specifications.
Model n All Cardiovascular RespiratoryFull baseline model, time-independent 2000 census tract mean PM2.5 exposures 517,041 1.03 (1.00, 1.05) 1.10 (1.05, 1.15) 1.05 (0.98, 1.13)Full model, time-dependent annual census tract mean PM2.5 exposures 517,041 1.03 (0.99, 1.05) 1.11 (1.06, 1.16) 1.05 (0.97, 1.15)Full baseline model, 2000 PMSA mean PM2.5 exposures 474,565 1.01 (0.98, 1.04) 1.10 (1.04, 1.16) 1.06 (0.97, 1.16)Full baseline model without contextual variations 517,041 1.06 (1.03, 1.08) 1.15 (1.10, 1.20) 1.09 (1.02, 1.18)Full baseline model with random effects 517,041 1.03 (1.00, 1.05) 1.10 (1.05, 1.14) 1.06 (0.99, 1.14)Full baseline model with O3 466,121 1.02 (0.99, 1.05) 1.07 (1.02, 1.12) 1.02 (0.94, 1.11)Full baseline model retaining all who moved from study area after 2000 517,041 1.02 (1.00, 1.05) 1.10 (1.06, 1.15) 1.04 (0.97, 1.12)Full baseline model for California only 160,209 1.02 (0.99, 1.04) 1.10 (1.05, 1.16) 1.01 (0.93, 1.10)
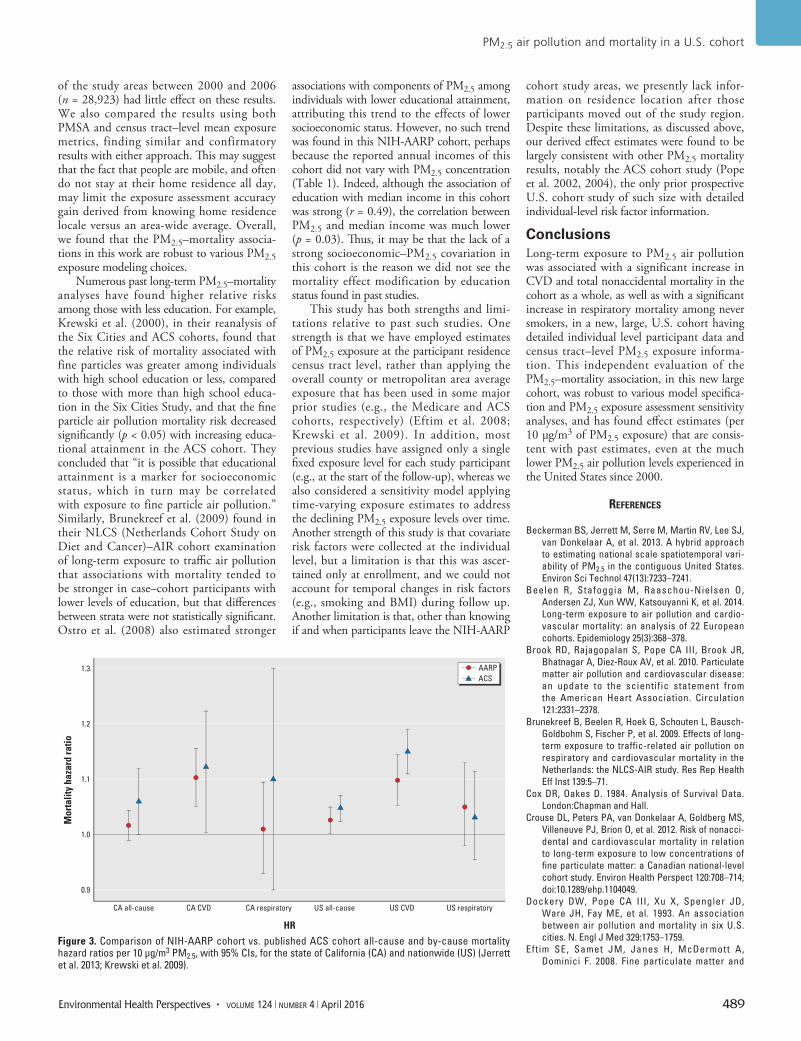
PM2.5 air pollution and mortality in a U.S. cohort
Environmental Health Perspectives • volume 124 | number 4 | April 2016 489
of the study areas between 2000 and 2006 (n = 28,923) had little effect on these results. We also compared the results using both PMSA and census tract–level mean exposure metrics, finding similar and confirmatory results with either approach. This may suggest that the fact that people are mobile, and often do not stay at their home residence all day, may limit the exposure assessment accuracy gain derived from knowing home residence locale versus an area-wide average. Overall, we found that the PM2.5–mortality associa-tions in this work are robust to various PM2.5 exposure modeling choices.
Numerous past long-term PM2.5–mortality analyses have found higher relative risks among those with less education. For example, Krewski et al. (2000), in their reanalysis of the Six Cities and ACS cohorts, found that the relative risk of mortality associated with fine particles was greater among individuals with high school education or less, compared to those with more than high school educa-tion in the Six Cities Study, and that the fine particle air pollution mortality risk decreased significantly (p < 0.05) with increasing educa-tional attainment in the ACS cohort. They concluded that “it is possible that educational attainment is a marker for socioeconomic status, which in turn may be correlated with exposure to fine particle air pollution.” Similarly, Brunekreef et al. (2009) found in their NLCS (Netherlands Cohort Study on Diet and Cancer)–AIR cohort examination of long-term exposure to traffic air pollution that associations with mortality tended to be stronger in case–cohort participants with lower levels of education, but that differences between strata were not statistically significant. Ostro et al. (2008) also estimated stronger
associations with components of PM2.5 among individuals with lower educational attainment, attributing this trend to the effects of lower socioeconomic status. However, no such trend was found in this NIH-AARP cohort, perhaps because the reported annual incomes of this cohort did not vary with PM2.5 concentration (Table 1). Indeed, although the association of education with median income in this cohort was strong (r = 0.49), the correlation between PM2.5 and median income was much lower (p = 0.03). Thus, it may be that the lack of a strong socioeconomic– PM2.5 covariation in this cohort is the reason we did not see the mortality effect modification by education status found in past studies.
This study has both strengths and limi-tations relative to past such studies. One strength is that we have employed estimates of PM2.5 exposure at the participant residence census tract level, rather than applying the overall county or metropolitan area average exposure that has been used in some major prior studies (e.g., the Medicare and ACS cohorts, respectively) (Eftim et al. 2008; Krewski et al. 2009). In addition, most previous studies have assigned only a single fixed exposure level for each study participant (e.g., at the start of the follow-up), whereas we also considered a sensitivity model applying time-varying exposure estimates to address the declining PM2.5 exposure levels over time. Another strength of this study is that covariate risk factors were collected at the individual level, but a limitation is that this was ascer-tained only at enrollment, and we could not account for temporal changes in risk factors (e.g., smoking and BMI) during follow up. Another limitation is that, other than knowing if and when participants leave the NIH-AARP
cohort study areas, we presently lack infor-mation on residence location after those participants moved out of the study region. Despite these limitations, as discussed above, our derived effect estimates were found to be largely consistent with other PM2.5 mortality results, notably the ACS cohort study (Pope et al. 2002, 2004), the only prior prospective U.S. cohort study of such size with detailed individual-level risk factor information.
ConclusionsLong-term exposure to PM2.5 air pollution was associated with a significant increase in CVD and total nonaccidental mortality in the cohort as a whole, as well as with a significant increase in respiratory mortality among never smokers, in a new, large, U.S. cohort having detailed individual level participant data and census tract–level PM2.5 exposure informa-tion. This independent evaluation of the PM2.5–mortality association, in this new large cohort, was robust to various model specifica-tion and PM2.5 exposure assessment sensitivity analyses, and has found effect estimates (per 10 μg/m3 of PM2.5 exposure) that are consis-tent with past estimates, even at the much lower PM2.5 air pollution levels experienced in the United States since 2000.
RefeRences
Beckerman BS, Jerrett M, Serre M, Martin RV, Lee SJ, van Donkelaar A, et al. 2013. A hybrid approach to estimating national scale spatiotemporal vari-ability of PM2.5 in the contiguous United States. Environ Sci Technol 47(13):7233–7241.
Beelen R, Stafoggia M, Raaschou-Nielsen O, Andersen ZJ, Xun WW, Katsouyanni K, et al. 2014. Long-term exposure to air pollution and cardio-vascular mortality: an analysis of 22 European cohorts. Epidemiology 25(3):368–378.
Brook RD, Rajagopalan S, Pope CA III, Brook JR, Bhatnagar A, Diez-Roux AV, et al. 2010. Particulate matter air pollution and cardiovascular disease: an update to the scientific statement from the American Heart Association. Circulation 121:2331–2378.
Brunekreef B, Beelen R, Hoek G, Schouten L, Bausch-Goldbohm S, Fischer P, et al. 2009. Effects of long-term exposure to traffic-related air pollution on respiratory and cardiovascular mortality in the Netherlands: the NLCS-AIR study. Res Rep Health Eff Inst 139:5–71.
Cox DR, Oakes D. 1984. Analysis of Survival Data. London:Chapman and Hall.
Crouse DL, Peters PA, van Donkelaar A, Goldberg MS, Villeneuve PJ, Brion O, et al. 2012. Risk of nonacci-dental and cardiovascular mortality in relation to long-term exposure to low concentrations of fine particulate matter: a Canadian national-level cohort study. Environ Health Perspect 120:708–714; doi:10.1289/ehp.1104049.
Dockery DW, Pope CA III, Xu X, Spengler JD, Ware JH, Fay ME, et al. 1993. An association between air pollution and mortality in six U.S. cities. N. Engl J Med 329:1753–1759.
Eftim SE, Samet JM, Janes H, McDermott A, Dominici F. 2008. Fine particulate matter and
Figure 3. Comparison of NIH-AARP cohort vs. published ACS cohort all-cause and by-cause mortality hazard ratios per 10 μg/m3 PM2.5, with 95% CIs, for the state of California (CA) and nationwide (US) (Jerrett et al. 2013; Krewski et al. 2009).
1.3
1.2
1.1
1.0
0.9
Mor
talit
y ha
zard
ratio
CA all-cause CA CVD CA respiratory US respiratoryUS all-cause
HR
US CVD
AARPACS
Thurston et al.
490 volume 124 | number 4 | April 2016 • Environmental Health Perspectives
mortality: a comparison of the Six Cities and American Cancer Society cohorts with a Medicare cohort. Epidemiology 19:209–216.
Fleming TR, Harrington DP. 1991. Counting Processes and Survival Analysis. New York:John Wiley.
Hoek G, Krishnan RM, Beelen R, Peters A, Ostro B, Brunekreef B, et al. 2013. Long-term air pollution exposure and cardio-respiratory mortality: a review. Environ Health 12:43; doi:10.1186/1476-069X-12-43.
Jerrett M, Burnett RT, Beckerman BS, Turner MC, Krewski D, Thurston G, et al. 2013. Spatial analysis of air pollution and mortality in California. Am J Respir Crit Care Med 188(5):593–599.
Krewski D, Burnett RT, Goldberg MS, Hoover K, Siemiatycki J, Abrahamowicz M, et al. 2000. Part II: Sensitivity Analyses. In: Reanalysis of the Harvard Six Cities Study and the American Cancer Society Study of Particulate Air Pollution and Mortality. A Special Report of the Institute’s Particle Epidemiology Reanalysis Project. Cambridge, MA:Health Effects Institute.
Krewski D, Jerrett M, Burnett RT, Ma R, Hughes E, Shi Y, et al. 2009. Extended follow-up and spatial analysis of the American Cancer Society study linking particulate air pollution and mortality. Res Rep Health Effects Inst 140:5–114.
Lepeule J, Laden F, Dockery D, Schwartz J. 2012. Chronic exposure to fine particles and mortality: an extended follow-up of the Harvard Six Cities study from 1974 to 2009. Environ Health Perspect 120(7):965–970; doi:10.1289/ehp.1104660.
Michaud DS, Midthune D, Hermansen S, Leitzmann M,
Harlan LC, Kipnis V, et al. 2005. Comparison of cancer registry case ascertainment with SEER estimates and self-reporting in a subset of the NIH-AARP Diet and Health Study. J Registry Manag 32:70–75.
NIH-AARP (National Institutes of Health and AARP Diet and Health Study). 2006. Data Dictionary. August 2006. Available: http://dietandhealth.cancer.gov/docs/DataDictionary_Aug2006.pdf [accessed 18 February 2009].
Ostro BD, Feng WY, Broadwin R, Malig BJ, Green RS, Lipsett MJ. 2008. The impact of components of fine particulate matter on cardiovascular mortality in susceptible subpopulations. Occup Environ Med 65:750–756.
Ostro B, Lipsett M, Reynolds P, Goldberg D, Hertz A, Garcia C, et al. 2010. Long-term exposure to constituents of fine particulate air pollution and mortality: results from the California Teachers Study. Environ Health Perspect 118:363–369; doi:10.1289/ehp.0901181.
Ozkaynak H, Thurston GD. 1987. Associations between 1980 U.S. mortality rates and alternative measures of airborne particle concentration. Risk Anal 7:449–460.
Pope CA III, Burnett RT, Thun MJ, Calle EE, Krewski D, Ito K, et al. 2002. Lung cancer, cardiopulmonary mortality, and long-term exposure to fine particu-late air pollution. JAMA 287:1132–1141.
Pope CA III, Burnett RT, Thurston GD, Thun MJ, Calle EE, Krewski D, et al. 2004. Cardiovascular mortality and long-term exposure to particu-late air pollution: epidemiological evidence of
general pathophysiological pathways of disease. Circulation 109:71–77.
Pope CA III, Thun MJ, Namboodiri MM, Dockery DW, Evans JS, Speizer FE, et al. 1995. Particulate air pollution as a predictor of mortality in a prospec-tive study of U.S. adults. Am J Respir Crit Care Med 151(3 pt 1):669–674.
R Core Team. 2013. R: A language and Environment for Statistical Computing. Vienna, Austria:R Foundation for Statistical Computing. Available: http://www.R-project.org [accessed 16 May 2013].
Reis P. 2013. GOP, Harvard, EPA Grapple over Landmark Health Study. 2013. National Journal (Washington, DC) 12 September. Available: http://www.nationaljournal.com/magazine/gop-harvard-epa-grapple-over-landmark-health-study-20130912 [accessed 2 January 2015].
Schatzkin A, Subar AF, Thompson FE, Harlan LC, Tangrea J, Hollenbeck AR, et al. 2001. Design and serendipity in establishing a large cohort with wide dietary intake distributions: the National Institutes of Health–American Association of Retired Persons Diet and Health Study. Am J Epidemiol 154(12):1119–1125.
U.S. EPA (U.S. Environmental Protection Agency). 2009. Integrated Science Assessment for Particulate Matter (Final Report). EPA/600/R-08/139F. Washington, DC:U.S. EPA.
U.S. EPA. 2014. AirData. Download Data Files. Avaialble: http://aqsdr1.epa.gov/aqsweb/aqstmp/airdata/download_files.html [accessed 14 April 2014].
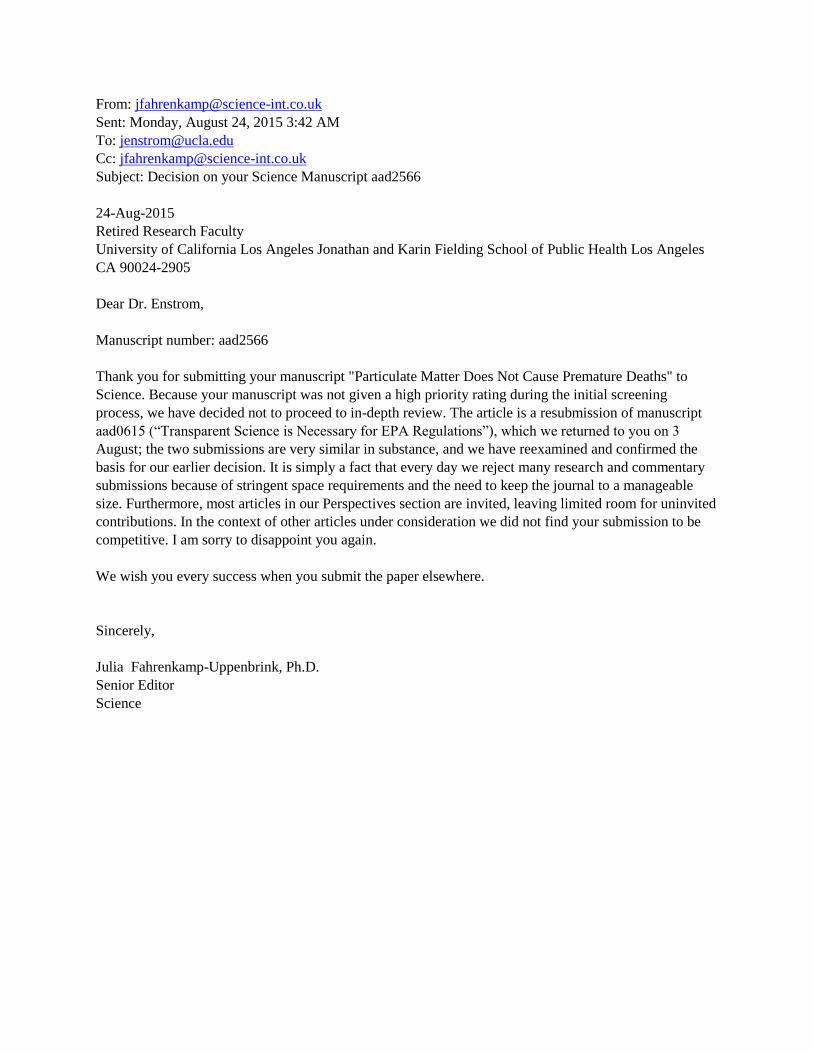
From: [email protected]
Sent: Monday, August 24, 2015 3:42 AM
Subject: Decision on your Science Manuscript aad2566
24-Aug-2015
Retired Research Faculty
University of California Los Angeles Jonathan and Karin Fielding School of Public Health Los Angeles
CA 90024-2905
Dear Dr. Enstrom,
Manuscript number: aad2566
Thank you for submitting your manuscript "Particulate Matter Does Not Cause Premature Deaths" to
Science. Because your manuscript was not given a high priority rating during the initial screening
process, we have decided not to proceed to in-depth review. The article is a resubmission of manuscript
aad0615 (“Transparent Science is Necessary for EPA Regulations”), which we returned to you on 3
August; the two submissions are very similar in substance, and we have reexamined and confirmed the
basis for our earlier decision. It is simply a fact that every day we reject many research and commentary
submissions because of stringent space requirements and the need to keep the journal to a manageable
size. Furthermore, most articles in our Perspectives section are invited, leaving limited room for uninvited
contributions. In the context of other articles under consideration we did not find your submission to be
competitive. I am sorry to disappoint you again.
We wish you every success when you submit the paper elsewhere.
Sincerely,
Julia Fahrenkamp-Uppenbrink, Ph.D.
Senior Editor
Science
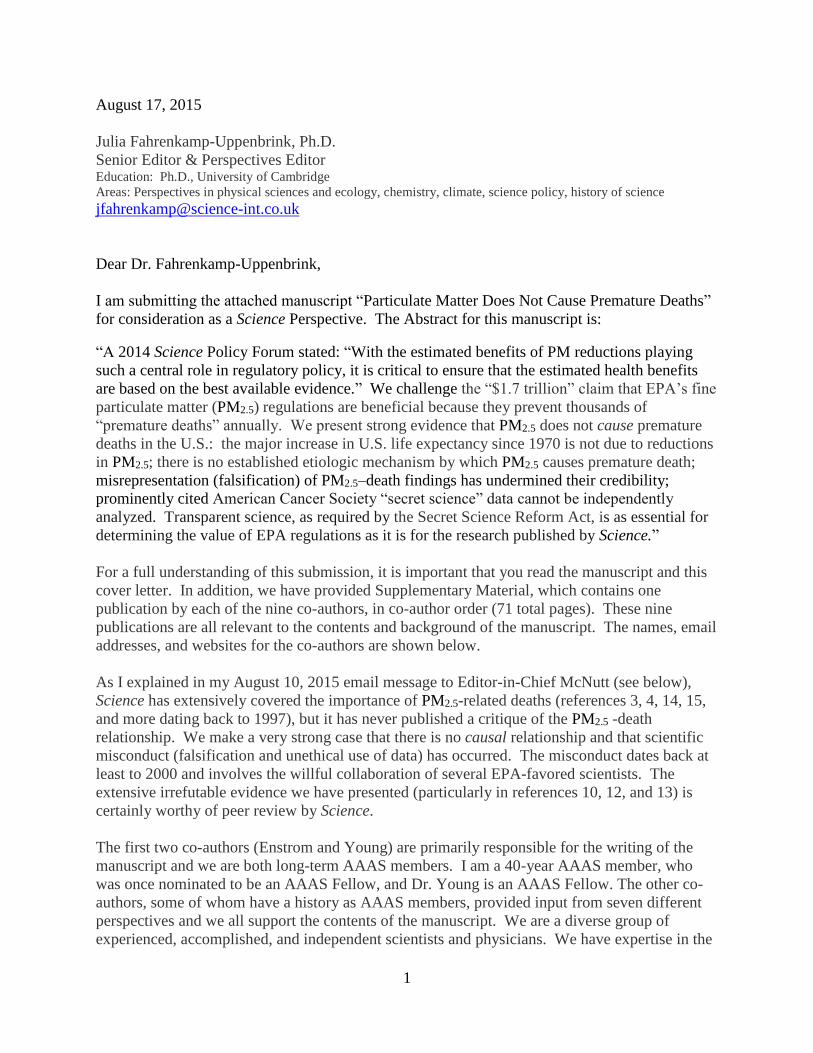
1
August 17, 2015
Julia Fahrenkamp-Uppenbrink, Ph.D.
Senior Editor & Perspectives Editor Education: Ph.D., University of Cambridge
Areas: Perspectives in physical sciences and ecology, chemistry, climate, science policy, history of science
Dear Dr. Fahrenkamp-Uppenbrink,
I am submitting the attached manuscript “Particulate Matter Does Not Cause Premature Deaths”
for consideration as a Science Perspective. The Abstract for this manuscript is:
“A 2014 Science Policy Forum stated: “With the estimated benefits of PM reductions playing
such a central role in regulatory policy, it is critical to ensure that the estimated health benefits
are based on the best available evidence.” We challenge the “$1.7 trillion” claim that EPA’s fine
particulate matter (PM2.5) regulations are beneficial because they prevent thousands of
“premature deaths” annually. We present strong evidence that PM2.5 does not cause premature
deaths in the U.S.: the major increase in U.S. life expectancy since 1970 is not due to reductions
in PM2.5; there is no established etiologic mechanism by which PM2.5 causes premature death;
misrepresentation (falsification) of PM2.5–death findings has undermined their credibility;
prominently cited American Cancer Society “secret science” data cannot be independently
analyzed. Transparent science, as required by the Secret Science Reform Act, is as essential for
determining the value of EPA regulations as it is for the research published by Science.”
For a full understanding of this submission, it is important that you read the manuscript and this
cover letter. In addition, we have provided Supplementary Material, which contains one
publication by each of the nine co-authors, in co-author order (71 total pages). These nine
publications are all relevant to the contents and background of the manuscript. The names, email
addresses, and websites for the co-authors are shown below.
As I explained in my August 10, 2015 email message to Editor-in-Chief McNutt (see below),
Science has extensively covered the importance of PM2.5-related deaths (references 3, 4, 14, 15,
and more dating back to 1997), but it has never published a critique of the PM2.5 -death
relationship. We make a very strong case that there is no causal relationship and that scientific
misconduct (falsification and unethical use of data) has occurred. The misconduct dates back at
least to 2000 and involves the willful collaboration of several EPA-favored scientists. The
extensive irrefutable evidence we have presented (particularly in references 10, 12, and 13) is
certainly worthy of peer review by Science.
The first two co-authors (Enstrom and Young) are primarily responsible for the writing of the
manuscript and we are both long-term AAAS members. I am a 40-year AAAS member, who
was once nominated to be an AAAS Fellow, and Dr. Young is an AAAS Fellow. The other co-
authors, some of whom have a history as AAAS members, provided input from seven different
perspectives and we all support the contents of the manuscript. We are a diverse group of
experienced, accomplished, and independent scientists and physicians. We have expertise in the
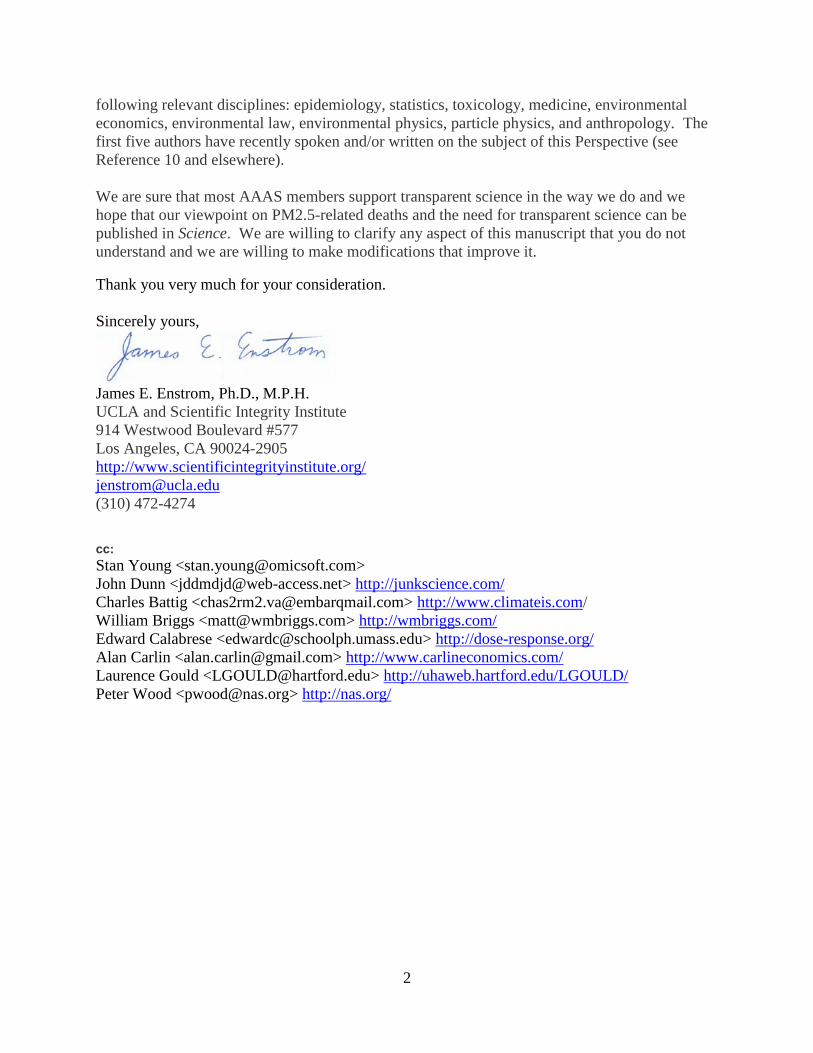
2
following relevant disciplines: epidemiology, statistics, toxicology, medicine, environmental
economics, environmental law, environmental physics, particle physics, and anthropology. The
first five authors have recently spoken and/or written on the subject of this Perspective (see
Reference 10 and elsewhere).
We are sure that most AAAS members support transparent science in the way we do and we
hope that our viewpoint on PM2.5-related deaths and the need for transparent science can be
published in Science. We are willing to clarify any aspect of this manuscript that you do not
understand and we are willing to make modifications that improve it.
Thank you very much for your consideration.
Sincerely yours,
James E. Enstrom, Ph.D., M.P.H.
UCLA and Scientific Integrity Institute
914 Westwood Boulevard #577
Los Angeles, CA 90024-2905
http://www.scientificintegrityinstitute.org/
(310) 472-4274 cc:
Stan Young <[email protected]>
John Dunn <[email protected]> http://junkscience.com/
Charles Battig <[email protected]> http://www.climateis.com/
William Briggs <[email protected]> http://wmbriggs.com/
Edward Calabrese <[email protected]> http://dose-response.org/
Alan Carlin <[email protected]> http://www.carlineconomics.com/
Laurence Gould <[email protected]> http://uhaweb.hartford.edu/LGOULD/
Peter Wood <[email protected]> http://nas.org/
3
From: Marcia McNutt <[email protected]>
Sent: Monday, August 10, 2015 12:29 PM
To: James E. Enstrom <[email protected]>
Subject: Re: Reconsider Decision on Science Manuscript aad0615
Dear Dr. Enstrom:
I looked into the history of this submission and discussed it with the Editor. As you can perhaps
appreciate, we need to be consistent in how we handle various types of content that we receive.
In the case of your submission, on one hand the essay was presented as an alternative view to the
Rosenberg et al. PF. We have already published quite a few letters to the editor that express
alternate viewpoints and support for the Secret Science Act. If you have additional points that
have not already been made in any of the letters we have already published, our Letters editor
would be pleased to consider publishing an additional letter from you.
On the other hand, there were some elements of your policy forum submission that were only
marginally connected to the Rosenberg piece, and were instead discussing the public health
impacts of PM2.5. That issue needs to be submitted as a research article and reviewed as such,
rather than as a policy forum. That would be a rather different sort of submission.
I hope this explanation helps you decide in what direction to take your manuscript.
Marcia McNutt
AAASAAASAAASAAASAAASAAASAAASAAASAAASAAASAAAS
Dr. Marcia K. McNutt
Editor-in-Chief, Science family of journals
American Association for the Advancement of Science
1200 New York Avenue N.W.
Washington, D.C. 20005
(202) 326-6505 (w)
(831) 915-4699 (c)
AAASAAASAAASAAASAAASAAASAAASAAASAAASAAASAAAS
From: "James E. Enstrom" <[email protected]>
Date: Monday, August 10, 2015 at 5:59 AM
To: Marcia McNutt <[email protected]>
Subject: Reconsider Decision on Science Manuscript aad0615
August 10, 2015
4
Marcia K. McNutt, Ph.D.
Editor-in-Chief, Science
Dear Editor-in-Chief McNutt,
I request that you reconsider the August 3, 2015 rejection by Editor Brad Wible of the July 20,
2015 Science Policy Forum Manuscript aad0615 "Transparent Science is Necessary for EPA
Regulations". Because of the strength of the evidence that it contains, I request that the
manuscript undergo full in-depth review. If you have not done so, I request that you briefly
examine the manuscript itself ( http://www.scientificintegrityinstitute.org/PFPaper072015.pdf),
the detailed cover letter ( http://www.scientificintegrityinstitute.org/PFLetter072015.pdf), the 71-
page supplement ( http://www.scientificintegrityinstitute.org/PFSupp072015.pdf), my June 4,
2015 email message to you ( http://www.scientificintegrityinstitute.org/McNuttWSJ060415.pdf),
and the outstanding credentials of the nine co-authors (as stated on their personal websites).
Reference 10 of the manuscript contains overwhelming and indisputable evidence of scientific
misconduct (falsification) by major investigators who have published key epidemiologic research
on the relationship between PM2.5 and mortality. Reference 12 contains clear evidence that the
research of these same investigators has violated a 1982 ACS confidentiality statement to CPS II
research subjects. This evidence warrants in-depth peer review by Science.
For the record, Science has never published a major article which challenges the claim the air
pollution (particularly PM2.5) currently causes “premature death” in the United States,
particularly in California. However, Science has published several major articles which promote
the dangers of air pollution, including the August 21, 1970 article on “Air Pollution and Human
Health” ( http://www.sciencemag.org/content/169/3947/723.full.pdf), the February 14, 1992
article on “Valuing the Health Benefits of Clean Air”
(http://www.sciencemag.org/content/255/5046/812.full.pdf), the April 18, 2014 Policy Forum on
“Particulate Matter Matters” ( http://www.sciencemag.org/content/344/6181/257.full.pdf), and
the May 29, 2015 Policy Forum on “Congress’s Attacks on Science-based Rules”
(http://www.sciencemag.org/content/348/6238/964.full.pdf).
In the interest of objectivity and integrity regarding an environmental science issue of national
significance, Science should peer review this manuscript. Please let me know your decision.
Thank you very much.
Sincerely yours,
James E. Enstrom, Ph.D., M.P.H.
UCLA and Scientific Integrity Institute
http://www.scientificintegrityinstitute.org/
(310) 472-4274
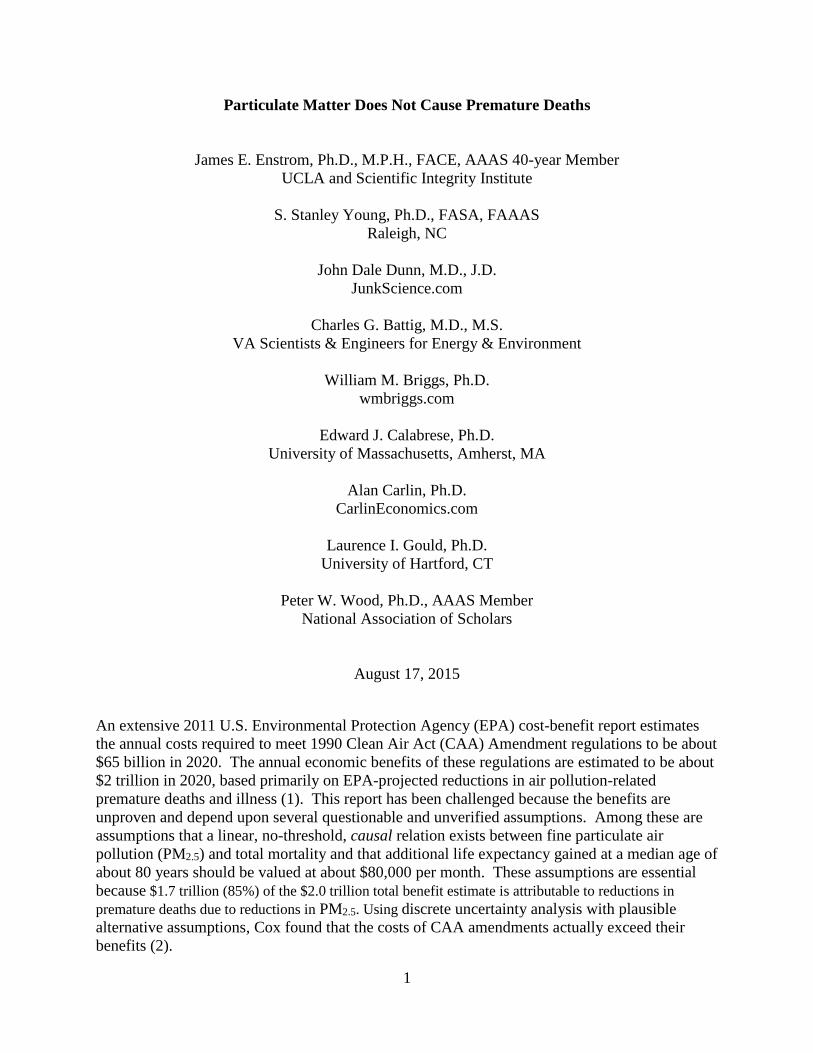
1
Particulate Matter Does Not Cause Premature Deaths
James E. Enstrom, Ph.D., M.P.H., FACE, AAAS 40-year Member
UCLA and Scientific Integrity Institute
S. Stanley Young, Ph.D., FASA, FAAAS
Raleigh, NC
John Dale Dunn, M.D., J.D.
JunkScience.com
Charles G. Battig, M.D., M.S.
VA Scientists & Engineers for Energy & Environment
William M. Briggs, Ph.D.
wmbriggs.com
Edward J. Calabrese, Ph.D.
University of Massachusetts, Amherst, MA
Alan Carlin, Ph.D.
CarlinEconomics.com
Laurence I. Gould, Ph.D.
University of Hartford, CT
Peter W. Wood, Ph.D., AAAS Member
National Association of Scholars
August 17, 2015
An extensive 2011 U.S. Environmental Protection Agency (EPA) cost-benefit report estimates
the annual costs required to meet 1990 Clean Air Act (CAA) Amendment regulations to be about
$65 billion in 2020. The annual economic benefits of these regulations are estimated to be about
$2 trillion in 2020, based primarily on EPA-projected reductions in air pollution-related
premature deaths and illness (1). This report has been challenged because the benefits are
unproven and depend upon several questionable and unverified assumptions. Among these are
assumptions that a linear, no-threshold, causal relation exists between fine particulate air
pollution (PM2.5) and total mortality and that additional life expectancy gained at a median age of
about 80 years should be valued at about $80,000 per month. These assumptions are essential
because $1.7 trillion (85%) of the $2.0 trillion total benefit estimate is attributable to reductions in
premature deaths due to reductions in PM2.5. Using discrete uncertainty analysis with plausible
alternative assumptions, Cox found that the costs of CAA amendments actually exceed their
benefits (2).
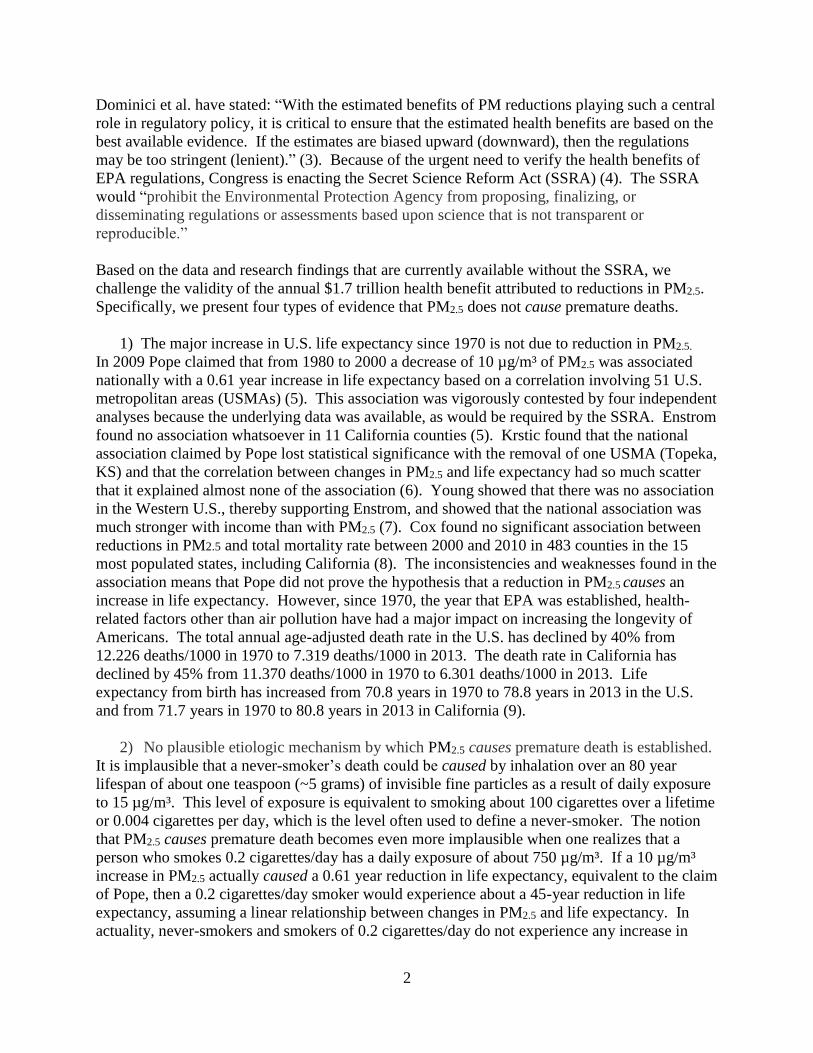
2
Dominici et al. have stated: “With the estimated benefits of PM reductions playing such a central
role in regulatory policy, it is critical to ensure that the estimated health benefits are based on the
best available evidence. If the estimates are biased upward (downward), then the regulations
may be too stringent (lenient).” (3). Because of the urgent need to verify the health benefits of
EPA regulations, Congress is enacting the Secret Science Reform Act (SSRA) (4). The SSRA
would “prohibit the Environmental Protection Agency from proposing, finalizing, or
disseminating regulations or assessments based upon science that is not transparent or
reproducible.”
Based on the data and research findings that are currently available without the SSRA, we
challenge the validity of the annual $1.7 trillion health benefit attributed to reductions in PM2.5.
Specifically, we present four types of evidence that PM2.5 does not cause premature deaths.
1) The major increase in U.S. life expectancy since 1970 is not due to reduction in PM2.5.
In 2009 Pope claimed that from 1980 to 2000 a decrease of 10 µg/m³ of PM2.5 was associated
nationally with a 0.61 year increase in life expectancy based on a correlation involving 51 U.S.
metropolitan areas (USMAs) (5). This association was vigorously contested by four independent
analyses because the underlying data was available, as would be required by the SSRA. Enstrom
found no association whatsoever in 11 California counties (5). Krstic found that the national
association claimed by Pope lost statistical significance with the removal of one USMA (Topeka,
KS) and that the correlation between changes in PM2.5 and life expectancy had so much scatter
that it explained almost none of the association (6). Young showed that there was no association
in the Western U.S., thereby supporting Enstrom, and showed that the national association was
much stronger with income than with PM2.5 (7). Cox found no significant association between
reductions in PM2.5 and total mortality rate between 2000 and 2010 in 483 counties in the 15
most populated states, including California (8). The inconsistencies and weaknesses found in the
association means that Pope did not prove the hypothesis that a reduction in PM2.5 causes an
increase in life expectancy. However, since 1970, the year that EPA was established, health-
related factors other than air pollution have had a major impact on increasing the longevity of
Americans. The total annual age-adjusted death rate in the U.S. has declined by 40% from
12.226 deaths/1000 in 1970 to 7.319 deaths/1000 in 2013. The death rate in California has
declined by 45% from 11.370 deaths/1000 in 1970 to 6.301 deaths/1000 in 2013. Life
expectancy from birth has increased from 70.8 years in 1970 to 78.8 years in 2013 in the U.S.
and from 71.7 years in 1970 to 80.8 years in 2013 in California (9).
2) No plausible etiologic mechanism by which PM2.5 causes premature death is established.
It is implausible that a never-smoker’s death could be caused by inhalation over an 80 year
lifespan of about one teaspoon (~5 grams) of invisible fine particles as a result of daily exposure
to 15 µg/m³. This level of exposure is equivalent to smoking about 100 cigarettes over a lifetime
or 0.004 cigarettes per day, which is the level often used to define a never-smoker. The notion
that PM2.5 causes premature death becomes even more implausible when one realizes that a
person who smokes 0.2 cigarettes/day has a daily exposure of about 750 µg/m³. If a 10 µg/m³
increase in PM2.5 actually caused a 0.61 year reduction in life expectancy, equivalent to the claim
of Pope, then a 0.2 cigarettes/day smoker would experience about a 45-year reduction in life
expectancy, assuming a linear relationship between changes in PM2.5 and life expectancy. In
actuality, never-smokers and smokers of 0.2 cigarettes/day do not experience any increase in
3
total death rate or decrease in life expectancy, in spite of a 50-fold greater exposure to PM2.5
(10). Furthermore, hundreds of toxicology experiments on both animals and humans have not
proven that PM2.5 at levels up to 750 µg/m³ causes death. Finally, the small relative risks of
death and other biases and weaknesses of the PM2.5 epidemiologic studies do not meet the
standards of causality set by the 2011 Federal Judicial Center Reference Manual on Scientific
Evidence (11). The legal standard for causality in epidemiologic studies is a large relative risk
(RR > 2.0), not the small relative risk (RR ~ 1.1) typically found in PM2.5-mortality studies.
3) Misrepresentation of PM2.5–death findings has harmed the credibility of epidemiology.
The PM2.5-mortality relationship has been contested since 1993 because this small risk could be
due to well-known biases, such as, confounding variables and the ecological fallacy. In spite of
these biases, several major PM2.5 investigators continue to assert that selected positive findings
prove that PM2.5 causes death and they continue to ignore or dismiss null PM2.5 results. Enstrom
prepared a detailed November 15, 2013 document (5000 words of text with 77 URLs) which
describes many misrepresentations and exaggerations (12). In particular, Pope and others have
ignored null PM2.5 findings in California. Serious concerns about the PM2.5-mortality
relationship in California were expressed at a February 26, 2010 Symposium on “Estimating
Premature Deaths from Long-term Exposure to PM2.5” by the California Air Resources Board
(CARB). Vastly different viewpoints were expressed by scientists like Enstrom and Pope.
Although this Symposium could have led to better understanding and cooperation among PM2.5
investigators, it did not. For instance, three Symposium attendees (Pope, Jerrett, and Krewski),
published extensive findings in their October 28, 2011 CARB report showing that there was an
overall null relationship between PM2.5 and mortality in California, if one averaged the results
from all nine of their models. This null finding agrees exactly with the null findings of Enstrom
and others. However, in their subsequent September 1, 2013 AJRCCM paper, “Air Pollution and
Mortality in California,” they selectively published the positive findings found in one model, but
omitted the null findings of the eight other models in their 2011 report.
4) The American Cancer Society actively supports “secret science” PM2.5 epidemiology.
Since 1995 ACS has repeatedly allowed its 1982 Cancer Prevention Study (CPS II) data to be
selectively used for PM2.5 epidemiology research. However, ACS has refused to release the CPS
II data or allow analysis that addresses the legitimate concerns raised by qualified critics of this
“secret science” research. ACS is well aware of the scientific controversy generated by the
original 1995 Pope AJRCCM paper and subsequent papers that have been used by EPA as a
primary justification for its PM2.5 regulations. The demand for CPS II data access has increased
as PM2.5–related regulations have gotten stricter, more expensive, and more implausible. While
ACS refuses any independent access to its CPS II data, because of alleged concerns about subject
confidentiality, it has repeatedly allowed Pope and his collaborators to violate a confidentiality
pledge made to CPS II subjects. When personal questionnaire data was collected from CPS II
subjects upon enrollment in late 1982, ACS informed them with this exact sentence: “We will
never release information about any particular person and will not release addresses to any agency
for any purpose, whatsoever” (13). Both the September 1, 2013 AJRCCM paper and the new
January 2, 2015 Circulation Research paper by Pope include findings based on linking the home
address of each study subject to a geographically estimated PM2.5 concentration, in violation of
the 1982 agreement.
4
Our evidence that PM2.5 does not cause premature deaths invalidates the $1.7 trillion annual benefit
that EPA attributes to reductions in PM2.5 and supports Cox’s findings that the economic costs of EPA
CAA Amendment regulations exceed the resulting health benefits. Because the scientific and
economic stakes are high for America, there is an urgent need for transparency and
reproducibility in the science and data underlying EPA regulations, as required by the SSRA.
The data access requirement in the SSRA is very similar to the one Science has for its research
papers and to the one recently recommended by the editors of 30 major journals, including
Science (14). Even an environmental organization that objects to the SSRA, the Union of
Concerned Scientists, realizes that “public trust in science increases when we all have access to
the same base of evidence” (15).
References
1. U.S.Environmental Protection Agency. “The Benefits and Costs of the Clean Air Act
from 1990 to 2020” April 2011
(http://www.epa.gov/air/sect812/feb11/fullreport_rev_a.pdf)
2. L. A. Cox, Jr. Reassessing the human health benefits from cleaner air. Risk Anal
2012;32(5):816–829. DOI: 10.1111/j.1539-6924.2011.01698.x. Epub 2011 Nov 2.
3. F. Dominici, M. Greenstone, C. R. Sunstein. Policy Forum: Particulate matter matters.
Science 2014;344:257-259 (April 18, 2014) DOI: 10.1126/science.1247348
(http://www.sciencemag.org/content/344/6181/257.full.pdf)
4. S. Gallagher. AAAS Summary of the Secret Science Reform Act of 2015 (May 7, 2015)
(http://www.aaas.org/news/summary-secret-science-reform-act-2015)
5. J. E. Enstrom. Response to Pope “Fine-particulate air pollution and life expectancy in the
United States,” May 27, 2009 CARB Comment (http://www.arb.ca.gov/lists/gmove09/1-
carb_enstrom_comments_re_pm2.5_and_life_expectancy_052709.pdf)
6. G. Krstić. A reanalysis of fine particulate matter air pollution versus life expectancy in
the United States. J Air Waste Manage Assoc 2012;62(9):989-991. DOI:
10.1080/10962247.2012.697445
7. S. S. Young, J. Q. Xia. Assessing Geographic Heterogeneity and Variable Importance in
an Air Pollution Data Set. Statistical Analysis and Data Mining 2013;6:375–386.
DOI:10.1002/sam.11202
8. L. A. Cox, Jr., D. A. Popken. Has reducing fine particulate matter and ozone caused
reduced mortality rates in the United States? Annals Epidemiology 2015; 25:162-173.
DOI: 10.1016/j.annepidem.2014.11.006
5
9. NCHS National Vital Statistics Report (NVSR Volume 64, Number 2) “Deaths: Final
Data for 2013.” December 29, 2014
(http://www.cdc.gov/nchs/data/nvsr/nvsr64/nvsr64_02.pdf)
10. J. E. Enstrom, S. S. Young, C. Battig, J. D. Dunn. Tenth International Conference on
Climate Change, Panel 8 on Health Effects, June 11, 2015, Washington, DC
(http://climateconference.heartland.org/sessions/iccc10-panel-8-enstrom-young-battig/)
and (http://www.scientificintegrityinstitute.org/JEEICCC061115.pdf)
11. J. D. Dunn. Climate Conference Human Health Effects Research. JunkScience.com June
9, 2015 (http://junkscience.com/2015/06/09/72157/)
12. J. E. Enstrom. Public Comments to EPA on Clean Power Plan, December 1, 2014
(http://www.scientificintegrityinstitute.org/JEECPP120114.pdf)
13. J. E. Enstrom. Evidence ACS Violated 1982 CPS II Subject Confidentiality Statements
September 2, 2013 (http://www.scientificintegrityinstitute.org/Enstrom090213.pdf)
14. M. McNutt. Journals unite for reproducibility. Science 2014;346:679 (November 7, 2014)
(http://www.sciencemag.org/content/346/6210/679.full)
15. A. A. Rosenberg, L. M. Branscomb, V. Eady, P.C. Frumhoff, G. T. Goldman, M.
Halpern, K. Kimmell, Y. Kothari, L. D. Kramer, N. F. Lane, J. J. McCarthy, P. Phartiyal,
K. Rest, R. Sims, C. Wexler. Policy Forum: Congress's attacks on science-based rules.
Science 2015;348:964-966 (May 29, 2015) DOI: 10.1126/science.aab2939
(http://www.sciencemag.org/content/348/6238/964.full.pdf)
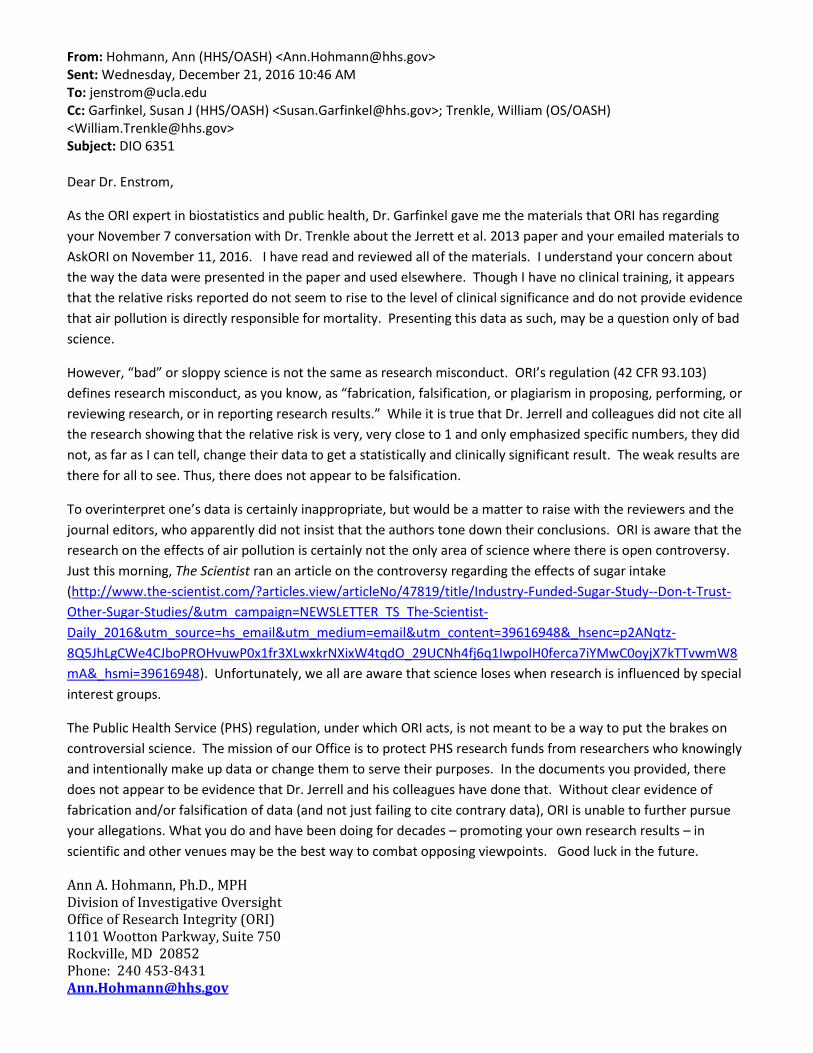
From: Hohmann, Ann (HHS/OASH) <[email protected]> Sent: Wednesday, December 21, 2016 10:46 AM To: [email protected] Cc: Garfinkel, Susan J (HHS/OASH) <[email protected]>; Trenkle, William (OS/OASH) <[email protected]> Subject: DIO 6351 Dear Dr. Enstrom,
As the ORI expert in biostatistics and public health, Dr. Garfinkel gave me the materials that ORI has regarding
your November 7 conversation with Dr. Trenkle about the Jerrett et al. 2013 paper and your emailed materials to
AskORI on November 11, 2016. I have read and reviewed all of the materials. I understand your concern about
the way the data were presented in the paper and used elsewhere. Though I have no clinical training, it appears
that the relative risks reported do not seem to rise to the level of clinical significance and do not provide evidence
that air pollution is directly responsible for mortality. Presenting this data as such, may be a question only of bad
science.
However, “bad” or sloppy science is not the same as research misconduct. ORI’s regulation (42 CFR 93.103)
defines research misconduct, as you know, as “fabrication, falsification, or plagiarism in proposing, performing, or
reviewing research, or in reporting research results.” While it is true that Dr. Jerrell and colleagues did not cite all
the research showing that the relative risk is very, very close to 1 and only emphasized specific numbers, they did
not, as far as I can tell, change their data to get a statistically and clinically significant result. The weak results are
there for all to see. Thus, there does not appear to be falsification.
To overinterpret one’s data is certainly inappropriate, but would be a matter to raise with the reviewers and the
journal editors, who apparently did not insist that the authors tone down their conclusions. ORI is aware that the
research on the effects of air pollution is certainly not the only area of science where there is open controversy.
Just this morning, The Scientist ran an article on the controversy regarding the effects of sugar intake
(http://www.the-scientist.com/?articles.view/articleNo/47819/title/Industry-Funded-Sugar-Study--Don-t-Trust-
Other-Sugar-Studies/&utm_campaign=NEWSLETTER_TS_The-Scientist-
Daily_2016&utm_source=hs_email&utm_medium=email&utm_content=39616948&_hsenc=p2ANqtz-
8Q5JhLgCWe4CJboPROHvuwP0x1fr3XLwxkrNXixW4tqdO_29UCNh4fj6q1IwpolH0ferca7iYMwC0oyjX7kTTvwmW8
mA&_hsmi=39616948). Unfortunately, we all are aware that science loses when research is influenced by special
interest groups.
The Public Health Service (PHS) regulation, under which ORI acts, is not meant to be a way to put the brakes on
controversial science. The mission of our Office is to protect PHS research funds from researchers who knowingly
and intentionally make up data or change them to serve their purposes. In the documents you provided, there
does not appear to be evidence that Dr. Jerrell and his colleagues have done that. Without clear evidence of
fabrication and/or falsification of data (and not just failing to cite contrary data), ORI is unable to further pursue
your allegations. What you do and have been doing for decades – promoting your own research results – in
scientific and other venues may be the best way to combat opposing viewpoints. Good luck in the future.
Ann A. Hohmann, Ph.D., MPH Division of Investigative Oversight Office of Research Integrity (ORI) 1101 Wootton Parkway, Suite 750 Rockville, MD 20852 Phone: 240 453-8431 [email protected]
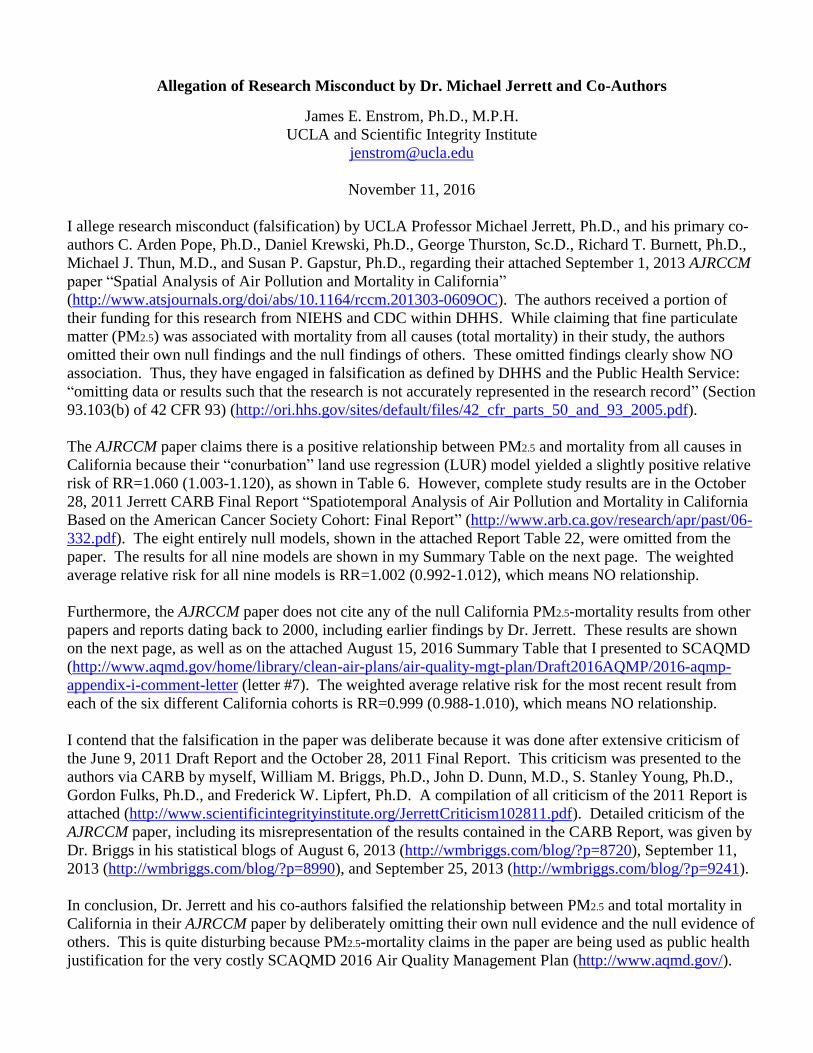
Allegation of Research Misconduct by Dr. Michael Jerrett and Co-Authors
James E. Enstrom, Ph.D., M.P.H.
UCLA and Scientific Integrity Institute
November 11, 2016
I allege research misconduct (falsification) by UCLA Professor Michael Jerrett, Ph.D., and his primary co-
authors C. Arden Pope, Ph.D., Daniel Krewski, Ph.D., George Thurston, Sc.D., Richard T. Burnett, Ph.D.,
Michael J. Thun, M.D., and Susan P. Gapstur, Ph.D., regarding their attached September 1, 2013 AJRCCM
paper “Spatial Analysis of Air Pollution and Mortality in California”
(http://www.atsjournals.org/doi/abs/10.1164/rccm.201303-0609OC). The authors received a portion of
their funding for this research from NIEHS and CDC within DHHS. While claiming that fine particulate
matter (PM2.5) was associated with mortality from all causes (total mortality) in their study, the authors
omitted their own null findings and the null findings of others. These omitted findings clearly show NO
association. Thus, they have engaged in falsification as defined by DHHS and the Public Health Service:
“omitting data or results such that the research is not accurately represented in the research record” (Section
93.103(b) of 42 CFR 93) (http://ori.hhs.gov/sites/default/files/42_cfr_parts_50_and_93_2005.pdf).
The AJRCCM paper claims there is a positive relationship between PM2.5 and mortality from all causes in
California because their “conurbation” land use regression (LUR) model yielded a slightly positive relative
risk of RR=1.060 (1.003-1.120), as shown in Table 6. However, complete study results are in the October
28, 2011 Jerrett CARB Final Report “Spatiotemporal Analysis of Air Pollution and Mortality in California
Based on the American Cancer Society Cohort: Final Report” (http://www.arb.ca.gov/research/apr/past/06-
332.pdf). The eight entirely null models, shown in the attached Report Table 22, were omitted from the
paper. The results for all nine models are shown in my Summary Table on the next page. The weighted
average relative risk for all nine models is RR=1.002 (0.992-1.012), which means NO relationship.
Furthermore, the AJRCCM paper does not cite any of the null California PM2.5-mortality results from other
papers and reports dating back to 2000, including earlier findings by Dr. Jerrett. These results are shown
on the next page, as well as on the attached August 15, 2016 Summary Table that I presented to SCAQMD
(http://www.aqmd.gov/home/library/clean-air-plans/air-quality-mgt-plan/Draft2016AQMP/2016-aqmp-
appendix-i-comment-letter (letter #7). The weighted average relative risk for the most recent result from
each of the six different California cohorts is RR=0.999 (0.988-1.010), which means NO relationship.
I contend that the falsification in the paper was deliberate because it was done after extensive criticism of
the June 9, 2011 Draft Report and the October 28, 2011 Final Report. This criticism was presented to the
authors via CARB by myself, William M. Briggs, Ph.D., John D. Dunn, M.D., S. Stanley Young, Ph.D.,
Gordon Fulks, Ph.D., and Frederick W. Lipfert, Ph.D. A compilation of all criticism of the 2011 Report is
attached (http://www.scientificintegrityinstitute.org/JerrettCriticism102811.pdf). Detailed criticism of the
AJRCCM paper, including its misrepresentation of the results contained in the CARB Report, was given by
Dr. Briggs in his statistical blogs of August 6, 2013 (http://wmbriggs.com/blog/?p=8720), September 11,
2013 (http://wmbriggs.com/blog/?p=8990), and September 25, 2013 (http://wmbriggs.com/blog/?p=9241).
In conclusion, Dr. Jerrett and his co-authors falsified the relationship between PM2.5 and total mortality in
California in their AJRCCM paper by deliberately omitting their own null evidence and the null evidence of
others. This is quite disturbing because PM2.5-mortality claims in the paper are being used as public health
justification for the very costly SCAQMD 2016 Air Quality Management Plan (http://www.aqmd.gov/).
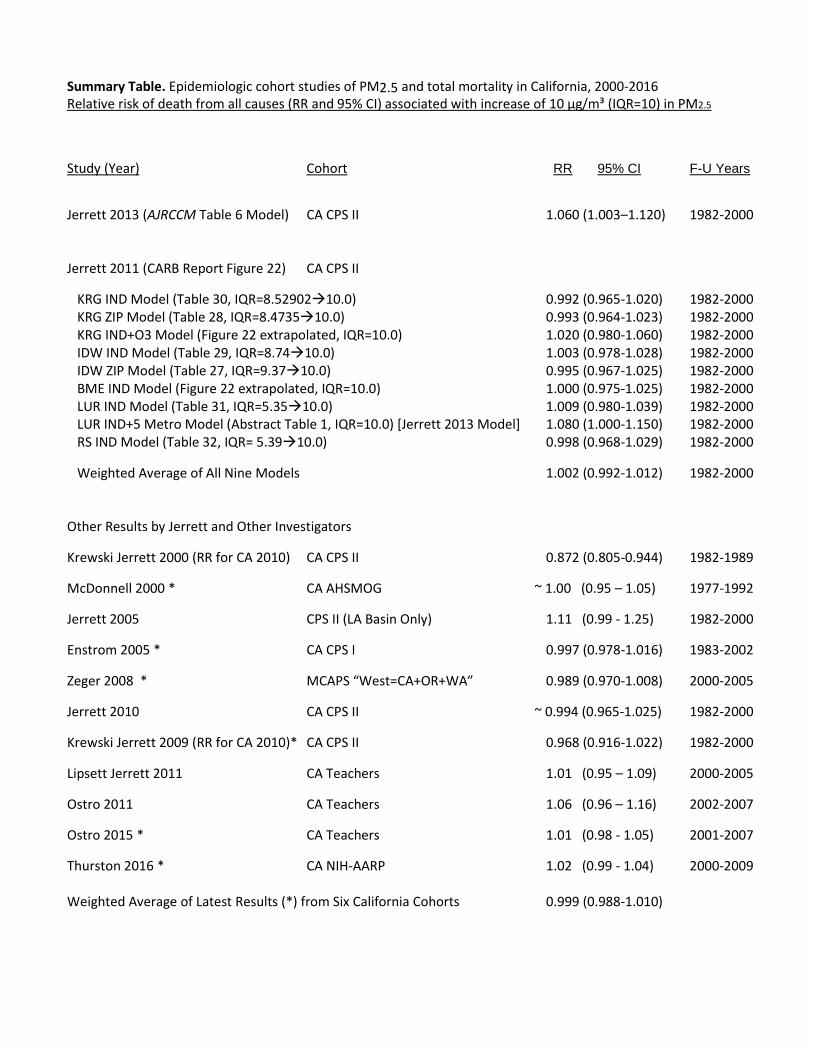
Summary Table. Epidemiologic cohort studies of PM2.5 and total mortality in California, 2000-2016 Relative risk of death from all causes (RR and 95% CI) associated with increase of 10 µg/m³ (IQR=10) in PM2.5
Study (Year) Cohort RR 95% CI F-U Years
Jerrett 2013 (AJRCCM Table 6 Model) CA CPS II 1.060 (1.003–1.120) 1982-2000 Jerrett 2011 (CARB Report Figure 22) CA CPS II KRG IND Model (Table 30, IQR=8.5290210.0) 0.992 (0.965-1.020) 1982-2000 KRG ZIP Model (Table 28, IQR=8.473510.0) 0.993 (0.964-1.023) 1982-2000 KRG IND+O3 Model (Figure 22 extrapolated, IQR=10.0) 1.020 (0.980-1.060) 1982-2000 IDW IND Model (Table 29, IQR=8.7410.0) 1.003 (0.978-1.028) 1982-2000 IDW ZIP Model (Table 27, IQR=9.3710.0) 0.995 (0.967-1.025) 1982-2000 BME IND Model (Figure 22 extrapolated, IQR=10.0) 1.000 (0.975-1.025) 1982-2000 LUR IND Model (Table 31, IQR=5.3510.0) 1.009 (0.980-1.039) 1982-2000 LUR IND+5 Metro Model (Abstract Table 1, IQR=10.0) [Jerrett 2013 Model] 1.080 (1.000-1.150) 1982-2000 RS IND Model (Table 32, IQR= 5.3910.0) 0.998 (0.968-1.029) 1982-2000
Weighted Average of All Nine Models 1.002 (0.992-1.012) 1982-2000 Other Results by Jerrett and Other Investigators
Krewski Jerrett 2000 (RR for CA 2010) CA CPS II 0.872 (0.805-0.944) 1982-1989
McDonnell 2000 * CA AHSMOG ~ 1.00 (0.95 – 1.05) 1977-1992
Jerrett 2005 CPS II (LA Basin Only) 1.11 (0.99 - 1.25) 1982-2000
Enstrom 2005 * CA CPS I 0.997 (0.978-1.016) 1983-2002
Zeger 2008 * MCAPS “West=CA+OR+WA” 0.989 (0.970-1.008) 2000-2005
Jerrett 2010 CA CPS II ~ 0.994 (0.965-1.025) 1982-2000
Krewski Jerrett 2009 (RR for CA 2010)* CA CPS II 0.968 (0.916-1.022) 1982-2000
Lipsett Jerrett 2011 CA Teachers 1.01 (0.95 – 1.09) 2000-2005
Ostro 2011 CA Teachers 1.06 (0.96 – 1.16) 2002-2007
Ostro 2015 * CA Teachers 1.01 (0.98 - 1.05) 2001-2007
Thurston 2016 * CA NIH-AARP 1.02 (0.99 - 1.04) 2000-2009 Weighted Average of Latest Results (*) from Six California Cohorts 0.999 (0.988-1.010)
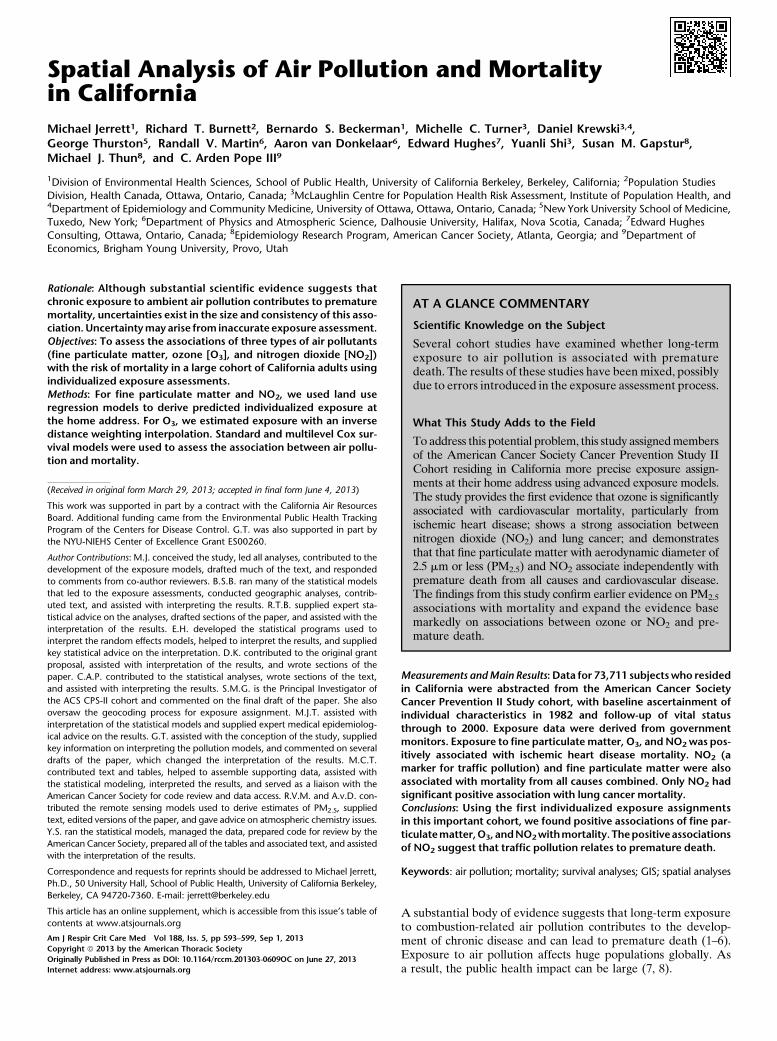
Spatial Analysis of Air Pollution and Mortalityin California
Michael Jerrett1, Richard T. Burnett2, Bernardo S. Beckerman1, Michelle C. Turner3, Daniel Krewski3,4,George Thurston5, Randall V. Martin6, Aaron van Donkelaar6, Edward Hughes7, Yuanli Shi3, Susan M. Gapstur8,Michael J. Thun8, and C. Arden Pope III9
1Division of Environmental Health Sciences, School of Public Health, University of California Berkeley, Berkeley, California; 2Population Studies
Division, Health Canada, Ottawa, Ontario, Canada; 3McLaughlin Centre for Population Health Risk Assessment, Institute of Population Health, and4Department of Epidemiology and Community Medicine, University of Ottawa, Ottawa, Ontario, Canada; 5New York University School of Medicine,Tuxedo, New York; 6Department of Physics and Atmospheric Science, Dalhousie University, Halifax, Nova Scotia, Canada; 7Edward Hughes
Consulting, Ottawa, Ontario, Canada; 8Epidemiology Research Program, American Cancer Society, Atlanta, Georgia; and 9Department of
Economics, Brigham Young University, Provo, Utah
Rationale: Although substantial scientific evidence suggests thatchronic exposure to ambient air pollution contributes to prematuremortality, uncertainties exist in the size and consistency of this asso-ciation.Uncertaintymayarise from inaccurate exposure assessment.Objectives: To assess the associations of three types of air pollutants(fine particulate matter, ozone [O3], and nitrogen dioxide [NO2])with the risk of mortality in a large cohort of California adults usingindividualized exposure assessments.Methods: For fine particulate matter and NO2, we used land useregression models to derive predicted individualized exposure atthe home address. For O3, we estimated exposure with an inversedistance weighting interpolation. Standard and multilevel Cox sur-vival models were used to assess the association between air pollu-tion and mortality.
Measurements andMain Results: Data for 73,711 subjectswho residedin California were abstracted from the American Cancer SocietyCancer Prevention II Study cohort, with baseline ascertainment ofindividual characteristics in 1982 and follow-up of vital statusthrough to 2000. Exposure data were derived from governmentmonitors. Exposure to fine particulatematter, O3, andNO2 was pos-itively associated with ischemic heart disease mortality. NO2 (amarker for traffic pollution) and fine particulate matter were alsoassociated with mortality from all causes combined. Only NO2 hadsignificant positive association with lung cancer mortality.Conclusions: Using the first individualized exposure assignmentsin this important cohort, we found positive associations of fine par-ticulatematter,O3, andNO2withmortality.Thepositiveassociationsof NO2 suggest that traffic pollution relates to premature death.
Keywords: air pollution; mortality; survival analyses; GIS; spatial analyses
A substantial body of evidence suggests that long-term exposureto combustion-related air pollution contributes to the develop-ment of chronic disease and can lead to premature death (1–6).Exposure to air pollution affects huge populations globally. Asa result, the public health impact can be large (7, 8).
(Received in original form March 29, 2013; accepted in final form June 4, 2013)
This work was supported in part by a contract with the California Air Resources
Board. Additional funding came from the Environmental Public Health Tracking
Program of the Centers for Disease Control. G.T. was also supported in part by
the NYU-NIEHS Center of Excellence Grant ES00260.
Author Contributions: M.J. conceived the study, led all analyses, contributed to the
development of the exposure models, drafted much of the text, and responded
to comments from co-author reviewers. B.S.B. ran many of the statistical models
that led to the exposure assessments, conducted geographic analyses, contrib-
uted text, and assisted with interpreting the results. R.T.B. supplied expert sta-
tistical advice on the analyses, drafted sections of the paper, and assisted with the
interpretation of the results. E.H. developed the statistical programs used to
interpret the random effects models, helped to interpret the results, and supplied
key statistical advice on the interpretation. D.K. contributed to the original grant
proposal, assisted with interpretation of the results, and wrote sections of the
paper. C.A.P. contributed to the statistical analyses, wrote sections of the text,
and assisted with interpreting the results. S.M.G. is the Principal Investigator of
the ACS CPS-II cohort and commented on the final draft of the paper. She also
oversaw the geocoding process for exposure assignment. M.J.T. assisted with
interpretation of the statistical models and supplied expert medical epidemiolog-
ical advice on the results. G.T. assisted with the conception of the study, supplied
key information on interpreting the pollution models, and commented on several
drafts of the paper, which changed the interpretation of the results. M.C.T.
contributed text and tables, helped to assemble supporting data, assisted with
the statistical modeling, interpreted the results, and served as a liaison with the
American Cancer Society for code review and data access. R.V.M. and A.v.D. con-
tributed the remote sensing models used to derive estimates of PM2.5, supplied
text, edited versions of the paper, and gave advice on atmospheric chemistry issues.
Y.S. ran the statistical models, managed the data, prepared code for review by the
American Cancer Society, prepared all of the tables and associated text, and assisted
with the interpretation of the results.
Correspondence and requests for reprints should be addressed to Michael Jerrett,
Ph.D., 50 University Hall, School of Public Health, University of California Berkeley,
Berkeley, CA 94720-7360. E-mail: [email protected]
This article has an online supplement, which is accessible from this issue’s table of
contents at www.atsjournals.org
Am J Respir Crit Care Med Vol 188, Iss. 5, pp 593–599, Sep 1, 2013
Copyright ª 2013 by the American Thoracic Society
Originally Published in Press as DOI: 10.1164/rccm.201303-0609OC on June 27, 2013
Internet address: www.atsjournals.org
AT A GLANCE COMMENTARY
Scientific Knowledge on the Subject
Several cohort studies have examined whether long-termexposure to air pollution is associated with prematuredeath. The results of these studies have beenmixed, possiblydue to errors introduced in the exposure assessment process.
What This Study Adds to the Field
Toaddress this potential problem, this study assignedmembersof the American Cancer Society Cancer Prevention Study IICohort residing in California more precise exposure assign-ments at their home address using advanced exposure models.The study provides the first evidence that ozone is significantlyassociated with cardiovascular mortality, particularly fromischemic heart disease; shows a strong association betweennitrogen dioxide (NO2) and lung cancer; and demonstratesthat that fine particulate matter with aerodynamic diameter of2.5 mm or less (PM2.5) and NO2 associate independently withpremature death from all causes and cardiovascular disease.The findings from this study confirm earlier evidence on PM2.5
associations with mortality and expand the evidence basemarkedly on associations between ozone or NO2 and pre-mature death.
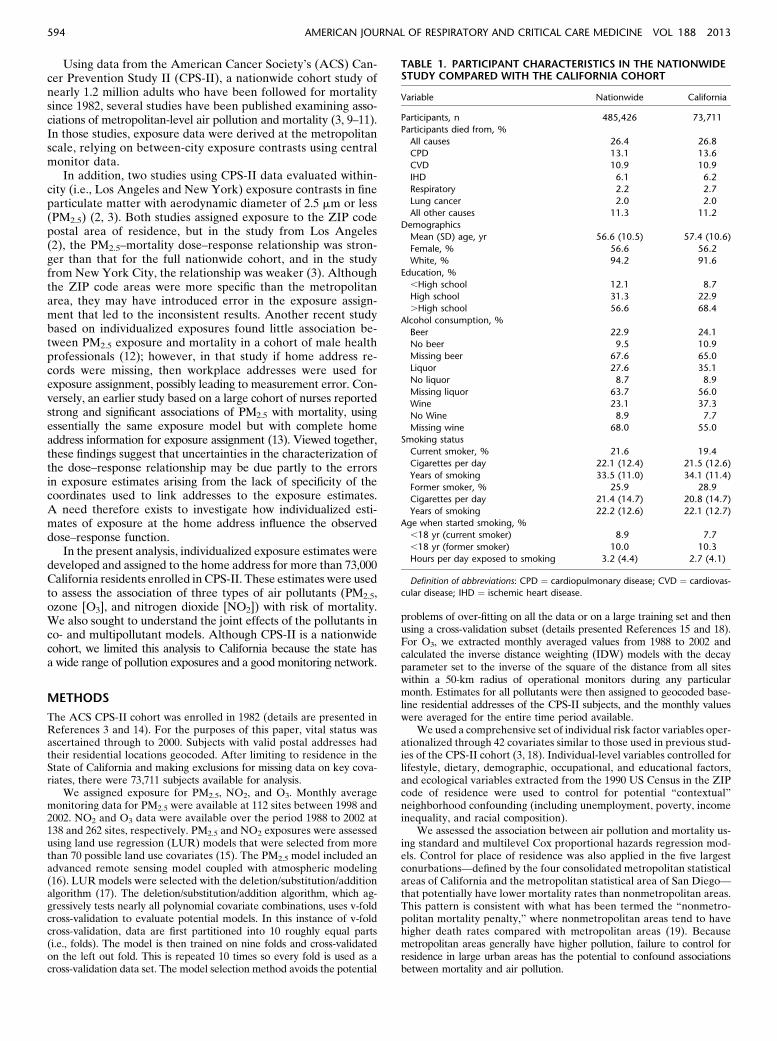
Using data from the American Cancer Society’s (ACS) Can-cer Prevention Study II (CPS-II), a nationwide cohort study ofnearly 1.2 million adults who have been followed for mortalitysince 1982, several studies have been published examining asso-ciations of metropolitan-level air pollution and mortality (3, 9–11).In those studies, exposure data were derived at the metropolitanscale, relying on between-city exposure contrasts using centralmonitor data.
In addition, two studies using CPS-II data evaluated within-city (i.e., Los Angeles and New York) exposure contrasts in fineparticulate matter with aerodynamic diameter of 2.5 mm or less(PM2.5) (2, 3). Both studies assigned exposure to the ZIP codepostal area of residence, but in the study from Los Angeles(2), the PM2.5–mortality dose–response relationship was stron-ger than that for the full nationwide cohort, and in the studyfrom New York City, the relationship was weaker (3). Althoughthe ZIP code areas were more specific than the metropolitanarea, they may have introduced error in the exposure assign-ment that led to the inconsistent results. Another recent studybased on individualized exposures found little association be-tween PM2.5 exposure and mortality in a cohort of male healthprofessionals (12); however, in that study if home address re-cords were missing, then workplace addresses were used forexposure assignment, possibly leading to measurement error. Con-versely, an earlier study based on a large cohort of nurses reportedstrong and significant associations of PM2.5 with mortality, usingessentially the same exposure model but with complete homeaddress information for exposure assignment (13). Viewed together,these findings suggest that uncertainties in the characterization ofthe dose–response relationship may be due partly to the errorsin exposure estimates arising from the lack of specificity of thecoordinates used to link addresses to the exposure estimates.A need therefore exists to investigate how individualized esti-mates of exposure at the home address influence the observeddose–response function.
In the present analysis, individualized exposure estimates weredeveloped and assigned to the home address for more than 73,000California residents enrolled in CPS-II. These estimates were usedto assess the association of three types of air pollutants (PM2.5,ozone [O3], and nitrogen dioxide [NO2]) with risk of mortality.We also sought to understand the joint effects of the pollutants inco- and multipollutant models. Although CPS-II is a nationwidecohort, we limited this analysis to California because the state hasa wide range of pollution exposures and a good monitoring network.
METHODS
The ACS CPS-II cohort was enrolled in 1982 (details are presented inReferences 3 and 14). For the purposes of this paper, vital status wasascertained through to 2000. Subjects with valid postal addresses hadtheir residential locations geocoded. After limiting to residence in theState of California and making exclusions for missing data on key cova-riates, there were 73,711 subjects available for analysis.
We assigned exposure for PM2.5, NO2, and O3. Monthly averagemonitoring data for PM2.5 were available at 112 sites between 1998 and2002. NO2 and O3 data were available over the period 1988 to 2002 at138 and 262 sites, respectively. PM2.5 and NO2 exposures were assessedusing land use regression (LUR) models that were selected from morethan 70 possible land use covariates (15). The PM2.5 model included anadvanced remote sensing model coupled with atmospheric modeling(16). LUR models were selected with the deletion/substitution/additionalgorithm (17). The deletion/substitution/addition algorithm, which ag-gressively tests nearly all polynomial covariate combinations, uses v-foldcross-validation to evaluate potential models. In this instance of v-foldcross-validation, data are first partitioned into 10 roughly equal parts(i.e., folds). The model is then trained on nine folds and cross-validatedon the left out fold. This is repeated 10 times so every fold is used as across-validation data set. The model selection method avoids the potential
problems of over-fitting on all the data or on a large training set and thenusing a cross-validation subset (details presented References 15 and 18).For O3, we extracted monthly averaged values from 1988 to 2002 andcalculated the inverse distance weighting (IDW) models with the decayparameter set to the inverse of the square of the distance from all siteswithin a 50-km radius of operational monitors during any particularmonth. Estimates for all pollutants were then assigned to geocoded base-line residential addresses of the CPS-II subjects, and the monthly valueswere averaged for the entire time period available.
We used a comprehensive set of individual risk factor variables oper-ationalized through 42 covariates similar to those used in previous stud-ies of the CPS-II cohort (3, 18). Individual-level variables controlled forlifestyle, dietary, demographic, occupational, and educational factors,and ecological variables extracted from the 1990 US Census in the ZIPcode of residence were used to control for potential “contextual”neighborhood confounding (including unemployment, poverty, incomeinequality, and racial composition).
We assessed the association between air pollution and mortality us-ing standard and multilevel Cox proportional hazards regression mod-els. Control for place of residence was also applied in the five largestconurbations—defined by the four consolidated metropolitan statisticalareas of California and the metropolitan statistical area of San Diego—that potentially have lower mortality rates than nonmetropolitan areas.This pattern is consistent with what has been termed the “nonmetro-politan mortality penalty,” where nonmetropolitan areas tend to havehigher death rates compared with metropolitan areas (19). Becausemetropolitan areas generally have higher pollution, failure to control forresidence in large urban areas has the potential to confound associationsbetween mortality and air pollution.
TABLE 1. PARTICIPANT CHARACTERISTICS IN THE NATIONWIDESTUDY COMPARED WITH THE CALIFORNIA COHORT
Variable Nationwide California
Participants, n 485,426 73,711
Participants died from, %
All causes 26.4 26.8
CPD 13.1 13.6
CVD 10.9 10.9
IHD 6.1 6.2
Respiratory 2.2 2.7
Lung cancer 2.0 2.0
All other causes 11.3 11.2
Demographics
Mean (SD) age, yr 56.6 (10.5) 57.4 (10.6)
Female, % 56.6 56.2
White, % 94.2 91.6
Education, %
,High school 12.1 8.7
High school 31.3 22.9
.High school 56.6 68.4
Alcohol consumption, %
Beer 22.9 24.1
No beer 9.5 10.9
Missing beer 67.6 65.0
Liquor 27.6 35.1
No liquor 8.7 8.9
Missing liquor 63.7 56.0
Wine 23.1 37.3
No Wine 8.9 7.7
Missing wine 68.0 55.0
Smoking status
Current smoker, % 21.6 19.4
Cigarettes per day 22.1 (12.4) 21.5 (12.6)
Years of smoking 33.5 (11.0) 34.1 (11.4)
Former smoker, % 25.9 28.9
Cigarettes per day 21.4 (14.7) 20.8 (14.7)
Years of smoking 22.2 (12.6) 22.1 (12.7)
Age when started smoking, %
,18 yr (current smoker) 8.9 7.7
,18 yr (former smoker) 10.0 10.3
Hours per day exposed to smoking 3.2 (4.4) 2.7 (4.1)
Definition of abbreviations: CPD ¼ cardiopulmonary disease; CVD ¼ cardiovas-
cular disease; IHD ¼ ischemic heart disease.
594 AMERICAN JOURNAL OF RESPIRATORY AND CRITICAL CARE MEDICINE VOL 188 2013
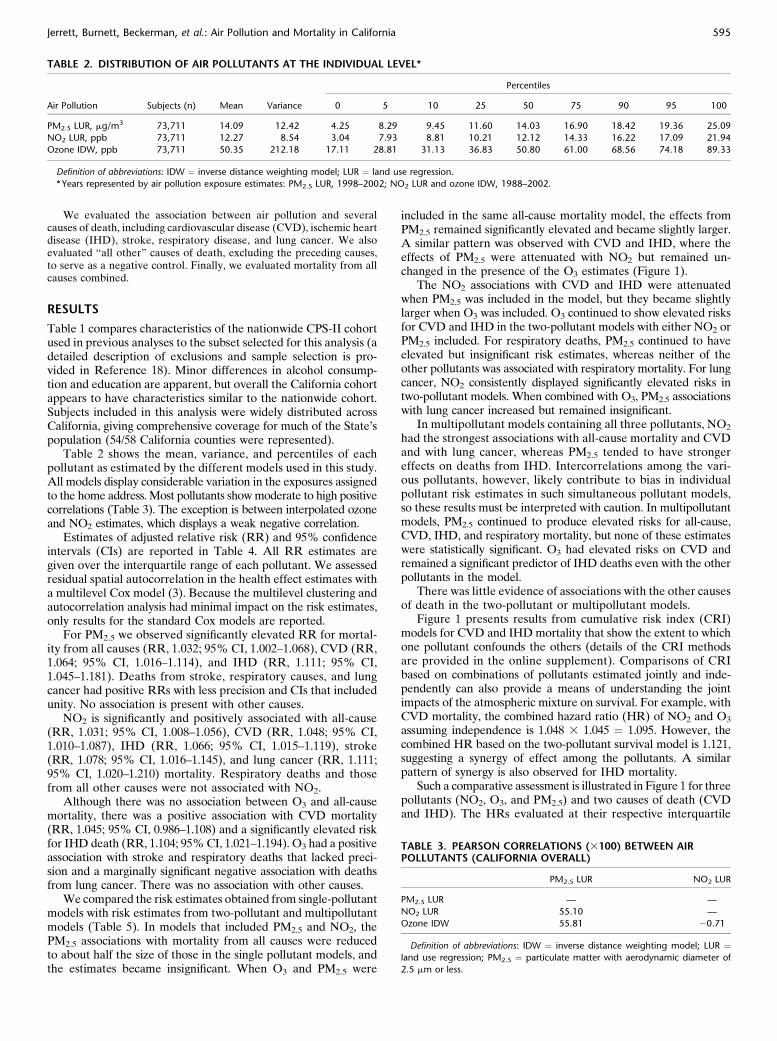
We evaluated the association between air pollution and severalcauses of death, including cardiovascular disease (CVD), ischemic heartdisease (IHD), stroke, respiratory disease, and lung cancer. We alsoevaluated “all other” causes of death, excluding the preceding causes,to serve as a negative control. Finally, we evaluated mortality from allcauses combined.
RESULTS
Table 1 compares characteristics of the nationwide CPS-II cohortused in previous analyses to the subset selected for this analysis (adetailed description of exclusions and sample selection is pro-vided in Reference 18). Minor differences in alcohol consump-tion and education are apparent, but overall the California cohortappears to have characteristics similar to the nationwide cohort.Subjects included in this analysis were widely distributed acrossCalifornia, giving comprehensive coverage for much of the State’spopulation (54/58 California counties were represented).
Table 2 shows the mean, variance, and percentiles of eachpollutant as estimated by the different models used in this study.All models display considerable variation in the exposures assignedto the home address. Most pollutants showmoderate to high positivecorrelations (Table 3). The exception is between interpolated ozoneand NO2 estimates, which displays a weak negative correlation.
Estimates of adjusted relative risk (RR) and 95% confidenceintervals (CIs) are reported in Table 4. All RR estimates aregiven over the interquartile range of each pollutant. We assessedresidual spatial autocorrelation in the health effect estimates witha multilevel Cox model (3). Because the multilevel clustering andautocorrelation analysis had minimal impact on the risk estimates,only results for the standard Cox models are reported.
For PM2.5 we observed significantly elevated RR for mortal-ity from all causes (RR, 1.032; 95% CI, 1.002–1.068), CVD (RR,1.064; 95% CI, 1.016–1.114), and IHD (RR, 1.111; 95% CI,1.045–1.181). Deaths from stroke, respiratory causes, and lungcancer had positive RRs with less precision and CIs that includedunity. No association is present with other causes.
NO2 is significantly and positively associated with all-cause(RR, 1.031; 95% CI, 1.008–1.056), CVD (RR, 1.048; 95% CI,1.010–1.087), IHD (RR, 1.066; 95% CI, 1.015–1.119), stroke(RR, 1.078; 95% CI, 1.016–1.145), and lung cancer (RR, 1.111;95% CI, 1.020–1.210) mortality. Respiratory deaths and thosefrom all other causes were not associated with NO2.
Although there was no association between O3 and all-causemortality, there was a positive association with CVD mortality(RR, 1.045; 95% CI, 0.986–1.108) and a significantly elevated riskfor IHD death (RR, 1.104; 95%CI, 1.021–1.194). O3 had a positiveassociation with stroke and respiratory deaths that lacked preci-sion and a marginally significant negative association with deathsfrom lung cancer. There was no association with other causes.
We compared the risk estimates obtained from single-pollutantmodels with risk estimates from two-pollutant and multipollutantmodels (Table 5). In models that included PM2.5 and NO2, thePM2.5 associations with mortality from all causes were reducedto about half the size of those in the single pollutant models, andthe estimates became insignificant. When O3 and PM2.5 were
included in the same all-cause mortality model, the effects fromPM2.5 remained significantly elevated and became slightly larger.A similar pattern was observed with CVD and IHD, where theeffects of PM2.5 were attenuated with NO2 but remained un-changed in the presence of the O3 estimates (Figure 1).
The NO2 associations with CVD and IHD were attenuatedwhen PM2.5 was included in the model, but they became slightlylarger when O3 was included. O3 continued to show elevated risksfor CVD and IHD in the two-pollutant models with either NO2 orPM2.5 included. For respiratory deaths, PM2.5 continued to haveelevated but insignificant risk estimates, whereas neither of theother pollutants was associated with respiratory mortality. For lungcancer, NO2 consistently displayed significantly elevated risks intwo-pollutant models. When combined with O3, PM2.5 associationswith lung cancer increased but remained insignificant.
In multipollutant models containing all three pollutants, NO2
had the strongest associations with all-cause mortality and CVDand with lung cancer, whereas PM2.5 tended to have strongereffects on deaths from IHD. Intercorrelations among the vari-ous pollutants, however, likely contribute to bias in individualpollutant risk estimates in such simultaneous pollutant models,so these results must be interpreted with caution. In multipollutantmodels, PM2.5 continued to produce elevated risks for all-cause,CVD, IHD, and respiratory mortality, but none of these estimateswere statistically significant. O3 had elevated risks on CVD andremained a significant predictor of IHD deaths even with the otherpollutants in the model.
There was little evidence of associations with the other causesof death in the two-pollutant or multipollutant models.
Figure 1 presents results from cumulative risk index (CRI)models for CVD and IHDmortality that show the extent to whichone pollutant confounds the others (details of the CRI methodsare provided in the online supplement). Comparisons of CRIbased on combinations of pollutants estimated jointly and inde-pendently can also provide a means of understanding the jointimpacts of the atmospheric mixture on survival. For example, withCVD mortality, the combined hazard ratio (HR) of NO2 and O3
assuming independence is 1.048 3 1.045 ¼ 1.095. However, thecombined HR based on the two-pollutant survival model is 1.121,suggesting a synergy of effect among the pollutants. A similarpattern of synergy is also observed for IHD mortality.
Such a comparative assessment is illustrated in Figure 1 for threepollutants (NO2, O3, and PM2.5) and two causes of death (CVDand IHD). The HRs evaluated at their respective interquartile
TABLE 2. DISTRIBUTION OF AIR POLLUTANTS AT THE INDIVIDUAL LEVEL*
Air Pollution Subjects (n) Mean Variance
Percentiles
0 5 10 25 50 75 90 95 100
PM2.5 LUR, mg/m3 73,711 14.09 12.42 4.25 8.29 9.45 11.60 14.03 16.90 18.42 19.36 25.09
NO2 LUR, ppb 73,711 12.27 8.54 3.04 7.93 8.81 10.21 12.12 14.33 16.22 17.09 21.94
Ozone IDW, ppb 73,711 50.35 212.18 17.11 28.81 31.13 36.83 50.80 61.00 68.56 74.18 89.33
Definition of abbreviations: IDW ¼ inverse distance weighting model; LUR ¼ land use regression.
* Years represented by air pollution exposure estimates: PM2.5 LUR, 1998–2002; NO2 LUR and ozone IDW, 1988–2002.
TABLE 3. PEARSON CORRELATIONS (3100) BETWEEN AIRPOLLUTANTS (CALIFORNIA OVERALL)
PM2.5 LUR NO2 LUR
PM2.5 LUR — —
NO2 LUR 55.10 —
Ozone IDW 55.81 20.71
Definition of abbreviations: IDW ¼ inverse distance weighting model; LUR ¼land use regression; PM2.5 ¼ particulate matter with aerodynamic diameter of
2.5 mm or less.
Jerrett, Burnett, Beckerman, et al.: Air Pollution and Mortality in California 595
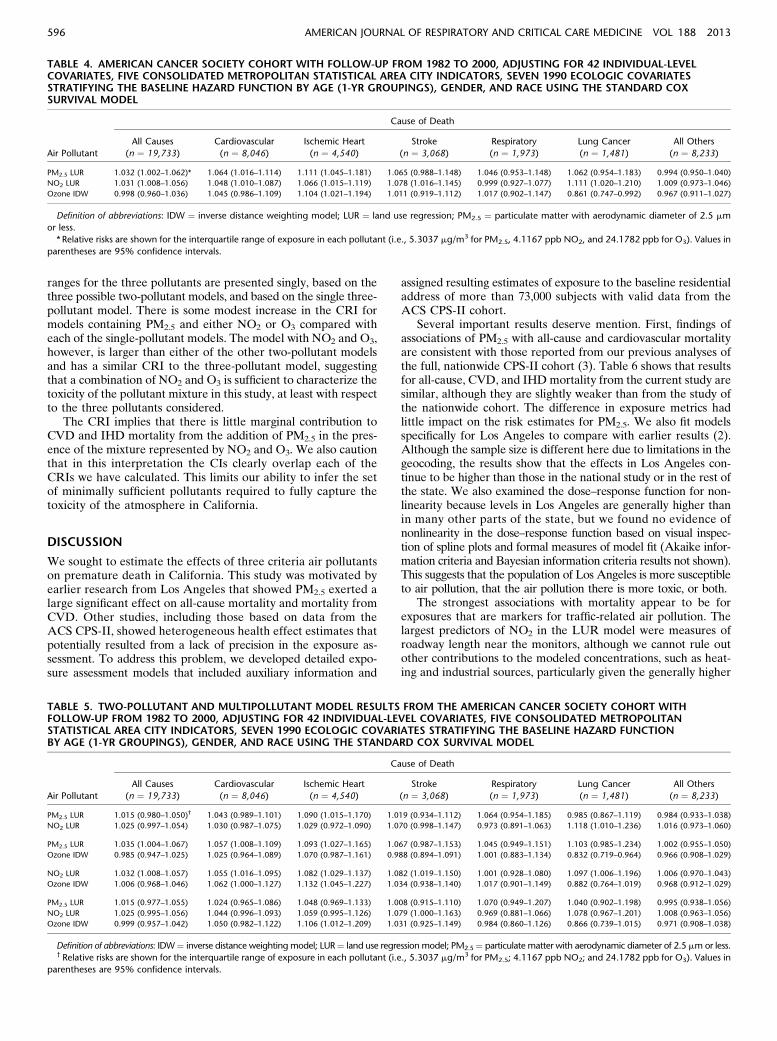
ranges for the three pollutants are presented singly, based on thethree possible two-pollutant models, and based on the single three-pollutant model. There is some modest increase in the CRI formodels containing PM2.5 and either NO2 or O3 compared witheach of the single-pollutant models. The model with NO2 and O3,however, is larger than either of the other two-pollutant modelsand has a similar CRI to the three-pollutant model, suggestingthat a combination of NO2 and O3 is sufficient to characterize thetoxicity of the pollutant mixture in this study, at least with respectto the three pollutants considered.
The CRI implies that there is little marginal contribution toCVD and IHD mortality from the addition of PM2.5 in the pres-ence of the mixture represented by NO2 and O3. We also cautionthat in this interpretation the CIs clearly overlap each of theCRIs we have calculated. This limits our ability to infer the setof minimally sufficient pollutants required to fully capture thetoxicity of the atmosphere in California.
DISCUSSION
We sought to estimate the effects of three criteria air pollutantson premature death in California. This study was motivated byearlier research from Los Angeles that showed PM2.5 exerted alarge significant effect on all-cause mortality and mortality fromCVD. Other studies, including those based on data from theACS CPS-II, showed heterogeneous health effect estimates thatpotentially resulted from a lack of precision in the exposure as-sessment. To address this problem, we developed detailed expo-sure assessment models that included auxiliary information and
assigned resulting estimates of exposure to the baseline residentialaddress of more than 73,000 subjects with valid data from theACS CPS-II cohort.
Several important results deserve mention. First, findings ofassociations of PM2.5 with all-cause and cardiovascular mortalityare consistent with those reported from our previous analyses ofthe full, nationwide CPS-II cohort (3). Table 6 shows that resultsfor all-cause, CVD, and IHDmortality from the current study aresimilar, although they are slightly weaker than from the study ofthe nationwide cohort. The difference in exposure metrics hadlittle impact on the risk estimates for PM2.5. We also fit modelsspecifically for Los Angeles to compare with earlier results (2).Although the sample size is different here due to limitations in thegeocoding, the results show that the effects in Los Angeles con-tinue to be higher than those in the national study or in the rest ofthe state. We also examined the dose–response function for non-linearity because levels in Los Angeles are generally higher thanin many other parts of the state, but we found no evidence ofnonlinearity in the dose–response function based on visual inspec-tion of spline plots and formal measures of model fit (Akaike infor-mation criteria and Bayesian information criteria results not shown).This suggests that the population of Los Angeles is more susceptibleto air pollution, that the air pollution there is more toxic, or both.
The strongest associations with mortality appear to be forexposures that are markers for traffic-related air pollution. Thelargest predictors of NO2 in the LUR model were measures ofroadway length near the monitors, although we cannot rule outother contributions to the modeled concentrations, such as heat-ing and industrial sources, particularly given the generally higher
TABLE 4. AMERICAN CANCER SOCIETY COHORT WITH FOLLOW-UP FROM 1982 TO 2000, ADJUSTING FOR 42 INDIVIDUAL-LEVELCOVARIATES, FIVE CONSOLIDATED METROPOLITAN STATISTICAL AREA CITY INDICATORS, SEVEN 1990 ECOLOGIC COVARIATESSTRATIFYING THE BASELINE HAZARD FUNCTION BY AGE (1-YR GROUPINGS), GENDER, AND RACE USING THE STANDARD COXSURVIVAL MODEL
Air Pollutant
Cause of Death
All Causes
(n ¼ 19,733)
Cardiovascular
(n ¼ 8,046)
Ischemic Heart
(n ¼ 4,540)
Stroke
(n ¼ 3,068)
Respiratory
(n ¼ 1,973)
Lung Cancer
(n ¼ 1,481)
All Others
(n ¼ 8,233)
PM2.5 LUR 1.032 (1.002–1.062)* 1.064 (1.016–1.114) 1.111 (1.045–1.181) 1.065 (0.988–1.148) 1.046 (0.953–1.148) 1.062 (0.954–1.183) 0.994 (0.950–1.040)
NO2 LUR 1.031 (1.008–1.056) 1.048 (1.010–1.087) 1.066 (1.015–1.119) 1.078 (1.016–1.145) 0.999 (0.927–1.077) 1.111 (1.020–1.210) 1.009 (0.973–1.046)
Ozone IDW 0.998 (0.960–1.036) 1.045 (0.986–1.109) 1.104 (1.021–1.194) 1.011 (0.919–1.112) 1.017 (0.902–1.147) 0.861 (0.747–0.992) 0.967 (0.911–1.027)
Definition of abbreviations: IDW ¼ inverse distance weighting model; LUR ¼ land use regression; PM2.5 ¼ particulate matter with aerodynamic diameter of 2.5 mm
or less.
* Relative risks are shown for the interquartile range of exposure in each pollutant (i.e., 5.3037 mg/m3 for PM2.5, 4.1167 ppb NO2, and 24.1782 ppb for O3). Values in
parentheses are 95% confidence intervals.
TABLE 5. TWO-POLLUTANT AND MULTIPOLLUTANT MODEL RESULTS FROM THE AMERICAN CANCER SOCIETY COHORT WITHFOLLOW-UP FROM 1982 TO 2000, ADJUSTING FOR 42 INDIVIDUAL-LEVEL COVARIATES, FIVE CONSOLIDATED METROPOLITANSTATISTICAL AREA CITY INDICATORS, SEVEN 1990 ECOLOGIC COVARIATES STRATIFYING THE BASELINE HAZARD FUNCTIONBY AGE (1-YR GROUPINGS), GENDER, AND RACE USING THE STANDARD COX SURVIVAL MODEL
Air Pollutant
Cause of Death
All Causes
(n ¼ 19,733)
Cardiovascular
(n ¼ 8,046)
Ischemic Heart
(n ¼ 4,540)
Stroke
(n ¼ 3,068)
Respiratory
(n ¼ 1,973)
Lung Cancer
(n ¼ 1,481)
All Others
(n ¼ 8,233)
PM2.5 LUR 1.015 (0.980–1.050)† 1.043 (0.989–1.101) 1.090 (1.015–1.170) 1.019 (0.934–1.112) 1.064 (0.954–1.185) 0.985 (0.867–1.119) 0.984 (0.933–1.038)
NO2 LUR 1.025 (0.997–1.054) 1.030 (0.987–1.075) 1.029 (0.972–1.090) 1.070 (0.998–1.147) 0.973 (0.891–1.063) 1.118 (1.010–1.236) 1.016 (0.973–1.060)
PM2.5 LUR 1.035 (1.004–1.067) 1.057 (1.008–1.109) 1.093 (1.027–1.165) 1.067 (0.987–1.153) 1.045 (0.949–1.151) 1.103 (0.985–1.234) 1.002 (0.955–1.050)
Ozone IDW 0.985 (0.947–1.025) 1.025 (0.964–1.089) 1.070 (0.987–1.161) 0.988 (0.894–1.091) 1.001 (0.883–1.134) 0.832 (0.719–0.964) 0.966 (0.908–1.029)
NO2 LUR 1.032 (1.008–1.057) 1.055 (1.016–1.095) 1.082 (1.029–1.137) 1.082 (1.019–1.150) 1.001 (0.928–1.080) 1.097 (1.006–1.196) 1.006 (0.970–1.043)
Ozone IDW 1.006 (0.968–1.046) 1.062 (1.000–1.127) 1.132 (1.045–1.227) 1.034 (0.938–1.140) 1.017 (0.901–1.149) 0.882 (0.764–1.019) 0.968 (0.912–1.029)
PM2.5 LUR 1.015 (0.977–1.055) 1.024 (0.965–1.086) 1.048 (0.969–1.133) 1.008 (0.915–1.110) 1.070 (0.949–1.207) 1.040 (0.902–1.198) 0.995 (0.938–1.056)
NO2 LUR 1.025 (0.995–1.056) 1.044 (0.996–1.093) 1.059 (0.995–1.126) 1.079 (1.000–1.163) 0.969 (0.881–1.066) 1.078 (0.967–1.201) 1.008 (0.963–1.056)
Ozone IDW 0.999 (0.957–1.042) 1.050 (0.982–1.122) 1.106 (1.012–1.209) 1.031 (0.925–1.149) 0.984 (0.860–1.126) 0.866 (0.739–1.015) 0.971 (0.908–1.038)
Definition of abbreviations: IDW¼ inverse distance weightingmodel; LUR¼ land use regression model; PM2.5¼ particulate matter with aerodynamic diameter of 2.5 mmor less.y Relative risks are shown for the interquartile range of exposure in each pollutant (i.e., 5.3037 mg/m3 for PM2.5; 4.1167 ppb NO2; and 24.1782 ppb for O3). Values in
parentheses are 95% confidence intervals.
596 AMERICAN JOURNAL OF RESPIRATORY AND CRITICAL CARE MEDICINE VOL 188 2013
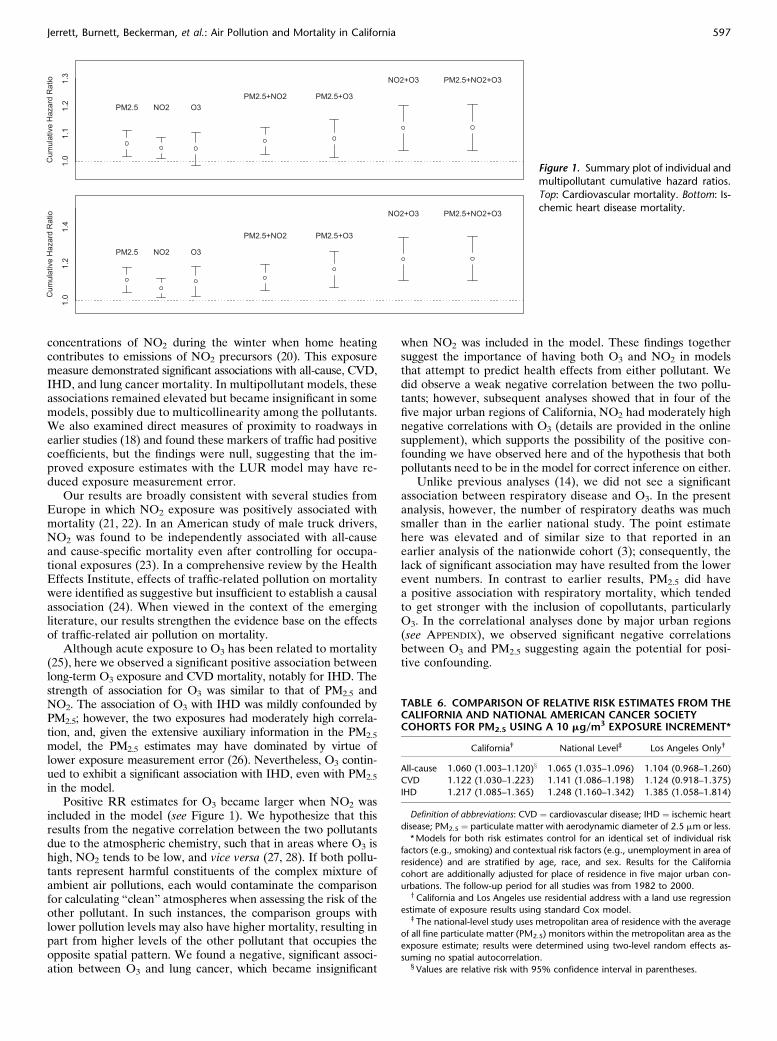
concentrations of NO2 during the winter when home heatingcontributes to emissions of NO2 precursors (20). This exposuremeasure demonstrated significant associations with all-cause, CVD,IHD, and lung cancer mortality. In multipollutant models, theseassociations remained elevated but became insignificant in somemodels, possibly due to multicollinearity among the pollutants.We also examined direct measures of proximity to roadways inearlier studies (18) and found these markers of traffic had positivecoefficients, but the findings were null, suggesting that the im-proved exposure estimates with the LUR model may have re-duced exposure measurement error.
Our results are broadly consistent with several studies fromEurope in which NO2 exposure was positively associated withmortality (21, 22). In an American study of male truck drivers,NO2 was found to be independently associated with all-causeand cause-specific mortality even after controlling for occupa-tional exposures (23). In a comprehensive review by the HealthEffects Institute, effects of traffic-related pollution on mortalitywere identified as suggestive but insufficient to establish a causalassociation (24). When viewed in the context of the emergingliterature, our results strengthen the evidence base on the effectsof traffic-related air pollution on mortality.
Although acute exposure to O3 has been related to mortality(25), here we observed a significant positive association betweenlong-term O3 exposure and CVD mortality, notably for IHD. Thestrength of association for O3 was similar to that of PM2.5 andNO2. The association of O3 with IHD was mildly confounded byPM2.5; however, the two exposures had moderately high correla-tion, and, given the extensive auxiliary information in the PM2.5
model, the PM2.5 estimates may have dominated by virtue oflower exposure measurement error (26). Nevertheless, O3 contin-ued to exhibit a significant association with IHD, even with PM2.5
in the model.Positive RR estimates for O3 became larger when NO2 was
included in the model (see Figure 1). We hypothesize that thisresults from the negative correlation between the two pollutantsdue to the atmospheric chemistry, such that in areas where O3 ishigh, NO2 tends to be low, and vice versa (27, 28). If both pollu-tants represent harmful constituents of the complex mixture ofambient air pollutions, each would contaminate the comparisonfor calculating “clean” atmospheres when assessing the risk of theother pollutant. In such instances, the comparison groups withlower pollution levels may also have higher mortality, resulting inpart from higher levels of the other pollutant that occupies theopposite spatial pattern. We found a negative, significant associ-ation between O3 and lung cancer, which became insignificant
when NO2 was included in the model. These findings togethersuggest the importance of having both O3 and NO2 in modelsthat attempt to predict health effects from either pollutant. Wedid observe a weak negative correlation between the two pollu-tants; however, subsequent analyses showed that in four of thefive major urban regions of California, NO2 had moderately highnegative correlations with O3 (details are provided in the onlinesupplement), which supports the possibility of the positive con-founding we have observed here and of the hypothesis that bothpollutants need to be in the model for correct inference on either.
Unlike previous analyses (14), we did not see a significantassociation between respiratory disease and O3. In the presentanalysis, however, the number of respiratory deaths was muchsmaller than in the earlier national study. The point estimatehere was elevated and of similar size to that reported in anearlier analysis of the nationwide cohort (3); consequently, thelack of significant association may have resulted from the lowerevent numbers. In contrast to earlier results, PM2.5 did havea positive association with respiratory mortality, which tendedto get stronger with the inclusion of copollutants, particularlyO3. In the correlational analyses done by major urban regions(see APPENDIX), we observed significant negative correlationsbetween O3 and PM2.5 suggesting again the potential for posi-tive confounding.
Figure 1. Summary plot of individual and
multipollutant cumulative hazard ratios.
Top: Cardiovascular mortality. Bottom: Is-chemic heart disease mortality.
TABLE 6. COMPARISON OF RELATIVE RISK ESTIMATES FROM THECALIFORNIA AND NATIONAL AMERICAN CANCER SOCIETYCOHORTS FOR PM2.5 USING A 10 mg/m3 EXPOSURE INCREMENT*
California† National Level‡ Los Angeles Only†
All-cause 1.060 (1.003–1.120)x 1.065 (1.035–1.096) 1.104 (0.968–1.260)
CVD 1.122 (1.030–1.223) 1.141 (1.086–1.198) 1.124 (0.918–1.375)
IHD 1.217 (1.085–1.365) 1.248 (1.160–1.342) 1.385 (1.058–1.814)
Definition of abbreviations: CVD ¼ cardiovascular disease; IHD ¼ ischemic heart
disease; PM2.5 ¼ particulate matter with aerodynamic diameter of 2.5 mm or less.
*Models for both risk estimates control for an identical set of individual risk
factors (e.g., smoking) and contextual risk factors (e.g., unemployment in area of
residence) and are stratified by age, race, and sex. Results for the California
cohort are additionally adjusted for place of residence in five major urban con-
urbations. The follow-up period for all studies was from 1982 to 2000.yCalifornia and Los Angeles use residential address with a land use regression
estimate of exposure results using standard Cox model.z The national-level study uses metropolitan area of residence with the average
of all fine particulate matter (PM2.5) monitors within the metropolitan area as the
exposure estimate; results were determined using two-level random effects as-
suming no spatial autocorrelation.xValues are relative risk with 95% confidence interval in parentheses.
Jerrett, Burnett, Beckerman, et al.: Air Pollution and Mortality in California 597
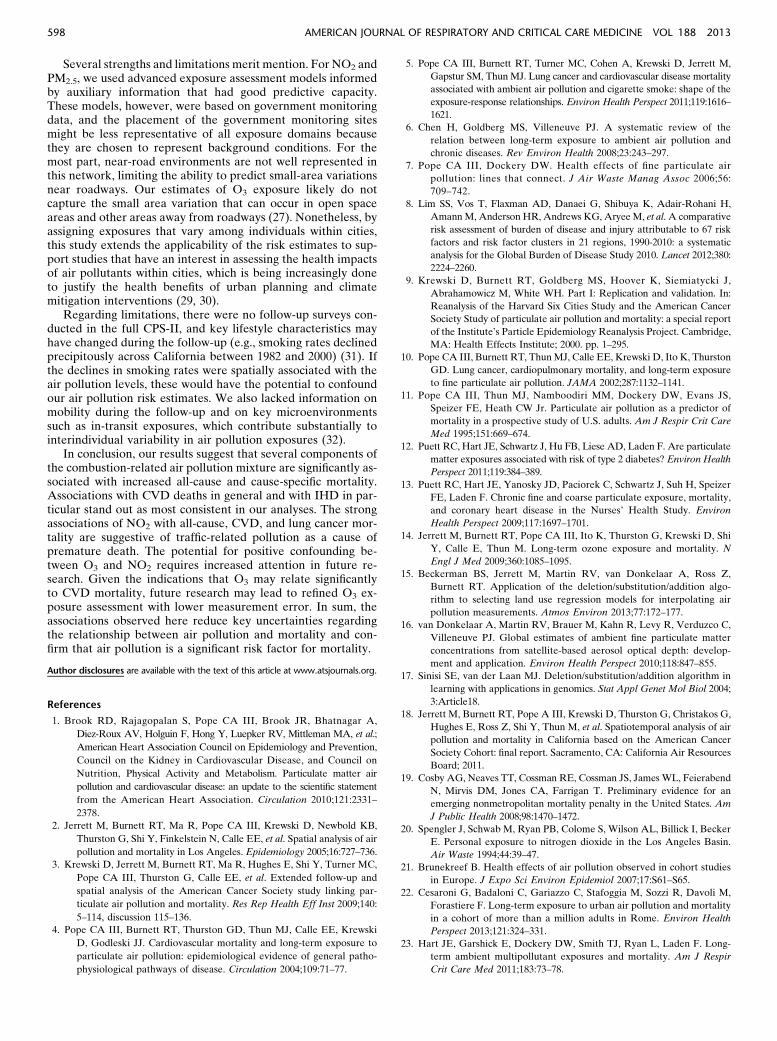
Several strengths and limitations merit mention. For NO2 andPM2.5, we used advanced exposure assessment models informedby auxiliary information that had good predictive capacity.These models, however, were based on government monitoringdata, and the placement of the government monitoring sitesmight be less representative of all exposure domains becausethey are chosen to represent background conditions. For themost part, near-road environments are not well represented inthis network, limiting the ability to predict small-area variationsnear roadways. Our estimates of O3 exposure likely do notcapture the small area variation that can occur in open spaceareas and other areas away from roadways (27). Nonetheless, byassigning exposures that vary among individuals within cities,this study extends the applicability of the risk estimates to sup-port studies that have an interest in assessing the health impactsof air pollutants within cities, which is being increasingly doneto justify the health benefits of urban planning and climatemitigation interventions (29, 30).
Regarding limitations, there were no follow-up surveys con-ducted in the full CPS-II, and key lifestyle characteristics mayhave changed during the follow-up (e.g., smoking rates declinedprecipitously across California between 1982 and 2000) (31). Ifthe declines in smoking rates were spatially associated with theair pollution levels, these would have the potential to confoundour air pollution risk estimates. We also lacked information onmobility during the follow-up and on key microenvironmentssuch as in-transit exposures, which contribute substantially tointerindividual variability in air pollution exposures (32).
In conclusion, our results suggest that several components ofthe combustion-related air pollution mixture are significantly as-sociated with increased all-cause and cause-specific mortality.Associations with CVD deaths in general and with IHD in par-ticular stand out as most consistent in our analyses. The strongassociations of NO2 with all-cause, CVD, and lung cancer mor-tality are suggestive of traffic-related pollution as a cause ofpremature death. The potential for positive confounding be-tween O3 and NO2 requires increased attention in future re-search. Given the indications that O3 may relate significantlyto CVD mortality, future research may lead to refined O3 ex-posure assessment with lower measurement error. In sum, theassociations observed here reduce key uncertainties regardingthe relationship between air pollution and mortality and con-firm that air pollution is a significant risk factor for mortality.
Author disclosures are available with the text of this article at www.atsjournals.org.
References
1. Brook RD, Rajagopalan S, Pope CA III, Brook JR, Bhatnagar A,
Diez-Roux AV, Holguin F, Hong Y, Luepker RV, Mittleman MA, et al.;
American Heart Association Council on Epidemiology and Prevention,
Council on the Kidney in Cardiovascular Disease, and Council on
Nutrition, Physical Activity and Metabolism. Particulate matter air
pollution and cardiovascular disease: an update to the scientific statement
from the American Heart Association. Circulation 2010;121:2331–
2378.
2. Jerrett M, Burnett RT, Ma R, Pope CA III, Krewski D, Newbold KB,
Thurston G, Shi Y, Finkelstein N, Calle EE, et al. Spatial analysis of air
pollution and mortality in Los Angeles. Epidemiology 2005;16:727–736.
3. Krewski D, Jerrett M, Burnett RT, Ma R, Hughes E, Shi Y, Turner MC,
Pope CA III, Thurston G, Calle EE, et al. Extended follow-up and
spatial analysis of the American Cancer Society study linking par-
ticulate air pollution and mortality. Res Rep Health Eff Inst 2009;140:
5–114, discussion 115–136.
4. Pope CA III, Burnett RT, Thurston GD, Thun MJ, Calle EE, Krewski
D, Godleski JJ. Cardiovascular mortality and long-term exposure to
particulate air pollution: epidemiological evidence of general patho-
physiological pathways of disease. Circulation 2004;109:71–77.
5. Pope CA III, Burnett RT, Turner MC, Cohen A, Krewski D, Jerrett M,
Gapstur SM, ThunMJ. Lung cancer and cardiovascular disease mortality
associated with ambient air pollution and cigarette smoke: shape of the
exposure-response relationships. Environ Health Perspect 2011;119:1616–
1621.
6. Chen H, Goldberg MS, Villeneuve PJ. A systematic review of the
relation between long-term exposure to ambient air pollution and
chronic diseases. Rev Environ Health 2008;23:243–297.
7. Pope CA III, Dockery DW. Health effects of fine particulate air
pollution: lines that connect. J Air Waste Manag Assoc 2006;56:
709–742.
8. Lim SS, Vos T, Flaxman AD, Danaei G, Shibuya K, Adair-Rohani H,
AmannM, Anderson HR, Andrews KG, AryeeM, et al. A comparative
risk assessment of burden of disease and injury attributable to 67 risk
factors and risk factor clusters in 21 regions, 1990-2010: a systematic
analysis for the Global Burden of Disease Study 2010. Lancet 2012;380:
2224–2260.
9. Krewski D, Burnett RT, Goldberg MS, Hoover K, Siemiatycki J,
Abrahamowicz M, White WH. Part I: Replication and validation. In:
Reanalysis of the Harvard Six Cities Study and the American Cancer
Society Study of particulate air pollution and mortality: a special report
of the Institute’s Particle Epidemiology Reanalysis Project. Cambridge,
MA: Health Effects Institute; 2000. pp. 1–295.
10. Pope CA III, Burnett RT, ThunMJ, Calle EE, Krewski D, Ito K, Thurston
GD. Lung cancer, cardiopulmonary mortality, and long-term exposure
to fine particulate air pollution. JAMA 2002;287:1132–1141.
11. Pope CA III, Thun MJ, Namboodiri MM, Dockery DW, Evans JS,
Speizer FE, Heath CW Jr. Particulate air pollution as a predictor of
mortality in a prospective study of U.S. adults. Am J Respir Crit Care
Med 1995;151:669–674.
12. Puett RC, Hart JE, Schwartz J, Hu FB, Liese AD, Laden F. Are particulate
matter exposures associated with risk of type 2 diabetes? Environ Health
Perspect 2011;119:384–389.
13. Puett RC, Hart JE, Yanosky JD, Paciorek C, Schwartz J, Suh H, Speizer
FE, Laden F. Chronic fine and coarse particulate exposure, mortality,
and coronary heart disease in the Nurses’ Health Study. Environ
Health Perspect 2009;117:1697–1701.
14. Jerrett M, Burnett RT, Pope CA III, Ito K, Thurston G, Krewski D, Shi
Y, Calle E, Thun M. Long-term ozone exposure and mortality. N
Engl J Med 2009;360:1085–1095.
15. Beckerman BS, Jerrett M, Martin RV, van Donkelaar A, Ross Z,
Burnett RT. Application of the deletion/substitution/addition algo-
rithm to selecting land use regression models for interpolating air
pollution measurements. Atmos Environ 2013;77:172–177.
16. van Donkelaar A, Martin RV, Brauer M, Kahn R, Levy R, Verduzco C,
Villeneuve PJ. Global estimates of ambient fine particulate matter
concentrations from satellite-based aerosol optical depth: develop-
ment and application. Environ Health Perspect 2010;118:847–855.
17. Sinisi SE, van der Laan MJ. Deletion/substitution/addition algorithm in
learning with applications in genomics. Stat Appl Genet Mol Biol 2004;
3:Article18.
18. Jerrett M, Burnett RT, Pope A III, Krewski D, Thurston G, Christakos G,
Hughes E, Ross Z, Shi Y, Thun M, et al. Spatiotemporal analysis of air
pollution and mortality in California based on the American Cancer
Society Cohort: final report. Sacramento, CA: California Air Resources
Board; 2011.
19. Cosby AG, Neaves TT, Cossman RE, Cossman JS, James WL, Feierabend
N, Mirvis DM, Jones CA, Farrigan T. Preliminary evidence for an
emerging nonmetropolitan mortality penalty in the United States. Am
J Public Health 2008;98:1470–1472.
20. Spengler J, Schwab M, Ryan PB, Colome S, Wilson AL, Billick I, Becker
E. Personal exposure to nitrogen dioxide in the Los Angeles Basin.
Air Waste 1994;44:39–47.
21. Brunekreef B. Health effects of air pollution observed in cohort studies
in Europe. J Expo Sci Environ Epidemiol 2007;17:S61–S65.
22. Cesaroni G, Badaloni C, Gariazzo C, Stafoggia M, Sozzi R, Davoli M,
Forastiere F. Long-term exposure to urban air pollution and mortality
in a cohort of more than a million adults in Rome. Environ Health
Perspect 2013;121:324–331.
23. Hart JE, Garshick E, Dockery DW, Smith TJ, Ryan L, Laden F. Long-
term ambient multipollutant exposures and mortality. Am J Respir
Crit Care Med 2011;183:73–78.
598 AMERICAN JOURNAL OF RESPIRATORY AND CRITICAL CARE MEDICINE VOL 188 2013

24. Health Effects Institute Panel on the Health Effects of Traffic-Related
Air Pollution. Traffic-related air pollution: a critical review of the
literature on emissions, exposure and health effects. Special report 17.
Boston, MA: HEI; 2009.
25. Henrotin JB, Zeller M, Lorgis L, Cottin Y, Giroud M, Béjot Y. Evidence
of the role of short-term exposure to ozone on ischaemic cerebral and
cardiac events: the Dijon Vascular Project (DIVA). Heart 2010;96:
1990–1996.
26. Zidek JV, Wong H, Le ND, Burnett R. Causality, measurement error and
multicollinearity in epidemiology. Environmetrics 1996;7:441–451.
27. Beckerman B, Jerrett M, Brook JR, Verma DK, Arain MA, Finkelstein
MM. Correlation of nitrogen dioxide with other traffic pollutants near
a major expressway. Atmos Environ 2008;42:275–290.
28. McConnell R, Berhane K, Yao L, Lurmann FW, Avol E, Peters JM.
Predicting residential ozone deficits from nearby traffic. Sci Total
Environ 2006;363:166–174.
29. Woodcock J, Edwards P, Tonne C, Armstrong BG, Ashiru O, Banister
D, Beevers S, Chalabi Z, Chowdhury Z, Cohen A, et al. Public health
benefits of strategies to reduce greenhouse-gas emissions: urban land
transport. Lancet 2009;374:1930–1943.
30. Rojas-Rueda D, de Nazelle A, Tainio M, Nieuwenhuijsen MJ. The health
risks and benefits of cycling in urban environments compared with car
use: health impact assessment study. BMJ 2011;343:d4521.
31. California Department of Public Health California Tobacco Control
Program. Smoking prevalence among California adults, 1984-2010
[prepared 2011 Apr; accessed 2012 Sep 11]. Available from: http://
www.cdph.ca.gov/Pages/NR11-031SmokingChart.aspx
32. de Nazelle A, Nieuwenhuijsen MJ, Antó JM, Brauer M, Briggs D,
Braun-Fahrlander C, Cavill N, Cooper AR, Desqueyroux H, Fruin
S, et al. Improving health through policies that promote active travel:
a review of evidence to support integrated health impact assessment.
Environ Int 2011;37:766–777.
Jerrett, Burnett, Beckerman, et al.: Air Pollution and Mortality in California 599
Spatiotemporal Analysis of Air Pollution and Mortality in California Based on the
American Cancer Society Cohort: Final Report
Principal Investigator:
Michael Jerrett, PhD
Co-Investigators:
Richard T. Burnett, PhD Arden Pope III, PhD Daniel Krewski, PhD George Thurston, ScD
George Christakos, PhD, ScD Edward Hughes, PhD
Zev Ross, MS Yuanli Shi, MD
Michael Thun, MD
Student and Postdoctoral Co-Investigators:
Bernardo Beckerman, MS Michelle Catherine Turner, MS
Jason Su, PhD Seung-Jae Lee, PhD
Prepared for:
Contract # 06-332 State of California Air Resources Board
Research Division PO Box 2815
Sacramento CA 95812
5
ABSTRACT Problem: Studies using the American Cancer Society (ACS) Cancer Prevention II (CPS II) cohort to assess the relation between particulate air pollution and mortality rank among the most influential and widely cited. The original study, a reanalysis that introduced new random effects methods and spatial analytic techniques, and recent studies with longer follow-up and improved exposure assignment, have all demonstrated statistically significant and substantively large air pollution effects on all-cause and cause-specific mortality. Due to this robust association and a lack of other large cohort studies on the long-term effects, the ACS studies have proven important to government regulatory interventions and health burden assessments. At present there are no ACS CPS II statewide studies in California that investigate whether the risks are similar to or different from those reported in the above-mentioned analyses. Existing estimates come from either national-level ACS studies, in which the California subjects comprise less than 15% of the total national sample, or from select metropolitan or county areas of California, where questions remain about their generalizability to the rest of the state. A need therefore exists to investigate whether the results hold across California. In addition, none of the existing ACS studies have used high-resolution exposure assignment or investigated the temporal dimensions of the dose-response relationship. In this study we used advanced exposure modeling to reduce problems of measurement error, and we investigated time windows of exposure. Previous Work: Our previous work includes the original ACS study of particulate air pollution and mortality, the reanalysis of the ACS study, as well as studies involving analytic extensions to both these studies using new spatial models, and a study providing the first assessment of particulate air pollution at the within-city or “intraurban” scale using Los Angeles as the test site. Our Los Angeles results suggest the chronic health effects associated with intraurban gradients in exposure to fine particulate matter (PM2.5) are even larger than those previously reported for the metropolitan areas used in both the original study by Pope et al. [1]and the reanalysis by Krewski et al. [2]. For the within-city models, we observed effects nearly three times greater than those using models relying on between-community exposure contrasts. These findings were confirmed using more refined exposure models in a subsequent Health Effects Institute report [3]. In that report, we also found risks for the national study that were greater than those in earlier studies for deaths due to cardiovascular causes. Objectives: In this context, we pursued the following research objectives: (1) to derive detailed assessments of the health effects from particulate and gaseous air pollution on all-cause and cause-specific mortality in California based on the ACS CPS II cohort, (2) to investigate whether specific particle characteristics associate with larger health effects through examination of intraurban gradients in exposure to different particle constituents and sources, and (3) to determine whether critical exposure time windows exist in the relationship between air pollution and mortality in California. Description: We identified more than 76,000 California subjects in the ACS cohort to serve as the study population (20,432 deaths with an 18 year follow-up ending in 2000). These subjects were widely distributed across California, giving comprehensive coverage for much of the
6
population of the state (i.e., 54 of 58 California counties have ACS subjects). For the first time in using the ACS CPS-II data, we have geocoded subjects to their home address to refine our exposure assignment. As a basis for exposure assessment, we utilized interpolation estimates derived by Air Resources Board staff for the California Teachers Cohort Study led by Dr. Michael Lipsett, with Dr. Jerrett as co-investigator. We also implemented geostatisical kriging, advanced remote sensing coupled with atmospheric modeling, land use regression, and Bayesian models capable of assessing space-time patterns in exposure to improve exposure assignment. We employed a comprehensive set of 20 individual risk factor variables similar to those used in previous ACS studies. These variables control for lifestyle, dietary, demographic, occupational, and educational influences that may confound the air pollution-mortality association. We used ecological variables in the neighborhoods of residence to control for “contextual” neighborhood confounding (e.g., unemployment). Although we used similar variables as in previous analyses to promote comparison to earlier results, we also tested other model specifications. We assessed the association between air pollution and several causes of death, including cardiovascular (CVD), ischemic heart disease (IHD), respiratory, lung cancer, and other causes. We also evaluated all-cause mortality. There is some debate about the efficacy of evaluating associations between all-cause mortality and air pollution because several causes of deaths in this broad categorization likely have little association with air pollution. We have included the all-cause metric for several reasons. First, the all-cause metric has been used in most of the other published studies to date, and therefore we used this outcome for comparability with previous results. Second, the all-cause measure avoids the potential cross-classification bias between respiratory and CVD deaths. Third, the all-cause metric can be useful in burden of mortality assessments, and it has been used extensively for this purpose. Finally, we use the all-cause metric to compare with the cause-specific effects that we hypothesized should be more strongly related to pollution exposures (i.e., CVD deaths). A related point is the use of the combined "all other" causes of death to serve as a negative "control". The overall results are more compelling if one observes associations only for those causes of deaths for which there exists biological plausibility or where previous results have provided an a priori hypothesis (CVD, IHD, lung cancer), and where the risks for all other effects are null. We assessed the association between air pollution and death using standard and multilevel Cox proportional hazards models. Control was also applied for residence in the five largest urban conurbations, which potentially have different mortality rates than non-metropolitan areas. We also assessed spatial autocorrelation in the health effect estimates. Key Results: Below we summarize the key results from our investigation.
1. Cardiovascular disease (CVD) deaths, especially those from ischemic heart disease
(IHD), are consistently and robustly associated with measures of fine particulate and traffic-related air pollution. The effects on CVD and IHD in California are virtually identical to those of the national ACS study (see Abstract Table 1).
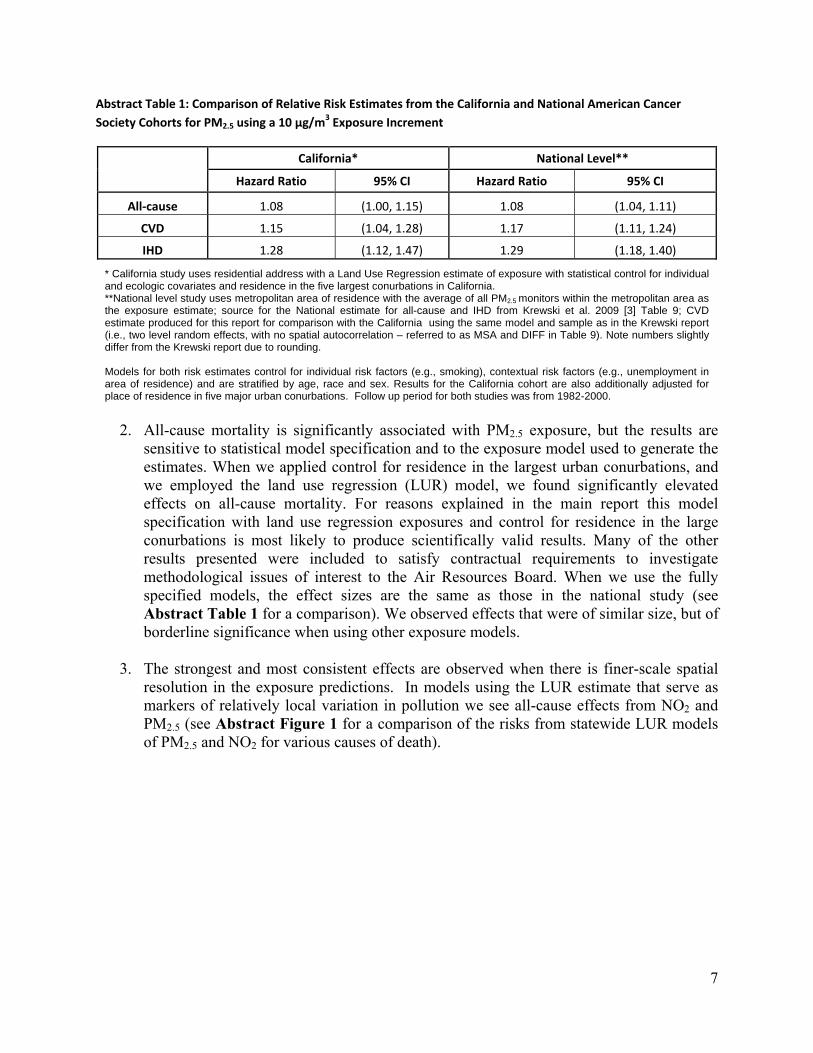
7
Abstract Table 1: Comparison of Relative Risk Estimates from the California and National American Cancer
Society Cohorts for PM2.5 using a 10 µg/m3 Exposure Increment
California* National Level**
Hazard Ratio 95% CI Hazard Ratio 95% CI
All‐cause 1.08 (1.00, 1.15) 1.08 (1.04, 1.11)
CVD 1.15 (1.04, 1.28) 1.17 (1.11, 1.24)
IHD 1.28 (1.12, 1.47) 1.29 (1.18, 1.40)
* California study uses residential address with a Land Use Regression estimate of exposure with statistical control for individual and ecologic covariates and residence in the five largest conurbations in California. **National level study uses metropolitan area of residence with the average of all PM2.5 monitors within the metropolitan area as the exposure estimate; source for the National estimate for all-cause and IHD from Krewski et al. 2009 [3] Table 9; CVD estimate produced for this report for comparison with the California using the same model and sample as in the Krewski report (i.e., two level random effects, with no spatial autocorrelation – referred to as MSA and DIFF in Table 9). Note numbers slightly differ from the Krewski report due to rounding. Models for both risk estimates control for individual risk factors (e.g., smoking), contextual risk factors (e.g., unemployment in area of residence) and are stratified by age, race and sex. Results for the California cohort are also additionally adjusted for place of residence in five major urban conurbations. Follow up period for both studies was from 1982-2000.
2. All-cause mortality is significantly associated with PM2.5 exposure, but the results are
sensitive to statistical model specification and to the exposure model used to generate the estimates. When we applied control for residence in the largest urban conurbations, and we employed the land use regression (LUR) model, we found significantly elevated effects on all-cause mortality. For reasons explained in the main report this model specification with land use regression exposures and control for residence in the large conurbations is most likely to produce scientifically valid results. Many of the other results presented were included to satisfy contractual requirements to investigate methodological issues of interest to the Air Resources Board. When we use the fully specified models, the effect sizes are the same as those in the national study (see Abstract Table 1 for a comparison). We observed effects that were of similar size, but of borderline significance when using other exposure models.
3. The strongest and most consistent effects are observed when there is finer-scale spatial resolution in the exposure predictions. In models using the LUR estimate that serve as markers of relatively local variation in pollution we see all-cause effects from NO2 and PM2.5 (see Abstract Figure 1 for a comparison of the risks from statewide LUR models of PM2.5 and NO2 for various causes of death).
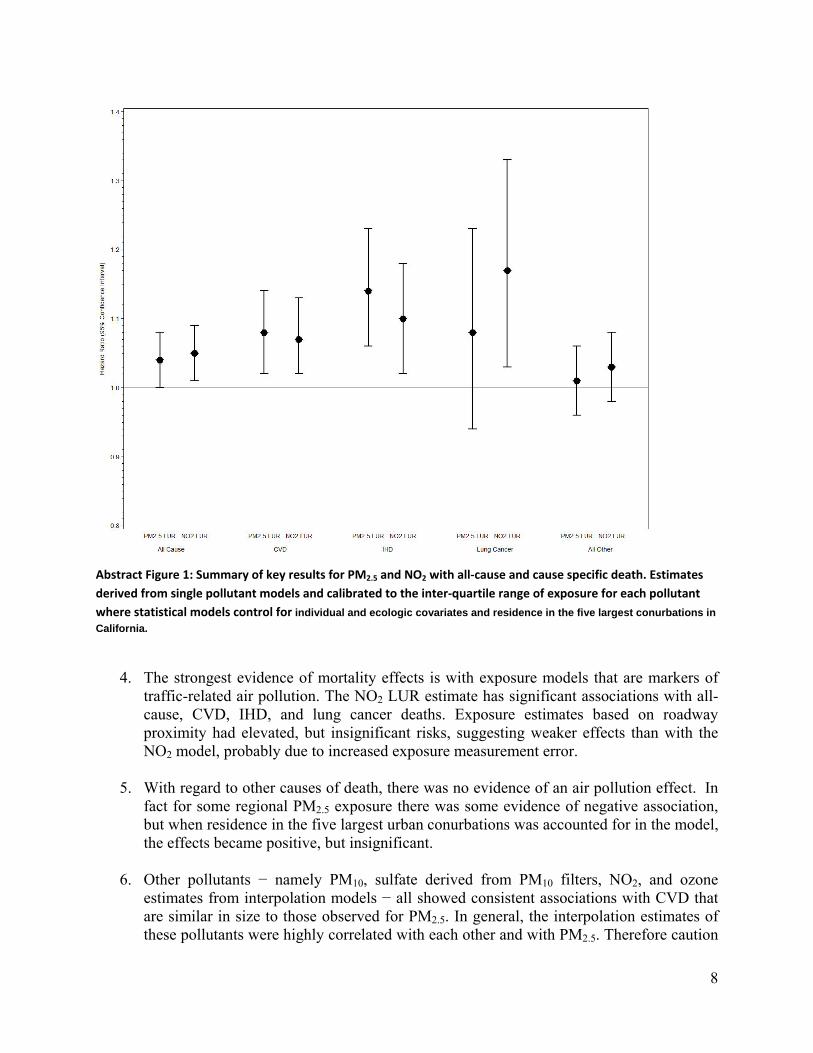
8
Abstract Figure 1: Summary of key results for PM2.5 and NO2 with all‐cause and cause specific death. Estimates
derived from single pollutant models and calibrated to the inter‐quartile range of exposure for each pollutant
where statistical models control for individual and ecologic covariates and residence in the five largest conurbations in
California.
4. The strongest evidence of mortality effects is with exposure models that are markers of
traffic-related air pollution. The NO2 LUR estimate has significant associations with all-cause, CVD, IHD, and lung cancer deaths. Exposure estimates based on roadway proximity had elevated, but insignificant risks, suggesting weaker effects than with the NO2 model, probably due to increased exposure measurement error.
5. With regard to other causes of death, there was no evidence of an air pollution effect. In fact for some regional PM2.5 exposure there was some evidence of negative association, but when residence in the five largest urban conurbations was accounted for in the model, the effects became positive, but insignificant.
6. Other pollutants − namely PM10, sulfate derived from PM10 filters, NO2, and ozone estimates from interpolation models − all showed consistent associations with CVD that are similar in size to those observed for PM2.5. In general, the interpolation estimates of these pollutants were highly correlated with each other and with PM2.5. Therefore caution
9
must be exercised in interpreting effects from any single pollutant when the exposure estimate relies solely on interpolation.
CONCLUSION Taken together, the results from this investigation indicate consistent and robust effects of PM2.5 − and other pollutants commonly found in the combustion-source mixture with PM2.5
− on deaths from CVD and IHD. We also found significant associations between PM2.5 and all causes of death, although these findings were sensitive to model specification. In Los Angeles, where the monitoring network is capable of detecting intraurban variations in PM2.5, we observed large effects on death from all causes, CVD, IHD, and respiratory disease. These results were consistent with past ACS analyses and with findings from other national or international studies reviewed in this report. Our strongest results were from a land use regression estimate of NO2, which is generally thought to represent traffic sources, where significantly elevated effects were found on deaths from all causes, CVD, IHD, and lung cancer. We therefore conclude that combustion-source air pollution is significantly associated with premature death in this large cohort of Californians.
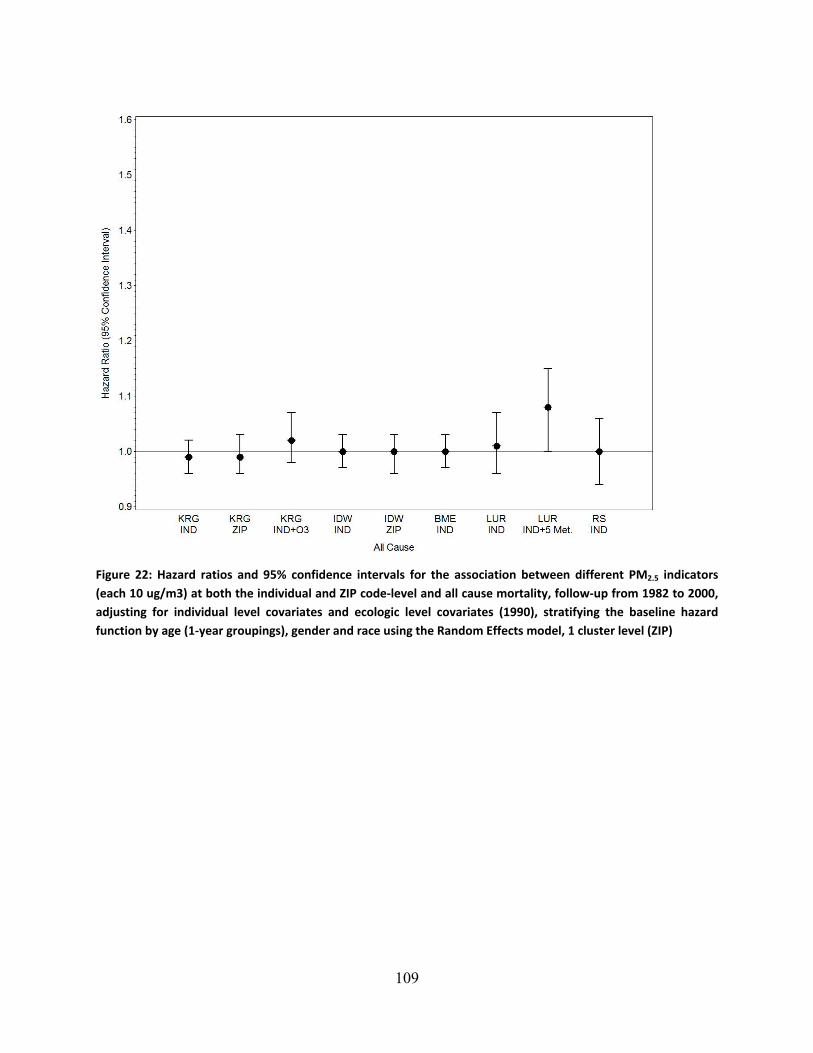
109
Figure 22: Hazard ratios and 95% confidence intervals for the association between different PM2.5 indicators
(each 10 ug/m3) at both the individual and ZIP code‐level and all cause mortality, follow‐up from 1982 to 2000,
adjusting for individual level covariates and ecologic level covariates (1990), stratifying the baseline hazard
function by age (1‐year groupings), gender and race using the Random Effects model, 1 cluster level (ZIP)
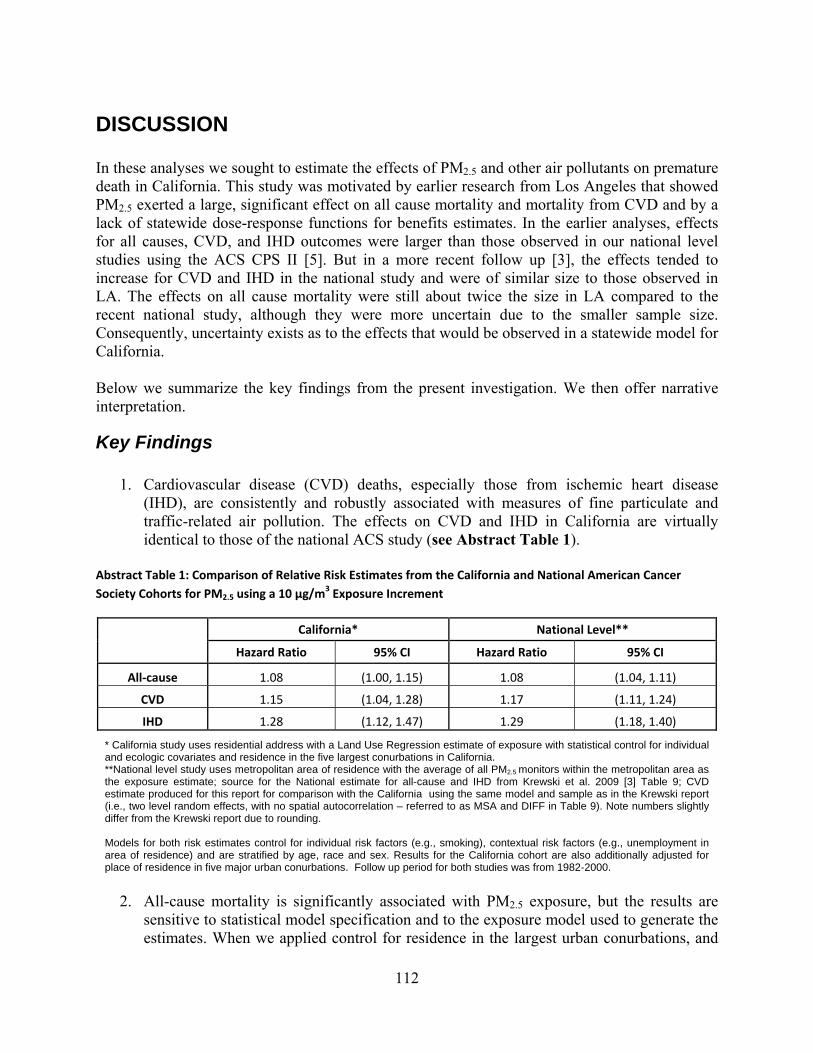
112
DISCUSSION In these analyses we sought to estimate the effects of PM2.5 and other air pollutants on premature death in California. This study was motivated by earlier research from Los Angeles that showed PM2.5 exerted a large, significant effect on all cause mortality and mortality from CVD and by a lack of statewide dose-response functions for benefits estimates. In the earlier analyses, effects for all causes, CVD, and IHD outcomes were larger than those observed in our national level studies using the ACS CPS II [5]. But in a more recent follow up [3], the effects tended to increase for CVD and IHD in the national study and were of similar size to those observed in LA. The effects on all cause mortality were still about twice the size in LA compared to the recent national study, although they were more uncertain due to the smaller sample size. Consequently, uncertainty exists as to the effects that would be observed in a statewide model for California. Below we summarize the key findings from the present investigation. We then offer narrative interpretation.
Key Findings
1. Cardiovascular disease (CVD) deaths, especially those from ischemic heart disease (IHD), are consistently and robustly associated with measures of fine particulate and traffic-related air pollution. The effects on CVD and IHD in California are virtually identical to those of the national ACS study (see Abstract Table 1).
Abstract Table 1: Comparison of Relative Risk Estimates from the California and National American Cancer
Society Cohorts for PM2.5 using a 10 µg/m3 Exposure Increment
California* National Level**
Hazard Ratio 95% CI Hazard Ratio 95% CI
All‐cause 1.08 (1.00, 1.15) 1.08 (1.04, 1.11)
CVD 1.15 (1.04, 1.28) 1.17 (1.11, 1.24)
IHD 1.28 (1.12, 1.47) 1.29 (1.18, 1.40)
* California study uses residential address with a Land Use Regression estimate of exposure with statistical control for individual and ecologic covariates and residence in the five largest conurbations in California. **National level study uses metropolitan area of residence with the average of all PM2.5 monitors within the metropolitan area as the exposure estimate; source for the National estimate for all-cause and IHD from Krewski et al. 2009 [3] Table 9; CVD estimate produced for this report for comparison with the California using the same model and sample as in the Krewski report (i.e., two level random effects, with no spatial autocorrelation – referred to as MSA and DIFF in Table 9). Note numbers slightly differ from the Krewski report due to rounding. Models for both risk estimates control for individual risk factors (e.g., smoking), contextual risk factors (e.g., unemployment in area of residence) and are stratified by age, race and sex. Results for the California cohort are also additionally adjusted for place of residence in five major urban conurbations. Follow up period for both studies was from 1982-2000.
2. All-cause mortality is significantly associated with PM2.5 exposure, but the results are
sensitive to statistical model specification and to the exposure model used to generate the estimates. When we applied control for residence in the largest urban conurbations, and
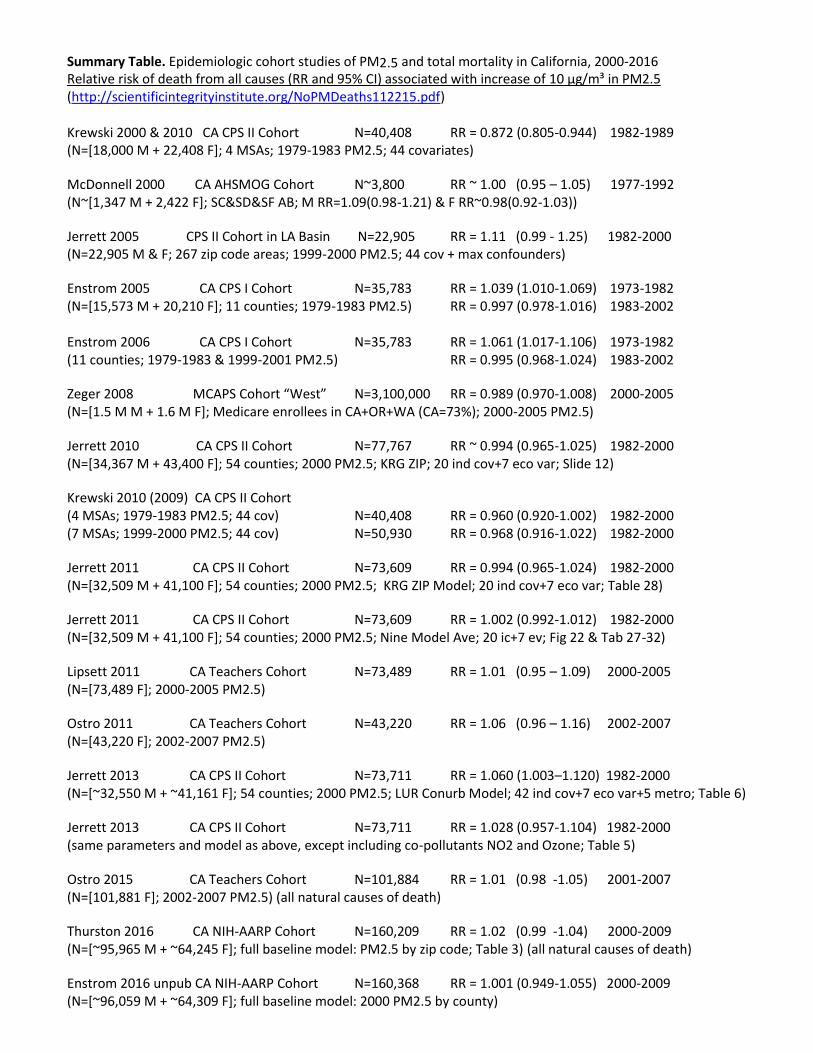
Summary Table. Epidemiologic cohort studies of PM2.5 and total mortality in California, 2000-2016 Relative risk of death from all causes (RR and 95% CI) associated with increase of 10 µg/m³ in PM2.5 (http://scientificintegrityinstitute.org/NoPMDeaths112215.pdf) Krewski 2000 & 2010 CA CPS II Cohort N=40,408 RR = 0.872 (0.805-0.944) 1982-1989 (N=[18,000 M + 22,408 F]; 4 MSAs; 1979-1983 PM2.5; 44 covariates)
McDonnell 2000 CA AHSMOG Cohort N~3,800 RR ~ 1.00 (0.95 – 1.05) 1977-1992 (N~[1,347 M + 2,422 F]; SC&SD&SF AB; M RR=1.09(0.98-1.21) & F RR~0.98(0.92-1.03))
Jerrett 2005 CPS II Cohort in LA Basin N=22,905 RR = 1.11 (0.99 - 1.25) 1982-2000 (N=22,905 M & F; 267 zip code areas; 1999-2000 PM2.5; 44 cov + max confounders)
Enstrom 2005 CA CPS I Cohort N=35,783 RR = 1.039 (1.010-1.069) 1973-1982 (N=[15,573 M + 20,210 F]; 11 counties; 1979-1983 PM2.5) RR = 0.997 (0.978-1.016) 1983-2002 Enstrom 2006 CA CPS I Cohort N=35,783 RR = 1.061 (1.017-1.106) 1973-1982 (11 counties; 1979-1983 & 1999-2001 PM2.5) RR = 0.995 (0.968-1.024) 1983-2002
Zeger 2008 MCAPS Cohort “West” N=3,100,000 RR = 0.989 (0.970-1.008) 2000-2005 (N=[1.5 M M + 1.6 M F]; Medicare enrollees in CA+OR+WA (CA=73%); 2000-2005 PM2.5)
Jerrett 2010 CA CPS II Cohort N=77,767 RR ~ 0.994 (0.965-1.025) 1982-2000 (N=[34,367 M + 43,400 F]; 54 counties; 2000 PM2.5; KRG ZIP; 20 ind cov+7 eco var; Slide 12)
Krewski 2010 (2009) CA CPS II Cohort (4 MSAs; 1979-1983 PM2.5; 44 cov) N=40,408 RR = 0.960 (0.920-1.002) 1982-2000 (7 MSAs; 1999-2000 PM2.5; 44 cov) N=50,930 RR = 0.968 (0.916-1.022) 1982-2000
Jerrett 2011 CA CPS II Cohort N=73,609 RR = 0.994 (0.965-1.024) 1982-2000 (N=[32,509 M + 41,100 F]; 54 counties; 2000 PM2.5; KRG ZIP Model; 20 ind cov+7 eco var; Table 28)
Jerrett 2011 CA CPS II Cohort N=73,609 RR = 1.002 (0.992-1.012) 1982-2000 (N=[32,509 M + 41,100 F]; 54 counties; 2000 PM2.5; Nine Model Ave; 20 ic+7 ev; Fig 22 & Tab 27-32)
Lipsett 2011 CA Teachers Cohort N=73,489 RR = 1.01 (0.95 – 1.09) 2000-2005 (N=[73,489 F]; 2000-2005 PM2.5)
Ostro 2011 CA Teachers Cohort N=43,220 RR = 1.06 (0.96 – 1.16) 2002-2007 (N=[43,220 F]; 2002-2007 PM2.5)
Jerrett 2013 CA CPS II Cohort N=73,711 RR = 1.060 (1.003–1.120) 1982-2000 (N=[~32,550 M + ~41,161 F]; 54 counties; 2000 PM2.5; LUR Conurb Model; 42 ind cov+7 eco var+5 metro; Table 6)
Jerrett 2013 CA CPS II Cohort N=73,711 RR = 1.028 (0.957-1.104) 1982-2000 (same parameters and model as above, except including co-pollutants NO2 and Ozone; Table 5)
Ostro 2015 CA Teachers Cohort N=101,884 RR = 1.01 (0.98 -1.05) 2001-2007 (N=[101,881 F]; 2002-2007 PM2.5) (all natural causes of death)
Thurston 2016 CA NIH-AARP Cohort N=160,209 RR = 1.02 (0.99 -1.04) 2000-2009 (N=[~95,965 M + ~64,245 F]; full baseline model: PM2.5 by zip code; Table 3) (all natural causes of death)
Enstrom 2016 unpub CA NIH-AARP Cohort N=160,368 RR = 1.001 (0.949-1.055) 2000-2009 (N=[~96,059 M + ~64,309 F]; full baseline model: 2000 PM2.5 by county)
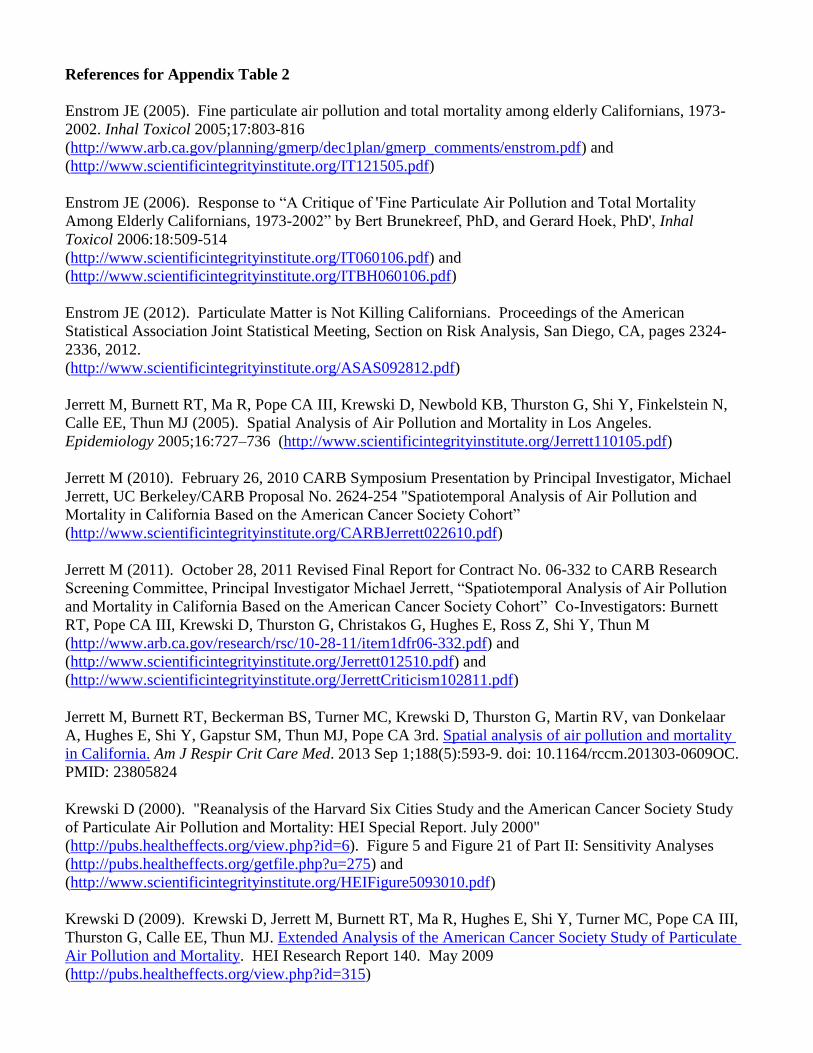
References for Appendix Table 2
Enstrom JE (2005). Fine particulate air pollution and total mortality among elderly Californians, 1973-
2002. Inhal Toxicol 2005;17:803-816
(http://www.arb.ca.gov/planning/gmerp/dec1plan/gmerp_comments/enstrom.pdf) and
(http://www.scientificintegrityinstitute.org/IT121505.pdf)
Enstrom JE (2006). Response to “A Critique of 'Fine Particulate Air Pollution and Total Mortality
Among Elderly Californians, 1973-2002” by Bert Brunekreef, PhD, and Gerard Hoek, PhD', Inhal
Toxicol 2006:18:509-514
(http://www.scientificintegrityinstitute.org/IT060106.pdf) and
(http://www.scientificintegrityinstitute.org/ITBH060106.pdf)
Enstrom JE (2012). Particulate Matter is Not Killing Californians. Proceedings of the American
Statistical Association Joint Statistical Meeting, Section on Risk Analysis, San Diego, CA, pages 2324-
2336, 2012.
(http://www.scientificintegrityinstitute.org/ASAS092812.pdf)
Jerrett M, Burnett RT, Ma R, Pope CA III, Krewski D, Newbold KB, Thurston G, Shi Y, Finkelstein N,
Calle EE, Thun MJ (2005). Spatial Analysis of Air Pollution and Mortality in Los Angeles.
Epidemiology 2005;16:727–736 (http://www.scientificintegrityinstitute.org/Jerrett110105.pdf)
Jerrett M (2010). February 26, 2010 CARB Symposium Presentation by Principal Investigator, Michael
Jerrett, UC Berkeley/CARB Proposal No. 2624-254 "Spatiotemporal Analysis of Air Pollution and
Mortality in California Based on the American Cancer Society Cohort”
(http://www.scientificintegrityinstitute.org/CARBJerrett022610.pdf)
Jerrett M (2011). October 28, 2011 Revised Final Report for Contract No. 06-332 to CARB Research
Screening Committee, Principal Investigator Michael Jerrett, “Spatiotemporal Analysis of Air Pollution
and Mortality in California Based on the American Cancer Society Cohort” Co-Investigators: Burnett
RT, Pope CA III, Krewski D, Thurston G, Christakos G, Hughes E, Ross Z, Shi Y, Thun M
(http://www.arb.ca.gov/research/rsc/10-28-11/item1dfr06-332.pdf) and
(http://www.scientificintegrityinstitute.org/Jerrett012510.pdf) and
(http://www.scientificintegrityinstitute.org/JerrettCriticism102811.pdf)
Jerrett M, Burnett RT, Beckerman BS, Turner MC, Krewski D, Thurston G, Martin RV, van Donkelaar
A, Hughes E, Shi Y, Gapstur SM, Thun MJ, Pope CA 3rd. Spatial analysis of air pollution and mortality
in California. Am J Respir Crit Care Med. 2013 Sep 1;188(5):593-9. doi: 10.1164/rccm.201303-0609OC.
PMID: 23805824
Krewski D (2000). "Reanalysis of the Harvard Six Cities Study and the American Cancer Society Study
of Particulate Air Pollution and Mortality: HEI Special Report. July 2000"
(http://pubs.healtheffects.org/view.php?id=6). Figure 5 and Figure 21 of Part II: Sensitivity Analyses
(http://pubs.healtheffects.org/getfile.php?u=275) and
(http://www.scientificintegrityinstitute.org/HEIFigure5093010.pdf)
Krewski D (2009). Krewski D, Jerrett M, Burnett RT, Ma R, Hughes E, Shi Y, Turner MC, Pope CA III,
Thurston G, Calle EE, Thun MJ. Extended Analysis of the American Cancer Society Study of Particulate
Air Pollution and Mortality. HEI Research Report 140. May 2009
(http://pubs.healtheffects.org/view.php?id=315)
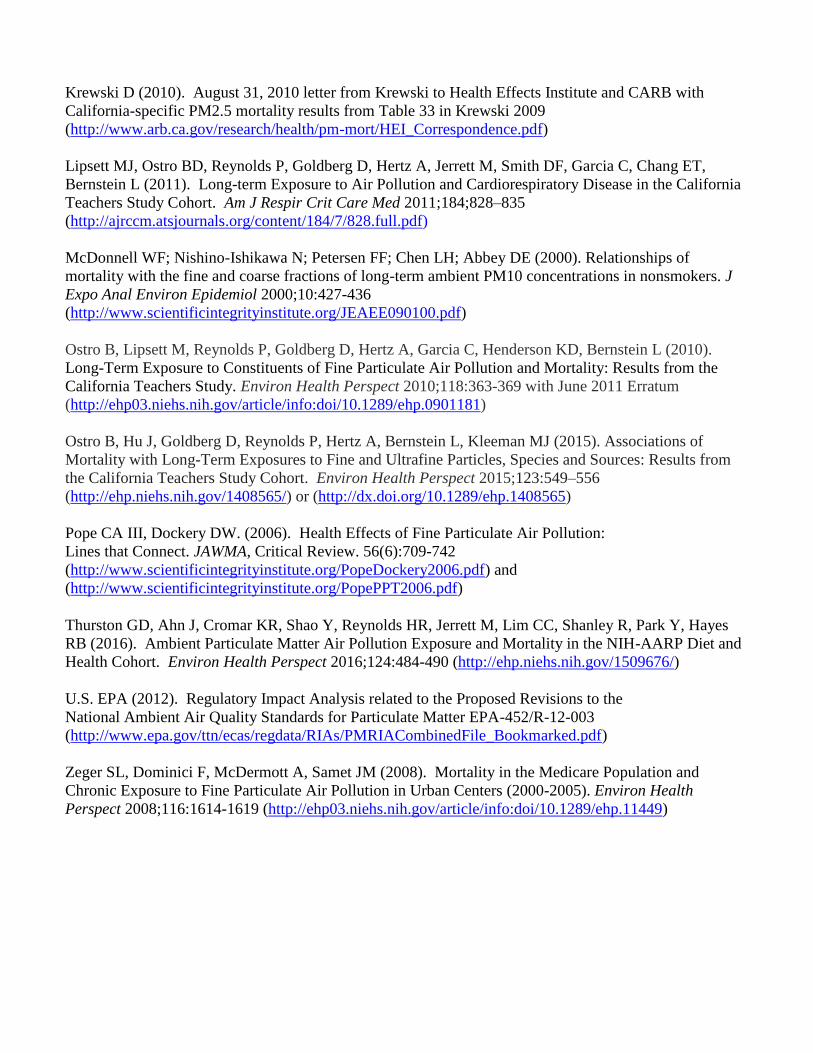
Krewski D (2010). August 31, 2010 letter from Krewski to Health Effects Institute and CARB with
California-specific PM2.5 mortality results from Table 33 in Krewski 2009
(http://www.arb.ca.gov/research/health/pm-mort/HEI_Correspondence.pdf)
Lipsett MJ, Ostro BD, Reynolds P, Goldberg D, Hertz A, Jerrett M, Smith DF, Garcia C, Chang ET,
Bernstein L (2011). Long-term Exposure to Air Pollution and Cardiorespiratory Disease in the California
Teachers Study Cohort. Am J Respir Crit Care Med 2011;184;828–835
(http://ajrccm.atsjournals.org/content/184/7/828.full.pdf)
McDonnell WF; Nishino-Ishikawa N; Petersen FF; Chen LH; Abbey DE (2000). Relationships of
mortality with the fine and coarse fractions of long-term ambient PM10 concentrations in nonsmokers. J
Expo Anal Environ Epidemiol 2000;10:427-436
(http://www.scientificintegrityinstitute.org/JEAEE090100.pdf)
Ostro B, Lipsett M, Reynolds P, Goldberg D, Hertz A, Garcia C, Henderson KD, Bernstein L (2010).
Long-Term Exposure to Constituents of Fine Particulate Air Pollution and Mortality: Results from the
California Teachers Study. Environ Health Perspect 2010;118:363-369 with June 2011 Erratum
(http://ehp03.niehs.nih.gov/article/info:doi/10.1289/ehp.0901181)
Ostro B, Hu J, Goldberg D, Reynolds P, Hertz A, Bernstein L, Kleeman MJ (2015). Associations of
Mortality with Long-Term Exposures to Fine and Ultrafine Particles, Species and Sources: Results from
the California Teachers Study Cohort. Environ Health Perspect 2015;123:549–556
(http://ehp.niehs.nih.gov/1408565/) or (http://dx.doi.org/10.1289/ehp.1408565)
Pope CA III, Dockery DW. (2006). Health Effects of Fine Particulate Air Pollution:
Lines that Connect. JAWMA, Critical Review. 56(6):709-742
(http://www.scientificintegrityinstitute.org/PopeDockery2006.pdf) and
(http://www.scientificintegrityinstitute.org/PopePPT2006.pdf)
Thurston GD, Ahn J, Cromar KR, Shao Y, Reynolds HR, Jerrett M, Lim CC, Shanley R, Park Y, Hayes
RB (2016). Ambient Particulate Matter Air Pollution Exposure and Mortality in the NIH-AARP Diet and
Health Cohort. Environ Health Perspect 2016;124:484-490 (http://ehp.niehs.nih.gov/1509676/)
U.S. EPA (2012). Regulatory Impact Analysis related to the Proposed Revisions to the
National Ambient Air Quality Standards for Particulate Matter EPA-452/R-12-003
(http://www.epa.gov/ttn/ecas/regdata/RIAs/PMRIACombinedFile_Bookmarked.pdf)
Zeger SL, Dominici F, McDermott A, Samet JM (2008). Mortality in the Medicare Population and
Chronic Exposure to Fine Particulate Air Pollution in Urban Centers (2000-2005). Environ Health
Perspect 2008;116:1614-1619 (http://ehp03.niehs.nih.gov/article/info:doi/10.1289/ehp.11449)
1
Critiques of Final Report for CARB Contract No. 06-332
(http://www.scientificintegrityinstitute.org/JerrettCriticism102811.pdf)
“Spatiotemporal Analysis of Air Pollution and Mortality in California
Based on the American Cancer Society Cohort: Final Report”
Michael Jerrett, Richard T. Burnett, Arden Pope III, Daniel Krewski, George Thurston,
George Christakos, Edward Hughes, Zev Ross, Yuanli Shi, Michael Thun and
Bernardo Beckerman, Michelle Catherine Turner, Jason Su, Seung-Joe Lee
Compiled by
James E. Enstrom, Ph.D., M.P.H.
December 12, 2011
June 9, 2011 and October 28, 2011 CARB Research Screening Committee Meeting Information
(http://www.arb.ca.gov/research/rsc/rsc.htm)
June 9, 2011 Draft Final Report “Spatiotemporal Analysis of Air Pollution and Mortality in
California Based on the American Cancer Society Cohort: Final Report” (145 pages)
(http://www.arb.ca.gov/research/rsc/06-09-11/agenda4_contract06-
332_draft_report_cynthia_0520_v2.pdf)
October 28, 2011 Revised Final Report “Spatiotemporal Analysis of Air Pollution and Mortality
in California Based on the American Cancer Society Cohort: Final Report” (148 pages)
(http://www.arb.ca.gov/research/rsc/10-28-11/item1dfr06-332.pdf)
June 9, 2011 written comments by James E. Enstrom, Ph.D., M.P.H., UCLA, Los Angeles, CA
(Summary read by Enstrom on June 9, 2011)
(http://www.scientificintegrityinstitute.org/Enstrom060911.pdf)
June 9, 2011 written comments by Norman R. “Skip” Brown of Delta Construction Company,
Sacramento, CA (Summary read by Brown on June 9, 2011)
(http://www.scientificintegrityinstitute.org/Delta060911.pdf)
June 9, 2011 written comments by John D. Dunn, M.D., J.D., Lake Brownwood, TX
(Summary read by Hank de Carbonel on June 9, 2011)
(http://www.scientificintegrityinstitute.org/Dunn060911.pdf)
2
June 27, 2011 written comments by Frederick W. Lipfert, Ph.D., Northport, NY
(http://www.scientificintegrityinstitute.org/Lipfert062711.pdf)
August 17, 2011 Bakersfield Californian article by Lois Henry
“New study doesn’t hit the mark for air pollution deaths”
(http://www.bakersfield.com/news/columnist/henry/x560461816/New-study-doesnt-hit-the-
mark-for-air-pollution-deaths) or (http://www.scientificintegrityinstitute.org/Henry081711.pdf)
September 13, 2011 written comments of William Matt Briggs, Ph.D., New York, NY
(http://wmbriggs.com/blog/?p=4353) or
(http://www.scientificintegrityinstitute.org/Briggs091311.pdf)
October 20, 2011 Second Delta (Brown) Critique
(Summary read by Allen Faris on October 28, 2011)
(http://www.scientificintegrityinstitute.org/Delta102011.pdf)
October 24, 2011 Briggs Critique
(Summary not read on October 28, 2011)
(http://www.scientificintegrityinstitute.org/Briggs102411.pdf)
October 26, 2011 Second Enstrom Critique
(Statement read by Betty Plowman on October 28, 2011)
(http://www.scientificintegrityinstitute.org/Enstrom102611.pdf)
October 26, 2011 Second Malkan Critique
(Statement read by Richard Fields on October 28, 2011)
(http://www.scientificintegrityinstitute.org/Malkan102611.pdf)
October 26, 2011 Second Dunn Critique
(Summary read by Hank de Carbonel on October 28, 2011
(http://www.scientificintegrityinstitute.org/Dunn102611.pdf)
October 26, 2011 Lipfert Critique
(Summary read by Eric Eisenhammer on October 28, 2011)
(http://www.scientificintegrityinstitute.org/Lipfert102611.pdf)
October 26, 2011 Fulks Critique
(Summary read by Daniel Robertson on October 28, 2011)
(http://www.scientificintegrityinstitute.org/Fulks102611.pdf)
3
October 30, 2011 Briggs Blog re Jerrett Report
“A Case Of Failed Peer Review: Dust And Death”
(http://wmbriggs.com/blog/?p=4587)
(http://www.scientificintegrityinstitute.org/Briggs103011.pdf)
November 30, 2011 Bakersfield Californian article by Lois Henry
“Air Board Study in Error? They Don’t Seem to Care”
(http://www.bakersfield.com/news/columnist/henry/x1347873497/LOIS-HENRY-Air-
Board-study-in-error-They-dont-seem-to-care)
(http://www.scientificintegrityinstitute.org/Henry113011.pdf)
December 12, 2011 Briggs Blog re Jerrett Report
"CARB Misinterprets Statistics, Calls For Elimination of Dust"
(http://wmbriggs.com/blog/?p=4857)
(http://www.scientificintegrityinstitute.org/Briggs121211.pdf)
June 9, 2011 verbal comments by Dr. Enstrom, Dr. Matthew A. Malkan of UCLA, Mr. Brown,
and Dr. Dunn as read by Hank de Carbonel
(http://www.scientificintegrityinstitute.org/CARBRSC060911.mp3)
October 28, 2011 verbal comments read for Drs. Enstrom, Malkan, Dunn, Lipfert, and Fulks, and
Mr. Brown (http://www.scientificintegrityinstitute.org/CARBRSC102811.mp3) or
(http://www.cdtoa.org/CARBdocs/2011-10-28-SRatCARBreJerret.MP3)
1
December 1, 2014
From:
James E. Enstrom, Ph.D., M.P.H.
UCLA School of Public Health and
Los Angeles, CA 90095-1772 and
Scientific Integrity Institute
Los Angeles, CA 90024-2905
(310) 472-4274
To:
Environmental Protection Agency
EPA Docket Center (EPA/DC)
Mail code 28221T
1200 Pennsylvania Avenue, NW.
Washington, DC 20460.
Office of Management and Budget
Office of Information and Regulatory Affairs
Attn: Desk Officer for the EPA
25 17th St. NW.
Washington, DC 20503
Ms. Amy Vasu, Sector Policies and Programs
Division (D205–01), U.S. EPA, Research
Re:
Docket ID No. EPA-HQ-OAR-2013-0602
Public Comments on the Proposed Emission Guidelines for Greenhouse Gas Emissions from
Existing Stationary Sources: Electric Utility Generating Units (CPP) including the Regulatory
Impact Analysis (RIA) for the Proposed Carbon Pollution Guidelines for Existing Power Plants
and Emission Standards for Modified and Reconstructed Power Plants, EPA 542/R-14-002
2
I am an epidemiologist with substantial expertise in air pollution health effects, particularly the
relationship between air pollution and mortality in California and the United States. I challenge
the public health basis for the June 2, 2014 EPA Clean Power Plan (Cutting Carbon Pollution
from Power Plants) (http://www2.epa.gov/carbon-pollution-standards/clean-power-plan-
proposed-rule). In particular, I have substantial evidence challenging the validity of the EPA
Fact Sheet claim that “Americans will see billions of dollars in public health and climate
benefits, now and for future generations. The Clean Power Plan will lead to climate and health
benefits worth an estimated $55 billion to $93 billion in 2030, including avoiding 2,700 to 6,600
premature deaths and 140,000 to 150,000 asthma attacks in children.”
(http://www2.epa.gov/carbon-pollution-standards/fact-sheet-clean-power-plan-overview).
The June 2, 2014 EPA “Regulatory Impact Analysis for the Proposed Carbon Pollution
Guidelines for Existing Power Plants and Emission Standards for Modified and Reconstructed
Power Plants” (EPA-452/R-14-002)
(http://www2.epa.gov/sites/production/files/2014-06/documents/20140602ria-clean-power-
plan.pdf) states in section 4.3.1.1 Mortality Concentration-Response Functions for PM2.5 :
“Considering a substantial body of published scientific literature and reflecting thousands of
epidemiology, toxicology, and clinical studies, the PM ISA documents the association between
elevated PM2.5 concentrations and adverse health effects, including increased premature
mortality (U.S. EPA, 2009b). The PM ISA, which was twice reviewed by the Clean Air
Scientific Advisory Committee of EPA’s Science Advisory Board (SAB-CASAC) (U.S. EPA-
SAB, 2009b, 2009c), concluded that there is a causal relationship between mortality and both
long-term and short-term exposure to PM2.5 based on the entire body of scientific evidence. . . .
For adult PM-related mortality, we use the effect coefficients from the most recent epidemiology
studies examining two large population cohorts: the American Cancer Society cohort (Krewski et
al., 2009) and the Harvard Six Cities cohort (Lepeule et al., 2012). The PM ISA (U.S. EPA,
2009b) concluded that the ACS and Six Cities cohorts provide the strongest evidence of the
association between long-term PM2.5 exposure and premature mortality with support from a
number of additional cohort studies.”
In addition, this same document states in section 4.3.2 Economic Valuation for Health Co-
benefits : “After quantifying the change in adverse health impacts, we estimate the economic
value of these avoided impacts. Reductions in ambient concentrations of air pollution generally
lower the risk of future adverse health effects by a small amount for a large population. . . . The
unit values applied in this analysis are provided in Table 5-9 of the PM NAAQS RIA for each
health endpoint (U.S. EPA, 2012a). . . . Avoided premature deaths account for 98 percent of
monetized PM-related co-benefits and over 90 percent of monetized ozone-related co-benefits.”
Thus, the monetized public health benefits of the Clean Power Plan (CPP) depend heavily upon
the co-benefit of reducing PM2.5-related premature deaths. Without PM2.5-related premature
deaths the monetized public health benefits of the CPP are far less than the costs of
implementing the CPP.
3
I have assembled overwhelming evidence that challenges the validity of the relationship between
PM2.5 and total mortality (“premature deaths”) as described in publications based on the
American Cancer Society (ACS) Cancer Prevention Study II (CPS II) cohort, such as, Krewski et
al., 2009. This evidence is detailed in my attached November 15, 2013 critique “Scientific
Misconduct in Fine Particulate Matter Epidemiology by Dr. C. Arden Pope, III, in Collaboration
with Drs. Daniel Krewski, Michael Jerrett, and Richard Burnett, with the Complete Cooperation
of the American Cancer Society.” This 10-page, 5,000-word, 77-URL critique of the
publications based upon the ACS CPS II cohort is on my Scientific Integrity Institute website
(http://www.scientificintegrityinstitute.org/Pope111513.pdf). In addition, on March 19, 2014
this critique was submitted to the California Air Resources Board (CARB)
(http://www.arb.ca.gov/lispub/comm/bccomdisp.php?listname=truckbus14&comment_num=35
&virt_num=33), where it has been completely ignored by CARB staff and board members. My
critique is supported by my attached November 7, 2013 email request to Dr. Alpa V. Patel of
ACS Epidemiology describing my serious concerns about the use of CPS II data for examining
PM2.5 and mortality (http://www.scientificintegrityinstitute.org/Patel110713.pdf). My critique is
further supported by the 50 attached pages of January 6, 2010 to May 17, 2011 correspondence
between an Ad Hoc Group of California businessmen and the UC President Mark G. Yudof
regarding UC Berkeley Professor Michael Jerrett and his unethical use of ACS CPS II data in the
analysis and characterization of the relationship between PM2.5 and mortality in California
during 1982-2000 (http://calcontrk.org/Jerrett051711.pdf).
In conclusion, I challenge the use in the CPP of publications based upon the ACS CPS II cohort,
such as, Krewski et al., 2009. EPA must investigate my evidence regarding the following issues
regarding the CPS II cohort: unethical use of CPS II subjects’ home addresses for PM2.5
epidemiology, failure to fully disclose geographic variation in PM2.5 mortality risk, deliberate
misrepresentation of the PM2.5 mortality risk in California, failure to present national PM2.5
mortality findings based on CPS II deaths since 2000, failure of ACS to allow independent and
alternative analyses of the CPS II cohort, and other related scientific and ethical issues described
in the attached pages.
Until my extensive evidence challenging the public health basis for the CPP is properly
investigated the CPP should not be implemented.
Thank you very much for your consideration of my comments.
Sincerely yours,
James E. Enstrom, Ph.D., M.P.H.
UCLA School of Public Health and
Los Angeles, CA 90095-1772 and
Scientific Integrity Institute
Los Angeles, CA 90024-2905
(310) 472-4274
1
Scientific Misconduct in Fine Particulate Matter Epidemiology by Dr. C. Arden Pope, III,
in Collaboration with Drs. Daniel Krewski, Michael Jerrett, and Richard Burnett,
with the Complete Cooperation of the American Cancer Society
James E. Enstrom, Ph.D., M.P.H.
UCLA School of Public Health
Los Angeles, CA 90095-1772
and
Scientific Integrity Institute
Los Angeles, CA 90024-2905
November 15, 2013
This document presents detailed documented evidence of scientific misconduct in fine
particulate matter epidemiology by Clive Arden Pope, III, Ph.D., Mary Lou Fulton Professor of
Economics at Brigham Young University (https://economics.byu.edu/Pages/Faculty/C-Arden-
Pope.aspx). This scientific misconduct has been conducted with the close collaboration of
Daniel Krewski, Ph.D., Professor at the University of Ottawa Faculty of Medicine
(http://www.med.uottawa.ca/epid/eng/krewskibio.html), Michael Jerrett, Ph.D., Professor and
Chair of Environmental Health Sciences at the UC Berkeley School of Public Health
(http://ehs.sph.berkeley.edu/people/jerrett.htm), Richard T. Burnett, Ph.D., Senior Research
Scientist at Health Canada, Ottawa (http://www.zoominfo.com/p/Rick-Burnett/52191135). This
collaboration has been made possible with the complete cooperation of the American Cancer
Society during the past twenty years, involving Vice President of Epidemiology Emeritus
Michael J. Thun, M.D. (http://www.cancer.org/research/researchprogramsfunding/epidemiology-
cancerpreventionstudies/ourstaff/michael-j-thun) and Vice President of Epidemiology Susan M.
Gapstur, Ph.D. (http://www.cancer.org/research/researchprogramsfunding/epidemiology-
cancerpreventionstudies/ourstaff/susan-m-gapstur).
The focus here is on Dr. Pope because he is “The World’s Leading Expert on the Effects of Air
Pollution on Health,” as stated at the beginning of his 64 minute February 15, 2007 lecture “Air
Pollution and Health” to Sevier Citizens for Clean Air and Water in Richfield, Utah
(http://wn.com/arden_pope). This lecture used a PPT presentation that was similar to the one
used in his June 19, 2007 lecture to Utah Moms for Clean Air in Salt Lake City, Utah
(http://www.utahmomsforcleanair.org/docs/Utah-Moms_Arden-Pope-presentation.pdf). At the
beginning of his February 15, 2007 lecture Dr. Pope twice stated he was speaking “the truth the
best I know it” (http://www.scientificintegrityinstitute.org/Pope021507.pdf). As will be shown
with the evidence below, Pope did not speak the truth as he knew it then and he has gotten
progressively more dishonest since 2007. The primary form of scientific misconduct committed
by Dr. Pope has been falsification (not properly describing results in the research record and
willful perversion of facts).
The evidence here focuses on Dr. Pope’s scientific misconduct since I published my December
15, 2005 Inhalation Toxicology (IT) paper “Fine Particulate Air Pollution and Total Mortality
Among Elderly Californians, 1973-2002” and submitted it to the California Air Resources Board
2
(CARB) (http://www.arb.ca.gov/planning/gmerp/dec1plan/gmerp_comments/enstrom.pdf). In
particular, the evidence relates to fine particulate matter (PM2.5) epidemiology and diesel
vehicle regulations in California (http://www.forbes.com/2010/06/08/california-diesel-
regulation-pollution-opinions-columnists-henry-i-miller-james-e-enstrom.html) and to the
August 1, 2013 US House Science Committee subpoena of US Environmental Protection
Agency (EPA) “secret science” data from the American Cancer Society Cancer Prevention
Study II (CPS II) (http://science.house.gov/press-release/smith-subpoenas-epa-s-secret-science).
The focus of this document is on 1) Dr. Pope’s clear and consistent pattern of dishonesty and
deception regarding his research, publications, and statements on PM2.5 mortality risk in
California since 2006, while he participated in research on PM2.5 mortality risk in California
funded by CARB and 2) Dr. Pope’s direct involvement with CARB during 2006-2009 as a
“scientific advisor” on the key report that provided the public health justification for the passage
in December 2008 of draconian diesel PM2.5 regulations that have harmed countless California
businessmen.
Intense controversy regarding PM2.5 epidemiology dates back to Dr. Pope’s March 1, 1995
AJRCCM paper “Particulate Air Pollution as a Predictor of Mortality in a Prospective Study of
U.S. Adults” based on ACS CPS II data with Dr. Thun of ACS Epidemiology as second author
(http://www.atsjournals.org/doi/abs/10.1164/ajrccm/151.3_Pt_1.669). The initial controversy
was described in the July 25, 1997 Science article “Showdown Over Clean Air Science”
(http://www.sciencemag.org/content/277/5325/466.full) and the August/September 1997 Reason
article “Polluted Science” (http://reason.com/archives/1997/08/01/polluted-science).
The current controversy begins with my December 15, 2005 IT paper and the January 1, 2006 IT
editorial about my paper by Dr. Suresh Moolgavkar “Fine Particles and Mortality”
(http://www.scientificintegrityinstitute.org/IT010106.pdf). These papers were cited in Dr.
Pope’s June 1, 2006 JAWMA “Critical Review—Health effects of fine particulate air pollution:
Lines that connect” (http://www.scientificintegrityinstitute.org/PopeDockery2006.pdf). Then, in
conjunction with CARB, Dr. Pope prepared a 47-slide PPT presentation of his PM2.5 review
which included my 2005 IT paper and the 2006 IT editorial, as well as my picture
(http://www.scientificintegrityinstitute.org/PopePPT2006.pdf). My 2005 IT paper is the first
statewide examination of PM2.5 and total mortality in California and it is still the most detailed
examination of this relationship published in a peer-reviewed journal. Since his 2006 JAWMA
paper, Dr. Pope has not properly cited the evidence on PM2.5 mortality risk in California.
On August 21, 2006 CARB scientists conducted a “Public Workshop on Updating the
Methodology for Estimating Premature Death Associated with PM2.5 Exposures.” The PPT
presentation for this Workshop (http://www.arb.ca.gov/research/health/pm-mort/ws-slides.pdf)
shows Dr. Pope as a CARB advisor and “Key Steps in ARB’s Update of Methodology” and
“Tentative Timeline.” However, the 2005 Enstrom paper was not shown as one of the “New
studies emerged since 2002.” Joel M. Schwartz of the American Enterprise Institute testified at
the Workshop and then on August 29, 2006 submitted to CARB ten pages of formal comments
and three of his AEI papers, including his May 2006 paper “Air Pollution and Health: Do
Popular Portrayals Reflect the Scientific Evidence?”
(http://joelschwartz.com/pdfs/AirPoll_Health_EPO_0506.pdf). His formal comments stated
“The discussions and handouts at the August 21 workshop indicate that CARB’s approach to
evaluating the association of PM2.5 and mortality tends to omit contrary evidence and to
3
uncritically accept supportive evidence. This would cause CARB to overstate the magnitude and
certainty of the association of air pollution and premature mortality.”
(http://www.scientificintegrityinstitute.org/Schwartz082906.pdf).
During the latter part of 2006, Dr. Jerrett, serving as Principle Investigator, worked with Drs.
Pope, Krewski, and Burnett and six other co-Investigators on preparing the CARB Interagency
Proposal No. 2624-254 "Spatiotemporal Analysis of Air Pollution and Mortality in California
Based on the American Cancer Society Cohort”
(http://www.scientificintegrityinstitute.org/Jerrett012510.pdf). Dr. Pope was included as a
consultant to be paid $14,997, with the justification “Dr. Pope will supply expert guidance on the
interpretation and analysis of statistical modeling and air pollution epidemiology.”
This proposal contains the following claims that Dr. Pope knew in 2006 were dishonest:
“California currently has no statewide studies assessing mortality resulting from air pollution in
the general population.” (page 3); “California has no state-wide estimates of mortality to support
policymaking and regulatory activities. Extension of the ACS study to address scientific
uncertainties and to derive estimates specific to California will assist the Air Resources Board
and others to assess the benefits of policy interventions.” (page 4); “This study will derive the
first California wide estimates of mortality associated with PM2.5 exposure and other criteria
co-pollutants, thus supplying policymakers with a valuable resource for deriving benefit
estimates.” (page 5). Drs. Jerrett, Krewski, and Burnett also knew in 2006 that the above claims
were dishonest because they became aware of my 2005 IT paper in January 2006 when Dr.
Krewski granted me permission to reproduce Figure 21 of the 2000 Krewski Health Effects
Institute (HEI) Reanalysis Report (http://pubs.healtheffects.org/view.php?id=6) and use it in my
June 1, 2006 IT response paper (http://www.scientificintegrityinstitute.org/IT060106.pdf).
The Jerrett Proposal was reviewed by CARB Research Screening Committee on December 14,
2006 (http://www.arb.ca.gov/research/rsc/12-14-06/dec06adv.pdf) and was approved by CARB
on January 25, 2007 and it became “ARB/UCB Agreement No. 06-332,” with a three-year total
budget of $749,706 (http://www.arb.ca.gov/board/books/2007/012507/07-1-4pres.pdf). At both
of these meetings false claims were made about no prior statewide studies of PM2.5 and
mortality in California. If my paper had been cited in the Jerrett Proposal, the proposal would
have had to acknowledge that a very large and detailed statewide study of PM2.5 and mortality
in California had already been conducted and published. My study and its null findings would
have influenced the specific aims and approval of the Jerrett Proposal by the CARB Research
Screening Committee and CARB members. This scientific misconduct by Dr. Jerrett, Dr. Pope,
and the other co-investigators was reported in a March 24, 2010 letter to UC President Mark G.
Yudof by an Ad Hoc Group of California businessmen impacted by CARB diesel regulations
(http://www.calcontrk.org/CARBdocs/letters/AdHocGroupLettertoYudofReJerrettMisconduct03
2410.pdf). Dr. Pope was involved with this project until 2013, as will be explained later.
On January 25, 2007, the exact same day that the Jerrett Proposal was approved, Drs. Scott L.
Zeger, Francesca Dominici, Aidan McDermott, and Jonathan M. Samet posted their Johns
Hopkins University Department of Biostatistics Working Paper 133 “Mortality in the Medicare
Population and Chronic Exposure to Fine Particulate Air Pollution”
(http://biostats.bepress.com/jhubiostat/paper133). These four JHU professors were major air
pollution investigators at this time, all much more respected and better known than me, and they
4
cited my 2005 IT paper as being consistent with their finding “No positive association was found
between county-level PM2.5 concentration and mortality rates for the 32 urban counties in the
western U.S. [California, Oregon, and Washington] in the MCAPS [Medicare Cohort for Air
Pollution Studies] cohort. The lack of association for the West is largely because the Los
Angeles area counties have higher PM2.5 levels than other western counties, but not higher
adjusted mortality rates. . . . In our initial analyses of the MCAPS data, we confirmed the
association between PM2.5 and mortality found in other studies but find substantial and
unexplained geographic heterogeneity in the effect of PM2.5 across the United States.” The null
findings in my 2005 IT paper and the “substantial and unexplained geographic heterogeneity”
findings in Zeger 2007 were completely ignored by Dr. Pope in his February 15, 2007 and June
19, 2007 public lectures. A revised and expanded version of Zeger 2007 was published online
August 12, 2008 (http://www.ncbi.nlm.nih.gov/pmc/?term=10.1289/ehp.11449).
The content of his 2007 lectures and the 2007 Jerrett Project are highly relevant to the honesty of
Dr. Pope because during 2006-2009 he served as a “scientific advisor” to CARB on PM2.5
health effects. In particular, he provided scientific advice on a 2007 CARB draft report entitled
“Methodology for Estimating the Premature Deaths Associated with Long-term Exposures to
Fine Airborne Particulate Matter in California.” The report was distributed to six peer reviewers
with an August 27, 2007 CARB cover letter and the peer review comments were returned during
September-October 2007. This draft based the dose-response relationship between PM2.5 and
premature deaths (total mortality) in California on the national September 21, 2006 “Expanded
Expert Judgment Assessment of the Concentration-Response Relationship Between PM2.5
Exposure and Mortality” (http://www.epa.gov/ttn/ecas/regdata/Uncertainty/pm_ee_report.pdf).
Drs. Pope and Krewski were two of the twelve experts used in this major PM2.5 risk assessment,
constituting another conflict of interest for Dr. Pope in his role as a CARB scientific advisor.
The 2007 CARB draft report, including the comments of the six peer reviewers, was revised and
released as the May 22, 2008 CARB Draft Report
(http://scientificintegrityinstitute.org/CARBPMDraft052208.pdf). It was summarized at the May
22, 2008 CARB meeting in a PPT presentation “Revised Estimates of Premature Death
Associated with PM2.5 Exposures in California,” which cited Dr. Pope as a Scientific Advisor
(http://www.arb.ca.gov/board/books/2008/052208/08-5-5pres.pdf). Neither the report nor the
PPT addressed my April 24, 2008 comments to CARB about the need to focus on California-
specific evidence as the basis for estimating PM2.5-related premature deaths in California
(http://www.arb.ca.gov/lists/erplan08/2-carb_enstrom_comments_on_gmerp_042208.pdf).
A July 11, 2008 CARB teleconference was held because of my June 4, 2008 concerns stated to
the CARB Chair Mary D. Nichols at her California Senate Rules Committee confirmation
hearing in Sacramento (http://scientificintegrityinstitute.org/Nichols060408.pdf). I was very
concerned that the May 22, 2008 CARB Draft Report had not properly focused on PM2.5
mortality risk in California (http://scientificintegrityinstitute.org/AgendaSum071108.pdf).
During that teleconference I spoke directly with Drs. Pope, Jerrett, and Burnett about failure of
the CARB report to properly present and use California-specific PM2.5 mortality risk evidence
(http://scientificintegrityinstitute.org/Enstrom071108.pdf). Dr. Pope and the others evaded my
repeated requests to them to clarify the Jerrett Project California PM2.5 mortality risk findings,
as well as prior PM2.5 findings dating back to Figure 21 in the 2000 Krewski HEI Reanalysis
Report. I stated “I’m very concerned that a number of these [CARB diesel vehicle] regulations
5
are going to move forward based on, well for instance, the Pope 2002 study when more studies
are forth coming and I think that if there’s an effort made by the ARB to slow down the
regulatory process that would relieve a lot of my concerns.” In response, Dr. Pope stated “That’s
something I wouldn’t get involved with one way or the other. I’m interested in the science and I
hope that the regulation is wise and uses the science in a reasonable way.”
(http://scientificintegrityinstitute.org/CARB071108.pdf). This was a disingenuous and dishonest
statement by Dr. Pope because he has been clearly aware since at least 2006, when he began
advising CARB, that his research and reviews on PM2.5 mortality risk were being used by
CARB as public health justification for draconian diesel vehicle regulations in California.
When Pope failed to contact me, as per his comments during the teleconference, I sent him an
August 20, 2008 email request asking for the same California-specific calculations that I had
asked for during the teleconference (http://www.scientificintegrityinstitute.org/Pope082008.pdf).
Pope never responded to my email request. During this period, a total of 148 pages of highly
critical public comments were received by CARB regarding the May 22, 2008 Draft Staff Report
(http://www.arb.ca.gov/research/health/pm-mort/pm-mort_supp.pdf). On October 24, 2008
CARB issued a Final Staff Report “Methodology for Estimating Premature Deaths Associated
with Long-term Exposure to Fine Airborne Particulate Matter in California”
(http://www.scientificintegrityinstitute.org/CARBPMFinal102408.pdf). In spite of the extensive
detailed criticism that Dr. Pope must have seen, the Final Staff Report was essentially unchanged
from Draft Staff Report. Both of these reports listed Dr. Pope as a Scientific Advisor and they
reflect his failure to address serious criticism and null California-specific PM2.5 risk evidence.
I challenged the scientific integrity of the Final Staff Report with detailed December 10, 2008
CARB public comments regarding the proposed CARB Statewide Truck and Bus Regulation. I
described six different sources showing geographic variation in PM2.5 mortality risk nationally
and little or no PM2.5 mortality risk in California (http://www.arb.ca.gov/lists/truckbus08/897-
carb_enstrom_comments_on_statewide_truck_regulations_121008.pdf). In spite of the massive
criticism of scientific, legal, and economic aspects of the CARB Truck and Bus Regulation
received from hundreds of commenters, this multi-billion dollar diesel vehicle regulation was
approved by CARB on December 12, 2008 (http://www.arb.ca.gov/newsrel/nr121208.htm).
Although we had engaged in direct discussion and correspondence about this issue in 2008, Dr.
Pope did not address the issue of geographic variation in PM2.5 mortality risk in his January 22,
2009 NEJM paper “Fine Particulate Air Pollution and Life Expectancy in the United States”
(http://www.nejm.org/doi/full/10.1056/NEJMsa0805646). This paper made no mention of the
above evidence of geographic variation in PM2.5 mortality risk dating back to 2000. I submitted
a February 11, 2009 NEJM letter with specific results showing no relationship in California
based on data from me and the paper. Although my letter was rejected by the NEJM on March
16, 2009, it was forwarded to Dr. Pope for comment (http://www.arb.ca.gov/lists/gmove09/1-
carb_enstrom_comments_re_pm2.5_and_life_expectancy_052709.pdf).
Dr. Pope has never acknowledged or addressed my null California results and my concerns about
his conclusions regarding the relationship between PM2.5 and life expectancy. For instance, he
failed to address any such criticism in his May 3, 2009 HEI PPT presentation on this relationship
(http://www.healtheffects.org/Slides/AnnConf2009/Pope.pdf). Additional criticism of Pope
6
2009 is contained in the September 2012 paper of Goran Krstić, Ph.D., whose 2009 letter was
also rejected by the NEJM. Reanalyzing Dr. Pope’s publicly available data, Dr. Krstić found
“The observed loss of statistical significance in the correlation between the reduction of ambient
air PM2.5 concentrations and life expectancy in metropolitan areas of the United States, after
removing one of the metropolitan areas [Topeka, KS] from the regression analysis, may raise
concern for the policymakers in decisions regarding further reductions in permitted levels of air
pollution emissions.” (http://www.ncbi.nlm.nih.gov/pubmed/23019812). This same Pope 2009
data was reanalyzed in the August 2013 paper of Dr. S. Stanley Young, who concluded “Given
the lack of effect in the West and the greater importance of other predictors, we agree with Krstić
that this data set does not support the claim that decreasing PM2.5 will increase longevity.”
(http://onlinelibrary.wiley.com/doi/10.1002/sam.11202/abstract).
During 2002-2009 Dr. Pope worked with Dr. Krewski on an HEI project that resulted in the June
3, 2009 HEI Research Report 140 “Extended Follow-Up and Spatial Analysis of the American
Cancer Society Study Linking Particulate Air Pollution and Mortality,” which lists Dr. Pope as
eighth author (http://pubs.healtheffects.org/view.php?id=315). HEI Heath Review Committee
Commentary states “Dr. Krewski’s 4-year study, ‘Extended Follow-Up and Spatial Analysis of
the American Cancer Society Study Linking Particulate Air Pollution and Mortality,’ began in
May 2002. Total expenditures were $425,000. The draft Investigators’ Report from Krewski and
colleagues was received for review in January 2007. A revised report, received in January 2008,
was accepted for publication in June 2008.” The final report results were summarized in a May
21, 2008 Krewski PPT (http://www.scientificintegrityinstitute.org/Krewski052108.pdf). This
“spatial analysis” did not analyze or discuss the geographic variation in PM2.5 mortality risk that
was found in Figures 5 and 21 of the 2000 Krewski HEI Reanalysis Report and it did not cite
papers showing geographic variation like Enstrom 2005, Enstrom 2006, Zeger 2007, and Zeger
2008. As explained previously, the primary authors, including Drs. Pope, Krewski, Jerrett, and
Burnett, were all well aware of evidence of national geographic variation dating back to the 2000
HEI Reanalysis Report. Yet they failed to address this issue in the 2009 HEI Research Report.
On November 16, 2009 CARB Member John B. Telles, M.D., raised serious concerns about the
integrity of the October 24, 2008 CARB Final Staff Report because of the dishonesty of its lead
author, Hien T. Tran (http://www.scientificintegrityinstitute.org/Telles111609.pdf). The
dishonesty of Tran is described on a website that describes scientific and ethical misconduct by
CARB (http://killcarb.org/tranpage.html). As a result of Dr. Telles’ concerns, a February 26,
2010 CARB Symposium “Estimating Premature Deaths from Long-term Exposure to PM2.5”
and organized and conducted in Sacramento. Dr. Pope and I participated, along with Drs.
Krewski, Jerrett, Moolgavkar, and numerous other PM2.5 mortality risk experts
(http://www.arb.ca.gov/research/health/pm-mort/pm-mort-ws_02-26-10.htm). Several dozen
California businessmen adversely impacted by the CARB diesel vehicle regulations approved on
December 12, 2008 were in the audience of this Symposium. Along with Dr. Telles, they were
very concerned about the integrity of the October 24, 2008 CARB Final Staff Report.
At the Symposium Dr. Pope made a 52-slide PPT presentation “Overview of PM2.5-Related
Mortality Studies” (http://www.arb.ca.gov/research/health/pm-mort/pope.pdf). On slide 50 he
posed the question “Then which health studies are relevant to California?” and followed this with
an accurate statement “Some of the highest quality research on the health effects of air pollution
7
has been conducted in California” and a false statement “The results are similar to studies from
elsewhere.” His slides 48 and 49 did not accurately reflect all of the existing null California-
specific results. Particularly disturbing is the fact that Dr. Pope did not present any California-
specific results that should have been in the June 3, 2009 Krewski HEI Research Report. Even
more disturbing is the fact that he did not present any results from the ongoing Jerrett Project
described earlier. When the Jerrett Project was approved on January 25, 2007, the agreement
with CARB called for the California-wide results to be available in eighteen months (July 2008).
Although not shown by Dr. Pope, Dr. Jerrett did show in slide 12 of his Symposium presentation
that the Jerrett Project found no relationship between PM2.5 and total mortality in California
(RR = 1.00) (http://www.scientificintegrityinstitute.org/JerrettTrans022610.pdf). This null result
is in exact agreement with the Enstrom 2005 result (RR =1.00). An Ad Hoc Group of California
businessmen who attended February 26, 2010 CARB Symposium were interested in seeing all
the California evidence, particularly the California-specific results from the 2009 HEI Research
Report. They submitted a request to HEI for these results and their request yielded an August
31, 2010 HEI letter containing California-specific results calculated by Dr. Krewski as a subset
of the national results in the 2009 HEI Research Report. Dr. Krewski found no PM2.5 mortality
risk in California: RR = 0.87 (0.81-0.94) during 1982-1989 and RR = 0.96 (0.92-1.00) during
1982-2000 (http://www.arb.ca.gov/research/health/pm-mort/HEI_Correspondence.pdf).
The low PM2.5 mortality risk in California during 1982-1989 found by Dr. Krewski is consistent
with my September 30, 2010 analysis of Figures 5 and 21 in the 2000 HEI Report
(http://www.scientificintegrityinstitute.org/HEIFigure5093010.pdf). Based on my own analysis,
Figure 5 showed PM2.5 mortality risk for 49 US cities (metropolitan areas) and Fresno,
California ranked second lowest and Los Angeles, California ranked fifth lowest. Figures 5 and
21 were not mentioned in Dr. Pope’s Symposium PPT or in the 2009 HEI Report. It certainly
should have been included in 2009 HEI Report if Dr. Pope had been honest in addressing Figures
5 and 21, my 2006 and 2008 submissions to CARB, and my 2008 requests to him. The null
California results from the Jerrett Project could have been released in early 2008 and then
incorporated into the CARB Draft Report and the CARB Final Report. Modified CARB reports
that found few or no premature deaths in California due to PM2.5 would probably have changed
the December 12, 2008 CARB vote on the Truck and Bus Regulation.
Because of my extensive concerns about the scientific integrity of PM2.5 epidemiology, as
described above, I organized a symposium, "Ethical Aspects of Small Epidemiologic Risks," for
the Third North American Congress of Epidemiology (CoE) in Montreal, Canada during June
21-24, 2011 (http://www.epiresearch.org/archive/fall10news.pdf). This symposium was
sponsored by the American College of Epidemiology and at that time I was Chair of the ACE
Ethics Committee (http://acepidemiology.org/content/ethics). I invited 18 experts in PM2.5
epidemiology who held views different than my own to debate me at this ethics symposium. All
18 of the experts declined my invitation, including six co-Investigators of the Jerrett Project:
Drs. Jerrett, Pope, Krewski, Burnett, Thun, and Thurston
(http://www.scientificintegrityinstitute.org/COEEthics022311.pdf). Because diverse points of
view on PM2.5 epidemiology could not be presented at the Symposium, it was cancelled. This
disappointing experience illustrates the difficulty of resolving ethical issues in PM2.5
epidemiology, like lack of access to underlying data and deliberate misrepresentation of results.
8
The June 9, 2011 Draft Jerrett Report, with Dr. Pope as the third author, presented null results
from eight of the nine statistical models that they tested, adding to the single null finding
presented by Dr. Jerrett on February 26, 2010. However, the Summary and Abstract of this
report were heavily criticized by me and several others for stating conclusions that did not reflect
the null findings in the report itself. This report was not approved and was deferred by the
CARB Research Screening Committee. In spite of the criticism, the October 28, 2011 Final
Jerrett Report was essentially unchanged from the June 9, 2011 Draft Jerrett Report. This lead to
further criticism that the final report continued to misrepresent and/or ignore its overwhelmingly
null findings (http://www.scientificintegrityinstitute.org/JerrettCriticism102811.pdf).
Continuing misrepresentation of PM2.5 mortality risk in California is clearly evident in Dr.
Pope’s July 28, 2011 EPA Webinar PPT "Health Effects of Particulate Matter Air Pollution"
(http://www.epa.gov/burnwise/pdfs/PMHealthEffects-Pope.pdf). He makes no mention of
PM2.5 mortality risk in California found in Figure 5 and 21 from Krewski 2000, the February 26,
2010 CARB Symposium, the June 9, 2011 Jerrett Report, or the June 1, 2011 Erratum to Ostro
2009 paper, or the June 23, 2011 Lipsett 2011 paper, all of which were available before his EPA
webinar (http://www.scientificintegrityinstitute.org/Enstrom081512.pdf).
The most recent summary of all California evidence is given in my August 1, 2012 American
Statistical Association Joint Statistical Meeting 2012 PPT presentation "Are Fine Particulates
Killing Californians?" (http://www.scientificintegrityinstitute.org/ASA080112.pdf) and in my
subsequent ASA JSM 2012 Proceedings paper "Particulate Matter is Not Killing Californians"
(http://www.scientificintegrityinstitute.org/ASAS092812.pdf). There is now overwhelming
epidemiologic evidence from ten different analyses of five separate cohorts showing no
relationship between PM2.5 and premature death (total mortality) in California. In spite of my
many attempts since 2008, this overwhelming evidence has not yet been recognized by Dr. Pope.
The serious misuse of PM2.5 epidemiologic findings by EPA and CARB is reflected in the US
House Science Committee criticism of EPA science and regulations dating back to a November
15, 2011 letter to the White House from Congressmen Andy Harris, M.D., and Paul Broun, M.D.
(http://science.house.gov/press-release/harris-and-broun-question-administration%E2%80%99s-
environmental-cost-benefit-analyses). This letter and numerous additional letters up to a July 22,
2013 letter have requested the Harvard Six Cities Study (H6CS) and ACS CPS II data used by
EPA (http://science.house.gov/press-release/committee-threatens-subpoena-epa-secret-science).
The basic issues are summarized in a July 30, 2013 Wall Street Journal commentary “The EPA’s
Game of Secret Science” by US House Science Committee Chairman Lamar Smith
(http://online.wsj.com/news/articles/SB10001424127887323829104578624562008231682).
Because EPA did not comply with their prior requests, the US House Science Committee issued
an August 1, 2013 subpoena on EPA to produce the “secret science” data from H6CS and ACS
CPS II (http://science.house.gov/press-release/smith-subpoenas-epa-s-secret-science). Dr. Pope
is co-author on four of the seven papers specifically cited in the subpoena. He is first author on
“Pope et al. 2002. Lung Cancer, Cardiopulmonary Mortality, and Long-term Exposure to Fine
Particulate Air Pollution.” Journal of the American Medical Association 287: 1132-1141” and
9
“Pope et al. 2009. “Fine Particulate Air Pollution and Life Expectancy in the United States.”
New England Journal of Medicine 360: 376-386.” He is third author on “Jerrett et al. 2009
“Long-term ozone exposure and mortality”, New England Journal of Medicine 360; 1085-1095”
and eighth author on “Krewski et al. 2009. “Extended Follow-up and Spatial Analysis of the
American Cancer Society Study Linking Particulate Air Pollution and Mortality, HEI Research
Report 140, Health Effects Institute. Boston, MA.” A fifth study is “Krewski et al. 2000.
‘Reanalysis of the Harvard Six Cities Study and the American Cancer Society Study of
Particulate Air Pollution and Mortaltiy.’ Special Report to Health Effects Institute. Cambridge
MA. July.” This 2000 HEI Reanalysis Report was conducted in order to check the accuracy of
the highly controversial Pope 1995 paper, as described in the 1997 Science and Reason articles.
Instead of encouraging the other H6SC and ACS CPS II investigators to comply with the
subpoena, Dr. Pope has made several patently false statements to the press that try to justify the
investigators’ refusal to comply. However, of the 23 primary authors of the seven subpoenaed
papers, only Dr. Pope has publicly challenged the appropriateness of the subpoena. The
following are three of his most blatantly false public statements:
1) The August 2, 2013 Science Insider statement: “Economist C. Arden Pope of Brigham
Young University in Provo, Utah, one of the authors on the Six Cities Study, says that turning
over what Smith requests would undoubtedly violate the confidentiality agreement made with
participants. ‘It’s extremely hard to give a data set that will allow you to replicate the results in
these studies that doesn’t include information that then allows you—with an Internet search of
obituaries—to quickly figure out who the people were,’ he says.”
(http://news.sciencemag.org/environment/2013/08/house-panel-subpoenas-epa-air-pollution-
data)
2) The August 9, 2013 Science statement: “Thursday, Smith asserted the data would be shared
with ‘various reputable entities and organizations’ and would be ‘deidentified’ so that no names
would be made public. But because the six cities were small, it would be easy to quickly figure
out who the participants were, according to Pope.”
(http://www.sciencemag.org/content/341/6146/604.full.pdf)
3) The September 7, 2013 Boston Globe statement: “C. Arden Pope III, an economics professor
at Brigham Young University who also was lead author on the American Cancer Society study,
said there was no attempt to hide information from Congress or the public. ‘Characterizing the
ACS and Harvard Six-Cities studies as “secret science” is a misrepresentation of the truth,’ Pope
said in remarks he e-mailed to the Globe. ‘We have continued to be actively involved in open,
collaborative, extended analysis efforts,’ he added, ‘using the data and information in such a way
that contributes to scientific understanding and that does not violate commitments to the privacy
and confidentiality of research participants.’”
(http://www.bostonglobe.com/news/nation/2013/09/06/landmark-harvard-study-health-effects-
air-pollution-target-house-gop-subpoena/2K0jhfbJsZcfXqcQHc4jzL/story.html).
The illustrate the dishonesty of Dr. Pope’s claim “it would be easy to quickly figure out who the
participants were,” the first deceased H6CS subject is shown as Record 1259 of the H6CS Excel
data file given to EPA in response the subpoena “Lepeule2012_data_0713 final.xlsx”:
10
“STU 409 0.74538 20.9 20.9 1 1 0 0 1”
Dr. Pope cannot possibly identify this H6CS subject using the information provided above.
Furthermore, Dr. Pope has not engaged in meaningful collaboration with scientists other than
several of the authors of the subpoenaed papers. Their refusal to comply with the subpoena is
direct evidence that Dr. Pope and his colleagues have not engaged in “open, collaborative,
extended analysis efforts.” The characterization of Dr. Pope’s research as “secret science” is not
“a misrepresentation of the truth.”
The final and most glaring example of Dr. Pope’s dishonesty is the September 1, 2013 AJRCCM
paper “Spatial Analysis of Air Pollution and Mortality in California” that he co-authored with
Drs. Jerrett, Krewski, Burnett, and Thun and eight other Jerrett Project investigators
(http://www.atsjournals.org/doi/abs/10.1164/rccm.201303-0609OC). This paper was published
exactly one month after the subpoena was issued for the CPS II data used in the paper. The
paper is highly misleading and completely ignores the overwhelming null evidence in the
October 28, 2011 Jerrett Final Report (http://www.arb.ca.gov/research/apr/past/06-332.pdf). The
positive relationship that it does report is a based on a “conurbation” land use regression model
that normalizes out the low death rates in the urban areas of California. This ad hoc model was
not even mentioned in the original proposal. Furthermore, the paper does not cite the
overwhelming null California PM2.5 mortality evidence that is summarized in my September 28,
2012 ASA JSM 2012 paper (http://www.scientificintegrityinstitute.org/ASAS092812.pdf). The
serious flaws in the AJRCCM paper are discussed in detail by Dr. William Briggs in his blogs of
August 6, 2013 (http://wmbriggs.com/blog/?p=8720) and September 11, 2013
(http://wmbriggs.com/blog/?p=8990). The AJRCCM paper and the defiance of its authors
reinforces the importance of the subpoena of EPA “secret science” data and the urgent need for
independent reanalysis of the ACS CPS II data that underlies this paper and the subpoenaed
papers, as explained by Dr. Briggs on September 25, 2013 (http://wmbriggs.com/blog/?p=9241).
In conclusion, Dr. Pope, in collaboration with Drs. Krewski, Jerrett, Burnett, and Thun, has
engaged in serious scientific misconduct (falsification) in his PM2.5 epidemiology research and
reviews, particularly as it relates to geographic variation in PM2.5 mortality risk and lack of risk
in California. The dishonest claim of Dr. Pope and his collaborators that there is a current
substantial PM2.5 mortality rink in California has been used by EPA and CARB to justify
draconian regulations designed to reduce alleged premature deaths in California due to PM2.5
when there is overwhelming epidemiologic evidence that these deaths do not actually exist.