Embed Size (px)
Citation preview
From frontier to developed – the FTSE ASEAN Index Series
ftserussell.com
Research
May 2015
FTSE Russell | From frontier to developed – the FTSE ASEAN Index Series 1
The FTSE ASEAN Index Series provides a comprehensive range of benchmarks to measure the performance of stocks within an increasingly integrated and fast-growing economic region.
ASEANThe Association of Southeast Asian Nations (ASEAN) was set up in 1967 and initially included five member states: Indonesia, Malaysia, Philippines, Singapore and Thailand. With the addition of Brunei Darussalam (1984), Vietnam (1995), Lao PDR and Myanmar (1997), and Cambodia (1999), ASEAN’s membership has since expanded to ten.
ASEAN’s founding aims include the joint pursuit of economic growth, social progress and cultural development1. In 2007 ASEAN’s member states committed themselves to a process of economic integration through the introduction of a single market, called the ASEAN Economic Community (AEC). The AEC has the goal of regional economic integration by 2015, including the free flow of goods, services, labour and capital between ASEAN member states.
Collectively, ASEAN countries command significant economic weight. According to a recent study2 by consulting firm McKinsey, ASEAN’s member states had a combined GDP of $2.4 trillion in 2013. If ASEAN were a single country this would place it seventh in a ranking of world economies by GDP, just behind the UK.
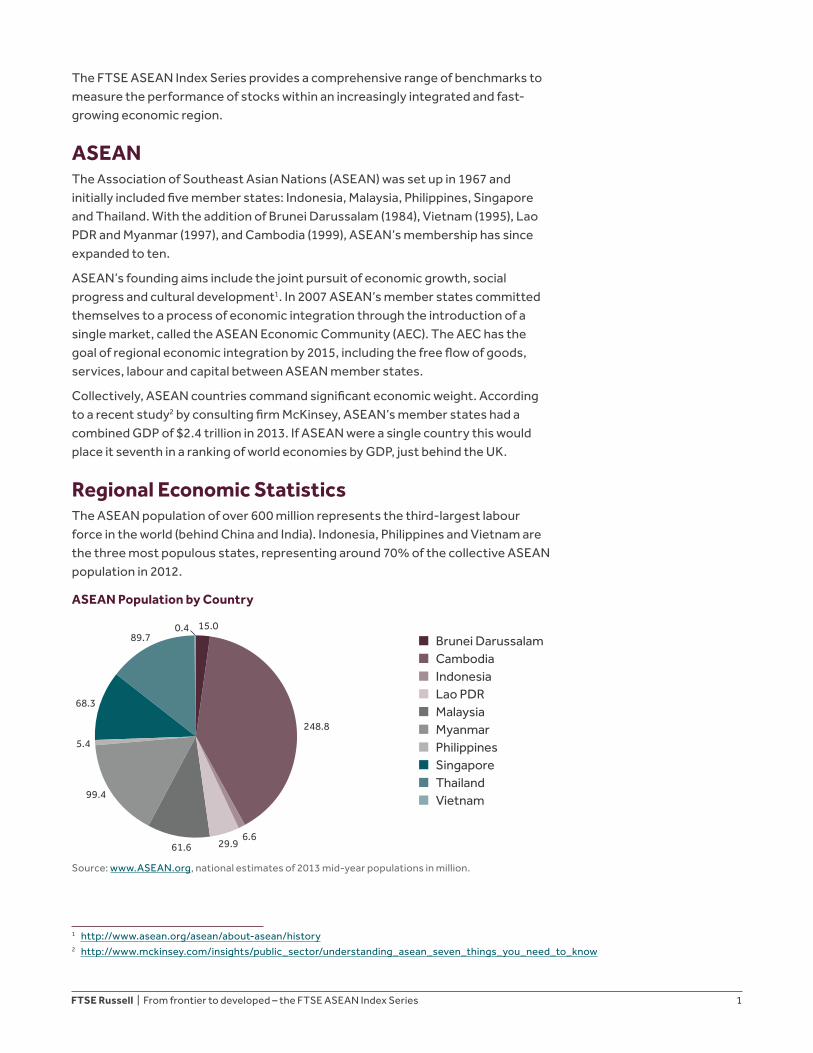
Regional Economic StatisticsThe ASEAN population of over 600 million represents the third-largest labour force in the world (behind China and India). Indonesia, Philippines and Vietnam are the three most populous states, representing around 70% of the collective ASEAN population in 2012.
ASEAN Population by Country
Brunei Darussalam Cambodia Indonesia Lao PDR Malaysia Myanmar Philippines Singapore Thailand Vietnam
15.00.4
6.6
5.4
29.961.6
99.4
68.3
89.7
248.8
Source: www.ASEAN.org, national estimates of 2013 mid-year populations in million.
1 http://www.asean.org/asean/about-asean/history2 http://www.mckinsey.com/insights/public_sector/understanding_asean_seven_things_you_need_to_know
FTSE Russell | From frontier to developed – the FTSE ASEAN Index Series 2
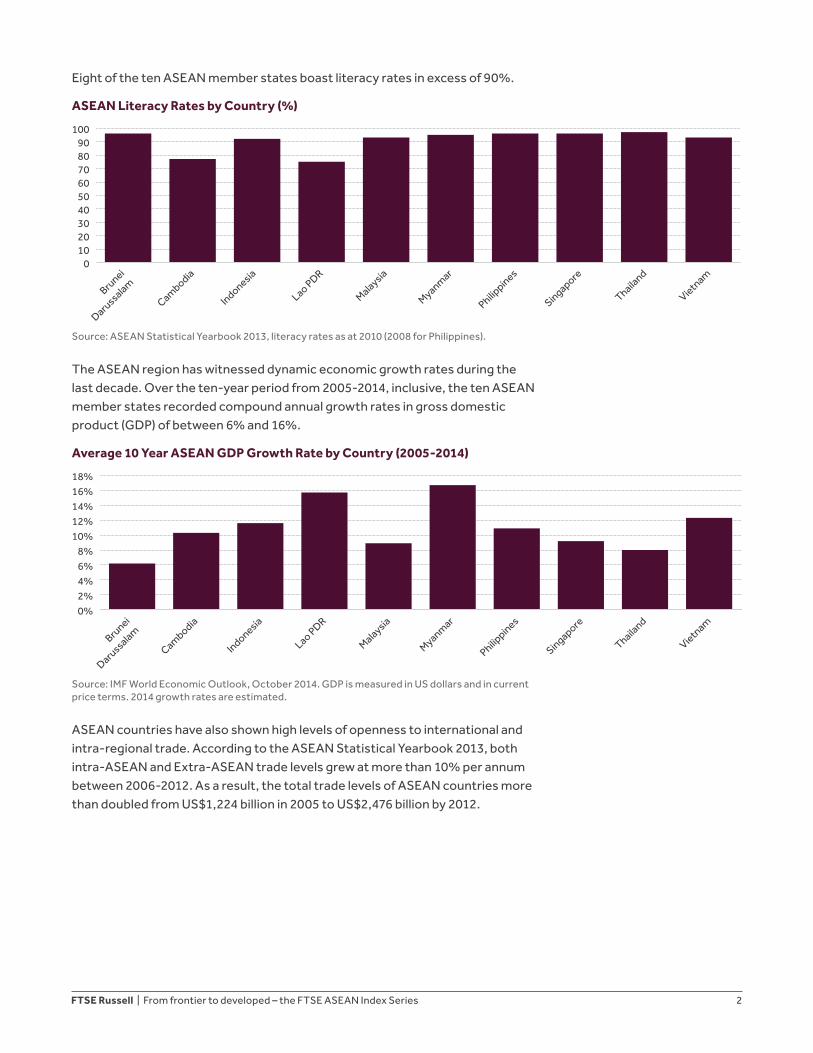
Eight of the ten ASEAN member states boast literacy rates in excess of 90%.
ASEAN Literacy Rates by Country (%)
0102030405060708090
100
Brunei
Darussalam
Cambodia
Indonesia
Lao PDR
Malaysia
Myanmar
Philippines
Singapore
Thailand
Vietnam
Source: ASEAN Statistical Yearbook 2013, literacy rates as at 2010 (2008 for Philippines).
The ASEAN region has witnessed dynamic economic growth rates during the last decade. Over the ten-year period from 2005-2014, inclusive, the ten ASEAN member states recorded compound annual growth rates in gross domestic product (GDP) of between 6% and 16%.
Average 10 Year ASEAN GDP Growth Rate by Country (2005-2014)
0%2%4%6%8%
10%12%14%16%18%
Brunei
Darussalam
Cambodia
Indonesia
Lao PDR
Malaysia
Myanmar
Philippines
Singapore
Thailand
Vietnam
Source: IMF World Economic Outlook, October 2014. GDP is measured in US dollars and in current price terms. 2014 growth rates are estimated.
ASEAN countries have also shown high levels of openness to international and intra-regional trade. According to the ASEAN Statistical Yearbook 2013, both intra-ASEAN and Extra-ASEAN trade levels grew at more than 10% per annum between 2006-2012. As a result, the total trade levels of ASEAN countries more than doubled from US$1,224 billion in 2005 to US$2,476 billion by 2012.
FTSE Russell | From frontier to developed – the FTSE ASEAN Index Series 3
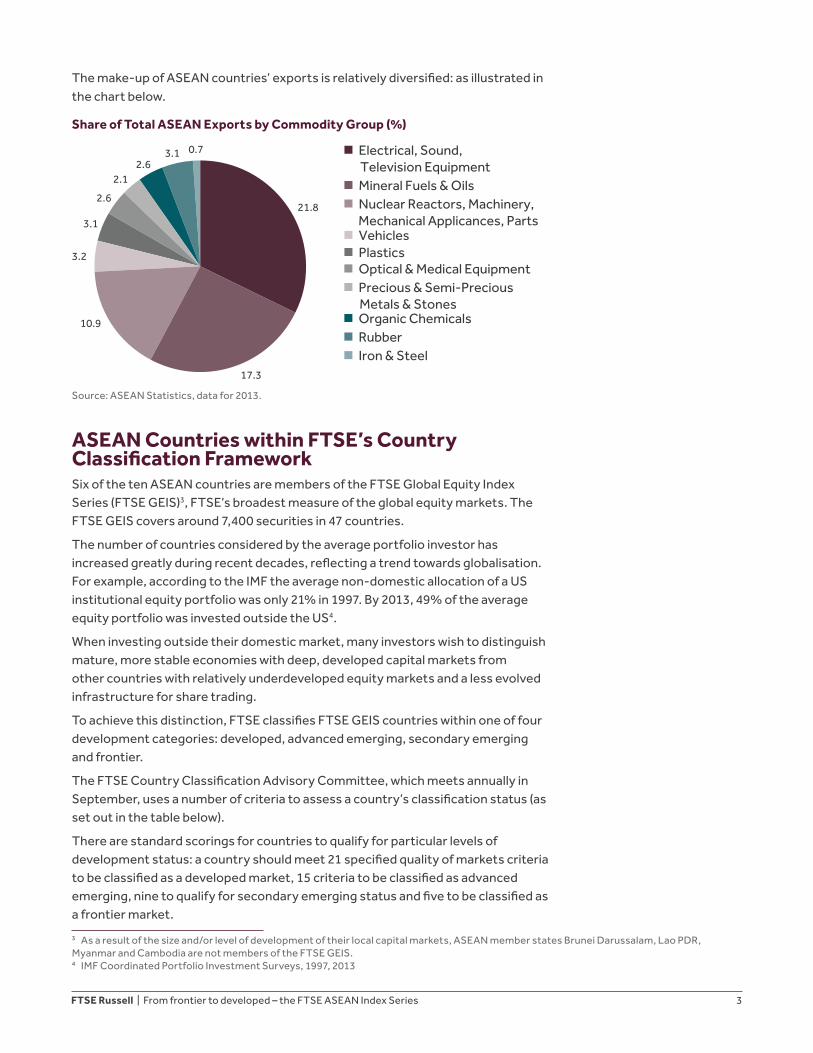
The make-up of ASEAN countries’ exports is relatively diversified: as illustrated in the chart below.
Share of Total ASEAN Exports by Commodity Group (%)
21.8
17.3
10.9
3.2
3.1
2.6
2.12.6
0.73.1 n Electrical, Sound, Television Equipmentn Mineral Fuels & Oilsn Nuclear Reactors, Machinery, Mechanical Applicances, Partsn Vehiclesn Plasticsn Optical & Medical Equipmentn Precious & Semi-Precious Metals & Stonesn Organic Chemicalsn Rubbern Iron & Steel
Source: ASEAN Statistics, data for 2013.
ASEAN Countries within FTSE’s Country Classification FrameworkSix of the ten ASEAN countries are members of the FTSE Global Equity Index Series (FTSE GEIS)3, FTSE’s broadest measure of the global equity markets. The FTSE GEIS covers around 7,400 securities in 47 countries.
The number of countries considered by the average portfolio investor has increased greatly during recent decades, reflecting a trend towards globalisation. For example, according to the IMF the average non-domestic allocation of a US institutional equity portfolio was only 21% in 1997. By 2013, 49% of the average equity portfolio was invested outside the US4.
When investing outside their domestic market, many investors wish to distinguish mature, more stable economies with deep, developed capital markets from other countries with relatively underdeveloped equity markets and a less evolved infrastructure for share trading.
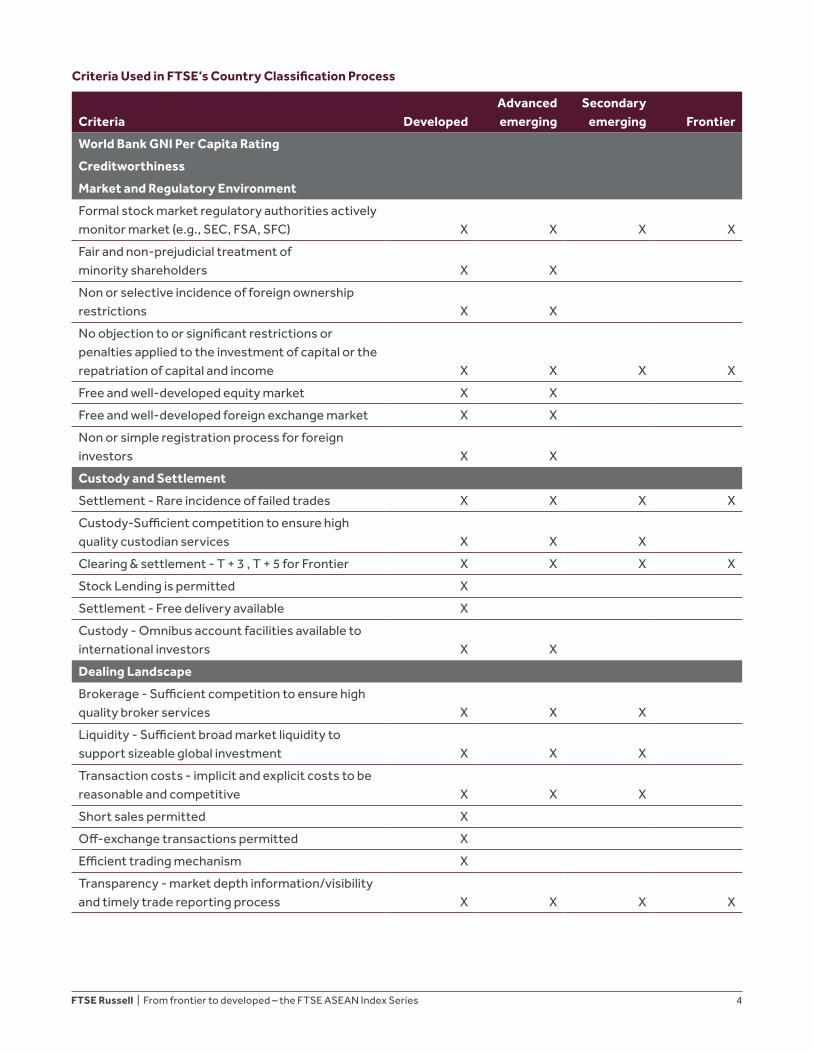
To achieve this distinction, FTSE classifies FTSE GEIS countries within one of four development categories: developed, advanced emerging, secondary emerging and frontier.
The FTSE Country Classification Advisory Committee, which meets annually in September, uses a number of criteria to assess a country’s classification status (as set out in the table below).
There are standard scorings for countries to qualify for particular levels of development status: a country should meet 21 specified quality of markets criteria to be classified as a developed market, 15 criteria to be classified as advanced emerging, nine to qualify for secondary emerging status and five to be classified as a frontier market.
3 As a result of the size and/or level of development of their local capital markets, ASEAN member states Brunei Darussalam, Lao PDR, Myanmar and Cambodia are not members of the FTSE GEIS. 4 IMF Coordinated Portfolio Investment Surveys, 1997, 2013
FTSE Russell | From frontier to developed – the FTSE ASEAN Index Series 4
Criteria Used in FTSE’s Country Classification Process
Criteria DevelopedAdvanced emerging
Secondary emerging Frontier
World Bank GNI Per Capita Rating
Creditworthiness
Market and Regulatory Environment
Formal stock market regulatory authorities actively monitor market (e.g., SEC, FSA, SFC) X X X X
Fair and non-prejudicial treatment of minority shareholders X X
Non or selective incidence of foreign ownership restrictions X X
No objection to or significant restrictions or penalties applied to the investment of capital or the repatriation of capital and income X X X X
Free and well-developed equity market X X
Free and well-developed foreign exchange market X X
Non or simple registration process for foreign investors X X
Custody and Settlement
Settlement - Rare incidence of failed trades X X X X
Custody-Sufficient competition to ensure high quality custodian services X X X
Clearing & settlement - T + 3 , T + 5 for Frontier X X X X
Stock Lending is permitted X
Settlement - Free delivery available X
Custody - Omnibus account facilities available to international investors X X
Dealing Landscape
Brokerage - Sufficient competition to ensure high quality broker services X X X
Liquidity - Sufficient broad market liquidity to support sizeable global investment X X X
Transaction costs - implicit and explicit costs to be reasonable and competitive X X X
Short sales permitted X
Off-exchange transactions permitted X
Efficient trading mechanism X
Transparency - market depth information/visibility and timely trade reporting process X X X X
FTSE Russell | From frontier to developed – the FTSE ASEAN Index Series 5
Criteria DevelopedAdvanced emerging
Secondary emerging Frontier
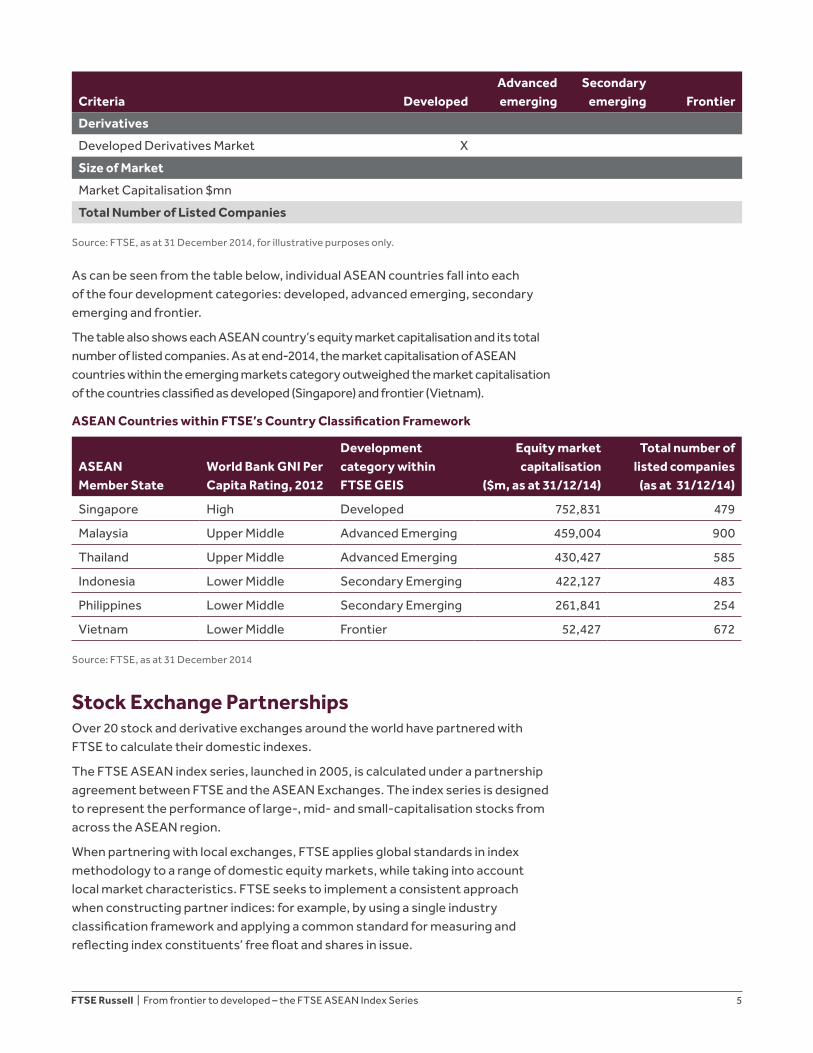
Derivatives
Developed Derivatives Market X
Size of Market
Market Capitalisation $mn
Total Number of Listed Companies
Source: FTSE, as at 31 December 2014, for illustrative purposes only.
As can be seen from the table below, individual ASEAN countries fall into each of the four development categories: developed, advanced emerging, secondary emerging and frontier.
The table also shows each ASEAN country’s equity market capitalisation and its total number of listed companies. As at end-2014, the market capitalisation of ASEAN countries within the emerging markets category outweighed the market capitalisation of the countries classified as developed (Singapore) and frontier (Vietnam).
ASEAN Countries within FTSE’s Country Classification Framework
ASEAN Member State
World Bank GNI Per Capita Rating, 2012
Development category within FTSE GEIS
Equity market capitalisation
($m, as at 31/12/14)
Total number of listed companies
(as at 31/12/14)
Singapore High Developed 752,831 479
Malaysia Upper Middle Advanced Emerging 459,004 900
Thailand Upper Middle Advanced Emerging 430,427 585
Indonesia Lower Middle Secondary Emerging 422,127 483
Philippines Lower Middle Secondary Emerging 261,841 254
Vietnam Lower Middle Frontier 52,427 672
Source: FTSE, as at 31 December 2014
Stock Exchange PartnershipsOver 20 stock and derivative exchanges around the world have partnered with FTSE to calculate their domestic indexes.
The FTSE ASEAN index series, launched in 2005, is calculated under a partnership agreement between FTSE and the ASEAN Exchanges. The index series is designed to represent the performance of large-, mid- and small-capitalisation stocks from across the ASEAN region.
When partnering with local exchanges, FTSE applies global standards in index methodology to a range of domestic equity markets, while taking into account local market characteristics. FTSE seeks to implement a consistent approach when constructing partner indices: for example, by using a single industry classification framework and applying a common standard for measuring and reflecting index constituents’ free float and shares in issue.
FTSE Russell | From frontier to developed – the FTSE ASEAN Index Series 6
FTSE’s approach involves regular discussions with its clients and external advisory committees to ensure that indices meet the requirements of end-users. Publicly available rules provide full transparency of index methodologies.
ASEAN Capital Market IntegrationIn recent years governments, stock exchanges and regulatory authorities in ASEAN member states have made concerted efforts to increase the level of integration of local capital markets.
In 2011 seven stock exchanges from the ASEAN region–the Bursa Malaysia, the Hanoi Stock Exchange, the Ho Chi Minh Stock Exchange, the Indonesia Stock Exchange, the Philippine Stock Exchange, the Singapore Exchange and the Stock Exchange of Thailand–joined an initiative called the ASEAN Exchanges.
According to its member exchanges, this initiative aims to promote the growth of ASEAN capital markets by driving cross-border trading flows, streamlining market access and creating financial products with a focus on the region.
Additionally, as at mid-2014 three of the ASEAN exchanges (Malaysia, Singapore and Thailand) are connected via the so-called ASEAN Trading Link. The link provides a common access point for participating ASEAN exchanges in the network via a single hub, enabling investors within the region to route orders from their domestic stock exchange to other ASEAN exchanges for execution.
The ASEAN exchanges have also announced plans to streamline the post-trade procedures for cross-border transactions conducted via the ASEAN Trading Link.
The FTSE ASEAN Index SeriesThe FTSE ASEAN index series consists of the following equity indexes and index categories.
The FTSE ASEAN All-Share index represents the performance of large-, mid- and small-capitalisation ASEAN companies. The index consists of the constituents of the FTSE ASEAN Indonesia All-Share index, the FTSE ASEAN Philippines All-Share index, the FTSE ASEAN Vietnam All-Share index, the FTSE Bursa Malaysia EMAS index, the FTSE SET All-Share index and the FTSE ST All-Share index.
The FTSE ASEAN All-Share ex Developed index represents the performance of all the companies in the FTSE ASEAN All-Share index, with the exception of those listed in developed markets (i.e., companies listed on the Singapore Exchange are excluded).
The FTSE/ASEAN 40 index is designed to represent the performance of the largest companies from across the ASEAN exchanges.
The FTSE ASEAN Sector indexes subdivide the FTSE ASEAN All-Share index into industry, supersector and sector indices, following the Industry Classification Benchmark (ICB).
The FTSE ASEAN Stars index comprises 30 companies from each of the ASEAN exchanges of Indonesia, Malaysia, Philippines, Singapore and Thailand, and 15 companies each from the two Vietnam member exchanges (Ho Chi Minh and Hanoi). This index is intended to serve as a market barometer and not as the underlying benchmark for financial products.
FTSE Russell | From frontier to developed – the FTSE ASEAN Index Series 7
Investability and Liquidity ScreensIn common with other indexes from the FTSE range, the FTSE ASEAN index series is adjusted for free float and screened for liquidity. This facilitates replication by index-tracking financial products.
Companies with a free float of 15 percent or lower are not eligible for inclusion in the index series. In Vietnam the minimum free float is 5 percent to allow some of Vietnam’s largest companies to be included.
The categories of shares subject to free float restrictions are set out in detail in the index ground rules5.
The constituents of the index series are also subject to a screening for liquidity, based upon the monthly median of each security’s daily trading volume. In order for a security to be eligible for inclusion in the FTSE ASEAN indexes, its median trading volume must exceed a minimum threshold, also detailed in the index rules. Reflecting the differences in trading volumes across the different ASEAN markets, the minimum turnover threshold is set at different levels for different ASEAN exchanges.
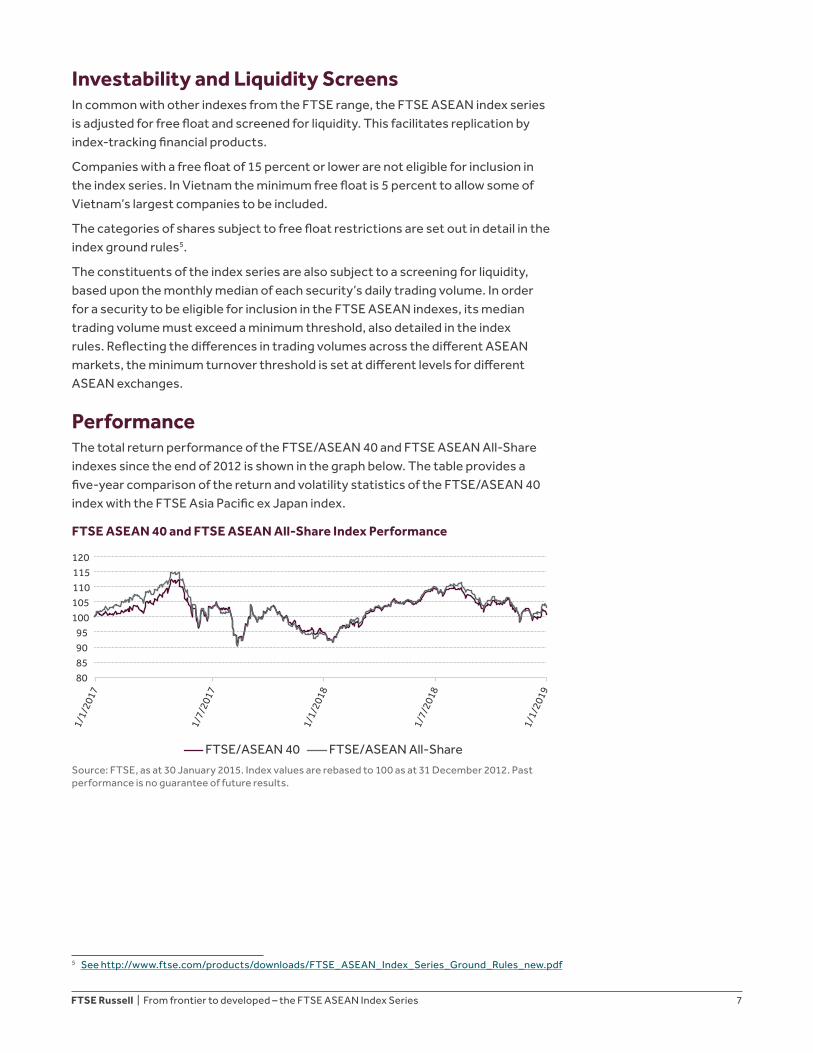
PerformanceThe total return performance of the FTSE/ASEAN 40 and FTSE ASEAN All-Share indexes since the end of 2012 is shown in the graph below. The table provides a five-year comparison of the return and volatility statistics of the FTSE/ASEAN 40 index with the FTSE Asia Pacific ex Japan index.
FTSE ASEAN 40 and FTSE ASEAN All-Share Index Performance
FTSE/ASEAN 40 FTSE/ASEAN All-Share
80859095
100105110115120
1/1/
2017
1/7/
2017
1/1/
2018
1/7/
2018
1/1/
2019
Source: FTSE, as at 30 January 2015. Index values are rebased to 100 as at 31 December 2012. Past performance is no guarantee of future results.
5 See http://www.ftse.com/products/downloads/FTSE_ASEAN_Index_Series_Ground_Rules_new.pdf
FTSE Russell | From frontier to developed – the FTSE ASEAN Index Series 8
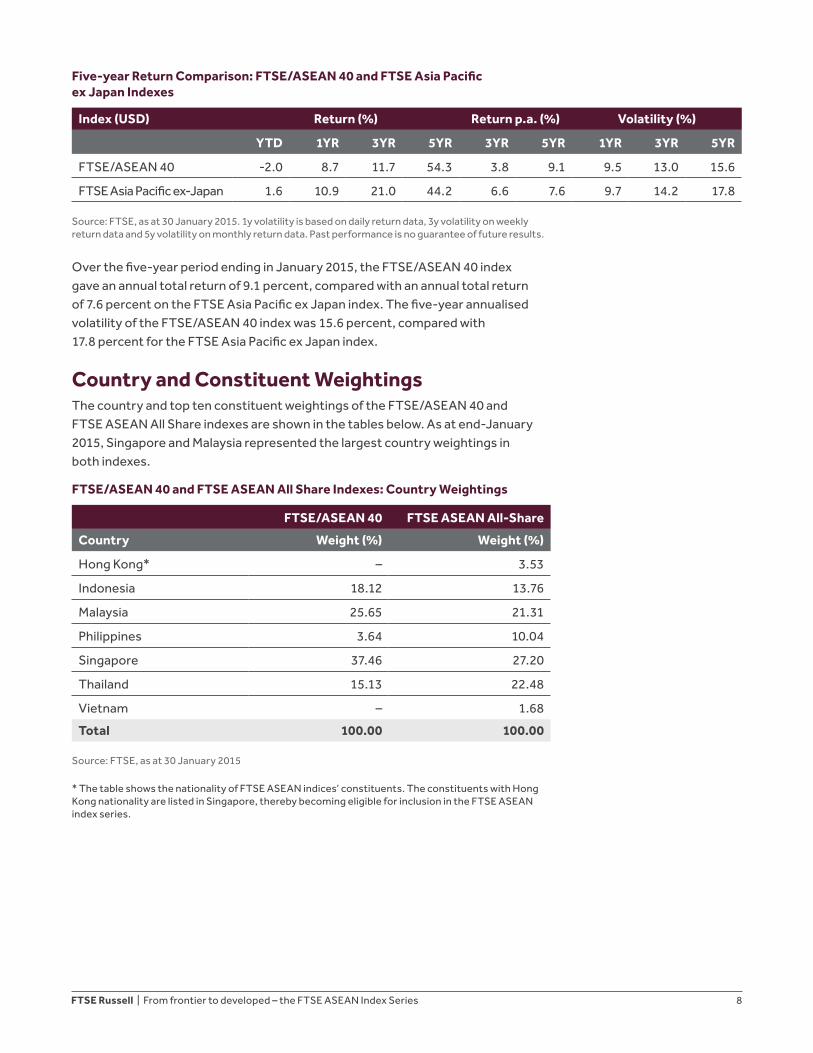
Five-year Return Comparison: FTSE/ASEAN 40 and FTSE Asia Pacific ex Japan Indexes
Index (USD) Return (%) Return p.a. (%) Volatility (%)
YTD 1YR 3YR 5YR 3YR 5YR 1YR 3YR 5YR
FTSE/ASEAN 40 -2.0 8.7 11.7 54.3 3.8 9.1 9.5 13.0 15.6
FTSE Asia Pacific ex-Japan 1.6 10.9 21.0 44.2 6.6 7.6 9.7 14.2 17.8
Source: FTSE, as at 30 January 2015. 1y volatility is based on daily return data, 3y volatility on weekly return data and 5y volatility on monthly return data. Past performance is no guarantee of future results.
Over the five-year period ending in January 2015, the FTSE/ASEAN 40 index gave an annual total return of 9.1 percent, compared with an annual total return of 7.6 percent on the FTSE Asia Pacific ex Japan index. The five-year annualised volatility of the FTSE/ASEAN 40 index was 15.6 percent, compared with 17.8 percent for the FTSE Asia Pacific ex Japan index.
Country and Constituent WeightingsThe country and top ten constituent weightings of the FTSE/ASEAN 40 and FTSE ASEAN All Share indexes are shown in the tables below. As at end-January 2015, Singapore and Malaysia represented the largest country weightings in both indexes.
FTSE/ASEAN 40 and FTSE ASEAN All Share Indexes: Country Weightings
FTSE/ASEAN 40 FTSE ASEAN All-Share
Country Weight (%) Weight (%)
Hong Kong* – 3.53
Indonesia 18.12 13.76
Malaysia 25.65 21.31
Philippines 3.64 10.04
Singapore 37.46 27.20
Thailand 15.13 22.48
Vietnam – 1.68
Total 100.00 100.00
Source: FTSE, as at 30 January 2015
* The table shows the nationality of FTSE ASEAN indices’ constituents. The constituents with Hong Kong nationality are listed in Singapore, thereby becoming eligible for inclusion in the FTSE ASEAN index series.
FTSE Russell | From frontier to developed – the FTSE ASEAN Index Series 9
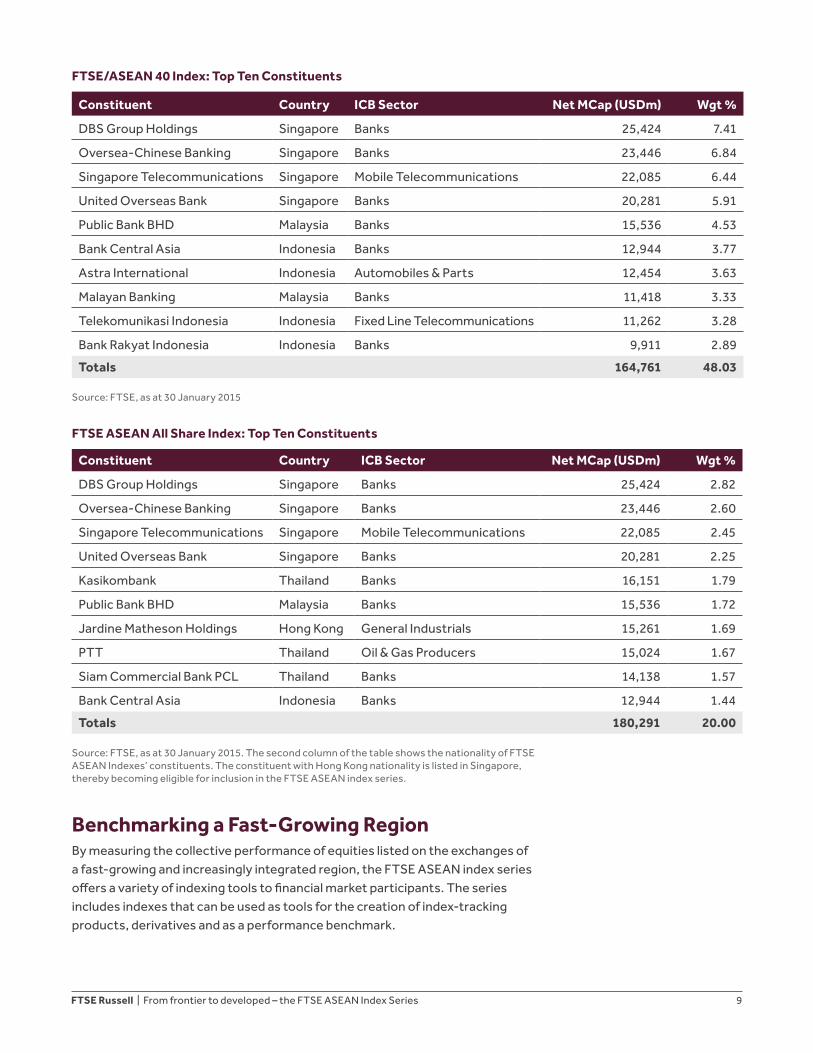
FTSE/ASEAN 40 Index: Top Ten Constituents
Constituent Country ICB Sector Net MCap (USDm) Wgt %
DBS Group Holdings Singapore Banks 25,424 7.41
Oversea-Chinese Banking Singapore Banks 23,446 6.84
Singapore Telecommunications Singapore Mobile Telecommunications 22,085 6.44
United Overseas Bank Singapore Banks 20,281 5.91
Public Bank BHD Malaysia Banks 15,536 4.53
Bank Central Asia Indonesia Banks 12,944 3.77
Astra International Indonesia Automobiles & Parts 12,454 3.63
Malayan Banking Malaysia Banks 11,418 3.33
Telekomunikasi Indonesia Indonesia Fixed Line Telecommunications 11,262 3.28
Bank Rakyat Indonesia Indonesia Banks 9,911 2.89
Totals 164,761 48.03
Source: FTSE, as at 30 January 2015
FTSE ASEAN All Share Index: Top Ten Constituents
Constituent Country ICB Sector Net MCap (USDm) Wgt %
DBS Group Holdings Singapore Banks 25,424 2.82
Oversea-Chinese Banking Singapore Banks 23,446 2.60
Singapore Telecommunications Singapore Mobile Telecommunications 22,085 2.45
United Overseas Bank Singapore Banks 20,281 2.25
Kasikombank Thailand Banks 16,151 1.79
Public Bank BHD Malaysia Banks 15,536 1.72
Jardine Matheson Holdings Hong Kong General Industrials 15,261 1.69
PTT Thailand Oil & Gas Producers 15,024 1.67
Siam Commercial Bank PCL Thailand Banks 14,138 1.57
Bank Central Asia Indonesia Banks 12,944 1.44
Totals 180,291 20.00
Source: FTSE, as at 30 January 2015. The second column of the table shows the nationality of FTSE ASEAN Indexes’ constituents. The constituent with Hong Kong nationality is listed in Singapore, thereby becoming eligible for inclusion in the FTSE ASEAN index series.
Benchmarking a Fast-Growing RegionBy measuring the collective performance of equities listed on the exchanges of a fast-growing and increasingly integrated region, the FTSE ASEAN index series offers a variety of indexing tools to financial market participants. The series includes indexes that can be used as tools for the creation of index-tracking products, derivatives and as a performance benchmark.
FTSE Russell 10
© 2015 London Stock Exchange Group companies.
London Stock Exchange Group companies includes FTSE International Limited (“FTSE”), Frank Russell Company (“Russell”), MTS Next Limited (“MTS”), and FTSE TMX Global Debt Capital Markets Inc (“FTSE TMX”). All rights reserved.
“FTSE®”, “Russell®”, “MTS®”, “FTSE TMX®” and “FTSE Russell” and other service marks and trademarks related to the FTSE or Russell indexes are trademarks of the London Stock Exchange Group companies and are used by FTSE, MTS, FTSE TMX and Russell under licence.
All information is provided for information purposes only. Every effort is made to ensure that all information given in this publication is accurate, but no responsibility or liability can be accepted by the London Stock Exchange Group companies nor its licensors for any errors or for any loss from use of this publication.
Neither the London Stock Exchange Group companies nor any of their licensors make any claim, prediction, warranty or representation whatsoever, expressly or impliedly, either as to the results to be obtained from the use of the FTSE Russell Indexes or the fitness or suitability of the Indexes for any particular purpose to which they might be put.
The London Stock Exchange Group companies do not provide investment advice and nothing in this document should be taken as constituting financial or investment advice. The London Stock Exchange Group companies make no representation regarding the advisability of investing in any asset. A decision to invest in any such asset should not be made in reliance on any information herein. Indexes cannot be invested in directly. Inclusion of an asset in an index is not a recommendation to buy, sell or hold that asset. The general information contained in this publication should not be acted upon without obtaining specific legal, tax, and investment advice from a licensed professional.
No part of this information may be reproduced, stored in a retrieval system or transmitted in any form or by any means, electronic, mechanical, photocopying, recording or otherwise, without prior written permission of the London Stock Exchange Group companies. Distribution of the London Stock Exchange Group companies’ index values and the use of their indexes to create financial products require a licence with FTSE, FTSE TMX, MTS and/or Russell and/or its licensors.
The Industry Classification Benchmark (“ICB”) is owned by FTSE. FTSE does not accept any liability to any person for any loss or damage arising out of any error or omission in the ICB.
Past performance is no guarantee of future results. Charts and graphs are provided for illustrative purposes only. Index returns shown may not represent the results of the actual trading of investable assets. Certain returns shown may reflect back-tested performance. All performance presented prior to the index inception date is back-tested performance. Back-tested performance is not actual performance, but is hypothetical. The back-test calculations are based on the same methodology that was in effect when the index was officially launched. However, back-tested data may reflect the application of the index methodology with the benefit of hindsight, and the historic calculations of an index may change from month to month based on revisions to the underlying economic data used in the calculation of the index.
For more information about our indexes, please visit ftserussell.com.
FTSE Russell
About FTSE RussellFTSE Russell is a leading global provider of benchmarking, analytics and data solutions for investors, giving them a precise view of the market relevant to their investment process. A comprehensive range of reliable and accurate indexes provides investors worldwide with the tools they require to measure and benchmark markets across asset classes, styles or strategies.
FTSE Russell index expertise and products are used extensively by institutional and retail investors globally. For over 30 years, leading asset owners, asset managers, ETF providers and investment banks have chosen FTSE Russell indexes to benchmark their investment performance and create ETFs, structured products and index-based derivatives.
FTSE Russell is focused on applying the highest industry standards in index design and governance, employing transparent rules-based methodology informed by independent committees of leading market participants. FTSE Russell fully embraces the IOSCO Principles and its Statement of Compliance has received independent assurance. Index innovation is driven by client needs and customer partnerships, allowing FTSE Russell to continually enhance the breadth, depth and reach of its offering.
FTSE Russell is wholly owned by London Stock Exchange Group.
For more information, visit www.ftserussell.com.
To learn more, visit www.ftserussell.com; email [email protected], [email protected]; or call your regional Client Service Team office:
EMEA+44 (0) 20 7866 1810
North America+1 877 503 6437
Asia-PacificHong Kong +852 2164 3333Tokyo +81 3 3581 2764Sydney +61 (0) 2 8823 3521