Embed Size (px)
Citation preview

From Extreme to Mainstream:
How Social Norms Unravel∗
Leonardo Bursztyn†
Georgy Egorov‡
Stefano Fiorin§
July 2017
Abstract
Social norms, usually persistent, can unravel quickly when new public information arrives, suchas a surprising election outcome. In our model of strategic communication, senders state theiropinion but they can lie to pander to the popular view; receivers thus make less inference aboutsuch senders. We test the model’s predictions with two experiments. On the sender’s side,we show via revealed preference that Donald Trump’s rise in popularity and eventual victoryincreased individuals’ willingness to publicly express xenophobic views. On the receiver’s side,we show that individuals are judged less negatively if they expressed a xenophobic view in anenvironment where the view is popular.
Keywords: Social norms; social acceptability; elections; xenophobia; political attitudes; socialinteractions; communication
∗We would like to thank Daron Acemoglu, Abhijit Banerjee, Roland Benabou, Davide Cantoni, Esther Duflo,Benjamin Enke, Raymond Fisman, Tarek Hassan, John List, Emir Kamenica, Ricardo Perez-Truglia, Frank Schilbach,Andrei Shleifer, Hans-Joachim Voth, Noam Yuchtman, and numerous seminar participants for helpful comments andsuggestions. Excellent research assistance was provided by Raymond Han, Jacob Miller, and Aakaash Rao. We aregrateful to the UCLA Behavioral Lab for financial support. This study received approval from the UCLA InstitutionalReview Board. The experiments reported in this study can be found in the AEA RCT Registry (AEARCTR-0001752and AEARCTR-0002028).†University of Chicago and NBER, [email protected].‡Kellogg School of Management, Northwestern University and NBER, [email protected].§UCLA Anderson School of Management, University of California, Los Angeles, [email protected].
1 Introduction
Social norms are an important element of any society: some behaviors and opinions are socially
desirable, while others are stigmatized. There is growing evidence that individuals care to a large
extent about how they are perceived by others and that such concerns might affect important
decisions in a variety of settings, from charitable donations (DellaVigna, List and Malmendier,
2012) to schooling choices (Bursztyn and Jensen, 2015) to political behavior (DellaVigna et al.,
2017; Enikolopov et al., 2017; Perez-Truglia and Cruces, forthcoming). Moreover, these social image
concerns matter both in interactions with other people from the same social group (Bursztyn and
Jensen, 2015) and in interactions with strangers, such as surveyors and solicitors (DellaVigna, List
and Malmendier, 2012; DellaVigna et al., 2017). In particular, even individuals with very strongly-
held political views might avoid publicly expressing them if they believe their opinion is not popular
in their social environment (Bursztyn et al., 2016).
A recent literature has documented the persistence of cultural traits and norms over long pe-
riods of time (Voigtlander and Voth, 2012; Fernandez, 2007; Giuliano, 2007; Algan and Cahuc,
2010; Alesina, Giuliano and Nunn, 2013). However, little is known about what factors might lead
long-standing social norms to change, or even more so, to change quickly. In this paper, we argue
that aggregators of private opinions in a society, such as elections, might lead to updates in indi-
viduals’ perceptions of what people around them think, and thus induce fast changes in the social
acceptability of holding and expressing certain opinions and in the likelihood that these opinions
are publicly expressed.1
Consider the support for the communist regime in the Soviet Union in the late 1980s. Kuran
(1991) argues that many individuals opposed the regime but believed that others supported it.
In that environment, a referendum on the regime would have quickly updated people’s opinions
about the views of others. Incorrect beliefs about the opinions of others are not restricted to
totalitarian regimes, where expressing personal views is often risky. In fact, as we argue below,
if most individuals assume that a specific opinion is stigmatized, the stigma may be sustained in
equilibrium.2 In this paper, we formalize this idea and test it using two experiments with real
1Consistently with Benabou and Tirole (2011), we think of social norms as the set of ‘social sanctions or rewards’that incentivize a certain behavior. According to this view, social norms guide public or potentially public, butnot private behavior. Thus we do not take a broader view on social norms that also includes self-image concernsthat can shape even one’s private behavior by rewarding adherence and punishing deviance. Notice that since ourpaper explains how new public information can change social norms in the narrower (and our preferred) sense, it alsosuggests that social norms in the broader sense change – specifically, the part of social norms responsible for rewardsor punishments by others. Thus, when we say that social norms unravel, they do so according to either definition.
2This phenomenon is known in social psychology as “pluralistic ignorance” (Katz and Allport, 1931), whereprivately most people reject a view, but incorrectly believe that most other people accept it, and therefore end upacting accordingly. For example, in 1968 most white Americans substantially overestimated the support for racialsegregation among other whites (O’Gorman, 1975). A related concept is “preference falsification” (Kuran, 1995):people’s stated, public preferences are influenced by social acceptability, and might be different from their true,private preferences. For example, American college graduates consistently understate their support for immigrationrestrictions when asked directly as compared to their preferences elicited in a less obtrusive way, which is consistent
1
stakes. In our first experiment (henceforth experiment 1 ), we show that Donald Trump’s rise in
popularity and eventual victory in the 2016 U.S. Presidential election causally increased individuals’
perception of the social acceptability of holding strong anti-immigration (or xenophobic) views and
their willingness to publicly express them.3
We present a simple model of strategic communication between individuals who can hold one
of the two mutually exclusive convictions, e.g., xenophobic and tolerant. Each sender delivers
a message (states his view) to a receiver, who in turn uses this message to make a Bayesian
update on the sender’s true conviction (e.g., whether or not the sender is xenophobic). In our
setting, as in DellaVigna et al. (2017), lying (or expressing a conviction that is not one’s own) is
costly, so messages have some credibility; at the same time, citizens can pay this cost and lie, so
communication need not be truthful. Importantly, the sender has social image concerns: he values
other people’s perception of his type. Thus, for example, if he thinks that most other people are
tolerant, he might want to hide his xenophobic views and pay the cost of lying; conversely, if he
believes that most other people are xenophobic, he would not only feel free to state such a view
if he shares it, but may express xenophobia even if he is tolerant. In other words, senders have
incentives to ‘pander to the majority’. In the extreme cases we may have a ‘political correctness’
equilibrium, wherein all senders state the same view regardless of their true convictions, thus
preventing learning about these true convictions. Receivers are Bayesian, and their perceptions of
senders depends on the strategy that senders use. In the example above, if xenophobic individuals
say that they are tolerant because they believe that most receivers are tolerant, then anyone who
expresses xenophobic opinions must indeed be xenophobic. At the same time, if most receivers
are believed to be xenophobic so that even some tolerant people express such views, then a person
stating xenophobic views is not necessarily a xenophobe, and thus will be judged less harshly by
tolerant people.4
Our model predicts, in particular, that a positive update about the share of xenophobes in a
society makes xenophobic messages more likely. Thus, a shock to this belief, such as information
aggregated in an election where this particular issue (tolerance vs. xenophobia) is salient, can rapidly
change the social norm in communication: what was unacceptable and rarely, if ever, spoken, could
become acceptable and normal in a matter of weeks, if not days. Quite interestingly, the logic of
the paper suggests that information aggregation can make an ‘extreme’ topic ‘mainstream’, but
not the other way around: such a shock cannot make a mainstream topic extreme. This is easy to
with preference falsification (Janus, 2010).3We thus focus on the consequences Trump’s election rather than its causes or determinants. With respect to the
latter, Enke (2017) demonstrates the link between tribalistic (as opposed to universal) moral values and Trump voteat the county level, while Allcott and Gentzkow (2017) discuss the possible role of fake news. Relatedly, Xiong (2017)studies the effect of the celebrity status of Ronald Reagan on his electoral support, and suggests that a similar effectmay have helped Trump. At the same time, our focus is on causes and not consequences of changes in social norms(see Ali and Benabou, 2016, on the latter).
4Notice that we do not allow agents to be influenced and change their opinion. This simplification fits our needsas we do not see evidence of subjects changing their opinions in our experimental interventions.
2

see: if a topic is mainstream and socially acceptable, individuals know how widely each opinion is
shared, and by whom, in which case information aggregation is unlikely to reveal new information.
Of course, if the underlying fundamentals change – for example, more people become radicalized, or
people become more judgmental of others – then a certain viewpoint could move from mainstream
to extreme. However, since this involves changes in fundamentals, this is likely to be a slow and
gradual process.
We test the model on both the senders’ and receivers’ sides using real-stakes experiments on
Amazon Mechanical Turk (henceforth MTurk). On the sender’s side, we focus on the 2016 U.S.
Presidential election. Throughout his campaign, Donald Trump proposed, among other things,
the construction of a wall separating the U.S. and Mexico and a ban on Muslims from entering
the U.S. His popularity might thus send an informative signal about the number of people who
sympathize with these proposals and thus about those who hold xenophobic views. As a result,
Donald Trump’s electoral success potentially caused a shift in social norms regarding expressing
views on immigrants.
More specifically, in the two weeks before the election which took place on November 8, 2016,
participants were offered a bonus cash reward if they authorized the researchers to make a donation
to a strongly anti-immigration organization on their behalf.5 Accepting the offer is therefore a
profitable xenophobic action. At baseline, participants who randomly expected their decision to
be potentially observed by and discussed with a surveyor in a future interaction (the “public”
condition) were significantly more likely to forgo the donation bonus payment than those who
expected their choice to be entirely anonymous (the “private” condition). This suggests the presence
of social stigma associated with the action. Before making the donation decision, a random subset
of participants received information that positively updated their perceptions of Trump’s popularity
in their home state on the eve of the election. We first show that this information indeed positively
updated their beliefs about the local popularity of xenophobic views. We then show that, for
these participants, the wedge in the likelihood of undertaking the xenophobic action in private and
public disappeared. This difference with respect to the baseline condition was driven entirely by
an increase in the donation rate in the public condition, with no change in the private condition.
We also exploited the “natural experiment” of Trump’s unexpected victory as an alternative
treatment that could generate increases in the willingness to publicly express xenophobic views.
We replicated the experimental intervention shortly after the election, restricting the design to the
baseline condition with no additional information on Trump’s popularity. We find that after the
election, the wedge between private and public donation rates disappeared, even in the absence
5A small share of subjects were steered towards donating to a pro-immigrant organization, so we could claimthat the subjects’ match with the organization is random (and ensure that participants would not associate theexperimenters with a specific political view). In the case of a pro-immigration organization, both actions (donatingand not donating) were unlikely to be stigmatized. We steered most subjects to an anti-immigrant organization tomaximize power in the case where we hoped to find stigma.
3
of the experimental information intervention. Again, this difference was entirely driven by an
increase in the public donation rate; the private donation rate remained unchanged from the pre-
election intervention. Our results suggest that Donald Trump’s rise in popularity did not make
these participants more xenophobic, but instead made those who were already xenophobic more
comfortable expressing their xenophobic views in public. We also discuss suggestive evidence of
the precise mechanisms driving our findings.
A second experiment (henceforth experiment 2 ) studies the receiver’s side. We exploit the
general lack of knowledge among MTurk workers in the U.S. about the 2009 Swiss referendum that
banned the construction of minarets in that country. We consider this an ideal setting for two
reasons. First, the topic of the referendum was closely aligned with that of experiment 1. Second,
the fact that most participants were unaware not only of the ban, but also of the fact that the
majority of the Swiss population supported it, allows us to manipulate participants’ beliefs about
the public support for the ban.
After stating their personal views on whether the construction of minarets should be banned,
participants played a dictator game with a real, anonymous Swiss person. We randomized the
information about the Swiss person given to the participants in order to evaluate the effect of
information on the participants’ attitude towards that person, which we measure via revealed
preference (the dictator game). We focus on participants who reported that they were against
banning the construction of minarets. In the first treatment group, individuals who were randomly
told that the Swiss person was in favor of the ban significantly reduced their donation levels in
the dictator game, when compared to the control group where that piece of information was not
provided. In the second treatment group, participants were additionally informed that 57.5% of
Swiss respondents also supported the ban, which led them to update upward; this figure was the
actual support for the ban in the 2009 referendum. In this case, donations went up significantly
compared to the previous treatment group, consistent with participants judging the Swiss person
less negatively for expressing a popular view, which he could have done to pander to the majority.
A potential alternative interpretation is that participants judge the Swiss person less negatively
for holding his opinion when the majority of Swiss support the ban, regardless of whether his
support was expressed in public. For example, it could be that participants feel that they cannot
blame a person for privately holding a view if that person is surrounded by many other people
who also hold that view and who could also have influenced the private opinions of that person, or
the popular support for the ban could be interpreted as evidence that such ban is justified in the
Swiss context. To directly rule out these alternatives and confirm that our findings are driven by
participants’ belief that the Swiss person might have had strategic reasons to publicly express an
intolerant view, we also ran an additional experiment where we emphasized that the Swiss person’s
opinion was expressed anonymously. In that treatment, informing participants of a higher level of
public support for the ban in Switzerland does not increase donation amounts.
4

Our results suggest that Trump’s rise in popularity and eventual electoral victory could have
casually changed social norms regarding the expression of xenophobic views in the U.S. Though we
detect no changes in privately-held views, we believe the findings on public expression are of great
policy relevance. For example, increases in public expression of anti-immigrant sentiment might
also lead to more frequent acts of hate crime against immigrants. Indeed, recent reports indicate a
steep increase in the number of hate crimes against these groups throughout the campaign period,
and especially after Donald Trump’s election.6 More common public expression of certain views
might also facilitate coordination for large-scale actions, such as demonstrations and movements,
and recent work provides evidence that such demonstrations and movements might affect many
important outcomes, from election results (Madestam et al., 2013) to the stock market valuation
of different firms (Acemoglu, Hassan and Tahoun, Forthcoming). In addition, reductions in the
stigma associated with holding previously-extreme views might lead to shifts in the language used
in and reported by the popular media, and might also reduce the stigma associated with consuming
and discussing certain news sources on the far side of the political spectrum. For example, the news
website Breitbart more than doubled its share of general news audience between the end of 2014
and July 2016, reaching 9% of the market (18 million visitors) that month.7 Increases in public
expression of such views can thus lead to increases in individuals’ overall exposure to them, and
more exposure might eventually lead to changes in privately-held views, via persuasion or simple
conformism.
Our results contribute to a growing literature that examines the impacts of political institutions
on social norms and culture more generally. This literature typically studies the long-run impact
of political institutions (e.g., Lowes et al., 2017); we show that changes on the political side can
lead to fast changes in social norms. Our paper also adds to a recent theoretical literature on
social norms (e.g., Benabou and Tirole, 2011; Acemoglu and Jackson, 2017) by studying how new
information may lead to unraveling of such norms. Our findings also speak to a cross-disciplinary
literature on the consequences of political actions, both theoretical (e.g., Lohmann, 1993) and
empirical (e.g., Madestam et al., 2013). Methodologically, this paper also relates to a literature
on the measurement of sensitive attitudes, which includes approaches such as the “randomized
response technique” (Warner, 1965), the “list experiment” (Raghavarao and Federer, 1979), the
“endorsement experiment” (Sniderman and Piazza, 1993), and the “lost letter technique” (Milgram,
1977). In our study, the private donation decision provides a measure based on revealed preference,
where concerns about social desirability are minimized due to anonymity. Conceptually, experiment
6For example, a recent report by the Center for the Study of Hate and Extremism (2017) indicates that across eightmajor metropolitan areas in the U.S., the number of hate crimes increased by more than 20% in 2016. This increaseis significantly larger in both absolute and relative terms than any year-to-year increase in hate crimes in these citiessince 2010. Increases in public expression of hate against some minorities might also spur increases in expression ofhate against other minorities. For example, the same report shows that hate crimes against African-Americans andJews in New York City also increased substantially between March 2016 and March 2017.
7See https://fivethirtyeight.com/features/trump-made-breitbart-great-again/.
5

1 is novel since it exploits both experimental and natural occurring variation as two alternative
approaches. Randomized informational interventions are often subject to the criticism of not being
entirely natural, while before/after designs based on natural variation suffer from lack of true
randomization. In our setting, the two approaches yielded very similar results, which provides
extra assurance of both the validity of our tests of the model and the real-life significance of our
findings.
Theoretically, the two most important precursors to our paper are Bernheim (1994) and Morris
(2001). Bernheim (1994) studies the behavior of individuals with social concerns and predicts the
emergence of social norms. People with similar preferences will adhere strictly to such norms,
while people with extreme tastes will choose not to do so. The possibility of complete pooling
and the resulting non-transmission of information is suggested in Morris (2001), where an advisor
who is afraid of being perceived as biased ultimately avoids giving advice in all states of the
world. Our model can be viewed as combining and simplifying the two approaches to get a model
with straightforward comparative statics results that highlight the role of individual beliefs and
information shocks. One can loosely view the model as adapting the binary message structure of
Morris (2001) to the social communication setting of Bernheim (1994).
Our work also relates to existing papers studying the economic consequences of conformity.
Prendergast (1993) identifies rational incentives for managers to conform to supervisors’ opinions
in order to appear competent, which in turn hampers information transmission. Andreoni, Niki-
forakis and Siegenthaler (2017) study ‘conformity traps,’ situations where groups of individuals fail
to coordinate on a beneficial action due to individual incentives to conform to the predominant
and inefficient behavior. In a laboratory experiment they find, in particular, that opinion polls can
facilitate changes of norms that benefit the group. Their setting, however, is one of full information,
and thus opinion polls facilitate switching from one equilibrium to another. Our model has incom-
plete information and features a unique equilibrium, and elections can change the beliefs about the
distribution of other people’s opinions (though we do not take a position on whether overcoming
conformity is necessarily socially beneficial). In a different setting, Kets and Sandroni (2016) study
the trade-off between the performance of conforming versus diverse groups of individuals.
The remainder of this paper proceeds as follows. We introduce a simple framework formalizing
our argument in Section 2. In Section 3, we present the design and results from experiment 1 that
studies the 2016 U.S. Presidential elections. In Section 4, we present the design and results from
experiment 2. Section 5 concludes.
6

2 Theoretical Framework
2.1 A model of communication
There is a continuum of citizens.8 Citizens can hold one of two mutually exclusive convictions, A
or B; we sometimes call it their type and write ti ∈ {A,B} for citizen i. (One can think of these as
‘beliefs’ in colloquial sense, but we reserve the word ‘belief’ for the game-theoretical notion.) The
share of citizens holding conviction A is p, so Pr (ti = A) = p. We do not assume that p is known,
and instead allow citizens to hold an incorrect belief about the share of citizens with conviction A,
which we denote by q. To avoid dealing with higher-order beliefs, we assume that q is common
knowledge.
The citizens are paired with one another; within each pair, there is a sender i and receiver
j. Sender i sends message mi, and we assume that the message space is binary, so message
mi ∈ {A,B}. Sending a message mi may involve the following costs for citizen i. First, sending
a message mi 6= ti incurs a cost of lying li; this cost is assumed to be distributed uniformly on
[0, 1] (this can be thought of as normalization), and independently of ti (i.e., citizens holding either
conviction are equally averse to lying).9 Second, the sender enjoys a benefit proportional (with
intensity factor denoted by a) to his belief that the receiver approves his type. Consequently, the
expected utility of a citizen i with two-dimensional type (ti, li) from sending message mi to receiver
j is given by
Ui (mi) = −liI{mi 6=ti} + aq Prj (ti = A | mi) + a (1− q) (1− Prj (ti = A | mi)) , (1)
where Prj (ti = A | mi) is the receiver’s posterior that the sender is type A conditional on the
message he sent, mi.
In this game, we are interested in Perfect Bayesian Equilibria, which furthermore satisfy the
D1 criterion (Cho and Kreps, 1987).
2.2 Analysis
We start our analysis with the case q > 12 , which means that types ti = A are perceived to be more
numerous. Then senders with the same type ti = A communicate truthfully. Indeed, by sending
message mi = B they would incur the cost of lying and furthermore make the receiver’s opinion
8We could instead assume communication between two individuals. The results would not change at all, with theexception of the dynamic extension (Subsection 2.3).
9Thus, in our model, communication is not ‘cheap talk’, as in Crawford and Sobel (1982). See Kartik, Ottavianiand Squintani (2007) and Kartik (2009) for models of strategic communication with lying costs in an uninformedprincipal – informed agent framework. The cost of lying could also be interpreted as the (lost) intrinsic utilityobtained from expressing one’s own true conviction.
7

about them worse, on average.10 For senders of type ti = B, there is a cutoff z, so that those with
li < z send message mi = A (i.e., they lie if it is not too costly) and those with li > z send mi = B.
As a result, receiver j who got message mi = A believes that the sender is ti = A with probability
Prj (ti = A | mi = A) =q
q + (1− q) z,
and a receiver who got message mi = B believes that the sender is type ti = B for sure, so
Prj (ti = A | mi = B) = 0.
This implies that for a sender with type (ti = B, li), sending message mi = A results in expected
utility
Ui (mi = A) = aqq
q + (1− q) z+ a (1− q)
(1− q) z
q + (1− q) z− li,
whereas sending message mi = B results in expected utility
Ui (mi = B) = a (1− q) ,
because only receivers of type B will approve of him. The sender with type (ti = B, li = z) is
indifferent if and only if Ui(mi = A) = Ui(mi = B) or, equivalently,
− (1− q) z2 − qz + aq (2q − 1) = 0.
The left-hand side is positive at z = 0 and equals aq (2q − 1)− 1 at z = 1. Thus, if aq (2q − 1) ≥ 1,
then (almost) everyone sends message mi = A. If aq (2q − 1) < 1, then there is a unique interior
solution, given by
z =
√1
4
(q
1− q
)2
+ a(2q − 1) q
1− q− q
2 (1− q). (2)
If q < 12 , the analysis is similar; the difference is that all types with ti = B communicate
truthfully, whereas at least some types with ti = A (those with lowest cost of lying) send message
mi = B. More precisely, if a (1− q) (1− 2q) ≥ 1, then everyone sends mi = B, and otherwise the
cutoff of citizens with ti = A is given by
z =
√1
4
(1− q
q
)2
+ a (1− 2q)1− q
q− 1− q
2q. (3)
10This argument implicitly uses the fact that types t = A are relatively more likely to send message m = A thantypes t = B. We formally prove that this holds in every equilibrium in Appendix A. Intuitively, this follows from thepresence of costs of lying, which make the two messages asymmetric.
8

Lastly, if q = 12 , then everyone communicates truthfully. We summarize these results in the following
proposition.
Proposition 1. Denote v = 2√a2+8a+a
. There is a unique equilibrium, taking the following form.
(i) If q ≤ 12 − v, then every sender sends message mi = B.
(ii) If q ∈(12 − v, 12
)then citizens with conviction B send message B for sure, while citizens
with conviction A send message B iff their costs of lying li < z, where z ∈ (0, 1) is given by (3),
and send message A otherwise.
(iii) If q = 12 , then every sender sends message mi = ti, i.e., communicates truthfully.
(iv) If q ∈(12 ,
12 + v
), then citizens with conviction A send message A for sure, while citizens
with conviction B send message A iff their costs of lying li < z, where z ∈ (0, 1) is given by (2),
and send message B otherwise.
(v) If q ≥ 12 + v, then every sender sends message mi = A.
Thus, if q = 12 (case iii), then everyone would communicate truthfully regardless of a. If a is
high enough (a > 1) and q is close to 0 or 1 (cases i and v), then the equilibrium takes the ‘political
correctness’ form, wherein all senders communicate the message corresponding to the majority of
receivers. The requirement a > 1 reflects that the sender’s concern about the receiver’s opinions
has to be strong enough to overcome even the highest cost of lying. For intermediate values of q,
citizens who have a low cost of lying pander to the majority, but those with high cost of lying do
not.
Even if the equilibrium is not fully of the ‘political correctness’ form, communication depends
on the beliefs that citizens have as well as their sensitivity to the opinion of others. The cutoffs (2)
and (3) are both increasing in a, meaning that if senders are more concerned with the receiver’s
opinion, they are more likely to send a message preferred by a majority of receivers. Furthermore,
(2) is increasing in q, provided that q > 12 . This happens for two reasons. First, a higher q makes
it more likely that the receiver is of type A, which makes the sender even more willing to send
message A. Second, and more subtly, a higher q increases the receiver’s prior that the sender is
type A, which means that the drop in his opinion about the sender who discloses his conviction B
is now higher, and the sender’s chance to ‘pass’ as type A if he sends message A is also higher. The
cutoff (3) is decreasing in q for similar reasons, which again implies that the share of senders who
send A is increasing in q even if q < 12 . Of course, a higher objective number of citizens of type
A, p, also increases the share of senders sending A: while this does not change the strategy of an
individual sender, this is true since citizens with conviction A are relatively more likely to send A.
We summarize these comparative statics results in the following proposition.
Proposition 2. Suppose that q ∈(12 − v, 12 + v
), so in the unique equilibrium both messages are
sent with positive probabilities. Then:
9

(i) An increase in p, the objective share of citizens with conviction A, leads to more senders
sending message A;
(ii) An increase in q, the citizens’ belief about the share of those with conviction A, also leads
to more senders sending message A.
(iii) An increase in a leads to more senders sending message A if q > 12 and to more senders
sending message B if q < 12 . There is no effect if q = 1
2 .
More generally, for q < 12 − v or q > 1
2 + v, these results hold in a weak sense.
Proposition 2 describes the effect of parameters on the behavior of senders. We are also inter-
ested in their effect on the receiver’s beliefs about the sender following the receipt of either message.
To understand these effects, suppose that q > 12 . Then after receiving message B, the receiver is
certain that the sender was of type B, so Prj (ti = A | mi = B) = 0. At the same time, as argued
above, after receiving message A, the receiver’s posterior probability that the sender is of type A
equals Prj (ti = A | mi = A) = qq+(1−q)z . Since z is increasing in a, this posterior belief is decreasing
in a. This is natural: if a is higher, more citizens of type B misrepresent themselves by sending
message mi = A, thus making it less likely that a random sender of message A is truly type A. Now
consider the comparative statics with respect to q. Here, there are two effects. First, the cutoff z
is increasing in q, thus making it harder to be sure that a sender with message A is indeed type
A. But, on the other hand, a higher q implies a higher overall share of citizens with type A (as
perceived by the receiver), which implies a higher prior they have on sender being type A, which,
all things equal, would imply a higher posterior. These two effects contribute to a nonmonotone
overall effect: the posterior Prj (ti = A | mi = A) is highest (equal to 1) at q = 12 and q = 1, and
otherwise it is U-shaped, with the minimum attained at q = min(12 + v,
√12 ≈ 0.71
).11 We thus
have the following result.
Proposition 3. Suppose again that both messages are sent with positive probabilities. Then the pos-
terior of a receiver j that the sender who sent message mi = A is indeed ti = A, Prj (ti = A | mi = A),
is constant and equal to 1 for q < 12 , decreases in q when q ∈
(12 , q)
and increases back to 1 when
q ∈ (q, 1). This posterior always exceeds 12 and is decreasing in a if q > 1
2 . It does not depend on
the objective share of citizens with type A, p.
In other words, the receiver’s posterior that the sender who sent message mi = A is indeed type
ti = A evolves as follows (see Figure 1 for an illustration if q =√
12 , as would be the case, e.g.,
if a < 1). If conviction A is shared only by a minority (q < 12), then message mi = A is taken
at face value, as only ti = A would send it. As the share of citizens with conviction A becomes
a majority, receivers would recognize that this message could be sent for strategic reason and this
11More precisely, q =√
12
if a ≤ 2 +√
2 and q = 12
+ v otherwise.
10

would decrease Prj (ti = A | mi = A) down from 1. However, at some point the posterior would
increase again, for one of the two reasons. First, social pressure could become strong enough so that
all senders send message mi = A, thus making this message uninformative and the posterior equal
to the prior q (this would happen at q = 12 + v per Proposition 1). Second, even without reaching
the ‘political correctness’ equilibrium (e.g., that would never happen if a < 1), the receivers would
recognize at some point (specifically, at q =√
12) that there are many citizens with type ti = A,
and the posterior would increase again, up to 1 as q tends to 1). Of course, a similar result applies
with respect to Prj (ti = A | mi = B), which we omit to save space.
2.3 Dynamics
Let us now consider a simple extension of the previous model that will enable us to study how
certain shocks to the underlying parameters affect communication strategies within the society,
as well as social learning. There may be multiple reasons for shocks: arrival of new information
that makes some people change their opinions, a speech by an influential politician or celebrity,
or others. Here, we consider elections as a particular case of a shock that aggregates convictions
and allows citizens to learn about members of their society that they do not directly communicate
with.12
Specifically, we consider a three-period model. In each of the periods, each citizen communicates
with a continuum of other citizens, and we assume that in these communications he is both the
sender and the receiver. Informally, we think about citizens adopting a certain ‘persona’ for the
whole period, and if what they learned during that period about the rest of the society suggests
it would be better to act differently, they can send different messages in the subsequent periods
but not in the current one. Formally, we assume that each citizen is matched with three disjoint
continua of other citizens, and in each of the periods, he sends a message to all other citizens
matched to him in that period and receives messages from all of them.13 Before period 1, the
share of citizens having conviction A, i.e., p, is realized but not know to the citizens, and Nature
instead sends a noisy public signal to all citizens, so citizens start period 1 with a common belief
that the share of citizens with conviction A is q. They communicate in period 1, update on p, and
then communicate in period 2. Between periods 2 and 3, Nature reveals p (e.g., through elections),
after which the citizens have a final round of communication. Such timing allows us to compare
the social norms learned through strategic communication (period 2) and the social norms learned
through public information aggregation (period 3). We do not introduce any discounting, but since
12Political campaigns that precede elections may, of course, persuade people to change convictions about issues ormake some issues more salient than others. This may also change communication strategies in the society. Here, weonly focus on the moment of the election as the source of the information shock.
13For example, suppose that citizens are randomly allocated in a unit cube with coordinates (x, y, z). In period 1,citizen (x, y, z) communicates with citizens of the form (∗, y, z), in period 2, he does so with (x, ∗, z), and in period3, he communicates with those of the form (x, y, ∗). Within a period, all citizens communicate simultaneously, so themessage that a citizen sends is not affected by what he receives in that period.
11
each agent is infinitesimal and does not expect to change others’ beliefs for the subsequent periods,
each agent would communicate to maximize his static payoffs with or without discounting.
We have the following result.
Proposition 4. Let again v = 2√a2+8a+a
. Then:
(i) If the initial signal q satisfies q ∈(12 − v, 12 + v
), then each citizen sends the same message
in periods 2 and 3. In period 1, some send a different message, unless p = q.
(ii) If the initial signal q satisfies q /∈(12 − v, 12 + v
), then each citizen sends the same message
in periods 1 and 2. They also act the same way in period 3 if p, q ≤ 12 − v or p, q ≥ 1
2 + v, but some
act differently otherwise.
This result is mainly of interest if the original belief was wrong. If q is relatively close to 12 , then
both messages are sent with positive probabilities. Each citizen is then perfectly able to deduce p
from what they observe in period 1. Indeed, suppose, for the sake of the argument, that q ≥ 12 . In
this case, the share of messages A equals p + (1− p) z, where z is given by (2). For the assumed
values of q, z < 1, and therefore p can be perfectly learned. Once this is the case, there is no
learning between periods 2 and 3, and therefore citizens act identically, knowing that the share of
citizens with conviction A is p and is common knowledge.
The pattern is very different if q is not close to 12 (and a > 1). In this case, all citizens, regardless
of their conviction, send the same message in period 1 in equilibrium (A if q is close to 1 and B
if q is close to 0). As a result, what each citizen observes does not depend on p, and therefore no
citizen makes any inference about p. The second period is then identical to the first one. However,
the true value of p is revealed before period 3, and this can potentially lead to a different behavior.
Namely, if q > 12 + v, so all citizens were sending A in periods 1 and 2, then this will only continue
if p > 12 + v as well, while if p ≤ 1
2 + v, then some (or, in the extreme case p ≤ 12 − v, all) citizens
will start sending message B.
We thus observe the following. If the original citizens’ beliefs about their fellow citizens are
sufficiently moderate, the society is able to learn the true parameter through communication, and
elections do not reveal new information and therefore do not lead to a change in behavior. However,
if the original beliefs led the society to a ‘political correctness’ equilibrium, then there is no learning
in communication. In this case, elections can reveal new and surprising information, and thus can
lead to a discontinuous change in beliefs and behaviors.
2.4 Predictions
The model implies the following testable predictions.
(i) An increase in the citizens’ prior belief about the share of citizens having a certain conviction
also increases the likelihood that the corresponding message is sent.
12

(ii) The receiver’s posterior that the sender who sent a message indeed has the corresponding
conviction depends on this prior nonmonotonically. Namely, it equals 1 for priors on[0, 12]∪
{1}, and it is U-shaped on(12 , 1), while always exceeding 1
2 .
(iii) A shock that aggregates preferences in the society does not change individual behavior if the
society was not in a ‘political correctness’ equilibrium. If it was, then a shock may change
behavior.
3 Experiment 1: U.S. Presidential Elections
We developed two experiments with workers from the online platform MTurk. A number of recent
papers in economics have used the same platform to conduct surveys or experiments (e.g., Kuziemko
et al., 2015; Elias, Lacetera and Macis, 2016). The platform draws workers from very diverse
backgrounds, though it is not representative of the U.S. population as a whole.
3.1 Experimental Design
3.1.1 Intervention Before the Election
During the two weeks prior to the presidential election, we recruited participants (N = 458) from
the eight states in which the expected probability of Donald Trump’s victory at the state level
was 100%, according to the website Predictwise: Alabama, Arkansas, Idaho, Nebraska, Oklahoma,
Mississippi, West Virginia, and Wyoming. MTurk workers with at least 80% approval rate could see
our request, which was described as a “5 minute survey” with a reward of $0.50. Each worker could
participate in the survey only once. Workers who clicked on the request were displayed detailed
instructions about the task, and given access to links to the study information sheet and the actual
survey. The survey was conducted on the online platform Qualtrics.
After answering a number of demographic questions, half of the participants were randomly
informed about the 100% local odds from the website (information condition) while the other half
were not informed (control condition).14 Though restricting to these states might affect the external
validity of the findings, it also allows us not to worry about the role of heterogeneous priors (and
updates) in response to an informational treatment: the 100% forecast ensured that for this half of
the sample, the direction of the update about Trump’s local popularity is either zero or positive,
but never negative.15
14See the survey script in Appendix C.15Eliciting priors in the control group to assess the direction of the update would have been challenging since the
forecast information was available online. Therefore, asking the question before the donation decision could haveundone the treatment. Answers to the question if asked after the donation decision could have been affected by thedecision itself and by the private/public condition later assigned to the participant.
13

Participants were then asked to predict the share of individuals in their state that agree with
the following relatively strong anti-immigration statement:16
“Both legal and illegal immigration should be drastically reduced because immigrants
undermine American culture and do not respect American values.”
This provides a measure of the perceived local popularity of anti-immigrant sentiment.
In the next part of the intervention, we measured the perceived social acceptability of strong
anti-immigrant sentiment using a donation experiment with real stakes. Participants were first told
that they would be given the opportunity to make a donation to a randomly drawn organization
that could either be anti- or pro-immigration, to ensure that participants would not associate
the experimenters with a specific political view. To maximize power and avoid direct deception,
the randomization was such that more than 90% of participants (N=428) would get assigned the
organization we were interested in: the Federation of American Immigration Reform.17 To make
sure that the participants were aware of the organization’s very strong anti-immigration stance, a
few more details about the organization and its founder were provided in the experiment:
The Federation for American Immigration Reform (FAIR) is an immigration-reduction
organization of concerned individuals who believe that immigration laws must be re-
formed, and seeks to reduce overall immigration (both legal and illegal) into the United
States. The founder of FAIR is John Tanton, author of ‘The Immigration Invasion’ who
wrote “I’ve come to the point of view that for European-American society and culture
to persist requires a European-American majority, and a clear one at that.”
Participants were then asked if they would like to authorize the researchers to donate $1 to
that organization on their behalf. The money would not come from the subject’s $0.50 payment
for participation in the study. Moreover, the participant would also be paid an extra $1 (or about
1/6 of an hourly wage on MTurk) if he/she authorized the donation. Rejecting the donation would
16Here we describe the protocol of the experiment as it was registered on the AEA RCT registry with numberAEARCTR-0001752. As described in the registry, we planned to reach 400 individuals by November 7 – the daybefore the election and thus conceptually the last day in which the survey could be done (also pre-registered as the trialend date). In the piloting phase (on October 26 and 27) we were able to recruit 184 participants. We thus expectednot to have any issue recruiting 400 more subjects in the eight days between October 31 and November 7, giventhat in two days we were able to survey nearly half of that sample size. However, only 274 MTurk workers selectedthemselves into the study during the registered trial dates. The number of active MTurk workers in these states islower than we had originally expected (and to our knowledge no estimates of the MTurk population in those statesexist), which made it difficult to recruit enough participants before the election. In order to reach the desired (andregistered) sample size, we decided to include individuals who participated in the pilot experiment conducted beforethe registration with nearly identical versions of the protocol. In particular, both the wording of the informationaltreatment and the wording of the donation decision were completely unchanged. If we restrict the analysis to the 274subjects who followed the registered protocol, results are directionally similar, as discussed in Subsection 3.3.
17The pro-immigration organization was the National Immigration Forum.
14
not affect the monetary payoffs to the participant in any way other than through the loss of this
extra amount.
In addition to the original randomization of informing subjects about Trump’s probability
of victory in the participant’s state, we introduced a second layer of cross-randomization at the
donation stage. Half of the participants were assured that their donation authorization would be
kept completely anonymous, and that no one, not even the researchers would be able to match their
decision to their name: we refer to this condition as the private condition. Specifically, participants
were told:
Note: just like any other answer to this survey, also your donation decision will be
completely anonymous. No one, not even the researchers, will be able to match your
decision to your name.
The other half of the subjects were instead informed, right before the donation question was
displayed to them, that they might be personally contacted by the research team to verify their
answers to the questions in the remaining part of the survey: this is what we refer to as the public
condition.
Important: in order to ensure the quality of the data collected, a member of the research
team might personally contact you to verify your answers to the next question and
the following ones.
Names and contact information were not collected during the intervention, since the practice
is not allowed on MTurk. As a result, it was not possible to credibly lead participants to believe
that their decision would be observed by other individuals, for example, from their state. However,
on MTurk it is possible to contact participants individually on the platform via their worker ID.
We were therefore able to minimize deception since the decision was anonymous yet researchers
could still potentially contact participants (moreover, participants in the public condition might
have believed that they would be asked for personal information in case they were contacted later
on). As mentioned before, social acceptability with respect to surveyors and solicitors is also
informative to the study of social pressure and social image concerns, as examined in DellaVigna,
List and Malmendier (2012) and DellaVigna et al. (2017).
3.1.2 Intervention After the Election
We exploited the natural experiment of Trump’s unexpected victory as an alternative “treatment”
that could lead to an increase in the social acceptability of holding xenophobic views. We repeated
the experimental intervention in the same states during the first week after the election, restricting
the design to the control condition with no additional initial information on Trump’s popularity.
15
We recruited both subjects who had participated before the election (N = 168; 166 of them assigned
to the anti-immigration organization) and new participants (N = 218; 215 assigned to that orga-
nization). Based on naturally occurring variation, we can assess the impact of Trump’s electoral
victory on the perceived social acceptability of xenophobia.
3.2 Linking the Experiment to the Theoretical Framework
In what follows, we assume that A is the xenophobic conviction, while B is the opposite (tolerant)
one. In experiment 1, the communication is between the subject (the sender) and the researcher
(the receiver). Moreover, q here corresponds to the sender’s beliefs about the share of xenophobes
in the country. We consider two treatments that test the effect of manipulating q on the likelihood
that a xenophobic message is sent, thus testing the comparative static result associated with q from
Proposition 2:
• Treatment 1: the researchers communicate to the subject that Trump is winning for sure in
their state.
• Treatment 2: Trump wins the election.
Note that though both treatments increase q, their effect might operate through different chan-
nels. In particular, since Treatment 1 provides information about the area where the sender lives,
the effect is likely operating through the sender updating his beliefs about the receiver’s prior about
him. On the other hand, since Treatment 2 provides information at the country level, it might also
lead to an update of the sender’s prior on whether the receiver is a xenophobe. In our discussion
of results, we provide suggestive evidence consistent with these hypotheses.
3.3 Main Results
Appendix Table B1 provides evidence that individual characteristics are balanced across all four
pre-election experimental conditions, confirming that the randomization was successful. The first
four bars of Figure 2 display our main findings from the pre-election experiment. In the control
condition before the election, we observe a large and statistically significant wedge between dona-
tion rates in private and in public: a drop from 54% in private to 34% in public (the p-value of a
t test of equality is 0.002). Among individuals in the information condition, we observe no differ-
ence in private and public donation rates, which are 47% and 46%, respectively (p-value=0.839).
Moreover, we find no significant difference in private donation rates between the information and
control conditions (p-value=0.280), suggesting that the information is not increasing privately-held
xenophobia. The increase in public donation rates between the two conditions is statistically sig-
nificant (p-value=0.089), as is the difference in differences between donation rates in private across
conditions and donation rates in public across conditions (p-value=0.050). These results indicate
16

that the information provided causally increased the social acceptability of the action to the point of
eliminating the original social stigma associated with it.18 The first two columns of Table 1 display
the difference in differences results in regression format and show that our results are unchanged
when individual covariates are included. The table also displays p-values from permutation tests,
showing that our findings are robust to that inference method.
As an additional way of examining the effect of Trump’s increased popularity on public ex-
pression of xenophobia, we compare the private and public donation rates in the control condition
before and after the election. In the last two bars of Figure 2, we analyze the actions of respon-
dents who participated in both waves of the experiment. Though we focus on a subset of the
original participants, we find no evidence of selective attrition, and the samples in the different
conditions (before and after) are again well balanced (see Appendix Table B2). In private, we
again observe no increase in donation rates (54% before the election and 49% after the election,
p-value=0.440). In public, we observe a significant increase from 34% before the election to 48%
after it (p-value=0.060). The difference in differences between donation rates in private before and
after the election and donation rates in public before and after the election in the control condition
is also statistically significant (p-value=0.062). It is worth emphasizing that the donation rates
following the two different “treatments” (either experimental or natural) are extremely similar:
47% vs. 49% in private, and 46% vs. 48% in public. The last two columns of Table 1 display the
results in regression format, and again confirm that the findings are robust to using permutation
tests. Our results are also robust to different samples for the post-election experiment, such as also
including new participants, as displayed in Appendix Table B3.19
3.4 Discussion
3.4.1 Potential Mechanisms
In the experimental intervention before the election, the information provided to participants gen-
erated a positive (or null) update in their beliefs about Trump’s local popularity. Although this
18Apart from social stigma, another possible reason for the lower donation rates in the public condition with respectto the private condition is that participants might want to avoid talking with the surveyor because of the extra effortand time this requires (independently of the topic of the conversation), and they might expect the likelihood of havingto talk to be higher in case they decide to make the donation. However, this mechanism should operate identicallyboth in the control and in the treatment conditions, thus not affecting our identification of the reduction in socialstigma.
19If we restrict the analysis to the 274 subjects who followed the registered protocol results are directionally similar:raw donation rates are respectively, for the the private and public groups, 54% and 35% in the control condition beforethe election, 50% and 39% in the information condition before the election, and 39% and 45% in the control conditionafter the election. As with the full sample, the wedge between the public and private condition is significant in thecontrol condition before the election (p-value=0.018), and not significant in the information condition (p-value=0.219),or after the election (p-value=0.607). The difference in differences between donation rates in private across conditionsand donation rates in public across conditions is smaller than in the full sample and not significant before the election(8.4%, p-value=0.486), but large and significant after the election (24.9%, p-value=0.068).
17
might have also updated participants’ belief regarding whether the surveyor is a xenophobe, we
believe that the main effect of the information shock was updating participants’ beliefs about the
surveyor’s priors about the share of xenophobes around the participant. While we don’t have a
direct measure of this belief about the surveyor’s prior, we elicited the update in participants’
beliefs about the share of xenophobes in their home state – a good proxy for the other variable in
question. For the proxy to be valid, we need the update in participants’ beliefs about the share
of xenophobes in their state to go in the same direction as the update in their beliefs about the
surveyor’s beliefs about that same share. We believe this a reasonable assumption.
Figure 3 provides evidence that the information shock led to a positive update in beliefs about
the opinions about other individuals in the same state. In the control condition before the election,
the average guess was that 64% of other people in the participant’s home state would agree with the
xenophobic statement, while it was 68% in the information condition (p-value=0.062). This small
increase in the average guess might not fully display the impact that the information intervention
had on the distribution of beliefs about others. The distribution in the information condition first-
order stochastically dominates the distribution in the control condition (a Kolmogorov-Smirnov
test of equality of the two distributions yields a p-value of 0.072). For example, the percentage
of participants who think that the share of those agreeing with the xenophobic statement in their
state is above 90% increases substantially with the provision of information (from 9% to 17%, with
a p-value of 0.018).
When we analyze the effects of Trump’s actual victory on the social stigma associated with
the donation decision, it is less clear ex ante that an update in respondents’ beliefs about the
surveyor’s priors regarding the share of xenophobes in the respondents’ state would the main
driver of the findings. After the election, the surveyor is not directly providing any information
that would necessarily lead to an unambiguously weakly positive update in perceptions of Trump’s
local popularity. For example, participants might now believe that Trump’s actual margin of victory
in their state was smaller than what the surveyor had originally expected. Indeed, when comparing
the pre-election control group with the group after the election, we find no shift in the distribution
of beliefs about the share of xenophobes in participants’ home states (see Appendix Figure B1).
However, there is an unambiguously weakly positive update in participants’ perception of Trump’s
national popularity. According to our model, this will increase the probability that participants:
(i) think that the surveyor is xenophobic, and (ii) think that the surveyor will judge them less
negatively even if the researcher is not xenophobic. Hence, although we do not provide direct
evidence of these mechanisms, the nature of the intervention suggests that these two elements are
the likely drivers of the findings in the comparison of pre- and post-election donation rates.
One might be concerned that another mechanism might be operative, especially when examining
the post-election results. Indeed, participants might expect xenophobic policies to be institutional-
ized under Donald Trump’s administration (and believe that such expectation is also shared by the
18

surveyors). Such institutionalization/legitimacy could potentially increase the social acceptability
of xenophobia. In Appendix D, we discuss an additional experiment in which we replicate the
main finding of experiment 1 (randomized updates in the perceived popularity of xenophobic views
increasing their social acceptability), and provide direct evidence suggesting that the channel of
institutionalization/legitimacy is not the main driver of the effects. In experiment 2, we discuss
evidence suggesting that institutionalization/legitimacy is also not a likely driver of the effects on
the receiver’s side of the communication.
3.4.2 Further Interpreting the Findings
Although the effects we find are large, it is important to note that they are coming from a marginal
positive signal of Trump’s local popularity starting from a situation where he was already believed
to be extremely popular locally. Even in the control condition, the average individual believes that
64% of people in his/her state agree with the xenophobic statement, and 34% of participants make
the donation in public. Though we cannot test this hypothesis, perhaps an increase in the perceived
popularity of holding xenophobic views and a reduction of the related social stigma might have
already taken place throughout the presidential campaign, before the experiment took place. It is
also possible that the statement we chose was perceived as relatively mild toward the end of the
campaign period, so the small update in beliefs about the views of others regarding the chosen
statement could correspond to larger updates for a more extreme statement, or for a statement
more directly connected to the subsequent donation decision.
Finally, we can rule out that our main effect is coming from participants updating their beliefs
about the instrumental benefits associated with donating to the organization (for example, because
the organization is now more likely to fulfill its mission). Any effect explained by that factor would
have shown up in the private donation rates as well.
4 Experiment 2: Dictator Game
4.1 Experimental Design
4.1.1 Wave 1 – Non-Anonymous Behavior by the Swiss Player
In late February 2017, we recruited participants from the six states in which Hillary Clinton won
the presidential election with the highest margin: California, Hawaii, Maryland, Massachusetts,
New York, and Vermont. This was done to maximize the chances of recruiting subjects with liberal
views, and in particular subjects with no anti-Muslim sentiment.20
20As in experiment 1, MTurk workers with at least 80% approval rate could see our request, which in this casewas described as a “4-5 minutes short survey” with a reward of $0.50. Each worker could participate in the surveyonly once. Workers who clicked on the request were displayed detailed instructions about the task, and given accessto links to the study information sheet and the actual survey. The survey was conducted on the online platform
19
First, after answering a number of demographic questions, all participants were told that a
minaret is a tower typically built adjacent to a mosque and traditionally used for the Muslim
call to prayer. Second, they were asked whether they would support the introduction of a law
prohibiting the building of minarets in their state. Following our pre-registration, we focus on
subjects who reported to be against the introduction of this law (N = 396), and we examine how
they would interact with a person who has opposite views.21 In order to do so, in the third part of
the survey, participants were told that they were matched with a subject from another survey and
were asked to play a dictator game in which they could decide how to split $3 (half of an hourly
wage on the platform) between themselves and the other participant. We randomly assigned our
participants to three different groups and randomized the background information we gave to our
participants about the person they were matched with. Participants in the control group were
only told that the participant they were matched with was a 24-year-old male from Switzerland.
Note that we used real 24-year-old male subjects from Switzerland recruited to take part in a short
survey by a research assistant from the University of Zurich.
Participants in the anti-minarets group were additionally told that this person supports the
prohibition of the building of minarets in Switzerland. Participants in the anti-minarets, public
support group were instead told that “like 57.5% of Swiss respondents, the participant supports
the prohibition of the building of minarets in Switzerland.”
4.1.2 Wave 2 – Anonymous Behavior by the Swiss Player
If we find higher donations in the anti-minarets, public support group, when compared to the anti-
minarets one, we can conclude that the participants may believe that the Swiss person has strategic
reasons to state that he is anti-minarets, and for this reason judge him less for expressing that view.
However, a potential alternative interpretation of this result would be that participants might judge
the Swiss person less negatively when a majority of Swiss people support the ban, regardless of
whether his support was expressed in public. For example, it could be that participants feel that
they cannot blame a person for privately holding a view if that person is surrounded by many other
people who also hold that view and who could have influenced this person’s convictions. With
similar implications, participants might change their own opinion about minarets after learning
that a majority of Swiss people are against them, and for this reason start judging the Swiss
participant less negatively for privately holding these same views.
To explicitly rule out these possibilities, in the days immediately following wave 1, we conducted
an experiment with a slightly modified version of the protocol. In this second wave, participants
were informed about the fact that the 24-year-old male from Switzerland expressed his opinion in
an anonymous survey. To make sure we could hire enough respondents, in this wave we recruited
Qualtrics. The script used in experiment 2 is displayed in Appendix C.21Subjects who instead supported the law (N = 152) did not participate in the third part of the survey.
20

participants from the twelve states in which Hillary Clinton won the presidential election with the
highest margin (California, Hawaii, Maryland, Massachusetts, New York, and Vermont as in wave
1, plus Connecticut, Delaware, Illinois, New Jersey, Rhode Island, and Washington).22
The design of this experiment was almost identical to the original version. Once again, we focus
on subjects who reported to be against the introduction of the ban (N = 427).23 The main difference
with the original version is that we emphasized that the Swiss participant expressed his opinion
anonymously. Both in the control and in the treatment conditions, instead of writing, as before, that
“we matched you with a participant from another survey,” in this version we wrote “we matched you
with a participant from another anonymous survey.” In our treatment groups we emphasized once
again that the survey the Swiss person participated in was anonymous: “In our anonymous survey,
like the one you just completed, he said he supports the prohibition of the building of minarets
in Switzerland.” We call this first treatment group the anonymous anti-minarets group. Finally,
instead of writing “like 57.5% of Swiss respondents, the participant supports the prohibition of
the building of minarets in Switzerland,” in this case we wrote “According to numbers from 2009,
57.5% of Swiss respondents are in favor of prohibiting the building of minarets.” We call this second
treatment group the anonymous anti-minarets, public support group.24
4.1.3 Elicitation of Beliefs
At the end of the intervention, subjects in the control group were also asked about their beliefs
regarding the share of the Swiss who supported banning the construction of minarets, and whether
they believed the ban is legal in Switzerland. In the first wave we did not collect this information for
individuals in the anti-minarets and anti-minarets public support groups. To check whether their
beliefs about the share of the Swiss population supporting the ban are changed by the treatments,
we included these questions for both the control group and the treatment groups in the second
22As in the other two experiments, MTurk workers with at least 80% approval rate could see our request, whichin this case was described as a “4-5 minutes short survey” with a reward of $0.50. Each worker could participate inthe survey only once, and only if he/she did not participate in our other experiment. Workers who clicked on therequest were displayed detailed instructions about the task, and given access to links to the study information sheetand the actual survey. The survey was conducted on the online platform Qualtrics. The script used in this secondwave of experiment 2 is presented in Appendix C.
23Subjects who instead supported the law (N = 138) did not participate in the third part of the survey.24Our design also included a fourth group (N=136 in wave 1, and N=139 in wave 2), where participants were instead
told: “Building minarets is illegal in Switzerland, following a 2009 referendum. Like 57.5% of Swiss respondents,the participant supports the prohibition of the building of minarets in Switzerland. However, he did not vote inthe referendum since he was under legal voting age” in wave 1, and “In our anonymous survey, like the one youjust completed, he said he supports the prohibition of the building of minarets in Switzerland. Building minarets isillegal in Switzerland, following a 2009 referendum. According to numbers from 2009, 57.5% of Swiss respondentsare in favor of prohibiting the building of minarets. However, the person you are matched with did not vote in thereferendum since he was under legal voting age” in wave 2. This anti-minarets, referendum treatment was intended totest whether providing information a view that is not only held by a majority but is also official would further changethe donation rates. We found no effect of this additional treatment relative to the second treatment group, neitherin the original version nor in the anonymous version of experiment 2, suggesting that institutionalization/legitimacyalso does not seem to play a role on the receiver’s side. We report these results in Appendix Figures B2 and B3.
21

wave. The share of those thinking that a majority of the Swiss support the ban is almost identical
in the control group and the anti-minarets group (respectively 20 and 25%, with a p-value for the
test of equality of 0.301), but increases to 63% in the anonymous anti-minarets public support group
(p-values of the test of equality are less than 0.001 for either groups). The median belief about
the share of the Swiss population supporting the ban is 30% in both control and anonymous anti-
minarets groups, and 55% in the anonymous anti-minarets public support group. This confirms
that our experimental manipulation indeed shifted beliefs about the level of popular support for
the ban in Switzerland.25
Participants across conditions were also asked whether they believed the construction of minarets
is legal in Switzerland: in all three groups, a majority reported to think that constructing minarets
was legal (88% in the control group, 77% in the anti-minarets group, and 74% in the anti-minarets
public support group).26 We can thus rule out that the effects are affected by the fact that the ban
is enacted as law, and can thus isolate the role of pandering to the public opinion on participants’
judgment of the Swiss player.
4.2 Linking the Experiment to the Theoretical Framework
We have the following predictions, which help us test Proposition 3 (see Figure 4).
• Anti-minarets group: The Swiss person is revealed to be against minarets. The participants’
prior that Swiss people are on average anti-minarets is relatively low. This has two implica-
tions. First, before any additional information about the Swiss person is communicated, the
perceived probability that he is anti-minarets is low. Second, and more importantly, he is
not thought to have strategic reasons to pretend to be anti-minarets, because this view is not
thought to be popular among the Swiss: the subjects believe that in the equilibrium of the
game that the Swiss person plays, he would only say mi = A (i.e., express the intolerant view)
if his type is indeed ti = A. Thus, the posterior that this person is anti-minarets increases all
the way to 1. This lowers donations as compared to the control group.
• Anti-minarets, public support group: The Swiss person is revealed to be against minarets,
and in addition we reveal that 57.5% of the Swiss respondents support banning minarets.
25Here we report the numbers from the second wave of the experiment, since the first wave only asked beliefs forthe control group. The numbers for this group are very similar across waves. In the first wave, 17% of control groupparticipants believe a majority of Swiss people support the ban, compared to 20% in the second wave. The medianbelief is 30% for the control groups in both waves.
26While the beliefs are significantly different when comparing the control group with either of the two treatmentgroups (the p-values for the test of equality are 0.013 against the anonymous anti-minarets group and 0.002 againstthe anonymous anti-minarets public support group), there is no statistical difference between the two treatment groups(the p-value for the test of equality is 0.500). In the anti-minarets, referendum group where subjects were insteadtold that building minarets is indeed illegal, only 23% of respondents reported thinking that constructing minaretswas legal: as displayed in Appendix Figure B3 this treatment had no significant effect on donations above the effectof the anonymous anti-minarets, public support treatment.
22

Now, compared to the previous experimental condition, the participants may believe that
the Swiss person had strategic reasons to state that he is anti-minarets. This decreases
Prj (ti = A | mi = A) from 1 to some value which, however, must be greater than 12 , as fol-
lows from Proposition 3. This implies that donations should be higher than in the previous
treatment group, but not as high as in the control group.
The second wave of the experiment helps us test our model further, as well as rule out the
main alternative interpretations:
• Anonymous anti-minarets group: The Swiss person is revealed to be privately against minarets.
Again, subjects’ prior that Swiss people are on average anti-minarets is relatively low. The
posterior that the Swiss player is anti-minarets is 1, so donations should be similar to the
ones in the Anti-minarets group.
• Anonymous anti-minarets, public support group: The Swiss person is revealed to be pri-
vately against minarets, and we also reveal that 57.5% of Swiss respondents support banning
minarets. Unlike the non-anonymous version of this treatment, participants do not think the
Swiss person has strategic reasons to state that he is anti-minarets, since the expression is
anonymous. As a result, the posterior that the Swiss player is against anti-minarets is again
1, and the donation levels should be similar to those in the Anti-minarets group.
4.3 Results
Appendix Table B4 provides a test of balance of individual characteristics across all six conditions
from the two waves and separately for the three conditions of each wave. Although the two waves
were not conducted simultaneously, the variables are fairly well-balanced when pooling the two
waves. Only the share of white respondents is marginally unbalanced (p-value=0.085). As a result,
to simplify the exposition of our findings, below we pool the observations in the control groups from
the two waves, and compare the raw outcome variables across the two waves. Appendix Figures
B4 and B5 display the results separately for the two waves of the experiment and show that the
numbers are almost identical for the two control groups.
We now turn to the main findings from experiment 2, displayed in Figure 5. Panel A displays
comparisons of average donations across groups. In the control condition, where participants were
only told that they are matched with a 24-year-old male from Switzerland, we observe an average
transfer to the Swiss participant of $1.03. The average transfer is substantially lower for subjects
in the anti-minarets group, who are also told that this person supports the prohibition on building
minarets in Switzerland: the average transfer for this group is $0.69. The effect of informing subject
about the anti-Muslim views of the Swiss participant is statistically significant (p-value<0.001).
However, the average transfer among subjects in the anti-minarets, public support group who are
told that the majority of Swiss respondents are against minarets is $0.92, which is not statistically
23

different from the average transfer in the control group (the p-value of the difference is 0.162) but
is substantially higher than the average transfer in the anti-minarets group (p-value=0.013). The
average donation in the anonymous anti-minarets group is identical to that in the anti-minarets
group, at $0.69. The average donation in the anonymous anti-minarets, public support group is
also very similar: $0.70. These two levels are significantly different from the average in the control
group (p-value<0.001 in both cases). The average donation in the anonymous anti-minarets, public
support group is also significantly lower than the one in the first wave version of the treatment (p-
value=0.014).
Panel B compares the share of participants who do not share anything from their $3 endowment
with the Swiss person. The percentage of participants deciding not to transfer anything to the
Swiss respondent increases from 22% in the control group to 42% in the anti-minarets group (p-
value<0.001), while only 27% of subjects in the anti-minarets, public support decide to keep all $3.
This percentage is not statistically different from the one in the control group (p-value=0.370), but
is substantially lower than the one for subjects in the anti-minarets group (p-value=0.013). Here
again, the levels of the outcome variable in the two anonymous treatments are almost identical
to the level in the anti-minarets group: 43% and 44%. Importantly, the share of participants
not donating is significantly higher in the anonymous anti-minarets, public support group when
compared to the non-anonymous version of the treatment (p-value=0.004).
Panel C displays a similar pattern for the median transfer, which is $1.50 in the control group,
$0.30 in the anti-minarets group, and $1.20 in the anti-minarets, public support group. While
the median transfer in the control group is higher than the median transfer in both other groups
(p-value against the anti-minarets is less than 0.001 and against the anti-minarets public, support
group is 0.030), providing information that 57.5% of Swiss respondents support the prohibition
on building minarets makes a statistically significant difference (p-value<0.001) when compared to
the anti-minarets group. The median donation in the two anonymous groups are identical ($0.50).
The median donation in the anonymous anti-minarets group is not significantly different from the
median in the anti-minarets group (p-value=0.496). The median donation in the anonymous anti-
minarets, public support group is significantly lower than the median in the anti-minarets, public
support group (p=0.021).
Overall, across all three outcome variables, the results are consistent with the four predictions
stemming from the model. Appendix Table B5 displays the results in regression format and show
that our results are not changed when individual covariates are included.
5 Conclusion
In this paper, we study how social norms, usually thought of as relatively stable and persistent,
can change rapidly. We construct a model of strategic communication and test its predictions
24
using two experiments. In the model, a positive shock to beliefs about popularity of a certain view
makes more agents willing to express this view. In our first experiment, we show that a positive,
experimentally-induced update in people’s beliefs about Donald Trump’s popularity increases their
willingness to publicly express xenophobic views. The effect of his actual victory is very similar,
which suggests that an upward update on the popularity of anti-immigrant views following the
election is the likely mechanism. We see no evidence that this election increased the likelihood
of having such views, at least not in the days immediately following the election, and therefore
conclude that the increased expression of certain views should be attributed to a shift of social
norms rather than individual preferences or attitudes, at least in the short run. Using dictator
games, we also test the model’s prediction that individuals are judged less for expressing a view
that is popular in their environment, and find that it is indeed the case.
Our findings shed light on the factors that can trigger rapid change in social norms, and in
particular, norms against the expression of xenophobic views. Our results suggest that social
norms regarding the expression of such views in the U.S. might have already been causally changed
by Trump’s rise in popularity and eventual electoral victory. More broadly, the mechanisms we
study in this paper might help explain the rise – and potential consequences – of other crucial
recent events such as the Brexit vote in the U.K., and more generally the rise in anti-immigrant
and anti-minority sentiment in the developed world.
Our analysis suggests at least two lines for subsequent work. One deals with the joint evolution
of individual views and social norms. While we see no evidence that Donald Trump’s election
changed people’s views on immigration in the very short run, it is well possible that the changed
social norm will expose people to views that will eventually influence their own. These individual
views could eventually affect both social norms and political decisions. Thus, understanding how
individuals acquire and change their preferences through social interactions is of utmost importance.
An interesting and important question, for example, is whether laws prohibiting certain speech (such
as those banning denial of the Holocaust in Germany and some other countries) are more or less
effective in forming public opinion as compared to cases where such speech is not banned but highly
stigmatized (as, e.g., in the U.S.)
A different set of questions stems from our second experiment. We observed that the subjects
were largely willing to forgive the Swiss individual if he stated anti-Muslim views as part of con-
forming to the social norm. Yet they were remarkably unwilling to forgive the individual for holding
such views, despite knowing little about the reasons why he acquired them. This alone would be
consistent with subjects viewing people from other countries as similar to them as individuals, but
living in different social environments, but this explanation is perhaps too simplistic. Nevertheless,
understanding how people judge thoughts and actions of people from their own and from differ-
ent societies and cultures, and perhaps ultimately why social norms emerge, is another interesting
avenue for future research.
25
References
Acemoglu, Daron, and Matthew O. Jackson. 2017. “Social Norms and the Enforcement ofLaws.” Journal of the European Economic Association, 15(2): 245.
Acemoglu, Daron, Tarek A Hassan, and Ahmed Tahoun. Forthcoming. “The Power of theStreet: Evidence from Egypt’s Arab Spring.” Review of Financial Studies.
Alesina, Alberto, Paola Giuliano, and Nathan Nunn. 2013. “On the Origins of GenderRoles: Women and the Plough.” The Quarterly Journal of Economics, 128(2): 469–530.
Algan, Yann, and Pierre Cahuc. 2010. “Inherited Trust and Growth.” American EconomicReview, 100(5): 2060–92.
Ali, S. Nageed, and Roland Benabou. 2016. “Image Versus Information: Changing SocietalNorms and Optimal Privacy.” National Bureau of Economic Research Working Paper 22203.
Allcott, Hunt, and Matthew Gentzkow. 2017. “Social Media and Fake News in the 2016Election.” Journal of Economic Perspectives, 31(2): 211–36.
Andreoni, James, Nikos Nikiforakis, and Simon Siegenthaler. 2017. “Social Change andthe Conformity Trap.” Mimeo.
Benabou, Roland, and Jean Tirole. 2011. “Laws and Norms.” National Bureau of EconomicResearch Working Paper 17579.
Bernheim, B. Douglas. 1994. “A Theory of Conformity.” Journal of Political Economy,102(5): 841–877.
Bursztyn, Leonardo, and Robert Jensen. 2015. “How Does Peer Pressure Affect EducationalInvestments?” The Quarterly Journal of Economics, 130(3): 1329.
Bursztyn, Leonardo, Michael Callen, Bruno Ferman, Saad Gulzar, Ali Hasanain, andNoam Yuchtman. 2016. “Political Identity: Experimental Evidence on Anti-Americanism inPakistan.” Mimeo.
Center for the Study of Hate and Extremism. 2017. “Special Status Report: Hate Crime inMetropolitan Areas.”
Cho, In-Koo, and David M. Kreps. 1987. “Signaling Games and Stable Equilibria*.” TheQuarterly Journal of Economics, 102(2): 179.
Crawford, Vincent P., and Joel Sobel. 1982. “Strategic Information Transmission.” Econo-metrica, 50(6): 1431–1451.
DellaVigna, Stefano, John A. List, and Ulrike Malmendier. 2012. “Testing for Altruismand Social Pressure in Charitable Giving.” The Quarterly Journal of Economics, 127(1): 1.
DellaVigna, Stefano, John A. List, Ulrike Malmendier, and Gautam Rao. 2017. “Votingto Tell Others.” The Review of Economic Studies, 84(1): 143.
26
Elias, Julio J., Nicola Lacetera, and Mario Macis. 2016. “Efficiency-Morality Trade-Offsin Repugnant Transactions: A Choice Experiment.” National Bureau of Economic ResearchWorking Paper 22632.
Enikolopov, Ruben, Alexey Makarin, Maria Petrova, and Leonid Polishchuk. 2017.“Social Image, Networks, and Protest Participation.” Mimeo.
Enke, Benjamin. 2017. “Moral Values and Trump Voting.” Mimeo.
Fernandez, Raquel. 2007. “Women, Work, and Culture.” Journal of the European EconomicAssociation, 5(2-3): 305–332.
Giuliano, Paola. 2007. “Living Arrangements in Western Europe: Does Cultural Origin Matter?”Journal of the European Economic Association, 5(5): 927–952.
Janus, Alexander L. 2010. “The Influence of Social Desirability Pressures on Expressed Immi-gration Attitudes*.” Social Science Quarterly, 91(4): 928–946.
Kartik, Navin. 2009. “Strategic Communication with Lying Costs.” The Review of EconomicStudies, 76(4): 1359.
Kartik, Navin, Marco Ottaviani, and Francesco Squintani. 2007. “Credulity, Lies, andCostly Talk.” Journal of Economic Theory, 134(1): 93 – 116.
Katz, Daniel, and Floyd H. Allport. 1931. Students’ Attitudes: A Report of the SyracuseUniversity Reaction Study. Syracuse, NY:Craftsman Press.
Kets, Willemien, and Alvaro Sandroni. 2016. “Challenging Conformity: A Case for Diversity.”Mimeo.
Kuran, Timur. 1991. “The East European Revolution of 1989: Is It Surprising That We WereSurprised?” American Economic Review, 81(2): 121–125.
Kuran, Timur. 1995. Private Truths, Public Lies: The Social Consequences of Preference Falsi-fication. Cambridge, MA:Harvard University Press.
Kuziemko, Ilyana, Michael I. Norton, Emmanuel Saez, and Stefanie Stantcheva. 2015.“How Elastic Are Preferences for Redistribution? Evidence from Randomized Survey Experi-ments.” American Economic Review, 105(4): 1478–1508.
Lohmann, Susanne. 1993. “A Signaling Model of Informative and Manipulative Political Action.”The American Political Science Review, 87(2): 319–333.
Lowes, Sara, Nathan Nunn, James A. Robinson, and Jonathan Weigel. 2017. “The Evolu-tion of Culture and Institutions: Evidence from the Kuba Kingdom.” Econometrica, 85(4): 1065–1091.
Madestam, Andreas, Daniel Shoag, Stan Veuger, and David Yanagizawa-Drott. 2013.“Do Political Protests Matter? Evidence from the Tea Party Movement.” The Quarterly Journalof Economics, 128(4): 1633.
27
Milgram, Stanley. 1977. The individual in a social world: essays and experiments. Reading,MA:Addison-Wesley.
Morris, Stephen. 2001. “Political Correctness.” Journal of Political Economy, 109(2): 231–265.
O’Gorman, Hubert J. 1975. “Pluralistic Ignorance and White Estimates of White Support forRacial Segregation.” Public Opinion Quarterly, 39(3): 313.
Perez-Truglia, Ricardo, and Guillermo Cruces. forthcoming. “Partisan Interactions: Evi-dence from a Field Experiment in the United States.” Journal of Political Economy.
Prendergast, Canice. 1993. “A Theory of ‘Yes Men’.” American Economic Review, 83(4): 757–770.
Raghavarao, D., and W. T. Federer. 1979. “Block Total Response as an Alternative to theRandomized Response Method in Surveys.” Journal of the Royal Statistical Society. Series B(Methodological), 41(1): 40–45.
Sniderman, Paul M., and Thomas L. Piazza. 1993. The Scar of Race. Cambridge,MA:Harvard University Press.
Voigtlander, Nico, and Hans-Joachim Voth. 2012. “Persecution Perpetuated: The Me-dieval Origins of Anti-Semitic Violence in Nazi Germany.” The Quarterly Journal of Economics,127(3): 1339–1392.
Warner, Stanley L. 1965. “Randomized Response: A Survey Technique for Eliminating EvasiveAnswer Bias.” Journal of the American Statistical Association, 60(309): 63–69.
Xiong, Heyu. 2017. “Media Personality and Its Political Premium.” Mimeo.
28
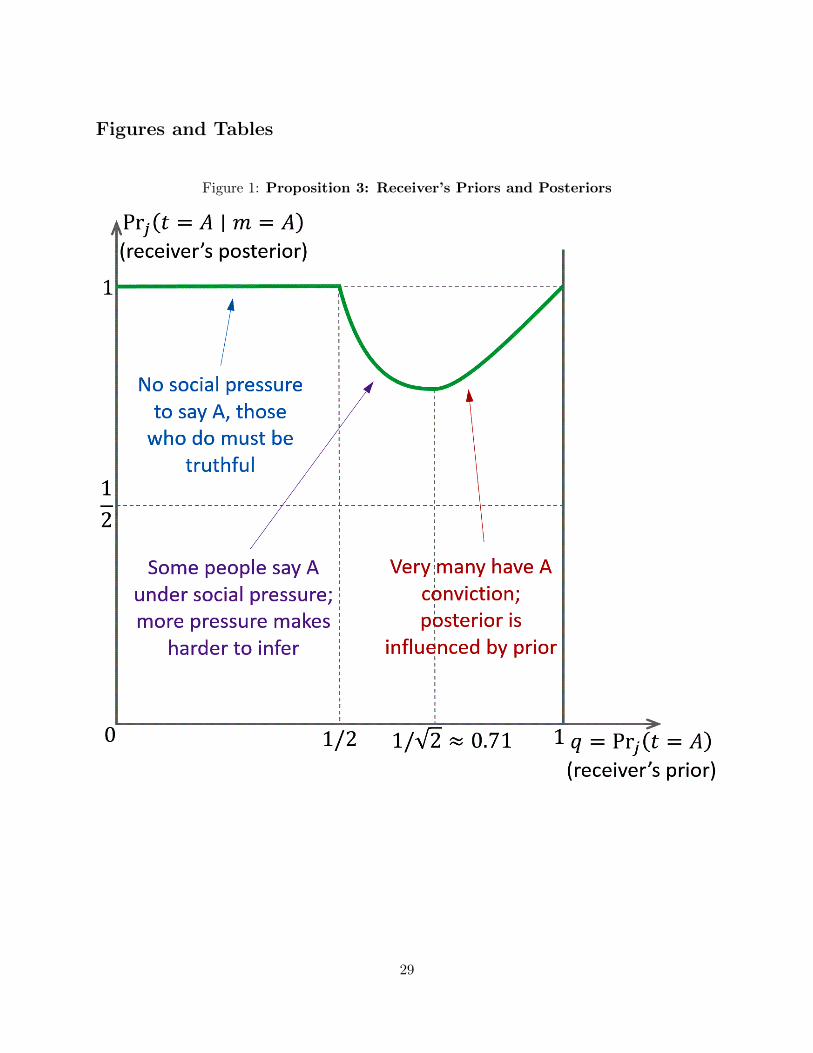
Figures and Tables
Figure 1: Proposition 3: Receiver’s Priors and Posteriors
29

Figure 2: Experiment 1: Donation Rates Before and After the Election
P=0.002 P=0.839 P=0.882
P=0.089
P=0.060
54% 34% 47% 46% 49% 48%
01
02
03
04
05
06
07
0
Do
na
tio
n R
ate
s
Control Before Election Information Before Election Control After Election
Private
Public
Notes: the two bars on the left display donation rates to the anti-immigration organizationfor individuals in the private and public conditions in the control group before the election(full sample, respectively N=112 and N=111), the two central bars display those in theinformation group before the election (full sample, respectively N=102 and N=103), andthe last two bars display those in the control group after the election (for individualsalready surveyed before the election, respectively N=82 and N=84). Error bars reflect 95%confidence intervals. Top horizontal bars show p-values for t tests of equality of meansbetween different experimental conditions.
30
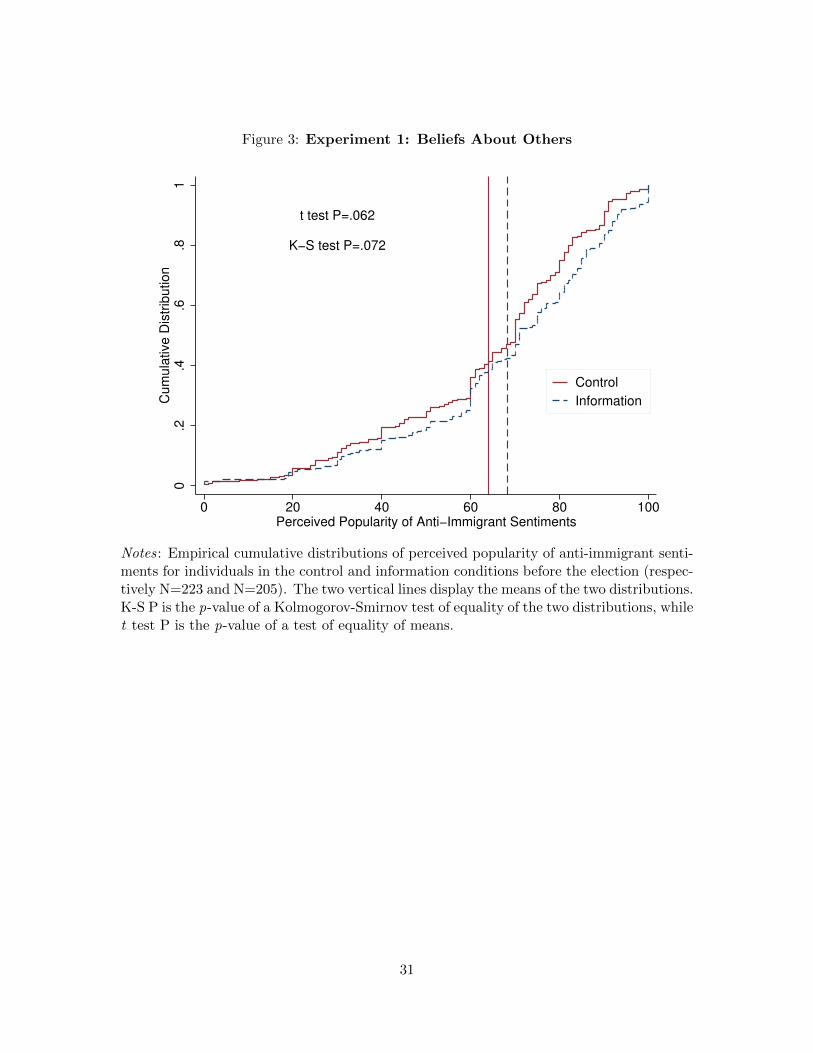
Figure 3: Experiment 1: Beliefs About Others
t test P=.062
K−S test P=.072
0.2
.4.6
.81
Cu
mu
lative
Dis
trib
utio
n
0 20 40 60 80 100Perceived Popularity of Anti−Immigrant Sentiments
Control
Information
Notes: Empirical cumulative distributions of perceived popularity of anti-immigrant senti-ments for individuals in the control and information conditions before the election (respec-tively N=223 and N=205). The two vertical lines display the means of the two distributions.K-S P is the p-value of a Kolmogorov-Smirnov test of equality of the two distributions, whilet test P is the p-value of a test of equality of means.
31

Figure 4: Experiment 2: Predictions on Receiver’s Priors and Posteriors
32

Figure 5: Experiment 2: Donation Rates
Panel A Panel B
P<0.001 P=0.013
P=0.162
P=0.922
P<0.001
P<0.001
P=0.962
P=0.014
$1.03 $0.69 $0.92 $0.69 $0.70
0.2
5.5
.75
11.2
51.5
Avera
ge D
onation A
mounts
Control Group Anti−Minarets Anti−MinaretsPublic Support
AnonymousAnti−Minarets
AnonymousAnti−MinaretsPublic Support
P<0.001 P=0.013
P=0.370
P=0.862
P<0.001
P<0.001
P=0.911
P=0.004
22% 42% 27% 43% 44%
0.1
.2.3
.4.5
.6.7
Share
Not D
onating
Control Group Anti−Minarets Anti−MinaretsPublic Support
AnonymousAnti−Minarets
AnonymousAnti−MinaretsPublic Support
Panel C
P<0.001 P=0.023
P=0.003
P=1.000
P<0.001
P<0.001
P=0.496
P=0.021
$1.50 $0.30 $1.20 $0.50 $0.50
0.2
5.5
.75
11.2
51.5
1.7
52
2.2
5M
edia
n D
onation A
mounts
Control Group Anti−Minarets Anti−MinaretsPublic Support
AnonymousAnti−Minarets
AnonymousAnti−MinaretsPublic Support
Notes: Panel A displays average donation amounts to the Swiss individual in the fiveexperimental conditions: the control group (N = 279, pooling 142 observations from thefirst version of experiment 2 and 137 observations from the second anonymous versionof experiment 2), the anti-minarets group (N=133), and the anti-minarets public supportgroup (N=131), the anonymous anti-minarets group (N=149), and the anonymous anti-minarets public support group (N=141). Panel B displays the percent of subjects notmaking positive donations. Panel C displays median donation amounts. Error bars reflect95% confidence intervals. Top horizontal bars show p-values for t tests of equality of meansbetween different experimental conditions.
33

Table 1: Experiment 1: Difference in Differences Regressions
Dependent Dummy: individual authorizes donation toVariable anti-immigrant organization
(1) (2) (3) (4)
Public -0.202*** -0.200*** -0.202*** -0.199***[0.065] [0.066] [0.065] [0.065](0.004) (0.005) (0.004) (0.007)
Information -0.074 -0.077 -0.074 -0.076[0.069] [0.068] [0.069] [0.068](0.277) (0.266) (0.277) (0.281)
Public*Information 0.188* 0.178* 0.188* 0.178*[0.096] [0.096] [0.096] [0.096](0.045) (0.062) (0.045) (0.062)
After Election -0.057 -0.062[0.073] [0.072](0.380) (0.304)
Public*After Election 0.191* 0.186*[0.102] [0.101](0.071) (0.080)
Mean Donation RateControl Private 0.545Before Election
Controls No Yes No YesN 428 428 594 594R2 0.022 0.033 0.017 0.034
Notes: Columns (1) and (2) includes the full pre-election sample.Columns (3) and (4) add the post-election sample of individuals alreadysurveyed before the election. Columns (1) presents OLS regression of adummy variable for whether a individual donates to the anti-immigrationorganization on a dummy for the Public condition, a dummy for the In-formation condition, and a dummy for the Public Information condition.The control private condition before the election is the omitted group,for which we report the mean donation rate. Columns (3) replicatesand adds a dummy for the after election condition, and a dummy forthe Public after election condition. Columns (2) and (4) replicate andadd individual covariates (gender, age, marital status, years of educa-tion, household income, and race). Robust standard errors in brackets.P -values from permutation tests with 1,000 repetitions in parentheses.* significant at 10%; ** significant at 5%; *** significant at 1% basedon robust standard errors.
34
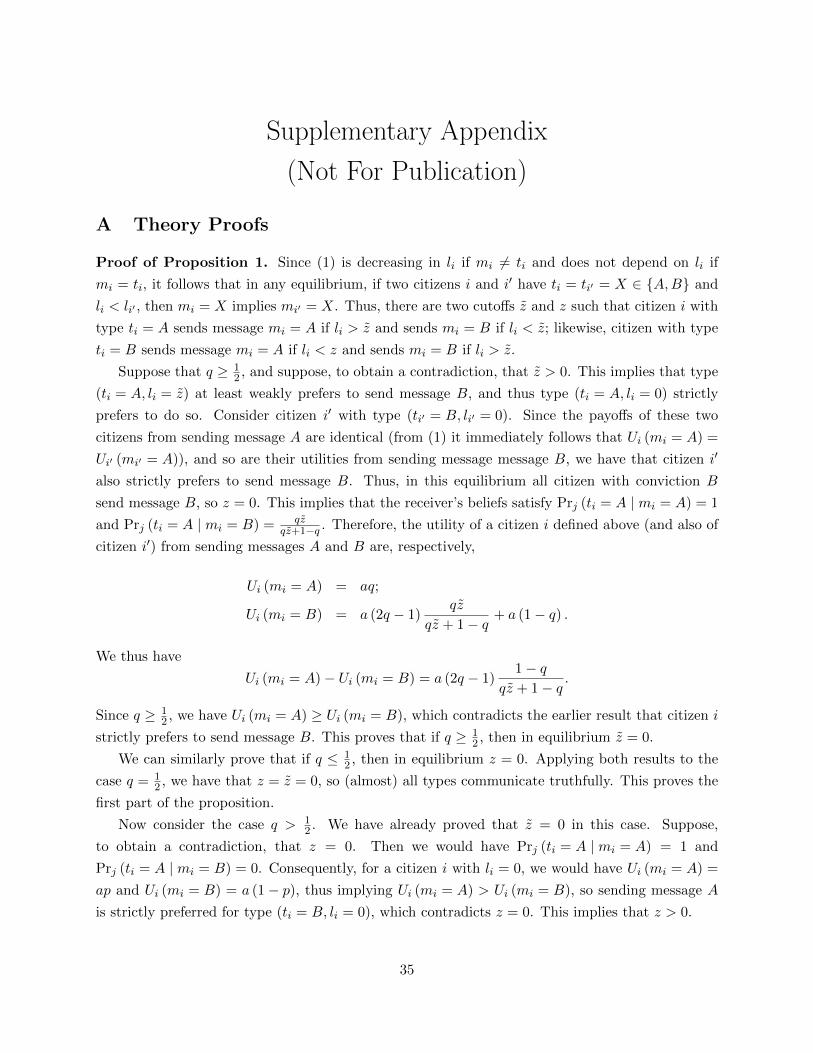
Supplementary Appendix
(Not For Publication)
A Theory Proofs
Proof of Proposition 1. Since (1) is decreasing in li if mi 6= ti and does not depend on li if
mi = ti, it follows that in any equilibrium, if two citizens i and i′ have ti = ti′ = X ∈ {A,B} and
li < li′ , then mi = X implies mi′ = X. Thus, there are two cutoffs z and z such that citizen i with
type ti = A sends message mi = A if li > z and sends mi = B if li < z; likewise, citizen with type
ti = B sends message mi = A if li < z and sends mi = B if li > z.
Suppose that q ≥ 12 , and suppose, to obtain a contradiction, that z > 0. This implies that type
(ti = A, li = z) at least weakly prefers to send message B, and thus type (ti = A, li = 0) strictly
prefers to do so. Consider citizen i′ with type (ti′ = B, li′ = 0). Since the payoffs of these two
citizens from sending message A are identical (from (1) it immediately follows that Ui (mi = A) =
Ui′ (mi′ = A)), and so are their utilities from sending message message B, we have that citizen i′
also strictly prefers to send message B. Thus, in this equilibrium all citizen with conviction B
send message B, so z = 0. This implies that the receiver’s beliefs satisfy Prj (ti = A | mi = A) = 1
and Prj (ti = A | mi = B) = qzqz+1−q . Therefore, the utility of a citizen i defined above (and also of
citizen i′) from sending messages A and B are, respectively,
Ui (mi = A) = aq;
Ui (mi = B) = a (2q − 1)qz
qz + 1− q+ a (1− q) .
We thus have
Ui (mi = A)− Ui (mi = B) = a (2q − 1)1− q
qz + 1− q.
Since q ≥ 12 , we have Ui (mi = A) ≥ Ui (mi = B), which contradicts the earlier result that citizen i
strictly prefers to send message B. This proves that if q ≥ 12 , then in equilibrium z = 0.
We can similarly prove that if q ≤ 12 , then in equilibrium z = 0. Applying both results to the
case q = 12 , we have that z = z = 0, so (almost) all types communicate truthfully. This proves the
first part of the proposition.
Now consider the case q > 12 . We have already proved that z = 0 in this case. Suppose,
to obtain a contradiction, that z = 0. Then we would have Prj (ti = A | mi = A) = 1 and
Prj (ti = A | mi = B) = 0. Consequently, for a citizen i with li = 0, we would have Ui (mi = A) =
ap and Ui (mi = B) = a (1− p), thus implying Ui (mi = A) > Ui (mi = B), so sending message A
is strictly preferred for type (ti = B, li = 0), which contradicts z = 0. This implies that z > 0.
35
Now suppose that z = 1, implying that (almost) all types send message A. In this case,
Prj (ti = A | mi = A) = q and Prj (ti = A | mi = B) is not defined by Bayesian updating. How-
ever, applying the D1 criterion, we have that the type (ti = B, li = 1) is the one that bene-
fits from deviating to mi = B most. Therefore, the only belief consistent with D1 criterion is
Prj (ti = A | mi = B) = 0. In this case, for this type (ti = B, li = 1), we have
Ui (mi = A) = aq2 + a (1− q)2 − 1,
Ui (mi = B) = a (1− q) .
This type weakly prefers to send message A if and only if aq (2q − 1) ≥ 1. This implies that
an equilibrium with z = 0 and z = 1, where (almost) all senders send mi = A, is only possible
if aq (2q − 1) ≥ 1. It is straightforward to verify that this is indeed an equilibrium under these
conditions.
Suppose that z ∈ (0, 1). This is only possible if the type (ti = B, li = z) is indifferent between
sending the two messages, which holds if and only if
− (1− q) z2 − qz + aq (2q − 1) = 0.
As argued in the main text, at z = 0 the left-hand side is positive and at z = 1 it equals aq (2q − 1)−1 and therefore is negative iff aq (2q − 1) < 0. Furthermore, this equation has exactly one positive
root and exactly one negative root. Consequently, z ∈ (0, 1) is only possible if aq (2q − 1) < 1, in
which case this value z is uniquely given by (2). It is straightforward to verify that this is indeed
an equilibrium. To finish the proof for the case q > 12 , it suffices to observe that aq (2q − 1)− 1 ≥ 0
if and only if
q ≥ 1
4
(1 +
√1 +
8
a
)=
1
2+ v.
Lastly, we need to consider the case q < 12 . However, it is completely symmetric to the case
q > 12 , and we omit the proof. �
Proof of Proposition 2. Suppose q ≥ 12 . Then the share of citizens who send message A,
which equals p + z (1− p), is increasing in p, since z does not depend on it. Likewise, if q ≤ 12 ,
then the threshold z does not depend on p, and then the share of citizens sending message A equals
p (1− z), it is also increasing in p. The first result follows.
Consider the effect of an increase in q. First, suppose that q > 12 . Let us prove that z is
36
increasing in q, to do so, let x = q1−q , then x is increasing in q. We have
z =
√1
4x2 + a (2q − 1)x− 1
2x
=a (2q − 1)x√
14x
2 + a (2q − 1)x + 12x
=a (2q − 1)√
14 + a (2q − 1) 1
x + 12
.
Since this is increasing in x, and also z is increasing in q directly, we have that z is increasing in q.
This proves the statement for q > 12 . If q ≤ 1
2 , the proof is similar and is omitted.
Finally, suppose that a increases. If q > 12 , then the share of citizens sending A is increasing
in a, since z is increasing in a. If q < 12 , the proof is similar. If q = 1
2 , then an increase in a has
no effect on the share of citizens that send message A in this case, which is q. This completes the
proof. �
Proof of Proposition 3. The result for a immediately follows from Prj (ti = A | mi = A) =q
q+(1−q)z (which is valid if q > 12) and the formula for z, (2). To get the comparative statics with
respect to q, consider
Prj (ti = A | mi = A) =q
q + (1− q) z
=1
1 + 1−qq z
=1
12 +
√14 + a (2q − 1) 1−q
q
.
Notice that the term (2q − 1) 1−qq is increasing in q for q <
√12 and decreasing in q for q >
√12 ;
indeed,d
dq
((2q − 1)
1− q
q
)=
1− 2q2
q2.
This implies that the converse (decreasing for q <√
12 and increasing for q >
√12) is true for
Prj (ti = A | mi = A).
Lastly, consider minimum possible value for Prj (ti = A | mi = A). Since we only need to con-
sider the case p = q > 12 , and also only the case where aq (2p− 1) < 1 (otherwise Prj (ti = A | mi = A) =
37

q > 12), we have
Prj (ti = A | mi = A) =1
12 +
√14 + a (2p− 1) 1−q
q
>1
12 +
√14 + 1−q
q2
>1
12 +
√14 + 2
=1
2,
where we plugged q = 12 , since 1−q
q2 is decreasing in q. This completes the proof. �
Proof of Proposition 4. The proof immediately follows from Proposition 1 and from the
text. �
38

B Appendix Figures and Tables
Figure B1: Experiment 1: Beliefs About Others After Election
t test P=.905
K−S test P=.961
0.2
.4.6
.81
Cu
mu
lative
Dis
trib
utio
n
0 20 40 60 80 100Perceived Popularity of Anti−Immigrant Sentiments
Control Before Election
Control After Election
Notes: Empirical cumulative distributions of perceived popularity of anti-immigrant sen-timents for individuals in the control condition before and after the election (respectivelyN=223 and N=166). The two vertical lines display the means of the two distributions. K-SP is the p-value of a Kolmogorov-Smirnov test of equality of the two distributions, while ttest P is the p-value of a test of equality of means.
39
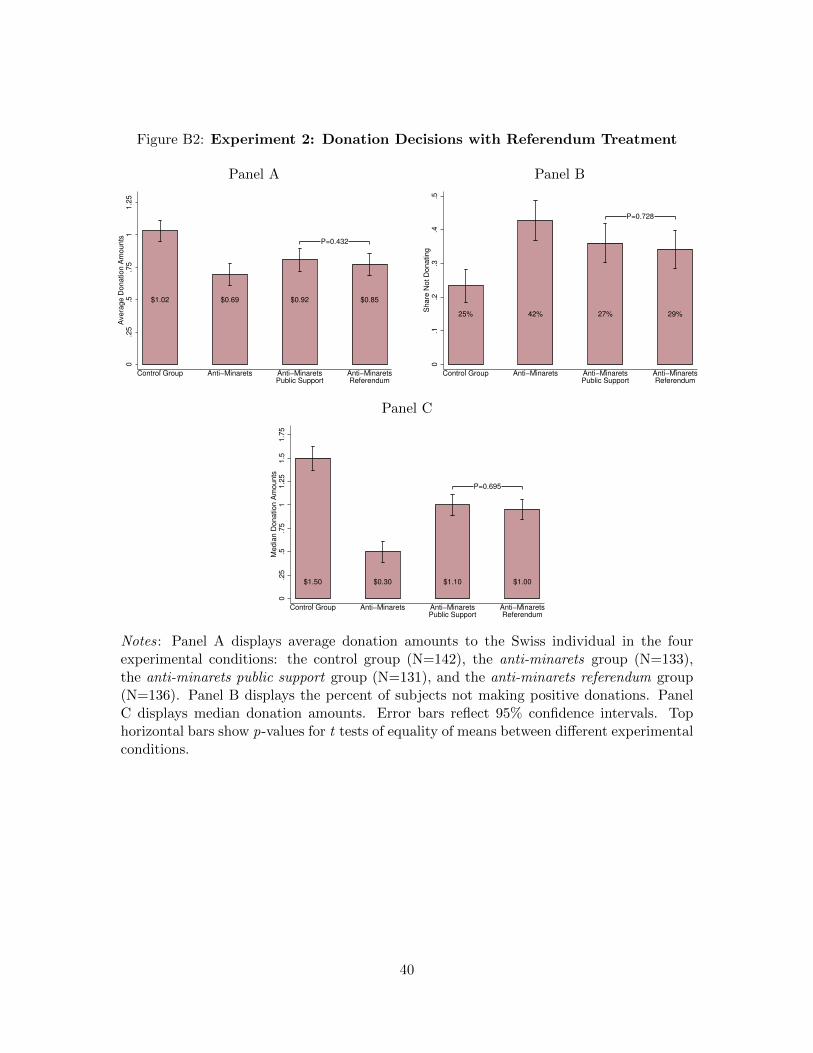
Figure B2: Experiment 2: Donation Decisions with Referendum Treatment
Panel A Panel B
P=0.432
$1.02 $0.69 $0.92 $0.85
0.2
5.5
.75
11.2
5A
vera
ge D
onation A
mounts
Control Group Anti−Minarets Anti−MinaretsPublic Support
Anti−MinaretsReferendum
P=0.728
25% 42% 27% 29%
0.1
.2.3
.4.5
Share
Not D
onating
Control Group Anti−Minarets Anti−MinaretsPublic Support
Anti−MinaretsReferendum
Panel C
P=0.695
$1.50 $0.30 $1.10 $1.00
0.2
5.5
.75
11.2
51.5
1.7
5M
edia
n D
onation A
mounts
Control Group Anti−Minarets Anti−MinaretsPublic Support
Anti−MinaretsReferendum
Notes: Panel A displays average donation amounts to the Swiss individual in the fourexperimental conditions: the control group (N=142), the anti-minarets group (N=133),the anti-minarets public support group (N=131), and the anti-minarets referendum group(N=136). Panel B displays the percent of subjects not making positive donations. PanelC displays median donation amounts. Error bars reflect 95% confidence intervals. Tophorizontal bars show p-values for t tests of equality of means between different experimentalconditions.
40
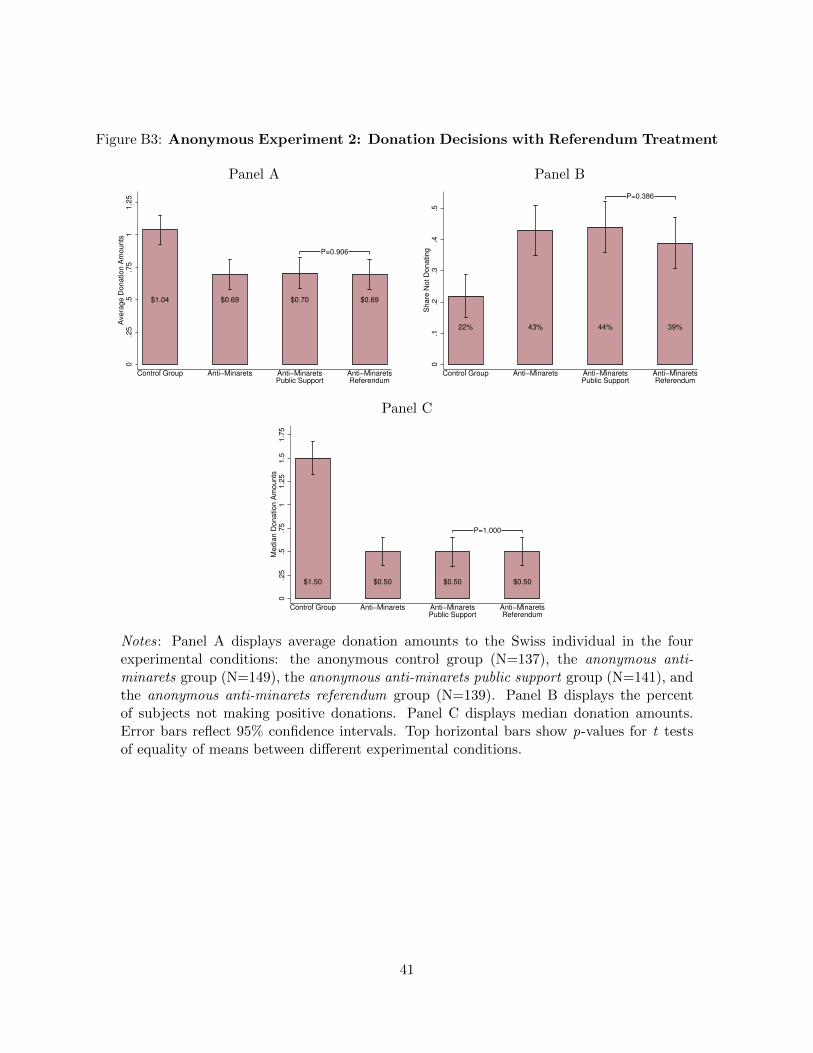
Figure B3: Anonymous Experiment 2: Donation Decisions with Referendum Treatment
Panel A Panel B
P=0.906
$1.04 $0.69 $0.70 $0.69
0.2
5.5
.75
11.2
5A
vera
ge D
onation A
mounts
Control Group Anti−Minarets Anti−MinaretsPublic Support
Anti−MinaretsReferendum
P=0.386
22% 43% 44% 39%
0.1
.2.3
.4.5
Share
Not D
onating
Control Group Anti−Minarets Anti−MinaretsPublic Support
Anti−MinaretsReferendum
Panel C
P=1.000
$1.50 $0.50 $0.50 $0.50
0.2
5.5
.75
11.2
51.5
1.7
5M
edia
n D
onation A
mounts
Control Group Anti−Minarets Anti−MinaretsPublic Support
Anti−MinaretsReferendum
Notes: Panel A displays average donation amounts to the Swiss individual in the fourexperimental conditions: the anonymous control group (N=137), the anonymous anti-minarets group (N=149), the anonymous anti-minarets public support group (N=141), andthe anonymous anti-minarets referendum group (N=139). Panel B displays the percentof subjects not making positive donations. Panel C displays median donation amounts.Error bars reflect 95% confidence intervals. Top horizontal bars show p-values for t testsof equality of means between different experimental conditions.
41
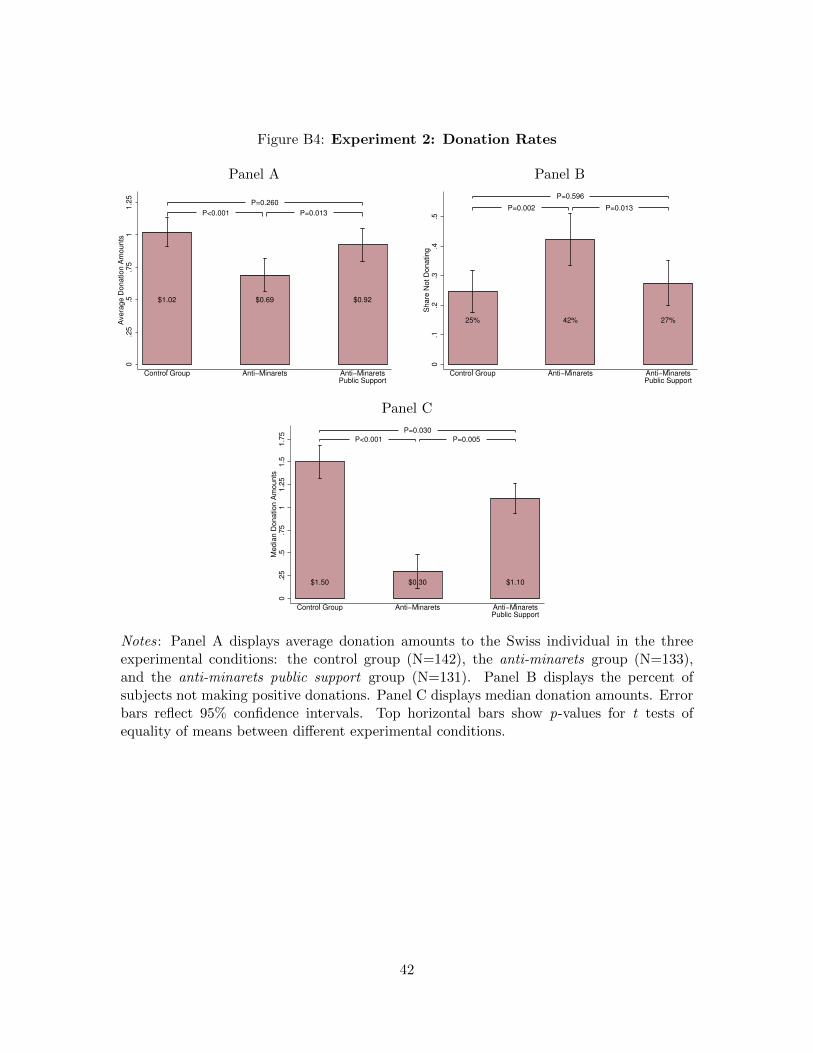
Figure B4: Experiment 2: Donation Rates
Panel A Panel B
P<0.001 P=0.013
P=0.260
$1.02 $0.69 $0.92
0.2
5.5
.75
11.2
5A
vera
ge D
onation A
mounts
Control Group Anti−Minarets Anti−MinaretsPublic Support
P=0.002 P=0.013
P=0.596
25% 42% 27%
0.1
.2.3
.4.5
Share
Not D
onating
Control Group Anti−Minarets Anti−MinaretsPublic Support
Panel C
P<0.001 P=0.005
P=0.030
$1.50 $0.30 $1.10
0.2
5.5
.75
11.2
51.5
1.7
5M
edia
n D
onation A
mounts
Control Group Anti−Minarets Anti−MinaretsPublic Support
Notes: Panel A displays average donation amounts to the Swiss individual in the threeexperimental conditions: the control group (N=142), the anti-minarets group (N=133),and the anti-minarets public support group (N=131). Panel B displays the percent ofsubjects not making positive donations. Panel C displays median donation amounts. Errorbars reflect 95% confidence intervals. Top horizontal bars show p-values for t tests ofequality of means between different experimental conditions.
42

Figure B5: Anonymous Experiment 2: Donation Rates
Panel A Panel B
P<0.001 P=0.922P<0.001
$1.04 $0.69 $0.70
0.2
5.5
.75
11.2
5A
vera
ge D
onation A
mounts
Control Group AnonymousAnti−Minarets
AnonymousAnti−MinaretsPublic Support
P<0.001 P=0.862P<0.001
22% 43% 44%
0.1
.2.3
.4.5
Share
Not D
onating
Control Group AnonymousAnti−Minarets
AnonymousAnti−MinaretsPublic Support
Panel C
P<0.001 P=1.000P<0.001
$1.50 $0.50 $0.50
0.2
5.5
.75
11.2
51.5
1.7
5M
edia
n D
onation A
mounts
Control Group AnonymousAnti−Minarets
AnonymousAnti−MinaretsPublic Support
Notes: Panel A displays average donation amounts to the Swiss individual in the threeexperimental conditions: the anonymous control group (N=137), the anonymous anti-minarets group (N=149), and the anonymous anti-minarets public support group (N=141).Panel B displays the percent of subjects not making positive donations. Panel C displaysmedian donation amounts. Error bars reflect 95% confidence intervals. Top horizontal barsshow p-values for t tests of equality of means between different experimental conditions.
43
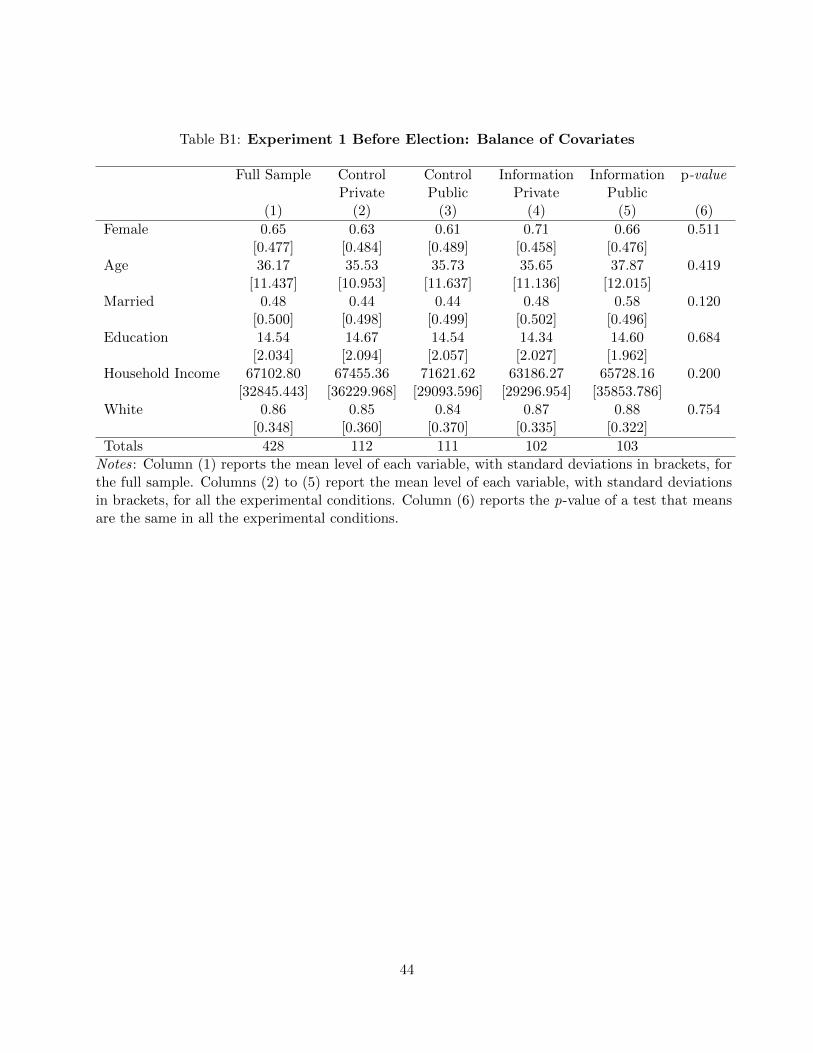
Table B1: Experiment 1 Before Election: Balance of Covariates
Full Sample Control Control Information Information p-valuePrivate Public Private Public
(1) (2) (3) (4) (5) (6)
Female 0.65 0.63 0.61 0.71 0.66 0.511[0.477] [0.484] [0.489] [0.458] [0.476]
Age 36.17 35.53 35.73 35.65 37.87 0.419[11.437] [10.953] [11.637] [11.136] [12.015]
Married 0.48 0.44 0.44 0.48 0.58 0.120[0.500] [0.498] [0.499] [0.502] [0.496]
Education 14.54 14.67 14.54 14.34 14.60 0.684[2.034] [2.094] [2.057] [2.027] [1.962]
Household Income 67102.80 67455.36 71621.62 63186.27 65728.16 0.200[32845.443] [36229.968] [29093.596] [29296.954] [35853.786]
White 0.86 0.85 0.84 0.87 0.88 0.754[0.348] [0.360] [0.370] [0.335] [0.322]
Totals 428 112 111 102 103
Notes: Column (1) reports the mean level of each variable, with standard deviations in brackets, forthe full sample. Columns (2) to (5) report the mean level of each variable, with standard deviationsin brackets, for all the experimental conditions. Column (6) reports the p-value of a test that meansare the same in all the experimental conditions.
44
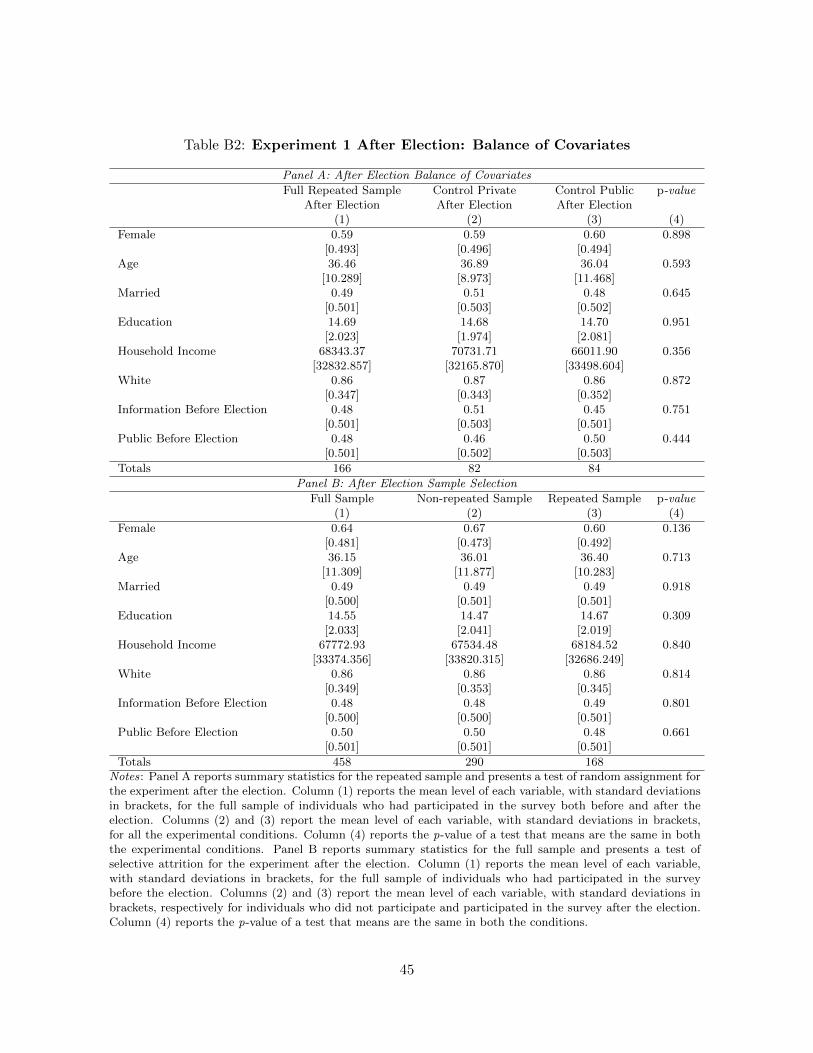
Table B2: Experiment 1 After Election: Balance of Covariates
Panel A: After Election Balance of Covariates
Full Repeated Sample Control Private Control Public p-valueAfter Election After Election After Election
(1) (2) (3) (4)
Female 0.59 0.59 0.60 0.898[0.493] [0.496] [0.494]
Age 36.46 36.89 36.04 0.593[10.289] [8.973] [11.468]
Married 0.49 0.51 0.48 0.645[0.501] [0.503] [0.502]
Education 14.69 14.68 14.70 0.951[2.023] [1.974] [2.081]
Household Income 68343.37 70731.71 66011.90 0.356[32832.857] [32165.870] [33498.604]
White 0.86 0.87 0.86 0.872[0.347] [0.343] [0.352]
Information Before Election 0.48 0.51 0.45 0.751[0.501] [0.503] [0.501]
Public Before Election 0.48 0.46 0.50 0.444[0.501] [0.502] [0.503]
Totals 166 82 84
Panel B: After Election Sample Selection
Full Sample Non-repeated Sample Repeated Sample p-value(1) (2) (3) (4)
Female 0.64 0.67 0.60 0.136[0.481] [0.473] [0.492]
Age 36.15 36.01 36.40 0.713[11.309] [11.877] [10.283]
Married 0.49 0.49 0.49 0.918[0.500] [0.501] [0.501]
Education 14.55 14.47 14.67 0.309[2.033] [2.041] [2.019]
Household Income 67772.93 67534.48 68184.52 0.840[33374.356] [33820.315] [32686.249]
White 0.86 0.86 0.86 0.814[0.349] [0.353] [0.345]
Information Before Election 0.48 0.48 0.49 0.801[0.500] [0.500] [0.501]
Public Before Election 0.50 0.50 0.48 0.661[0.501] [0.501] [0.501]
Totals 458 290 168Notes: Panel A reports summary statistics for the repeated sample and presents a test of random assignment forthe experiment after the election. Column (1) reports the mean level of each variable, with standard deviationsin brackets, for the full sample of individuals who had participated in the survey both before and after theelection. Columns (2) and (3) report the mean level of each variable, with standard deviations in brackets,for all the experimental conditions. Column (4) reports the p-value of a test that means are the same in boththe experimental conditions. Panel B reports summary statistics for the full sample and presents a test ofselective attrition for the experiment after the election. Column (1) reports the mean level of each variable,with standard deviations in brackets, for the full sample of individuals who had participated in the surveybefore the election. Columns (2) and (3) report the mean level of each variable, with standard deviations inbrackets, respectively for individuals who did not participate and participated in the survey after the election.Column (4) reports the p-value of a test that means are the same in both the conditions.
45
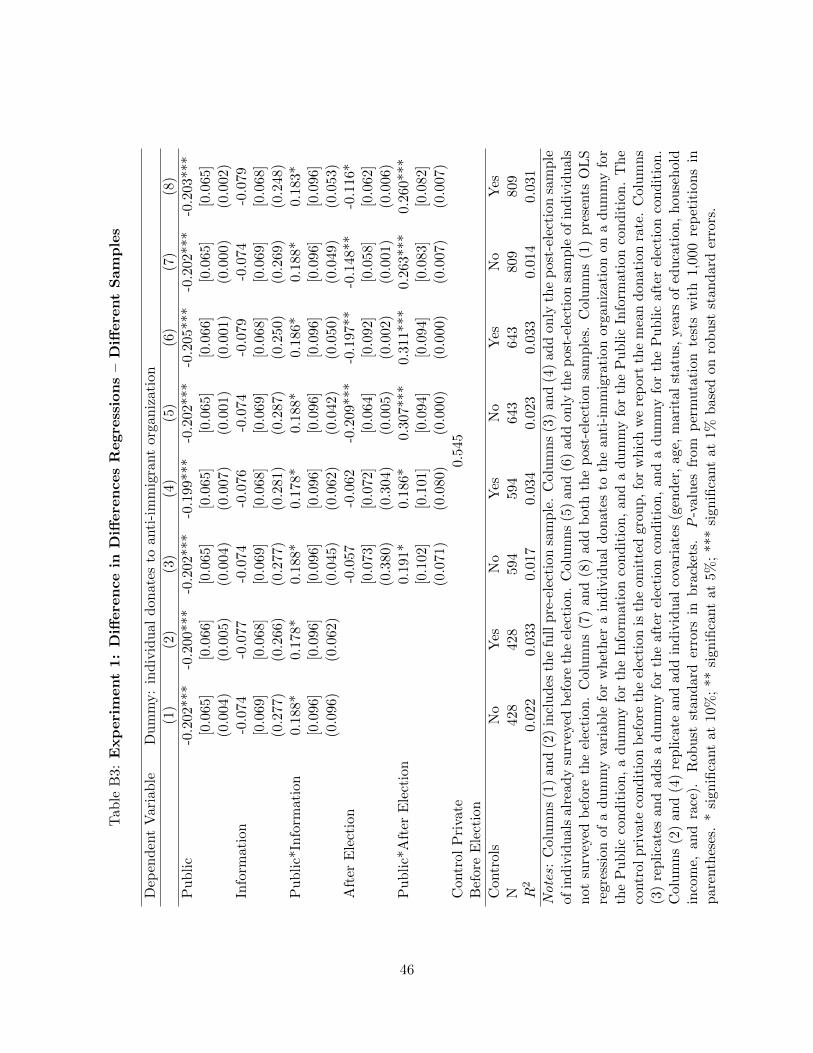
Tab
leB
3:E
xp
eri
ment
1:
Diff
ere
nce
inD
iffere
nces
Regre
ssio
ns
–D
iffere
nt
Sam
ple
s
Dep
end
ent
Var
iab
leD
um
my:
ind
ivid
ual
don
ates
toan
ti-i
mm
igra
nt
orga
niz
atio
n
(1)
(2)
(3)
(4)
(5)
(6)
(7)
(8)
Pu
bli
c-0
.202
***
-0.2
00**
*-0
.202
***
-0.1
99**
*-0
.202
***
-0.2
05**
*-0
.202***
-0.2
03***
[0.0
65]
[0.0
66]
[0.0
65]
[0.0
65]
[0.0
65]
[0.0
66]
[0.0
65]
[0.0
65]
(0.0
04)
(0.0
05)
(0.0
04)
(0.0
07)
(0.0
01)
(0.0
01)
(0.0
00)
(0.0
02)
Info
rmat
ion
-0.0
74-0
.077
-0.0
74-0
.076
-0.0
74-0
.079
-0.0
74
-0.0
79
[0.0
69]
[0.0
68]
[0.0
69]
[0.0
68]
[0.0
69]
[0.0
68]
[0.0
69]
[0.0
68]
(0.2
77)
(0.2
66)
(0.2
77)
(0.2
81)
(0.2
87)
(0.2
50)
(0.2
69)
(0.2
48)
Pu
bli
c*In
form
atio
n0.
188*
0.17
8*0.
188*
0.17
8*0.
188*
0.18
6*0.1
88*
0.1
83*
[0.0
96]
[0.0
96]
[0.0
96]
[0.0
96]
[0.0
96]
[0.0
96]
[0.0
96]
[0.0
96]
(0.0
96)
(0.0
62)
(0.0
45)
(0.0
62)
(0.0
42)
(0.0
50)
(0.0
49)
(0.0
53)
Aft
erE
lect
ion
-0.0
57-0
.062
-0.2
09**
*-0
.197
**-0
.148**
-0.1
16*
[0.0
73]
[0.0
72]
[0.0
64]
[0.0
92]
[0.0
58]
[0.0
62]
(0.3
80)
(0.3
04)
(0.0
05)
(0.0
02)
(0.0
01)
(0.0
06)
Pu
bli
c*A
fter
Ele
ctio
n0.
191*
0.18
6*0.
307*
**0.
311*
**0.2
63***
0.2
60***
[0.1
02]
[0.1
01]
[0.0
94]
[0.0
94]
[0.0
83]
[0.0
82]
(0.0
71)
(0.0
80)
(0.0
00)
(0.0
00)
(0.0
07)
(0.0
07)
Con
trol
Pri
vate
0.54
5B
efor
eE
lect
ion
Con
trol
sN
oY
esN
oY
esN
oY
esN
oY
esN
428
428
594
594
643
643
809
809
R2
0.02
20.
033
0.01
70.
034
0.02
30.
033
0.0
14
0.0
31
Note
s:C
olu
mn
s(1
)an
d(2
)in
clu
des
the
full
pre
-ele
ctio
nsa
mp
le.
Col
um
ns
(3)
and
(4)
add
only
the
post
-ele
ctio
nsa
mple
ofin
div
idu
als
alre
ady
surv
eyed
bef
ore
the
elec
tion
.C
olu
mn
s(5
)an
d(6
)ad
don
lyth
ep
ost-
elec
tion
sam
ple
of
ind
ivid
uals
not
surv
eyed
bef
ore
the
elec
tion
.C
olu
mn
s(7
)an
d(8
)ad
db
oth
the
pos
t-el
ecti
onsa
mp
les.
Col
um
ns
(1)
pre
sents
OL
Sre
gres
sion
ofa
du
mm
yva
riab
lefo
rw
het
her
ain
div
idu
ald
onat
esto
the
anti
-im
mig
rati
onor
gan
izati
on
on
ad
um
my
for
the
Pu
bli
cco
nd
itio
n,
ad
um
my
for
the
Info
rmat
ion
con
dit
ion
,an
da
du
mm
yfo
rth
eP
ub
lic
Info
rmati
on
con
dit
ion
.T
he
contr
olp
riva
teco
nd
itio
nb
efor
eth
eel
ecti
onis
the
omit
ted
grou
p,
for
wh
ich
we
rep
ort
the
mea
nd
onati
on
rate
.C
olu
mn
s(3
)re
pli
cate
san
dad
ds
ad
um
my
for
the
afte
rel
ecti
onco
nd
itio
n,
and
ad
um
my
for
the
Pu
bli
caf
ter
elec
tion
con
dit
ion
.C
olu
mn
s(2
)an
d(4
)re
pli
cate
and
add
ind
ivid
ual
cova
riat
es(g
end
er,
age,
mar
ital
stat
us,
year
sof
edu
cati
on,
hou
seh
old
inco
me,
and
race
).R
obu
stst
and
ard
erro
rsin
bra
cket
s.P
-val
ues
from
per
mu
tati
onte
sts
wit
h1,0
00
rep
etit
ion
sin
par
enth
eses
.*
sign
ifica
nt
at10
%;
**si
gnifi
cant
at5%
;**
*si
gnifi
cant
at1%
bas
edon
rob
ust
stan
dard
erro
rs.
46
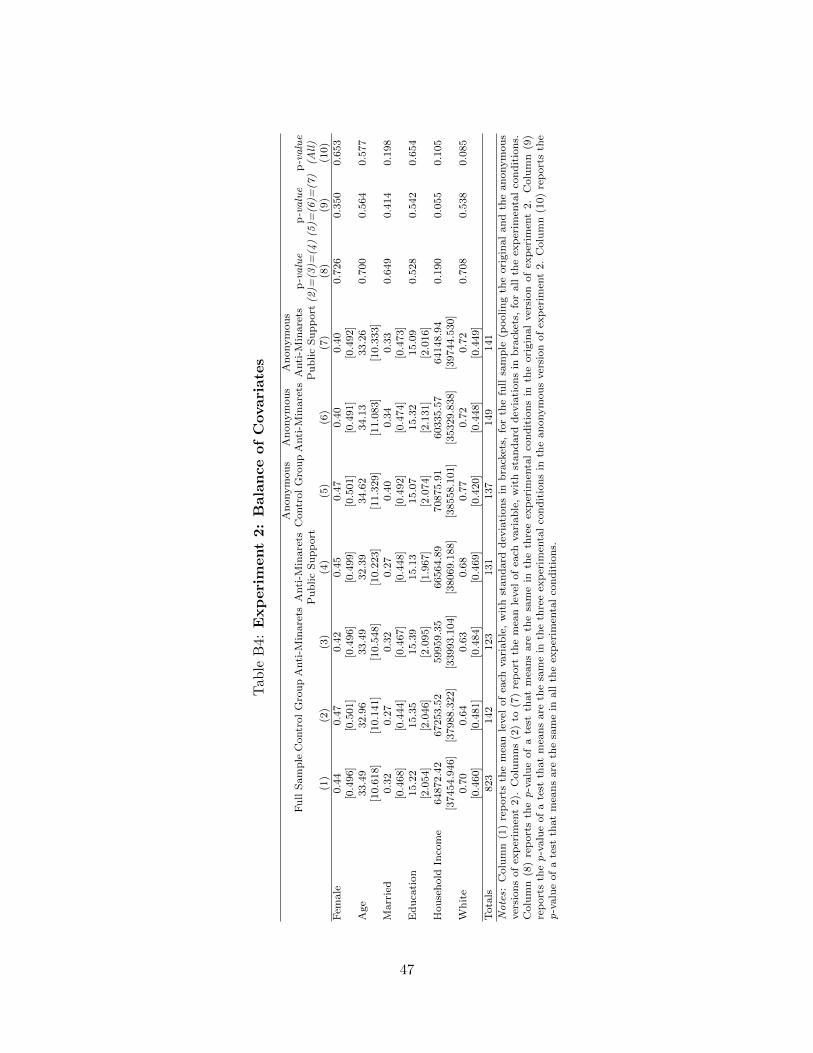
Tab
leB
4:E
xp
eri
ment
2:
Bala
nce
of
Covari
ate
s
Anonymous
Anonymous
Anonymous
FullSample
ControlGroupAnti-M
inarets
Anti-M
inarets
ControlGroupAnti-M
inarets
Anti-M
inarets
p-value
p-value
p-value
PublicSupport
PublicSupport
(2)=
(3)=
(4)(5)=
(6)=
(7)
(All)
(1)
(2)
(3)
(4)
(5)
(6)
(7)
(8)
(9)
(10)
Fem
ale
0.44
0.47
0.42
0.45
0.47
0.40
0.40
0.726
0.350
0.653
[0.496]
[0.501]
[0.496]
[0.499]
[0.501]
[0.491]
[0.492]
Age
33.49
32.96
33.49
32.39
34.62
34.13
33.26
0.700
0.564
0.577
[10.618]
[10.141]
[10.548]
[10.223]
[11.329]
[11.083]
[10.333]
Married
0.32
0.27
0.32
0.27
0.40
0.34
0.33
0.649
0.414
0.198
[0.468]
[0.444]
[0.467]
[0.448]
[0.492]
[0.474]
[0.473]
Educa
tion
15.22
15.35
15.39
15.13
15.07
15.32
15.09
0.528
0.542
0.654
[2.054]
[2.046]
[2.095]
[1.967]
[2.074]
[2.131]
[2.016]
Household
Inco
me
64872.42
67253.52
59959.35
66564.89
70875.91
60335.57
64148.94
0.190
0.055
0.105
[37454.946]
[37988.322]
[33993.104]
[38069.188]
[38558.101]
[35329.838]
[39744.530]
White
0.70
0.64
0.63
0.68
0.77
0.72
0.72
0.708
0.538
0.085
[0.460]
[0.481]
[0.484]
[0.469]
[0.420]
[0.448]
[0.449]
Totals
823
142
123
131
137
149
141
Notes:Column(1)reportsth
emea
nlevel
ofea
chvariable,withstandard
dev
iationsin
brackets,
forth
efullsample
(poolingth
eoriginalandth
eanonymous
versionsofex
perim
ent2).
Columns(2)to
(7)report
themea
nlevel
ofea
chvariable,withstandard
dev
iationsin
brackets,
forallth
eex
perim
entalco
nditions.
Column
(8)reportsth
ep-valueofatest
thatmea
nsare
thesamein
theth
reeex
perim
entalco
nditionsin
theoriginalversion
ofex
perim
ent2.Column
(9)
reportsth
ep-valueofatest
thatmea
nsare
thesamein
theth
reeex
perim
entalco
nditionsin
theanonymousversionofex
perim
ent2.Column(10)reportsth
ep-valueofatest
thatmea
nsare
thesamein
allth
eex
perim
entalco
nditions.
47
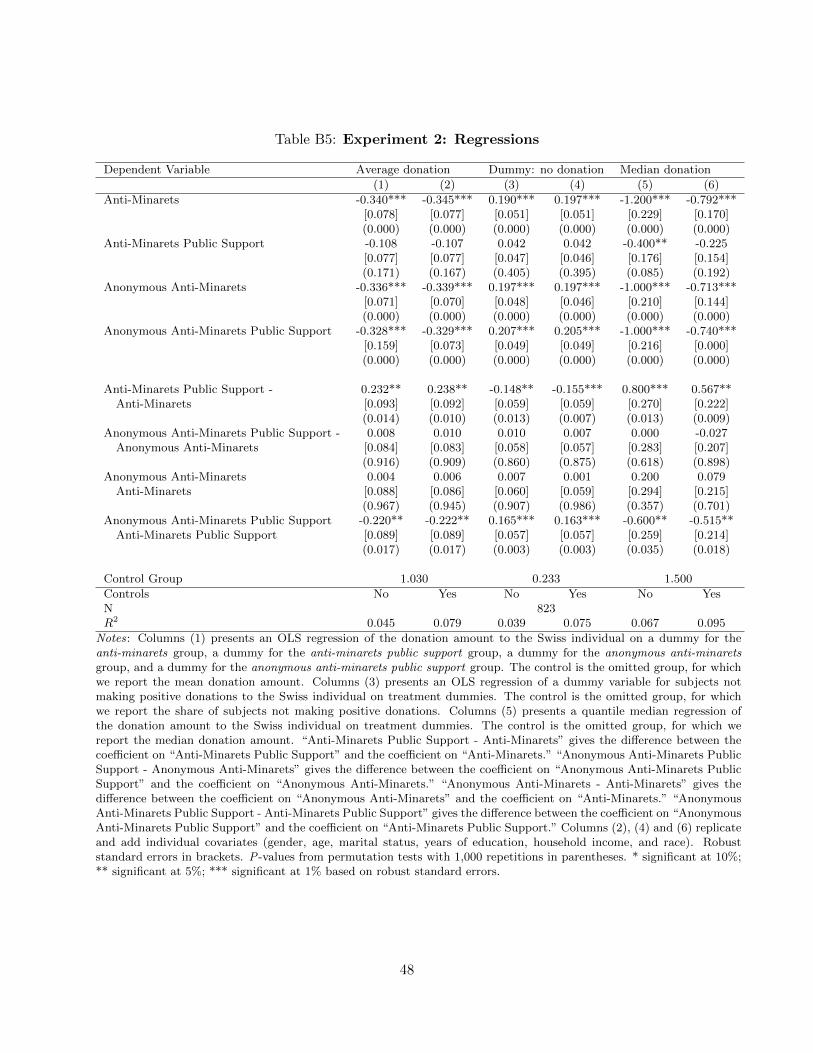
Table B5: Experiment 2: Regressions
Dependent Variable Average donation Dummy: no donation Median donation
(1) (2) (3) (4) (5) (6)
Anti-Minarets -0.340*** -0.345*** 0.190*** 0.197*** -1.200*** -0.792***[0.078] [0.077] [0.051] [0.051] [0.229] [0.170](0.000) (0.000) (0.000) (0.000) (0.000) (0.000)
Anti-Minarets Public Support -0.108 -0.107 0.042 0.042 -0.400** -0.225[0.077] [0.077] [0.047] [0.046] [0.176] [0.154](0.171) (0.167) (0.405) (0.395) (0.085) (0.192)
Anonymous Anti-Minarets -0.336*** -0.339*** 0.197*** 0.197*** -1.000*** -0.713***[0.071] [0.070] [0.048] [0.046] [0.210] [0.144](0.000) (0.000) (0.000) (0.000) (0.000) (0.000)
Anonymous Anti-Minarets Public Support -0.328*** -0.329*** 0.207*** 0.205*** -1.000*** -0.740***[0.159] [0.073] [0.049] [0.049] [0.216] [0.000](0.000) (0.000) (0.000) (0.000) (0.000) (0.000)
Anti-Minarets Public Support - 0.232** 0.238** -0.148** -0.155*** 0.800*** 0.567**Anti-Minarets [0.093] [0.092] [0.059] [0.059] [0.270] [0.222]
(0.014) (0.010) (0.013) (0.007) (0.013) (0.009)Anonymous Anti-Minarets Public Support - 0.008 0.010 0.010 0.007 0.000 -0.027
Anonymous Anti-Minarets [0.084] [0.083] [0.058] [0.057] [0.283] [0.207](0.916) (0.909) (0.860) (0.875) (0.618) (0.898)
Anonymous Anti-Minarets 0.004 0.006 0.007 0.001 0.200 0.079Anti-Minarets [0.088] [0.086] [0.060] [0.059] [0.294] [0.215]
(0.967) (0.945) (0.907) (0.986) (0.357) (0.701)Anonymous Anti-Minarets Public Support -0.220** -0.222** 0.165*** 0.163*** -0.600** -0.515**
Anti-Minarets Public Support [0.089] [0.089] [0.057] [0.057] [0.259] [0.214](0.017) (0.017) (0.003) (0.003) (0.035) (0.018)
Control Group 1.030 0.233 1.500
Controls No Yes No Yes No YesN 823R2 0.045 0.079 0.039 0.075 0.067 0.095
Notes: Columns (1) presents an OLS regression of the donation amount to the Swiss individual on a dummy for theanti-minarets group, a dummy for the anti-minarets public support group, a dummy for the anonymous anti-minaretsgroup, and a dummy for the anonymous anti-minarets public support group. The control is the omitted group, for whichwe report the mean donation amount. Columns (3) presents an OLS regression of a dummy variable for subjects notmaking positive donations to the Swiss individual on treatment dummies. The control is the omitted group, for whichwe report the share of subjects not making positive donations. Columns (5) presents a quantile median regression ofthe donation amount to the Swiss individual on treatment dummies. The control is the omitted group, for which wereport the median donation amount. “Anti-Minarets Public Support - Anti-Minarets” gives the difference between thecoefficient on “Anti-Minarets Public Support” and the coefficient on “Anti-Minarets.” “Anonymous Anti-Minarets PublicSupport - Anonymous Anti-Minarets” gives the difference between the coefficient on “Anonymous Anti-Minarets PublicSupport” and the coefficient on “Anonymous Anti-Minarets.” “Anonymous Anti-Minarets - Anti-Minarets” gives thedifference between the coefficient on “Anonymous Anti-Minarets” and the coefficient on “Anti-Minarets.” “AnonymousAnti-Minarets Public Support - Anti-Minarets Public Support” gives the difference between the coefficient on “AnonymousAnti-Minarets Public Support” and the coefficient on “Anti-Minarets Public Support.” Columns (2), (4) and (6) replicateand add individual covariates (gender, age, marital status, years of education, household income, and race). Robuststandard errors in brackets. P-values from permutation tests with 1,000 repetitions in parentheses. * significant at 10%;** significant at 5%; *** significant at 1% based on robust standard errors.
48

C Survey Scripts
Demographics
• What is your state of legal residence?
• What is your gender?
– Male
– Female
• What is your year of birth?
• What is your marital status?
– Single
– Married
• How would you describe your ethnicity/race? Please, check all that apply.
– White or European American
– Black or African American
– Hispanic or Latino
– Asian or Asian American
– Other
• What is the highest level of school you have completed or the highest degree you have received?
– Less than high school degree
– High school graduate (high school diploma or equivalent including GED)
– Some college but no degree
– Associate degree in college (2-year)
– Bachelor’s degree in college (4-year)
– Master’s degree
– Doctoral degree
– Professional degree (JD, MD)
49

• What is your household annual income? Please indicate the answer that includes your entire household
income in 2015 before taxes.
– Less than $10,000
– $10,000 to $19,999
– $20,000 to $29,999
– $30,000 to $39,999
– $40,000 to $49,999
– $50,000 to $59,999
– $60,000 to $69,999
– $70,000 to $79,999
– $80,000 to $89,999
– $90,000 to $99,999
– $100,000 to $149,999
– $150,000 or more
50

Experiment 1: Control Private
• From 0 to 100, what share of people in the population of [state] do you think agrees with the following
statement?
“Both legal and illegal immigration should be drastically reduced because immigrants undermine
American culture and do not respect American values.”
• We will now randomly select one among two different organization, and will give you the possibility
to make a donation to the selected organization:
– one is an organization which seeks to reduce overall migration to the United States;
– one is an organization which welcomes immigrants to the United States.
• The organization randomly chosen for you is the Federation for American Immigration Reform (FAIR).
The Federation for American Immigration Reform is an immigration-reduction organization of
concerned individuals who believe that immigration laws must be reformed and seeks to reduce overall
immigration (both legal and illegal) into the United States. The founder of FAIR is John Tanton,
author of “The Immigration Invasion” who wrote “I’ve come to the point of view that for European-
American society and culture to persist requires a European-American majority, and a clear one at that.”
Would you like to have us donate $1 on your behalf to the Federation for American Immigration
Reform? If you decide to have $1 donated to the immigration-reduction organization FAIR, we will also
transfer $1 extra to your MTurk account. So, if you decide to donate, instead of $0.50 you will be paid
in total $1.50. If instead you prefer not to donate, you will be paid only $0.50 for completing the survey.
Note: just like any other answer to this survey, also your donation decision will be com-
pletely anonymous. No one, not even the researchers, will be able to match your decision to your
name.
So would you like to have us donate $1 on your behalf to the Federation for American Immigra-
tion Reform?
– Yes
– No
• From 0 to 100, what do you think is the probability of Donald Trump winning the presidential election
in [state]?
51
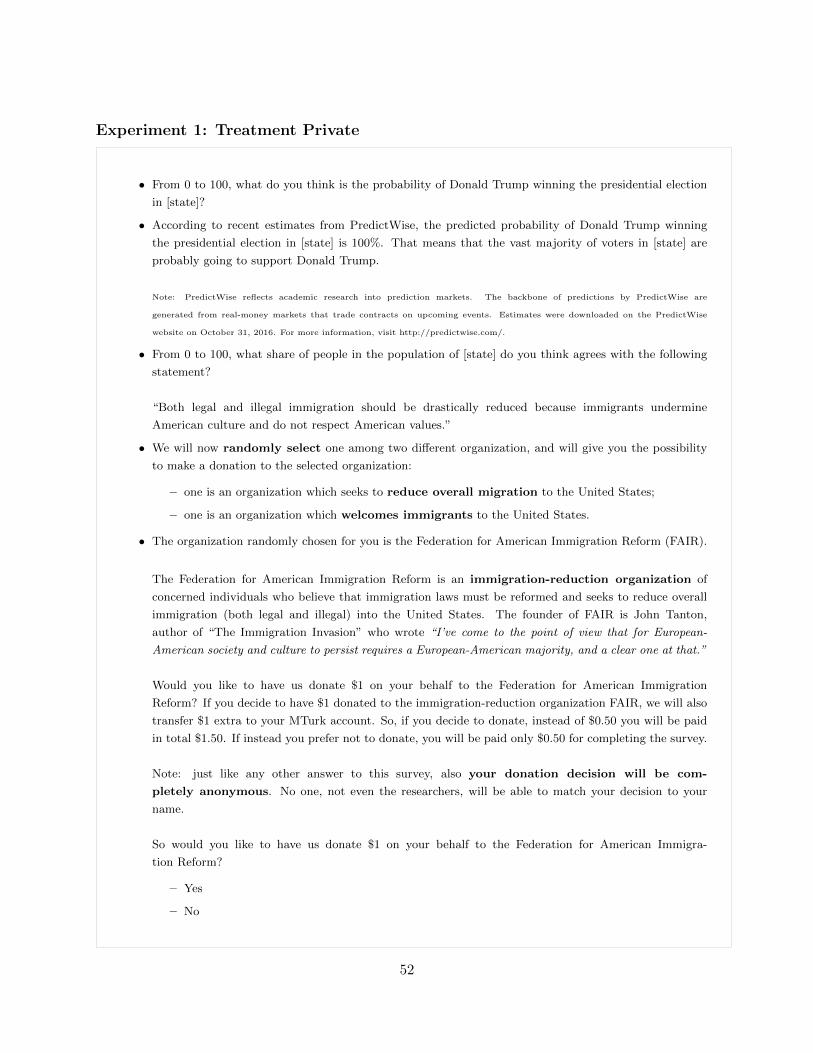
Experiment 1: Treatment Private
• From 0 to 100, what do you think is the probability of Donald Trump winning the presidential election
in [state]?
• According to recent estimates from PredictWise, the predicted probability of Donald Trump winning
the presidential election in [state] is 100%. That means that the vast majority of voters in [state] are
probably going to support Donald Trump.
Note: PredictWise reflects academic research into prediction markets. The backbone of predictions by PredictWise are
generated from real-money markets that trade contracts on upcoming events. Estimates were downloaded on the PredictWise
website on October 31, 2016. For more information, visit http://predictwise.com/.
• From 0 to 100, what share of people in the population of [state] do you think agrees with the following
statement?
“Both legal and illegal immigration should be drastically reduced because immigrants undermine
American culture and do not respect American values.”
• We will now randomly select one among two different organization, and will give you the possibility
to make a donation to the selected organization:
– one is an organization which seeks to reduce overall migration to the United States;
– one is an organization which welcomes immigrants to the United States.
• The organization randomly chosen for you is the Federation for American Immigration Reform (FAIR).
The Federation for American Immigration Reform is an immigration-reduction organization of
concerned individuals who believe that immigration laws must be reformed and seeks to reduce overall
immigration (both legal and illegal) into the United States. The founder of FAIR is John Tanton,
author of “The Immigration Invasion” who wrote “I’ve come to the point of view that for European-
American society and culture to persist requires a European-American majority, and a clear one at that.”
Would you like to have us donate $1 on your behalf to the Federation for American Immigration
Reform? If you decide to have $1 donated to the immigration-reduction organization FAIR, we will also
transfer $1 extra to your MTurk account. So, if you decide to donate, instead of $0.50 you will be paid
in total $1.50. If instead you prefer not to donate, you will be paid only $0.50 for completing the survey.
Note: just like any other answer to this survey, also your donation decision will be com-
pletely anonymous. No one, not even the researchers, will be able to match your decision to your
name.
So would you like to have us donate $1 on your behalf to the Federation for American Immigra-
tion Reform?
– Yes
– No
52

Experiment 1: Control Public
• From 0 to 100, what share of people in the population of [state] do you think agrees with the following
statement?
“Both legal and illegal immigration should be drastically reduced because immigrants undermine
American culture and do not respect American values.”
• Important: in order to ensure the quality of the data collected, a member of the research team might
personally contact you to verify your answers to the next question and the following ones.
• We will now randomly select one among two different organization, and will give you the possibility
to make a donation to the selected organization:
– one is an organization which seeks to reduce overall migration to the United States;
– one is an organization which welcomes immigrants to the United States.
• The organization randomly chosen for you is the Federation for American Immigration Reform (FAIR).
The Federation for American Immigration Reform is an immigration-reduction organization of
concerned individuals who believe that immigration laws must be reformed and seeks to reduce overall
immigration (both legal and illegal) into the United States. The founder of FAIR is John Tanton,
author of “The Immigration Invasion” who wrote “I’ve come to the point of view that for European-
American society and culture to persist requires a European-American majority, and a clear one at that.”
Would you like to have us donate $1 on your behalf to the Federation for American Immigration
Reform? If you decide to have $1 donated to the immigration-reduction organization FAIR, we will also
transfer $1 extra to your MTurk account. So, if you decide to donate, instead of $0.50 you will be paid
in total $1.50. If instead you prefer not to donate, you will be paid only $0.50 for completing the survey.
So would you like to have us donate $1 on your behalf to the Federation for American Immigra-
tion Reform?
– Yes
– No
• From 0 to 100, what do you think is the probability of Donald Trump winning the presidential election
in [state]?
53
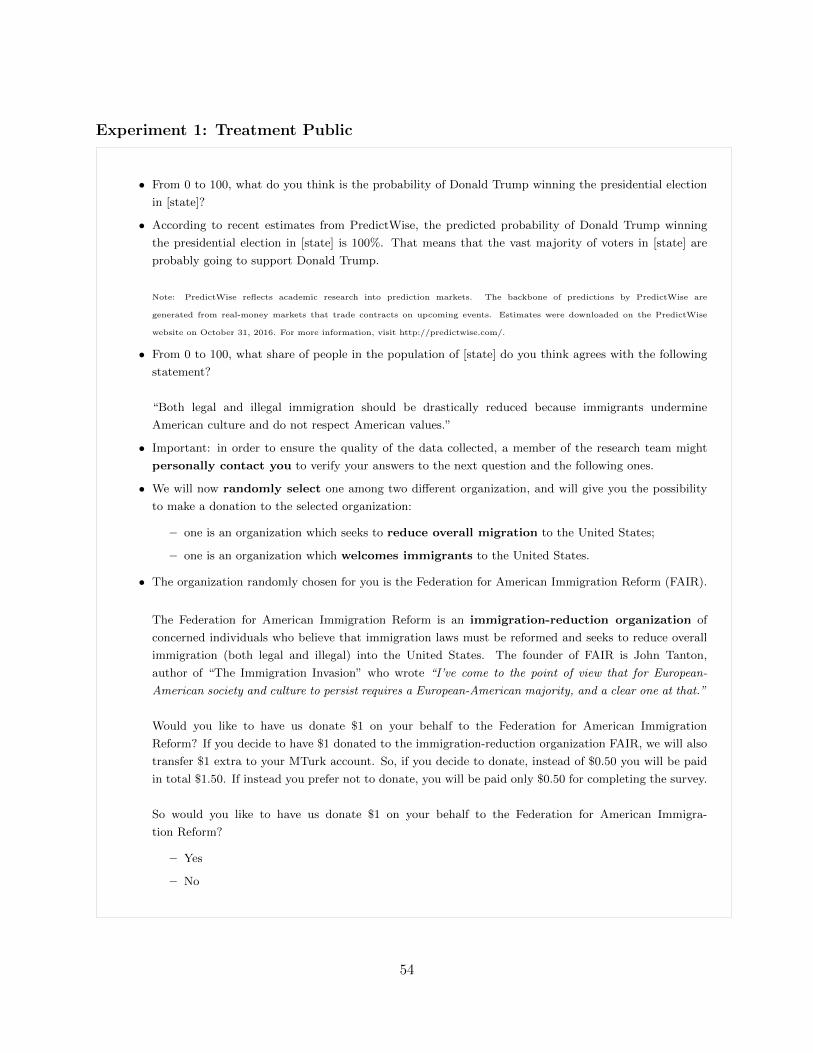
Experiment 1: Treatment Public
• From 0 to 100, what do you think is the probability of Donald Trump winning the presidential election
in [state]?
• According to recent estimates from PredictWise, the predicted probability of Donald Trump winning
the presidential election in [state] is 100%. That means that the vast majority of voters in [state] are
probably going to support Donald Trump.
Note: PredictWise reflects academic research into prediction markets. The backbone of predictions by PredictWise are
generated from real-money markets that trade contracts on upcoming events. Estimates were downloaded on the PredictWise
website on October 31, 2016. For more information, visit http://predictwise.com/.
• From 0 to 100, what share of people in the population of [state] do you think agrees with the following
statement?
“Both legal and illegal immigration should be drastically reduced because immigrants undermine
American culture and do not respect American values.”
• Important: in order to ensure the quality of the data collected, a member of the research team might
personally contact you to verify your answers to the next question and the following ones.
• We will now randomly select one among two different organization, and will give you the possibility
to make a donation to the selected organization:
– one is an organization which seeks to reduce overall migration to the United States;
– one is an organization which welcomes immigrants to the United States.
• The organization randomly chosen for you is the Federation for American Immigration Reform (FAIR).
The Federation for American Immigration Reform is an immigration-reduction organization of
concerned individuals who believe that immigration laws must be reformed and seeks to reduce overall
immigration (both legal and illegal) into the United States. The founder of FAIR is John Tanton,
author of “The Immigration Invasion” who wrote “I’ve come to the point of view that for European-
American society and culture to persist requires a European-American majority, and a clear one at that.”
Would you like to have us donate $1 on your behalf to the Federation for American Immigration
Reform? If you decide to have $1 donated to the immigration-reduction organization FAIR, we will also
transfer $1 extra to your MTurk account. So, if you decide to donate, instead of $0.50 you will be paid
in total $1.50. If instead you prefer not to donate, you will be paid only $0.50 for completing the survey.
So would you like to have us donate $1 on your behalf to the Federation for American Immigra-
tion Reform?
– Yes
– No
54

Experiment 2: Control Group
• A minaret is a tower typically built adjacent to a mosque and is traditionally used for the Muslim call
to prayer.
Would you support the introduction of a law prohibiting the building of minarets in [state]?
– Yes, I think the building of minarets should be prohibited in [state].
– No, I think the building of minarets should be allowed in [state].
• In this exercise, we matched you with a participant from another survey. You will not know who you
are paired with; only the researchers will know this. However, we will provide you with some additional
background information about the other participant.
The participant you are matched with is a 24-year-old male from Switzerland.
You and the other participant will split a total bonus of $3. You alone will make the decision of
how much of the $3 you will receive and how much of the $3 the other participant will receive. Whatever
decision you make will be implemented. You can choose to divide the $3 however you like. Whatever
you do not give to the other person you get to keep. The amount you keep will be credited to your
MTurk account in the form of a bonus payment. For example, if you decide to give $1.70, then you will
receive a bonus payment of $1.30.
How much would you like to give to the other person?
55

Experiment 2: Anti-minarets
• A minaret is a tower typically built adjacent to a mosque and is traditionally used for the Muslim call
to prayer.
Would you support the introduction of a law prohibiting the building of minarets in [state]?
– Yes, I think the building of minarets should be prohibited in [state].
– No, I think the building of minarets should be allowed in [state].
• In this exercise, we matched you with a participant from another survey. You will not know who you
are paired with; only the researchers will know this. However, we will provide you with some additional
background information about the other participant.
The participant you are matched with is a 24-year-old male from Switzerland. He supports the
prohibition of the building of minarets in Switzerland.
You and the other participant will split a total bonus of $3. You alone will make the decision of
how much of the $3 you will receive and how much of the $3 the other participant will receive. Whatever
decision you make will be implemented. You can choose to divide the $3 however you like. Whatever
you do not give to the other person you get to keep. The amount you keep will be credited to your
MTurk account in the form of a bonus payment. For example, if you decide to give $1.70, then you will
receive a bonus payment of $1.30.
How much would you like to give to the other person?
56

Experiment 2: Anti-minarets Public Support
• A minaret is a tower typically built adjacent to a mosque and is traditionally used for the Muslim call
to prayer.
Would you support the introduction of a law prohibiting the building of minarets in [state]?
– Yes, I think the building of minarets should be prohibited in [state].
– No, I think the building of minarets should be allowed in [state].
• In this exercise, we matched you with a participant from another survey. You will not know who you
are paired with; only the researchers will know this. However, we will provide you with some additional
background information about the other participant.
The participant you are matched with is a 24-year-old male from Switzerland. Like 57.5% of
Swiss respondents, the participant supports the prohibition of the building of minarets in Switzerland.
You and the other participant will split a total bonus of $3. You alone will make the decision of
how much of the $3 you will receive and how much of the $3 the other participant will receive. Whatever
decision you make will be implemented. You can choose to divide the $3 however you like. Whatever
you do not give to the other person you get to keep. The amount you keep will be credited to your
MTurk account in the form of a bonus payment. For example, if you decide to give $1.70, then you will
receive a bonus payment of $1.30.
How much would you like to give to the other person?
57

Experiment 2: Anti-minarets Referendum
• A minaret is a tower typically built adjacent to a mosque and is traditionally used for the Muslim call
to prayer.
Would you support the introduction of a law prohibiting the building of minarets in [state]?
– Yes, I think the building of minarets should be prohibited in [state].
– No, I think the building of minarets should be allowed in [state].
• In this exercise, we matched you with a participant from another survey. You will not know who you
are paired with; only the researchers will know this. However, we will provide you with some additional
background information about the other participant.
The participant you are matched with is a 24-year-old male from Switzerland. Building minarets
is illegal in Switzerland, following a 2009 referendum. Like 57.5% of Swiss respondents, the participant
supports the prohibition of the building of minarets in Switzerland. However, he did not vote in the
referendum since he was under legal voting age.
You and the other participant will split a total bonus of $3. You alone will make the decision of
how much of the $3 you will receive and how much of the $3 the other participant will receive. Whatever
decision you make will be implemented. You can choose to divide the $3 however you like. Whatever
you do not give to the other person you get to keep. The amount you keep will be credited to your
MTurk account in the form of a bonus payment. For example, if you decide to give $1.70, then you will
receive a bonus payment of $1.30.
How much would you like to give to the other person?
58

Anonymous Experiment 2: Control Group
• A minaret is a tower typically built adjacent to a mosque and is traditionally used for the Muslim call
to prayer.
Would you support the introduction of a law prohibiting the building of minarets in [state]?
– Yes, I think the building of minarets should be prohibited in [state].
– No, I think the building of minarets should be allowed in [state].
• In this exercise, we matched you with a participant from another anonymous survey. You will not know
who you are paired with. However, we will provide you with some additional background information
about the other participant.
The participant you are matched with is a 24-year-old male from Switzerland.
You and the other participant will split a total bonus of $3. You alone will make the decision of
how much of the $3 you will receive and how much of the $3 the other participant will receive. Whatever
decision you make will be implemented. You can choose to divide the $3 however you like. Whatever
you do not give to the other person you get to keep. The amount you keep will be credited to your
MTurk account in the form of a bonus payment. For example, if you decide to give $1.70, then you will
receive a bonus payment of $1.30.
How much would you like to give to the other person?
59
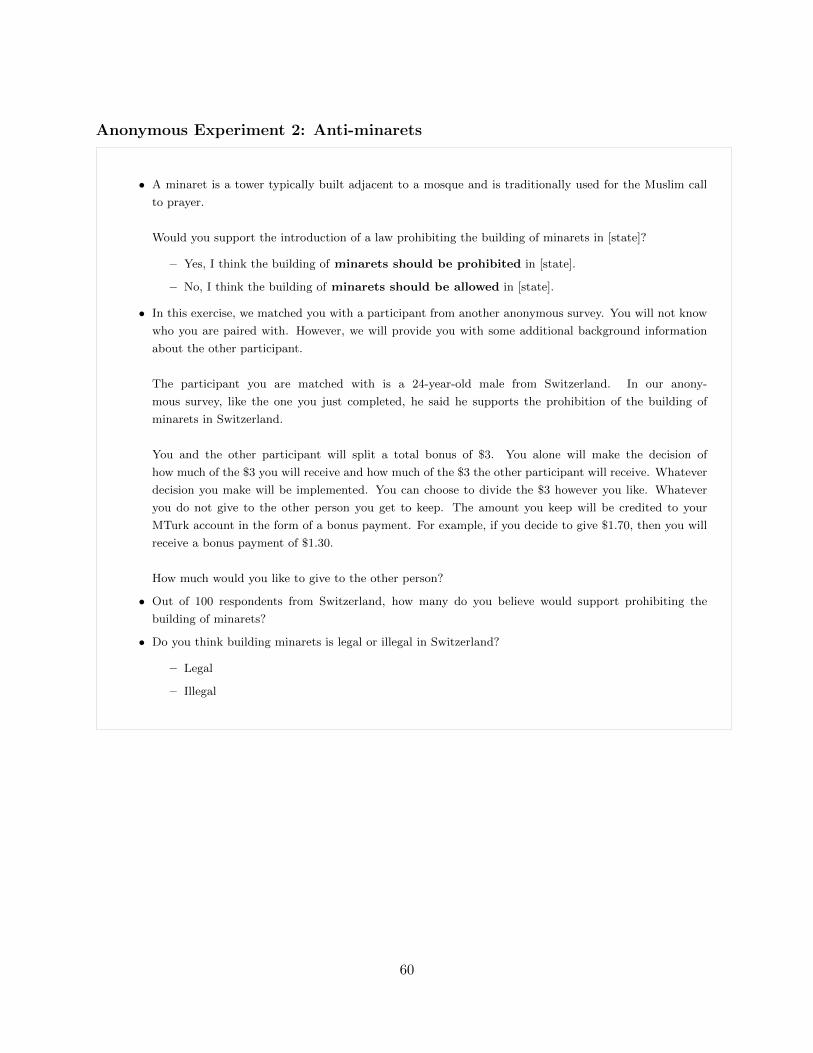
Anonymous Experiment 2: Anti-minarets
• A minaret is a tower typically built adjacent to a mosque and is traditionally used for the Muslim call
to prayer.
Would you support the introduction of a law prohibiting the building of minarets in [state]?
– Yes, I think the building of minarets should be prohibited in [state].
– No, I think the building of minarets should be allowed in [state].
• In this exercise, we matched you with a participant from another anonymous survey. You will not know
who you are paired with. However, we will provide you with some additional background information
about the other participant.
The participant you are matched with is a 24-year-old male from Switzerland. In our anony-
mous survey, like the one you just completed, he said he supports the prohibition of the building of
minarets in Switzerland.
You and the other participant will split a total bonus of $3. You alone will make the decision of
how much of the $3 you will receive and how much of the $3 the other participant will receive. Whatever
decision you make will be implemented. You can choose to divide the $3 however you like. Whatever
you do not give to the other person you get to keep. The amount you keep will be credited to your
MTurk account in the form of a bonus payment. For example, if you decide to give $1.70, then you will
receive a bonus payment of $1.30.
How much would you like to give to the other person?
• Out of 100 respondents from Switzerland, how many do you believe would support prohibiting the
building of minarets?
• Do you think building minarets is legal or illegal in Switzerland?
– Legal
– Illegal
60
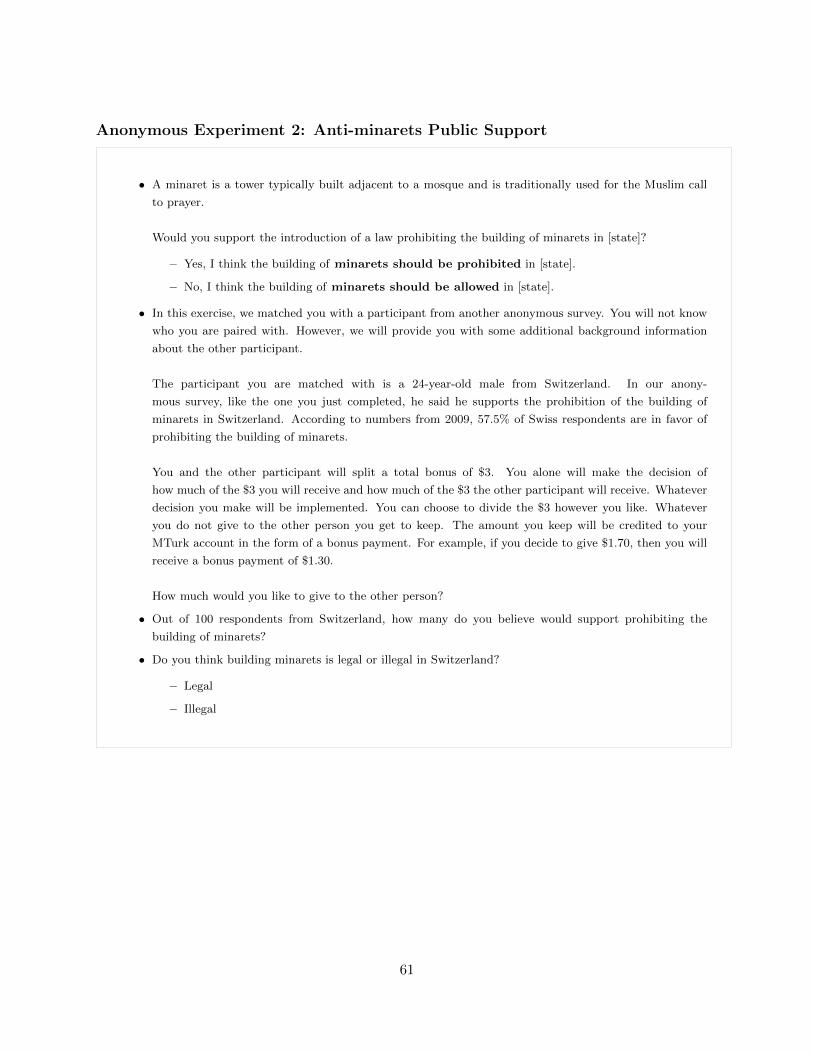
Anonymous Experiment 2: Anti-minarets Public Support
• A minaret is a tower typically built adjacent to a mosque and is traditionally used for the Muslim call
to prayer.
Would you support the introduction of a law prohibiting the building of minarets in [state]?
– Yes, I think the building of minarets should be prohibited in [state].
– No, I think the building of minarets should be allowed in [state].
• In this exercise, we matched you with a participant from another anonymous survey. You will not know
who you are paired with. However, we will provide you with some additional background information
about the other participant.
The participant you are matched with is a 24-year-old male from Switzerland. In our anony-
mous survey, like the one you just completed, he said he supports the prohibition of the building of
minarets in Switzerland. According to numbers from 2009, 57.5% of Swiss respondents are in favor of
prohibiting the building of minarets.
You and the other participant will split a total bonus of $3. You alone will make the decision of
how much of the $3 you will receive and how much of the $3 the other participant will receive. Whatever
decision you make will be implemented. You can choose to divide the $3 however you like. Whatever
you do not give to the other person you get to keep. The amount you keep will be credited to your
MTurk account in the form of a bonus payment. For example, if you decide to give $1.70, then you will
receive a bonus payment of $1.30.
How much would you like to give to the other person?
• Out of 100 respondents from Switzerland, how many do you believe would support prohibiting the
building of minarets?
• Do you think building minarets is legal or illegal in Switzerland?
– Legal
– Illegal
61

Anonymous Experiment 2: Anti-minarets Referendum
• A minaret is a tower typically built adjacent to a mosque and is traditionally used for the Muslim call
to prayer.
Would you support the introduction of a law prohibiting the building of minarets in [state]?
– Yes, I think the building of minarets should be prohibited in [state].
– No, I think the building of minarets should be allowed in [state].
• In this exercise, we matched you with a participant from another anonymous survey. You will not know
who you are paired with. However, we will provide you with some additional background information
about the other participant.
The participant you are matched with is a 24-year-old male from Switzerland. In our anonymous
survey, like the one you just completed, he said he supports the prohibition of the building of minarets
in Switzerland. Building minarets is illegal in Switzerland, following a 2009 referendum. According to
numbers from 2009, 57.5% of Swiss respondents are in favor of prohibiting the building of minarets. How-
ever, the person you are matched with did not vote in the referendum since he was under legal voting age.
You and the other participant will split a total bonus of $3. You alone will make the decision of
how much of the $3 you will receive and how much of the $3 the other participant will receive. Whatever
decision you make will be implemented. You can choose to divide the $3 however you like. Whatever
you do not give to the other person you get to keep. The amount you keep will be credited to your
MTurk account in the form of a bonus payment. For example, if you decide to give $1.70, then you will
receive a bonus payment of $1.30.
How much would you like to give to the other person?
• Out of 100 respondents from Switzerland, how many do you believe would support prohibiting the
building of minarets?
• Do you think building minarets is legal or illegal in Switzerland?
– Legal
– Illegal
62

D Experiment 3: Legitimacy
D.1 Experimental Design
The design of experiment 3 is very similar to experiment 1: it uses donation decisions made either
in a private or in a public condition to study the social acceptability of a view. The main difference
with respect to experiment 1, is that here we also focus on the role of the legitimacy of a view in
determining its social acceptability. For this purpose, we include a treatment in which we inform
subjects about the fact that a certain policy is unconstitutional. Given our previous findings
that the wedge between private and public donations to the Federation for American Immigration
Reform had disappeared after the presidential election in the six originally studied states (and our
overall concern that the social acceptability of xenophobia had increased in the country as a whole),
we made three additional changes to the protocol in experiment 1: we expanded the set of states
in our recruitment of participants, referred to stronger xenophobic (here, Islamophobic) language,
and included an organization with relatively more extreme views.27
Specifically, in early February 2017, we recruited participants (N = 574) from all the states in
which Donald Trump won the presidential election. MTurk workers with at least 80% approval
rate could see our request, which was described as a “5 minute survey” with a reward of $0.50.
Each worker could participate in the survey only once. Workers who clicked on the request were
displayed detailed instructions about the task, and given access to links to the study information
sheet and the actual survey. The survey was conducted on the online platform Qualtrics.
After answering a number of demographic questions, a third of the participants were randomly
informed about the fact that a large share of respondents of an anonymous online survey supported
the ban of Muslims from public office (public support information condition):28
“In a recent anonymous survey we conducted online, we found that a very large
proportion of respondents think that Muslims should be prohibited from holding public
office. This suggests that there is popular support for this type of ban.”29
Another third were additionally informed about the fact that such a ban is unconstitutional
and that Donald Trump would not be able to enact it (unconstitutionality information condition):
“Regardless of popular support, prohibiting Muslims from holding public office is un-
constitutional and will not be enacted. The 5th and 14th Amendments imply that
state and federal governments cannot discriminate against employees or job applicants
27The experiment can be found in the AEA RCT Registry (AEARCTR-0001994).28We used information from a previous anonymous survey we conducted on MTurk (N = 96) in which 42% of the
respondents expressed support for that ban: to participate MTurk workers had to have an approval rate of at least80% and to identify themselves as conservatives.
29To avoid deception, we used the vague expression “very large proportion,” which does not imply that a majorityof respondents held that position.
63
on religious grounds. This means that President Donald Trump will not enact this type
of ban.”
The remaining third were not given any information (control condition).
Participants were then asked to predict the share of individuals who would they think would
say in an anonymous online survey that they think Muslims should be prohibited from holding
public office. This provides a measure of the perceived popularity of anti-Muslim policies.
In the next part of the intervention, we measured the perceived social acceptability of expressing
strong anti-Muslim sentiment using a donation experiment with real stakes. Participants were first
told that they would be given the opportunity to make a donation to a randomly drawn organization
that could either be anti-Muslim or pro-immigration, to ensure that participants would not associate
the experimenters with a specific political view. To maximize power and avoid direct deception,
the randomization was such that more than 99% of participants (N=573) would get assigned the
organization we were interested in: ACT for America.30 To make sure that the participants were
aware of the organization’s very strong anti-immigration stance, a few more details about the
organization and its founder were provided in the experiment:
ACT for America is the largest grassroots anti-Muslim organization in the U.S ac-
tively working to promote anti-Muslim legislation and opinion. The founder of ACT
for America is Brigitte Gabriel, the author of a book titled ‘They Must Be Stopped’
and who argued that Muslims should be prohibited from holding public office
because “a practicing Muslim, who believes in the teachings of the Koran, cannot be a
loyal citizen of the United States.” ACT for America believes that Muslims represent
a threat to both national security and American values; its Thin Blue Line project
comprehensively mapped the addresses of U.S. Muslim student associations and other
Islamic institutions as sites of national security concern.
Participants were then asked if they would like to authorize the researchers to donate $1 to
that organization on their behalf. The money would not come from the subject’s $0.50 payment
for participation in the study. Moreover, the participant would also be paid an extra $1 (or about
1/6 of an hourly wage on MTurk) if he/she authorized the donation. Rejecting the donation would
not affect the monetary payoffs to the participants in any way other than through the loss of this
extra amount.
In addition to the original randomization of informing subjects about the popularity and uncon-
stitutionality of the ban, we introduced a second layer of cross-randomization at the donation stage.
Half of the participants were assured that their donation authorization would be kept completely
anonymous, and that no one, not even the researchers would be able to match their decision to
30The pro-immigration organization was once again the National Immigration Forum.
64
their name: we refer to this condition as the private condition. The other half of the subjects were
instead informed, right before the donation question was displayed to them, that they might be
personally contacted by the research team to verify their answers to the questions in the remaining
part of the survey: this is what we refer to as the public condition.
D.2 Results
Appendix Figure D1 displays the main findings from experiment 3. In the control condition, we
observe, like in experiment 1, a wedge between donation rates in private and in public: a drop from
40% in private to 29% in public (the p-value of a t test of equality is 0.099). Among individuals in
the public support information condition, we observe no difference in private and public donation
rates, which are 35% and 37%, respectively (p-value=0.757). These results are very similar to the
results in experiment 1 (although we use different population, organization, and treatment), and
indicate that the information provided causally increased the social acceptability of the action to
the point of eliminating the original social stigma associated with it. Among individuals in the
unconstitutionality information condition, we again observe no difference in private donation rates,
which are 29% and 30% respectively (p-value=0.795).
However, we find a difference in private donation rates between the unconstitutionality informa-
tion and control conditions (p-value=0.083), suggesting that the information is possibly decreasing
privately-held support for the Islamophobic policy.
Both information conditions positively update average beliefs about the popularity of the anti-
Muslim policy when compared to the control group. In the control group, the average guess was
that 45% of respondents of an online anonymous survey would support the anti-Muslim policy. The
average went up to 48% in the unconstitutionality information condition (p-value=0.183 against the
control group) and to 52% in popular support information condition (p-value=0.004 when compared
to the control group). This is consistent with subjects informed about the unconstitutionality of
banning Muslims from public office also reducing their beliefs about the popularity of the policy.
Taken together, these results suggest that the positive update in the perceived popularity of
the Islamophobic policy reduces the wedge in private vs public donations, even when that update
is smaller and even when the subjects are aware of the policy’s unconstitutionality. This once again
confirms that the channel of legality/institutionalization is not the main driver of our findings.
65
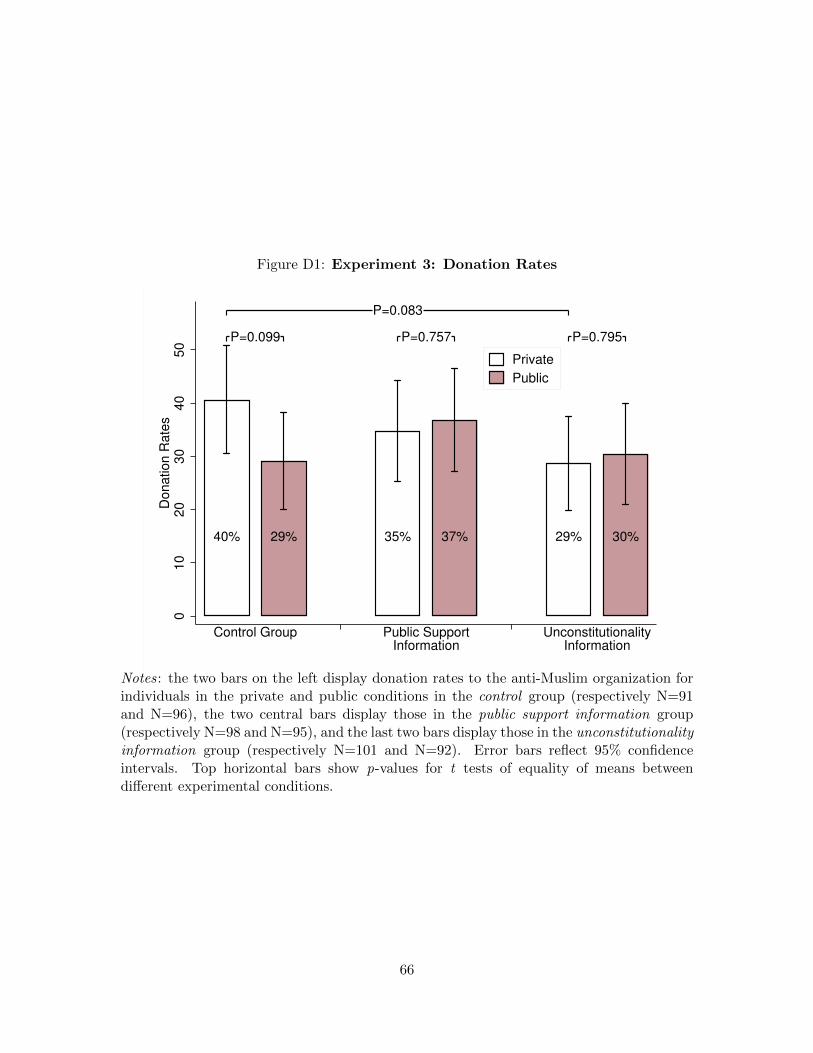
Figure D1: Experiment 3: Donation Rates
P=0.099 P=0.757 P=0.795
P=0.083
40% 29% 35% 37% 29% 30%
01
02
03
04
05
0D
on
atio
n R
ate
s
Control Group Public SupportInformation
UnconstitutionalityInformation
Private
Public
Notes: the two bars on the left display donation rates to the anti-Muslim organization forindividuals in the private and public conditions in the control group (respectively N=91and N=96), the two central bars display those in the public support information group(respectively N=98 and N=95), and the last two bars display those in the unconstitutionalityinformation group (respectively N=101 and N=92). Error bars reflect 95% confidenceintervals. Top horizontal bars show p-values for t tests of equality of means betweendifferent experimental conditions.
66