Embed Size (px)
Citation preview

Halon Replacement Decomposition Product Studies
Adam Chamway, Julian Grieg and David J Spring
Kidde International, Mathisen Way, Colnbrook Slough, Berkshire, SL3 O H B , UK
Tel(+44) 1753 683245 Fax (+44) 1753 683810
1 Introduction
A number of laboratories have previously reported results of test programs on Halon replacement agents canid out at laboratory ('I, intermediate (',') or full-scale (4,5). However, due to their mherent cost, full-scale tests are usually l i t 4 both in the cross section of agents studied, and the range of test parameters varied. Halon 1301 baseline tests are not always included. Although it is possible to compare results from different organisations, care has to be taken, as test fixtures and methodologies vary considerably kom one organisation to another. A further complication arises when decomposition product levels fiom difFerent studies are compared because there are several methods for measuring the concentrations of acid gases such as HF, HBr and HI. These include in-situ FTIR"), external FTIlUhcated sample lines ('I and several aqueous trapping methods followed by either ion chromatography(') or ion selective electrode analysis'". Therefore, it was decided to test a wide range of currently available agents under, as near as possible, equivalent conditions. To keep costs down a laboratory scale test chamber, suitable for realistic total-flood testing, was chosen.
Parameters that merit examination include test chamber size, fire size, fuel type, length of pre-bum, and the extent to which the suppression system is optimised. During this test work these Parameters will all be investigated to by to gain a fundamental understan@ of the comples issue of acid gas production. A wide range of currently available agents is being tested, g~ving a multidimensional baseline, against which potential second generation chemically acting agents are currently being evaluated.
2 Experimental
2.1
A diagram of the 200 L cubic test chamber is given in Figure 1. The chamber can be scaled and is equipped with a transparent door for observation and access. The fire threats arc three small pans containing heptane floated on water. The main fire (heptane volume 30 cm' and diameter 70 mm) is positioned in the centre of the base of the chamber. Two satellite fires (heptane volume 1 cm' and diameter 20 mm) arc positioned at the bottom right front comer and the top left rear comer. Thls gives a value of 7.3 kWm" for the fire size to chamber volume parameter (FSRV). All fires arc obscured with baffles as shown. Known masses of agents arc contained in a 0.3 L pressure vessel at 23 f 3 "C. With HFC-l34a, HFC-227ea, HFC-236fa, FC-3.1.10, FC-5.1.14 and IFC-1311 the vessel is pressurised minutes before discharge to 10 bar with nitrogen. Halon 1301, HFC-23 and HFC-125 have a room temperature vapour pressure above I O bar. Therefore, these agents are propelled by their intrinsic vapour pressure.
The Test Chamber and Procedure
HOTWC.96 307
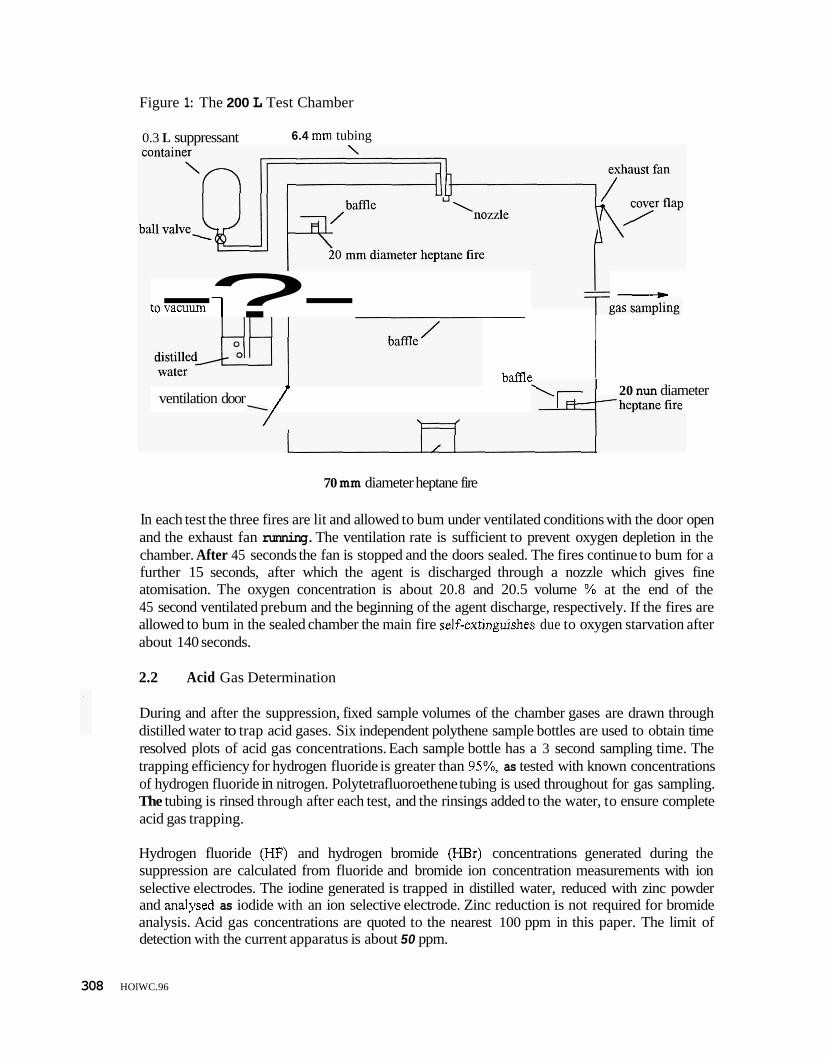
Figure 1: The 200 L Test Chamber
0.3 L suppressant 6.4 mm tubing
___) -?- 20 nun diameter
tovacuum 1
bafne
/ ventilation door \
70 mm diameter heptane fire
In each test the three fires are lit and allowed to bum under ventilated conditions with the door open and the exhaust fan running. The ventilation rate is sufficient to prevent oxygen depletion in the chamber. After 45 seconds the fan is stopped and the doors sealed. The fires continue to bum for a further 15 seconds, after which the agent is discharged through a nozzle which gives fine atomisation. The oxygen concentration is about 20.8 and 20.5 volume % at the end of the 45 second ventilated prebum and the beginning of the agent discharge, respectively. If the fires are allowed to bum in the sealed chamber the main fire self-extinguishes due to oxygen starvation after about 140 seconds.
2.2 Acid Gas Determination
During and after the suppression, fixed sample volumes of the chamber gases are drawn through distilled water to trap acid gases. Six independent polythene sample bottles are used to obtain time resolved plots of acid gas concentrations. Each sample bottle has a 3 second sampling time. The trapping efficiency for hydrogen fluoride is greater than 95%, as tested with known concentrations of hydrogen fluoride in nitrogen. Polytetrafluoroethene tubing is used throughout for gas sampling. The tubing is rinsed through after each test, and the rinsings added to the water, to ensure complete acid gas trapping.
Hydrogen fluoride (HF) and hydrogen bromide (HBr) concentrations generated during the suppression are calculated from fluoride and bromide ion concentration measurements with ion selective electrodes. The iodine generated is trapped in distilled water, reduced with zinc powder and analysed as iodide with an ion selective electrode. Zinc reduction is not required for bromide analysis. Acid gas concentrations are quoted to the nearest 100 ppm in this paper. The limit of detection with the current apparatus is about 50 ppm.
308 HOlWC.96
2.3 Evaluation of Suppressants
Suppressants are evaluated both in terms of the speed at which they extinguish the fires and of their degree of decomposition, particularly regarding acid gas production. The three dimensional (total flood) suppression properhes of the agents are evaluated by the use of satellite fires. Salient features of the agents tested are given in Table 1
Table 1: Agents Tested
Fluorocarbon Number
Trade Name and Chemical Boiling Cupburner Manufacturer Formula Point I "C ConcentrationA
I volume %
HFC-23
HFC-125
HFC-134a I (various) (CF3CH,F 1 -27 I 1OSB
FE-13, DuPont cHF3 -82 12.3
FE-25, DuPont CFJXF2 -49 9.2
HFC-227ea I FM-200TM, Great Lakes 1 CFICHFCFI I -17 I 6.4
FC-3 110
FC-5 1 14
llHFC-236fa 1 FE-36. DuPont ICF?CH,CFq 1 -2 1 5.3c
CEA410,3M C3,O -2 5.2
CEA-614,3M c6F14 +58 4 4
IFC-I 311
13B1 .
TnddeTM, Pacific Scientific CFJ -23 3 l D
Halon 1301, (none) CF3Br -58 3 1
-Dam from Centre for Global Environmental Technologies, CGETl, Sept23,1994, unless otherwise stated - Data from NMERI. - Data from Fenwal Safety Systems Combustion Research Center, Holliston. - Data from Pacific Sc ien~c .
A
C
D
3 Results
3.1 Halon 1301 Baseline
It is very well established that Halon 1301 is an effective fire suppressant. Therefore, Halon 1301 was used to determine a baseline of suppression performance in the 200 L test chamber. The results are summarised in Table 2.
When concentrations above the heptane cupbumer of 3.1 volume % for Halon 1301 were tested, all fires were extinguished before the end of the agent discharge (about 8 seconds). Measured HF concentrations were low. With concentrations of Halon 1301 of 4.1 volume % and 4.8 volume %, measured HF concentrations were below 700 ppm and less than SO ppm, respectively.
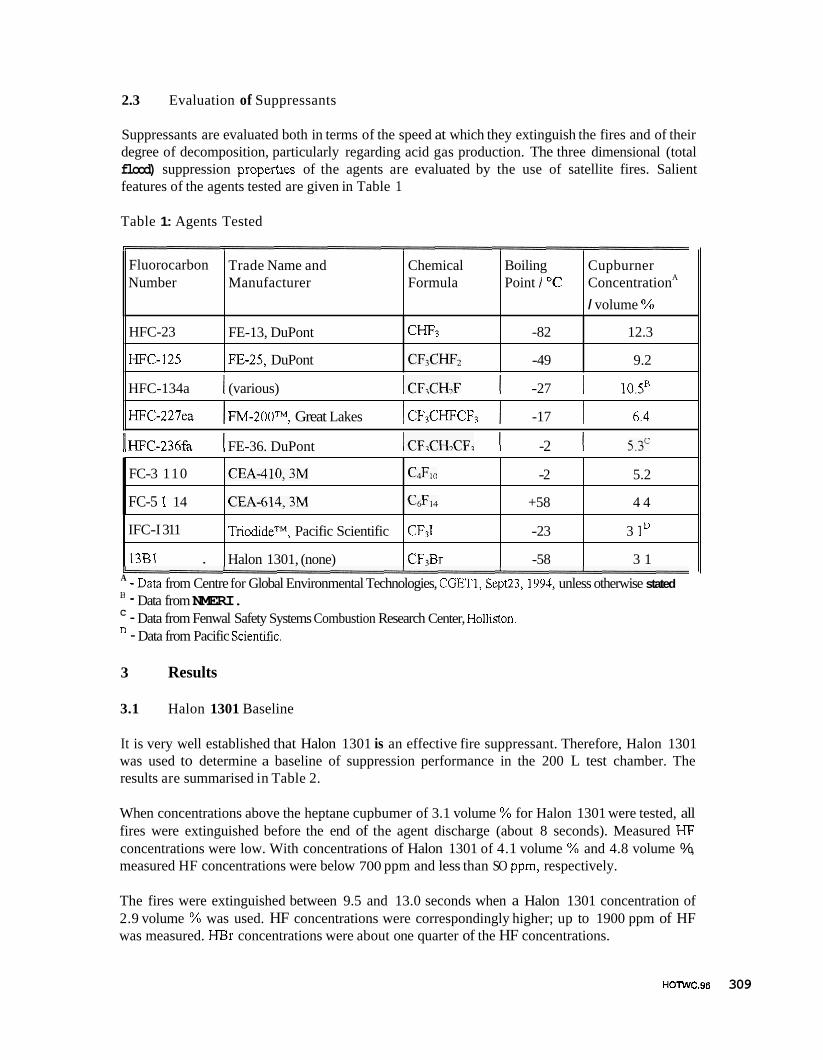
The fires were extinguished between 9.5 and 13.0 seconds when a Halon 1301 concentration of 2.9 volume % was used. HF concentrations were correspondingly higher; up to 1900 ppm of HF was measured. HBr concentrations were about one quarter of the HF concentrations.
HOTWC.98 309
Agent Time of Concentration Extinguishment
Maximum HF Maximum HBr Concentration Concentration
Below limit of detection # t Final value recorded
The time resolved data is presented in Figure 2. Initially, the HF concentration rises steeply, reaching a maximum which corresponds approximately to the moment of fire extinction. M e r this the HF concentration starts to fall due to absorption in condensed water vapour on the chamber surfaces.
I volume % 2.9 2.9
Figure 2: HF Concentration vs Time for Halon 1301 (7.3 kWmJ Heptane Fire in 200 L Chamber)
I
of Main Fire I s I ppm I ppm 12.5 1900 -
9.5 700t 2007
I800 I A
+4.l ~01%. Ext. 8.0s W L, 800 i / L
t 4 . 8 vol%. Ext 6.0 s 600
0 _ - - t 0 5 10 15 20 25 30
Time After Beginning of Discharge I s
3.2 Halon Replacement Agents
Figures 3 to 6 give the time-resolved HF results obtained with various concentrations of HFC-227ea, HFC-l34a, HFC-125 and FC-5.1.14 respectively. The other agents have as yet only been tested at one concentxation, and the results are given in Table 3 and Figure 7, which are summaries of all agents tested at approximately the same relative concentration (1.1 x heptane cupbumer concentration).
310 HOTWC.96

Figure 3: HF Concentration VS Time for HFC-227ea (7.3 kWmJ Heptane Fire in 200 L Chamber)
350w T I
30000 j-
E E 25000 --
C -
+5.6 vol%, Ext. 19.5 s +6.5 vol%, Ext. 8.5 s *7.1 vol%, Ext. 5.5 s
2 20000 ~~
C
I
t E E 25000 -
1 +8.2 ~01%. Ext. 5.5 s
10 20 30 40 50 60 0
Time After Beginning of Discharge Is
Figure 4: HF Concentration vs Time for HFC-134a (7.3 kWm” Heptane Fire in 200 L Chamber)
12000 T
+lO.Ovol%. Ext. 6 .5s t l l . 1 ~01%. E x t . 5 . 0 ~
O Y I
5 10 15 20 25 30 0
Time After Beginning of Discharge / s
HOTWC.96 311

Figure 5:
5000
4500
E 4000 Q Q 35w
30W
2500 C 0
2000 0 0 1500 U.
.
.- -
= low 500
0
HF Concentration vs Time for HFC-125 (7.3 kWm” heptane tire in 200 L Chamber)
I 0 5 10 15 20 25 30
Time After Beginning of Discharge I s
Figure 6: HF Concentration vs Time for FC-5.1.14 (7.3 kWm” Heptane Fire in 200 L Chamber)
3’2030 -
25000 --
n n - 20030 -- C 0 .-
U
0 10 20 30 40 50 60 70 80
Time After Beginning of Discharge I s
312 HOTWC.96

Agent
FC-3.1.10 tested at approx. 1.2 x heptane cupbumer concentration #
Agent Discharge Time of Ext. of Maximum Maximum Concentration Time Main Fire HF Conc. I2 Conc.
Figure 7: Comparative HF Concentrations vs Time for all Replacement Agents Tested (7.3 kWm3 Heptane Fire in 200 L Chamber)
90W T
8000
E 70W P P
E 0
- 6000 - 50W
5 40W u r: 0 30W 0 U I 2000
1003
0
.- 2 -
0 5 10 15 20 25 30
Time After Beginning of Discharge Is
+HFC-125, 9.9%, 10.0s t H F C - 1 3 4 a . 11.1%, 5.0s +HFC-227ea, 7.1%, 5.5s *HFC-236fa, 6.0%, 7.0s -CFC-3.1.10, 6.2%, 6.0s t F C - 5 . 1 . 1 4 . 5.0%. 6.5s
4 Discussion
4.1 Factors Influencing HF Formation
There are many factors which are hown to influence the degree of HI formation when fluorinated f i e suppressants, including both Halons and the non-omne deplehg replacement agents, are used to extinguish 6res:-
1. Fire Size to Room Volume (FSRV) The importance of this factor has been clearly demonstrated in many studies, particularly the work of Robin et a[.('') Agents are only decomposed when they come in contact with the fire. Therefore, the larger the fire, and the more intense it is, the greater the amount of HF formed. The concentration of HF obtained from a given amount of decomposition will naturally be inversely related to the volume of the room. In Robin's study with HFC-2273 with all other factors held c o r n a direct relationship is observed between the FSRV and the measured €5 concentration. A similar type of relationship may be expected for otber agents and conditions, although with a merent propottionality constant. It should be noted that the FSRV used in our study is relatively high, both as f ie tests go, and in comparison to real world fies. Modem fire detection systems are designed to detect fires whilst they are relatively small. For example, the EN54 standard (I1) calls for detection of a 0.11 mz heptane fire in a 205-370 m3 chamber. This equates to FSRV in the range 0.4 to 0.7 and to possible HF concentrations, according to Robin's correlation for HFC-227q of 300-500 ppm. Furthermore, the heptane fire is one of 6 fires called up by the EN54 standard. A number of smouldering fires are of very much lower heat output and ought therefore to generate lower concentrations of breakdown products.
2. Agent Concentration The importance of agent concentration relative to the minimum suppressing concentration (for the particular fuel in question) also has a very major influence on breakdown product formation. This is shown clearly in Figure 8 where, as the agent concentration relative to the heptane cupburner concentration is decreased below about a factor of 1.1, the HF concentrations start to rise rapidly. This is to be expected since in such cases inhomogeneities in distribution staxt to play a part and the agent is struggling to d g u i s h the flame. This effect has also been noted before in large scale tests, e.g. by Sheinson et al. ("), Figure 8 also includes data for cases where the amount of agent discharged resulted in a concentration below the suppressing concentration. Now, suppression is only achieved after a relatively long time and is clearly aided by oxygen depletion. The long contact times arising from such circumstances enhance the amount of agent brought into contact with the. flame and high concentrations of HF ensue.
314 HOlWC.96

Figure 8: The Maximum HF Concentration vs Agent Concentration to Heptane Cupburner Ratio (7.3 kWm-’ Heptane Fire in ZOO L Chamber)
.- 25000
.a .- 5 20000 V c 6 15000 U I
E 6 10000
I-
O 0.7
X
A
- Y
0.8 0.9 1 1.1 1.2 1.3 1.4 --ti
1 5 1.6
HFC-125 A HFC-134a x HFC-227e~ x HFC-236fa mFC-3.1.10 + FC-5.1.14 - IFC-1311
Ratio of Agent Concentration to Heptane Cupburner Concentration
3. Flame -Agent Contact Time The total time for which the agent, at below suppression concentrations, is in contact with the flame plays a sigruficant role, as is shown by Figure 3. In some of these tests, long contact times are deliberately brought about by choosing a mavimUm agent concentration below the cupburner concentration. This atact time is a combination ofthe time required to discharge the agent from the nozzle into the room and the time required to transport the agent (by jet momentum, turbulent difhsion and mixing) from the nozzle to the fire and to achieve a suppressing concentration at the fire. A slow build up of the agent conmtratioq or too low an agent concentration wdl result in long contact times and high concentrations of breakdown products. Agents such as HFC-23, which are not superpressunsed with nitrogen, but rely on their vapour pressure, exhibit slightly longer discharge times in this apparatus. This is due to the greater pressure decay during the &charge. The effect of varying discharge time (or more correctly, mass flow rate) will be examined in the near future. In practical applications, it is the task of the fire suppression engineer to design the system such that these contact times are minimised by short discharge times ( I O seconds or less) and with nozzles designed and positioned such as to get the agent to the fire as rapidly as possible. It should also be noted that this has the added benefit of suppressing the fue quickly and reducing the toxic gases arising from the fire itself
The Chemical Nature of the Agent The relative proportion of hydrogen and fluorine atom in the agent molecule influences the amount of HF form4 since it requires a sufficient source of both fluorine and hydrogen atom to produce it. The only source of fluorine is the agent, whereas hydrogen can derive from the heptane fuel, water vapour in the air and also from the agent itself (if the agent contains hydrogen atoms). Calculations were performed with the STANJAN Chemical Thenncdymmics
4.
HOlWC.96 315

program(’2’ for adiabatic stoichiometric heptane air flames containing increasing proportions of various agents. A humidity level of 50% was assumed. Figure 9 shows some of the results. As can be seen, for some agents the mole fraction of HF in the flame increases continuously with increasing agent concentration; with other agents a limiting concentration is reached where the flame essentially runs out of hydrogen and a plateau is reacbed. For agents with a relatively low H F atom ratio in the molecule, such as the perfluorocarbons, HFC-125 and JIFC-227% this limiting agent concentration is reached at mcentrations below the suppressing concentration, and thus there is a h i t on the rate of HF generation by the flame. For other agents, (HFC-23, HFC-134a and HFC-236fa) with a relatively higher H:F atom ratio in the molecule, this limiting concentration is actually above the suppressing concentration and there will not be a similar l i t on the rate of HF generation by the flame. This effect has been noted before‘”’. The calculations indicate that when HF formation is limiting, other fluorineumtamng decomposition products, such as carbonyl fluoride and tetrafluoromethane are formed. Carbonyl fluoride is rapidly hydrolysed to HF and carbon dioxide in the atmosphere (I4) and thus contibutes to the measured concentration of HF. However, ST4NJAN calculations indicate the mole fraction of carbonyl fluoride is up to an order of magnitude less than HF, which is in accord with previous experimental results (?.
Figure 9: Calculated HF Mole Fraction in a Stoichiometric HeptaneIAir Flame using the STANJAN Program
0.35 ,
t H F C - 1 2 5 +HFC-l34a ++ HFC-227ea + HFC-236fa t FC-3.1 . I O + FC-5.1.14
0 0.02 0.04 0.06 0.08 0.1 0.12 0.14
Agent Mole Fraction
5. Chemical Nature of the Fuel Following on fiom point 4 above, whether or not the flame becomes hydrogen limited will also depend on the chemical nature of the &el. All of test data refers to heptane as fuel. Very dif€erent fuels, e.g. wood or other Class A materials, or gaseous fuels such as methane might be expected to cause different bebaviour with some of the agents. This is another area of study.
316 HOTWC.96
4.2 Modelling of HF Formation
12000
E pa 10000
.- 5
.
.- .- c m 8000
C a, 0 C 6000 0 0 U I
4000 ‘u 3 In 3 2000 2
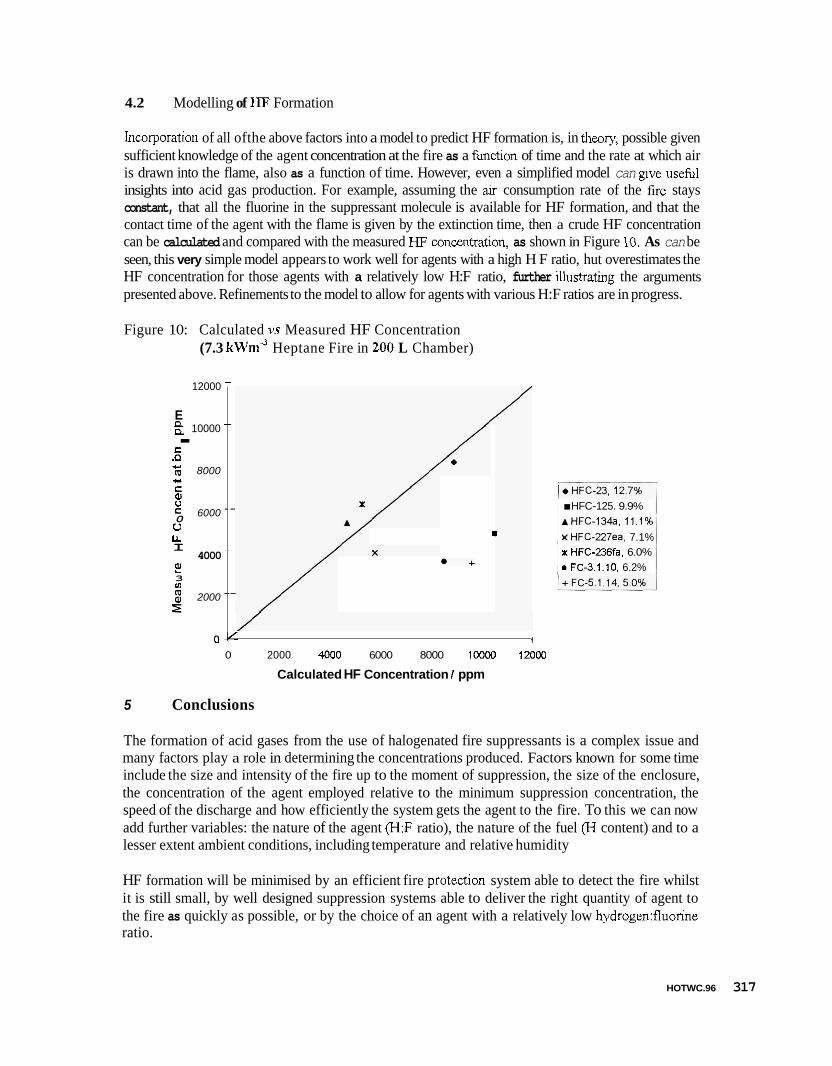
Incorporation of all ofthe above factors into a model to predict HF formation is, in theory, possible given sufficient knowledge of the agent concentration at the fire as a funmon of time and the rate at which air is drawn into the flame, also as a function of time. However, even a simplified model can g~ve useful insights into acid gas production. For example, assuming the air consumption rate of the fire stays constant, that all the fluorine in the suppressant molecule is available for HF formation, and that the contact time of the agent with the flame is given by the extinction time, then a crude HF concentration can be calculated and compared with the measured HF concentdon, as shown in Figure 10. As can be seen, this very simple model appears to work well for agents with a high H F ratio, hut overestimates the HF concentration for those agents with a relatively low H:F ratio, further flustrating the arguments presented above. Refinements to the model to allow for agents with various H:F ratios are in progress.
-
--
--
--
l
-~
--
Figure 10: Calculated vs Measured HF Concentration (7.3 kWm” Heptane Fire in 200 L Chamber)
I HFC-125. 9.9% AHFC-134a,11.1% xHFC-227ea, 7.1% x HFC-236fa. 6.0% 0 FC-3.1.10. 6.2%
O Y i
0 2000 4 W O 6000 8000 10000 12000
Calculated HF Concentration / ppm
5 Conclusions
The formation of acid gases from the use of halogenated fire suppressants is a complex issue and many factors play a role in determining the concentrations produced. Factors known for some time include the size and intensity of the fire up to the moment of suppression, the size of the enclosure, the concentration of the agent employed relative to the minimum suppression concentration, the speed of the discharge and how efficiently the system gets the agent to the fire. To this we can now add further variables: the nature of the agent (H:F ratio), the nature of the fuel (H content) and to a lesser extent ambient conditions, including temperature and relative humidity
HF formation will be minimised by an efficient fire protection system able to detect the fire whilst it is still small, by well designed suppression systems able to deliver the right quantity of agent to the fire as quickly as possible, or by the choice of an agent with a relatively low hydrogen:fluorine ratio.
HOTWC.96 317
6
10
14
References
P J DiNenno el al.; “Evalnation of Alternative Agents for Halon 1301 in Total Flooding Fire Suppression Systems”, Halon Options Technical Working Conference, Albuquerque, NM, May 11-13, 1993, 161-184.
R S Sheinson et al.; “Halon Replacement Total Flood Fire Testing, Intermediate Scale”, Halon Options Technical Working Conference, Albuquerque, NM, May 3-5, 1994,43-54.
T A Moore, D S Dierdolf and S R Skaggs; “Intermediate Scale (645 ft’) Fire Suppression Evaluation of NFPA 2001 Agents”, Halon Options Technical Working Conference, Albuquerque, NM, May 11-13, 1993, 115-128.
R Hansen, R Richards, G G Back and T A Moore; “USCG Full-scale Shipboard Testing of Gaseous Agents”, International CFC & Halon Conference, 1994, 386-394.
R S Sheinson el a/.; “Large Scale (840 m’) HFC Total Flooding Fire Extinguishment Results”, Halon Options Technical Working Conference, Albuquerque, NM, May 9-11 1995,637-648.
R S Sheinson and J I Alexander; “HF and HBr from Halon 1301 Extinguished Pan Fires”, Chemical and Physical Processes in Combustion, Eastern Section of the Combustion Institnte, Atlantic City, NJ, December 14-16, 1982, Paper 62.
D S Dierdorf, T A Moore and S R Skaggs; “Decomposition Product Analysis During Intermediate Scale (645 ft3) and Laboratory Scale (6.18 ft’) Testing of NFPA 2001 Agents”, Halon Alternatives Technical Working Conference, Albuquerque, NM, May 11-13, 1993, 635-647.
W D Smith, R S Sheinson el al,; “Halogen Acid Production Evaluation in an Intermediate Scale Halon 1301 Replacement Suppressant Test”, Interflam ’93, Oxford, Oxon, UK, 757-764.
M J Ferreira, C P Hanauska and M T Pike; “Thermal Decomposition Product Results Utilizing PFC-410 (3M Brand PFC-410 Clean Extinguishing Agent)”, Halon Alternatives Technical Working Conference, Albuquerque, NM, May 12-14, 1992,225-236.
M L Robin; “Fire Suppression with FM-200TM: Efficiency and Thermal Decomposition Products”, GLCC Report 75,918-3, December 1995.
BS5455 Part 9: 1984 (EN54-9) Annex E
W C Reynolds; STANJAN Chemical EquilibriumProgram v.3.89 (1987) Stanford University, CA.
G Linteris and G Gmurczyk; “Parametric Study of Hydrogen Fluoride Formation in Suppressed Fires”, Halon Options Technical Working Conference, Albuquerque, NM, May 3-5, 1995, 227-238.
R D W Kemmitt and D W A Sharp; “Fluorides of the Main Group Elements”, in “Advances in Fluorine Chemistly”, 4, Butterworths, London, 1965, 159-160.
318 HOTWC.98


![5. Ant Colony Optimization - cs.unibo.it · bining elements taken by different solutions (as is the case of evolution strategies [11] and genetic [ 43] or bionomic [ 56] algorithms)](https://img.pdfslide.us/doc/110x75/5f5159e6e5f918157102cb60/5-ant-colony-optimization-csuniboit-bining-elements-taken-by-different-solutions.jpg)