Embed Size (px)
Citation preview

Moving from Data Warehousing to
Decision Support
Dr. Bruce Hellinga
Feb. 28, 2013

Prior to Data Warehousing
Problem
definition
Analysis
Characteristics:
• Limited data
• spreadsheet tools applicable
• But small sample limits confidence in results
• Analysis difficult to reproduce
• Data not (systematically) archived
• Ad-hoc quality control

Data Warehousing
Data Archive
(Warehouse)
Characteristics:
• Large quantity of data
• Increased confidence in results, but…
• Quality control an issue
• Require more robust analysis tools
• Analyst needs to pull data/information from
warehouse to identify problems and causes
Automated data collection systems
• AVL/APC
• Farecard
Beyond Data Warehousing
• Wide variety of terms in use:
– Decision Support System (DSS)
– Business Intelligence (BI)
– Expert System
– Intelligent Agent (IA)
All are about automating the
transformation of data to information
that is useful

The Four Pillars
Quality
Assurance
(QA)
Measures Of
Performance
(MOP)
Push and
Pull
Assisted/
Automated
Diagnosis

P1: Quality Assurance • Data Errors (Reality different from recorded data)
Scheduled Actual
HOLIDAY INN TERMINAL
SMART!CENTRES CAMBRIDGE
CAMRIDGE CENTRE
TERMINAL
AINSLIE STREET TERMINAL
0
1
2
3
4
5
6
7
8
9
10
-21 -18 -15 -12 -9 -6 -3 0 3 6 9 12 15 18 21 24 27 30
Dis
tan
ce (
km
)
Time (minutes)
Route 51 - GRT
Schedule deviation

P1: Quality Assurance
• Data Anomalies
– Data are accurate but should not be used for
calculating performance measures and/or for
decision making

Cumulative
Relative
Frequency
Travel Time
(minutes)
100%
85%
All weather conditions
Excluding snow storms

AINSLIE STREET TERMINAL
SMART!CENTRES CAMBRIDGE
FAIRVIEW
CHARLES TERMINAL
UPTOWN WATERLOO
McCORMICK
CONESTOGA MALL
0
5
10
15
20
25
30
35
40
0 10 20 30 40 50 60 70 80 90 100 110 120
Dis
tan
ce
(k
m)
Time (minutes)
iXpress 200; Departing 5:15pm 42 minutes
But it is not always easy to determine whether data are
erroneous, anomalies, or valid!

P2: Measures of Performance
• With rich, precise data, it is possible to
compute many measures of performance,
but significant care is required.
• Example: Schedule adherence
– MOP = % “on-time”
– “on-time” = does not depart early and does
not arrive more than 3 minutes late.

18.8%
14.4%
10.7%
7.7%
5.9%
4.6%
0%
2%
4%
6%
8%
10%
12%
14%
16%
18%
20%
> 0s early > 15s early > 30s early > 45s early > 60s early > 75s early
Fra
cti
on
of
ob
se
rva
tio
ns
de
pa
rtin
g m
ore
th
an
X s
ec
on
ds
ea
rly
# observations (i.e. departures from time points) = 127,622

P3: Automating Diagnosis
• Questions:
1. What are the problems?
2. What are the (likely) causes of these
problems?
3. How do we solve the problem?
Data Warehouse

P4: Push and Pull
• An Intelligent DSS should identify problems and
notify the appropriate people at the appropriate
time with the appropriate information so they can
make the appropriate decision
– Relevant information (alerts) are pushed out from the
system automatically
– Still retain the ability for an analyst to “pull”
information for custom queries

Leveraging the data
• Transit data is not only valuable for the
transit operator and/or transit user!

Signalized Intersections
• Transit Operator
– Delays at signalized intersections increase operating
costs and decrease quality of service
– Can implement TSP or queue jump lanes, but where?
• Signals Manager
– Inadequate LOS necessitates improved signal timings
• Infrastructure Planning
– Calibrate planning models
– Identify corridors approaching capacity for which
capital expansion will be required
All of these activities require data about
existing conditions at the intersections
AND
we don’t know ahead of time which
intersections we need data for.

Stopped delay
(d)
Distance (X)
Signalized intersection 1
Each point is from a particular
bus on a given run (e.g. route,
date, and time of day)
Archived AVL/APC Data
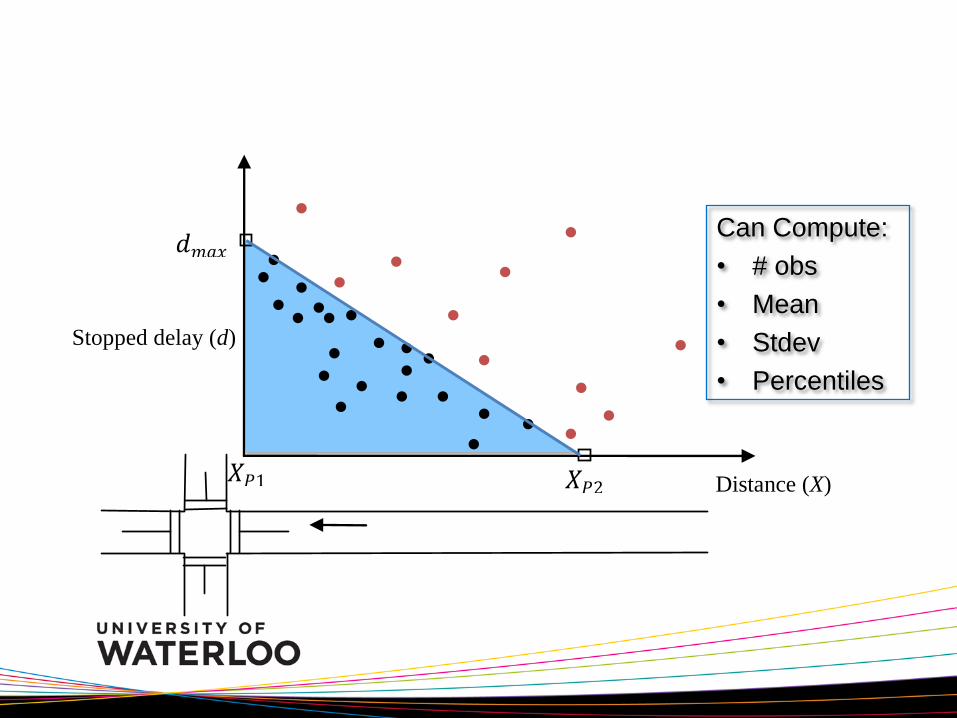
Stopped delay (d)
Distance (X) 𝑋𝑃2
𝑑𝑚𝑎𝑥
𝑋𝑃1
Can Compute:
• # obs
• Mean
• Stdev
• Percentiles

GIS Data
• Transit routes
• Signalized
intersections

A

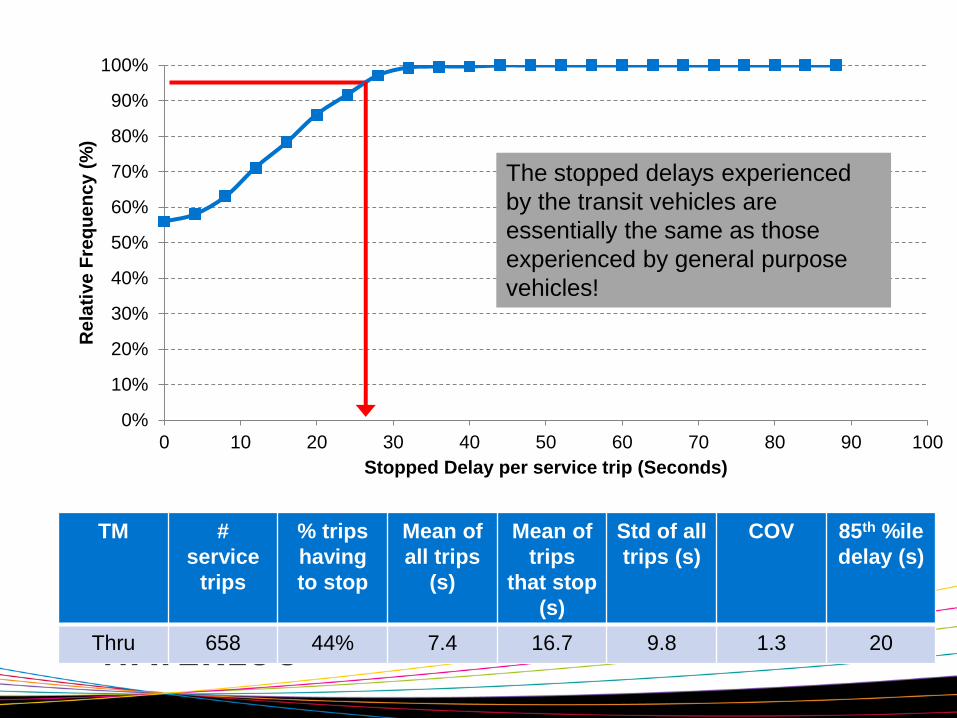
Total stopped delay per service trip due to
traffic signal
Route 200 dn (University@Phillip to University@Albert)
0
5
10
15
20
25
30
35
40
45
50
16:30 16:40 16:50 17:00 17:10 17:20 17:30 17:40 17:50 18:00
Sto
pp
ed
De
lay (
s)
Time of Day
0% 20% 40% 60%
0
4
8
12
16
20
24
28
32
36
40
44
48
Relative Frequency (%)
Sto
pp
ed
Dela
y (
Seco
nd
s)
TM #
service
trips
% trips
having
to stop
Mean of
all trips
(s)
Mean of
trips
that stop
(s)
Std of all
trips (s)
COV 85th %ile
delay (s)
Thru 658 44% 7.4 16.7 9.8 1.3 20
0%
10%
20%
30%
40%
50%
60%
70%
80%
90%
100%
0 10 20 30 40 50 60 70 80 90 100
Re
lati
ve
Fre
qu
en
cy (
%)
Stopped Delay per service trip (Seconds)
The stopped delays experienced
by the transit vehicles are
essentially the same as those
experienced by general purpose
vehicles!

0 10 20 30 40 50 60
52: DUNDAS@Easton to HESPELER/WATER@Coronation/Dundas
52: KING@River to FAIRWAY@King
11: OTTAWA@Alpine to OTTAWA@Homer Watson
51: PINEBUSH@Walmart&Home Depot to HESPELER@Eagle And Pinebush
5: ERB@Beechwood And Gateview to FISCHER-HALLMAN@Thorndale
16: HOMER WATSON@Doon South Rd And Monarch Tr to HOMER…
10: DOON VILLAGE@Pioneer to HOMER WATSON@ManitouAndDoon Village
201: FISCHER-HALLMAN@McGarry to FISCHER HALLMAN@Greenbrook And…
10: WILSON@Kingsway to FAIRWAY@Wilson
8: Terminal to FAIRWAY@Fairview Park Mall
15: LACKNER@Keewatin to VICTORIA@Natchez
3: OTTAWA@Alpine to OTTAWA@Homer Watson
9: NORTHFIELD@Highpoint to NORTHFIELD@Skylark
53: FRANKLIN@Clyde to FRANKLIN@Savage
23: N/A to FAIRWAY@Fairview Park Mall
110: HOMER WATSON@Doon South Rd And Monarch Tr to HOMER…
64: CONCESSION@Bishop to HESPELER@Dunbar
9: N/A to NORTHFIELD@Kraus
61: Terminal to HOMER WATSON@Conestoga College
21: KING@Conestoga Mall to KING@Northfield
Mean Stopped Delay (s)
Ranking the Route Segments on the basis of signal delays
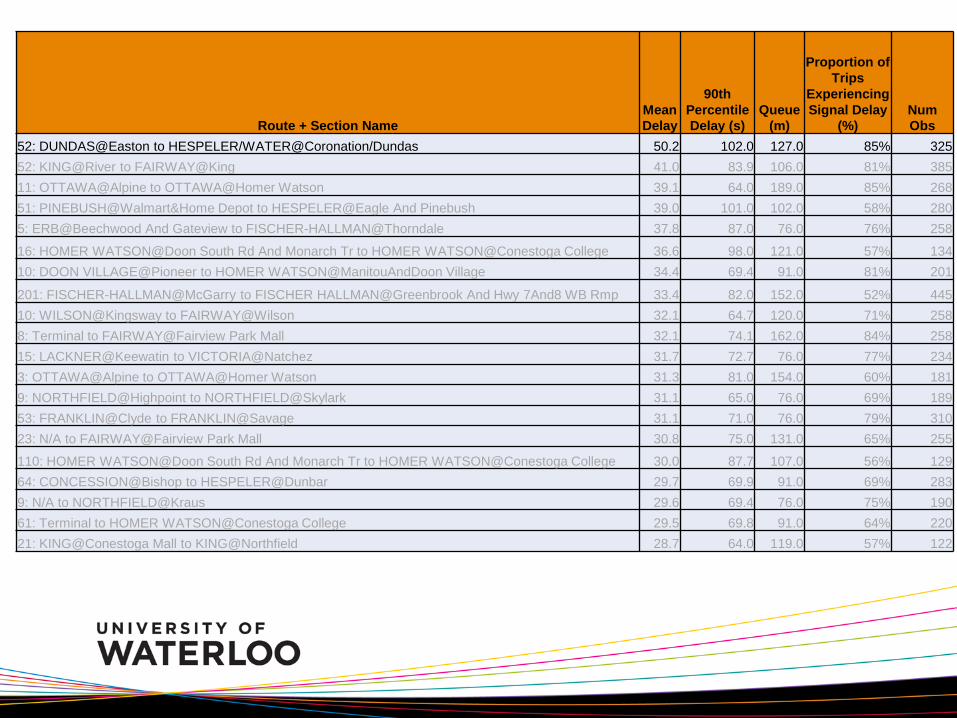
Route + Section Name Mean
Delay
90th
Percentile
Delay (s) Queue
(m)
Proportion of
Trips
Experiencing
Signal Delay
(%) Num
Obs
52: DUNDAS@Easton to HESPELER/WATER@Coronation/Dundas 50.2 102.0 127.0 85% 325
52: KING@River to FAIRWAY@King 41.0 83.9 106.0 81% 385
11: OTTAWA@Alpine to OTTAWA@Homer Watson 39.1 64.0 189.0 85% 268
51: PINEBUSH@Walmart&Home Depot to HESPELER@Eagle And Pinebush 39.0 101.0 102.0 58% 280
5: ERB@Beechwood And Gateview to FISCHER-HALLMAN@Thorndale 37.8 87.0 76.0 76% 258
16: HOMER WATSON@Doon South Rd And Monarch Tr to HOMER WATSON@Conestoga College 36.6 98.0 121.0 57% 134
10: DOON VILLAGE@Pioneer to HOMER WATSON@ManitouAndDoon Village 34.4 69.4 91.0 81% 201
201: FISCHER-HALLMAN@McGarry to FISCHER HALLMAN@Greenbrook And Hwy 7And8 WB Rmp 33.4 82.0 152.0 52% 445
10: WILSON@Kingsway to FAIRWAY@Wilson 32.1 64.7 120.0 71% 258
8: Terminal to FAIRWAY@Fairview Park Mall 32.1 74.1 162.0 84% 258
15: LACKNER@Keewatin to VICTORIA@Natchez 31.7 72.7 76.0 77% 234
3: OTTAWA@Alpine to OTTAWA@Homer Watson 31.3 81.0 154.0 60% 181
9: NORTHFIELD@Highpoint to NORTHFIELD@Skylark 31.1 65.0 76.0 69% 189
53: FRANKLIN@Clyde to FRANKLIN@Savage 31.1 71.0 76.0 79% 310
23: N/A to FAIRWAY@Fairview Park Mall 30.8 75.0 131.0 65% 255
110: HOMER WATSON@Doon South Rd And Monarch Tr to HOMER WATSON@Conestoga College 30.0 87.7 107.0 56% 129
64: CONCESSION@Bishop to HESPELER@Dunbar 29.7 69.9 91.0 69% 283
9: N/A to NORTHFIELD@Kraus 29.6 69.4 76.0 75% 190
61: Terminal to HOMER WATSON@Conestoga College 29.5 69.8 91.0 64% 220
21: KING@Conestoga Mall to KING@Northfield 28.7 64.0 119.0 57% 122

R52Up; DUNDAS@Easton to
HESPELER/WATER@Coronation/Dundas

Route + Section Name Mean
Delay
90th
Percentile
Delay (s) Queue
(m)
Proportion of
Trips
Experiencing
Signal Delay
(%) Num
Obs
52: DUNDAS@Easton to HESPELER/WATER@Coronation/Dundas 50.2 102.0 127.0 85% 325
52: KING@River to FAIRWAY@King 41.0 83.9 106.0 81% 385
11: OTTAWA@Alpine to OTTAWA@Homer Watson 39.1 64.0 189.0 85% 268
51: PINEBUSH@Walmart&Home Depot to HESPELER@Eagle And Pinebush 39.0 101.0 102.0 58% 280
5: ERB@Beechwood And Gateview to FISCHER-HALLMAN@Thorndale 37.8 87.0 76.0 76% 258
16: HOMER WATSON@Doon South Rd And Monarch Tr to HOMER WATSON@Conestoga College 36.6 98.0 121.0 57% 134
10: DOON VILLAGE@Pioneer to HOMER WATSON@ManitouAndDoon Village 34.4 69.4 91.0 81% 201
201: FISCHER-HALLMAN@McGarry to FISCHER HALLMAN@Greenbrook And Hwy 7And8 WB Rmp 33.4 82.0 152.0 52% 445
10: WILSON@Kingsway to FAIRWAY@Wilson 32.1 64.7 120.0 71% 258
8: Terminal to FAIRWAY@Fairview Park Mall 32.1 74.1 162.0 84% 258
15: LACKNER@Keewatin to VICTORIA@Natchez 31.7 72.7 76.0 77% 234
3: OTTAWA@Alpine to OTTAWA@Homer Watson 31.3 81.0 154.0 60% 181
9: NORTHFIELD@Highpoint to NORTHFIELD@Skylark 31.1 65.0 76.0 69% 189
53: FRANKLIN@Clyde to FRANKLIN@Savage 31.1 71.0 76.0 79% 310
23: N/A to FAIRWAY@Fairview Park Mall 30.8 75.0 131.0 65% 255
110: HOMER WATSON@Doon South Rd And Monarch Tr to HOMER WATSON@Conestoga College 30.0 87.7 107.0 56% 129
64: CONCESSION@Bishop to HESPELER@Dunbar 29.7 69.9 91.0 69% 283
9: N/A to NORTHFIELD@Kraus 29.6 69.4 76.0 75% 190
61: Terminal to HOMER WATSON@Conestoga College 29.5 69.8 91.0 64% 220
21: KING@Conestoga Mall to KING@Northfield 28.7 64.0 119.0 57% 122

R11IB; OTTAWA@Alpine to OTTAWA@Homer Watson
189m

Key Points
• Need to get the pillars right!
– QA; MOP; Diagnosis; Push & Pull
• Automating Diagnosis is not trivial – but
big payback
• Leverage the Archived AVL/APC data
– Distribute cost of DSS over more entities in
organization.
Photo Sources
Slide 2: http://paraelink.org/bmk3k4/bmk3k4_3.htm
Slide 3: GRT buses: www.therecord.com; GPS: www.gpscentral.ca; Passenger counter:
www.parvus.com
Slide 6: detour sign: http://embracingthedetour.com/detours-part-ii-day-52/; snow:
www.guelphmercurary.com; Octoberfest parade: www.therecord.com; temporary bus
stop: www.flickr.com