Embed Size (px)
Citation preview
F r o m D a t a G a t h e r i n g t o Resources Assessment:
A Hol is t ic V i e w o f P e t r o l e u m G e o l o g y
Hernani A. F. Chaves ~ and M. Effie Lewis 2
~Department of Geology/Geophysics, University of the State of Rio de Janei- ro, Rio de Janeiro, Brazil, and
zDepartment of Computer Science, Massachusetts Institute of Technology, Cambridge, Massachusetts 02139, USA
To integrate geological data to obtain an interpretat ion of the ge-
ology and natural resources of an area, we need a methodology that
provides a holistir approach, addressing all basic issues in geological
relations as well as uncertainties that arise w i th the evolution of basic
geological knowledge of an area.
In spite of the major role played by geoinformaticsmthe applica.
t ion of mathematics, statistics, and computer science to solve geo-
logical p rob lems~we do not yet have a properly designed method
for organizing geological data, including raw data, conceptual models,
modeling results, and geological Integration. Such a rapid method
should provide for updating of existing interpretations based on new
data or new theories.
A systematic v iew of data integration and Interpretation is im.
portant in petroleum exploration and petroleum engineering. We point
ou t the more striking tools already available but of restricted use and
some of the possible solutions for known problems that still require
research and development.
Key words:.
Petroleum geology
Exploration
Natural resources
Multidisciplinary data integration
Data storage
Geocoded data bases
12 I �9 1994 Oxford University Press 0961-1444/94/$4.00
Introduction Assessing energy and mineral resources of an area or a country is challenging and requires ingenuity and crea- tivity. Because of the paucity of methods for direct de- tection of hydrocarbons, evaluating sedimentary basins for energy resources is largely subjective.
Assessing resources requires sound geological knowl- edge and at least above-average familiarity with math- ematics, statistics, and economics. Resource assessments are normally accomplished by highly qualified profes- sionals, resulting in separation between the assessor and the exploration geologist.
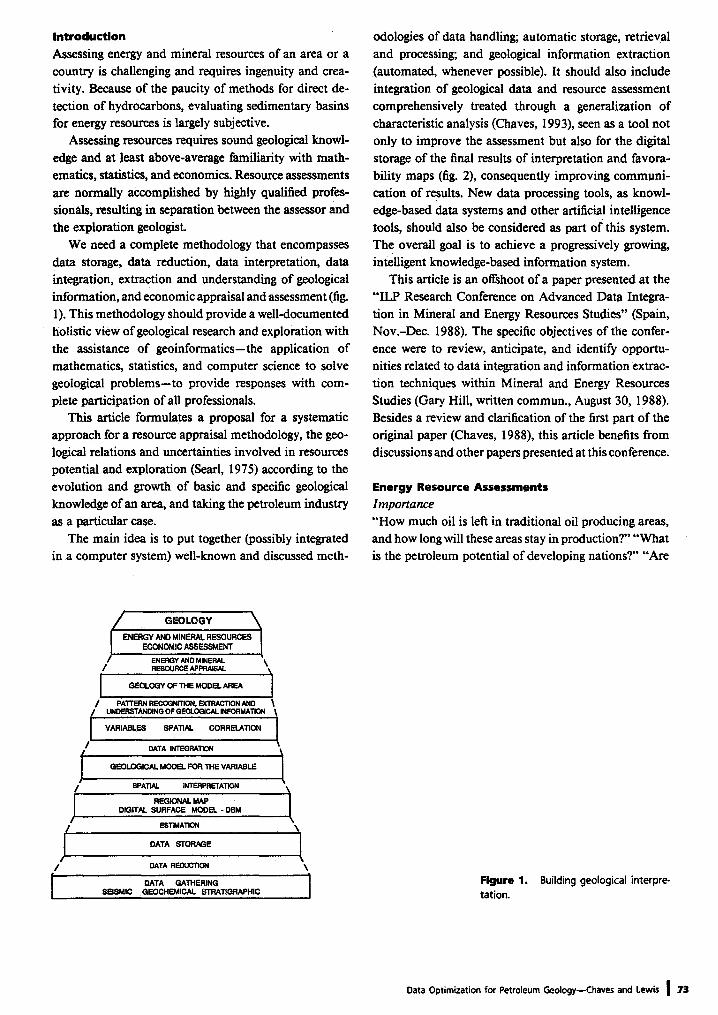
We need a complete methodology that encompasses data storage, data reduction, data interpretation, data integration, extraction and understanding of geological information, and economic appraisal and assessment (fig. 1). This methodology should provide a well-documented holistic view of geological research and exploration with the assistance of geoinformatics--the application of mathematics, statistics, and computer science to solve geological problems--to provide responses with com- plete participation of all professionals.
This article formulates a proposal for a systematic approach for a resource appraisal methodology, the geo- logical relations and uncertainties involved in resources potential and exploration (Searl, 1975) according to the evolution and growth of basic and specific geological knowledge of an area, and taking the petroleum industry as a particular case.
The main idea is to put together (possibly integrated in a computer system) well-known and discussed meth-
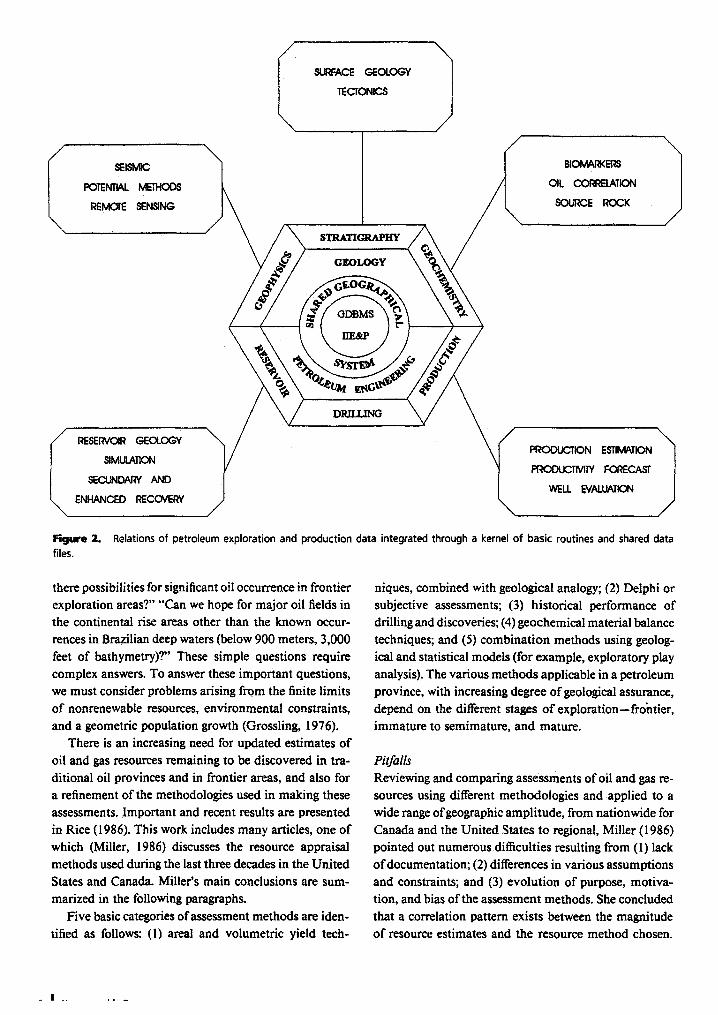
odologies of data handling; automatic storage, retrieval and processing; and geological information extraction (automated, whenever possible). It should also include integration of geological data and resource assessment comprehensively treated through a generalization of characteristic analysis (Chaves, 1993), seen as a tool not only to improve the assessment but also for the digital storage of the final results of interpretation and favora- bility maps (fig. 2), consequently improving communi- cation of results. New data processing tools, as knowl- edge-based data systems and other artificial intelligence tools, should also be considered as part of this system. The overall goal is to achieve a progressively growing, intelligent knowledge-based information system.
This article is an offshoot of a paper presented at the "'ILP Research Conference on Advanced Data Integra- tion in Mineral and Energy Resources Studies" (Spain, Nov.-Dec. 1988). The specific objectives of the confer- ence were to review, anticipate, and identify opportu- nities related to data integration and information extrac- tion techniques within Mineral and Energy Resources Studies (Gary Hill, written commun., August 30, 1988). Besides a review and clarification of the first part o f the original paper (Chaves, 1988), this article benefits from discussions and other papers presented at this conference.
Energy Resource Assessments Importance "How much oil is left in traditional oil producing areas, and how long will these areas stay in production?" "'What is the petroleum potential of developing nations? .... Are
/
/
J /
[
Q~OLOGY \ I ENERGY AND MINERAL RESOURCES
j J ECONOMIC ASSESSMENT ENERGY AND MINERAL
/ RESOURCE APPRAISAL
i GEOLOGY OF THE MODEL AREA
/ PATTERN R E C ~ EXTRACTION AND UNDERSTANDING OF GEOLOGICAL ~FORMATION
VARIABLES SPATIAL CORRELATION
DATA INTEGRATION
GEOLOG~AL MODe. FOR THE VARIABLE
SPATIAL INTERPRETATK~I
REGIONAL MAP D|GffAL SURFACE MODEL - DSM
~ATION
DATA 8TOFU~IE
SEISMIC
DATA RE[~JCTION
DATA GATHERING GEOCHEMICAL STRAT~GRAPHIC
\
L \
I Figure 1. tation.
Building geological interpre-
Data Optimization for Petroleum Geology--Chaves and Lewis ~ 73
,.~I~ACE G~OLOGY
TECTONICS
POTENTIAL METHODS OIL CORRELATION
REMOTE SENSING SOURCE ROCK
STRATIGRAPHY
GEOLOGY
1 GDBMS
Dpn .l.r~G
PROOUCTION EffrlMATION SlMULATI(~
PRODUCTNIIY F-Of~CAST SECIJNDARY AND
WELL EVALLIA'rI(DN ,~ ENHANCED RECOVERY /
Figure 2. files.
Relations of petroleum exploration and production data integrated through a kernel of basic routines and shared data
there possibilities for significant oil occurrence in frontier exploration areas? .... Can we hope for major oil fields in the continental rise areas other than the known occur- rences in Brazilian deep waters (below 900 meters, 3,000 feet of bathymetry)?" These simple questions require complex answers. To answer these important questions, we must consider problems arising from the finite limits of nonrenewable resources, environmental constraints, and a geometric population growth (Grossling, 1976).
There is an increasing need for updated estimates of oil and gas resources remaining to be discovered in tra- ditional oil provinces and in frontier areas, and also for a refinement of the methodologies used in making these assessments. Important and recent results are presented in Rice (1986). This work includes many articles, one of which (Miller, 1986) discusses the resource appraisal methods used during the last three decades in the United States and Canada. Miller's main conclusions are sum- marized in the following paragraphs.
Five basic categories of assessment methods are iden- tified as follows: (1) areal and volumetric yield tech-
niques, combined with geological analogy; (2) Delphi or subjective assessments; (3) historical performance of drilling and discoveries; (4) geochemical material balance techniques; and (5) combination methods using geolog- ical and statistical models (for example, exploratory p lay analysis). The various methods applicable in a petroleum province, with increasing degree of geological assurance, depend on the different stages of exploration--frontier, immature to semimature, and mature.
Pitfalls Reviewing and comparing assessments of oil and gas re- sources using different methodologies and applied to a wide range of geographic amplitude, from nationwide for Canada and the United States to regional, Miller (1986) pointed out numerous difficulties resulting from (1) lack of documentation; (2) differences in various assumptions and constraints; and (3) evolution of purpose, motiva- tion, and bias of the assessment methods. She concluded that a correlation pattern exists between the magnitude of resource estimates and the resource method chosen.
_ | . . . . .
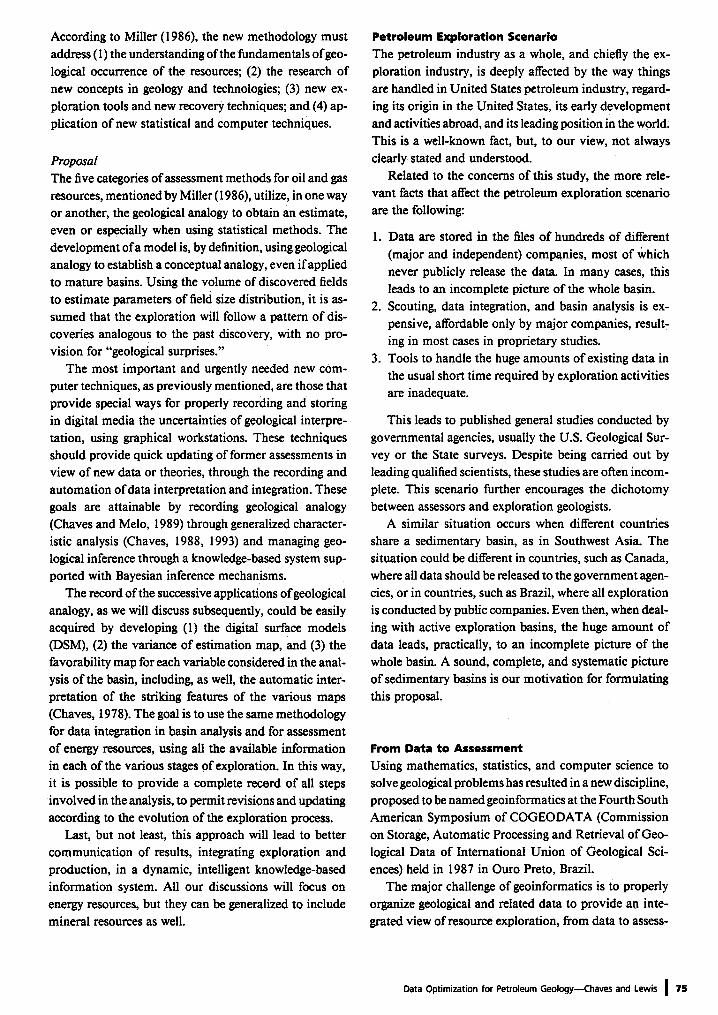
According to Miller (1986), the new methodology must address (l) the understanding of the fundamentals of geo- logical occurrence of the resources; (2) the research of new concepts in geology and technologies; (3) new ex- ploration tools and new recovery techniques; and (4) ap- plication of new statistical and computer techniques.
Proposal The five categories of assessment methods for oil and gas resources, mentioned by Miller (1986), utilize, in one way or another, the geological analogy to obtain an estimate, even or especially when using statistical methods. The development of a model is, by definition, using geological analogy to establish a conceptual analogy, even if applied to mature basins. Using the volume of discovered fields to estimate parameters of field size distribution, it is as- sumed that the exploration will follow a pattern of dis- coveries analogous to the past discovery, with no pro- vision for "geological surprises."
The most important and urgently needed new com- puter techniques, as previously mentioned, are those that provide special ways for properly recording and storing in digital media the uncertainties of geological interpre- tation, using graphical workstations. These techniques should provide quick updating of former assessments in view of new data or theories, through the recording and automation of data interpretation and integration. These goals are attainable by recording geological analogy (Chaves and Melo, 1989) through generalized character- istic analysis (Chaves, 1988, 1993) and managing geo- logical inference through a knowledge-based system sup- ported with Bayesian inference mechanisms.
The record of the successive applications of geological analogy, as we will discuss subsequently, could be easily acquired by developing (1) the digital surface models (DSM), (2) the variance of estimation map, and (3) the favorability map for each variable considered in the anal- ysis of the basin, including, as well, the automatic inter- pretation of the striking features of the various maps (Chaves, 1978). The goal is to use the same methodology for data integration in basin analysis and for assessment of energy resources, using all the available information in each of the various stages of exploration. In this way, it is possible to provide a complete record of all steps involved in the analysis, to permit revisions and updating according to the evolution of the exploration process.
Last, but not least, this approach will lead to better communication of results, integrating exploration and production, in a dynamic, intelligent knowledge-based information system. All our discussions will focus on energy resources, but they can be generalized to include mineral resources as well.
Petro leum Explorat ion Scenario
The petroleum industry as a whole, and chiefly the ex- ploration industry, is deeply affected by the way things are handled in United States petroleum industry, regard- ing its origin in the United States, its early development and activities abroad, and its leading position in the world. This is a well-known fact, but, to our view, not always clearly stated and understood.
Related to the concerns of this study, the more rele- vant facts that affect the petroleum exploration scenario are the following:
1. Data arc stored in the files of hundreds of different (major and independent) companies, most of ~vhich never publicly release the data. In many cases, this leads to an incomplete picture of the whole basin.
2. Scouting, data integration, and basin analysis is ex- pensive, affordable only by major companies, result- ing in most cases in proprietary studies.
3. Tools to handle the huge amounts of existing data in the usual short time required by exploration activities are inadequate.
This leads to published general studies conducted by governmental agencies, usually the U.S. Geological Sur- vey or the State surveys. Despite being carded out by leading qualified scientists, these studies are often incom- plete. This scenario further encourages the dichotomy between assessors and exploration geologists.
A similar situation occurs when different countries share a sedimentary basin, as in Southwest Asia. The situation could be different in countries, such as Canada, where all data should be released to the government agen- cies, or in countries, such as Brazil, where all exploration is conducted by public companies. Even then, when deal- ing with active exploration basins, the huge amount of data leads, practically, to an incomplete picture of the whole basin. A sound, complete, and systematic picture of sedimentary basins is our motivation for formulating this proposal.
F r o m D a t a t o A s s e s s m e n t
Using mathematics, statistics, and computer science to solve geological problems has resulted in a new discipline, proposed to be named geoinformatics at the Fourth South American Symposium of COGEODATA (Commission on Storage, Automatic Processing and Retrieval of Geo- logical Data of International Union of Geological Sci- ences) held in 1987 in Ouro Preto, Brazil.
The major challenge of geoinformatics is to properly organize geological and related data to provide an inte- grated view of resource exploration, from data to assess-
Data Optimization for Petroleum Geology--Chaves and Lewis I , ,
GEOINFORNATICS
o r g ~ n l z a t ; 1 o n Deta model Det~ updo'txng
da~',e, bese ~ ~ f dxgxt, a l - �9 represen~c~tzon sys4;em
r e t e ' x e v ~ l ~n~ lgsxs
reduotxon xnterpretotlon
s t o r - a g e
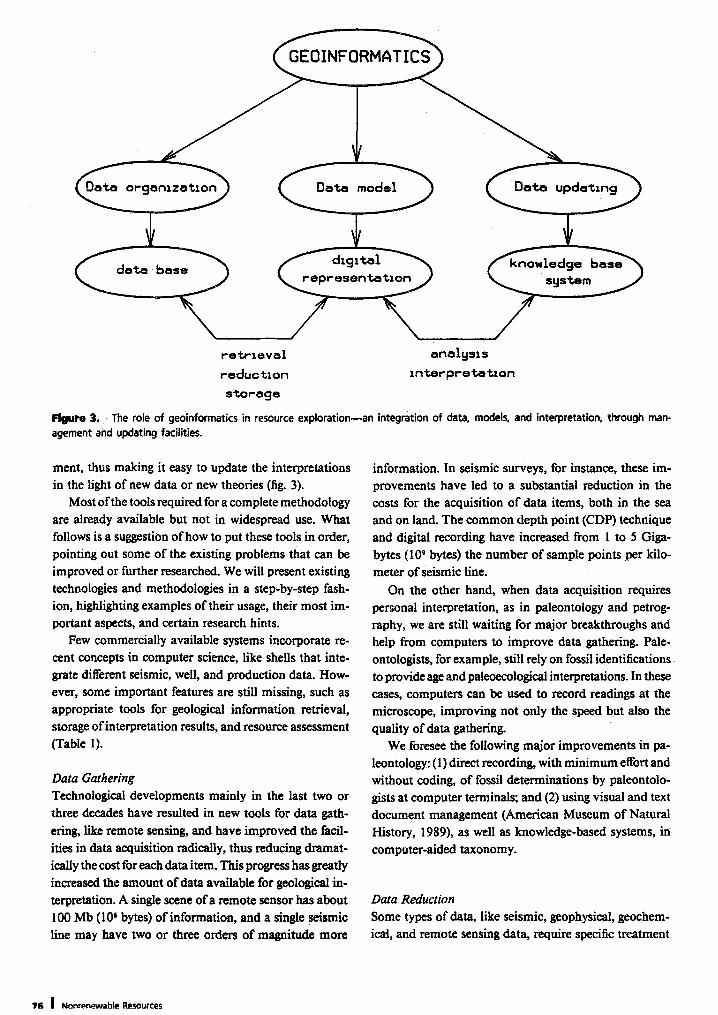
Figure 3, The role of geoinformatics in resource explorationman integration of data, models, and interpretation, through man- agement and updating facilities.
ment, thus making it easy to upclate the interpretations in the light of new data or new theories (fig. 3).
Most ofthe tools required for a complete methodology are already available but not in widespread use. What follows is a suggestion of how to put these tools in order, pointing out some of the existing problems that can be improved or further researched. We will present existing technologies and methodologies in a step-by-step fash- ion, highlighting examples of their usage, their most im- portant aspects, and certain research hints.
Few commercially available systems incorporate re- cent concepts in computer science, like shells that inte- grate different seismic, well, and production data. How- ever, some important features are still missing, such as appropriate tools for geological information retrieval, storage of interpretation results, and resource assessment (Table 1).
Data Gathering Technological developments mainly in the last two or three decades have resulted in new tools for data gath- ering, like remote sensing, and have improved the facil- ities in data acquisition radically, thus reducing dramat- ically the cost for each data item. This progress has greatly increased the amount of data available for geological in- terpretation. A single scene e ra remote sensor has about I00 Mb (10 s bytes) of information, and a single seismic line may have two or three orders of magnitude more
information. In seismic surveys, for instance, these im- provements have led to a substantial reduction in the costs for the acquisition of data items, both in the sea and on land. The common depth point (CDP) technique and digital recording have increased from 1 to 5 Giga- bytes (109 bytes) the number of sample points per kilo- meter of seismic line.
On the other hand, when data acquisition requires personal interpretation, as in paleontology and petrog- raphy, we are still waiting for major breakthroughs and help from computers to improve data gathering. Pale- ontologists, for example, still rely on fossil identifications to provide age and paleoecological interpretations. In these cases, computers can be used to record readings at the microscope, improving not only the speed but also the quality of data gathering.
We foresee the following major improvements in pa- leontology: (I) direct recording, with minimum effort and without coding, of fossil determinations by paleontolo- gists at computer terminals; and (2) using visual and text document management (American Museum of Natural History, 1989), as well as knowledge-based systems, in computer-aided taxonomy.
Data Reduction Some types of data, like seismic, geophysical, geochem- ical, and remote sensing data, require specific treatment
71 | Nonren~wab|e Resources
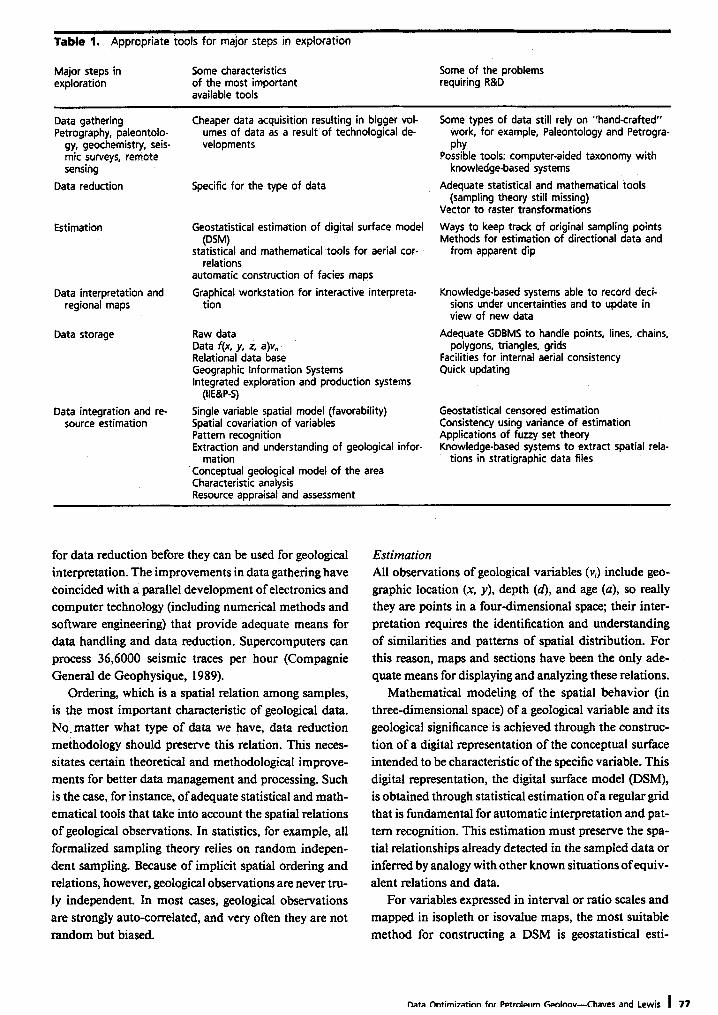
Table 1, Appropriate tools for major steps in exploration
Major steps in Some characteristics exploration of the most important
available tools
Some of the problems requiring R&D
Data gathering Petrography, paleontolo-
gy, geochemistry, seis- mic surveys, remote sensing
Data reduction
Estimation
Data interpretation and regional maps
Dat a storage
Data integration and re- source estimation
Cheaper data acquisition resulting in bigger Vol- umes of data as a result of technological de- velopments
Specific for the type of data
Geostatistical estimation of digital surface model (DSM)
statistical and mathematical tools for aerial cor- relations
automatic construction of facies maps
Graphical workstation for interactive interpreta- tion
Raw data Data f(x, y, z, a)v. Relational data base Geographic Information Systems Integrated exploration and production systems
(lIE&P-S) Single variable spatial model (favorability) Spatial covariation of variables Pattern recognition Extraction and understanding of geological infor-
mation "Conceptual geological model of the area Characteristic analysis Resource appraisal and assessment
Some types of data still rely on "hand-crafted" work, for example, Paleontology and Petrogra- phy
Possible tools: computer-aided taxonomy with knowledge-based systems
Adequate statistical and mathematical tools (sampling theory still missing)
Vector to raster transformations
Ways to keep track of original sampling points Methods for estimation of directional data and
from apparent dip
Knowledge-based systems able to record deci- sions under uncertainties and to update in view of new data
Adequate GDBMS to handle points, lines, chains. polygons, triangles, grids
Facilities for internal aerial consistency Quick updating
Geostatistical censored estimation Consistency using variance of estimation Applications of fuzzy set theory Knowledge-based systems to extract spatial rela-
tions in stratigraphic data files
for data reduction before they can be used for geological interpretation. The improvements in data gathering have coincided with a parallel development of electronics and computer technology (including numerical methods and software engineering) that provide adequate means for data handling and data reduction. Supercomputers can process 36,6000 seismic traces per hour (Compagnie General de Geophysique, 1989).
Ordering, which is a spatial relation among samples, is the most important characteristic of geological data. No.matter what type of data we have, data reduction methodology should preserve this relation. This neces- sitates certain theoretical and methodological improve- ments for better data management and processing. Such is the case, for instance, of adequate statistical and math- ematical tools that take into account the spatial relations of geological observations. In statistics, for example, all formalized sampling theory relies on random indepen- dent sampling. Because of implicit spatial ordering and relations, however, geological observations are never tru- ly independent. In most cases, geological observations are strongly auto-correlated, and very often they are not random but biased.
Estimation
All observations of geological variables (v~) include geo- graphic location (x, y), depth (d), and age (a), so really they are points in a four-dimensional space; their inter- pretation requires the identification and understanding of similarities and patterns of spatial distribution. For this reason, maps and sections have been the only ade- quate means for displaying and analyzing these relations.
Mathematical modeling of the spatial behavior (in three-dimensional space) of a geological variable and its geological significance is achieved through the construc- tion of a digital representation of the conceptual surface intended to be characteristic of the specific variable. This digital representation, the digital surface model (DSM), is obtained through statistical estimation of a regular grid that is fundamental for automatic interpretation and pat- tern recognition. This estimation must preserve the spa- tial relationships already detected in the sampled data or inferred by analogy with other known situations of equiv- alent relations and data.
For variables expressed in interval or ratio scales and mapped in isopleth or isovalue maps, the most suitable method for constructing a DSM is geostatistical esti-
13.1t.1 (3ntimiTatinn for Petroleum GeoloovmChaves and Lewis | 77
I l l IV V II
TD
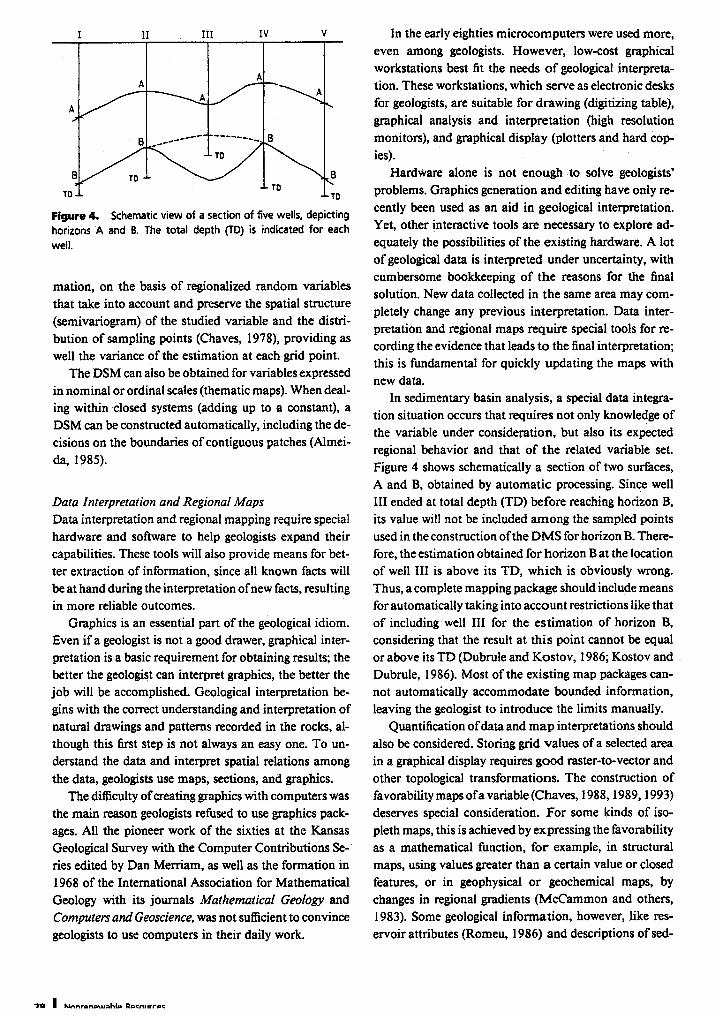
Figure 4. Schematic view of a section of five wells, depicting horizons A and B. The total depth (TD) is indicated for each well.
B
marion, on the basis of regionalized random variables that take into account and preserve the spatial structure (semivariogram) of the studied variable and the distri- bution of sampling points (Chaves, 1978), providing as wcU the variance of the estimation at each grid point.
The DSM can also be obtained for variables expressed in nominal or ordinal scales (thematic maps). When deal- ing within closed systems (adding up to a constant), a DSM can be constructed automatically, including the de- cisions on the boundaries of contiguous patches (Almei-
da, 1985).
Data Interpretation and Regional Maps Data interpretation and regional mapping require special hardware and software to help geologists expand their capabilities. These tools will also provide means for bet- ter extraction of information, since all known facts will be at hand during the interpretation ofnew facts, resulting in more reliable outcomes.
Graphics is an essential part of the geological idiom. Even if a geologist is not a good drawer, graphical inter- pretation is a basic requirement for obtaining results; the better the geologist can interpret graphics, the better the job will be accomplished. Geological interpretation be- gins with the correct understanding and interpretation of natural drawings and patterns recorded in the rocks, al- though this first step is not always an easy one. To un- derstand the data and interpret spatial relations among
the data, geologists use maps, sections, and graphics.
The difficulty of creating graphics with computers was
the main reason geologists refused to use graphics pack-
agcs. All the pioneer work of the sixties at the Kansas
Geological Survey with the Computer Contributions Sc-
ties edited by Dan Merriam, as well as the formation in
1968 of the International Association for Mathematical
Geology with its journals Mathematical Geology and Computers and Geoscience, was not sufficient to convince geologists to use computers in their daily work.
In the early eighties microcomputers were used more, even among geologists. However, low-cost graphical workstations best fit the needs o f geological interpreta- tion. These workstations, which serve as electronic desks for geologists, are suitable for drawing (digitizing table), graphical analysis and interpretation (high resolution monitors), and graphical display (plotters and hard cop-
ies). Hardware alone is not enough to solve geologists'
problems. Graphics generation and editing have only re- cently been used as an aid in geological interpretation. Yet, other interactive tools are necessary to explore ad- equately the possibilities of the existing hardware. A lot of geological data is interpreted under uncertainty, with cumbersome bookkeeping of the reasons for the final solution. New data collected in the same area may com- pletely change any previous interpretation. Data inter- pretation and regional maps require special tools for re- cording the evidence that leads to the final interpretation; this is fundamental for quickly updating the maps with new data.
In sedimentary basin analysis, a special data integra- tion situation occurs that requires not only knowledge of the variable under consideration, but also its expected regional behavior and that of the related variable set. Figure 4 shows schematically a section of two surfaces, A and B, obtained by automatic processing. Since well III ended at total depth (TD) before reaching horizon B, its value will not be included among the sampled points used in the construction of the DMS for horizon B. There- fore, the estimation obtained for horizon B at the location of well III is above its TD, which is obviously wrong. Thus, a complete mapping package should include means for automatically taking into account restrictions like that of including well III for the estimation of horizon B, considering that the result at this point cannot be equal or above its TD (Dubrule and Kostov, 1986; Kostov and �9 Dubrule, 1986). Most of the existing map packages can- not automatically accommodate bounded information, leaving the geologist to introduce the limits manually.
Quantification of data and map interpretations should also be considered. Storing grid values of a selected area in a graphical display requires good raster-to-vector and other topological transformations. The construction of favorability maps of a variable (Chaves, 1988, 1989, 1993) deserves special consideration. For some kinds of iso- pleth maps, this is achieved by expressing the favorability as a mathematical function, for example, in structural maps, using values greater than a certain value or closed features, or in geophysical or geochemical maps, by changes in regional gradients (McCammon and others, 1983). Some geological information, however, like res- ervoir attributes (Romeu, 1986) and descriptions of sed-
imentary facies, has an inherent uncertainty. For in- Stance, in the study of submarine fans with subsurface data, identification is certain when the samples come definitively from the proximal or the distal part of the fan. The question is how to pinpoint the different bound- aries. A mathematical tool well-suited for describing this kind of natural phenomena is fuzzy set theory or the special ease of fuzzy numbers.
Geological processes shape the framework affecting ecological, geochemical, and tectonic paleoenvironments recorded in the rocks. All data in a basin relate to each other, and 'they are consistently and coherently inter- preted as a result of implicit geometrical relations. These relations are not easily searched for or displayed by the usual means available for data processing. Currently, the geologist must look to stratigraphic data, for instance, to discover unconformities, pinch-outs, and so on. This task is more easily accomplished on a computer than man- ually. In the early days, when people tried to persuade geologists to use computers, it was said that in the United States there was more oil hidden in company data files than would possibly be found by direct field exploration. We are not convinced that these times are over, and not only in the United States. We are sure that these hidden oil potentials can be modeled by rule-based knowledge
systems.
Geological Data Storage Research should be undertaken to develop better statis- tical and mathematical tools for areal correlation and other types of relations. Geological information and geo- logical relations must be handled by a geocoded data base management system (GDBMS), a tool that should pro- vide support for the definition and storage of spatial data and relations: points, lines or chains, polygons, triangles, and grids. These kinds of relations are not in the scope of the relational data base model, the most commonly used model for data base management systems (DBMS). Only recently, commercially available data base man- agement systems (DBMS) began providing some of these features (Stoneebraker and Rowe, Digital Equipment Co/poration, 1986). Geographic Information Systems (GIS) are a major improvement on classical relational data base but are still restricted to two dimensions.
Lines or chains are spatial relations of points, polygons are spatial relations of lines, and both are relations in a plane (two-dimensional space); they require ways to be handled in a GDBMS. A natural extension of these re- lations would be solids and hypersolids, bodies in three- and four-dimensional spaces.
Triangles and grids must be stored in a GDBMS be- cause they are necessary for volumetric calculations, and for the storage of the various maps ofgeological variables
in a digital surface model (DSM). In this way, it is possible to keep track of the rationale behind the interpretation and enables quick updating of maps and interpretations whenever new data are available.
To express and store data in DSM form or in favor- ability maps, especially in petroleum geology, it is fun- damental to allow for data integration either through regular grid operations, for instance, in the calculation of regular and consistent isopachs (Rice, 1986), or through more elaborate techniques like characteristic analysis, which allows extraction and understanding of geological information (Chaves, 1988, 1993).
Since ordering is an inherent characteristic of geolog- ical observations, a GDBMS should also provide for the internal areal consistency of data. Presently most data bases in petroleum geology are only repositories of in- formation collected systematically through drilling activ- ities. Only in revision or in regional studies are these data bases reinterpreted and areal inconsistencies detected. Some of these inconsistencies are simply due to recording errors; however, some indicate important geological facts not yet known,
Spatial consistency (three dimensions or higher) of the data in the GDBMS requires tools for quick updating of the existing data base with new data and for direct de- tection of spatially unmatched relations. This will enable a kind of management by exception, obtaining prompt identifications of what might be a sample error or a new and unknown geological situation. At least some of these problems can be solved by (1) using mathematical tech- niques, such as geostatistical censored estimation, (2) providing bounded estimation, for example, for a new well to be drilled, or (3) using the variance of estimations to check the new variable value.
We must improve the method currently used to update DSM's. Today, DSM's are updated by completely recal- culating the model, resulting in the loss of refinement, chiefly on areas of low-density sampling. What is needed is a localized updating procedure that uses algorithms for fitting and adjusting potential surfaces. However, in this case, how far from the sample point should the DSM be adjusted? We must find a way for these algorithms to keep track of original sample points in relation to esti- mated ones, thus preserving the data samples already existing in the data base.
Interactive Integrated Exploration and Production Sys- tems In the early stages of exploration of a sedimentary basin, and in the past even after these stages, the regular pattern of surveys would be, for example, surface geology data gathering, interpretation, and reporting, followed by a geophysical survey with the same sequence of activities.
Data Optimization for Petroleum Geology--Chaves and Lewis J 79
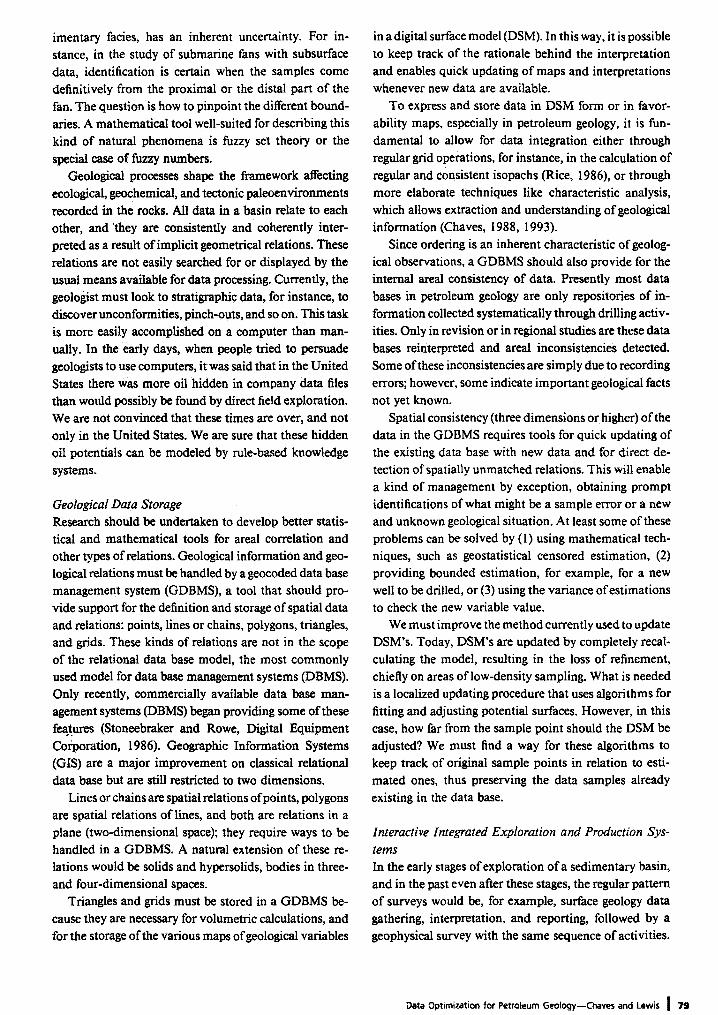
Figure 5. Comparison of in tandem surveys with parallel surveys in resource assessment.
IN TANDEN INTERPRETATIONS
I d#a xeductlon
I
PARALLEL INTERPRETATIONS
concurrent d~t~ zedultoa
mmmm~t
Even if the different surveys were somewhat synchro- nous, only with the release of the final report would their results be known to other people working in the same area, with the exception of personal contacts among spe- cialists. This has led, in many cases, to different inter- pretations for the same areas in a basin.
These hierarchical studies and reports, here designated "in tandem surveys," are superseded by what are called "parallel surveys," by analogy with computer architec- ture (fig. 5). With the use of computers, especially in the digital recording of seismic data, different kinds of sur- veys are assessed concurrently in an active exploration basin so as not to lose commercial opportunities. How- ever, we still need reports to pass information from one department to another in the same company. Even if the various departments share the same computer installa- tions, there is often a lack of integration of data bases; users must know the idiosyncrasies of each file or data base and apply interface programs between applications.
With workstations and effective GDBMS, we can have not only parallel surveys but parallel reporting on stra- tegic exploration and production decisions. For this, we need interactive integrated exploration and production systems (IIE&P-S).
In this case, different data bases (exploration, geo- physical, geochemical, production, and reservoir) and ap- plications will share not only computer systems but also common geographical information, using a unique kernel of basic routines for processing and intelligent man-ma- chine interfaces with all the peripherals (fig. 2). Since the data bank will contain not only original data but also various results stored as sections, DSM's, and favora- bility maps, users will have access to last-minute inter- pretations, allowing for better communication and in- creased knowledge of sedimentary basins.
There are no systems like this one, complete and in- tegrated, that provide for all the needs and possibilities from the beginning of exploration to enhanced recovery. A subset of IIE&P-S, not to be confused with the one
previously mentioned, includes systems suited for joint projects of geologists, geophysicists and petroleum en- gineers in restricted areas of a basin, for example, as in integrated studies ofreservoirs. Such systems are becom- ing more commonly available (Finder, 1988; Leonard, 1988; Integral, 1989; Discovery, 1990), even though they cannot deal with spatially defined objects and relations.
Data Integration and Resource Estimation The whole process culminates in an economic appraisal and assessment (fig. 1). The assessment provides a sys- tematic view of the geological variables, their character- istics, and uncertainties regardless of how generalized or elaborate the assessment method used, from areal and volumetric-yield techniques to elaborate and sophisti- cated combination methods using geological and statis- tical models (for example, exploratory play analysis).
Once in while, a team pursues basin analysis studies using in tandem surveys. For those studies, a snapshot of the data and interpretations available is taken to pro- mol~ data integration and resource appraisal. The main dissatisfactions with these studies are (1) the previously, mentioned separation between the geologist in charge of field data collection and interpretation and the praod- tioners of basin analysis and resource assessment; (2) initial interpretations based on different techniques, such as structural geology and seismic, do not mutually benefit each other; (3) major disagreements tb~t would require greater efforts to be removed; (4) in very active areas, the results may be out of date when completed; and (5) only when studies are completed will the results improve new exploration campaigns.
By adopting the integration methodologies here pro- posed, with convenient storage facilities and proper use of graphical workstations, it is possible to have a system- atic view of the whole process. Participants would know exactly the import.ance of their data and the relevance of new findings, especially the unexpected one that may
| Nonrenewable Resources
ultimately be responsible for changing exploration phi- losophy.
The use of characteristic analysis (CHARAN) works in all the methodologies proposed. One important aspect
is the adoption of the favorability maps for each relevant variable in the basin analysis. These maps reflect the most
favorable places for each variable, according to the in- terpretation of the geologist in charge of surveying. Thus, we can have the favorability map prepared by the struc-
turalist, paleontologist, geochemist, geophysicist, and so on. For the assessment team, the problem will be to apply CHARAN to (1) add these maps together, to find major
mismatches, chiefly between groups of variables; (2) point out areas requiring or worthy of more detailed work; (3) decide on new plays or new prospects; and (4) evaluate not only the total amount of possible resources to be
discovered. By applying quantified geological analogy, this evaluation could be used to estimate the size distri- bution of these possible occurrences (Chaves, 1989, 1993).
The proposed approach allows the evaluation of un- certainties for each variable used and for each step used to interpret these variables. Actually, these uncertainties start, in oil exploration, with the variables chosen to de- scribe the targets, since, as previously mentioned, there is currently no method for direct detection of hydrocar- bons. In this respect, CHARAN can be considered a type of discriminant function, identifying the variables with higher discriminant power, thus allowing us to verify the model we are using for the accumulations or plays. CHARAN can be applied to any phenomena and not restricted to regional studies. It can be used to charac- terize reservoirs and to describe oil pools or any other discrete sample space (Chaves, 1988, 1993).
Conclusions The modem methods available for data gathering in ge- ology result in a plethora of information. This informa- tion must be integrated to construct a sound interpreta- t ion of the geology and natural resources of an area.
.Despite the increased use of computers to process this
huge volume of data, a complete methodology is lacking. Computer graphical workstations can act as an extension of geologists' minds, providing for a well-documented holistic approach for a total resource appraisal method- ology that addresses all the basic issues relative to the geological relations and uncertainties involved in each step of resource appraisal and exploration.
The techniques for resource assessment require data integration using subjective knowledge. Normally, sub- jective criteria are difficult to state clearly.
Improvements in data storage management systems, allowing for spatial relations (three and four dimensions)
among graphically defined objects, and intelligent knowl- edge-based tools to explore the files of sedimentary basins for concealed statigraphic and structural relations can
provide for a data base management by exception that can benefit the whole exploration cycle.
Finally, general usage of characteristic analysis, a well- known technique for mineral resource assessment and
also proven to be useful for petroleum exploration, can
be used as a tool for (1) data integration in sedimentary basin analysis; (2) quantification of geological analogy
and petroleum assessment; and (3) indication of locations requiting or worthy of more detailed exploration efforts.
References Almeida, H.P., 1985, Geracao automatica de mapas tematicos:
apticacao a sistemas de dados ternados (Automatic Thematic Map Construction: Application to ternary data systems): Rio de Janeiro, Univ. Federal, COPPE, M. Sc. dissertation, 97 p.
American Museum of Natural History, 1989, Micro Based Mark I--System requirements: New York, Micropaleontology Press,
79 p. Compagnie Generale de Geophysique, 1989, Benchmarks in
seismic processing: Massy, France, 9 p. Chaves, H.A.F., 1978, Mapas batimetricos--Problemas de con-
strucao e analise automatica [Bathymetric maps--Problems in automatic construction and analysis]: Rio de Janeiro, Pon- tificia Universidade Catolica, M.Sc. dissertation.
-1988, Characteristic analysis applied to petroleum as- sessment of basins: ILP Research Conference on Advanced Data Integration in Mineral and Energy Resources Studies,
Sotogrande, Spain, November 1988, 28 p. -1993, Characteristic analysis as an oil exploration tool,
in Davis J.C. and Hertzfeld U.C., eds., Computers in geology: 25 years of progress: Oxford, Oxford University Press, pp.
99-I 12. Chaves, H.A.F., and Mr J.A., 1989, Characteristic analysis
(CHAR.AN) applied to oil exploration: 28th International Geological Congress, Washington, D.C., Session M2: Quan- titative Methods in Regional Resource Assessments [Ab- stracts].
Digital Equipment Corporation, 1986, The spatial/II database
management system takes the petroleum industry into the
future: Marlboro, Massachusetts. Discovery in: COGNSEIS DEVELOPMENT, Software Prod-
ucts for Exploration.
Dubrule, O., and Kostov, C., 1986, An interpolation method taking into account inequalities constraints--l. Methodolo-
gy: Mathematical Geology, v. 18, no. 1, p. 33-51. Finder, 1988, An executive summary: Massy, France, Explo-
ration Systems Inc. Grossling, B., 1976, Window on oil--A survey of world petro-
leum sources: London, The Financial Times Ltd., 140 p.
Data Optimization for Petroleum Geolocjy~Chaves and Lewis I 81
Integral- Company Generale de Gcophysique, Massy, France,
1989.
Kostov, C., and Dubrule, O., 1986, An interpolation method
taking into account inequality constraints--II. Practical ap-
proach: Mathematical Geology, v. 18, no. l, p, 53-73.
Leonard, J.A., 1988, Part I a: PC applications with well-file data:
Geobyte, November, p. 27-34.
McCammon, R.B., Botbol, J.M., McCarthy, J.H., and Gott,
G.B., 1983, Characteristic analysis applied to multiple geo-
chemical anomalies over a concealed porphyry copper pros-
peel, Rowe Canyon, Nevada: American Institute of Mining,
Metallurgical and Petroleum Engineers Transactions, v. 272,
p. 1998-2002.
Miller, B.M., 1986, Resource appraisal methods: Choice and
outcome, in Rice, D.D., ed., Oil and gas assessment--Meth-
ods and applications: Tulsa, American Association of Petro-
leum Geologists, (AAPG Studies in Geology # 21), pp. 1-
25. Rice, D.D., ed., 1986, Oil and gas assessment--Methods and
applications: Tulsa, American Association of Petroleum Ge-
ologists, (AAPG Studies in Geology # 21), 267 p.
Romeu, R.K., 1986. Projeto logico para um banco de dados de
reservatorios de petroleo--uma aplicacao dos numeros di-
fusos (Logical design of a data bank for petroleum reser-
voi rs -an application of fuzzy numbers): Ouro Preto, School
of Mines, M. Sc. dissertation, 120 p.
Searl, M.F., 1975, Resource assessment and supply curve de-
velopment: Towards better methodologies, in Grenon, M.,
ed., First IIASA Conference on Energy Resources, Luxem-
bourg, Austria, CP-76, p. 71-83.4.
Stoneebraker, M., and Rowe, L.A., 1985, The design of POST-
CRESS. Berkeley, University of California, College of En-
gineeriog, Electronic Research Laboratory, Memorandum no.
UCB/ERL 85/95.
Received February 28, 1992; revised August 9, 1993; accepted
September 13, 1993.
Many thanks to Charles Thoman, who read the draft. The
ideas here exposed were discussed with colleagues Hilton P. de
Almeida, Jorge Della Favera, Jos6 A. Melo; however, all mis-
takes are the authors' responsibility.
The ideas presented here are a summary ofdiscussions, find-
ings, proposed solutions, and frustrations faced by the Geoin-
formatic Laboratory of PETRCBRAS Research Center (CENPES)
for more than a decade in its research on sedimentary basin
assessment. This summary paper also benefited from discussions
with the AI Croup at the ILP Conference in Spain and with Dr.
Mouchmino and Dr. Prax at Massy, France.
All figures were produced on the CAD system of the Geoin-
formatic Laboratory with the assistance of Nora de Castro Maia
and Ronaldo Pereira de Oliveira. The help of AIdo Araujo da
Costa was essential in revision and editing.
R3 | NnnrenewabJe Resources