Embed Size (px)
Citation preview
From Business Planning to Financial Modelling and Valuation
10 October 2008(You will remember what you were doing
the day of The Crash)
Michel ALLÉYvan de BEAUFFORTGEST D-422
|1
From Business Planning to Financial Modelling and Valuation
Agenda of the evening
• 18h00 – 18h15 Agenda alignment– Excel session 1st or 8th November from 10h to 13h (with laptop)
– Meetings with experts 7th November
– Final presentation 10th December
• 18h15 – 20h00 Business planning & valuation
• 20h15 – 21h15 The airlines universe
|2
From Business Planning to Financial Modelling and Valuation
1. Introductiona. Objective of the courseb. Concept of business strategyc. The Business Pland. Scope and contexte. Use of the Business Planf. Financial Model as part of the Business Plang. Elaborating the plan = An iterative process
Table of content (1/5)
|3
From Business Planning to Financial Modelling and Valuation
2. Business Planninga. Source of informationb. What does the Company do?c. Economic environmentd. Underlying marketse. Competitorsf. Cost structure and sales priceg. Capex requirementh. Working capital requirementsi. Porter analysis j. SWOT analysisk. Human resources
Table of content (2/5)
|4
From Business Planning to Financial Modelling and Valuation
3. Financial Modellinga. Introduction
1. Excel merits2. Recommendations3. Useful excel shortcuts4. Useful excel functions5. Build a Financial Model = Two parts job
b. Consolidation rulesc. Sales to EBITDAd. Depreciation, Capex and Working Capital Requirementse. P&L, balance sheet and cashflow statementf. Ratiosg. Risks assessment and sensitivity casesh. Optimizing the financial structure
Table of content (3/5)
|5
From Business Planning to Financial Modelling and Valuation
4. Valuationa. Actualization models
1. DCF2. DDM
b. Models based on multiples1. Listed multiples2. Transaction multiples
c. Other valuation methodologies1. Net Asset Value2. Valuation based on IRR / LBO models3. Pay-back
Table of content (4/5)
|6
From Business Planning to Financial Modelling and Valuation
5. Appendicesa. Bibliographyb. Value creation analysisc. Some goodies
Table of content (5/5)
|7
From Business Planning to Financial Modelling and Valuation
1. Introduction
|8
From Business Planning to Financial Modelling and Valuation
1. Introduction: a. Objectives of the course
To get yourself familiar with…
• How to produce a set of viable business assumptions?
• How to input these in a financial model?
• How to derive a valuation?
• Where to find hidden jewels?
• How to determine the appropriate financial structure of a company?
|9
From Business Planning to Financial Modelling and Valuation
1. Introduction: b. Concept of business strategy (1/5)
• « Strategy is a concept by which we are trying to bring coherence to a multitude of actions by different actors in the organization. As such it is a complement to both organization, and corporate culture which perform the same function »
• The de facto strategy of a company corresponds to the underlying pattern in its resource allocation decisions – the way it deploys not only financial resources, but also its best people, and senior manager’s time. In that sense ALL companies have a strategy, through not always a conscious one
|10
From Business Planning to Financial Modelling and Valuation
1. Introduction: b. Concept of business strategy (2/5)
• Most companies develop however a formal and explicit strategy
• The starting point of such strategic thinking is an assessment of the fit between:– the company environment (i.e. what might be done?)
– its capabilities (i.e. what can be done?)
– and its identity (i.e. what one want to do?)
• Such strategy formulation implies not only a phase of analysis, but also the more creative generation of options and the need for choices
|11
From Business Planning to Financial Modelling and Valuation
1. Introduction: b. Concept of business strategy (3/5)
• The strategy which results from an assessment can be defined as « a set of deliberate priorities in resource allocation which, by building and maintaining the company’s competitive advantage, will allow it to reach its objectives »
• Difference between a “strategy” and a “tactic”– Strategy involves the “big picture”. The overall plan, how the
campaign will achieve organizational goals and objectives. Strategic planning helps to determine how the organization will be positioned
– Tactics are activities specifically created and selected to reach specific and measurable objectives. Tactics are the actual ways in which the strategies are executed
– “Strategy is an art. Tactics are science” Carl von Clausewitz
|12
From Business Planning to Financial Modelling and Valuation
1. Introduction: b. Concept of business strategy (4/5)
• A statement of business strategy typically consists of the following elements:– a set of objectives– a business definition– a competitive positioning (e.g. dominance, differentiation or
focus)
– a consistent set of functional policies– priorities in resources allocation
• Mostly, strategies are interacting with daily operations
|13
From Business Planning to Financial Modelling and Valuation
1. Introduction: b. Concept of business strategy (5/5)
• Apart from the socio-economic-political environment, the starting point of the environmental analysis is to focus on the immediate industry competitive environment as it is today.
• Four elements need to be analyzed in terms of the current situation and of trends:1. Market (segments, customers,…)
2. Competition (direct and indirect)
3. Cost structure (value chain composition and drivers)
4. Technology (underlies cost structure)
Goal = Determination of key success factors
|14
From Business Planning to Financial Modelling and Valuation
• The Business Plan (BP) describes and quantifies the long term project of the management for the company– Describes
• Facts • In a coherent vision
– Quantifies• Figures• In a coherent framework
– This, over a long period of time• Extended period of time (3 to 10 years)
• Where periodicity is a function of the situation (year, half year, quarter, …)
1. Introduction:c. The Business Plan
|15
From Business Planning to Financial Modelling and Valuation
1. Introduction:d. Scope and context
• The BP refers to all dimensions of the Company– Products
– Marketing
– Production
– R&D
– Human Resources
– Finance
• The BP depends on the business context– Integrating the overall and industry business trends
– Integrating the present and future competition
– Integrating the specific constraints (e.g. shareholders, investment bankers, debt providers, …)
|16
From Business Planning to Financial Modelling and Valuation
1. Introduction:e. Use of the Business Plan
� The BP is an essential work in the life of a company� Start-up or existing businesses
� Opportunity to stand back from the day-to-day activities
� The BP gives guidelines for the management � A contract between management and shareholders / bankers
� The BP is an assessment tool for the shareholders in investment decisions� It shows the profitability and the dividend yield prospects
� It shows how much value can be created
� The BP is a tool to evaluate the performances of the management� Are the goals achieved or not?
|17
From Business Planning to Financial Modelling and Valuation
1. Introduction:f. Financial Model as part of the Business Plan (1/3)
� The Financial Model is the rational translation in financial terms of the content of the BP� Forecasts for Profit & Loss account (P&L), Balance Sheet (BS) and
CashFlow Statement (CFS)� Link to be made with historical accounts (if any >< Start-up)� Put in simple equation an ever more complex reality
� Its quality relies on the quality of the BP’s assumptions (as well as coherent building)
� Objective tool � From P&L to CFS (through BS) �Identification of the cash needs / surplus � Determination of the optimal financial structure (maximisation under constraints)
� Prerequisite material support to assess the company’s value in a second step
|18
From Business Planning to Financial Modelling and Valuation
1. Introduction:f. Financial Model components: quick reminder (2/3)• P&L or “Profit and Losses” statement or income statement :
– It summarizes a firm's financial transactions over an interval of time– It starts from sales (top line) and ends up at net profit (bottom line), taking into
consideration costs, amortization, financial charges
• Balance Sheet:– It is the picture of the assets and liabilities of a company, a snapshot of a firm's
financial resources and obligations at a single point in time– At the right side (Liabilities) is the inventory of how the company is financed from
long term to short term (top right: equity then long term financial debt, bottom right: short term suppliers debt)
– The left side (Assets) registers how the financing is employed, from long term assets (e.g. buildings or intangibles) to short term ones (e.g. cash)
– Hence,
• Cash Flow statement: – Shows a company's flow of cash– The money coming into the business is called cash inflow, and money going out
from the business is called cash outflow– The statement shows how changes in balance sheet and income accounts affect
cash and cash equivalents, and breaks the analysis down to operating, investing, and financing activities
|19
From Business Planning to Financial Modelling and Valuation
1. Introduction:f. Financial Model as part of the Business Plan (2/2)
� If the results of the Financial Model do not meet the expectations of the shareholders� Review all the drivers to see how to improve the value creation
dynamics
� See if you can change the assumptions of the BP through an alternative strategy (and an alternative management team if necessary)
� Do not invest in the company or in the project!!!
|20
From Business Planning to Financial Modelling and Valuation
1. Introduction:g. Elaborating the plan = An iterative process (1/2)
• Permanent discussions between the CFO and the other managers– What happens from the financial point of view when we want to
change some assumptions?
– Why is it interesting or impossible from the financial point of view to make other assumptions / strategy?
• Frequent discussions between the management and the shareholders
• Follow-up of an acquisition or of a restructuring process
• Negotiation tool for the company and its bankers
• Essential tool under a bankruptcy context
• Need to be a dynamic and continuous exercise
|21
From Business Planning to Financial Modelling and Valuation
1. Introduction:g. Elaborating the plan = An iterative process (2/2)
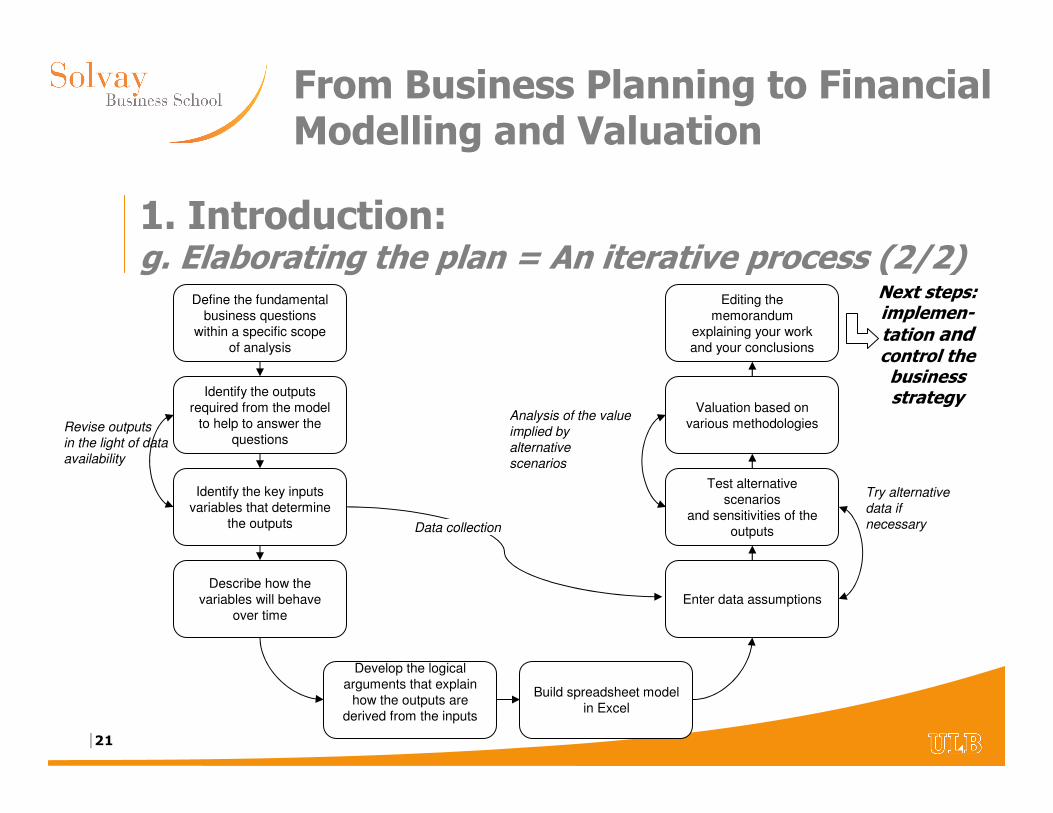
Define the fundamental
business questions
within a specific scope
of analysis
Identify the outputs
required from the model
to help to answer the
questions
Identify the key inputs
variables that determine
the outputs
Describe how the
variables will behave
over time
Develop the logical
arguments that explain
how the outputs are
derived from the inputs
Build spreadsheet model
in Excel
Enter data assumptions
Test alternative
scenarios
and sensitivities of the
outputs
Valuation based on
various methodologies
Editing the
memorandum
explaining your work
and your conclusions
Revise outputs
in the light of data
availability
Data collection
Try alternative
data if
necessary
Analysis of the value
implied by
alternative
scenarios
Next steps: implemen-tation andcontrol the business strategy
|22
From Business Planning to Financial Modelling and Valuation
2. Business Planning
|23
From Business Planning to Financial Modelling and Valuation
2. Business Planning:a. Source of information (1/2)
� Public sources of information about the business landscape as a starting point:� Industry studies (cf. Books, investment analysts, market research, ...)
� Company public information (cf. Annual reports, SEC filings, websites, bonds memorandum, IPO memorandum, promotional material, company histories, …)
� Business press: General newspapers (e.g. Wall Street Journal, Financial Times, ...), specialized industry trade journals, …
� Online services (e.g. Standards and Poor’s, Bloomberg, Reuters, JCF Group / Factset, Bureau van Dijk / Amadeus, Compustat, ...)
� Government sources (cf. Legal or tax documents, releases from antitrust or regulatory bodies)
� Trade associations, industry and company directories
|24
From Business Planning to Financial Modelling and Valuation
2. Business Planning:a. Source of information (2/3)
• A direct access to the company’s management is key:– Challenge preliminary conclusions about the business landscape
made on the basis of public information (bi-directional exercise)
– Further identification of business drivers and assumptions
• If a direct access to the company’s management is not possible, indirect contacts may be useful– Investment bankers
– Strategic consultants
– Accountants
– Lawyers
• Be careful with Non-Disclosure Agreements (NDA)
– Insurance brokers
– Competitors
– Suppliers
– Customers
|25
From Business Planning to Financial Modelling and Valuation
2. Business Planning:a. Source of information (3/3)
• Need to answer the following questions during the due diligence process (i.e. prior to financial modelling):1. What does the company do?
2. Impact of the economic environment?
3. Characteristics of the underlying markets?
4. Cost of sales structure?
5. Business cyclicality?
6. Capex program?
7. Working capital profile?
8. Standard audit procedure
– Accounting
– Legal
– Insurance
– Environmental
– Industrial
– Etc
|26
From Business Planning to Financial Modelling and Valuation
2. Business Planning:b. What does the Company do?
• Business– Comprehension of today’s situation (e.g. organic growth within an
historical perspective if any)
– Forecast of tomorrow’s evolution
• Which products?– Product mix
– Importance of Business Unit approach
– Life-cycle of products
– Product pipe-line
• Where are they sold?– Distribution networks / Type of customers (B2B / B2C)
– Nature of existing markets
– New markets?
|27
From Business Planning to Financial Modelling and Valuation
2. Business Planning:c. Economic environment (1/2)
• General economic prospects for the markets– GDP
– Demography
– Available income
– Conjuncture
• Influence of these prospects on the business
• Inflation prospects (Sales vs. Raw materials vs. Wages)
• Interest rates (impact for both sales and financial results)
• Political situation
• Legal framework
• Fiscal situation
• Exchange rates / Currency effects
|28
From Business Planning to Financial Modelling and Valuation
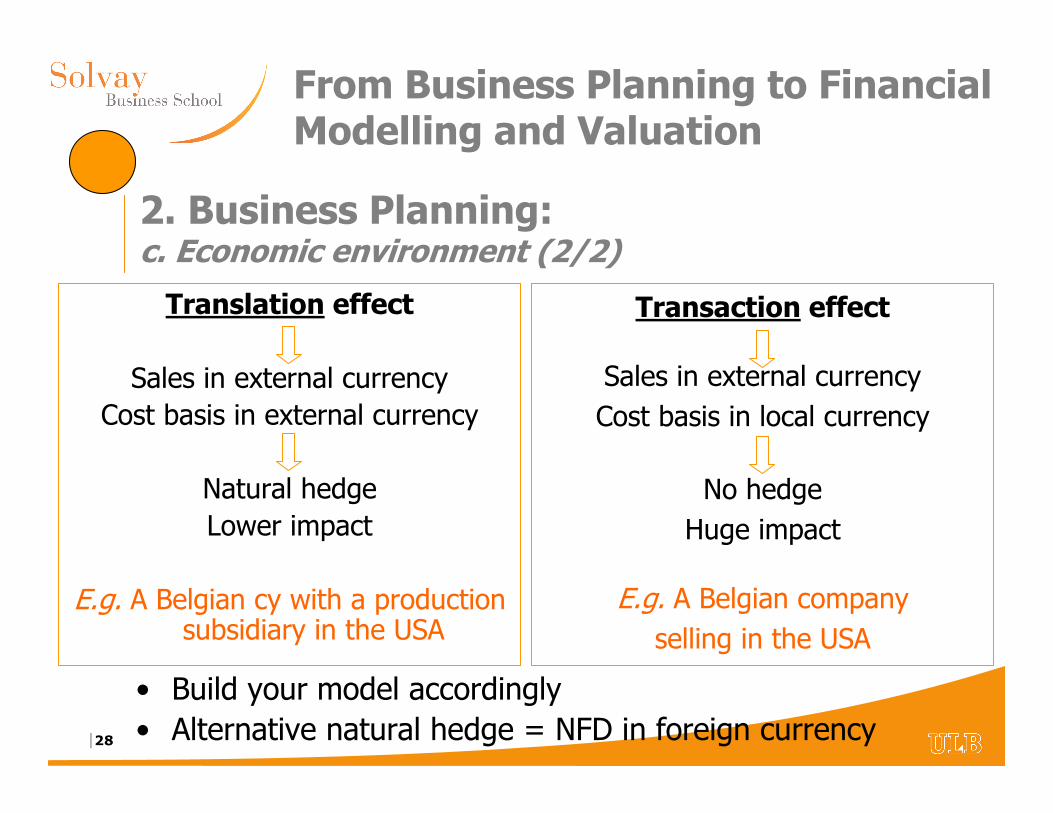
2. Business Planning:c. Economic environment (2/2)
Translation effect
Sales in external currency
Cost basis in external currency
Natural hedge
Lower impact
E.g. A Belgian cy with a production subsidiary in the USA
Transaction effect
Sales in external currency
Cost basis in local currency
No hedge
Huge impact
E.g. A Belgian company
selling in the USA
• Build your model accordingly
• Alternative natural hedge = NFD in foreign currency
|29
From Business Planning to Financial Modelling and Valuation
2. Business Planning:d. Underlying markets (1/2)
• Size of the markets– Today and in the future
– Historic and prospective evolution of prices and volumes
• Major customers (relative size)
• Major suppliers (relative size)
• Why and how are the markets changing?– Taste of the customers
– Innovative products and new technologies
• Segmentation of the markets
• Use of market studies (internal and / or external)
• Cyclicality characteristics
|30
From Business Planning to Financial Modelling and Valuation
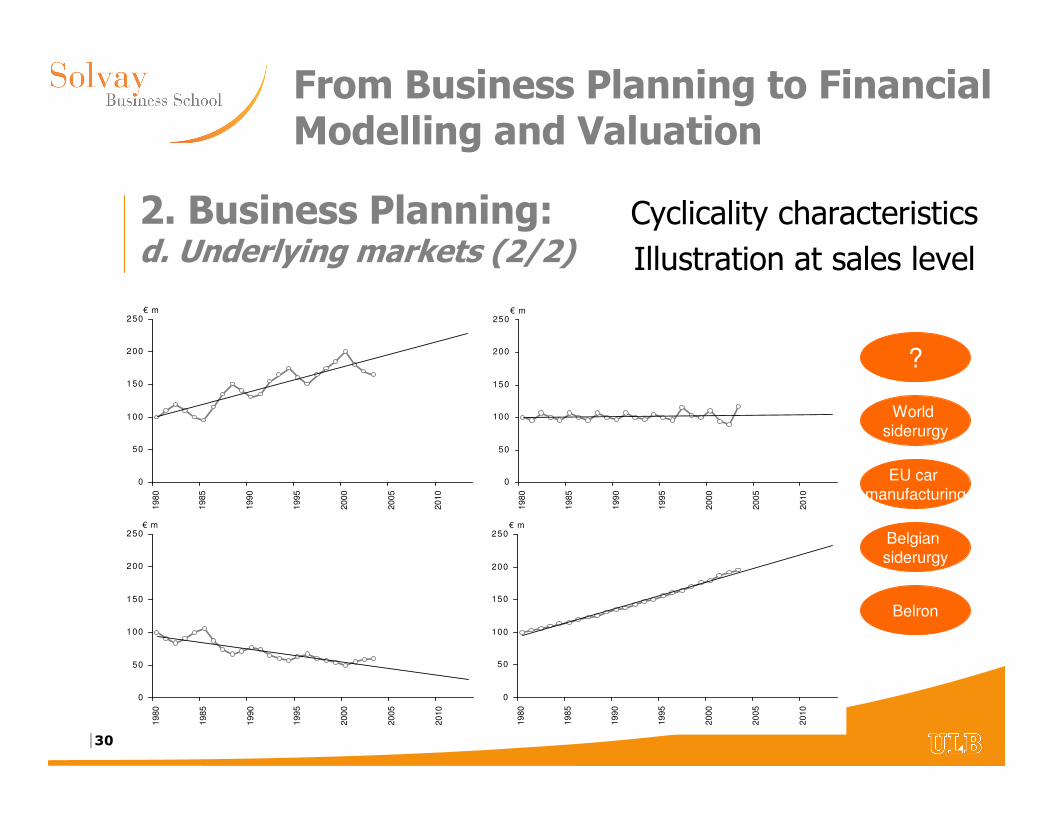
2. Business Planning:d. Underlying markets (2/2)
0
50
100
150
200
250
1980
1985
1990
1995
2000
2005
2010
€ m
0
50
100
150
200
250
19
80
19
85
19
90
19
95
20
00
20
05
20
10
€ m
0
50
100
150
200
250
1980
1985
1990
1995
2000
2005
2010
€ m
0
50
100
150
200
250
1980
1985
1990
1995
2000
2005
2010
€ m
Cyclicality characteristics
Illustration at sales level
World
siderurgy
EU car
manufacturing
Belgian
siderurgy
Belron
?
|31
From Business Planning to Financial Modelling and Valuation
2. Business Planning:e. Competitors (1/2)
• Who are they?• Where are they?• What is their market share (dynamic perspective)?• New entrants?
– Barriers to entry– Backward or downward integration dynamics– Sister industries
• Why should the customers go to competitors?• Present and future overcapacity?• Comparison of the products
– Price– Quality– Product range
|32
From Business Planning to Financial Modelling and Valuation
2. Business Planning:e. Competitors (2/2)
• What are the projects of the competitors?– Innovation– Price strategy– Financial situation
• Benchmarking is key– Operational – Financial
|33
From Business Planning to Financial Modelling and Valuation
2. Business Planning:f. Cost structure and sales price (1/2)
• Nature of the operating costs?– Fixed costs vs. variable costs– Sensitivity to external elements (currencies, raw materials, …)
– Translation effect vs. transaction effect
• What are the prices asked by the suppliers?– Today and tomorrow
– Can we buy cheaper or better?
• Ability to pass price increase through to clients?
• How fast will the salaries increase?
• Can we use new technologies?– To improve the productivity and to reduce the costs
– To improve the quality
|34
From Business Planning to Financial Modelling and Valuation
2. Business Planning:f. Cost structure and sales price (2/2)
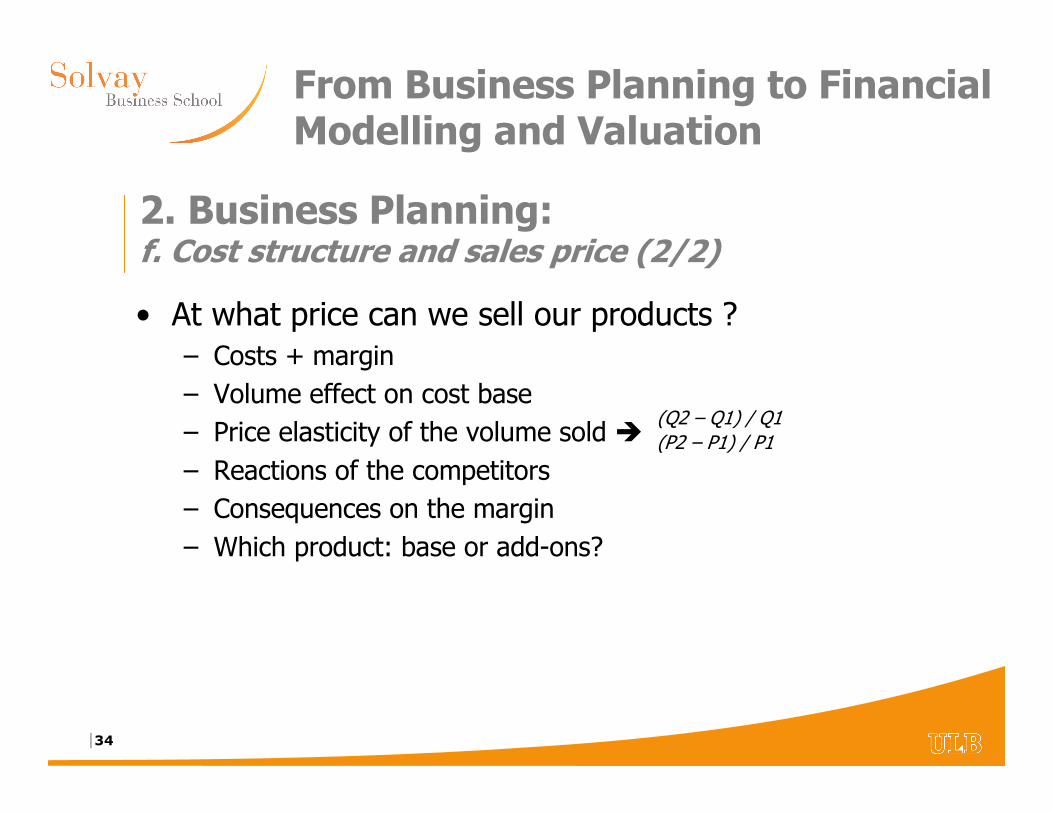
(Q2 – Q1) / Q1(P2 – P1) / P1
• At what price can we sell our products ?– Costs + margin
– Volume effect on cost base
– Price elasticity of the volume sold �
– Reactions of the competitors
– Consequences on the margin
– Which product: base or add-ons?
|35
From Business Planning to Financial Modelling and Valuation
2. Business Planning:g. Capex requirements (1/2)
• Which new fixed assets do we need / do you want?– Current status of the asset base
– Production facility requirements (size, layout, capacity, location)
– Amount / Timing / Flexibility
– Cost of opportunity
• Capex nature– Equipment requirements
– Maintenance capex vs. Expansion capex vs. Acquisitions / Disposals– Tangible vs. Intangible (IT)
• Research & Development?
• Commercial Investments– Advertising
– Start-up losses
|36
From Business Planning to Financial Modelling and Valuation
2. Business Planning:g. Capex requirements (2/2)
• Alternative scenarios– Financial or operational leasing
– Outsourcing
– Acquisitions
• Consequences on the P&L– Depreciation duration vs. life-time
– Tax considerations
|37
From Business Planning to Financial Modelling and Valuation
2. Business Planning:h. Working capital requirements (1/3)
• Inventory requirements– Raw materials inventory
– Finished goods inventory
– Warehouse space requirements
– Supply chain requirements
• Specific to each industry– Manufacturing >< Retail
• How can we reduce the inventories?– Logistic optimization
– Subcontracting
• Are we able to let the customers pay quicker?
• Can we pay the suppliers later?
|38
From Business Planning to Financial Modelling and Valuation
2. Business Planning:h. Working capital requirements (2/3)
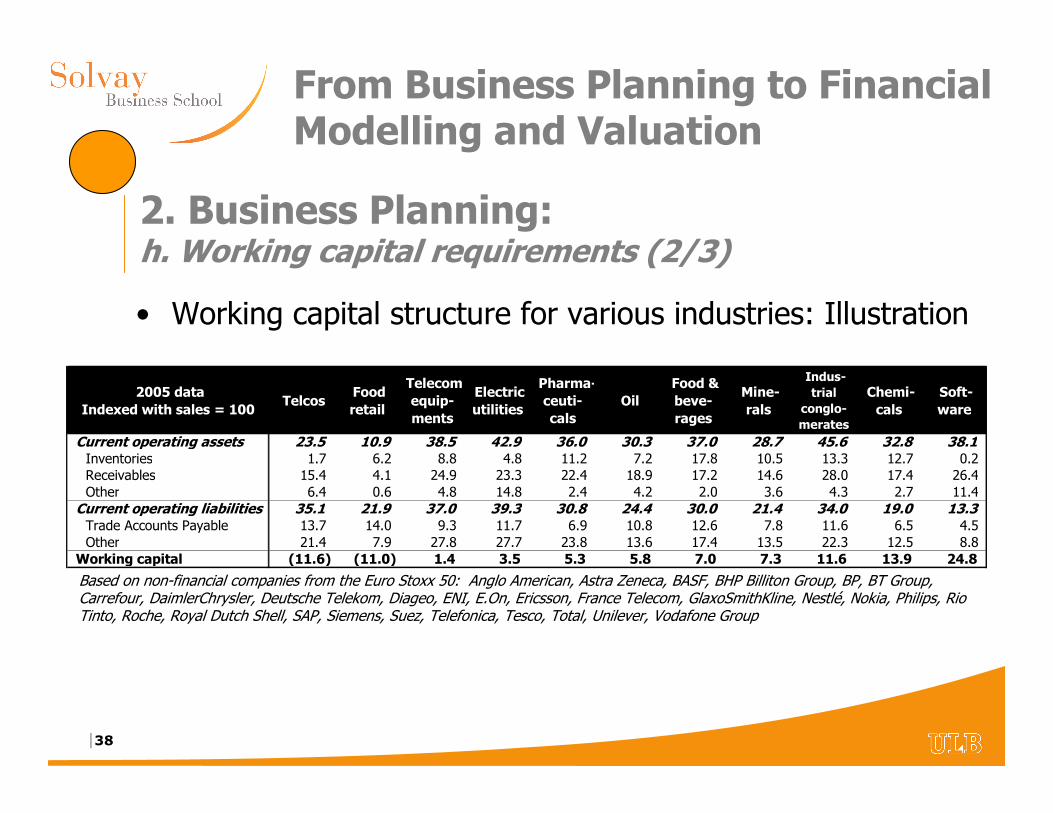
• Working capital structure for various industries: Illustration
Based on non-financial companies from the Euro Stoxx 50: Anglo American, Astra Zeneca, BASF, BHP Billiton Group, BP, BT Group, Carrefour, DaimlerChrysler, Deutsche Telekom, Diageo, ENI, E.On, Ericsson, France Telecom, GlaxoSmithKline, Nestlé, Nokia, Philips, Rio Tinto, Roche, Royal Dutch Shell, SAP, Siemens, Suez, Telefonica, Tesco, Total, Unilever, Vodafone Group
2005 data Indexed with sales = 100
Telcos Food retail
Telecom equip-ments
Electric utilities
Pharma-ceuti-cals
Oil Food & beve-rages
Mine-rals
Indus-trial
conglo-merates
Chemi-cals
Soft-ware
Current operating assets 23.5 10.9 38.5 42.9 36.0 30.3 37.0 28.7 45.6 32.8 38.1 Inventories 1.7 6.2 8.8 4.8 11.2 7.2 17.8 10.5 13.3 12.7 0.2 Receivables 15.4 4.1 24.9 23.3 22.4 18.9 17.2 14.6 28.0 17.4 26.4 Other 6.4 0.6 4.8 14.8 2.4 4.2 2.0 3.6 4.3 2.7 11.4
Current operating liabilities 35.1 21.9 37.0 39.3 30.8 24.4 30.0 21.4 34.0 19.0 13.3 Trade Accounts Payable 13.7 14.0 9.3 11.7 6.9 10.8 12.6 7.8 11.6 6.5 4.5 Other 21.4 7.9 27.8 27.7 23.8 13.6 17.4 13.5 22.3 12.5 8.8
Working capital (11.6) (11.0) 1.4 3.5 5.3 5.8 7.0 7.3 11.6 13.9 24.8
|39
From Business Planning to Financial Modelling and Valuation
2. Business Planning:h. Working capital requirements (3/3)
• New techniques to reduce the working capital– Just-in time
– Zero inventories
– Factoring
|40
From Business Planning to Financial Modelling and Valuation
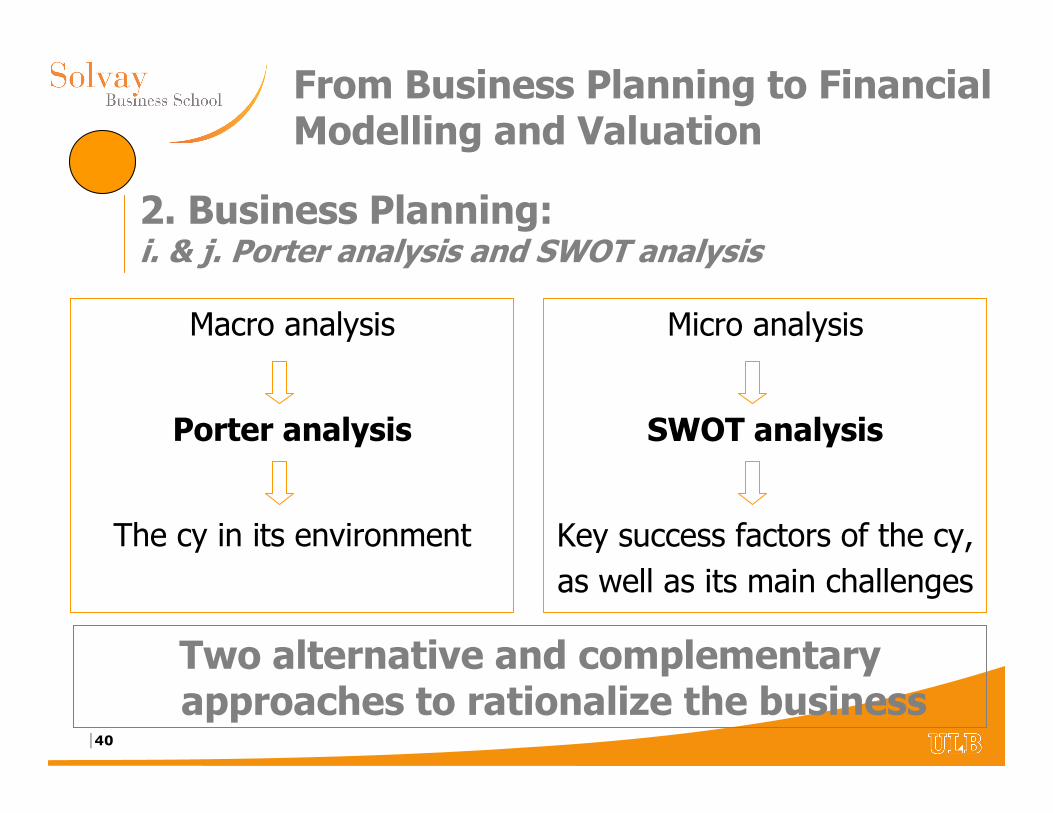
2. Business Planning:i. & j. Porter analysis and SWOT analysis
Macro analysis
Porter analysis
The cy in its environment
Micro analysis
SWOT analysis
Key success factors of the cy,
as well as its main challenges
Two alternative and complementary approaches to rationalize the business
|41
From Business Planning to Financial Modelling and Valuation
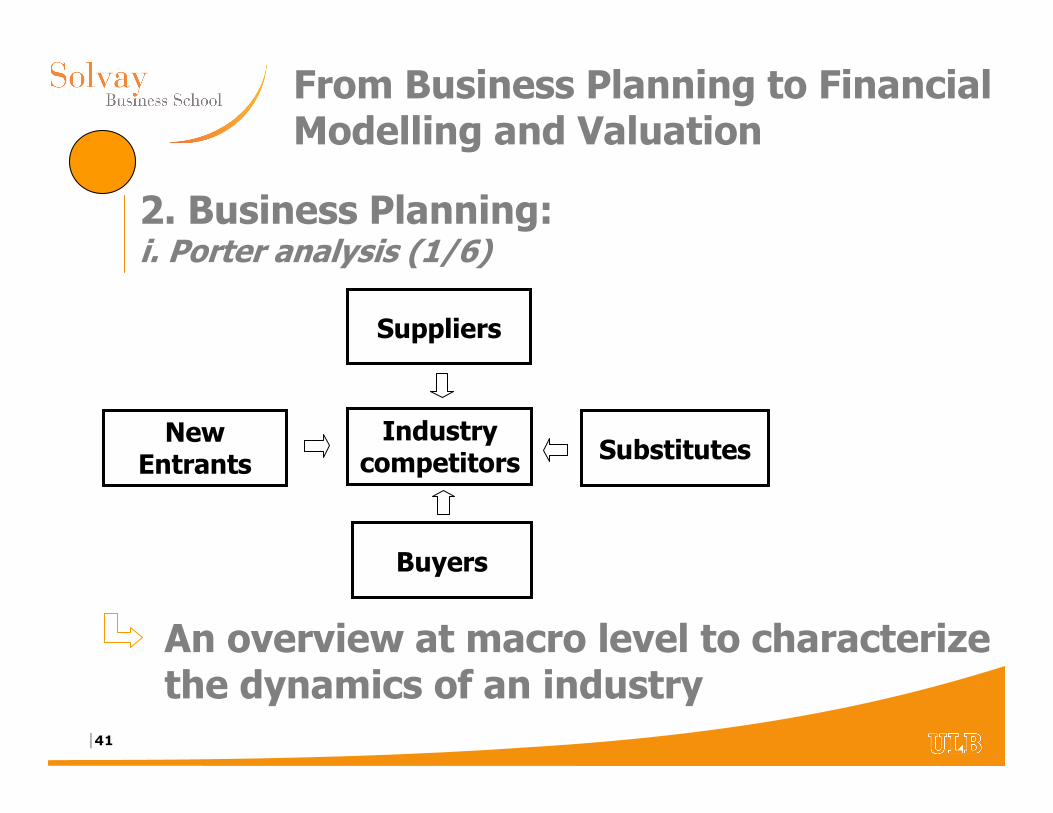
2. Business Planning:i. Porter analysis (1/6)
Suppliers
Industry competitors
Buyers
SubstitutesNew
Entrants
An overview at macro level to characterize the dynamics of an industry
|42
From Business Planning to Financial Modelling and Valuation
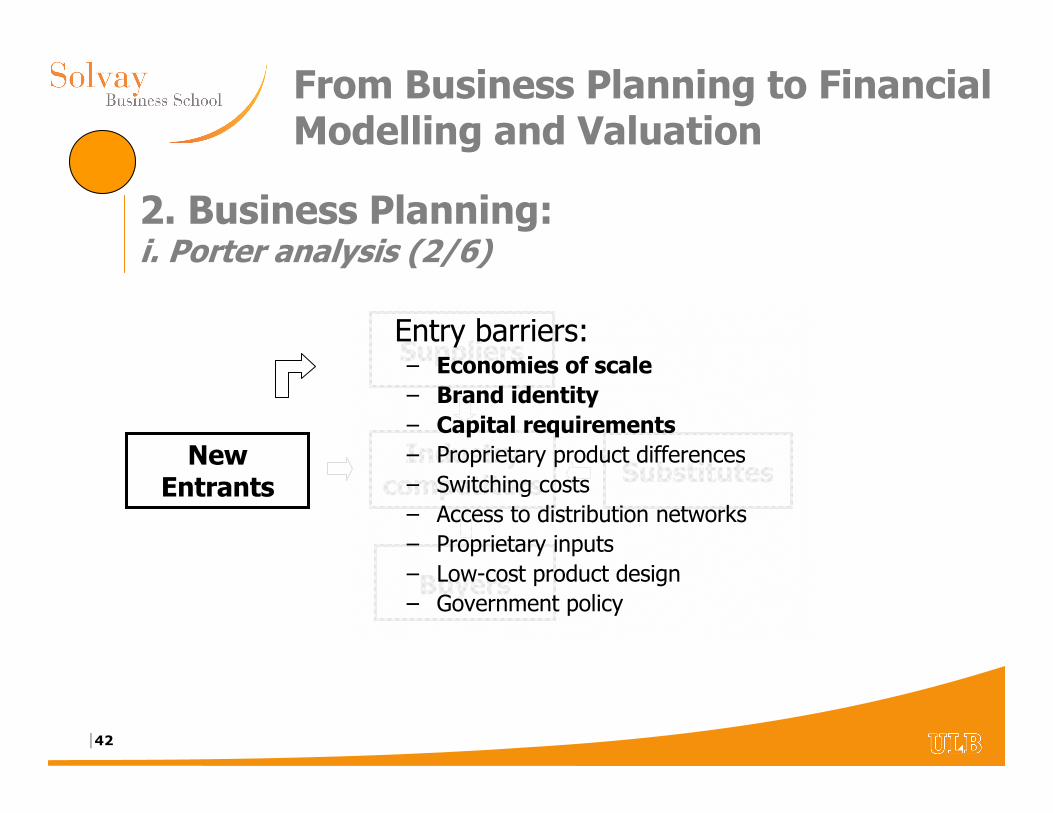
2. Business Planning:i. Porter analysis (2/6)
Suppliers
Industry competitors
Buyers
Substitutes
Entry barriers:– Economies of scale– Brand identity– Capital requirements– Proprietary product differences
– Switching costs
– Access to distribution networks
– Proprietary inputs
– Low-cost product design
– Government policy
New Entrants
|43
From Business Planning to Financial Modelling and Valuation
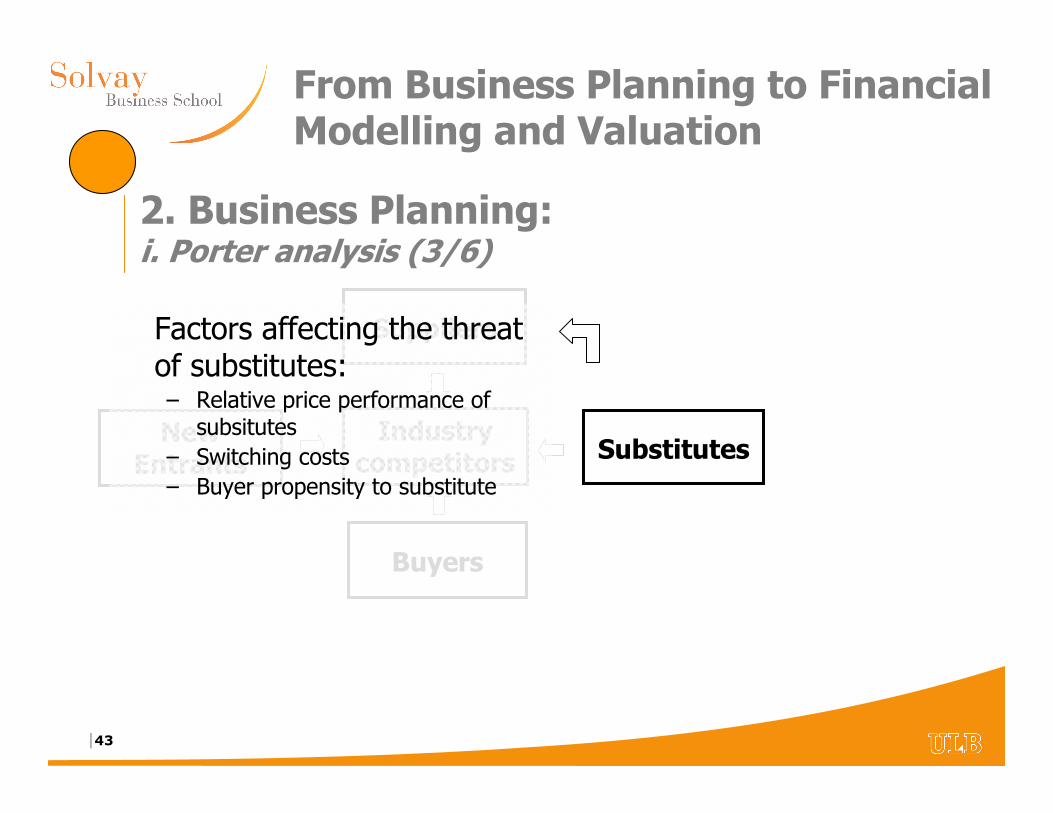
2. Business Planning:i. Porter analysis (3/6)
Suppliers
Industry competitors
Buyers
New Entrants
Factors affecting the threat of substitutes:– Relative price performance of
subsitutes
– Switching costs
– Buyer propensity to substitute
Substitutes
|44
From Business Planning to Financial Modelling and Valuation
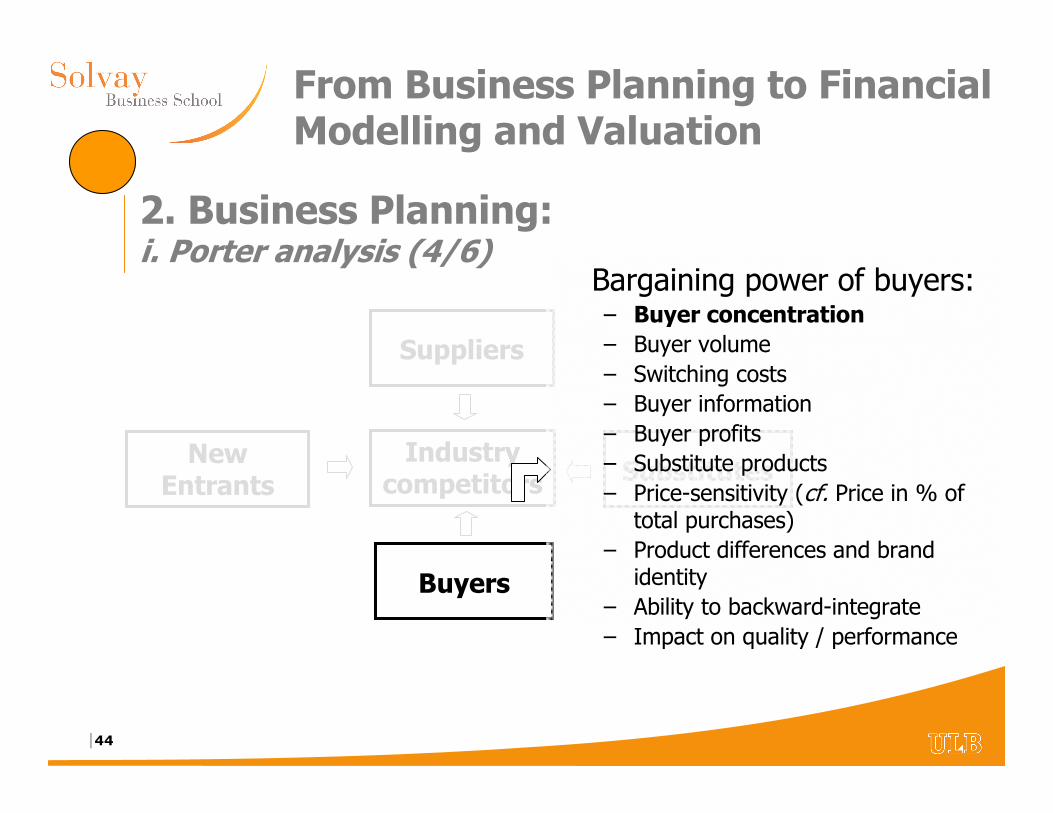
2. Business Planning:i. Porter analysis (4/6)
Suppliers
Industry competitors
Buyers
SubstitutesNew
Entrants
Bargaining power of buyers:– Buyer concentration– Buyer volume
– Switching costs
– Buyer information
– Buyer profits
– Substitute products
– Price-sensitivity (cf. Price in % of total purchases)
– Product differences and brand identity
– Ability to backward-integrate
– Impact on quality / performance
|45
From Business Planning to Financial Modelling and Valuation
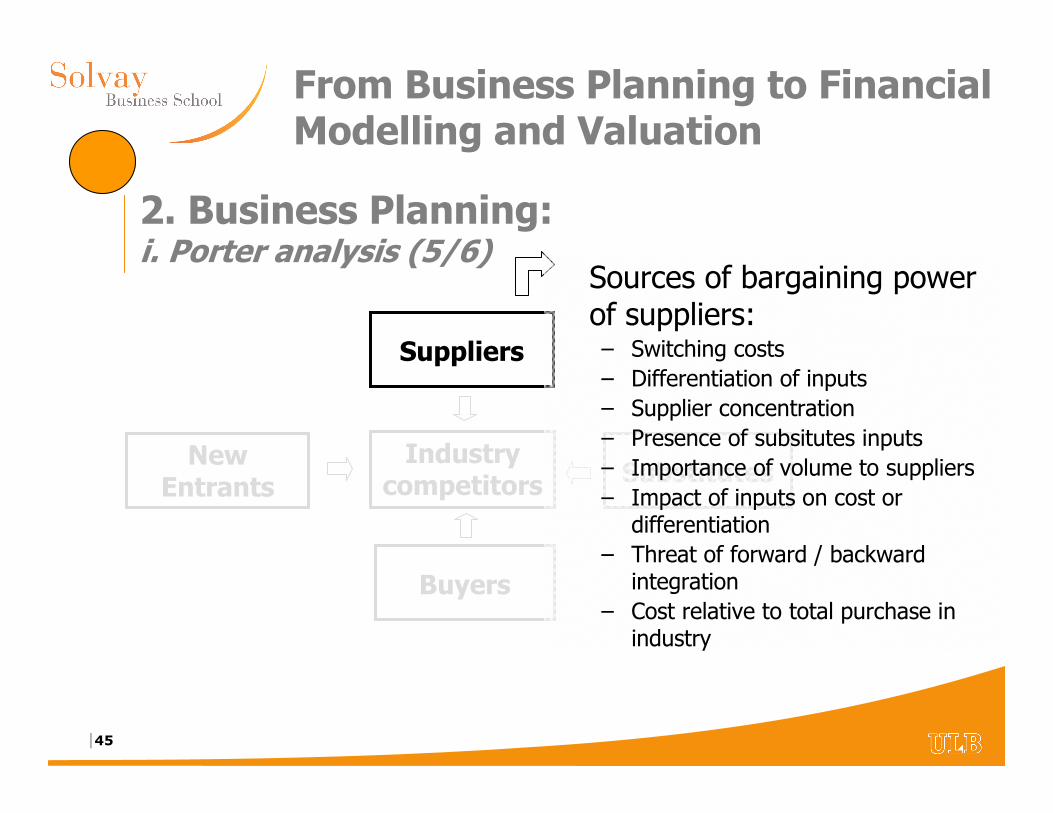
2. Business Planning:i. Porter analysis (5/6)
Suppliers
Industry competitors
Buyers
SubstitutesNew
Entrants
Sources of bargaining power of suppliers:– Switching costs
– Differentiation of inputs
– Supplier concentration
– Presence of subsitutes inputs
– Importance of volume to suppliers
– Impact of inputs on cost ordifferentiation
– Threat of forward / backwardintegration
– Cost relative to total purchase in industry
|46
From Business Planning to Financial Modelling and Valuation
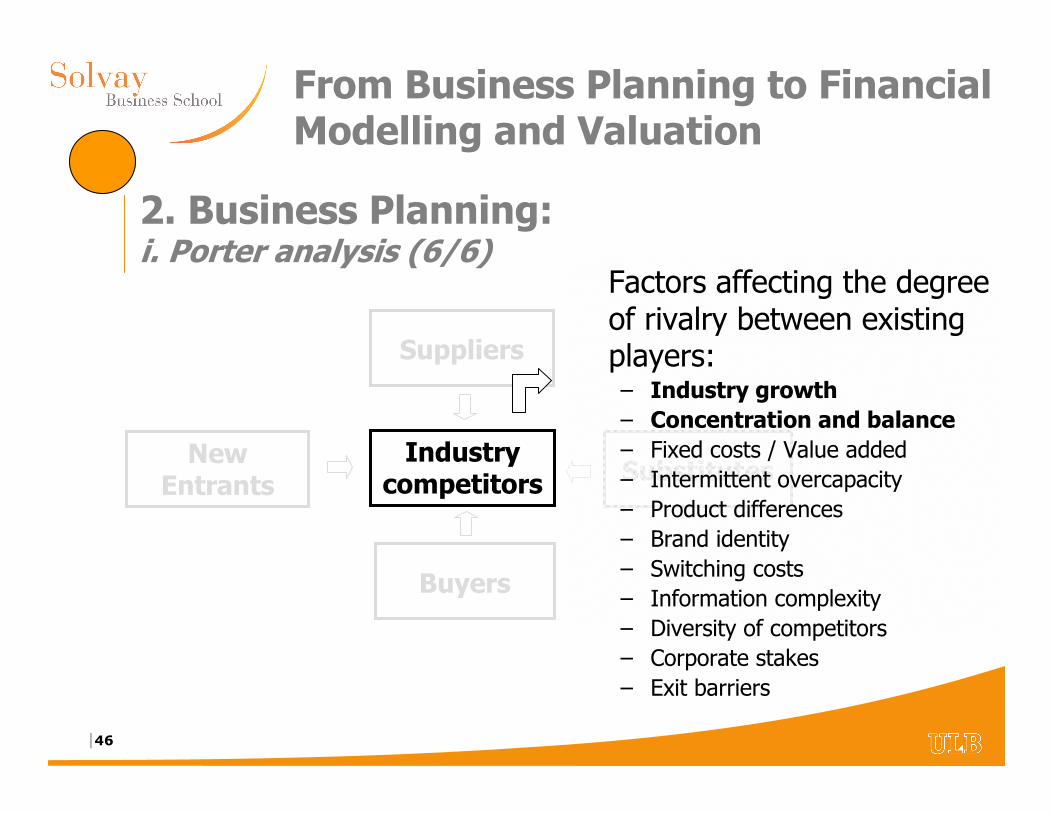
2. Business Planning:i. Porter analysis (6/6)
Suppliers
Industry competitors
Buyers
SubstitutesNew
Entrants
Factors affecting the degree of rivalry between existing players:– Industry growth– Concentration and balance– Fixed costs / Value added
– Intermittent overcapacity
– Product differences
– Brand identity
– Switching costs
– Information complexity
– Diversity of competitors
– Corporate stakes
– Exit barriers
|47
From Business Planning to Financial Modelling and Valuation
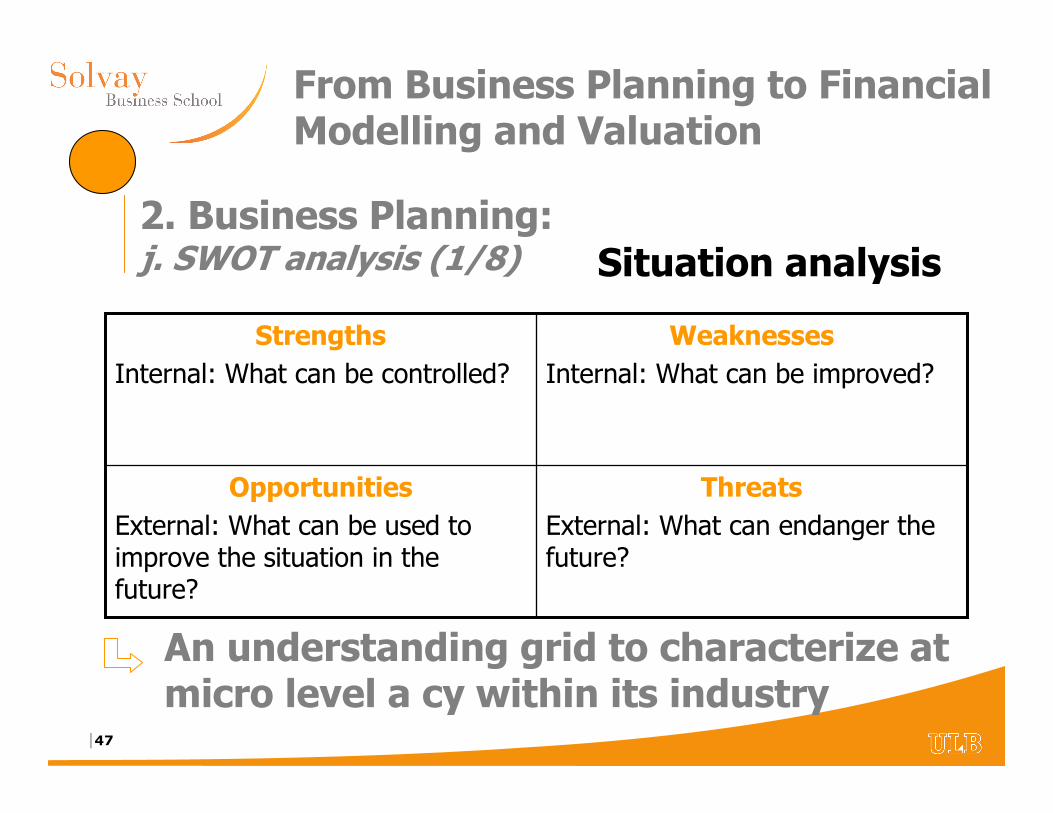
An understanding grid to characterize at micro level a cy within its industry
ThreatsExternal: What can endanger the future?
OpportunitiesExternal: What can be used to improve the situation in the future?
WeaknessesInternal: What can be improved?
StrengthsInternal: What can be controlled?
2. Business Planning:j. SWOT analysis (1/8) Situation analysis
|48
From Business Planning to Financial Modelling and Valuation
2. Business Planning:j. SWOT analysis (2/8)
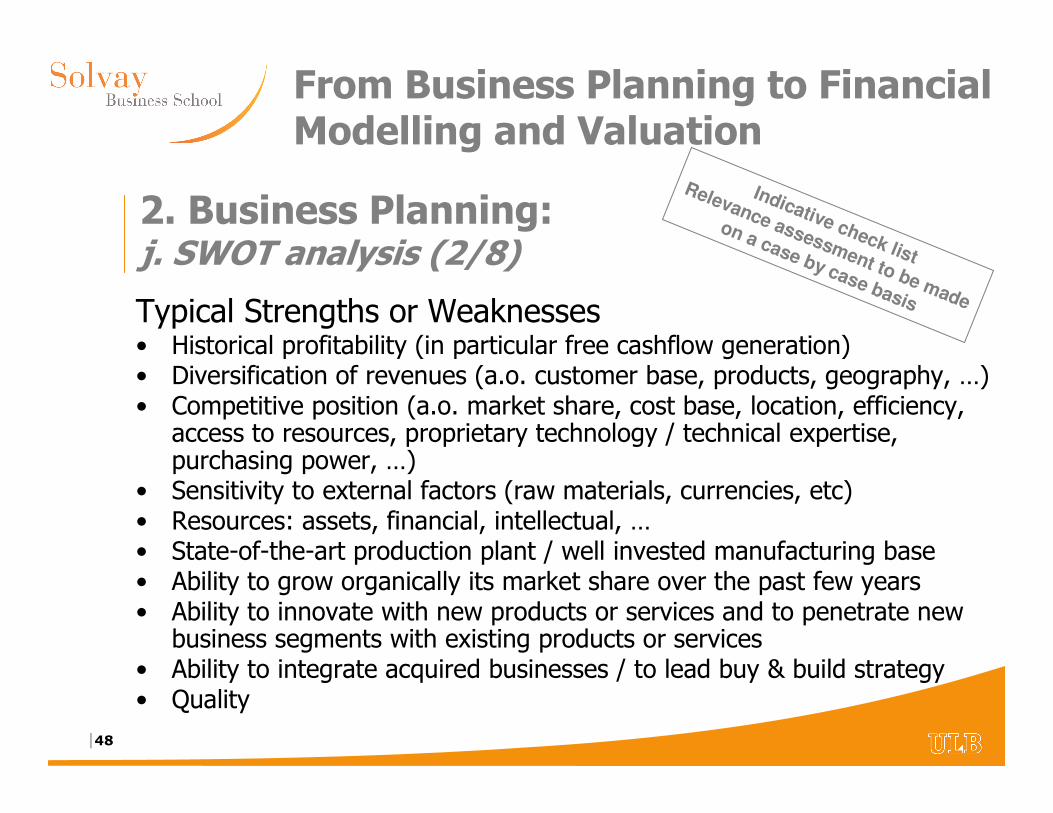
Typical Strengths or Weaknesses• Historical profitability (in particular free cashflow generation)• Diversification of revenues (a.o. customer base, products, geography, …)• Competitive position (a.o. market share, cost base, location, efficiency,
access to resources, proprietary technology / technical expertise, purchasing power, …)
• Sensitivity to external factors (raw materials, currencies, etc)• Resources: assets, financial, intellectual, …• State-of-the-art production plant / well invested manufacturing base• Ability to grow organically its market share over the past few years• Ability to innovate with new products or services and to penetrate new
business segments with existing products or services• Ability to integrate acquired businesses / to lead buy & build strategy• Quality
Indicative check list
Relevance assessment to be made
on a case by case basis
|49
From Business Planning to Financial Modelling and Valuation
2. Business Planning:j. SWOT analysis (3/8)
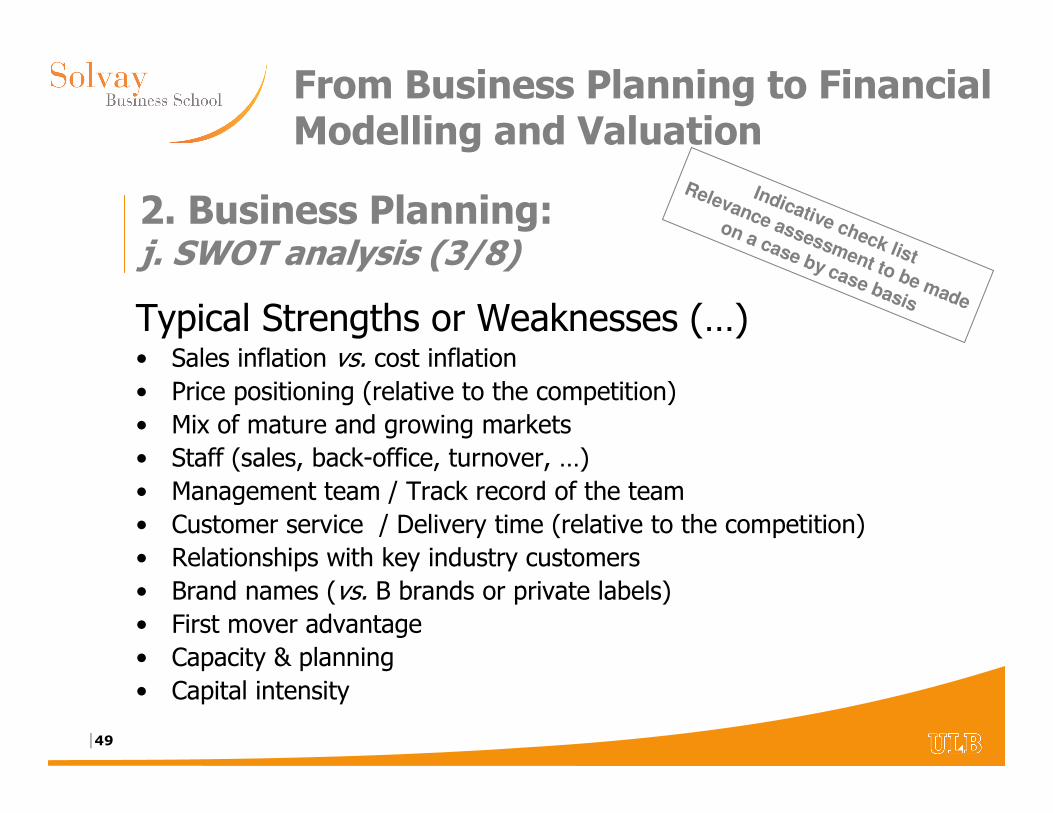
Typical Strengths or Weaknesses (…)• Sales inflation vs. cost inflation• Price positioning (relative to the competition)
• Mix of mature and growing markets
• Staff (sales, back-office, turnover, …)
• Management team / Track record of the team
• Customer service / Delivery time (relative to the competition)
• Relationships with key industry customers
• Brand names (vs. B brands or private labels)• First mover advantage
• Capacity & planning
• Capital intensity
Indicative check list
Relevance assessment to be made
on a case by case basis
|50
From Business Planning to Financial Modelling and Valuation
2. Business Planning:j. SWOT analysis (4/8)
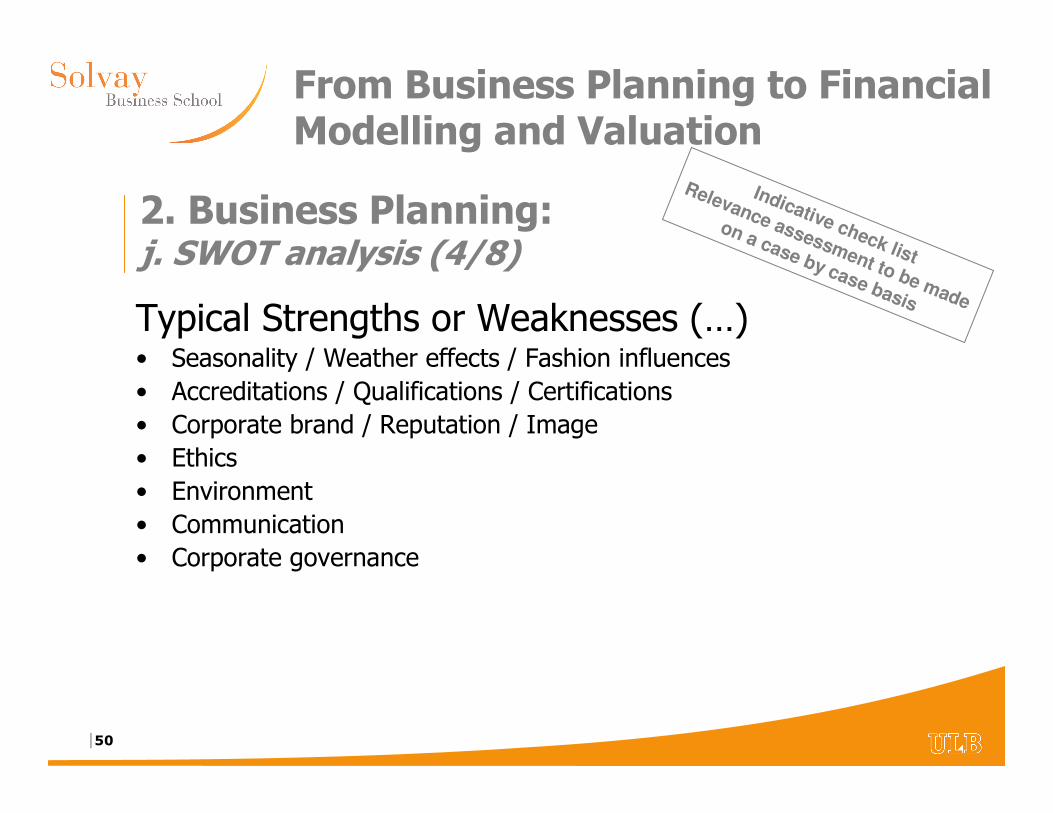
Typical Strengths or Weaknesses (…)• Seasonality / Weather effects / Fashion influences
• Accreditations / Qualifications / Certifications
• Corporate brand / Reputation / Image
• Ethics
• Environment
• Communication
• Corporate governance
Indicative check list
Relevance assessment to be made
on a case by case basis
|51
From Business Planning to Financial Modelling and Valuation
2. Business Planning:j. SWOT analysis (5/8)
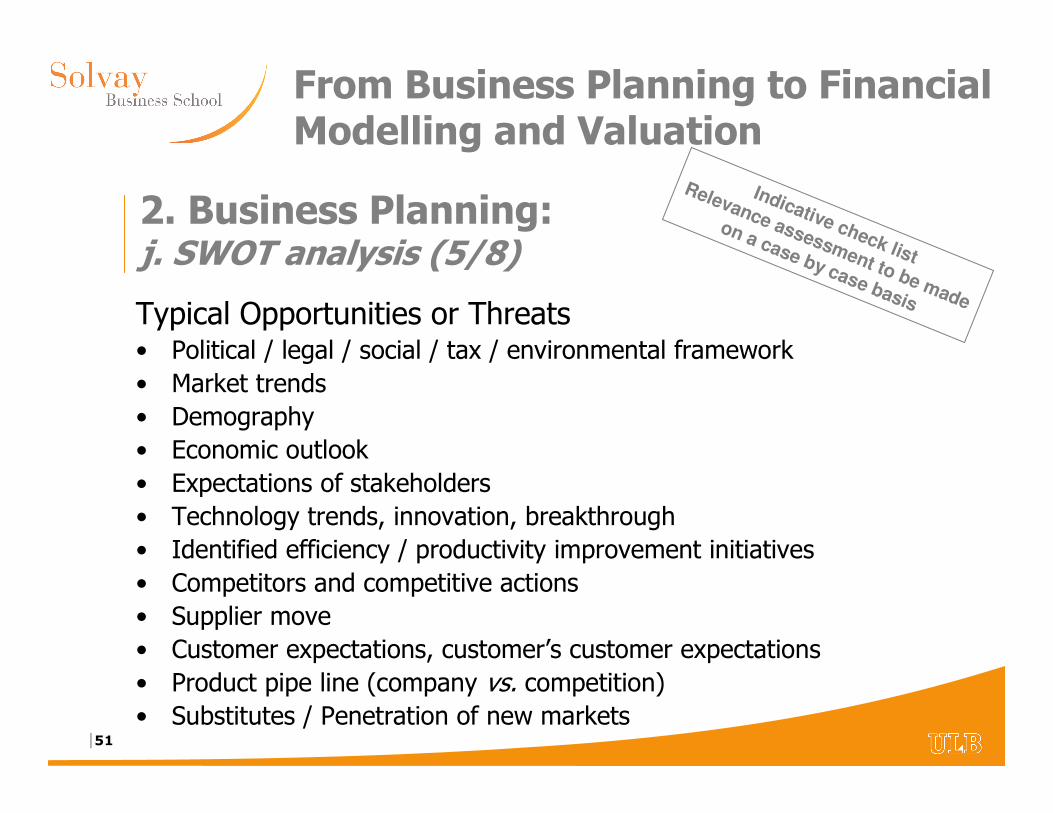
Typical Opportunities or Threats• Political / legal / social / tax / environmental framework
• Market trends
• Demography
• Economic outlook
• Expectations of stakeholders
• Technology trends, innovation, breakthrough
• Identified efficiency / productivity improvement initiatives
• Competitors and competitive actions
• Supplier move
• Customer expectations, customer’s customer expectations
• Product pipe line (company vs. competition)
• Substitutes / Penetration of new markets
Indicative check list
Relevance assessment to be made
on a case by case basis
|52
From Business Planning to Financial Modelling and Valuation
2. Business Planning:j. SWOT analysis (6/8)
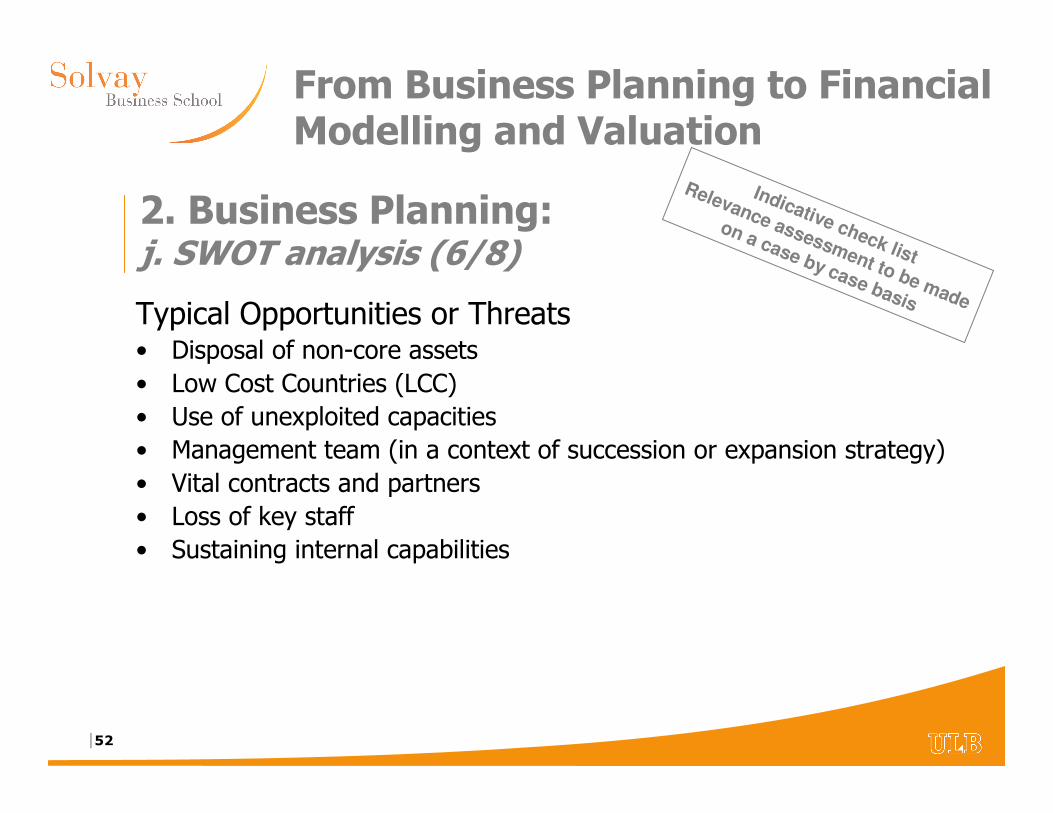
Typical Opportunities or Threats• Disposal of non-core assets
• Low Cost Countries (LCC)
• Use of unexploited capacities
• Management team (in a context of succession or expansion strategy)
• Vital contracts and partners
• Loss of key staff
• Sustaining internal capabilities
Indicative check list
Relevance assessment to be made
on a case by case basis
|53
From Business Planning to Financial Modelling and Valuation
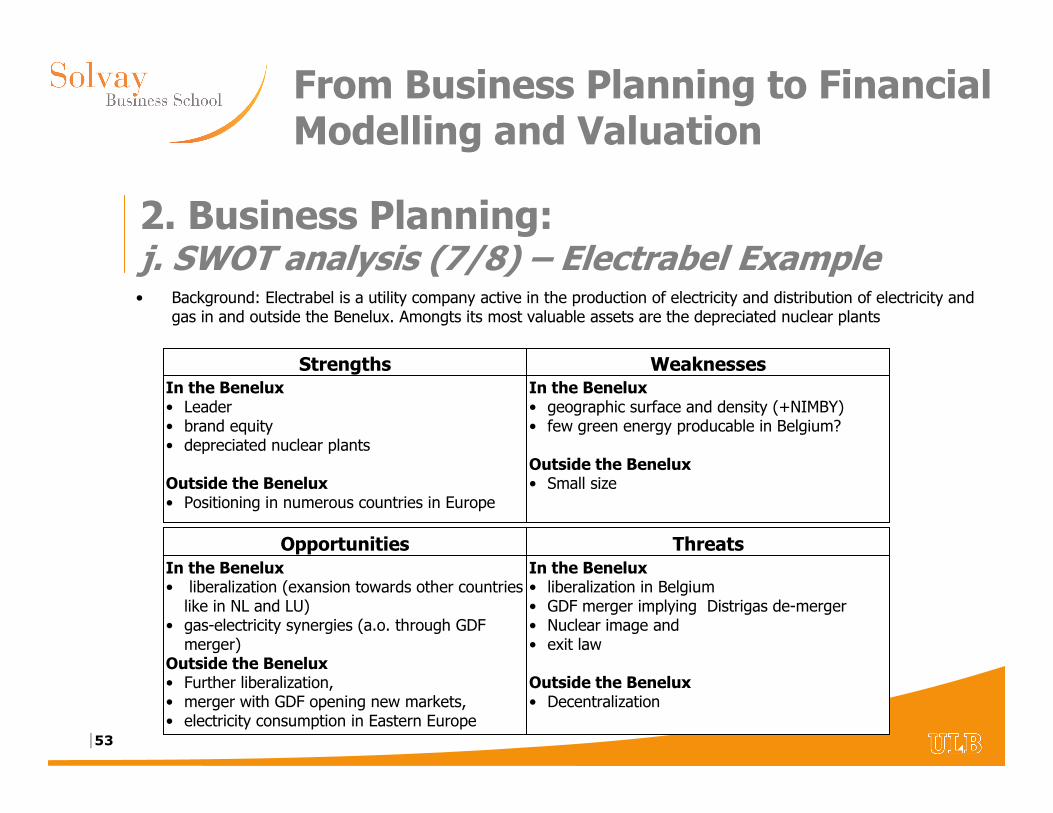
2. Business Planning:j. SWOT analysis (7/8) – Electrabel Example• Background: Electrabel is a utility company active in the production of electricity and distribution of electricity and
gas in and outside the Benelux. Amongts its most valuable assets are the depreciated nuclear plants
StrengthsIn the Benelux• Leader• brand equity• depreciated nuclear plants
Outside the Benelux• Positioning in numerous countries in Europe
OpportunitiesIn the Benelux• liberalization (exansion towards other countries
like in NL and LU)• gas-electricity synergies (a.o. through GDF
merger)Outside the Benelux• Further liberalization, • merger with GDF opening new markets,• electricity consumption in Eastern Europe
ThreatsIn the Benelux• liberalization in Belgium• GDF merger implying Distrigas de-merger• Nuclear image and • exit law
Outside the Benelux• Decentralization
WeaknessesIn the Benelux• geographic surface and density (+NIMBY)• few green energy producable in Belgium?
Outside the Benelux• Small size
|54
From Business Planning to Financial Modelling and Valuation
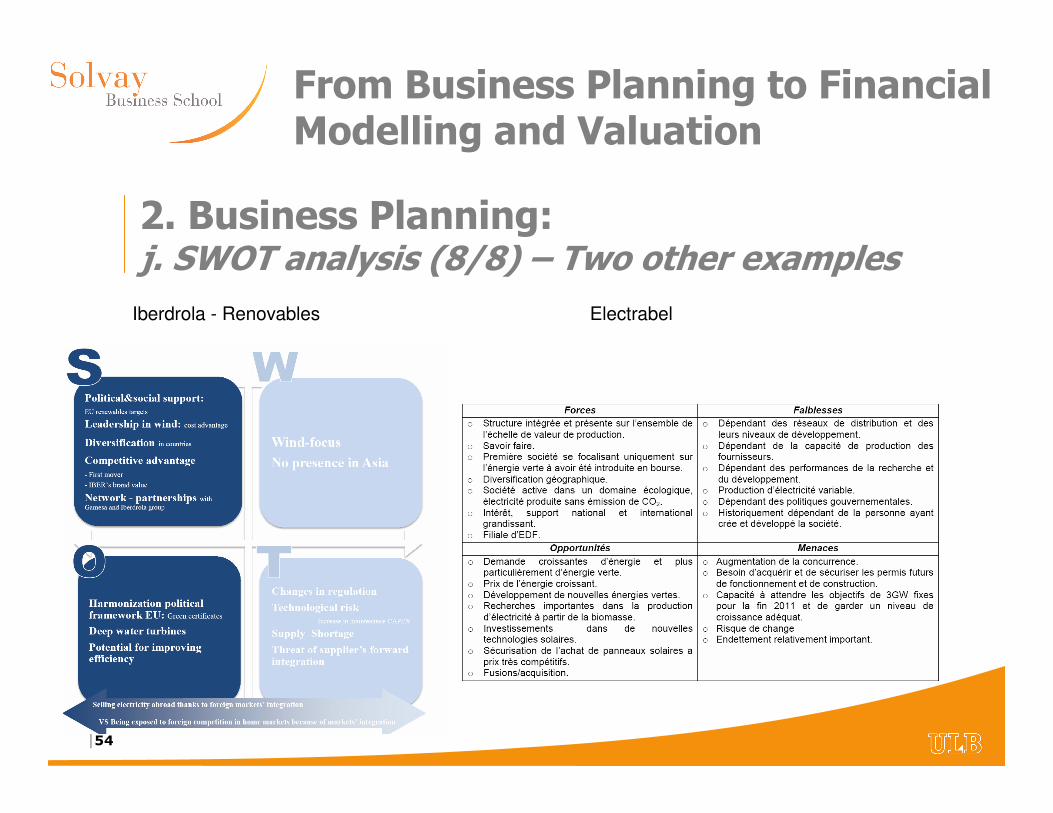
2. Business Planning:j. SWOT analysis (8/8) – Two other examples
Iberdrola - Renovables Electrabel
|55
From Business Planning to Financial Modelling and Valuation
2. Business Planning:k. Human resources
• Understand the existing organizational structure and key people
• Assign responsibilities
• Evaluate training required
• List skills required
• Prepare union issues
• Estimate compensation
• Gauge skills availability
• Consider new hiring
|56
From Business Planning to Financial Modelling and Valuation
3. Financial Modelling
|57
From Business Planning to Financial Modelling and Valuation
• Put the BP in an Excel workbook
• Advantages:– Quicker calculations
– Check that everything is OK
• Assets = Liabilities
• Cash flow Statement equation
– Easy modification of one or some assumptions (cf. sensitivity analysis)
– Data base for illustration (cf. table and graph for memorandum)
– Frequent update
• Disadvantages:– May easily become a black-box
3. Financial Modelling:a. Introduction (1/5): Excel merits
|58
From Business Planning to Financial Modelling and Valuation
• Do it yourself is always better >< Standardised template
• Make it simple (for you and for the external parties)– Regroup all the assumptions
– Use colours (assumptions in green, formulas in blue, …)
– Use various pages
– Use comments
• Avoid– Conceptual errors and links with other files
– Circular references
• Synthesis and graphic presentation– Always mention units (€ vs. € m, $, £, #, …)!
– Summary tables / Graphs
3. Financial Modelling:a. Introduction (2/5): Recommendations
|59
From Business Planning to Financial Modelling and Valuation
• Ctrl + C = Copy
• Ctrl + V = Paste
• Ctrl + P = Print
• Ctrl + Spacebar = Select a column
• Shift + Spacebar = Select a row
• Ctrl + A = Select a whole table, then the whole sheet
3. Financial Modelling:a. Introduction (3/5): Useful excel shortcuts
Will be further analyzed during Excel Training
|60
From Business Planning to Financial Modelling and Valuation
• ABS() = Returns the absolute value of a number
• AVERAGE() or MEAN() = Returns the arithmetic average or the mean of as series of arguments
• ISERROR()
• CONCATENATE() = Joins a number of strings (text) variables into a single text variable
• IF() = Returns one value if a specified condition is true and another value if the condition is false
• MAX() = Provides the largest value amongst a set of values
• MIN() = Provides the smallest value amongst a set of values
• ROUND() = Rounds a number to the specified number of digit
• VLOOKUP() = Searches for a value in the left-most column of a table and then returns a value from the same row in a column from within the table specified by the user
3. Financial Modelling:a. Introduction (4/5): Useful excel functions
Will be further analyzed during Excel Training
|61
From Business Planning to Financial Modelling and Valuation
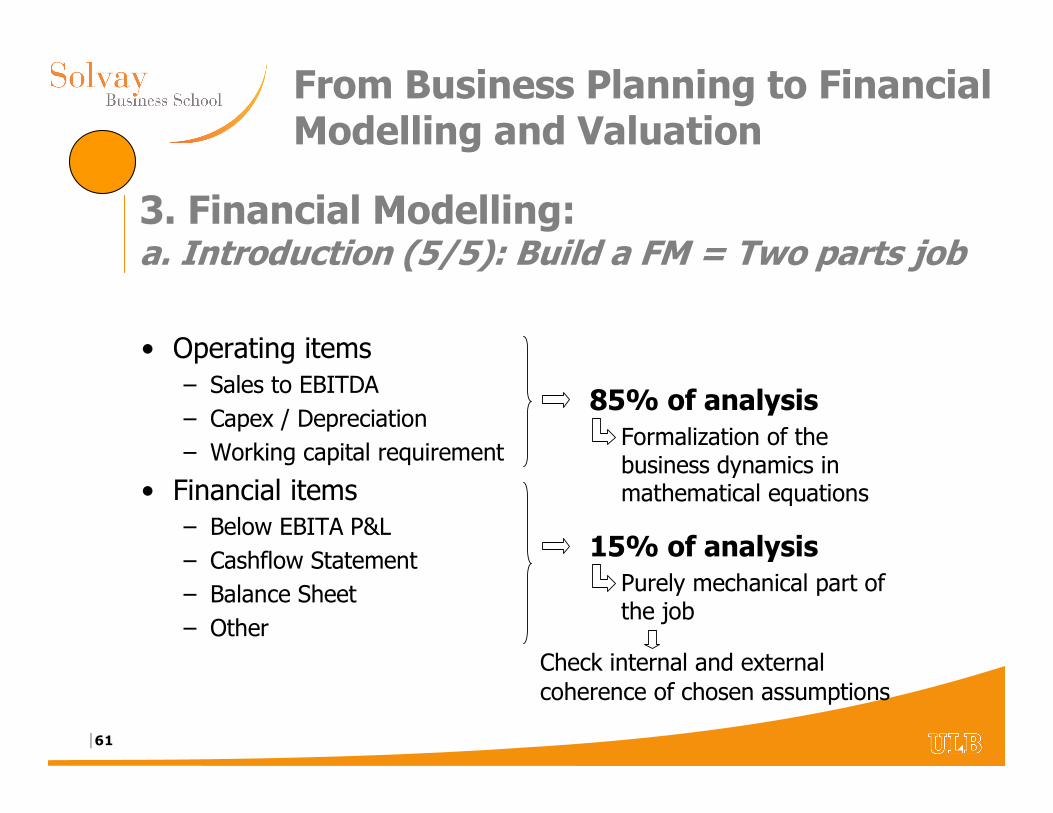
• Operating items– Sales to EBITDA
– Capex / Depreciation
– Working capital requirement
• Financial items– Below EBITA P&L
– Cashflow Statement
– Balance Sheet
– Other
85% of analysisFormalization of the business dynamics in mathematical equations
15% of analysisPurely mechanical part of the job
Check internal and external coherence of chosen assumptions
3. Financial Modelling:a. Introduction (5/5): Build a FM = Two parts job
|62
From Business Planning to Financial Modelling and Valuation
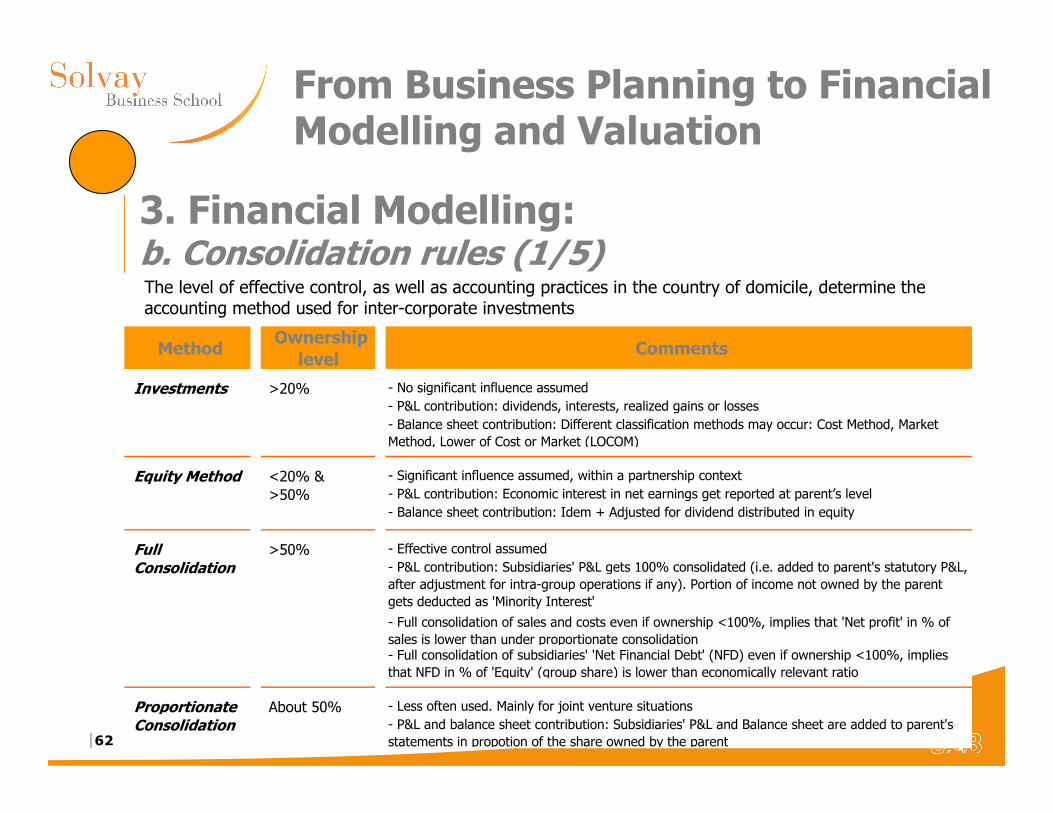
3. Financial Modelling:b. Consolidation rules (1/5)The level of effective control, as well as accounting practices in the country of domicile, determine the accounting method used for inter-corporate investments
Method Ownership
level Comments
Investments >20% - No significant influence assumed
- P&L contribution: dividends, interests, realized gains or losses
- Balance sheet contribution: Different classification methods may occur: Cost Method, Market
Method, Lower of Cost or Market (LOCOM)
Equity Method <20% & - Significant influence assumed, within a partnership context
>50% - P&L contribution: Economic interest in net earnings get reported at parent’s level
- Balance sheet contribution: Idem + Adjusted for dividend distributed in equity
Full >50% - Effective control assumed
Consolidation - P&L contribution: Subsidiaries' P&L gets 100% consolidated (i.e. added to parent's statutory P&L,
after adjustment for intra-group operations if any). Portion of income not owned by the parent
gets deducted as 'Minority Interest'
- Full consolidation of sales and costs even if ownership <100%, implies that 'Net profit' in % of
sales is lower than under proportionate consolidation- Full consolidation of subsidiaries' 'Net Financial Debt' (NFD) even if ownership <100%, implies
that NFD in % of 'Equity' (group share) is lower than economically relevant ratio
Proportionate About 50% - Less often used. Mainly for joint venture situations
Consolidation - P&L and balance sheet contribution: Subsidiaries' P&L and Balance sheet are added to parent's
statements in propotion of the share owned by the parent
|63
From Business Planning to Financial Modelling and Valuation
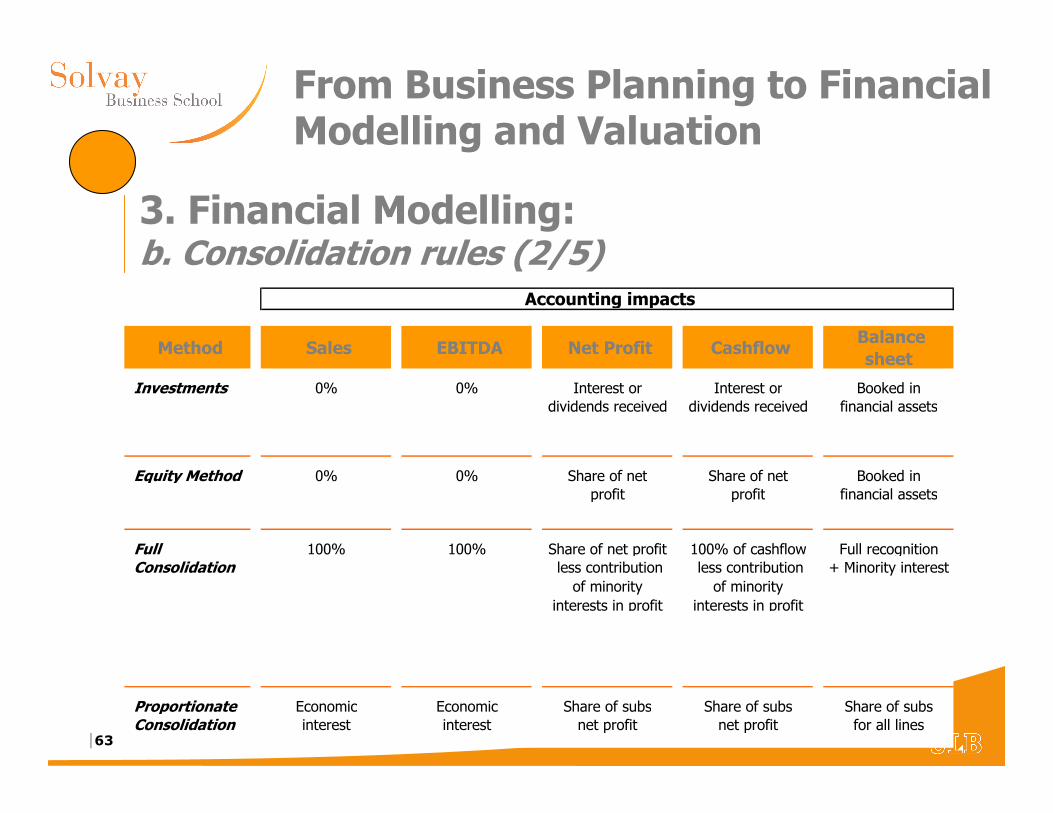
3. Financial Modelling:b. Consolidation rules (2/5)
Method Sales EBITDA Net Profit Cashflow Balance sheet
Investments 0% 0% Interest or Interest or Booked individends received dividends received financial assets
Equity Method 0% 0% Share of net Share of net Booked inprofit profit financial assets
Full 100% 100% Share of net profit 100% of cashflow Full recognitionConsolidation less contribution
of minority
interests in profit
less contribution
of minority
interests in profit
+ Minority interest
Proportionate Economic Economic Share of subs Share of subs Share of subsConsolidation interest interest net profit net profit for all lines
Accounting impacts
|64
From Business Planning to Financial Modelling and Valuation
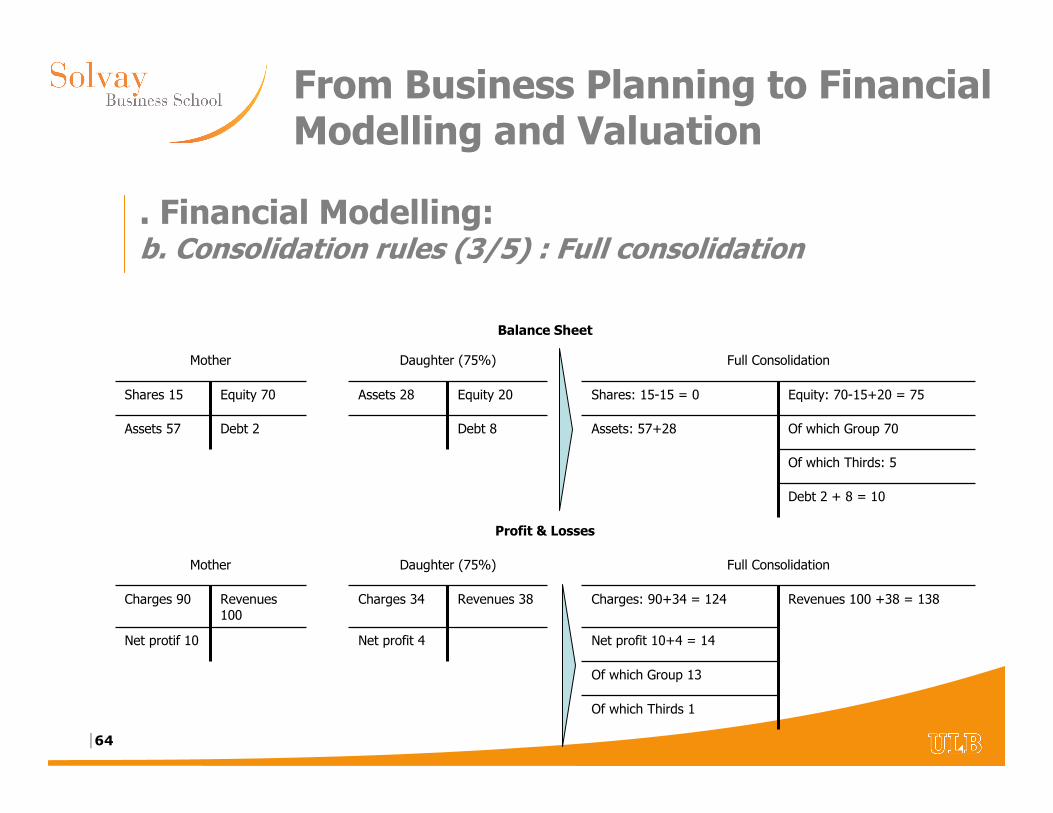
. Financial Modelling:b. Consolidation rules (3/5) : Full consolidation
Balance Sheet
Revenues 100
Debt 2
Equity 70
Net protif 10
Charges 90
Mother
Profit & Losses
Assets 57
Shares 15
Mother
Revenues 38
Debt 8
Equity 20
Net profit 4
Charges 34
Daughter (75%)
Assets 28
Daughter (75%)
Of which Thirds 1
Of which Group 13
Net profit 10+4 = 14
Charges: 90+34 = 124
Full Consolidation
Assets: 57+28
Shares: 15-15 = 0
Full Consolidation
Revenues 100 +38 = 138
Debt 2 + 8 = 10
Of which Thirds: 5
Of which Group 70
Equity: 70-15+20 = 75
|65
From Business Planning to Financial Modelling and Valuation
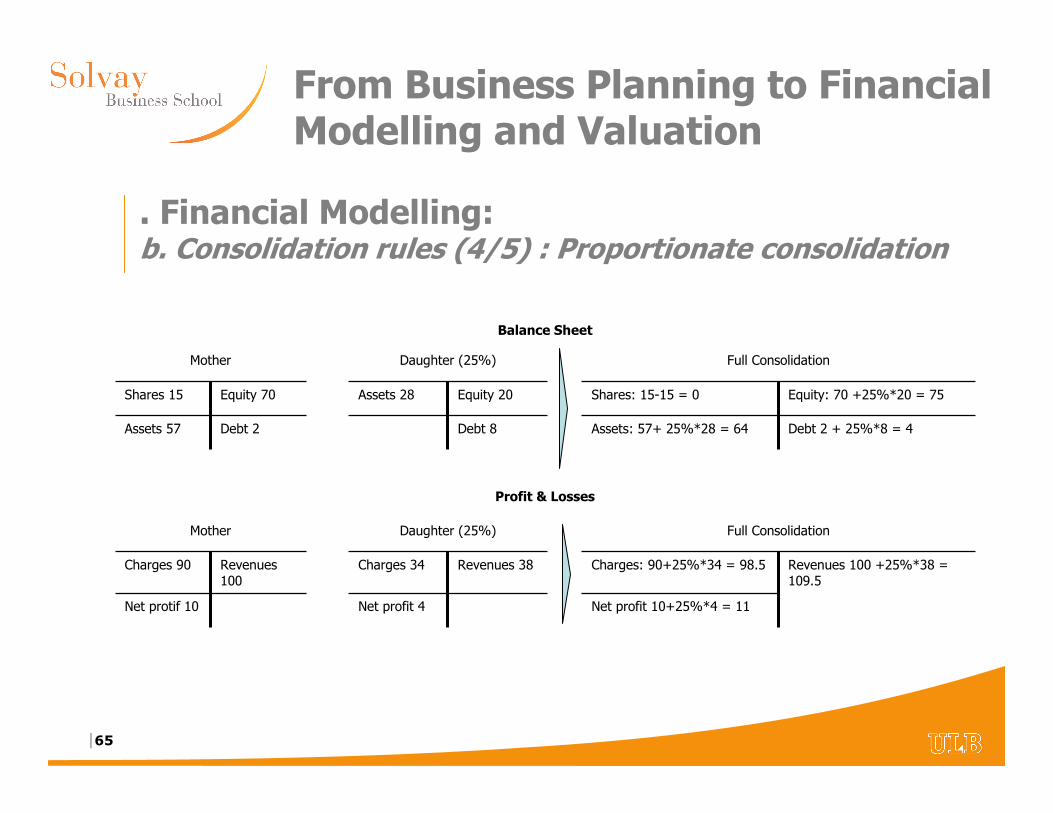
. Financial Modelling:b. Consolidation rules (4/5) : Proportionate consolidation
Balance Sheet
Revenues 100
Debt 2
Equity 70
Net protif 10
Charges 90
Mother
Profit & Losses
Assets 57
Shares 15
Mother
Revenues 38
Debt 8
Equity 20
Net profit 4
Charges 34
Daughter (25%)
Assets 28
Daughter (25%)
Net profit 10+25%*4 = 11
Charges: 90+25%*34 = 98.5
Full Consolidation
Assets: 57+ 25%*28 = 64
Shares: 15-15 = 0
Full Consolidation
Revenues 100 +25%*38 = 109.5
Debt 2 + 25%*8 = 4
Equity: 70 +25%*20 = 75
|66
From Business Planning to Financial Modelling and Valuation
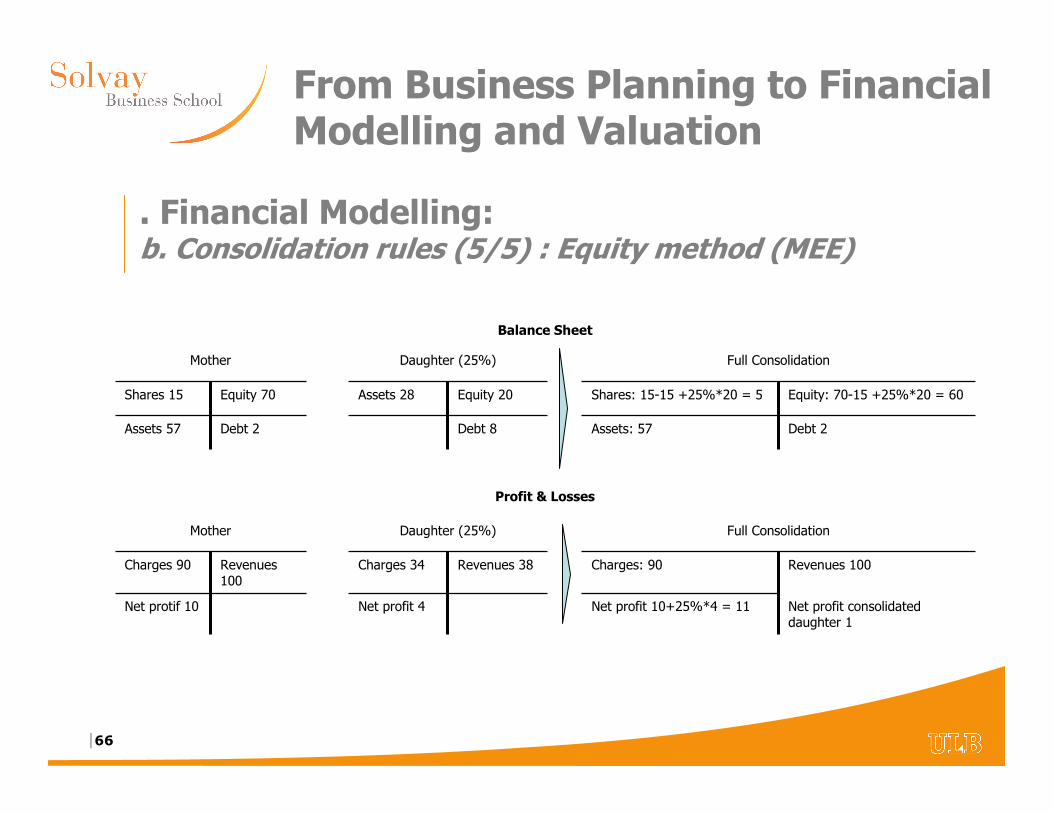
. Financial Modelling:b. Consolidation rules (5/5) : Equity method (MEE)
Balance Sheet
Revenues 100
Debt 2
Equity 70
Net protif 10
Charges 90
Mother
Profit & Losses
Assets 57
Shares 15
Mother
Revenues 38
Debt 8
Equity 20
Net profit 4
Charges 34
Daughter (25%)
Assets 28
Daughter (25%)
Net profit 10+25%*4 = 11
Charges: 90
Full Consolidation
Assets: 57
Shares: 15-15 +25%*20 = 5
Full Consolidation
Net profit consolidated daughter 1
Revenues 100
Debt 2
Equity: 70-15 +25%*20 = 60
|67
From Business Planning to Financial Modelling and Valuation
• Sales– Sales vs. Turnover vs. Revenues
– Revenue recognition rules to be carefully understood (e.g. discounts, allowances and returns, cross-sales, …)
• Gross Margin– Gross Margin ≡ Sales – Cost of goods sold
– Cost of goods sold = Direct costs
– Depreciation and amortization often included here (adjustment isneeded if any)
3. Financial Modelling:c. Sales to EBITDA (1/7)
|68
From Business Planning to Financial Modelling and Valuation
• EBITDA– EBITDA ≡ Earning Before Interest, Taxes, Depreciation and
Amortization
– Operating cashflow
– Most comparable valuation or benchmarking metric• Independent of the financial structure
• Common concept around the world (no impact of accounting rules regarding depreciation matters)
• EBITA– EBITA ≡ Earning Before Interest, Taxes and Amortization
– Operating profit
– After depreciation of fixed tangible assets but before goodwill amortization, since the later is not, as such, an effective operating charge
3. Financial Modelling:c. Sales to EBITDA (2/7)
|69
From Business Planning to Financial Modelling and Valuation
• Financials have to be considered based on their continuing normalized operations– Exceptional items are characterized by
• their unusual nature (unrelated to ordinary business activities) and
• By the infrequence of occurrence (i.e. not expected to happen again)
– Exceptional items include
• Restructuring charges
• Impact of disposed / acquired assets. Proforma data are better within the context of valuation based on multiples (cf. infra)
3. Financial Modelling:c. Sales to EBITDA (3/7)
|70
From Business Planning to Financial Modelling and Valuation
• Definition of the adequate degree of detail:– At consolidated level for mono-product / mono-market business
– Per business unit / per division
– Per product, per market, per plant, per shop, …
• Depend on data availability– Difference between an internal analyst and an external analyst
– Standard information package for listed companies
– Issues related to private companies
– Existing company vs. Start-up project
• Creativity is a key– Delta analysis or % analysis = simplest way
– Exhaustive analysis
– 80 / 20 rule
3. Financial Modelling:c. Sales to EBITDA (4/7)
|71
From Business Planning to Financial Modelling and Valuation
• Estimate revenues following a top-down approach:– Sizing the total market
– Determining the market share dynamics
– Forecasting prices
• Importance of considering the point in the cycle
• If possible breakdown between: – Price effect (to be compared to general inflation)
– Volume effect (to be compared to real GDP growth rate)
– Product-mix effect
– Currency effect (transaction impact vs. translation impact)
– Perimeter effect (cf. organic growth vs. mechanical growth implied acquisitions)
– Accounting changes
3. Financial Modelling:c. Sales to EBITDA (5/7)
|72
From Business Planning to Financial Modelling and Valuation
• When revenue growth forecasts have been built, then implied operating costs may be derived:– Classical breakdown = Cost of goods, Selling general and
administration costs (SG&A) and depreciation
– By default = % of sales but a more detailed approach should be followed: e.g.• Wages should take into account # of FTE and unit wage cost
• Advertizing per category
• Details over P&L impacts from R&D and start-up losses of new activities if any
– If expansion is important, a detailed capex / depreciation model is needed
– Historical and sectorial benchmark is key
3. Financial Modelling:c. Sales to EBITDA (6/7)
|73
From Business Planning to Financial Modelling and Valuation
• Distinction between variable and fixed costs
• Distinction between cash and non-cash operating costs
• Economic segmentation >< Accounting segmentation
• Coherence with revenue model:– Integration of plateau effects if any
– Link between marketing investment and sales evolution
• Analysis of non accounting set of data:– Productivity at production level (e.g. productivity per plant, …) and
capacity evolution
– Productivity evolution employee levels (to be compared to salaryevolution)
• Wage inflation > Sales inflation (normally)
3. Financial Modelling:c. Sales to EBITDA (7/7)
|74
From Business Planning to Financial Modelling and Valuation
• Depreciation are driven by past investments and amortization rules– Real estate
– Equipment
• Assets to be depreciated based on their effective economic life-time– Some significant differences may occur between accounting
amortization rhythm and economic amortization rhythm
– Management conservatism
– Tax considerations
3. Financial Modelling:d. Depreciation, Capex & Working Cap. Req. (1/2)
|75
From Business Planning to Financial Modelling and Valuation
• Capex may be expressed in % of sales (especially maintenance capex)
• Normally (excluding impact of high inflation context), within a medium term perspective, capex and depreciation should tend to be equivalent (in % of sales)
• If expansion is important, a detailed capex / depreciation model is needed (cf. supra for Depreciation in EBITA)
• Working capital items sometimes expressed in # of days of sales (for receivables and accrued items) or in # of days of cost of goods sold (for inventories and payables). Except in case of distinctive price evolution between sales and CoGs, % of sales for each item is easier to take into consideration
• Realism of evolution also to be validated in historical and sectorial perspectives
3. Financial Modelling:d. Depreciation, Capex & Working Cap. Req. (2/2)
|76
From Business Planning to Financial Modelling and Valuation
Illustration
€ m2000 (a)
2001 (a)
2002 (a)
2003 (a)
2004 (a)
2005 (e)
2006 (e)
2007 (e)
2008 (e)
2009 (e)
2010 (e)
Sales 192.4 226.0 237.7 267.4 288.8 309.1 318.3 327.9 337.7 347.9 358.3 y-o-y NA 17.5% 5.2% 12.5% 8.0% 7.0% 3.0% 3.0% 3.0% 3.0% 3.0%
(-) Cost of goods sold (108.8) (128.9) (145.2) (160.5) (173.3) (185.4) (191.0) (196.7) (202.6) (208.7) (215.0) % of sales -56.6% -57.0% -61.1% -60.0% -60.0% -60.0% -60.0% -60.0% -60.0% -60.0% -60.0%
(=) Gross margin 83.6 97.1 92.5 107.0 115.5 123.6 127.3 131.2 135.1 139.1 143.3 % of sales 43.4% 43.0% 38.9% 40.0% 40.0% 40.0% 40.0% 40.0% 40.0% 40.0% 40.0%
(-) S, G&A (38.6) (46.2) (49.7) (55.9) (60.4) (64.6) (66.5) (68.5) (70.6) (72.7) (74.9) % of sales -20.1% -20.5% -20.9% -20.9% -20.9% -20.9% -20.9% -20.9% -20.9% -20.9% -20.9%
(=) EBITDA (1) 45.0 50.9 42.8 51.1 55.1 59.0 60.8 62.6 64.5 66.4 68.4 % of sales 23.4% 22.5% 18.0% 19.1% 19.1% 19.1% 19.1% 19.1% 19.1% 19.1% 19.1%
(-) Non-cash operating expenses (12.4) (17.1) (18.2) (24.7) (23.0) (22.8) (20.2) (18.5) (18.3) (18.0) (17.7) % of sales -6.4% -7.6% -7.7% -9.2% -8.0% -7.4% -6.3% -5.6% -5.4% -5.2% -4.9%Depreciation (13.0) (17.2) (18.3) (24.7) (23.0) (22.8) (20.2) (18.5) (18.3) (18.0) (17.7) % of sales -6.7% -7.6% -7.7% -9.2% -8.0% -7.4% -6.3% -5.6% -5.4% -5.2% -4.9%
Other non-cash operating expenses 0.6 0.1 0.1 - - - - - - - - % of sales 0.3% 0.0% 0.0% 0.0% 0.0% 0.0% 0.0% 0.0% 0.0% 0.0% 0.0%
(=) EBITA 32.6 33.8 24.6 26.4 32.1 36.3 40.6 44.2 46.3 48.4 50.7 % of sales 16.9% 15.0% 10.3% 9.9% 11.1% 11.7% 12.8% 13.5% 13.7% 13.9% 14.2%
Capex (2) (31.1) (38.2) (34.4) (12.0) (15.0) (15.0) (15.5) (15.9) (16.4) (16.9) (17.4) % of sales -16.2% -16.9% -14.5% -4.5% -5.2% -4.9% -4.9% -4.9% -4.9% -4.9% -4.9%
Working capital requirements (3) (30.6) (7.6) (19.7) (16.1) (2.7) (3.0) 1.2 1.0 (3.6) (3.7) (3.8) % of sales -15.9% -3.4% -8.3% -6.0% -0.9% -1.0% 0.4% 0.3% -1.1% -1.1% -1.1%Working capital 73.2 81.0 100.9 116.5 117.9 120.9 119.7 118.7 122.3 126.0 129.7 % of sales 38.1% 35.8% 42.5% 43.6% 40.8% 39.1% 37.6% 36.2% 36.2% 36.2% 36.2%
(1) + (2) + (3) = Operating FCF (16.7) 5.1 (11.3) 23.0 37.5 41.1 46.5 47.7 44.6 45.9 47.3 % of sales -8.7% 2.3% -4.7% 8.6% 13.0% 13.3% 14.6% 14.5% 13.2% 13.2% 13.2%
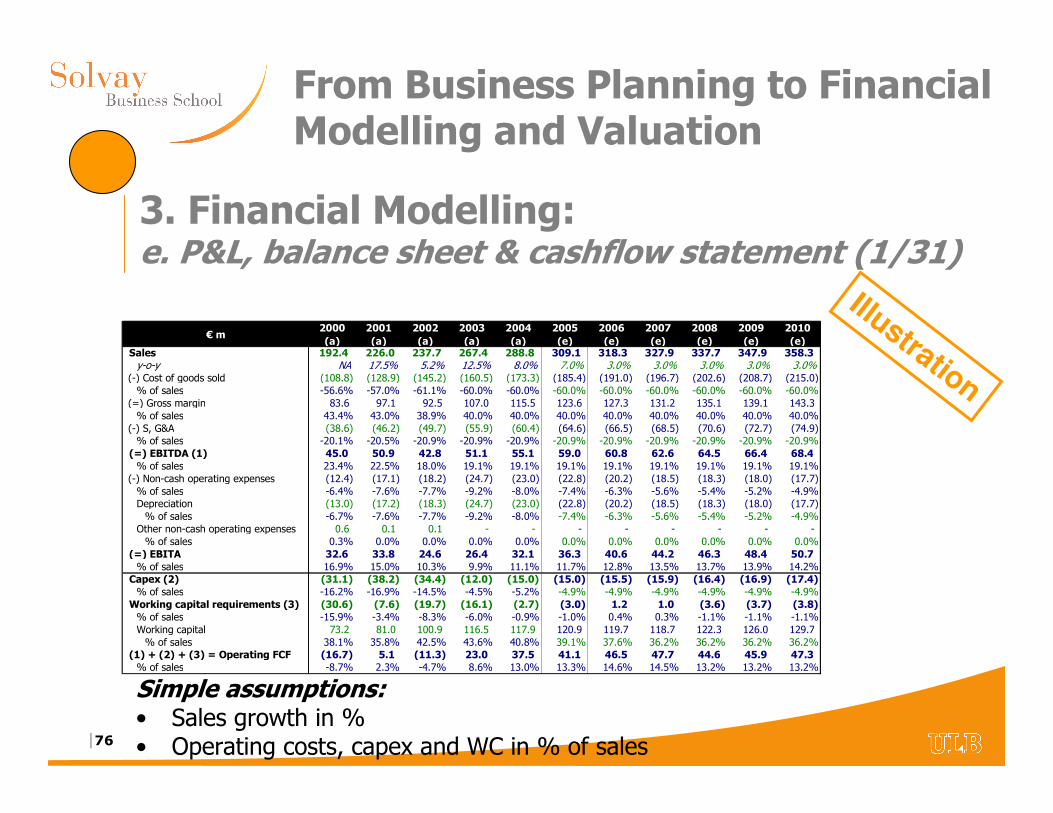
Simple assumptions:• Sales growth in %• Operating costs, capex and WC in % of sales
3. Financial Modelling:e. P&L, balance sheet & cashflow statement (1/31)
|77
From Business Planning to Financial Modelling and Valuation
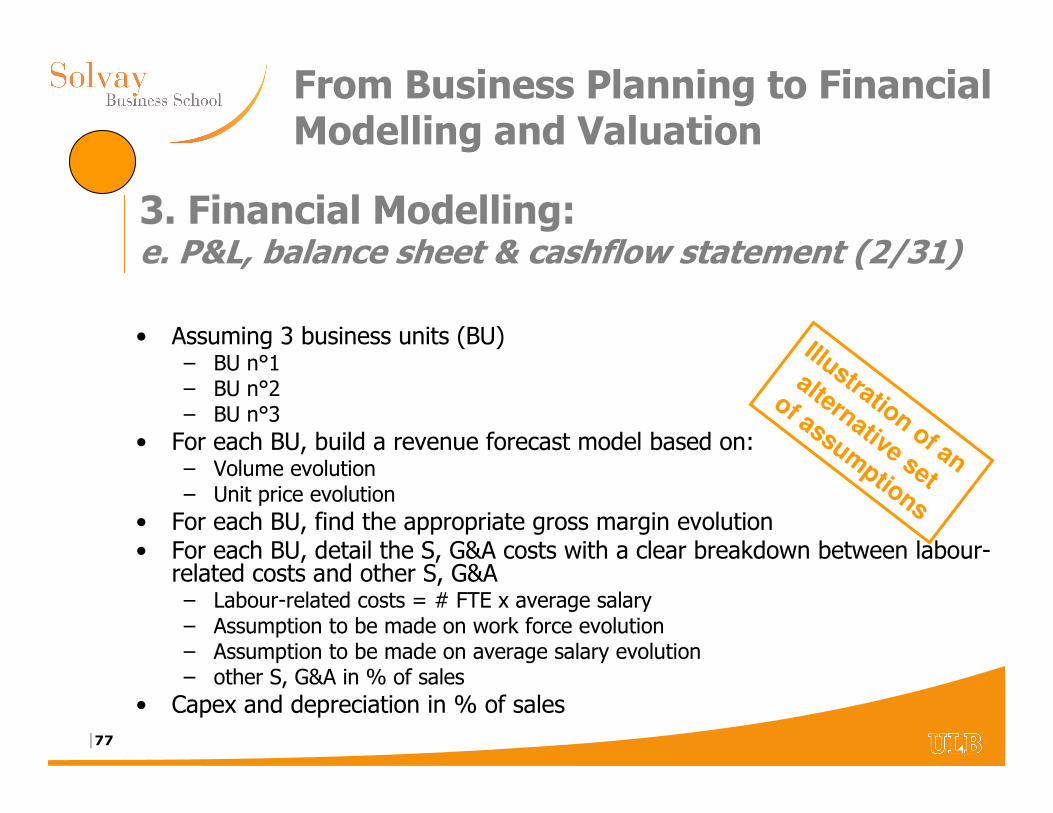
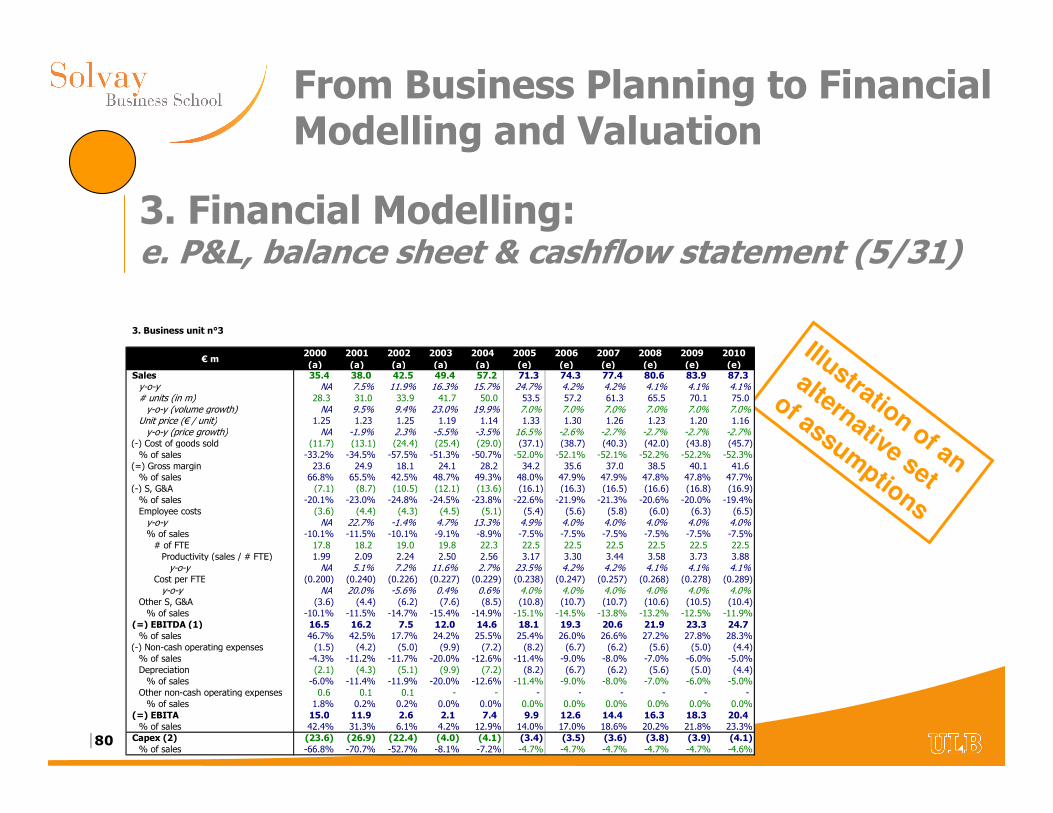
• Assuming 3 business units (BU)– BU n°1– BU n°2– BU n°3
• For each BU, build a revenue forecast model based on:– Volume evolution– Unit price evolution
• For each BU, find the appropriate gross margin evolution• For each BU, detail the S, G&A costs with a clear breakdown between labour-
related costs and other S, G&A– Labour-related costs = # FTE x average salary– Assumption to be made on work force evolution– Assumption to be made on average salary evolution– other S, G&A in % of sales
• Capex and depreciation in % of sales
Illustration of an
alternative set
of assumptions
3. Financial Modelling:e. P&L, balance sheet & cashflow statement (2/31)

|78
From Business Planning to Financial Modelling and Valuation
Illustration of an
alternative set
of assumptions
1. Business unit n°1
€ m2000 (a)
2001 (a)
2002 (a)
2003 (a)
2004 (a)
2005 (e)
2006 (e)
2007 (e)
2008 (e)
2009 (e)
2010 (e)
Sales 95.0 115.0 120.0 134.0 145.0 149.4 153.9 158.5 163.3 168.3 173.3 y-o-y NA 21.1% 4.3% 11.7% 8.2% 3.0% 3.0% 3.0% 3.0% 3.0% 3.0%# units (in m) 123.5 143.1 146.3 157.5 165.6 168.9 172.3 175.7 179.3 182.8 186.5 y-o-y (volume growth) NA 15.9% 2.2% 7.7% 5.1% 2.0% 2.0% 2.0% 2.0% 2.0% 2.0%
Unit price (€ / unit) 0.77 0.80 0.82 0.85 0.88 0.88 0.89 0.90 0.91 0.92 0.93 y-o-y (price growth) NA 4.5% 2.1% 3.7% 2.9% 1.0% 1.0% 1.0% 1.0% 1.0% 1.0%
(-) Cost of goods sold (61.8) (74.8) (78.0) (87.1) (94.3) (97.1) (100.0) (103.0) (106.2) (109.4) (112.7) % of sales -65.0% -65.0% -65.0% -65.0% -65.0% -65.0% -65.0% -65.0% -65.0% -65.0% -65.0%
(=) Gross margin 33.3 40.3 42.0 46.9 50.8 52.3 53.9 55.5 57.2 58.9 60.7 % of sales 35.0% 35.0% 35.0% 35.0% 35.0% 35.0% 35.0% 35.0% 35.0% 35.0% 35.0%
(-) S, G&A (19.1) (22.9) (24.1) (27.0) (29.4) (30.6) (31.7) (32.9) (34.1) (35.4) (36.8) % of sales -20.1% -19.9% -20.1% -20.1% -20.3% -20.5% -20.6% -20.8% -20.9% -21.1% -21.2%Employee costs (14.2) (17.1) (18.3) (20.0) (22.2) (23.1) (24.0) (25.0) (26.0) (27.0) (28.1) y-o-y NA 20.4% 7.0% 9.3% 11.0% 4.0% 4.0% 4.0% 4.0% 4.0% 4.0%% of sales -14.9% -14.9% -15.3% -14.9% -15.3% -15.5% -15.6% -15.8% -15.9% -16.1% -16.2%# of FTE 75.1 85.6 88.2 92.7 98.0 98.0 98.0 98.0 98.0 98.0 98.0 Productivity (sales / # FTE) 1.26 1.34 1.36 1.45 1.48 1.52 1.57 1.62 1.67 1.72 1.77 y-o-y NA 6.2% 1.3% 6.2% 2.4% 3.0% 3.0% 3.0% 3.0% 3.0% 3.0%
Cost per FTE (0.189) (0.200) (0.207) (0.216) (0.227) (0.236) (0.245) (0.255) (0.265) (0.276) (0.287) y-o-y NA 5.7% 3.9% 4.0% 5.0% 4.0% 4.0% 4.0% 4.0% 4.0% 4.0%
Other S, G&A (4.9) (5.8) (5.8) (7.0) (7.2) (7.5) (7.7) (7.9) (8.2) (8.4) (8.7) % of sales -5.2% -5.0% -4.8% -5.2% -5.0% -5.0% -5.0% -5.0% -5.0% -5.0% -5.0%
(=) EBITDA (1) 14.2 17.4 17.9 19.9 21.4 21.7 22.2 22.6 23.0 23.5 23.9 % of sales 14.9% 15.1% 14.9% 14.9% 14.7% 14.5% 14.4% 14.2% 14.1% 13.9% 13.8%
(-) Non-cash operating expenses (8.9) (10.7) (11.0) (12.3) (13.4) (12.0) (10.8) (9.5) (9.8) (10.1) (10.4) % of sales -9.3% -9.3% -9.1% -9.2% -9.2% -8.0% -7.0% -6.0% -6.0% -6.0% -6.0%Depreciation (8.9) (10.7) (11.0) (12.3) (13.4) (12.0) (10.8) (9.5) (9.8) (10.1) (10.4) % of sales -9.3% -9.3% -9.1% -9.2% -9.2% -8.0% -7.0% -6.0% -6.0% -6.0% -6.0%
Other non-cash operating expenses - - - - - - - - - - - % of sales 0.0% 0.0% 0.0% 0.0% 0.0% 0.0% 0.0% 0.0% 0.0% 0.0% 0.0%
(=) EBITA 5.3 6.7 7.0 7.6 8.0 9.8 11.4 13.1 13.2 13.4 13.5 % of sales 5.6% 5.8% 5.8% 5.7% 5.5% 6.5% 7.4% 8.2% 8.1% 7.9% 7.8%
Capex (2) (6.0) (7.8) (9.0) (4.2) (9.7) (9.0) (9.2) (9.5) (9.8) (10.1) (10.4) % of sales -6.3% -6.8% -7.5% -3.1% -6.7% -6.0% -6.0% -6.0% -6.0% -6.0% -6.0%
3. Financial Modelling:e. P&L, balance sheet & cashflow statement (3/31)
|79
From Business Planning to Financial Modelling and Valuation
Illustration of an
alternative set
of assumptions
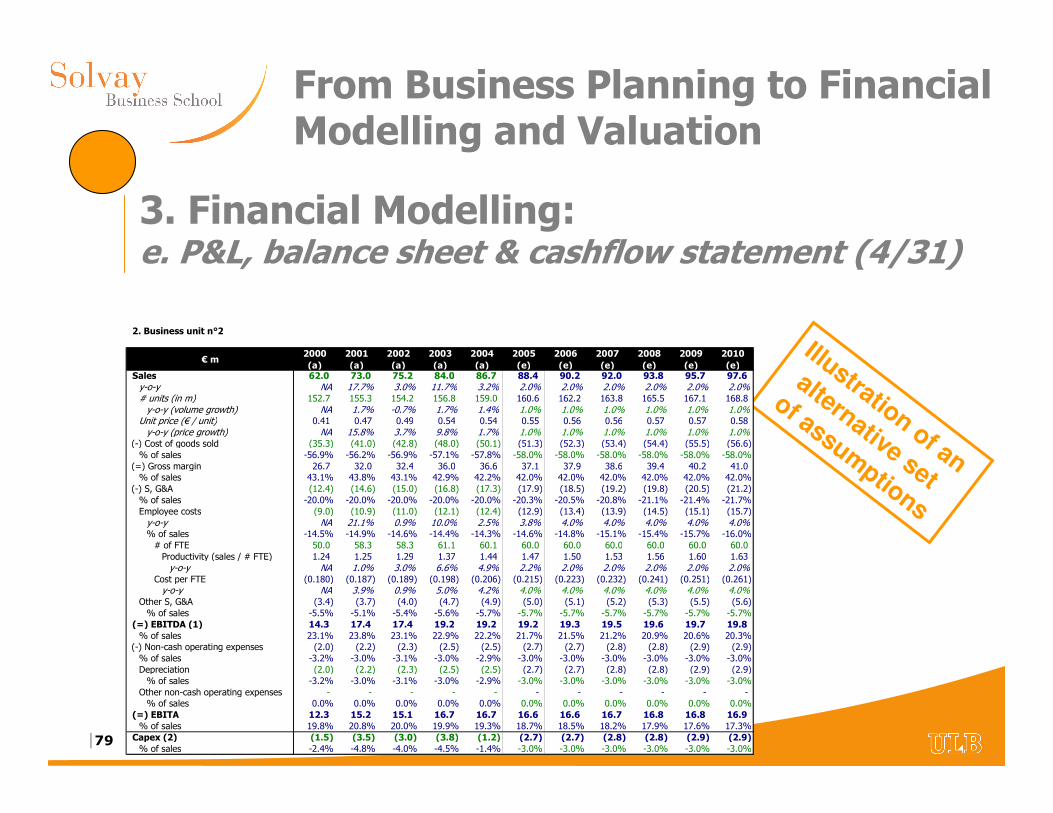
2. Business unit n°2
€ m2000 (a)
2001 (a)
2002 (a)
2003 (a)
2004 (a)
2005 (e)
2006 (e)
2007 (e)
2008 (e)
2009 (e)
2010 (e)
Sales 62.0 73.0 75.2 84.0 86.7 88.4 90.2 92.0 93.8 95.7 97.6 y-o-y NA 17.7% 3.0% 11.7% 3.2% 2.0% 2.0% 2.0% 2.0% 2.0% 2.0%# units (in m) 152.7 155.3 154.2 156.8 159.0 160.6 162.2 163.8 165.5 167.1 168.8 y-o-y (volume growth) NA 1.7% -0.7% 1.7% 1.4% 1.0% 1.0% 1.0% 1.0% 1.0% 1.0%
Unit price (€ / unit) 0.41 0.47 0.49 0.54 0.54 0.55 0.56 0.56 0.57 0.57 0.58 y-o-y (price growth) NA 15.8% 3.7% 9.8% 1.7% 1.0% 1.0% 1.0% 1.0% 1.0% 1.0%
(-) Cost of goods sold (35.3) (41.0) (42.8) (48.0) (50.1) (51.3) (52.3) (53.4) (54.4) (55.5) (56.6) % of sales -56.9% -56.2% -56.9% -57.1% -57.8% -58.0% -58.0% -58.0% -58.0% -58.0% -58.0%
(=) Gross margin 26.7 32.0 32.4 36.0 36.6 37.1 37.9 38.6 39.4 40.2 41.0 % of sales 43.1% 43.8% 43.1% 42.9% 42.2% 42.0% 42.0% 42.0% 42.0% 42.0% 42.0%
(-) S, G&A (12.4) (14.6) (15.0) (16.8) (17.3) (17.9) (18.5) (19.2) (19.8) (20.5) (21.2) % of sales -20.0% -20.0% -20.0% -20.0% -20.0% -20.3% -20.5% -20.8% -21.1% -21.4% -21.7%Employee costs (9.0) (10.9) (11.0) (12.1) (12.4) (12.9) (13.4) (13.9) (14.5) (15.1) (15.7) y-o-y NA 21.1% 0.9% 10.0% 2.5% 3.8% 4.0% 4.0% 4.0% 4.0% 4.0%% of sales -14.5% -14.9% -14.6% -14.4% -14.3% -14.6% -14.8% -15.1% -15.4% -15.7% -16.0%# of FTE 50.0 58.3 58.3 61.1 60.1 60.0 60.0 60.0 60.0 60.0 60.0 Productivity (sales / # FTE) 1.24 1.25 1.29 1.37 1.44 1.47 1.50 1.53 1.56 1.60 1.63 y-o-y NA 1.0% 3.0% 6.6% 4.9% 2.2% 2.0% 2.0% 2.0% 2.0% 2.0%
Cost per FTE (0.180) (0.187) (0.189) (0.198) (0.206) (0.215) (0.223) (0.232) (0.241) (0.251) (0.261) y-o-y NA 3.9% 0.9% 5.0% 4.2% 4.0% 4.0% 4.0% 4.0% 4.0% 4.0%
Other S, G&A (3.4) (3.7) (4.0) (4.7) (4.9) (5.0) (5.1) (5.2) (5.3) (5.5) (5.6) % of sales -5.5% -5.1% -5.4% -5.6% -5.7% -5.7% -5.7% -5.7% -5.7% -5.7% -5.7%
(=) EBITDA (1) 14.3 17.4 17.4 19.2 19.2 19.2 19.3 19.5 19.6 19.7 19.8 % of sales 23.1% 23.8% 23.1% 22.9% 22.2% 21.7% 21.5% 21.2% 20.9% 20.6% 20.3%
(-) Non-cash operating expenses (2.0) (2.2) (2.3) (2.5) (2.5) (2.7) (2.7) (2.8) (2.8) (2.9) (2.9) % of sales -3.2% -3.0% -3.1% -3.0% -2.9% -3.0% -3.0% -3.0% -3.0% -3.0% -3.0%Depreciation (2.0) (2.2) (2.3) (2.5) (2.5) (2.7) (2.7) (2.8) (2.8) (2.9) (2.9) % of sales -3.2% -3.0% -3.1% -3.0% -2.9% -3.0% -3.0% -3.0% -3.0% -3.0% -3.0%
Other non-cash operating expenses - - - - - - - - - - - % of sales 0.0% 0.0% 0.0% 0.0% 0.0% 0.0% 0.0% 0.0% 0.0% 0.0% 0.0%
(=) EBITA 12.3 15.2 15.1 16.7 16.7 16.6 16.6 16.7 16.8 16.8 16.9 % of sales 19.8% 20.8% 20.0% 19.9% 19.3% 18.7% 18.5% 18.2% 17.9% 17.6% 17.3%
Capex (2) (1.5) (3.5) (3.0) (3.8) (1.2) (2.7) (2.7) (2.8) (2.8) (2.9) (2.9) % of sales -2.4% -4.8% -4.0% -4.5% -1.4% -3.0% -3.0% -3.0% -3.0% -3.0% -3.0%
3. Financial Modelling:e. P&L, balance sheet & cashflow statement (4/31)
|80
From Business Planning to Financial Modelling and Valuation
Illustration of an
alternative set
of assumptions
3. Business unit n°3
€ m2000 (a)
2001 (a)
2002 (a)
2003 (a)
2004 (a)
2005 (e)
2006 (e)
2007 (e)
2008 (e)
2009 (e)
2010 (e)
Sales 35.4 38.0 42.5 49.4 57.2 71.3 74.3 77.4 80.6 83.9 87.3 y-o-y NA 7.5% 11.9% 16.3% 15.7% 24.7% 4.2% 4.2% 4.1% 4.1% 4.1%# units (in m) 28.3 31.0 33.9 41.7 50.0 53.5 57.2 61.3 65.5 70.1 75.0 y-o-y (volume growth) NA 9.5% 9.4% 23.0% 19.9% 7.0% 7.0% 7.0% 7.0% 7.0% 7.0%
Unit price (€ / unit) 1.25 1.23 1.25 1.19 1.14 1.33 1.30 1.26 1.23 1.20 1.16 y-o-y (price growth) NA -1.9% 2.3% -5.5% -3.5% 16.5% -2.6% -2.7% -2.7% -2.7% -2.7%
(-) Cost of goods sold (11.7) (13.1) (24.4) (25.4) (29.0) (37.1) (38.7) (40.3) (42.0) (43.8) (45.7) % of sales -33.2% -34.5% -57.5% -51.3% -50.7% -52.0% -52.1% -52.1% -52.2% -52.2% -52.3%
(=) Gross margin 23.6 24.9 18.1 24.1 28.2 34.2 35.6 37.0 38.5 40.1 41.6 % of sales 66.8% 65.5% 42.5% 48.7% 49.3% 48.0% 47.9% 47.9% 47.8% 47.8% 47.7%
(-) S, G&A (7.1) (8.7) (10.5) (12.1) (13.6) (16.1) (16.3) (16.5) (16.6) (16.8) (16.9) % of sales -20.1% -23.0% -24.8% -24.5% -23.8% -22.6% -21.9% -21.3% -20.6% -20.0% -19.4%Employee costs (3.6) (4.4) (4.3) (4.5) (5.1) (5.4) (5.6) (5.8) (6.0) (6.3) (6.5) y-o-y NA 22.7% -1.4% 4.7% 13.3% 4.9% 4.0% 4.0% 4.0% 4.0% 4.0%% of sales -10.1% -11.5% -10.1% -9.1% -8.9% -7.5% -7.5% -7.5% -7.5% -7.5% -7.5%# of FTE 17.8 18.2 19.0 19.8 22.3 22.5 22.5 22.5 22.5 22.5 22.5 Productivity (sales / # FTE) 1.99 2.09 2.24 2.50 2.56 3.17 3.30 3.44 3.58 3.73 3.88 y-o-y NA 5.1% 7.2% 11.6% 2.7% 23.5% 4.2% 4.2% 4.1% 4.1% 4.1%
Cost per FTE (0.200) (0.240) (0.226) (0.227) (0.229) (0.238) (0.247) (0.257) (0.268) (0.278) (0.289) y-o-y NA 20.0% -5.6% 0.4% 0.6% 4.0% 4.0% 4.0% 4.0% 4.0% 4.0%
Other S, G&A (3.6) (4.4) (6.2) (7.6) (8.5) (10.8) (10.7) (10.7) (10.6) (10.5) (10.4) % of sales -10.1% -11.5% -14.7% -15.4% -14.9% -15.1% -14.5% -13.8% -13.2% -12.5% -11.9%
(=) EBITDA (1) 16.5 16.2 7.5 12.0 14.6 18.1 19.3 20.6 21.9 23.3 24.7 % of sales 46.7% 42.5% 17.7% 24.2% 25.5% 25.4% 26.0% 26.6% 27.2% 27.8% 28.3%
(-) Non-cash operating expenses (1.5) (4.2) (5.0) (9.9) (7.2) (8.2) (6.7) (6.2) (5.6) (5.0) (4.4) % of sales -4.3% -11.2% -11.7% -20.0% -12.6% -11.4% -9.0% -8.0% -7.0% -6.0% -5.0%Depreciation (2.1) (4.3) (5.1) (9.9) (7.2) (8.2) (6.7) (6.2) (5.6) (5.0) (4.4) % of sales -6.0% -11.4% -11.9% -20.0% -12.6% -11.4% -9.0% -8.0% -7.0% -6.0% -5.0%
Other non-cash operating expenses 0.6 0.1 0.1 - - - - - - - - % of sales 1.8% 0.2% 0.2% 0.0% 0.0% 0.0% 0.0% 0.0% 0.0% 0.0% 0.0%
(=) EBITA 15.0 11.9 2.6 2.1 7.4 9.9 12.6 14.4 16.3 18.3 20.4 % of sales 42.4% 31.3% 6.1% 4.2% 12.9% 14.0% 17.0% 18.6% 20.2% 21.8% 23.3%
Capex (2) (23.6) (26.9) (22.4) (4.0) (4.1) (3.4) (3.5) (3.6) (3.8) (3.9) (4.1) % of sales -66.8% -70.7% -52.7% -8.1% -7.2% -4.7% -4.7% -4.7% -4.7% -4.7% -4.6%
3. Financial Modelling:e. P&L, balance sheet & cashflow statement (5/31)
|81
From Business Planning to Financial Modelling and Valuation
Illustration of an
alternative set
of assumptions
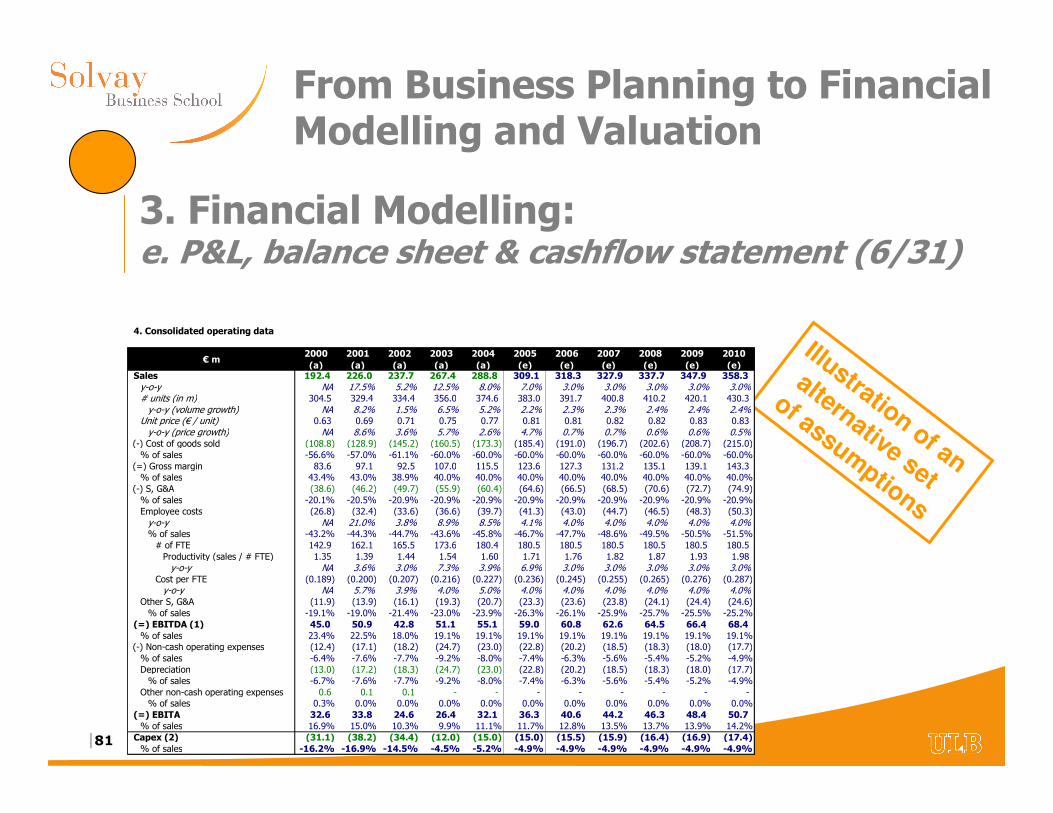
4. Consolidated operating data
€ m2000 (a)
2001 (a)
2002 (a)
2003 (a)
2004 (a)
2005 (e)
2006 (e)
2007 (e)
2008 (e)
2009 (e)
2010 (e)
Sales 192.4 226.0 237.7 267.4 288.8 309.1 318.3 327.9 337.7 347.9 358.3 y-o-y NA 17.5% 5.2% 12.5% 8.0% 7.0% 3.0% 3.0% 3.0% 3.0% 3.0%# units (in m) 304.5 329.4 334.4 356.0 374.6 383.0 391.7 400.8 410.2 420.1 430.3 y-o-y (volume growth) NA 8.2% 1.5% 6.5% 5.2% 2.2% 2.3% 2.3% 2.4% 2.4% 2.4%
Unit price (€ / unit) 0.63 0.69 0.71 0.75 0.77 0.81 0.81 0.82 0.82 0.83 0.83 y-o-y (price growth) NA 8.6% 3.6% 5.7% 2.6% 4.7% 0.7% 0.7% 0.6% 0.6% 0.5%
(-) Cost of goods sold (108.8) (128.9) (145.2) (160.5) (173.3) (185.4) (191.0) (196.7) (202.6) (208.7) (215.0) % of sales -56.6% -57.0% -61.1% -60.0% -60.0% -60.0% -60.0% -60.0% -60.0% -60.0% -60.0%
(=) Gross margin 83.6 97.1 92.5 107.0 115.5 123.6 127.3 131.2 135.1 139.1 143.3 % of sales 43.4% 43.0% 38.9% 40.0% 40.0% 40.0% 40.0% 40.0% 40.0% 40.0% 40.0%
(-) S, G&A (38.6) (46.2) (49.7) (55.9) (60.4) (64.6) (66.5) (68.5) (70.6) (72.7) (74.9) % of sales -20.1% -20.5% -20.9% -20.9% -20.9% -20.9% -20.9% -20.9% -20.9% -20.9% -20.9%Employee costs (26.8) (32.4) (33.6) (36.6) (39.7) (41.3) (43.0) (44.7) (46.5) (48.3) (50.3) y-o-y NA 21.0% 3.8% 8.9% 8.5% 4.1% 4.0% 4.0% 4.0% 4.0% 4.0%% of sales -43.2% -44.3% -44.7% -43.6% -45.8% -46.7% -47.7% -48.6% -49.5% -50.5% -51.5%# of FTE 142.9 162.1 165.5 173.6 180.4 180.5 180.5 180.5 180.5 180.5 180.5 Productivity (sales / # FTE) 1.35 1.39 1.44 1.54 1.60 1.71 1.76 1.82 1.87 1.93 1.98 y-o-y NA 3.6% 3.0% 7.3% 3.9% 6.9% 3.0% 3.0% 3.0% 3.0% 3.0%
Cost per FTE (0.189) (0.200) (0.207) (0.216) (0.227) (0.236) (0.245) (0.255) (0.265) (0.276) (0.287) y-o-y NA 5.7% 3.9% 4.0% 5.0% 4.0% 4.0% 4.0% 4.0% 4.0% 4.0%
Other S, G&A (11.9) (13.9) (16.1) (19.3) (20.7) (23.3) (23.6) (23.8) (24.1) (24.4) (24.6) % of sales -19.1% -19.0% -21.4% -23.0% -23.9% -26.3% -26.1% -25.9% -25.7% -25.5% -25.2%
(=) EBITDA (1) 45.0 50.9 42.8 51.1 55.1 59.0 60.8 62.6 64.5 66.4 68.4 % of sales 23.4% 22.5% 18.0% 19.1% 19.1% 19.1% 19.1% 19.1% 19.1% 19.1% 19.1%
(-) Non-cash operating expenses (12.4) (17.1) (18.2) (24.7) (23.0) (22.8) (20.2) (18.5) (18.3) (18.0) (17.7) % of sales -6.4% -7.6% -7.7% -9.2% -8.0% -7.4% -6.3% -5.6% -5.4% -5.2% -4.9%Depreciation (13.0) (17.2) (18.3) (24.7) (23.0) (22.8) (20.2) (18.5) (18.3) (18.0) (17.7) % of sales -6.7% -7.6% -7.7% -9.2% -8.0% -7.4% -6.3% -5.6% -5.4% -5.2% -4.9%
Other non-cash operating expenses 0.6 0.1 0.1 - - - - - - - - % of sales 0.3% 0.0% 0.0% 0.0% 0.0% 0.0% 0.0% 0.0% 0.0% 0.0% 0.0%
(=) EBITA 32.6 33.8 24.6 26.4 32.1 36.3 40.6 44.2 46.3 48.4 50.7 % of sales 16.9% 15.0% 10.3% 9.9% 11.1% 11.7% 12.8% 13.5% 13.7% 13.9% 14.2%
Capex (2) (31.1) (38.2) (34.4) (12.0) (15.0) (15.0) (15.5) (15.9) (16.4) (16.9) (17.4) % of sales -16.2% -16.9% -14.5% -4.5% -5.2% -4.9% -4.9% -4.9% -4.9% -4.9% -4.9%
3. Financial Modelling:e. P&L, balance sheet & cashflow statement (6/31)
|82
From Business Planning to Financial Modelling and Valuation
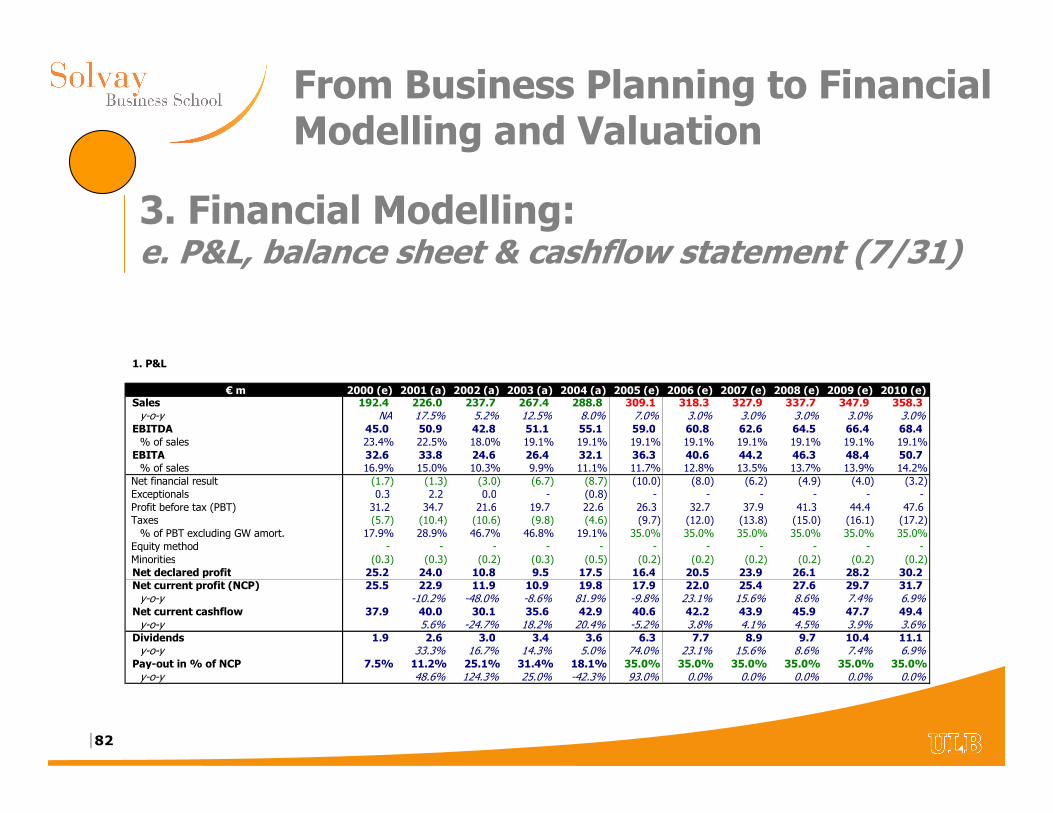
1. P&L
€ m 2000 (e) 2001 (a) 2002 (a) 2003 (a) 2004 (a) 2005 (e) 2006 (e) 2007 (e) 2008 (e) 2009 (e) 2010 (e)Sales 192.4 226.0 237.7 267.4 288.8 309.1 318.3 327.9 337.7 347.9 358.3 y-o-y NA 17.5% 5.2% 12.5% 8.0% 7.0% 3.0% 3.0% 3.0% 3.0% 3.0%
EBITDA 45.0 50.9 42.8 51.1 55.1 59.0 60.8 62.6 64.5 66.4 68.4 % of sales 23.4% 22.5% 18.0% 19.1% 19.1% 19.1% 19.1% 19.1% 19.1% 19.1% 19.1%
EBITA 32.6 33.8 24.6 26.4 32.1 36.3 40.6 44.2 46.3 48.4 50.7 % of sales 16.9% 15.0% 10.3% 9.9% 11.1% 11.7% 12.8% 13.5% 13.7% 13.9% 14.2%
Net financial result (1.7) (1.3) (3.0) (6.7) (8.7) (10.0) (8.0) (6.2) (4.9) (4.0) (3.2) Exceptionals 0.3 2.2 0.0 - (0.8) - - - - - - Profit before tax (PBT) 31.2 34.7 21.6 19.7 22.6 26.3 32.7 37.9 41.3 44.4 47.6 Taxes (5.7) (10.4) (10.6) (9.8) (4.6) (9.7) (12.0) (13.8) (15.0) (16.1) (17.2) % of PBT excluding GW amort. 17.9% 28.9% 46.7% 46.8% 19.1% 35.0% 35.0% 35.0% 35.0% 35.0% 35.0%
Equity method - - - - - - - - - - - Minorities (0.3) (0.3) (0.2) (0.3) (0.5) (0.2) (0.2) (0.2) (0.2) (0.2) (0.2) Net declared profit 25.2 24.0 10.8 9.5 17.5 16.4 20.5 23.9 26.1 28.2 30.2 Net current profit (NCP) 25.5 22.9 11.9 10.9 19.8 17.9 22.0 25.4 27.6 29.7 31.7 y-o-y -10.2% -48.0% -8.6% 81.9% -9.8% 23.1% 15.6% 8.6% 7.4% 6.9%
Net current cashflow 37.9 40.0 30.1 35.6 42.9 40.6 42.2 43.9 45.9 47.7 49.4 y-o-y 5.6% -24.7% 18.2% 20.4% -5.2% 3.8% 4.1% 4.5% 3.9% 3.6%
Dividends 1.9 2.6 3.0 3.4 3.6 6.3 7.7 8.9 9.7 10.4 11.1 y-o-y 33.3% 16.7% 14.3% 5.0% 74.0% 23.1% 15.6% 8.6% 7.4% 6.9%
Pay-out in % of NCP 7.5% 11.2% 25.1% 31.4% 18.1% 35.0% 35.0% 35.0% 35.0% 35.0% 35.0%y-o-y 48.6% 124.3% 25.0% -42.3% 93.0% 0.0% 0.0% 0.0% 0.0% 0.0%
3. Financial Modelling:e. P&L, balance sheet & cashflow statement (7/31)
|83
From Business Planning to Financial Modelling and Valuation
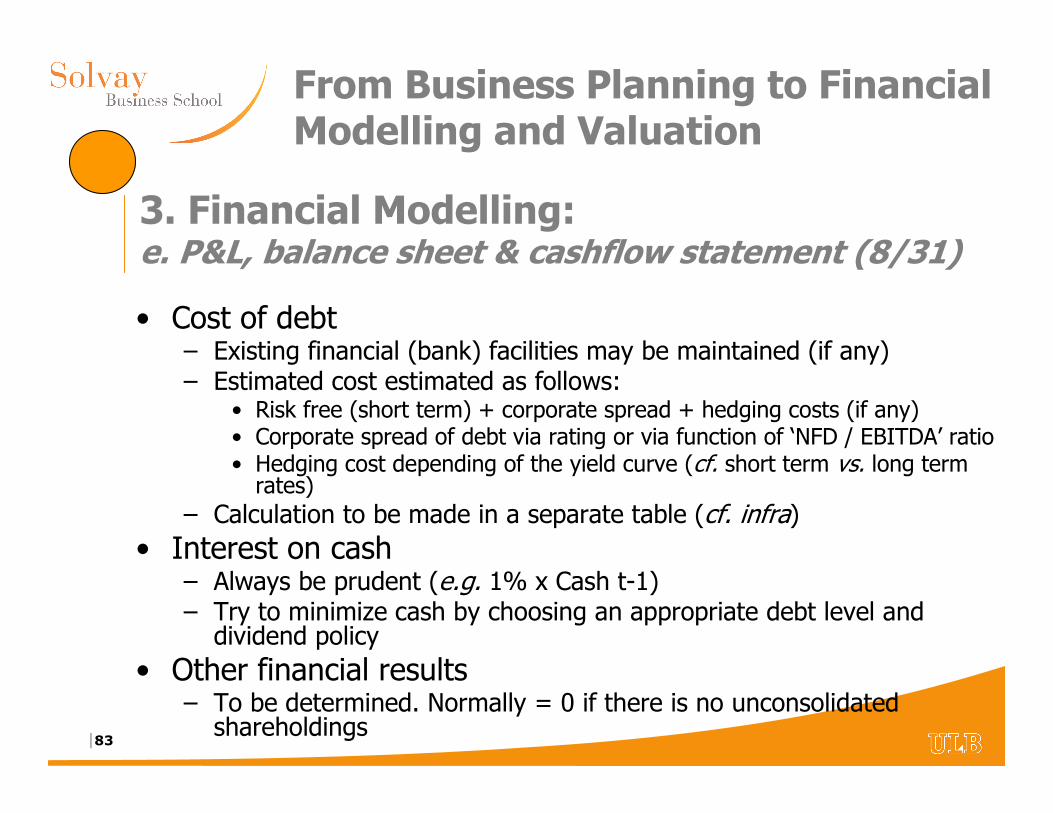
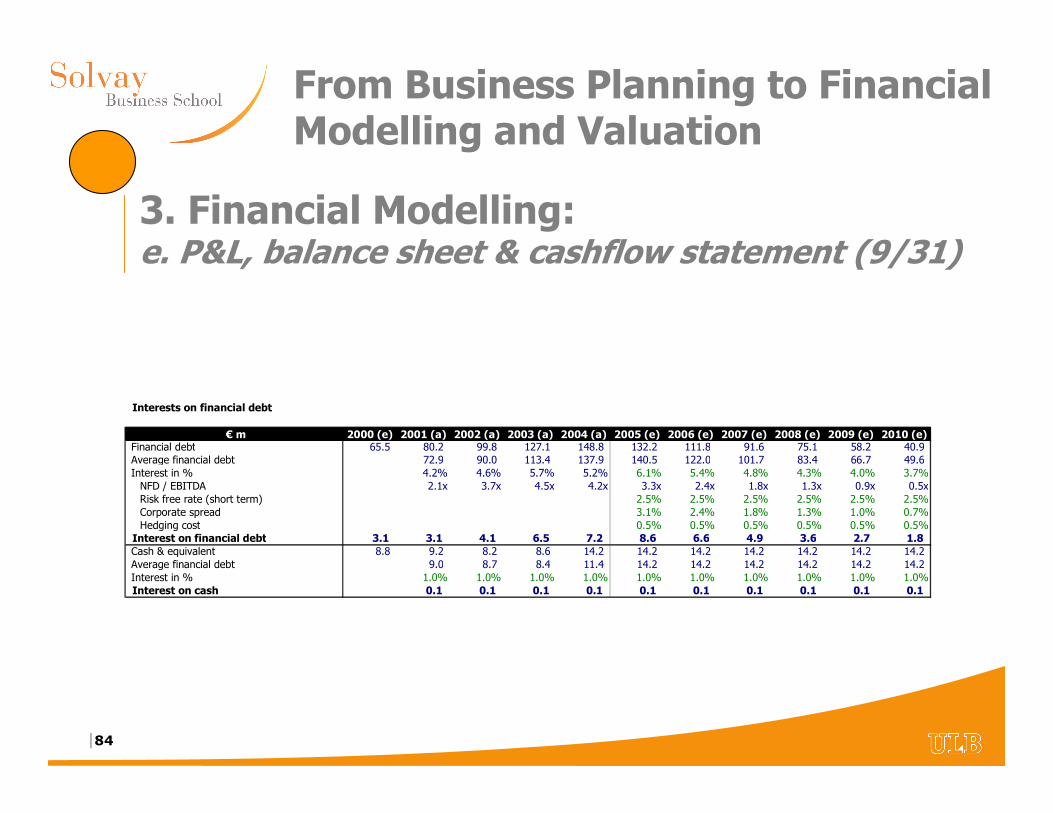
• Cost of debt – Existing financial (bank) facilities may be maintained (if any)– Estimated cost estimated as follows:
• Risk free (short term) + corporate spread + hedging costs (if any)• Corporate spread of debt via rating or via function of ‘NFD / EBITDA’ ratio• Hedging cost depending of the yield curve (cf. short term vs. long term rates)
– Calculation to be made in a separate table (cf. infra)
• Interest on cash– Always be prudent (e.g. 1% x Cash t-1)– Try to minimize cash by choosing an appropriate debt level and
dividend policy
• Other financial results– To be determined. Normally = 0 if there is no unconsolidated
shareholdings
3. Financial Modelling:e. P&L, balance sheet & cashflow statement (8/31)
|84
From Business Planning to Financial Modelling and Valuation
Interests on financial debt
€ m 2000 (e) 2001 (a) 2002 (a) 2003 (a) 2004 (a) 2005 (e) 2006 (e) 2007 (e) 2008 (e) 2009 (e) 2010 (e)Financial debt 65.5 80.2 99.8 127.1 148.8 132.2 111.8 91.6 75.1 58.2 40.9 Average financial debt 72.9 90.0 113.4 137.9 140.5 122.0 101.7 83.4 66.7 49.6 Interest in % 4.2% 4.6% 5.7% 5.2% 6.1% 5.4% 4.8% 4.3% 4.0% 3.7%NFD / EBITDA 2.1x 3.7x 4.5x 4.2x 3.3x 2.4x 1.8x 1.3x 0.9x 0.5xRisk free rate (short term) 2.5% 2.5% 2.5% 2.5% 2.5% 2.5%Corporate spread 3.1% 2.4% 1.8% 1.3% 1.0% 0.7%Hedging cost 0.5% 0.5% 0.5% 0.5% 0.5% 0.5%
Interest on financial debt 3.1 3.1 4.1 6.5 7.2 8.6 6.6 4.9 3.6 2.7 1.8 Cash & equivalent 8.8 9.2 8.2 8.6 14.2 14.2 14.2 14.2 14.2 14.2 14.2 Average financial debt 9.0 8.7 8.4 11.4 14.2 14.2 14.2 14.2 14.2 14.2 Interest in % 1.0% 1.0% 1.0% 1.0% 1.0% 1.0% 1.0% 1.0% 1.0% 1.0%Interest on cash 0.1 0.1 0.1 0.1 0.1 0.1 0.1 0.1 0.1 0.1
3. Financial Modelling:e. P&L, balance sheet & cashflow statement (9/31)
|85
From Business Planning to Financial Modelling and Valuation
• Extraordinary items– Excluding specific information = 0
• Taxes– Application of a % on PBT (excluding goodwill amortization)
– Tax loss carry forward has to be considered
– Tax optimization has to be considered
• Equity accounted shareholdings and minorities– To be determined on a case by case basis
– Be careful if 100% of earnings are not paid in dividend (cf. important for the establishment of the cashflow statement)
• Dividend policy– To be considered in the overall perspective
– Based on pay-out on ‘Net current profit’
3. Financial Modelling:e. P&L, balance sheet & cashflow statement (10/31)
|86
From Business Planning to Financial Modelling and Valuation
• NCP= Net Profit + Amortization Goodwill + Exceptionals
• Net current profit has to be adjusted for– Financing one-offs (e.g. debt refinancing)
– Parent’s share in a subsidiary’s exceptional item when parent uses the equity method
– Tax impact also has to be considered
3. Financial Modelling:e. P&L, balance sheet & cashflow statement (11/31)
|87
From Business Planning to Financial Modelling and Valuation
Detailed view
of the P&L
1. P&L
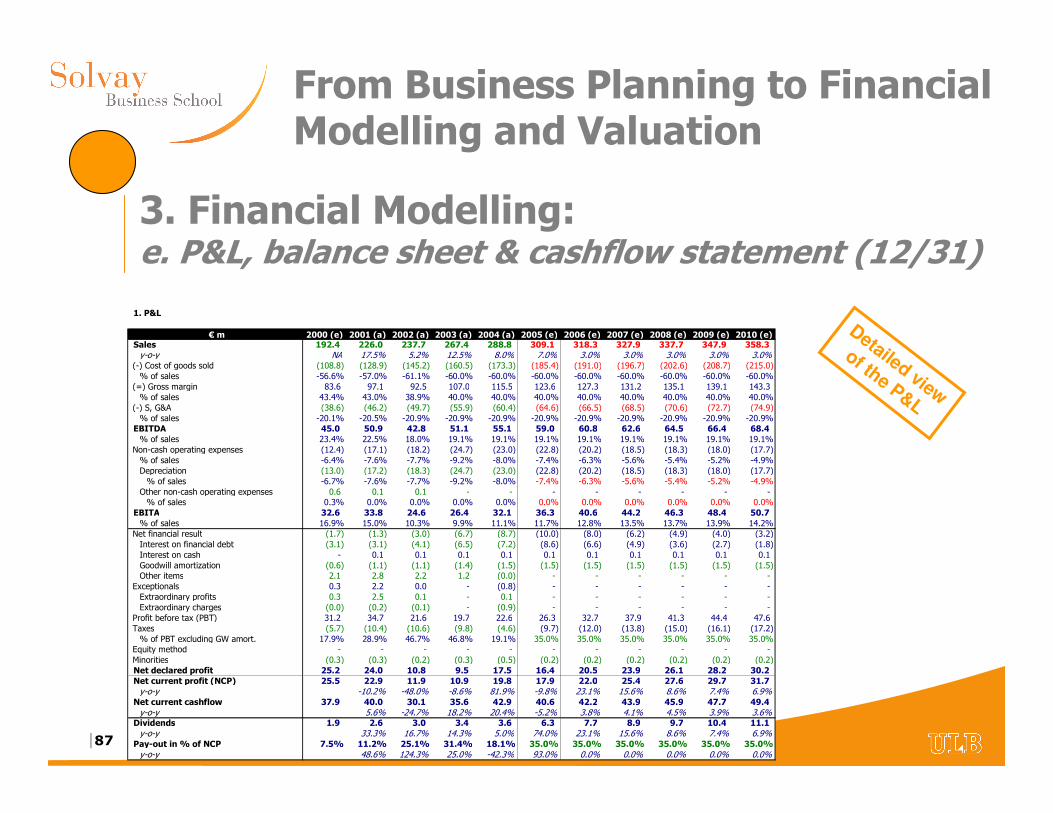
€ m 2000 (e) 2001 (a) 2002 (a) 2003 (a) 2004 (a) 2005 (e) 2006 (e) 2007 (e) 2008 (e) 2009 (e) 2010 (e)Sales 192.4 226.0 237.7 267.4 288.8 309.1 318.3 327.9 337.7 347.9 358.3 y-o-y NA 17.5% 5.2% 12.5% 8.0% 7.0% 3.0% 3.0% 3.0% 3.0% 3.0%
(-) Cost of goods sold (108.8) (128.9) (145.2) (160.5) (173.3) (185.4) (191.0) (196.7) (202.6) (208.7) (215.0) % of sales -56.6% -57.0% -61.1% -60.0% -60.0% -60.0% -60.0% -60.0% -60.0% -60.0% -60.0%
(=) Gross margin 83.6 97.1 92.5 107.0 115.5 123.6 127.3 131.2 135.1 139.1 143.3 % of sales 43.4% 43.0% 38.9% 40.0% 40.0% 40.0% 40.0% 40.0% 40.0% 40.0% 40.0%
(-) S, G&A (38.6) (46.2) (49.7) (55.9) (60.4) (64.6) (66.5) (68.5) (70.6) (72.7) (74.9) % of sales -20.1% -20.5% -20.9% -20.9% -20.9% -20.9% -20.9% -20.9% -20.9% -20.9% -20.9%
EBITDA 45.0 50.9 42.8 51.1 55.1 59.0 60.8 62.6 64.5 66.4 68.4 % of sales 23.4% 22.5% 18.0% 19.1% 19.1% 19.1% 19.1% 19.1% 19.1% 19.1% 19.1%
Non-cash operating expenses (12.4) (17.1) (18.2) (24.7) (23.0) (22.8) (20.2) (18.5) (18.3) (18.0) (17.7) % of sales -6.4% -7.6% -7.7% -9.2% -8.0% -7.4% -6.3% -5.6% -5.4% -5.2% -4.9%Depreciation (13.0) (17.2) (18.3) (24.7) (23.0) (22.8) (20.2) (18.5) (18.3) (18.0) (17.7) % of sales -6.7% -7.6% -7.7% -9.2% -8.0% -7.4% -6.3% -5.6% -5.4% -5.2% -4.9%
Other non-cash operating expenses 0.6 0.1 0.1 - - - - - - - - % of sales 0.3% 0.0% 0.0% 0.0% 0.0% 0.0% 0.0% 0.0% 0.0% 0.0% 0.0%
EBITA 32.6 33.8 24.6 26.4 32.1 36.3 40.6 44.2 46.3 48.4 50.7 % of sales 16.9% 15.0% 10.3% 9.9% 11.1% 11.7% 12.8% 13.5% 13.7% 13.9% 14.2%
Net financial result (1.7) (1.3) (3.0) (6.7) (8.7) (10.0) (8.0) (6.2) (4.9) (4.0) (3.2) Interest on financial debt (3.1) (3.1) (4.1) (6.5) (7.2) (8.6) (6.6) (4.9) (3.6) (2.7) (1.8) Interest on cash - 0.1 0.1 0.1 0.1 0.1 0.1 0.1 0.1 0.1 0.1 Goodwill amortization (0.6) (1.1) (1.1) (1.4) (1.5) (1.5) (1.5) (1.5) (1.5) (1.5) (1.5) Other items 2.1 2.8 2.2 1.2 (0.0) - - - - - -
Exceptionals 0.3 2.2 0.0 - (0.8) - - - - - - Extraordinary profits 0.3 2.5 0.1 - 0.1 - - - - - - Extraordinary charges (0.0) (0.2) (0.1) - (0.9) - - - - - -
Profit before tax (PBT) 31.2 34.7 21.6 19.7 22.6 26.3 32.7 37.9 41.3 44.4 47.6 Taxes (5.7) (10.4) (10.6) (9.8) (4.6) (9.7) (12.0) (13.8) (15.0) (16.1) (17.2) % of PBT excluding GW amort. 17.9% 28.9% 46.7% 46.8% 19.1% 35.0% 35.0% 35.0% 35.0% 35.0% 35.0%
Equity method - - - - - - - - - - - Minorities (0.3) (0.3) (0.2) (0.3) (0.5) (0.2) (0.2) (0.2) (0.2) (0.2) (0.2) Net declared profit 25.2 24.0 10.8 9.5 17.5 16.4 20.5 23.9 26.1 28.2 30.2 Net current profit (NCP) 25.5 22.9 11.9 10.9 19.8 17.9 22.0 25.4 27.6 29.7 31.7 y-o-y -10.2% -48.0% -8.6% 81.9% -9.8% 23.1% 15.6% 8.6% 7.4% 6.9%
Net current cashflow 37.9 40.0 30.1 35.6 42.9 40.6 42.2 43.9 45.9 47.7 49.4 y-o-y 5.6% -24.7% 18.2% 20.4% -5.2% 3.8% 4.1% 4.5% 3.9% 3.6%
Dividends 1.9 2.6 3.0 3.4 3.6 6.3 7.7 8.9 9.7 10.4 11.1 y-o-y 33.3% 16.7% 14.3% 5.0% 74.0% 23.1% 15.6% 8.6% 7.4% 6.9%
Pay-out in % of NCP 7.5% 11.2% 25.1% 31.4% 18.1% 35.0% 35.0% 35.0% 35.0% 35.0% 35.0%y-o-y 48.6% 124.3% 25.0% -42.3% 93.0% 0.0% 0.0% 0.0% 0.0% 0.0%
3. Financial Modelling:e. P&L, balance sheet & cashflow statement (12/31)
|88
From Business Planning to Financial Modelling and Valuation
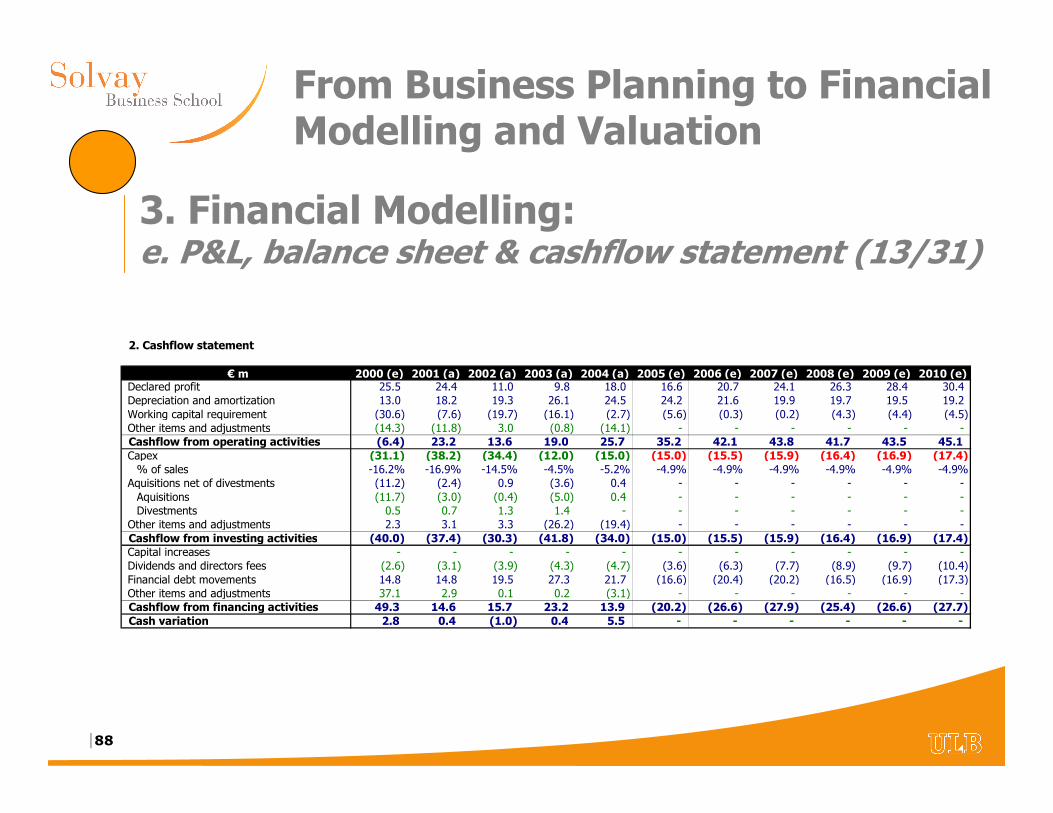
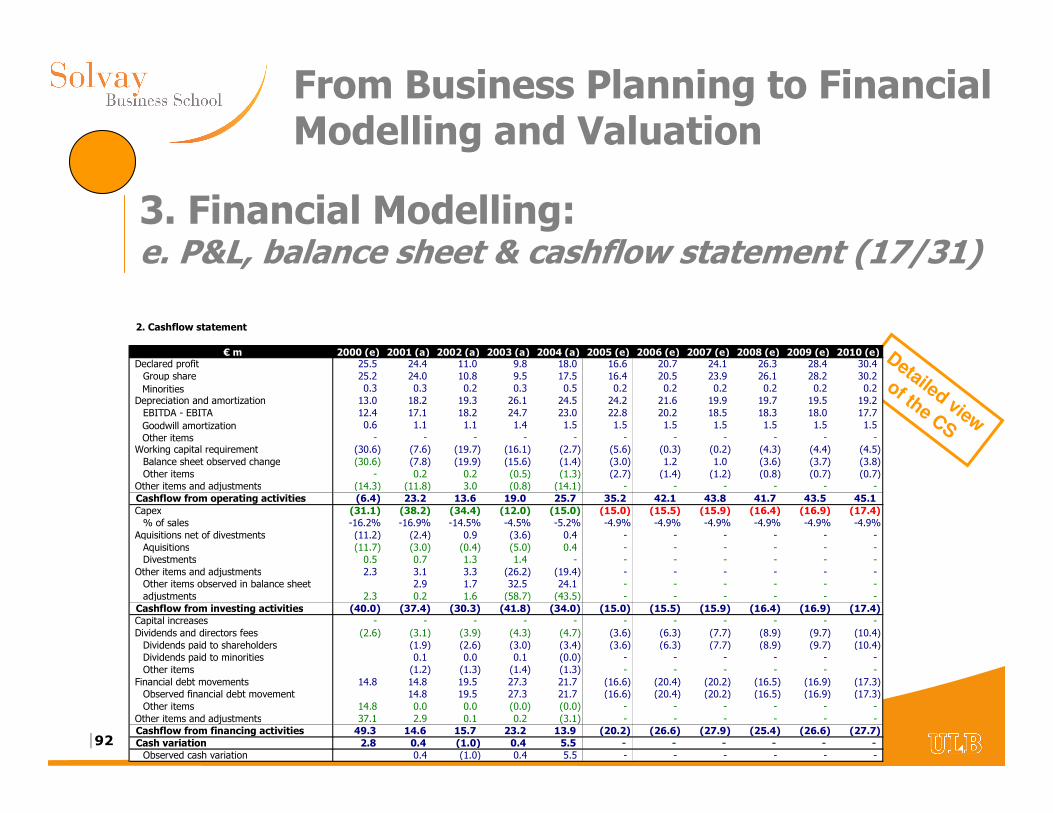
2. Cashflow statement
€ m 2000 (e) 2001 (a) 2002 (a) 2003 (a) 2004 (a) 2005 (e) 2006 (e) 2007 (e) 2008 (e) 2009 (e) 2010 (e)Declared profit 25.5 24.4 11.0 9.8 18.0 16.6 20.7 24.1 26.3 28.4 30.4 Depreciation and amortization 13.0 18.2 19.3 26.1 24.5 24.2 21.6 19.9 19.7 19.5 19.2 Working capital requirement (30.6) (7.6) (19.7) (16.1) (2.7) (5.6) (0.3) (0.2) (4.3) (4.4) (4.5) Other items and adjustments (14.3) (11.8) 3.0 (0.8) (14.1) - - - - - - Cashflow from operating activities (6.4) 23.2 13.6 19.0 25.7 35.2 42.1 43.8 41.7 43.5 45.1 Capex (31.1) (38.2) (34.4) (12.0) (15.0) (15.0) (15.5) (15.9) (16.4) (16.9) (17.4) % of sales -16.2% -16.9% -14.5% -4.5% -5.2% -4.9% -4.9% -4.9% -4.9% -4.9% -4.9%
Aquisitions net of divestments (11.2) (2.4) 0.9 (3.6) 0.4 - - - - - - Aquisitions (11.7) (3.0) (0.4) (5.0) 0.4 - - - - - - Divestments 0.5 0.7 1.3 1.4 - - - - - - -
Other items and adjustments 2.3 3.1 3.3 (26.2) (19.4) - - - - - - Cashflow from investing activities (40.0) (37.4) (30.3) (41.8) (34.0) (15.0) (15.5) (15.9) (16.4) (16.9) (17.4) Capital increases - - - - - - - - - - - Dividends and directors fees (2.6) (3.1) (3.9) (4.3) (4.7) (3.6) (6.3) (7.7) (8.9) (9.7) (10.4) Financial debt movements 14.8 14.8 19.5 27.3 21.7 (16.6) (20.4) (20.2) (16.5) (16.9) (17.3) Other items and adjustments 37.1 2.9 0.1 0.2 (3.1) - - - - - - Cashflow from financing activities 49.3 14.6 15.7 23.2 13.9 (20.2) (26.6) (27.9) (25.4) (26.6) (27.7) Cash variation 2.8 0.4 (1.0) 0.4 5.5 - - - - - -
3. Financial Modelling:e. P&L, balance sheet & cashflow statement (13/31)
|89
From Business Planning to Financial Modelling and Valuation
• ‘Declared profit’ and ‘Depreciation and amortization’– Derived from P&L
– Declared profit = Group share profit + Profit from minorities
• Working capital (WC) requirement– Derived from balance sheet (BS)
– WC requirement t = – (WC t – WC t-1)
– Be careful with change of perimeter (cf. acquisition and disposals)
• Other items and adjustments– Derived from historical cashflow statement for past financials
– Non-cash items due to changes in perimeter and currency impacts
– Adjustment to be considered if 100% of profit coming from equityaccounted shareholdings are received in dividend
– Prospectively = 0
3. Financial Modelling:e. P&L, balance sheet & cashflow statement (14/31)
|90
From Business Planning to Financial Modelling and Valuation
• Capex– In an ideal world = Detailed assumptions
– Distinction between maintenance capex and expansion
– In absence of satisfactory information % of sales consistent with industrial benchmarks
• Acquisitions and disposals– Prospective data to be considered first without change of perimeter
– In a second step, test the impact associated with acquisition and disposal
• Other items and adjustments– Derived from historical cashflow statement for past financials
– Non-cash items related to change in perimeter and currency impacts
– Prospectively = 0
3. Financial Modelling:e. P&L, balance sheet & cashflow statement (15/31)
|91
From Business Planning to Financial Modelling and Valuation
• Capital increase and dividend policy– Dividends to be considered = dividends paid to the company
shareholders and dividends paid to minorities – Assumptions to be considered carefully in the financial optimization /
value creation perspectives (cf. infra)– Fine tuning of those assumptions in other assumptions change
• Financial debt movements– Take into account reimbursement of existing credit line facilities– Automatic result (cf. equilibrium line)
• Other items and adjustments– Derived from historical cashflow statement (CFS) for past financials– Normally non-cash items related to change in perimeter and currency
impacts– Prospectively = 0
3. Financial Modelling:e. P&L, balance sheet & cashflow statement (16/31)
|92
From Business Planning to Financial Modelling and Valuation
Detailed view
of the CS
2. Cashflow statement
€ m 2000 (e) 2001 (a) 2002 (a) 2003 (a) 2004 (a) 2005 (e) 2006 (e) 2007 (e) 2008 (e) 2009 (e) 2010 (e)Declared profit 25.5 24.4 11.0 9.8 18.0 16.6 20.7 24.1 26.3 28.4 30.4 Group share 25.2 24.0 10.8 9.5 17.5 16.4 20.5 23.9 26.1 28.2 30.2
Minorities 0.3 0.3 0.2 0.3 0.5 0.2 0.2 0.2 0.2 0.2 0.2 Depreciation and amortization 13.0 18.2 19.3 26.1 24.5 24.2 21.6 19.9 19.7 19.5 19.2 EBITDA - EBITA 12.4 17.1 18.2 24.7 23.0 22.8 20.2 18.5 18.3 18.0 17.7
Goodwill amortization 0.6 1.1 1.1 1.4 1.5 1.5 1.5 1.5 1.5 1.5 1.5
Other items - - - - - - - - - - - Working capital requirement (30.6) (7.6) (19.7) (16.1) (2.7) (5.6) (0.3) (0.2) (4.3) (4.4) (4.5) Balance sheet observed change (30.6) (7.8) (19.9) (15.6) (1.4) (3.0) 1.2 1.0 (3.6) (3.7) (3.8) Other items - 0.2 0.2 (0.5) (1.3) (2.7) (1.4) (1.2) (0.8) (0.7) (0.7)
Other items and adjustments (14.3) (11.8) 3.0 (0.8) (14.1) - - - - - - Cashflow from operating activities (6.4) 23.2 13.6 19.0 25.7 35.2 42.1 43.8 41.7 43.5 45.1 Capex (31.1) (38.2) (34.4) (12.0) (15.0) (15.0) (15.5) (15.9) (16.4) (16.9) (17.4) % of sales -16.2% -16.9% -14.5% -4.5% -5.2% -4.9% -4.9% -4.9% -4.9% -4.9% -4.9%
Aquisitions net of divestments (11.2) (2.4) 0.9 (3.6) 0.4 - - - - - - Aquisitions (11.7) (3.0) (0.4) (5.0) 0.4 - - - - - - Divestments 0.5 0.7 1.3 1.4 - - - - - - -
Other items and adjustments 2.3 3.1 3.3 (26.2) (19.4) - - - - - - Other items observed in balance sheet 2.9 1.7 32.5 24.1 - - - - - - adjustments 2.3 0.2 1.6 (58.7) (43.5) - - - - - -
Cashflow from investing activities (40.0) (37.4) (30.3) (41.8) (34.0) (15.0) (15.5) (15.9) (16.4) (16.9) (17.4) Capital increases - - - - - - - - - - - Dividends and directors fees (2.6) (3.1) (3.9) (4.3) (4.7) (3.6) (6.3) (7.7) (8.9) (9.7) (10.4) Dividends paid to shareholders (1.9) (2.6) (3.0) (3.4) (3.6) (6.3) (7.7) (8.9) (9.7) (10.4) Dividends paid to minorities 0.1 0.0 0.1 (0.0) - - - - - - Other items (1.2) (1.3) (1.4) (1.3) - - - - - -
Financial debt movements 14.8 14.8 19.5 27.3 21.7 (16.6) (20.4) (20.2) (16.5) (16.9) (17.3) Observed financial debt movement 14.8 19.5 27.3 21.7 (16.6) (20.4) (20.2) (16.5) (16.9) (17.3) Other items 14.8 0.0 0.0 (0.0) (0.0) - - - - - -
Other items and adjustments 37.1 2.9 0.1 0.2 (3.1) - - - - - - Cashflow from financing activities 49.3 14.6 15.7 23.2 13.9 (20.2) (26.6) (27.9) (25.4) (26.6) (27.7) Cash variation 2.8 0.4 (1.0) 0.4 5.5 - - - - - - Observed cash variation 0.4 (1.0) 0.4 5.5 - - - - - -
3. Financial Modelling:e. P&L, balance sheet & cashflow statement (17/31)
|93
From Business Planning to Financial Modelling and Valuation
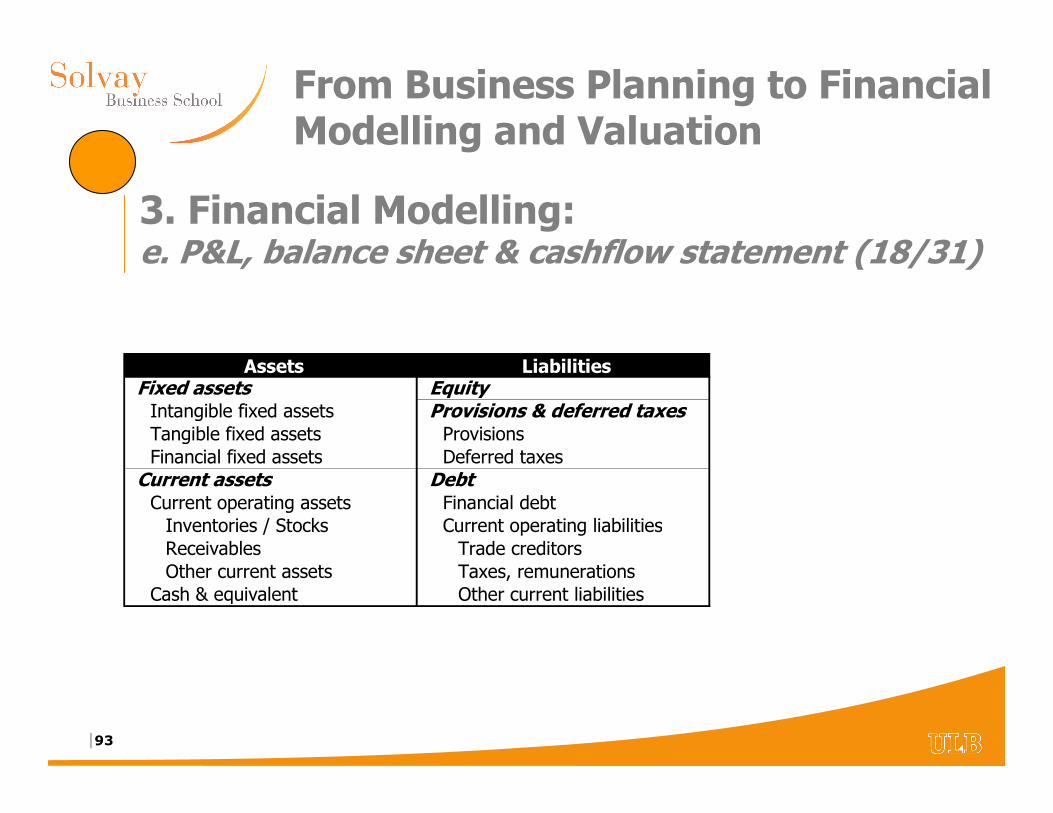
Assets Liabilities Fixed assets EquityIntangible fixed assets Provisions & deferred taxesTangible fixed assets ProvisionsFinancial fixed assets Deferred taxes
Current assets DebtCurrent operating assets Financial debtInventories / Stocks Current operating liabilitiesReceivables Trade creditorsOther current assets Taxes, remunerations
Cash & equivalent Other current liabilities
3. Financial Modelling:e. P&L, balance sheet & cashflow statement (18/31)
|94
From Business Planning to Financial Modelling and Valuation
• Intangible assets– Brands or goodwill
– Goodwill = Amount paid in excess of book value for previous acquisitions
– Under IFRS, no need to amortize the goodwill if it is still justified (cf.test)
• Tangible assets– Building, land and equipments
• Financial assets– Subsidiaries accounted under the Equity Method
– Investments
3. Financial Modelling:e. P&L, balance sheet & cashflow statement (19/31)
|95
From Business Planning to Financial Modelling and Valuation
• Other current assets– Prepaid expenses, accrued assets, etc
• Cash & equivalents– Includes cash, marketable securities and short-term investments
– For valuation purposes, it is interesting to split the real cash (excess cash) and the cash necessary for continuing operations (working capital nature)
3. Financial Modelling:e. P&L, balance sheet & cashflow statement (20/31)
|96
From Business Planning to Financial Modelling and Valuation
• Equity– Need to split ‘Group share equity’ and ‘Minority interests’
– Need to adjust equity to exclude grants
– Primarly based on common shares outstanding, but also includes other equity-linked products (cf. preferred shares, stock options, warrants, convertible bonds, …)
– Minority interests = Amount of subsidiaries’ equity owned by party other than the Company
• Provisions and deferred taxes– Short term vs. long term provisions
– Deferred taxes = due to the timing difference between income taxes accrued for financial reporting purposes and the actual cash income taxes paid
3. Financial Modelling:e. P&L, balance sheet & cashflow statement (21/31)
|97
From Business Planning to Financial Modelling and Valuation
Assets Liabilities Fixed assets EquityIntangible fixed assets Provisions & deferred taxesTangible fixed assets ProvisionsFinancial fixed assets Deferred taxes
Current assets DebtCurrent operating assets Financial debtInventories / Stocks Current operating liabilitiesReceivables Trade creditorsOther current assets Taxes, remunerations
Cash & equivalent Other current liabilities
Working capital (WC)Net current operating assets - Net current operating liabilities
Net financial debt (NFD)Financial debt – Cash & equivalent
3. Financial Modelling:e. P&L, balance sheet & cashflow statement (22/31)
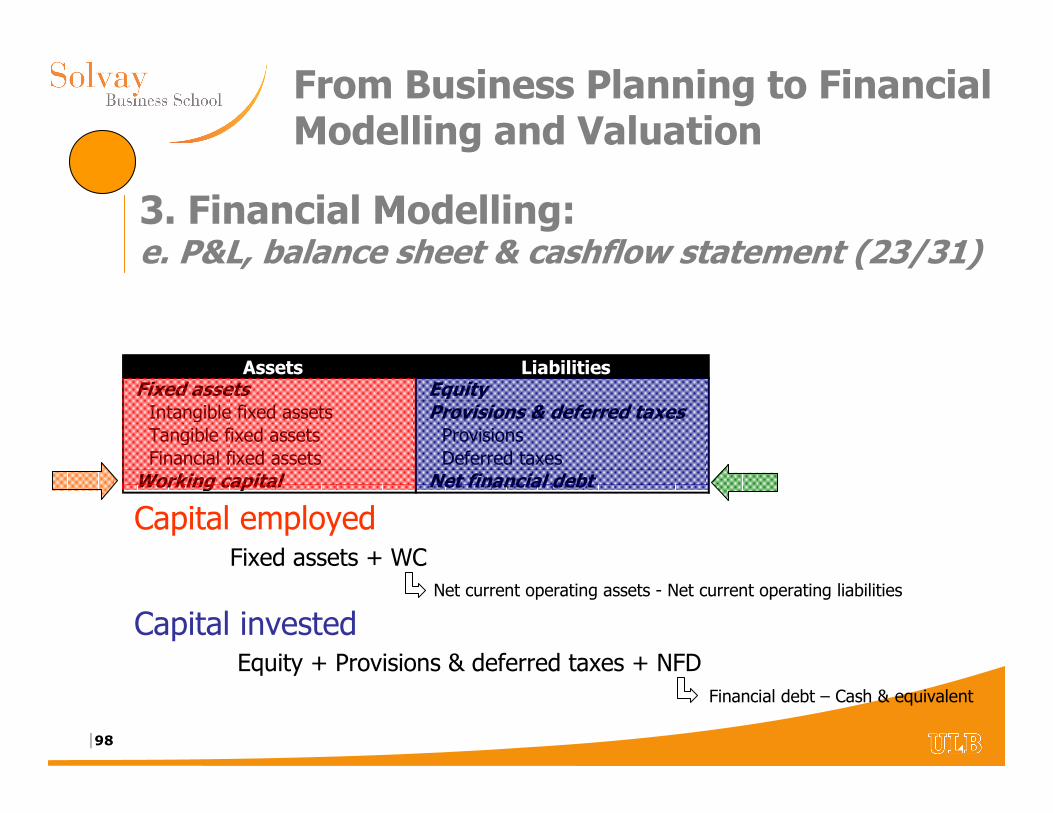
|98
From Business Planning to Financial Modelling and Valuation
Assets Liabilities Fixed assets EquityIntangible fixed assets Provisions & deferred taxesTangible fixed assets ProvisionsFinancial fixed assets Deferred taxes
Working capital Net financial debt
Capital employedFixed assets + WC
Capital investedEquity + Provisions & deferred taxes + NFD
3. Financial Modelling:e. P&L, balance sheet & cashflow statement (23/31)
Net current operating assets - Net current operating liabilities
Financial debt – Cash & equivalent
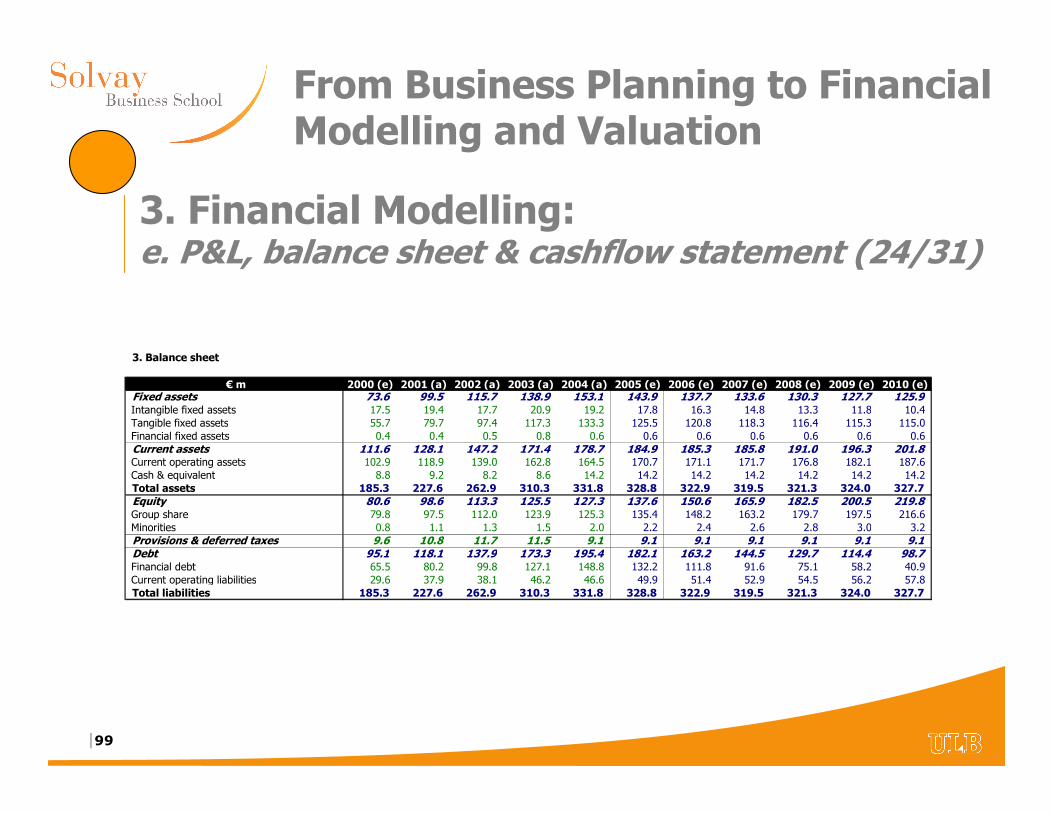
|99
From Business Planning to Financial Modelling and Valuation
3. Balance sheet
€ m 2000 (e) 2001 (a) 2002 (a) 2003 (a) 2004 (a) 2005 (e) 2006 (e) 2007 (e) 2008 (e) 2009 (e) 2010 (e)Fixed assets 73.6 99.5 115.7 138.9 153.1 143.9 137.7 133.6 130.3 127.7 125.9 Intangible fixed assets 17.5 19.4 17.7 20.9 19.2 17.8 16.3 14.8 13.3 11.8 10.4 Tangible fixed assets 55.7 79.7 97.4 117.3 133.3 125.5 120.8 118.3 116.4 115.3 115.0 Financial fixed assets 0.4 0.4 0.5 0.8 0.6 0.6 0.6 0.6 0.6 0.6 0.6 Current assets 111.6 128.1 147.2 171.4 178.7 184.9 185.3 185.8 191.0 196.3 201.8 Current operating assets 102.9 118.9 139.0 162.8 164.5 170.7 171.1 171.7 176.8 182.1 187.6 Cash & equivalent 8.8 9.2 8.2 8.6 14.2 14.2 14.2 14.2 14.2 14.2 14.2 Total assets 185.3 227.6 262.9 310.3 331.8 328.8 322.9 319.5 321.3 324.0 327.7 Equity 80.6 98.6 113.3 125.5 127.3 137.6 150.6 165.9 182.5 200.5 219.8 Group share 79.8 97.5 112.0 123.9 125.3 135.4 148.2 163.2 179.7 197.5 216.6 Minorities 0.8 1.1 1.3 1.5 2.0 2.2 2.4 2.6 2.8 3.0 3.2 Provisions & deferred taxes 9.6 10.8 11.7 11.5 9.1 9.1 9.1 9.1 9.1 9.1 9.1 Debt 95.1 118.1 137.9 173.3 195.4 182.1 163.2 144.5 129.7 114.4 98.7 Financial debt 65.5 80.2 99.8 127.1 148.8 132.2 111.8 91.6 75.1 58.2 40.9 Current operating liabilities 29.6 37.9 38.1 46.2 46.6 49.9 51.4 52.9 54.5 56.2 57.8 Total liabilities 185.3 227.6 262.9 310.3 331.8 328.8 322.9 319.5 321.3 324.0 327.7
3. Financial Modelling:e. P&L, balance sheet & cashflow statement (24/31)
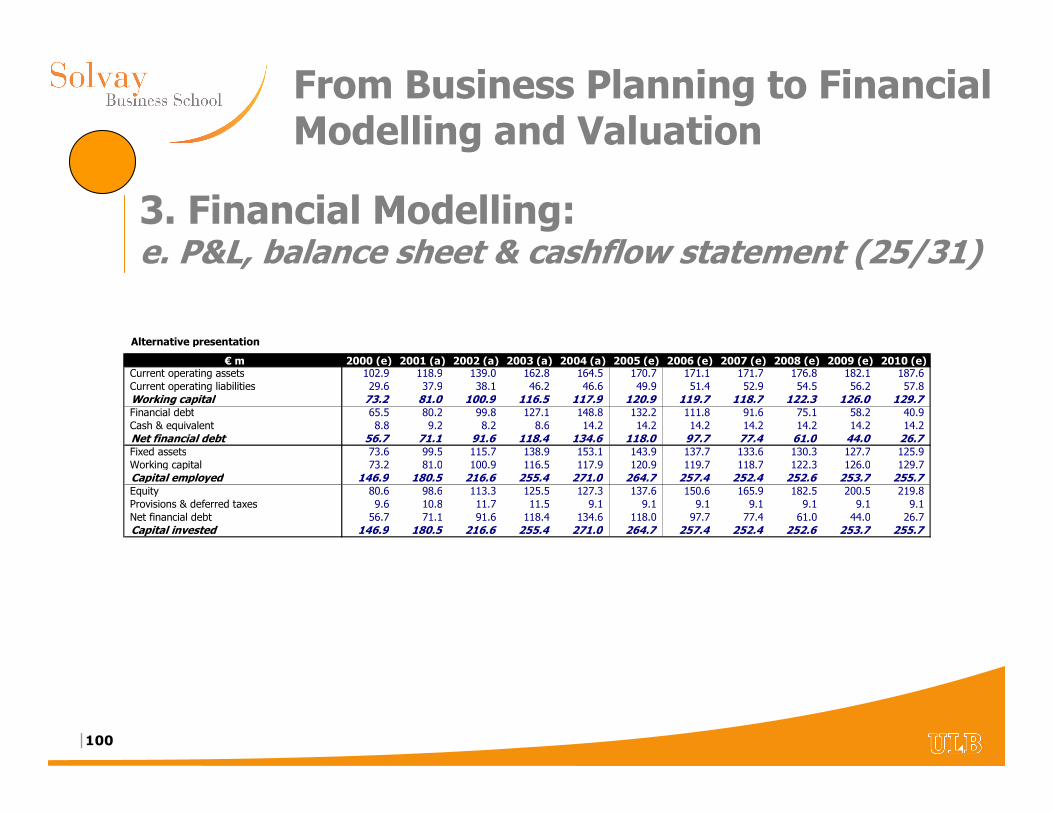
|100
From Business Planning to Financial Modelling and Valuation
Alternative presentation
€ m 2000 (e) 2001 (a) 2002 (a) 2003 (a) 2004 (a) 2005 (e) 2006 (e) 2007 (e) 2008 (e) 2009 (e) 2010 (e)Current operating assets 102.9 118.9 139.0 162.8 164.5 170.7 171.1 171.7 176.8 182.1 187.6 Current operating liabilities 29.6 37.9 38.1 46.2 46.6 49.9 51.4 52.9 54.5 56.2 57.8 Working capital 73.2 81.0 100.9 116.5 117.9 120.9 119.7 118.7 122.3 126.0 129.7 Financial debt 65.5 80.2 99.8 127.1 148.8 132.2 111.8 91.6 75.1 58.2 40.9 Cash & equivalent 8.8 9.2 8.2 8.6 14.2 14.2 14.2 14.2 14.2 14.2 14.2 Net financial debt 56.7 71.1 91.6 118.4 134.6 118.0 97.7 77.4 61.0 44.0 26.7 Fixed assets 73.6 99.5 115.7 138.9 153.1 143.9 137.7 133.6 130.3 127.7 125.9 Working capital 73.2 81.0 100.9 116.5 117.9 120.9 119.7 118.7 122.3 126.0 129.7 Capital employed 146.9 180.5 216.6 255.4 271.0 264.7 257.4 252.4 252.6 253.7 255.7 Equity 80.6 98.6 113.3 125.5 127.3 137.6 150.6 165.9 182.5 200.5 219.8 Provisions & deferred taxes 9.6 10.8 11.7 11.5 9.1 9.1 9.1 9.1 9.1 9.1 9.1 Net financial debt 56.7 71.1 91.6 118.4 134.6 118.0 97.7 77.4 61.0 44.0 26.7 Capital invested 146.9 180.5 216.6 255.4 271.0 264.7 257.4 252.4 252.6 253.7 255.7
3. Financial Modelling:e. P&L, balance sheet & cashflow statement (25/31)
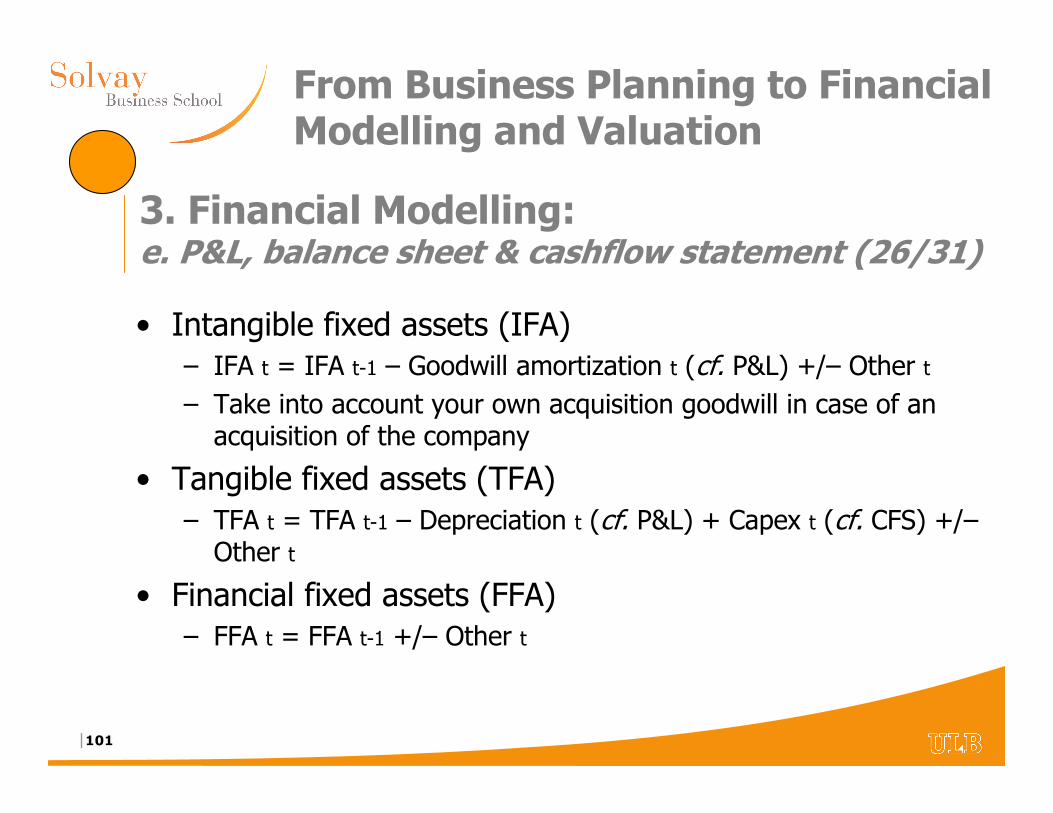
|101
From Business Planning to Financial Modelling and Valuation
• Intangible fixed assets (IFA)– IFA t = IFA t-1 – Goodwill amortization t (cf. P&L) +/– Other t
– Take into account your own acquisition goodwill in case of an acquisition of the company
• Tangible fixed assets (TFA)– TFA t = TFA t-1 – Depreciation t (cf. P&L) + Capex t (cf. CFS) +/–
Other t
• Financial fixed assets (FFA)– FFA t = FFA t-1 +/– Other t
3. Financial Modelling:e. P&L, balance sheet & cashflow statement (26/31)
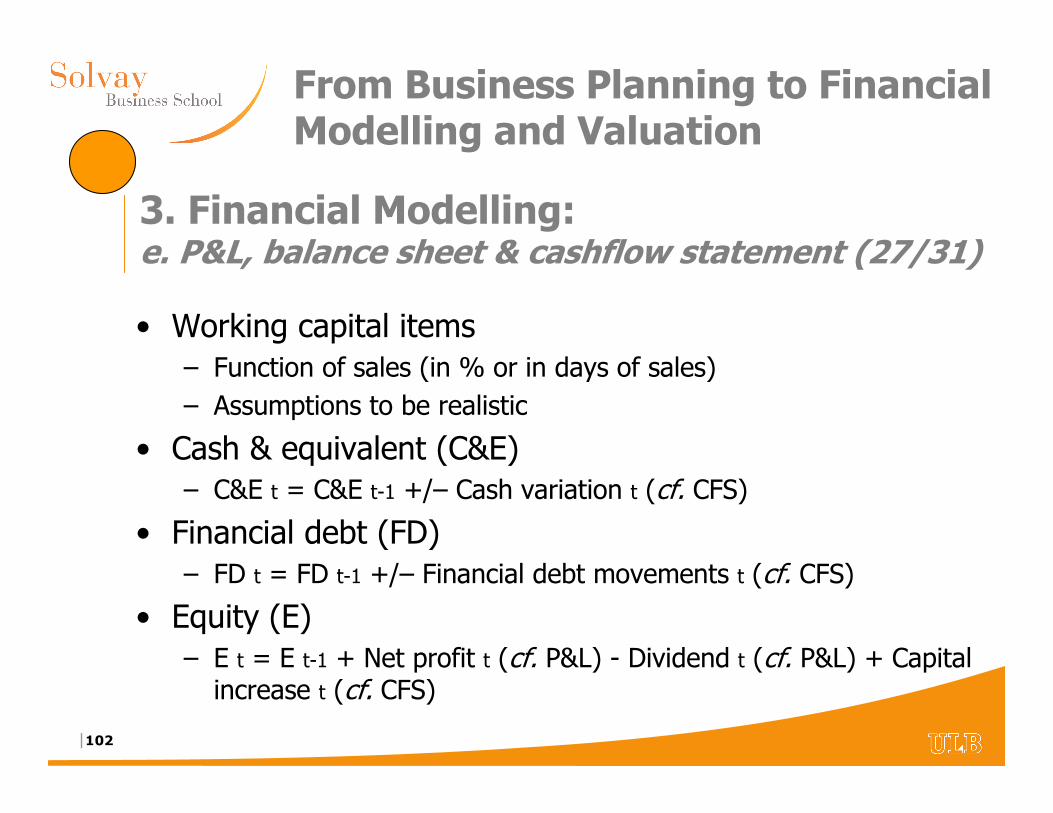
|102
From Business Planning to Financial Modelling and Valuation
• Working capital items– Function of sales (in % or in days of sales)
– Assumptions to be realistic
• Cash & equivalent (C&E)– C&E t = C&E t-1 +/– Cash variation t (cf. CFS)
• Financial debt (FD)– FD t = FD t-1 +/– Financial debt movements t (cf. CFS)
• Equity (E)– E t = E t-1 + Net profit t (cf. P&L) - Dividend t (cf. P&L) + Capital
increase t (cf. CFS)
3. Financial Modelling:e. P&L, balance sheet & cashflow statement (27/31)
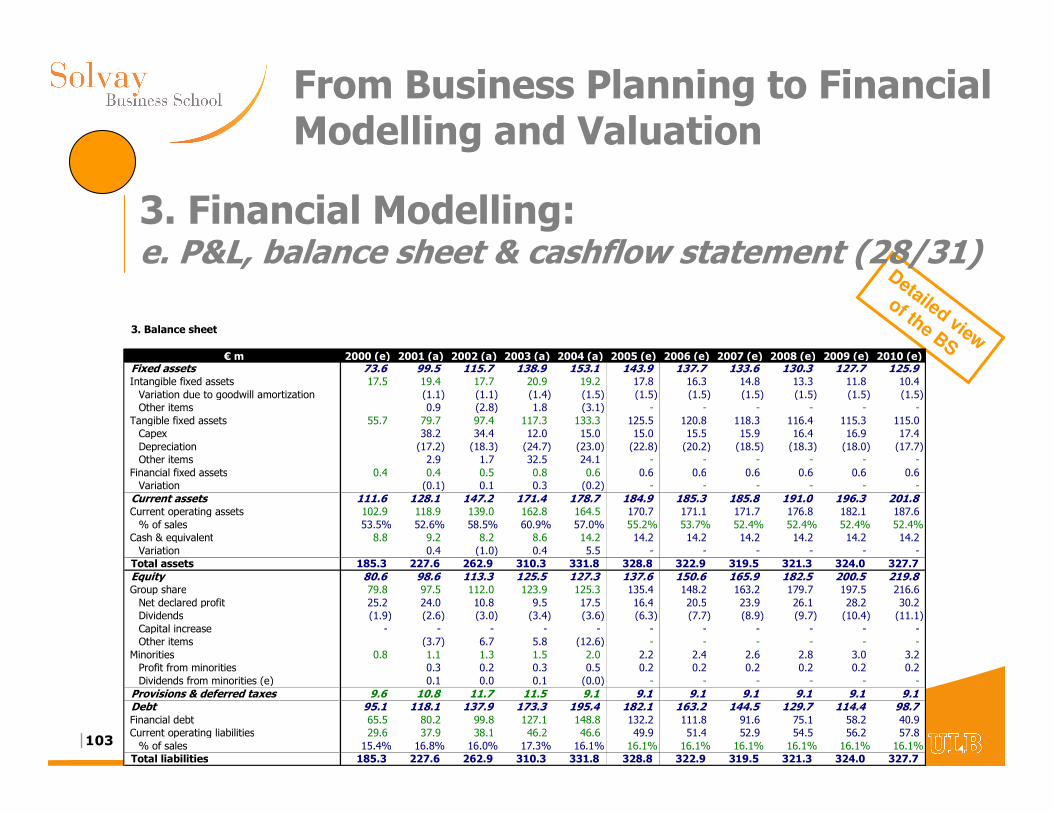
|103
From Business Planning to Financial Modelling and Valuation
Detailed view
of the BS3. Balance sheet
€ m 2000 (e) 2001 (a) 2002 (a) 2003 (a) 2004 (a) 2005 (e) 2006 (e) 2007 (e) 2008 (e) 2009 (e) 2010 (e)Fixed assets 73.6 99.5 115.7 138.9 153.1 143.9 137.7 133.6 130.3 127.7 125.9 Intangible fixed assets 17.5 19.4 17.7 20.9 19.2 17.8 16.3 14.8 13.3 11.8 10.4 Variation due to goodwill amortization (1.1) (1.1) (1.4) (1.5) (1.5) (1.5) (1.5) (1.5) (1.5) (1.5) Other items 0.9 (2.8) 1.8 (3.1) - - - - - -
Tangible fixed assets 55.7 79.7 97.4 117.3 133.3 125.5 120.8 118.3 116.4 115.3 115.0 Capex 38.2 34.4 12.0 15.0 15.0 15.5 15.9 16.4 16.9 17.4 Depreciation (17.2) (18.3) (24.7) (23.0) (22.8) (20.2) (18.5) (18.3) (18.0) (17.7) Other items 2.9 1.7 32.5 24.1 - - - - - -
Financial fixed assets 0.4 0.4 0.5 0.8 0.6 0.6 0.6 0.6 0.6 0.6 0.6 Variation (0.1) 0.1 0.3 (0.2) - - - - - -
Current assets 111.6 128.1 147.2 171.4 178.7 184.9 185.3 185.8 191.0 196.3 201.8 Current operating assets 102.9 118.9 139.0 162.8 164.5 170.7 171.1 171.7 176.8 182.1 187.6 % of sales 53.5% 52.6% 58.5% 60.9% 57.0% 55.2% 53.7% 52.4% 52.4% 52.4% 52.4%
Cash & equivalent 8.8 9.2 8.2 8.6 14.2 14.2 14.2 14.2 14.2 14.2 14.2 Variation 0.4 (1.0) 0.4 5.5 - - - - - -
Total assets 185.3 227.6 262.9 310.3 331.8 328.8 322.9 319.5 321.3 324.0 327.7 Equity 80.6 98.6 113.3 125.5 127.3 137.6 150.6 165.9 182.5 200.5 219.8 Group share 79.8 97.5 112.0 123.9 125.3 135.4 148.2 163.2 179.7 197.5 216.6 Net declared profit 25.2 24.0 10.8 9.5 17.5 16.4 20.5 23.9 26.1 28.2 30.2 Dividends (1.9) (2.6) (3.0) (3.4) (3.6) (6.3) (7.7) (8.9) (9.7) (10.4) (11.1) Capital increase - - - - - - - - - - - Other items (3.7) 6.7 5.8 (12.6) - - - - - -
Minorities 0.8 1.1 1.3 1.5 2.0 2.2 2.4 2.6 2.8 3.0 3.2 Profit from minorities 0.3 0.2 0.3 0.5 0.2 0.2 0.2 0.2 0.2 0.2 Dividends from minorities (e) 0.1 0.0 0.1 (0.0) - - - - - -
Provisions & deferred taxes 9.6 10.8 11.7 11.5 9.1 9.1 9.1 9.1 9.1 9.1 9.1 Debt 95.1 118.1 137.9 173.3 195.4 182.1 163.2 144.5 129.7 114.4 98.7 Financial debt 65.5 80.2 99.8 127.1 148.8 132.2 111.8 91.6 75.1 58.2 40.9 Current operating liabilities 29.6 37.9 38.1 46.2 46.6 49.9 51.4 52.9 54.5 56.2 57.8 % of sales 15.4% 16.8% 16.0% 17.3% 16.1% 16.1% 16.1% 16.1% 16.1% 16.1% 16.1%
Total liabilities 185.3 227.6 262.9 310.3 331.8 328.8 322.9 319.5 321.3 324.0 327.7
3. Financial Modelling:e. P&L, balance sheet & cashflow statement (28/31)
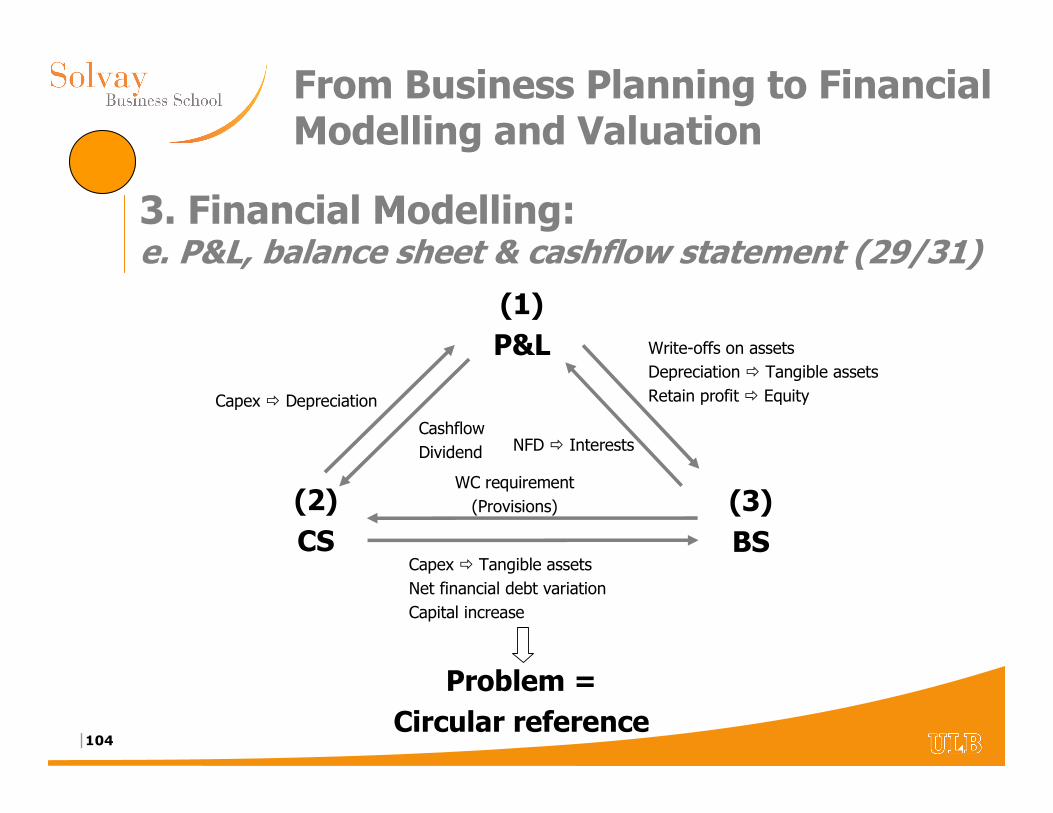
|104
From Business Planning to Financial Modelling and Valuation
(1)P&L
(2)CS
(3)BS
Cashflow
Dividend
WC requirement
(Provisions)
Capex � Tangible assets
Net financial debt variation
Capital increase
Capex � Depreciation
Write-offs on assets
Depreciation � Tangible assets
Retain profit � Equity
NFD � Interests
Problem = Circular reference
3. Financial Modelling:e. P&L, balance sheet & cashflow statement (29/31)
|105
From Business Planning to Financial Modelling and Valuation
• Two technical solutions
• Let a circular reference in your model– Simple solution (cf. automatic adjustment by Excel)
– Dangerous solution (cf. Excel may be affected)
– No indication if other circular references are introduced in themodel
• Isolation of the circular reference at the level of ‘Interests on financial debt’ through an appropriate table– Adjustment needed if any modification in the model (cf. more
work)
– But it permits to see the impact of those changes
3. Financial Modelling:e. P&L, balance sheet & cashflow statement (30/31)
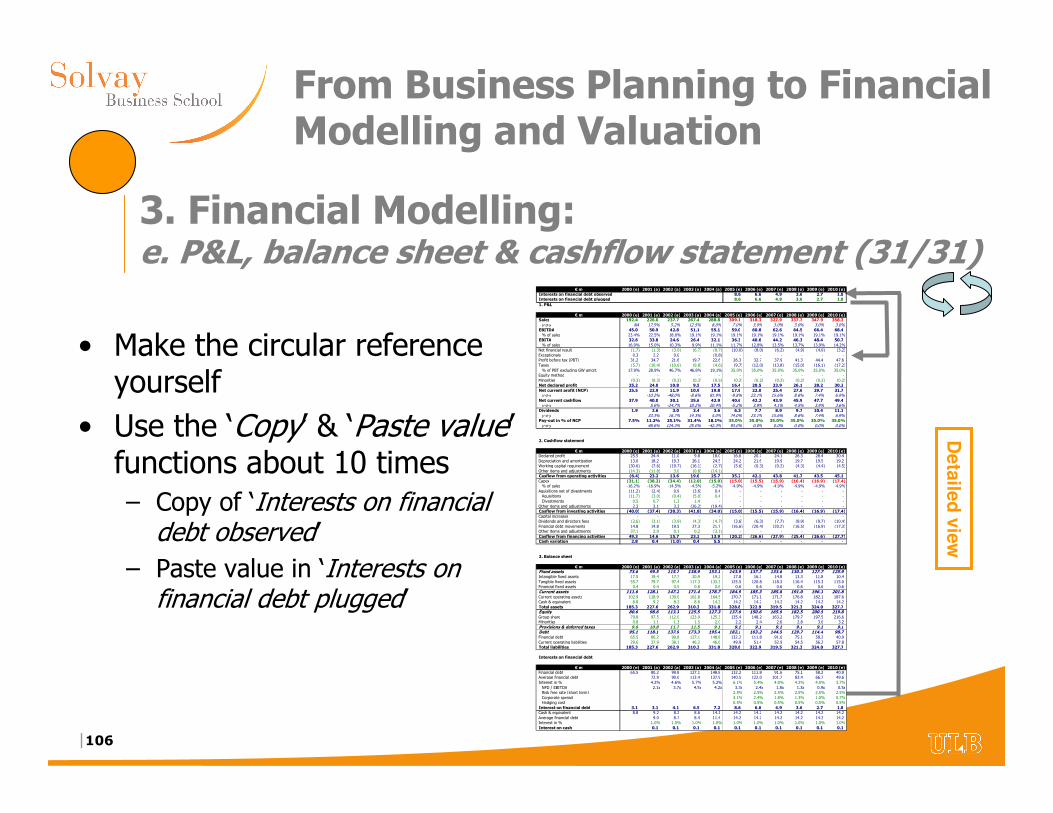
|106
From Business Planning to Financial Modelling and Valuation
• Make the circular reference yourself
• Use the ‘Copy’ & ‘Paste value’ functions about 10 times– Copy of ‘Interests on financial
debt observed’
– Paste value in ‘Interests on financial debt plugged’
Deta
iled
vie
w
€ m 2000 (e) 2001 (a) 2002 (a) 2003 (a) 2004 (a) 2005 (e) 2006 (e) 2007 (e) 2008 (e) 2009 (e) 2010 (e)Interests on financial debt observed 8.6 6.6 4.9 3.6 2.7 1.8 Interests on financial debt plugged 8.6 6.6 4.9 3.6 2.7 1.8 1. P&L
€ m 2000 (e) 2001 (a) 2002 (a) 2003 (a) 2004 (a) 2005 (e) 2006 (e) 2007 (e) 2008 (e) 2009 (e) 2010 (e)Sales 192.4 226.0 237.7 267.4 288.8 309.1 318.3 327.9 337.7 347.9 358.3 y-o-y NA 17.5% 5.2% 12.5% 8.0% 7.0% 3.0% 3.0% 3.0% 3.0% 3.0%
EBITDA 45.0 50.9 42.8 51.1 55.1 59.0 60.8 62.6 64.5 66.4 68.4 % of sales 23.4% 22.5% 18.0% 19.1% 19.1% 19.1% 19.1% 19.1% 19.1% 19.1% 19.1%
EBITA 32.6 33.8 24.6 26.4 32.1 36.3 40.6 44.2 46.3 48.4 50.7 % of sales 16.9% 15.0% 10.3% 9.9% 11.1% 11.7% 12.8% 13.5% 13.7% 13.9% 14.2%
Net financial result (1.7) (1.3) (3.0) (6.7) (8.7) (10.0) (8.0) (6.2) (4.9) (4.0) (3.2) Exceptionals 0.3 2.2 0.0 - (0.8) - - - - - - Profit before tax (PBT) 31.2 34.7 21.6 19.7 22.6 26.3 32.7 37.9 41.3 44.4 47.6 Taxes (5.7) (10.4) (10.6) (9.8) (4.6) (9.7) (12.0) (13.8) (15.0) (16.1) (17.2) % of PBT excluding GW amort. 17.9% 28.9% 46.7% 46.8% 19.1% 35.0% 35.0% 35.0% 35.0% 35.0% 35.0%
Equity method - - - - - - - - - - - Minorities (0.3) (0.3) (0.2) (0.3) (0.5) (0.2) (0.2) (0.2) (0.2) (0.2) (0.2) Net declared profit 25.2 24.0 10.8 9.5 17.5 16.4 20.5 23.9 26.1 28.2 30.2 Net current profit (NCP) 25.5 22.9 11.9 10.9 19.8 17.9 22.0 25.4 27.6 29.7 31.7 y-o-y -10.2% -48.0% -8.6% 81.9% -9.8% 23.1% 15.6% 8.6% 7.4% 6.9%
Net current cashflow 37.9 40.0 30.1 35.6 42.9 40.6 42.2 43.9 45.9 47.7 49.4 y-o-y 5.6% -24.7% 18.2% 20.4% -5.2% 3.8% 4.1% 4.5% 3.9% 3.6%
Dividends 1.9 2.6 3.0 3.4 3.6 6.3 7.7 8.9 9.7 10.4 11.1 y-o-y 33.3% 16.7% 14.3% 5.0% 74.0% 23.1% 15.6% 8.6% 7.4% 6.9%
Pay-out in % of NCP 7.5% 11.2% 25.1% 31.4% 18.1% 35.0% 35.0% 35.0% 35.0% 35.0% 35.0%y-o-y 48.6% 124.3% 25.0% -42.3% 93.0% 0.0% 0.0% 0.0% 0.0% 0.0%
2. Cashflow statement
€ m 2000 (e) 2001 (a) 2002 (a) 2003 (a) 2004 (a) 2005 (e) 2006 (e) 2007 (e) 2008 (e) 2009 (e) 2010 (e)Declared profit 25.5 24.4 11.0 9.8 18.0 16.6 20.7 24.1 26.3 28.4 30.4 Depreciation and amortization 13.0 18.2 19.3 26.1 24.5 24.2 21.6 19.9 19.7 19.5 19.2 Working capital requirement (30.6) (7.6) (19.7) (16.1) (2.7) (5.6) (0.3) (0.2) (4.3) (4.4) (4.5) Other items and adjustments (14.3) (11.8) 3.0 (0.8) (14.1) - - - - - - Casflow from operating activities (6.4) 23.2 13.6 19.0 25.7 35.2 42.1 43.8 41.7 43.5 45.1 Capex (31.1) (38.2) (34.4) (12.0) (15.0) (15.0) (15.5) (15.9) (16.4) (16.9) (17.4) % of sales -16.2% -16.9% -14.5% -4.5% -5.2% -4.9% -4.9% -4.9% -4.9% -4.9% -4.9%
Aquisitions net of divestments (11.2) (2.4) 0.9 (3.6) 0.4 - - - - - - Aquisitions (11.7) (3.0) (0.4) (5.0) 0.4 - - - - - - Divestments 0.5 0.7 1.3 1.4 - - - - - - -
Other items and adjustments 2.3 3.1 3.3 (26.2) (19.4) - - - - - - Casflow from investing activities (40.0) (37.4) (30.3) (41.8) (34.0) (15.0) (15.5) (15.9) (16.4) (16.9) (17.4) Capital increases - - - - - - - - - - - Dividends and directors fees (2.6) (3.1) (3.9) (4.3) (4.7) (3.6) (6.3) (7.7) (8.9) (9.7) (10.4) Financial debt movements 14.8 14.8 19.5 27.3 21.7 (16.6) (20.4) (20.2) (16.5) (16.9) (17.3) Other items and adjustments 37.1 2.9 0.1 0.2 (3.1) - - - - - - Casflow from financing activities 49.3 14.6 15.7 23.2 13.9 (20.2) (26.6) (27.9) (25.4) (26.6) (27.7) Cash variation 2.8 0.4 (1.0) 0.4 5.5 - - - - - -
3. Balance sheet
€ m 2000 (e) 2001 (a) 2002 (a) 2003 (a) 2004 (a) 2005 (e) 2006 (e) 2007 (e) 2008 (e) 2009 (e) 2010 (e)Fixed assets 73.6 99.5 115.7 138.9 153.1 143.9 137.7 133.6 130.3 127.7 125.9 Intangible fixed assets 17.5 19.4 17.7 20.9 19.2 17.8 16.3 14.8 13.3 11.8 10.4 Tangible fixed assets 55.7 79.7 97.4 117.3 133.3 125.5 120.8 118.3 116.4 115.3 115.0 Financial fixed assets 0.4 0.4 0.5 0.8 0.6 0.6 0.6 0.6 0.6 0.6 0.6 Current assets 111.6 128.1 147.2 171.4 178.7 184.9 185.3 185.8 191.0 196.3 201.8 Current operating assets 102.9 118.9 139.0 162.8 164.5 170.7 171.1 171.7 176.8 182.1 187.6 Cash & equivalent 8.8 9.2 8.2 8.6 14.2 14.2 14.2 14.2 14.2 14.2 14.2 Total assets 185.3 227.6 262.9 310.3 331.8 328.8 322.9 319.5 321.3 324.0 327.7 Equity 80.6 98.6 113.3 125.5 127.3 137.6 150.6 165.9 182.5 200.5 219.8 Group share 79.8 97.5 112.0 123.9 125.3 135.4 148.2 163.2 179.7 197.5 216.6 Minorities 0.8 1.1 1.3 1.5 2.0 2.2 2.4 2.6 2.8 3.0 3.2 Provisions & deferred taxes 9.6 10.8 11.7 11.5 9.1 9.1 9.1 9.1 9.1 9.1 9.1 Debt 95.1 118.1 137.9 173.3 195.4 182.1 163.2 144.5 129.7 114.4 98.7 Financial debt 65.5 80.2 99.8 127.1 148.8 132.2 111.8 91.6 75.1 58.2 40.9 Current operating liabilities 29.6 37.9 38.1 46.2 46.6 49.9 51.4 52.9 54.5 56.2 57.8 Total liabilities 185.3 227.6 262.9 310.3 331.8 328.8 322.9 319.5 321.3 324.0 327.7
Interests on financial debt
€ m 2000 (e) 2001 (a) 2002 (a) 2003 (a) 2004 (a) 2005 (e) 2006 (e) 2007 (e) 2008 (e) 2009 (e) 2010 (e)Financial debt 65.5 80.2 99.8 127.1 148.8 132.2 111.8 91.6 75.1 58.2 40.9 Average financial debt 72.9 90.0 113.4 137.9 140.5 122.0 101.7 83.4 66.7 49.6 Interest in % 4.2% 4.6% 5.7% 5.2% 6.1% 5.4% 4.8% 4.3% 4.0% 3.7%NFD / EBITDA 2.1x 3.7x 4.5x 4.2x 3.3x 2.4x 1.8x 1.3x 0.9x 0.5xRisk free rate (short term) 2.5% 2.5% 2.5% 2.5% 2.5% 2.5%Corporate spread 3.1% 2.4% 1.8% 1.3% 1.0% 0.7%Hedging cost 0.5% 0.5% 0.5% 0.5% 0.5% 0.5%
Interest on financial debt 3.1 3.1 4.1 6.5 7.2 8.6 6.6 4.9 3.6 2.7 1.8 Cash & equivalent 8.8 9.2 8.2 8.6 14.2 14.2 14.2 14.2 14.2 14.2 14.2 Average financial debt 9.0 8.7 8.4 11.4 14.2 14.2 14.2 14.2 14.2 14.2 Interest in % 1.0% 1.0% 1.0% 1.0% 1.0% 1.0% 1.0% 1.0% 1.0% 1.0%Interest on cash 0.1 0.1 0.1 0.1 0.1 0.1 0.1 0.1 0.1 0.1
3. Financial Modelling:e. P&L, balance sheet & cashflow statement (31/31)
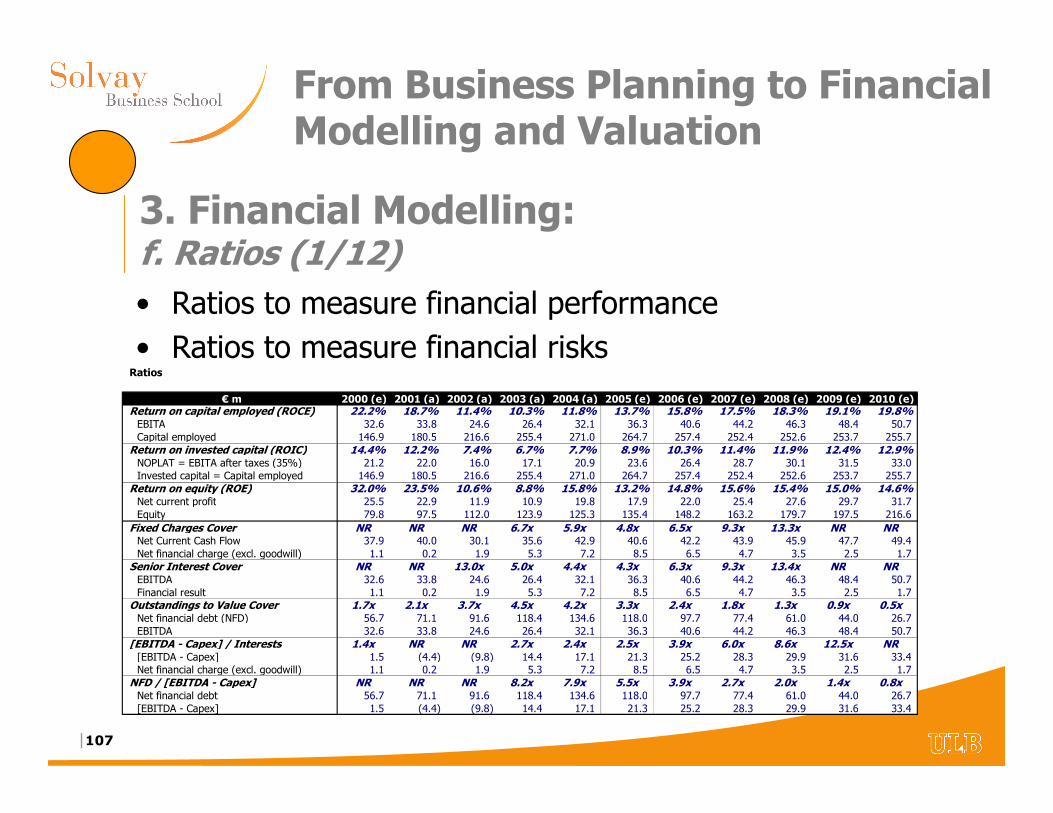
|107
From Business Planning to Financial Modelling and Valuation
• Ratios to measure financial performance
• Ratios to measure financial risksRatios
€ m 2000 (e) 2001 (a) 2002 (a) 2003 (a) 2004 (a) 2005 (e) 2006 (e) 2007 (e) 2008 (e) 2009 (e) 2010 (e)Return on capital employed (ROCE) 22.2% 18.7% 11.4% 10.3% 11.8% 13.7% 15.8% 17.5% 18.3% 19.1% 19.8%EBITA 32.6 33.8 24.6 26.4 32.1 36.3 40.6 44.2 46.3 48.4 50.7 Capital employed 146.9 180.5 216.6 255.4 271.0 264.7 257.4 252.4 252.6 253.7 255.7
Return on invested capital (ROIC) 14.4% 12.2% 7.4% 6.7% 7.7% 8.9% 10.3% 11.4% 11.9% 12.4% 12.9%NOPLAT = EBITA after taxes (35%) 21.2 22.0 16.0 17.1 20.9 23.6 26.4 28.7 30.1 31.5 33.0 Invested capital = Capital employed 146.9 180.5 216.6 255.4 271.0 264.7 257.4 252.4 252.6 253.7 255.7
Return on equity (ROE) 32.0% 23.5% 10.6% 8.8% 15.8% 13.2% 14.8% 15.6% 15.4% 15.0% 14.6%Net current profit 25.5 22.9 11.9 10.9 19.8 17.9 22.0 25.4 27.6 29.7 31.7 Equity 79.8 97.5 112.0 123.9 125.3 135.4 148.2 163.2 179.7 197.5 216.6
Fixed Charges Cover NR NR NR 6.7x 5.9x 4.8x 6.5x 9.3x 13.3x NR NRNet Current Cash Flow 37.9 40.0 30.1 35.6 42.9 40.6 42.2 43.9 45.9 47.7 49.4 Net financial charge (excl. goodwill) 1.1 0.2 1.9 5.3 7.2 8.5 6.5 4.7 3.5 2.5 1.7
Senior Interest Cover NR NR 13.0x 5.0x 4.4x 4.3x 6.3x 9.3x 13.4x NR NREBITDA 32.6 33.8 24.6 26.4 32.1 36.3 40.6 44.2 46.3 48.4 50.7 Financial result 1.1 0.2 1.9 5.3 7.2 8.5 6.5 4.7 3.5 2.5 1.7
Outstandings to Value Cover 1.7x 2.1x 3.7x 4.5x 4.2x 3.3x 2.4x 1.8x 1.3x 0.9x 0.5xNet financial debt (NFD) 56.7 71.1 91.6 118.4 134.6 118.0 97.7 77.4 61.0 44.0 26.7 EBITDA 32.6 33.8 24.6 26.4 32.1 36.3 40.6 44.2 46.3 48.4 50.7
[EBITDA - Capex] / Interests 1.4x NR NR 2.7x 2.4x 2.5x 3.9x 6.0x 8.6x 12.5x NR[EBITDA - Capex] 1.5 (4.4) (9.8) 14.4 17.1 21.3 25.2 28.3 29.9 31.6 33.4 Net financial charge (excl. goodwill) 1.1 0.2 1.9 5.3 7.2 8.5 6.5 4.7 3.5 2.5 1.7
NFD / [EBITDA - Capex] NR NR NR 8.2x 7.9x 5.5x 3.9x 2.7x 2.0x 1.4x 0.8xNet financial debt 56.7 71.1 91.6 118.4 134.6 118.0 97.7 77.4 61.0 44.0 26.7 [EBITDA - Capex] 1.5 (4.4) (9.8) 14.4 17.1 21.3 25.2 28.3 29.9 31.6 33.4
3. Financial Modelling:f. Ratios (1/12)
|108
From Business Planning to Financial Modelling and Valuation
Key concepts to assess the financial performance:1. Return On Equity• The Return On Equity (RoE) is a key concept for the shareholders
• It measures the profitability of their investment in shares of this company compared to alternative financial assets
– Other companies
– Fixed rates bonds
• RoE ≡ Net profit (group share) / Equity (group share)
• How to measure the equity?
– Equity at book-value or ... equity at market price
– The difference can be huge for listed companies
3. Financial Modelling:f. Ratios (2/12)
|109
From Business Planning to Financial Modelling and Valuation
Key concepts to assess the financial performance:2. Return on Capital Employed • The Return on Capital Employed (RoCE) measures what the
company earns (before interest and tax) per unit of capital employed
– RoCE ≡ EBITA / (Fixed assets + Working Capital)
– This ratio is not influenced by the financial structure of the company
• If total assets are used the concept is called Return on Assets– RoA ≡ EBITA (or EBITDA) / Total assets
3. Financial Modelling:f. Ratios (3/12)
|110
From Business Planning to Financial Modelling and Valuation
Key concepts to assess the financial performance:3. Return on Invested Capital• It can be useful to calculate the Return on Invested Capital
(RoIC). This is equal to the RoCE but considers the EBITA after taxes (or NOPAT)
– RoIC = RoCE x (1- τ) = EBITA x (1- τ) / (Fixed assets + Working Capital)
– EBITA x (1- τ) = NOPAT (Net Operating Profit After Taxes)
– Where τ is the average tax rate
3. Financial Modelling:f. Ratios (4/12)
|111
From Business Planning to Financial Modelling and Valuation
• What is a sound level for the RoCE?– higher than the interest rate– in the range of 10% to 18% in Western economies– the level is a reference for expected profitability of new capital
expenditures
• What is a sound level for the RoE?– in the range of 12% to 25%– depends on the risk of the business
• activity related risks (high tech vs. low tech)• maturity of the business (start up vs. mature)• financial structure (highly leveraged vs. standard)
3. Financial Modelling:f. Ratios (5/12)
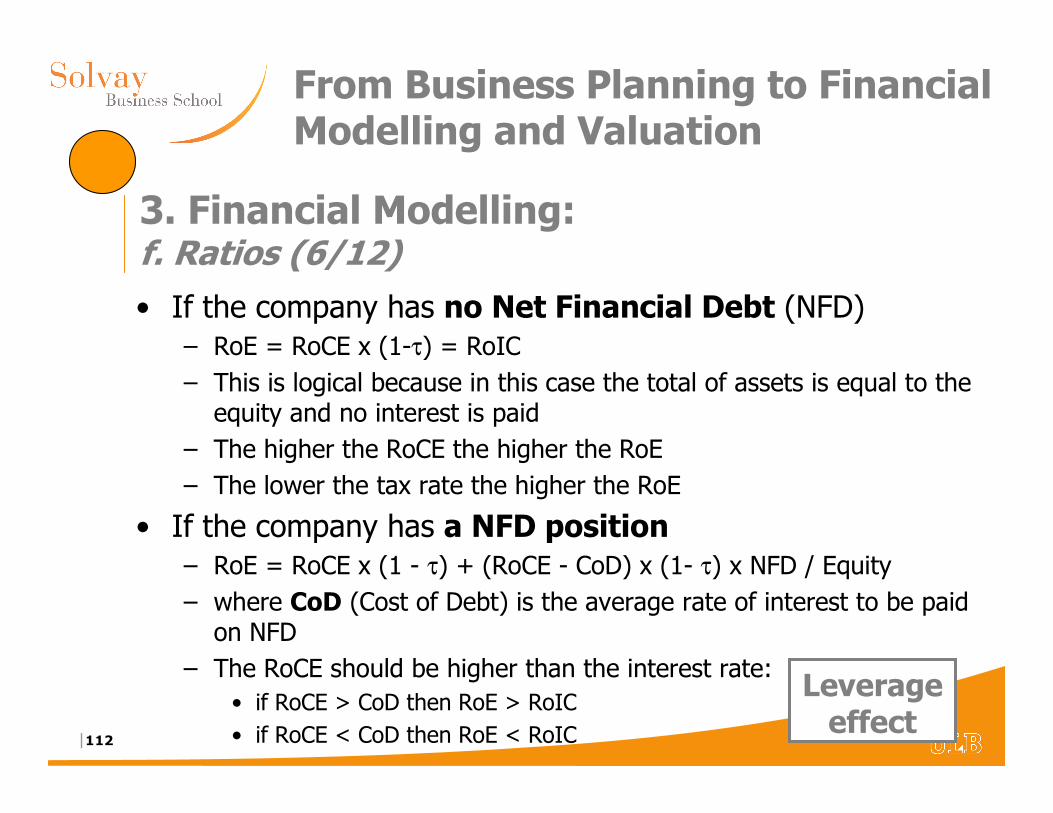
|112
From Business Planning to Financial Modelling and Valuation
• If the company has no Net Financial Debt (NFD)– RoE = RoCE x (1-τ) = RoIC
– This is logical because in this case the total of assets is equal to the equity and no interest is paid
– The higher the RoCE the higher the RoE
– The lower the tax rate the higher the RoE
• If the company has a NFD position– RoE = RoCE x (1 - τ) + (RoCE - CoD) x (1- τ) x NFD / Equity
– where CoD (Cost of Debt) is the average rate of interest to be paid on NFD
– The RoCE should be higher than the interest rate:
• if RoCE > CoD then RoE > RoIC
• if RoCE < CoD then RoE < RoIC
Leverage effect
3. Financial Modelling:f. Ratios (6/12)
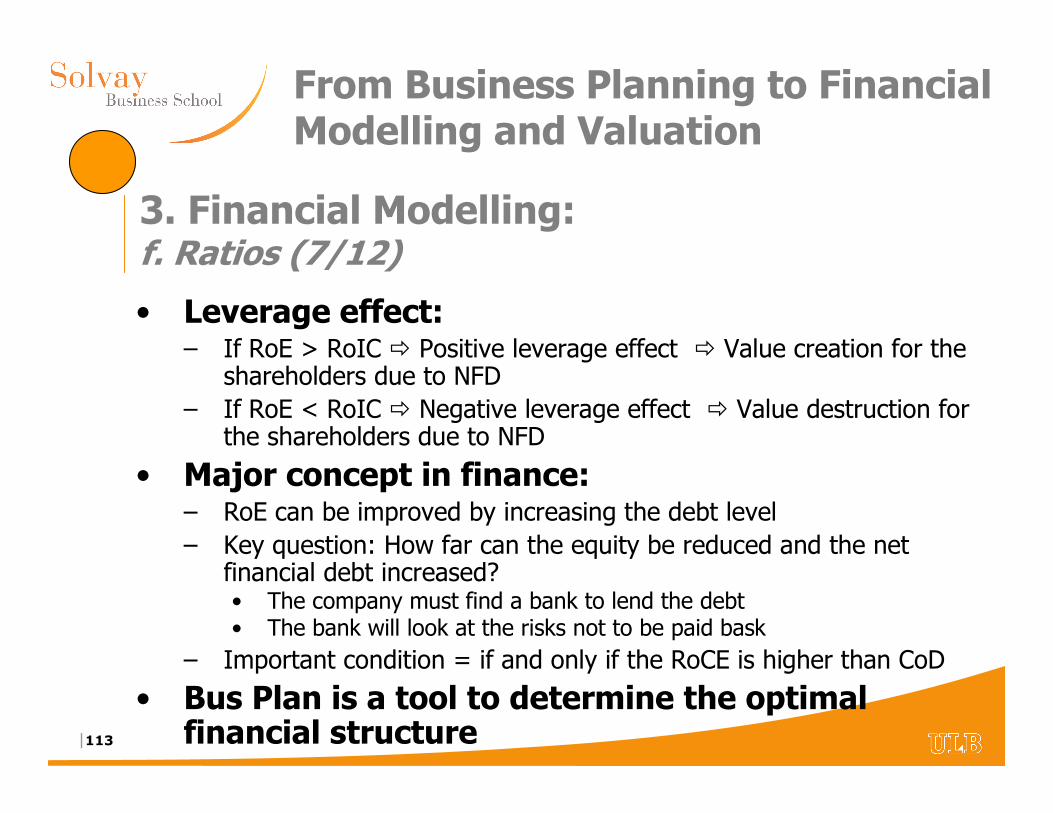
|113
From Business Planning to Financial Modelling and Valuation
• Leverage effect: – If RoE > RoIC � Positive leverage effect � Value creation for the
shareholders due to NFD
– If RoE < RoIC � Negative leverage effect � Value destruction for the shareholders due to NFD
• Major concept in finance:– RoE can be improved by increasing the debt level
– Key question: How far can the equity be reduced and the net financial debt increased?• The company must find a bank to lend the debt• The bank will look at the risks not to be paid bask
– Important condition = if and only if the RoCE is higher than CoD
• Bus Plan is a tool to determine the optimal financial structure
3. Financial Modelling:f. Ratios (7/12)
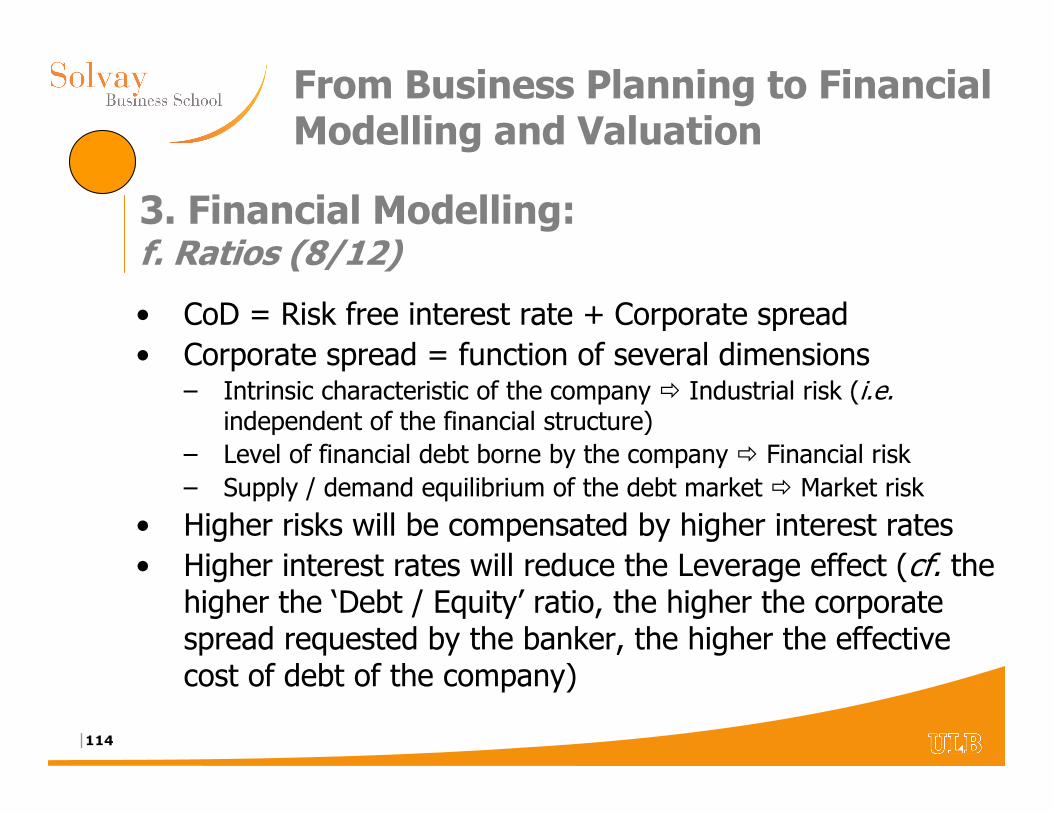
|114
From Business Planning to Financial Modelling and Valuation
• CoD = Risk free interest rate + Corporate spread
• Corporate spread = function of several dimensions – Intrinsic characteristic of the company � Industrial risk (i.e.
independent of the financial structure)
– Level of financial debt borne by the company � Financial risk
– Supply / demand equilibrium of the debt market � Market risk
• Higher risks will be compensated by higher interest rates
• Higher interest rates will reduce the Leverage effect (cf. the higher the ‘Debt / Equity’ ratio, the higher the corporate spread requested by the banker, the higher the effective cost of debt of the company)
3. Financial Modelling:f. Ratios (8/12)
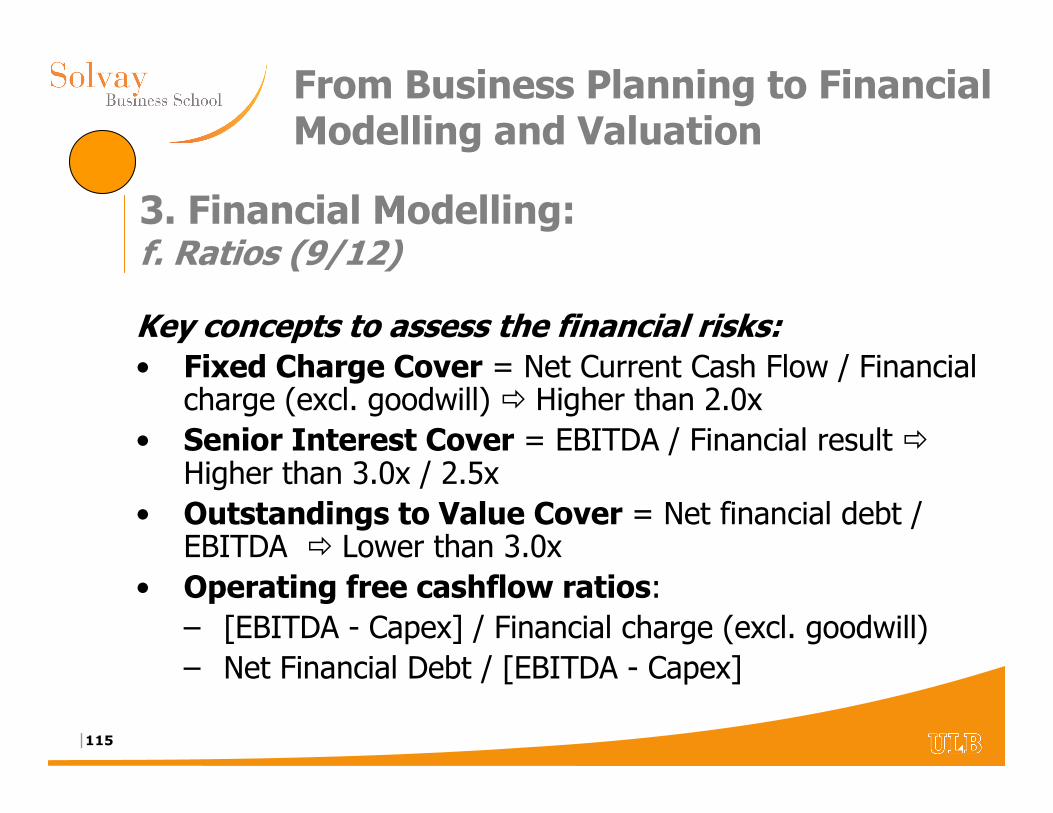
|115
From Business Planning to Financial Modelling and Valuation
Key concepts to assess the financial risks:• Fixed Charge Cover = Net Current Cash Flow / Financial
charge (excl. goodwill) � Higher than 2.0x
• Senior Interest Cover = EBITDA / Financial result �Higher than 3.0x / 2.5x
• Outstandings to Value Cover = Net financial debt / EBITDA � Lower than 3.0x
• Operating free cashflow ratios:– [EBITDA - Capex] / Financial charge (excl. goodwill)
– Net Financial Debt / [EBITDA - Capex]
3. Financial Modelling:f. Ratios (9/12)
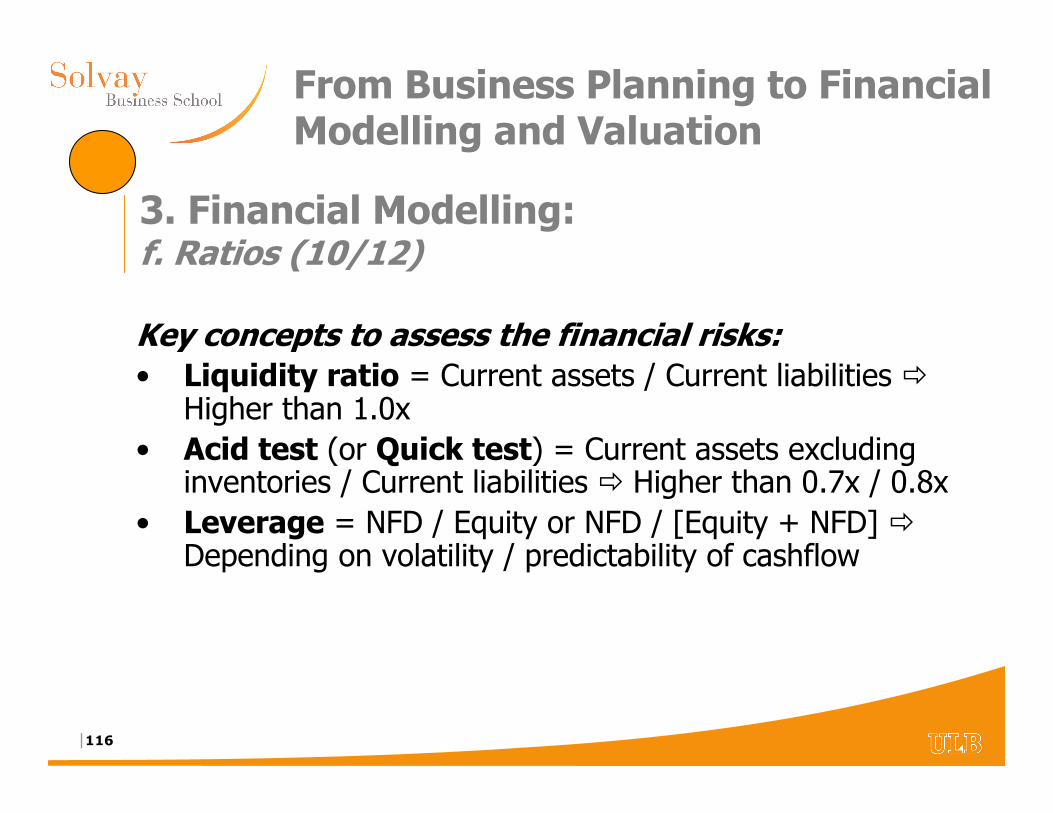
|116
From Business Planning to Financial Modelling and Valuation
Key concepts to assess the financial risks:• Liquidity ratio = Current assets / Current liabilities �
Higher than 1.0x
• Acid test (or Quick test) = Current assets excluding inventories / Current liabilities � Higher than 0.7x / 0.8x
• Leverage = NFD / Equity or NFD / [Equity + NFD] �Depending on volatility / predictability of cashflow
3. Financial Modelling:f. Ratios (10/12)
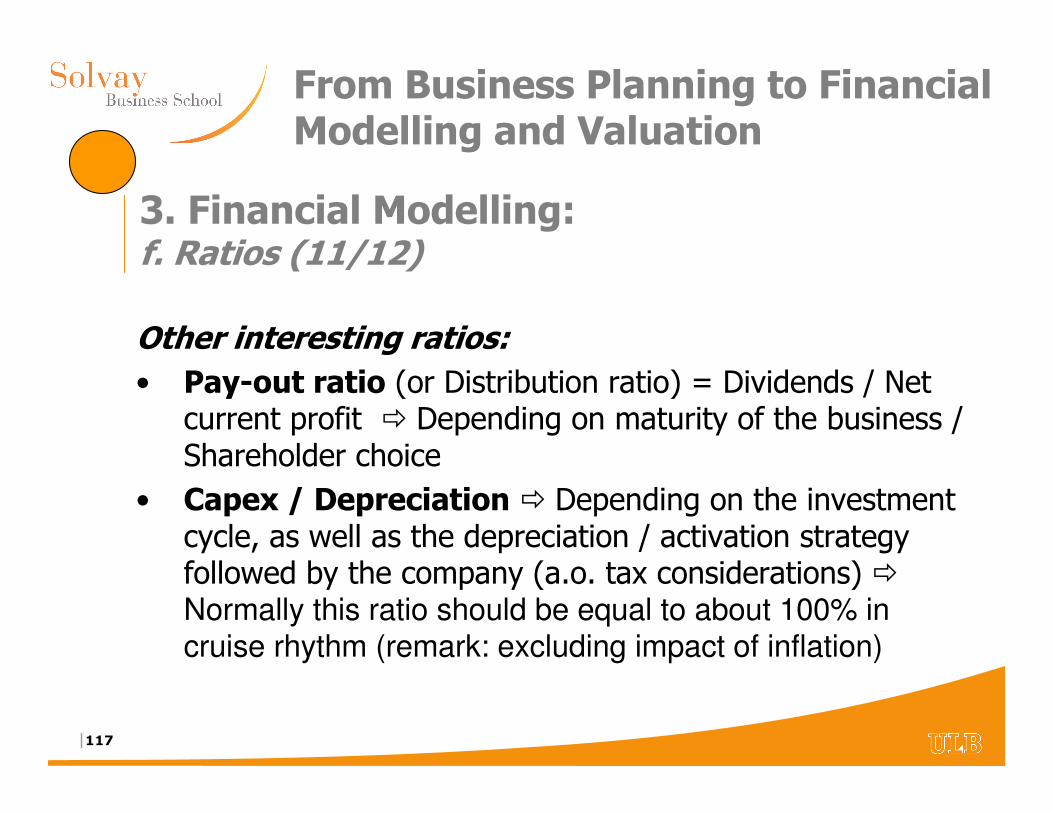
|117
From Business Planning to Financial Modelling and Valuation
Other interesting ratios:• Pay-out ratio (or Distribution ratio) = Dividends / Net
current profit � Depending on maturity of the business / Shareholder choice
• Capex / Depreciation � Depending on the investment cycle, as well as the depreciation / activation strategy followed by the company (a.o. tax considerations) �Normally this ratio should be equal to about 100% in cruise rhythm (remark: excluding impact of inflation)
3. Financial Modelling:f. Ratios (11/12)
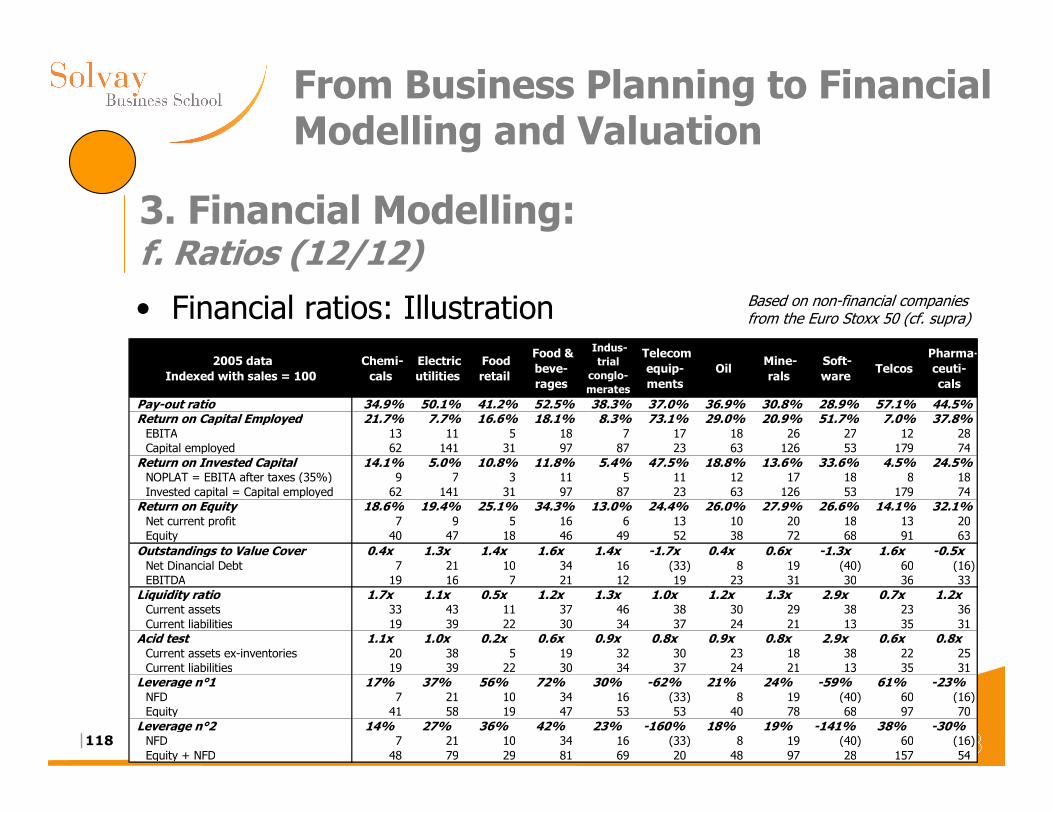
|118
From Business Planning to Financial Modelling and Valuation
• Financial ratios: Illustration
3. Financial Modelling:f. Ratios (12/12)
2005 data Indexed with sales = 100
Chemi-cals
Electric utilities
Food retail
Food & beve-rages
Indus-trial
conglo-merates
Telecom equip-ments
Oil Mine-rals
Soft-ware
Telcos Pharma-ceuti-cals
Pay-out ratio 34.9% 50.1% 41.2% 52.5% 38.3% 37.0% 36.9% 30.8% 28.9% 57.1% 44.5%Return on Capital Employed 21.7% 7.7% 16.6% 18.1% 8.3% 73.1% 29.0% 20.9% 51.7% 7.0% 37.8%EBITA 13 11 5 18 7 17 18 26 27 12 28 Capital employed 62 141 31 97 87 23 63 126 53 179 74
Return on Invested Capital 14.1% 5.0% 10.8% 11.8% 5.4% 47.5% 18.8% 13.6% 33.6% 4.5% 24.5%NOPLAT = EBITA after taxes (35%) 9 7 3 11 5 11 12 17 18 8 18 Invested capital = Capital employed 62 141 31 97 87 23 63 126 53 179 74
Return on Equity 18.6% 19.4% 25.1% 34.3% 13.0% 24.4% 26.0% 27.9% 26.6% 14.1% 32.1%Net current profit 7 9 5 16 6 13 10 20 18 13 20 Equity 40 47 18 46 49 52 38 72 68 91 63
Outstandings to Value Cover 0.4x 1.3x 1.4x 1.6x 1.4x -1.7x 0.4x 0.6x -1.3x 1.6x -0.5xNet Dinancial Debt 7 21 10 34 16 (33) 8 19 (40) 60 (16) EBITDA 19 16 7 21 12 19 23 31 30 36 33
Liquidity ratio 1.7x 1.1x 0.5x 1.2x 1.3x 1.0x 1.2x 1.3x 2.9x 0.7x 1.2xCurrent assets 33 43 11 37 46 38 30 29 38 23 36 Current liabilities 19 39 22 30 34 37 24 21 13 35 31
Acid test 1.1x 1.0x 0.2x 0.6x 0.9x 0.8x 0.9x 0.8x 2.9x 0.6x 0.8xCurrent assets ex-inventories 20 38 5 19 32 30 23 18 38 22 25 Current liabilities 19 39 22 30 34 37 24 21 13 35 31
Leverage n°1 17% 37% 56% 72% 30% -62% 21% 24% -59% 61% -23%NFD 7 21 10 34 16 (33) 8 19 (40) 60 (16) Equity 41 58 19 47 53 53 40 78 68 97 70
Leverage n°2 14% 27% 36% 42% 23% -160% 18% 19% -141% 38% -30%NFD 7 21 10 34 16 (33) 8 19 (40) 60 (16) Equity + NFD 48 79 29 81 69 20 48 97 28 157 54
Based on non-financial companies from the Euro Stoxx 50 (cf. supra)
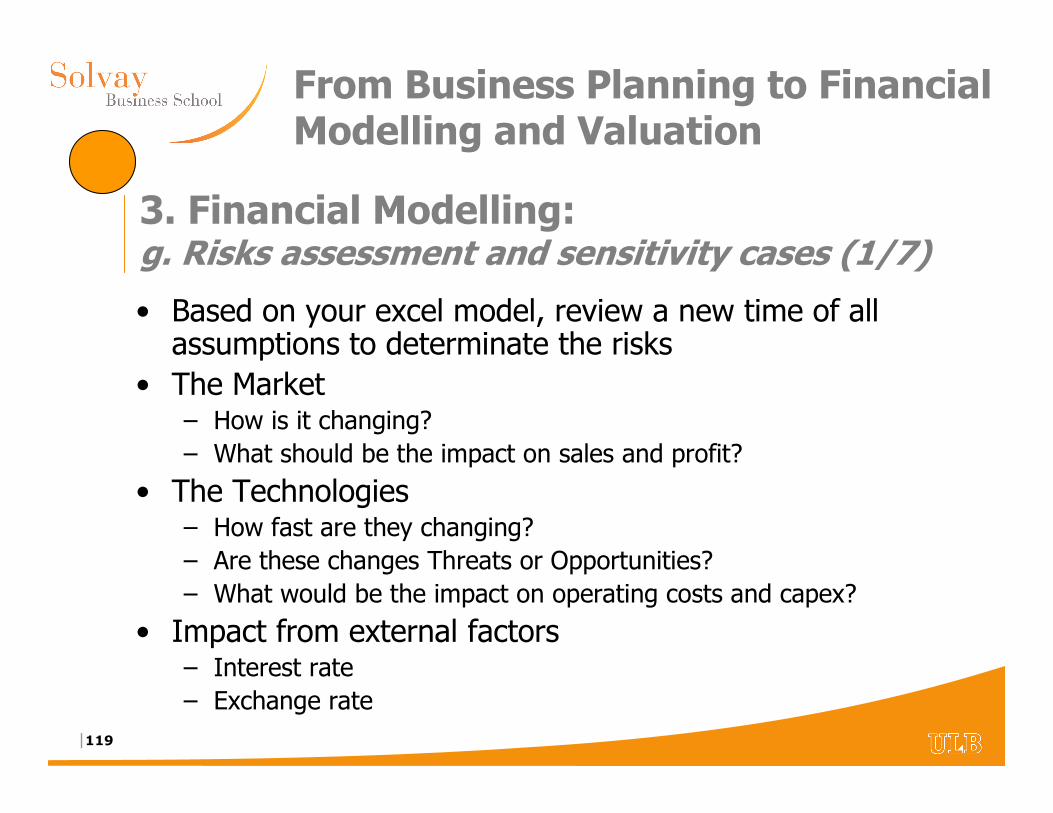
|119
From Business Planning to Financial Modelling and Valuation
• Based on your excel model, review a new time of all assumptions to determinate the risks
• The Market– How is it changing?
– What should be the impact on sales and profit?
• The Technologies– How fast are they changing?
– Are these changes Threats or Opportunities?
– What would be the impact on operating costs and capex?
• Impact from external factors– Interest rate
– Exchange rate
3. Financial Modelling:g. Risks assessment and sensitivity cases (1/7)
|120
From Business Planning to Financial Modelling and Valuation
• Quantify the risks– Probability to occur
– Financial consequences if they occur
• Manage the risks to reduce them– Process changes
– Additional expenses (opex or capex)
• Cover the risks– Insurances
– Financial coverage
3. Financial Modelling:g. Risks assessment and sensitivity cases (2/7)
|121
From Business Planning to Financial Modelling and Valuation
• We can see immediately all the consequences of changing one assumption– occupancy rate or load factor– unit price vs. volume (cf. elasticity)– additional capital expenditures
• more rooms, more planes, more shops• fixed and variable costs
– interest rate– exchange rate
• Three scenarios may be built:– ‘Base Case’– ‘Best Case’– ‘Worst Case’
3. Financial Modelling:g. Risks assessment and sensitivity cases (3/7)
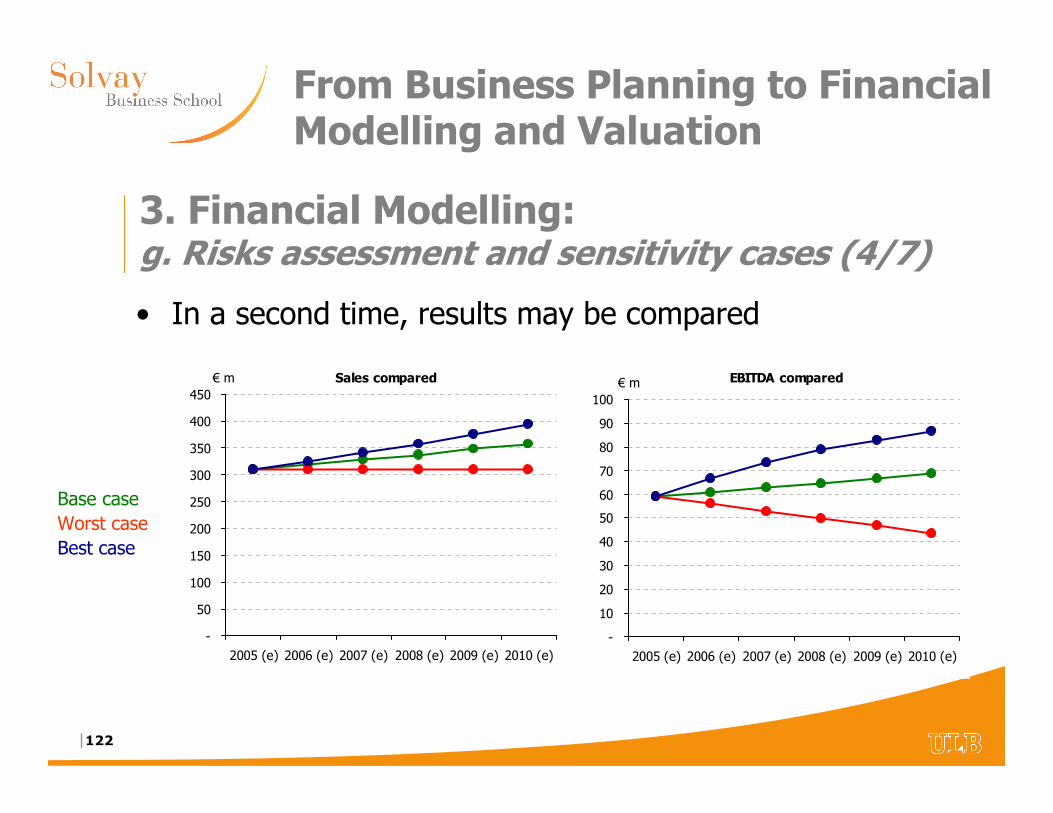
|122
From Business Planning to Financial Modelling and Valuation
• In a second time, results may be compared
3. Financial Modelling:g. Risks assessment and sensitivity cases (4/7)
Base case
Worst case
Best case
-
50
100
150
200
250
300
350
400
450
2005 (e) 2006 (e) 2007 (e) 2008 (e) 2009 (e) 2010 (e)
€ m Sales compared
-
10
20
30
40
50
60
70
80
90
100
2005 (e) 2006 (e) 2007 (e) 2008 (e) 2009 (e) 2010 (e)
€ m EBITDA compared
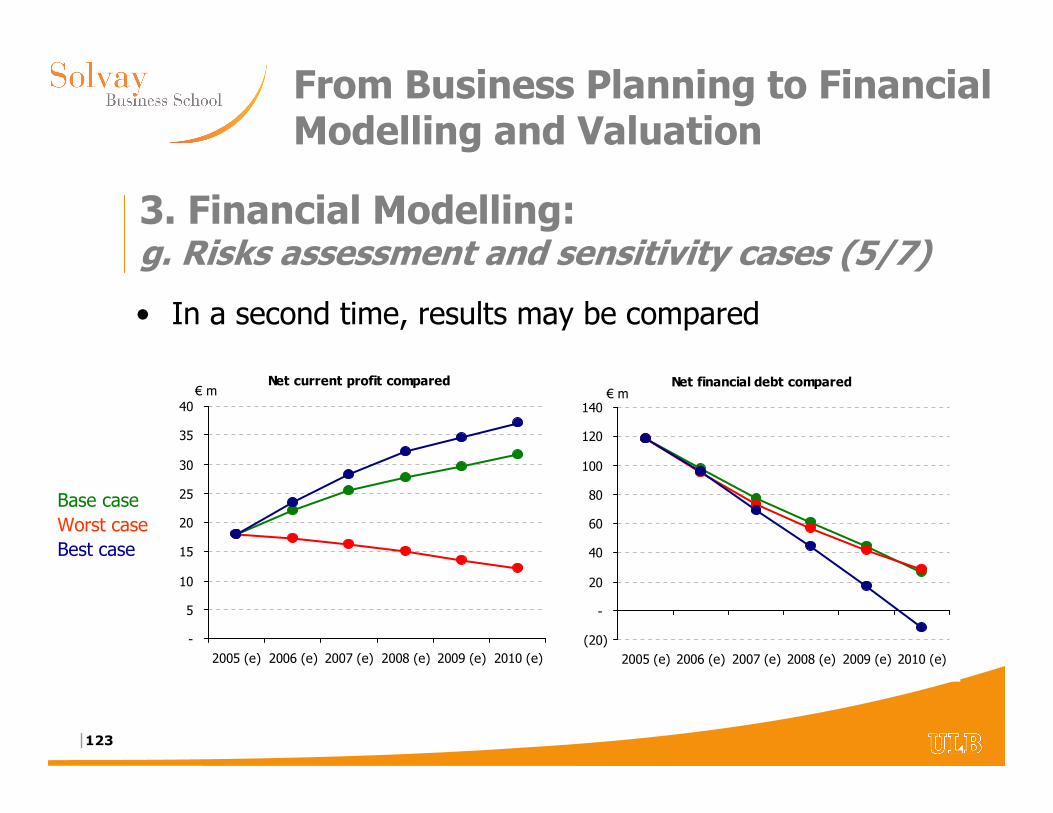
|123
From Business Planning to Financial Modelling and Valuation
• In a second time, results may be compared
3. Financial Modelling:g. Risks assessment and sensitivity cases (5/7)
Base case
Worst case
Best case
-
5
10
15
20
25
30
35
40
2005 (e) 2006 (e) 2007 (e) 2008 (e) 2009 (e) 2010 (e)
€ mNet current profit compared
(20)
-
20
40
60
80
100
120
140
2005 (e) 2006 (e) 2007 (e) 2008 (e) 2009 (e) 2010 (e)
€ mNet financial debt compared
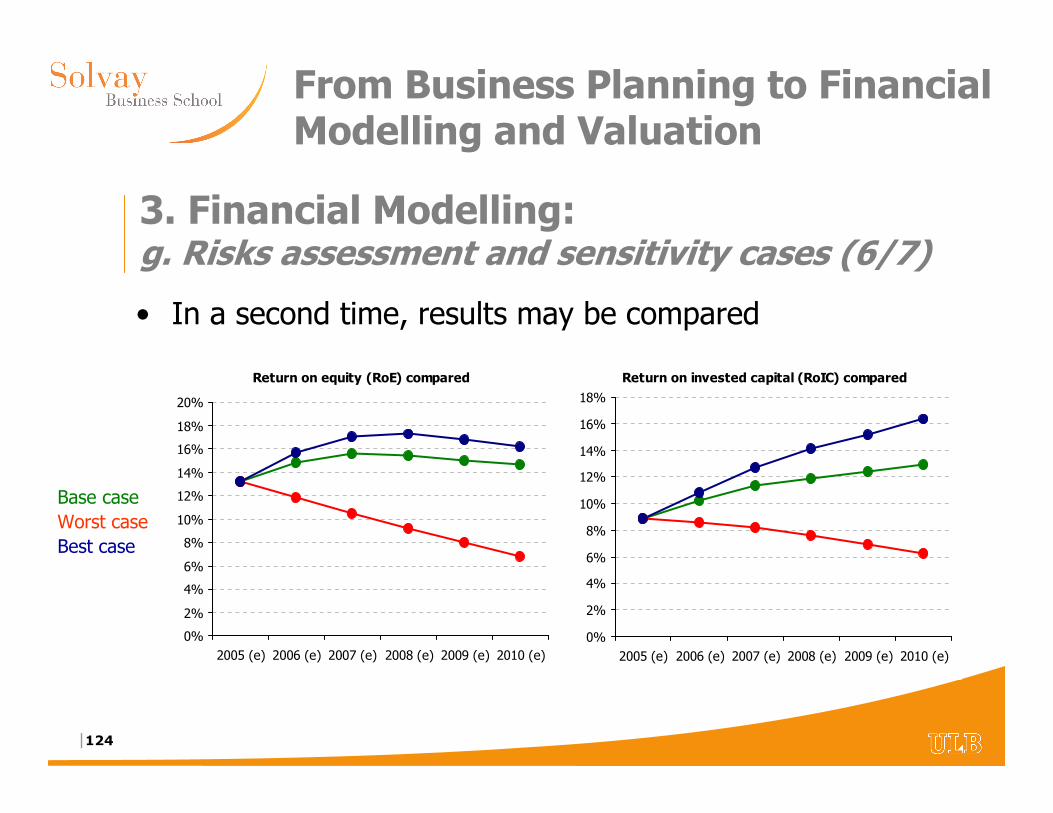
|124
From Business Planning to Financial Modelling and Valuation
• In a second time, results may be compared
Base case
Worst case
Best case
0%
2%
4%
6%
8%
10%
12%
14%
16%
18%
20%
2005 (e) 2006 (e) 2007 (e) 2008 (e) 2009 (e) 2010 (e)
Return on equity (RoE) compared
0%
2%
4%
6%
8%
10%
12%
14%
16%
18%
2005 (e) 2006 (e) 2007 (e) 2008 (e) 2009 (e) 2010 (e)
Return on invested capital (RoIC) compared
3. Financial Modelling:g. Risks assessment and sensitivity cases (6/7)
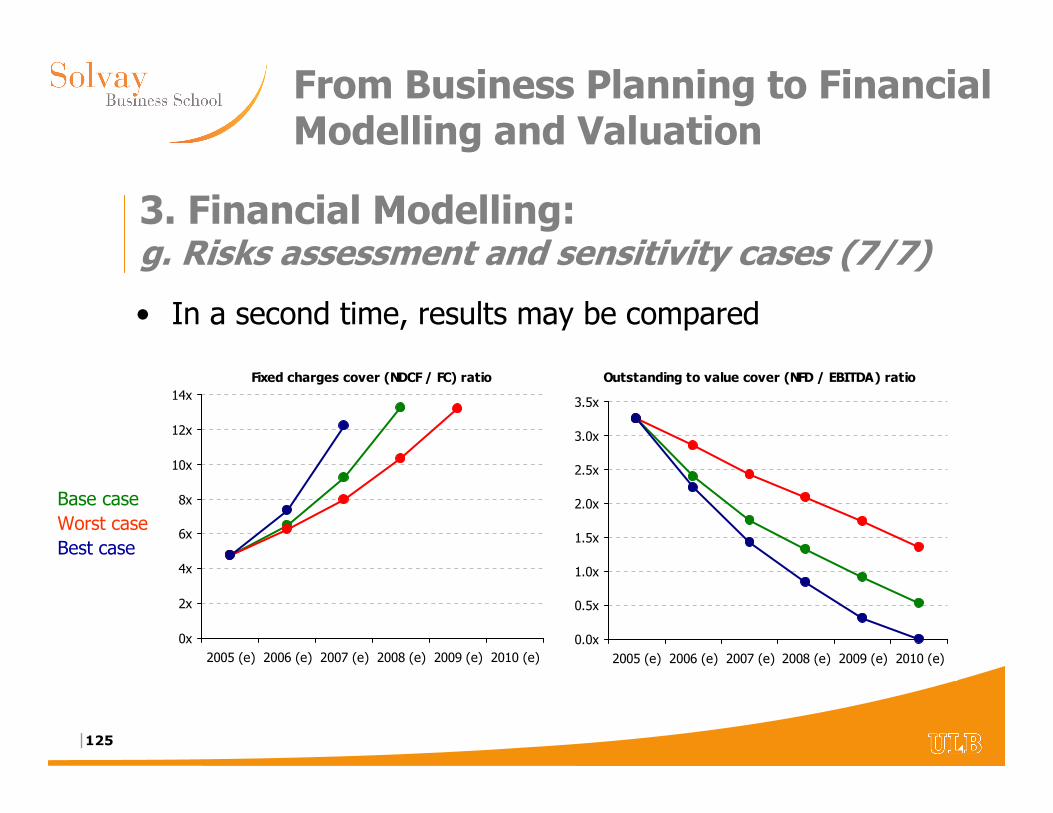
|125
From Business Planning to Financial Modelling and Valuation
• In a second time, results may be compared
Base case
Worst case
Best case
0x
2x
4x
6x
8x
10x
12x
14x
2005 (e) 2006 (e) 2007 (e) 2008 (e) 2009 (e) 2010 (e)
Fixed charges cover (NDCF / FC) ratio
0.0x
0.5x
1.0x
1.5x
2.0x
2.5x
3.0x
3.5x
2005 (e) 2006 (e) 2007 (e) 2008 (e) 2009 (e) 2010 (e)
Outstanding to value cover (NFD / EBITDA) ratio
3. Financial Modelling:g. Risks assessment and sensitivity cases (7/7)
|126
From Business Planning to Financial Modelling and Valuation
• How much equity and how much debt to finance the business ?
– 1st goal: Maximize the profitability for the shareholders
– 2nd goal: Be able to pay the interests and to repay the debt
– 3rd goal: Minimize the risks
• Minimize the capital needs
– Optimize the use of fixed assets (productivity)
– Minimize the working capital
• Minimize the equity
– Leverage effect
– Gross cost of debt normally < requested return on equity
– Tax impact
• Use the Financial Plan to seek the best structure
3. Financial Modelling:h. Optimizing the financial structure
|127
From Business Planning to Financial Modelling and Valuation
4. Valuation
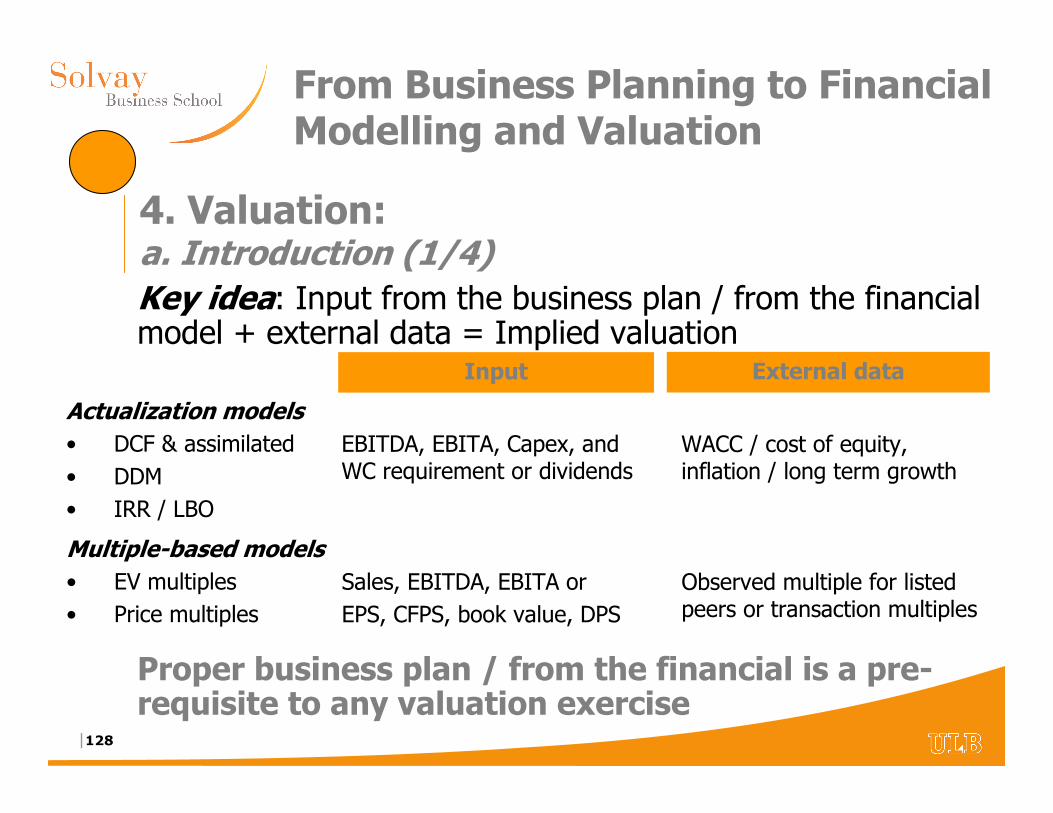
|128
From Business Planning to Financial Modelling and Valuation
Key idea: Input from the business plan / from the financial model + external data = Implied valuation
Proper business plan / from the financial is a pre-requisite to any valuation exercise
Actualization models• DCF & assimilated
• DDM
• IRR / LBO
Input External data
EBITDA, EBITA, Capex, and WC requirement or dividends
WACC / cost of equity, inflation / long term growth
Multiple-based models• EV multiples
• Price multiples
Sales, EBITDA, EBITA or
EPS, CFPS, book value, DPS
Observed multiple for listed peers or transaction multiples
4. Valuation:a. Introduction (1/4)
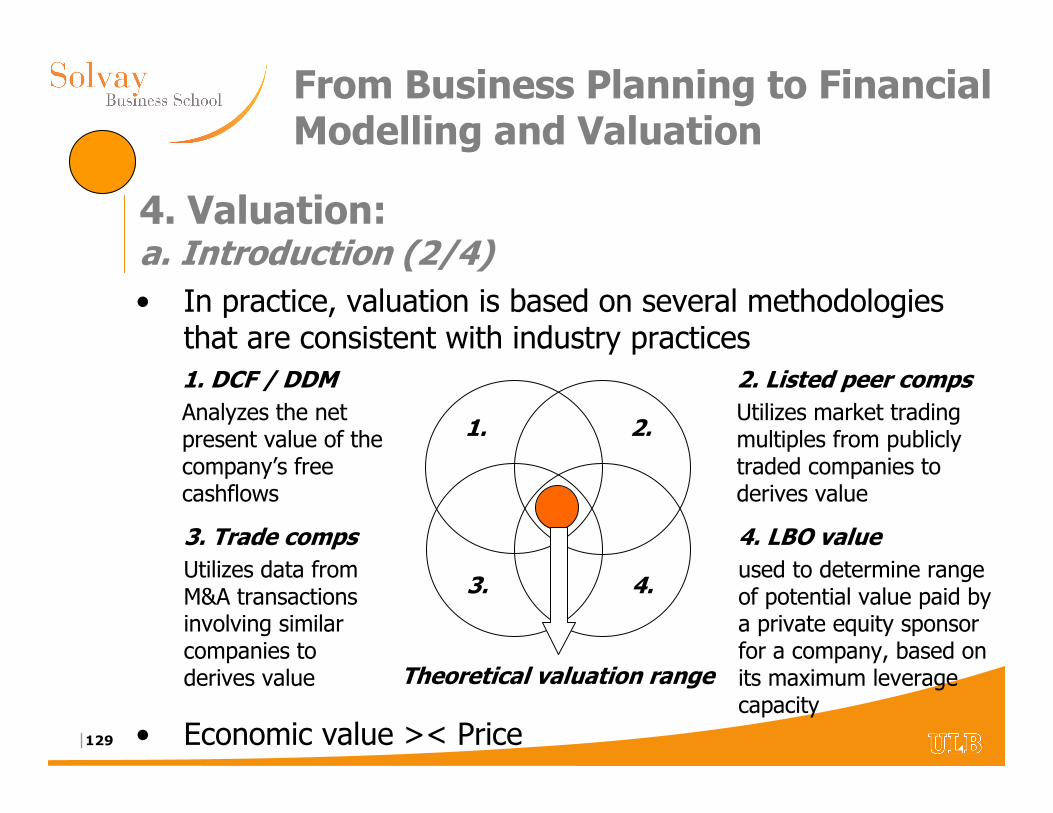
|129
From Business Planning to Financial Modelling and Valuation
• In practice, valuation is based on several methodologies that are consistent with industry practices
• Economic value >< Price
4. Valuation:a. Introduction (2/4)
1. DCF / DDMAnalyzes the net present value of the company’s free cashflows
1. 2.
2. Listed peer compsUtilizes market trading multiples from publicly traded companies to derives value
3. Trade compsUtilizes data from M&A transactions involving similar companies to derives value
3. 4.
4. LBO valueused to determine range of potential value paid by a private equity sponsor for a company, based on its maximum leverage capacity
Theoretical valuation range
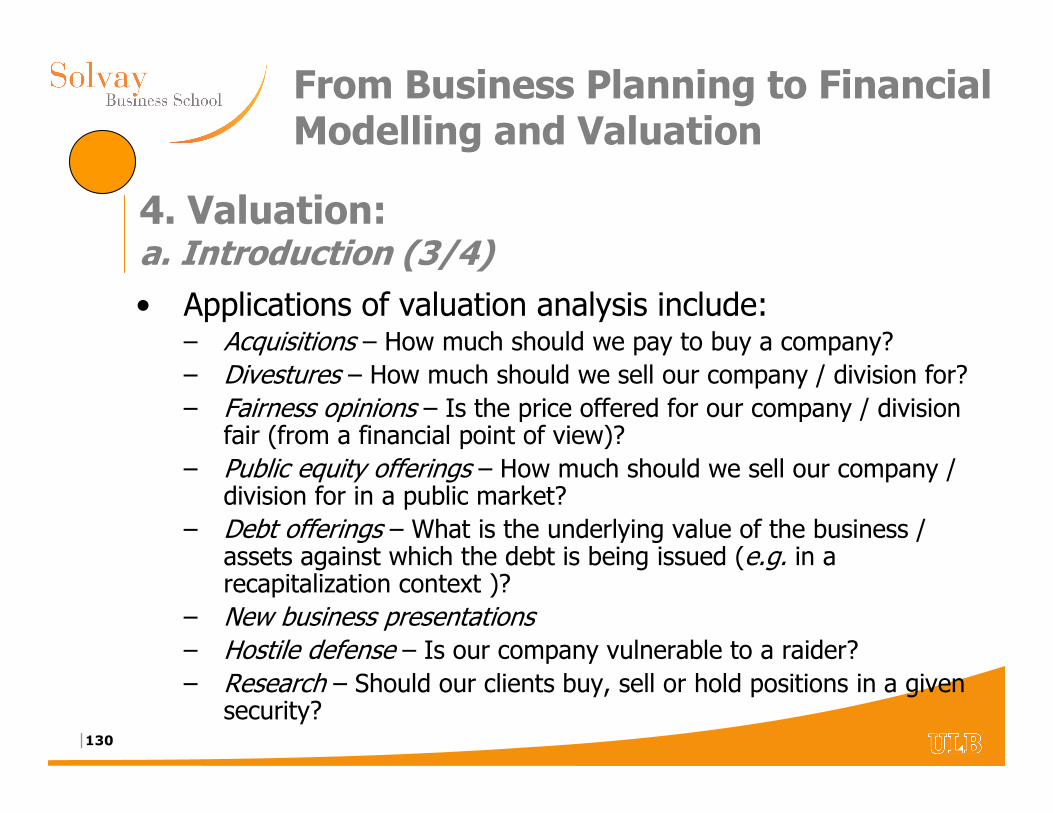
|130
From Business Planning to Financial Modelling and Valuation
• Applications of valuation analysis include:– Acquisitions – How much should we pay to buy a company?
– Divestures – How much should we sell our company / division for?
– Fairness opinions – Is the price offered for our company / division fair (from a financial point of view)?
– Public equity offerings – How much should we sell our company / division for in a public market?
– Debt offerings – What is the underlying value of the business / assets against which the debt is being issued (e.g. in a recapitalization context )?
– New business presentations– Hostile defense – Is our company vulnerable to a raider?
– Research – Should our clients buy, sell or hold positions in a given security?
4. Valuation:a. Introduction (3/4)
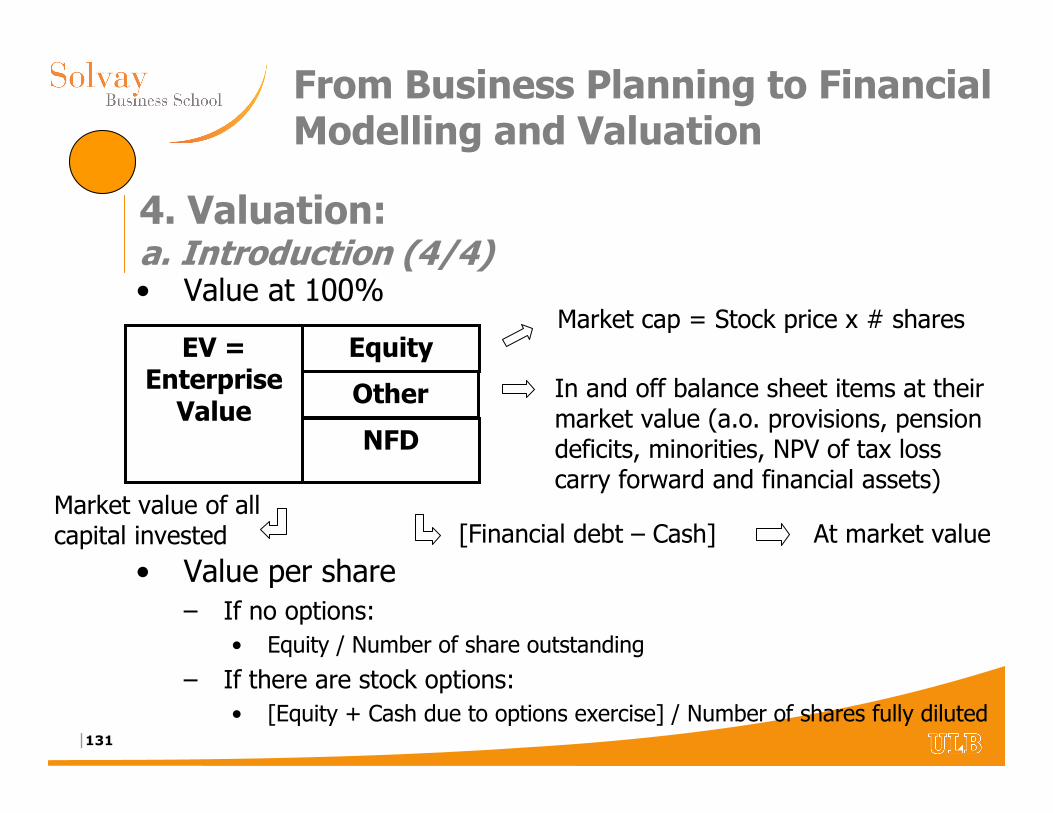
|131
From Business Planning to Financial Modelling and Valuation
• Value per share– If no options:
• Equity / Number of share outstanding
– If there are stock options:
• [Equity + Cash due to options exercise] / Number of shares fully diluted
4. Valuation:a. Introduction (4/4)
EV = Enterprise
Value
Equity
Other
NFD
Market cap = Stock price x # shares
In and off balance sheet items at their market value (a.o. provisions, pension deficits, minorities, NPV of tax loss carry forward and financial assets)
[Financial debt – Cash] At market value
• Value at 100%
Market value of all capital invested
|132
From Business Planning to Financial Modelling and Valuation
• Actualization models are the fundamental valuation tools– For some companies the only way to value
– For all companies, represent their theoretical value, a proxy for private market value
– Only way to take into account the business plan and financial model of the company (>< multiples = spot situation)
– Simple and easy to use
– Do not change every day (unlike public comps)
– Always represents relevant data (>< transaction comps)
– Excluding financial model, dependent of a small number of assumptions
4. Valuation:b. Actualization models (1/2)
|133
From Business Planning to Financial Modelling and Valuation
• DCF = Discounted (free) Cash Flow– Common practice all around the world
– Valuation of a project including medium term perspectives
• DDM = Dividend Discount Model– Focus on dividend � Useful for long-term minority investors
– Financial market oriented (relative valuation based on alpha derived from the CAPM theory)
• Theoretically: DCF = DDM– Same core idea: “The value of a productive asset is equal to
the net present value of all expected future cash flows that can be removed from it without affecting its value (including an estimated terminal value) discounted using appropriate actualization rate (i.e. function of the underlying risk)”
4. Valuation:b. Actualization models (2/2)
|134
From Business Planning to Financial Modelling and Valuation
• Financial data from financial model (cf. supra) determining the operating free cashflows over a medium horizon (e.g. 5to 10 years):– EBITA
– Normative Tax rate
– Non-cash operating items
– Capex
– Working capital requirements
• Discount rate � WACC (cf. infra) • Terminal Value (TV)
– Gordon-Shapiro• Value 0 = FCF 1 / (WACC – g) = [FCF 0 x (1 + g)] / (WACC – g)
– Multiple (e.g. prudent EV / EBITDA or EV / EBITA)
� NOPAT = EBITA x (1 – τ)
4. Valuation:b. Actualization models: 1. DCF (1/6)
|135
From Business Planning to Financial Modelling and Valuation
• WACC– Weighted Average Cost of Capital – (1 – Lv) x CoE + Lv x CoD x (1 – τ)
• Where:– Lv = NFD / (Equity + NFD)
• Maximum 30 / 35% of EV• Leverage effect considered ad infinitum � Must be sustainable
– CoE = Cost of Equity• Based on CAPM theory, CoE = Rf + β x RP• Where:
– Rf = Risk free rate (e.g. 10 y Government bond)– β = Beta of the cy (*) – RP = Risk premium = Rm - Rf
– CoD = Cost of Debt• CoD = Rf + Spread function of indebtness
– Tax rate = τ
(*) β lev = β unlev x [1 + (1 – Tc) x (NFD / Equity)]
4. Valuation:b. Actualization models: 1. DCF (2/6)
|136
From Business Planning to Financial Modelling and Valuation
• Risk premium
– From CAPM model
• The only consistent approach from a theoretical point of view
• In practice, very complex to build
– Alternative approaches
• Use public sources
• Proxy = [1/ P/E of the market] – Risk free rate
• Normative risk premium (e.g. 3 to 5%)
4. Valuation:b. Actualization models: 1. DCF (3/6)
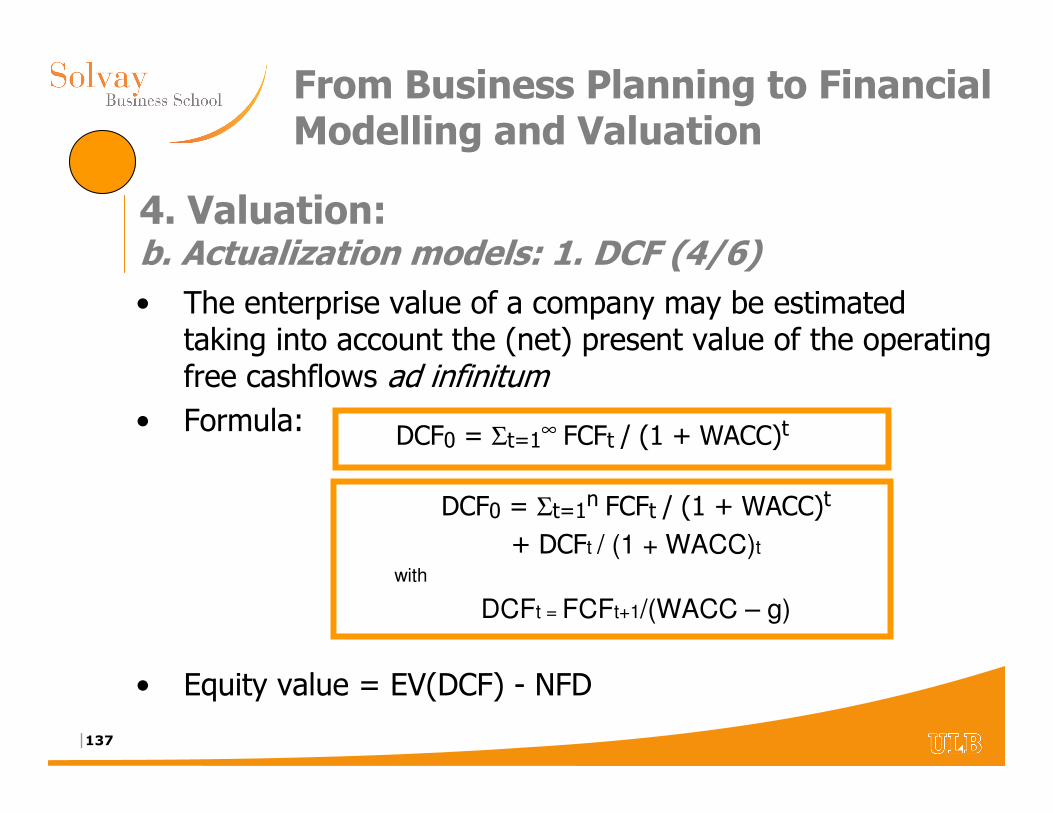
|137
From Business Planning to Financial Modelling and Valuation
• The enterprise value of a company may be estimated taking into account the (net) present value of the operating free cashflows ad infinitum
• Formula:
• Equity value = EV(DCF) - NFD
DCF0 = Σt=1∞ FCFt / (1 + WACC)t
DCF0 = Σt=1n FCFt / (1 + WACC)t
+ DCFt / (1 + WACC)t
with
DCFt = FCFt+1/(WACC – g)
4. Valuation:b. Actualization models: 1. DCF (4/6)
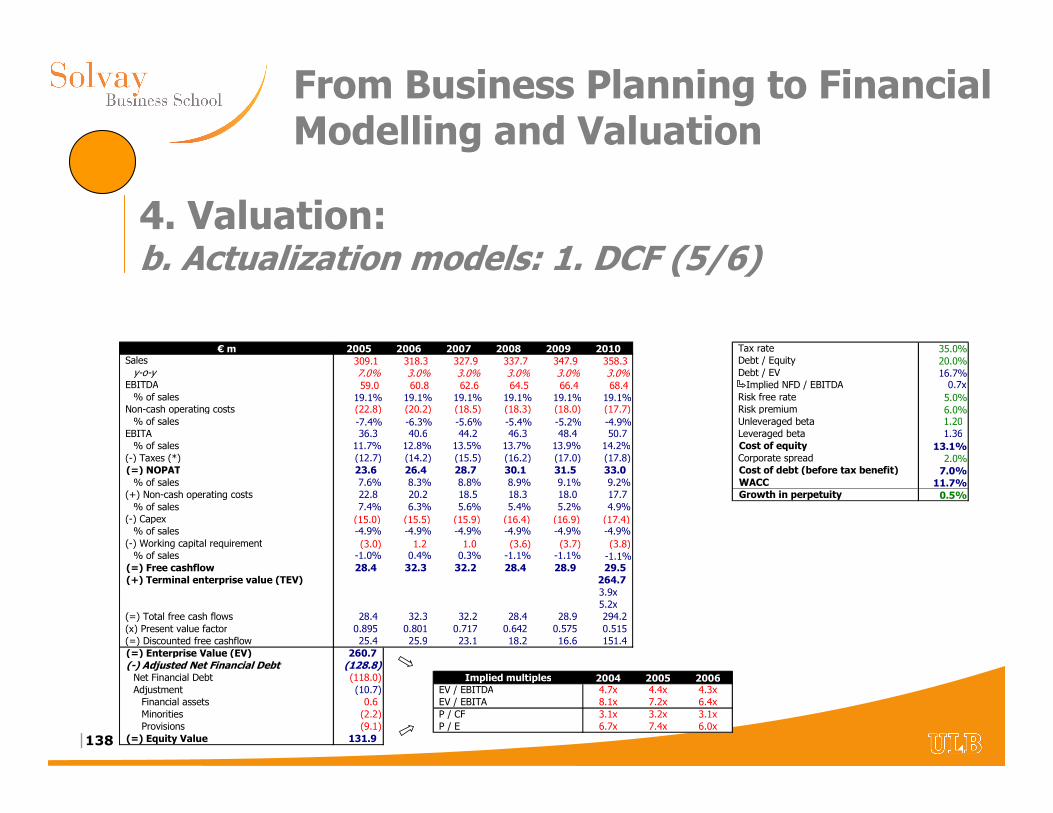
|138
From Business Planning to Financial Modelling and Valuation
€ m 2005 2006 2007 2008 2009 2010 Tax rate 35.0%Sales 309.1 318.3 327.9 337.7 347.9 358.3 Debt / Equity 20.0%y-o-y 7.0% 3.0% 3.0% 3.0% 3.0% 3.0% Debt / EV 16.7%
EBITDA 59.0 60.8 62.6 64.5 66.4 68.4 Implied NFD / EBITDA 0.7x% of sales 19.1% 19.1% 19.1% 19.1% 19.1% 19.1% Risk free rate 5.0%
Non-cash operating costs (22.8) (20.2) (18.5) (18.3) (18.0) (17.7) Risk premium 6.0%% of sales -7.4% -6.3% -5.6% -5.4% -5.2% -4.9% Unleveraged beta 1.20
EBITA 36.3 40.6 44.2 46.3 48.4 50.7 Leveraged beta 1.36 % of sales 11.7% 12.8% 13.5% 13.7% 13.9% 14.2% Cost of equity 13.1%
(-) Taxes (*) (12.7) (14.2) (15.5) (16.2) (17.0) (17.8) Corporate spread 2.0%(=) NOPAT 23.6 26.4 28.7 30.1 31.5 33.0 Cost of debt (before tax benefit) 7.0%% of sales 7.6% 8.3% 8.8% 8.9% 9.1% 9.2% WACC 11.7%
(+) Non-cash operating costs 22.8 20.2 18.5 18.3 18.0 17.7 Growth in perpetuity 0.5%% of sales 7.4% 6.3% 5.6% 5.4% 5.2% 4.9%
(-) Capex (15.0) (15.5) (15.9) (16.4) (16.9) (17.4)% of sales -4.9% -4.9% -4.9% -4.9% -4.9% -4.9%
(-) Working capital requirement (3.0) 1.2 1.0 (3.6) (3.7) (3.8)% of sales -1.0% 0.4% 0.3% -1.1% -1.1% -1.1%
(=) Free cashflow 28.4 32.3 32.2 28.4 28.9 29.5 (+) Terminal enterprise value (TEV) 264.7
3.9x5.2x
(=) Total free cash flows 28.4 32.3 32.2 28.4 28.9 294.2 (x) Present value factor 0.895 0.801 0.717 0.642 0.575 0.515 (=) Discounted free cashflow 25.4 25.9 23.1 18.2 16.6 151.4 (=) Enterprise Value (EV) 260.7 (-) Adjusted Net Financial Debt (128.8) Net Financial Debt (118.0) 2004 2005 2006Adjustment (10.7) EV / EBITDA 4.7x 4.4x 4.3xFinancial assets 0.6 EV / EBITA 8.1x 7.2x 6.4xMinorities (2.2) P / CF 3.1x 3.2x 3.1xProvisions (9.1) P / E 6.7x 7.4x 6.0x
(=) Equity Value 131.9
Implied multiples
4. Valuation:b. Actualization models: 1. DCF (5/6)
|139
From Business Planning to Financial Modelling and Valuation
• The DCF value may be compared to the price of the asset– If the DCF value is higher, this asset will be considered as
undervalued. This gives a rational reason to buy the asset
– A contrario, the asset will be considered as overvalued. It will be justified to avoid an acquisition or will give a rational reason to sell the asset
• Don’t forget to run the valuation model on sensitivity cases
• Also look at the sensitivity of the value to external factors (WACC and g)
4. Valuation:b. Actualization models: 1. DCF (6/6)
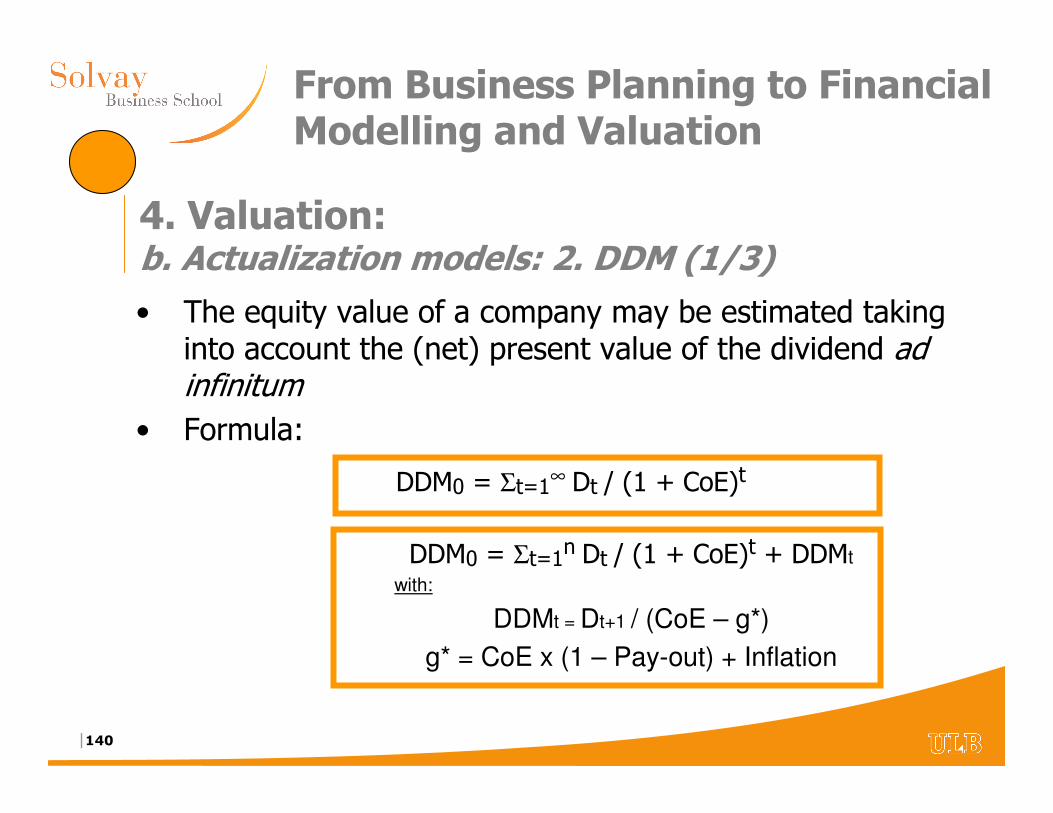
|140
From Business Planning to Financial Modelling and Valuation
• The equity value of a company may be estimated taking into account the (net) present value of the dividend ad infinitum
• Formula:
DDM0 = Σt=1∞ Dt / (1 + CoE)t
DDM0 = Σt=1n Dt / (1 + CoE)t + DDMt
with:
DDMt = Dt+1 / (CoE – g*)
g* = CoE x (1 – Pay-out) + Inflation
4. Valuation:b. Actualization models: 2. DDM (1/3)
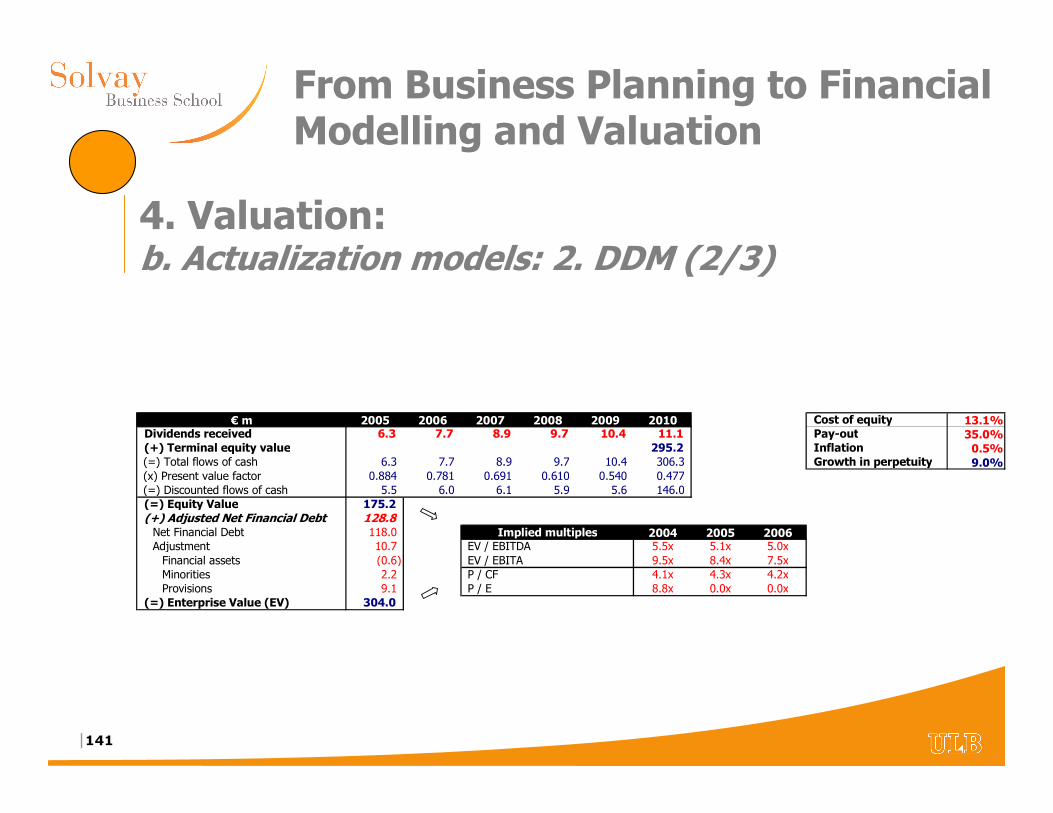
|141
From Business Planning to Financial Modelling and Valuation
€ m 2005 2006 2007 2008 2009 2010 Cost of equity 13.1%Dividends received 6.3 7.7 8.9 9.7 10.4 11.1 Pay-out 35.0%(+) Terminal equity value 295.2 Inflation 0.5%(=) Total flows of cash 6.3 7.7 8.9 9.7 10.4 306.3 Growth in perpetuity 9.0%(x) Present value factor 0.884 0.781 0.691 0.610 0.540 0.477 (=) Discounted flows of cash 5.5 6.0 6.1 5.9 5.6 146.0 (=) Equity Value 175.2 (+) Adjusted Net Financial Debt 128.8 Net Financial Debt 118.0 2004 2005 2006Adjustment 10.7 EV / EBITDA 5.5x 5.1x 5.0xFinancial assets (0.6) EV / EBITA 9.5x 8.4x 7.5xMinorities 2.2 P / CF 4.1x 4.3x 4.2xProvisions 9.1 P / E 8.8x 0.0x 0.0x
(=) Enterprise Value (EV) 304.0
Implied multiples
4. Valuation:b. Actualization models: 2. DDM (2/3)

|142
From Business Planning to Financial Modelling and Valuation
• If the DDM value may be compared to the price of the asset– If the DDM value is higher, this asset will be considered as
undervalued. This gives a rational reason to buy the asset
– A contrario, the company will be considered as overvalued. It will be justified to avoid an acquisition or will give a rational reason to sell the shares
4. Valuation:b. Actualization models : 2. DDM (3/3)
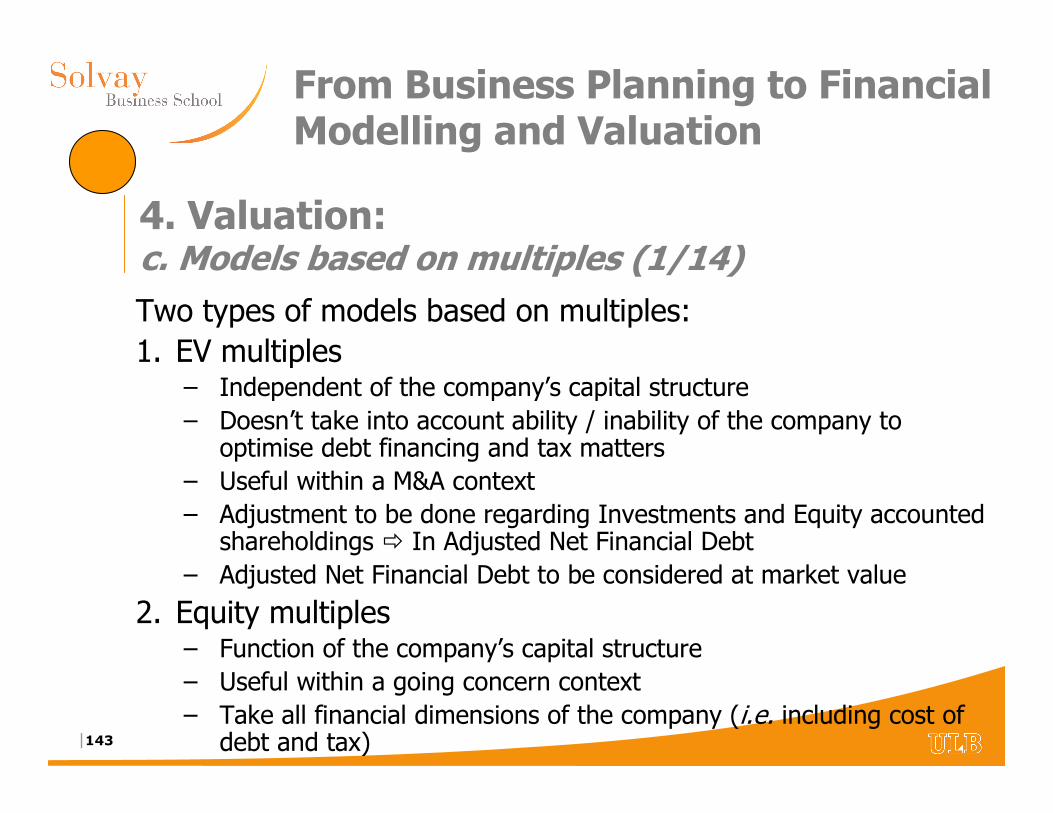
|143
From Business Planning to Financial Modelling and Valuation
4. Valuation:c. Models based on multiples (1/14)Two types of models based on multiples:
1. EV multiples– Independent of the company’s capital structure
– Doesn’t take into account ability / inability of the company to optimise debt financing and tax matters
– Useful within a M&A context
– Adjustment to be done regarding Investments and Equity accountedshareholdings � In Adjusted Net Financial Debt
– Adjusted Net Financial Debt to be considered at market value
2. Equity multiples– Function of the company’s capital structure
– Useful within a going concern context
– Take all financial dimensions of the company (i.e. including cost of debt and tax)
|144
From Business Planning to Financial Modelling and Valuation
4. Valuation:c. Models based on multiples (2/14)
• In both cases, need to use normalized financial data in the numerator of the ratios
– Extraordinary items excluded (cf. supra)
– Proforma financials if acquisition / disposal of (material) assets
– If possible for both the company and the peers
• In both cases, need to consider averages or medians
– Listed peers t-1, t, t+1 and t+2 data
– Last twelve months data (LTM) are also usually considered
– Average / median of several ratios
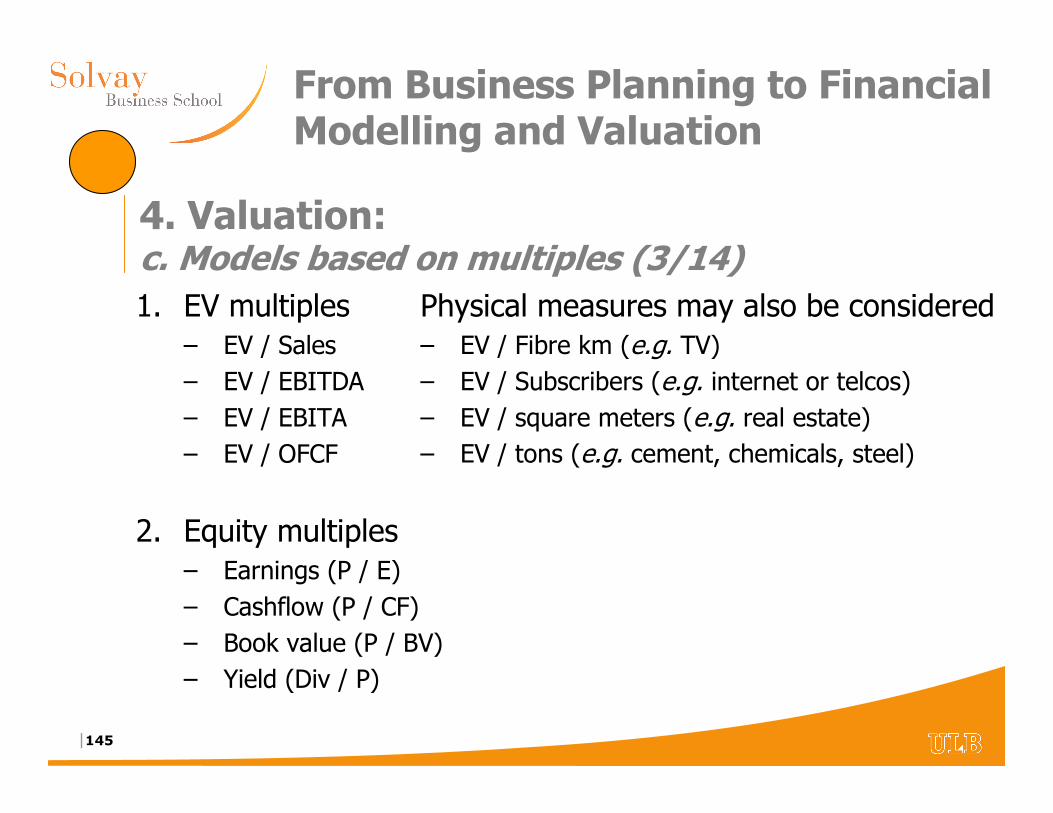
|145
From Business Planning to Financial Modelling and Valuation
1. EV multiples– EV / Sales
– EV / EBITDA
– EV / EBITA
– EV / OFCF
2. Equity multiples– Earnings (P / E)
– Cashflow (P / CF)
– Book value (P / BV)
– Yield (Div / P)
4. Valuation:c. Models based on multiples (3/14)
Physical measures may also be considered– EV / Fibre km (e.g. TV)
– EV / Subscribers (e.g. internet or telcos)
– EV / square meters (e.g. real estate)
– EV / tons (e.g. cement, chemicals, steel)
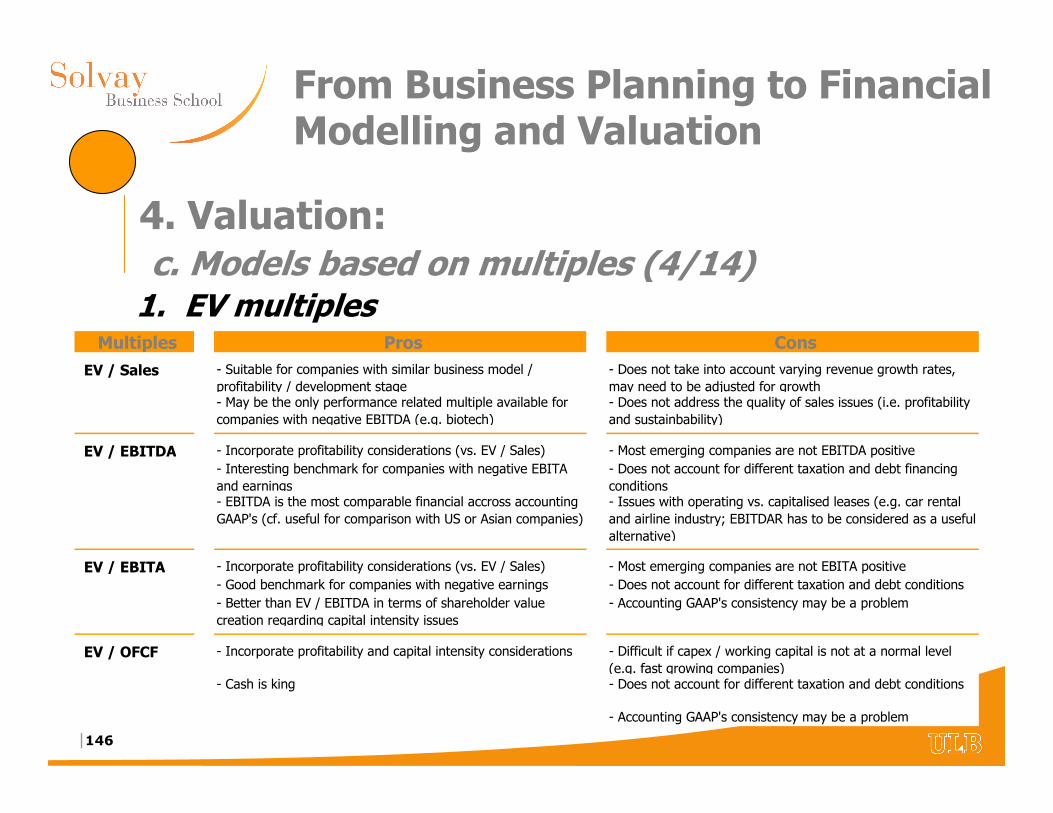
|146
From Business Planning to Financial Modelling and Valuation
4. Valuation:c. Models based on multiples (4/14)
1. EV multiples Multiples Pros Cons
EV / Sales - Suitable for companies with similar business model /
profitability / development stage
- Does not take into account varying revenue growth rates,
may need to be adjusted for growth- May be the only performance related multiple available for
companies with negative EBITDA (e.g. biotech)
- Does not address the quality of sales issues (i.e. profitability
and sustainbability)
EV / EBITDA - Incorporate profitability considerations (vs. EV / Sales) - Most emerging companies are not EBITDA positive
- Interesting benchmark for companies with negative EBITA
and earnings
- Does not account for different taxation and debt financing
conditions- EBITDA is the most comparable financial accross accounting
GAAP's (cf. useful for comparison with US or Asian companies)
- Issues with operating vs. capitalised leases (e.g. car rental
and airline industry; EBITDAR has to be considered as a useful
alternative)
EV / EBITA - Incorporate profitability considerations (vs. EV / Sales) - Most emerging companies are not EBITA positive
- Good benchmark for companies with negative earnings - Does not account for different taxation and debt conditions
- Better than EV / EBITDA in terms of shareholder value
creation regarding capital intensity issues
- Accounting GAAP's consistency may be a problem
EV / OFCF - Incorporate profitability and capital intensity considerations - Difficult if capex / working capital is not at a normal level
(e.g. fast growing companies)- Cash is king - Does not account for different taxation and debt conditions
- Accounting GAAP's consistency may be a problem
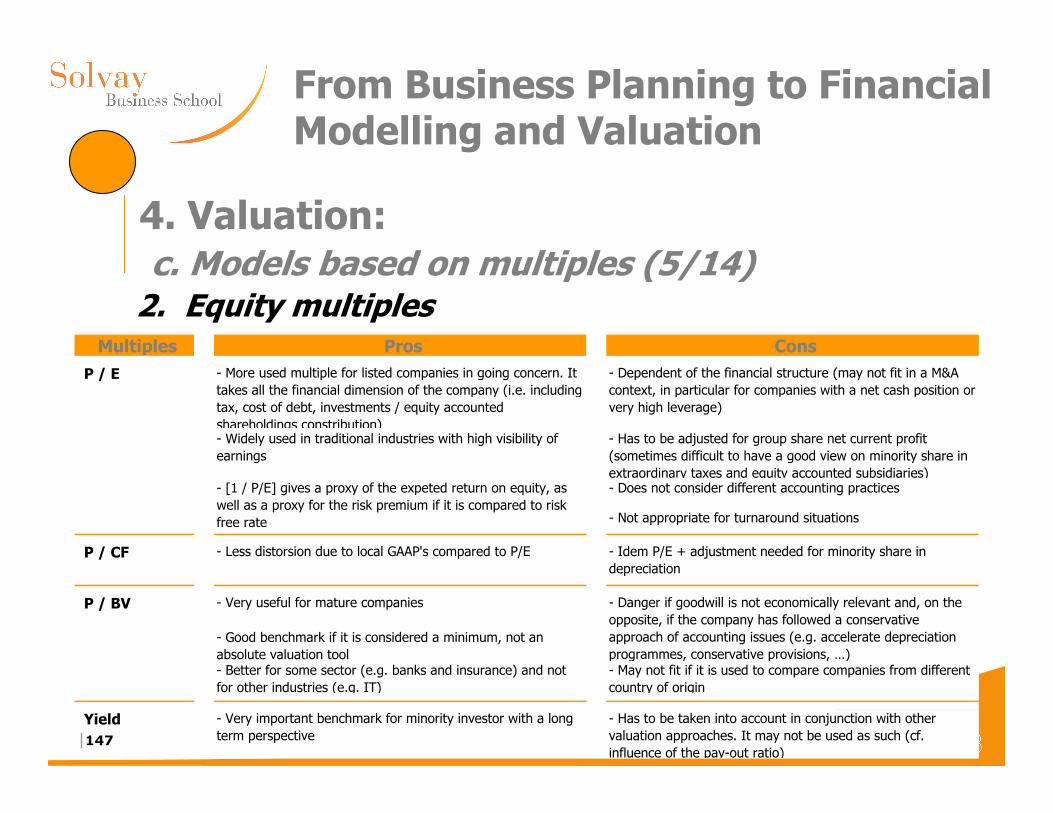
|147
From Business Planning to Financial Modelling and Valuation
4. Valuation:c. Models based on multiples (5/14)
2. Equity multiples Multiples Pros Cons
P / E - More used multiple for listed companies in going concern. It
takes all the financial dimension of the company (i.e. including
tax, cost of debt, investments / equity accounted
shareholdings constribution)
- Dependent of the financial structure (may not fit in a M&A
context, in particular for companies with a net cash position or
very high leverage)
- Widely used in traditional industries with high visibility of
earnings
- Has to be adjusted for group share net current profit
(sometimes difficult to have a good view on minority share in
extraordinary taxes and equity accounted subsidiaries)- Does not consider different accounting practices
- Not appropriate for turnaround situations
P / CF - Less distorsion due to local GAAP's compared to P/E - Idem P/E + adjustment needed for minority share in
depreciation
P / BV - Very useful for mature companies
- Good benchmark if it is considered a minimum, not an
absolute valuation tool- Better for some sector (e.g. banks and insurance) and not
for other industries (e.g. IT)
- May not fit if it is used to compare companies from different
country of origin
Yield - Very important benchmark for minority investor with a long
term perspective
- Has to be taken into account in conjunction with other
valuation approaches. It may not be used as such (cf.
influence of the pay-out ratio)
- Danger if goodwill is not economically relevant and, on the
opposite, if the company has followed a conservative
approach of accounting issues (e.g. accelerate depreciation
programmes, conservative provisions, …)
- [1 / P/E] gives a proxy of the expeted return on equity, as
well as a proxy for the risk premium if it is compared to risk
free rate
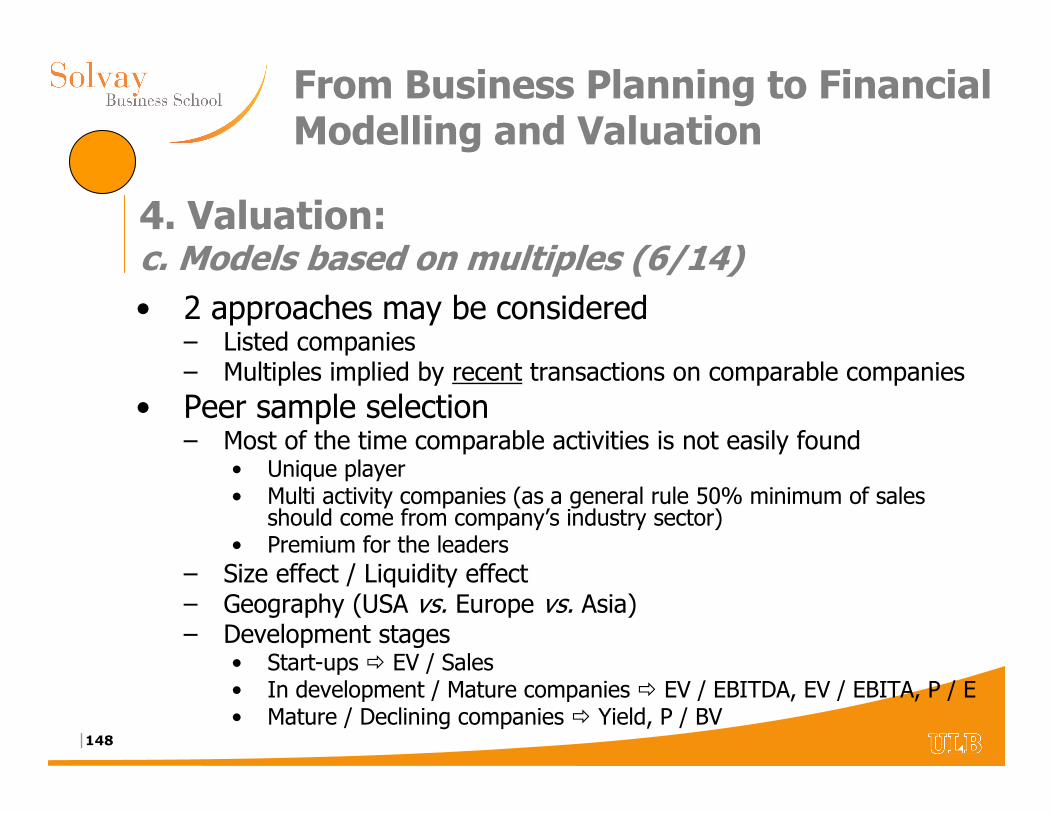
|148
From Business Planning to Financial Modelling and Valuation
• 2 approaches may be considered– Listed companies– Multiples implied by recent transactions on comparable companies
• Peer sample selection– Most of the time comparable activities is not easily found
• Unique player• Multi activity companies (as a general rule 50% minimum of sales
should come from company’s industry sector)• Premium for the leaders
– Size effect / Liquidity effect– Geography (USA vs. Europe vs. Asia)– Development stages
• Start-ups � EV / Sales• In development / Mature companies � EV / EBITDA, EV / EBITA, P / E• Mature / Declining companies � Yield, P / BV
4. Valuation:c. Models based on multiples (6/14)
|149
From Business Planning to Financial Modelling and Valuation
• Dangers– Sample vs. company’s specificities (growth / margins / industrial
characteristics)
– Data availability / quality in particular for prospective data
– Be careful with conglomerates (Sum-of-the-part / NAV approach is better)
– For precedent transactions, be careful of turnaround situations and hidden impact of synergies
– Relative valuation method, not an absolute one
� Good double check
4. Valuation:c. Models based on multiples (7/14)
|150
From Business Planning to Financial Modelling and Valuation
4. Valuation:c. Models based on multiples (8/14)In practice:• Step 1: Build a sample of companies which are
comparable in their operations, financial conditions and ownership to the company you aim to assess the value– Exclude companies with abnormal trading (e.g. M&A situations,
limited liquidity)
– Exclude companies with significant Investments or Equity accounted shareholdings
– Recent transaction must be consistent with research projections
• Step 2: Calculate a set of multiples for the identified peers
• Step 3: Assess which multiples make most sense for the underlying sector
|151
From Business Planning to Financial Modelling and Valuation
4. Valuation:c. Models based on multiples (9/14)In practice (…):• Step 4: Assess the difference in stage of development,
growth prospects, profitability
• Step 5: Apply the relevant multiples to the target company’s financials, with a view to arrive at an implied EV and equity
• Step 6: Check if other considerations have to be taken into account– Illiquidity discount
– Profitability / growth premium or discount
– IPO discount
– Control premium / Minority discount
– etc
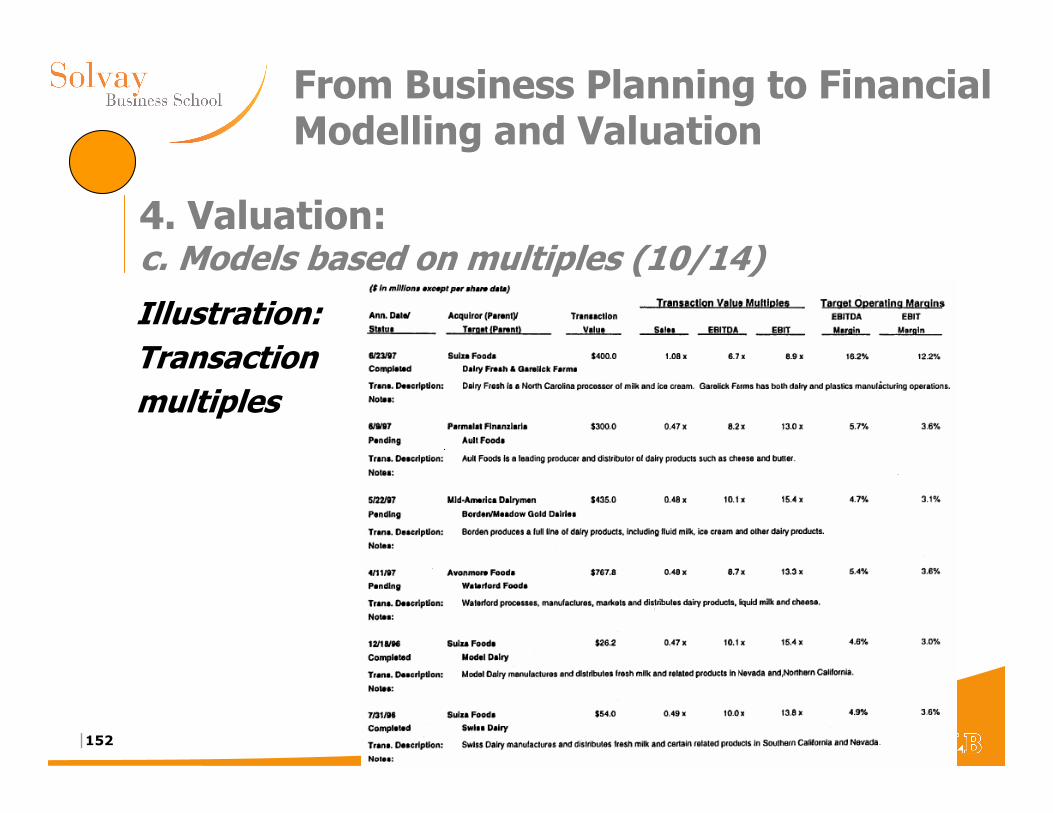
|152
From Business Planning to Financial Modelling and Valuation
4. Valuation:c. Models based on multiples (10/14)
Illustration: Transactionmultiples
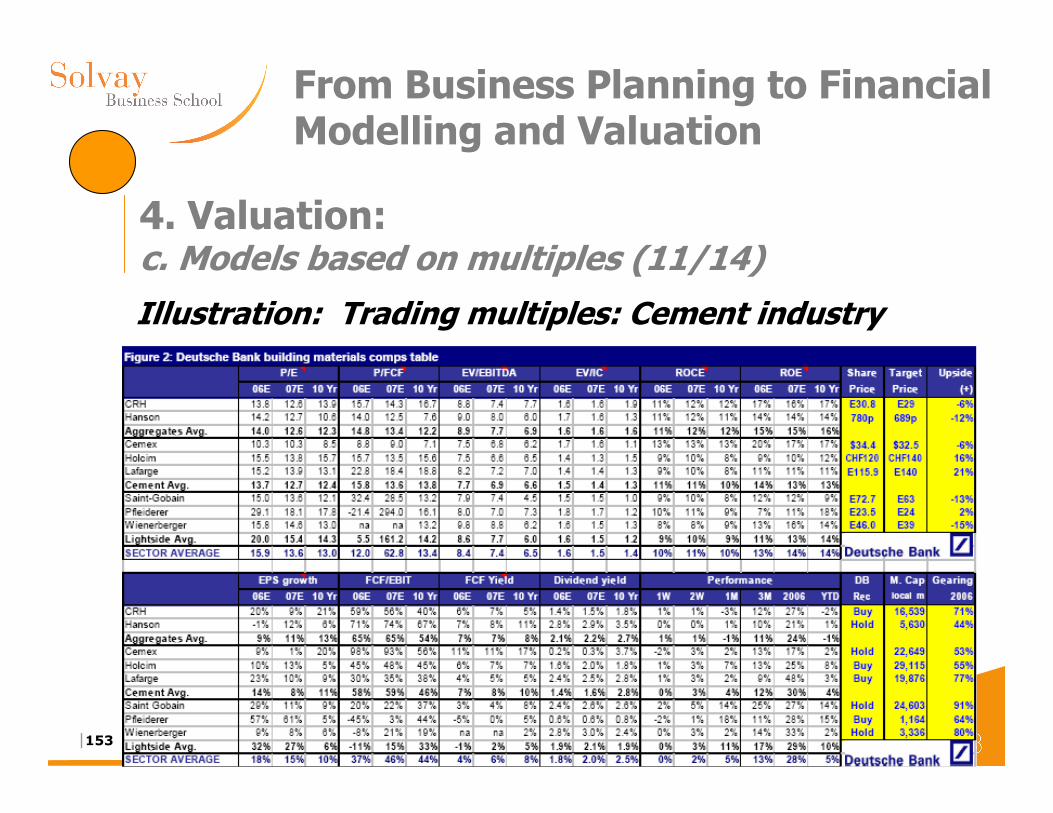
|153
From Business Planning to Financial Modelling and Valuation
4. Valuation:c. Models based on multiples (11/14)
Illustration: Trading multiples: Cement industry
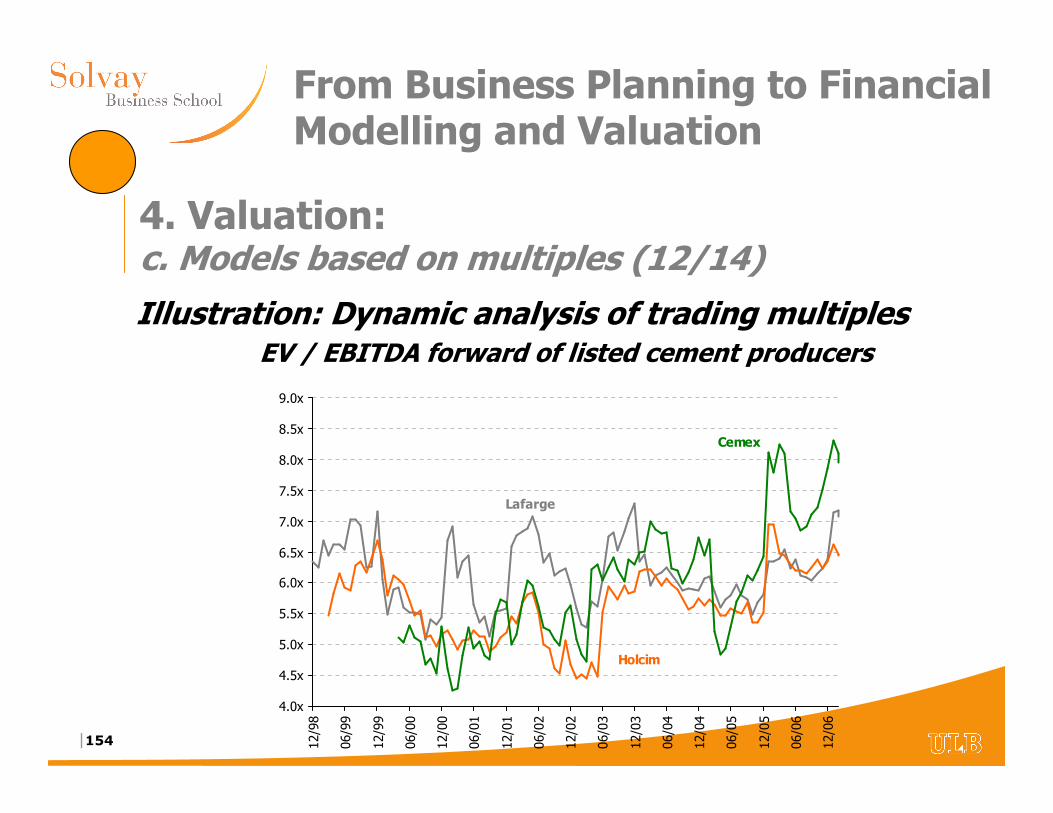
|154
From Business Planning to Financial Modelling and Valuation
4. Valuation:c. Models based on multiples (12/14)
Illustration: Dynamic analysis of trading multiplesEV / EBITDA forward of listed cement producers
4.0x
4.5x
5.0x
5.5x
6.0x
6.5x
7.0x
7.5x
8.0x
8.5x
9.0x
12/98
06/99
12/99
06/00
12/00
06/01
12/01
06/02
12/02
06/03
12/03
06/04
12/04
06/05
12/05
06/06
12/06
Cemex
Holcim
Lafarge
|155
From Business Planning to Financial Modelling and Valuation
• If the company you have to analyse is listed, its multiples may be compared to other comparable quoted companies (or to transaction multiples)– If multiples are higher than average, it can imply an overvaluation.
Alternatively, it can be justified by better perspectives of profit growth than the sample’s average
– If there is no difference in terms of profit growth perspectives, if the multiples are higher than average, the company will be considered overvalued (i.e. justification to sell the shares). A contrario, if the multiples are lower than average, the company will be considered undervalued (i.e. justification to buy the shares)
4. Valuation:c. Models based on multiples (13/14)
|156
From Business Planning to Financial Modelling and Valuation
• If the company you have to analyse is not listed, the multiples observed for comparable companies which are listed (or transaction multiples) may be used to estimate the value of the company
• Example:– If you have the EBITDA2006 of the company and you have
calculated the average EV / EBITDA2006 observed for the comparable listed peers
– The estimated value may be derived as:
[EBITDA company 2006 x EV / EBITDA comparable 2006] – NFD company 31/12/2006
4. Valuation:c. Models based on multiples (14/14)
|157
From Business Planning to Financial Modelling and Valuation
1. Valuation based on IRR / LBO models (1/5)• Required IRR + Business plan + Ex-ante exit multiple =
Implied equity value
• Frequently used by private equity buyers in case of LBO (Leverage-Buy-Out transactions) / venture capital
• Need to adjust required IRR to the risk associated to the financial structure
• Need to be close to the debt market to assess adequately the financial debt a company may bear– Depends on company, industry and market prospects
– May change over time (sometimes very fast)
4. Valuation:d. Other valuation methodologies
|158
From Business Planning to Financial Modelling and Valuation
1. Valuation based on IRR / LBO models (2/5)In practice:• Step 1: Build your financial plan considering the existing
financial structure
• Step 2: Assess the maximum financial leverage a bank is ready to grant you to acquire the company
• Step 3: On this basis, determine the optimal ‘Sources and uses’ your are ready to consider for a transaction– Total consideration (TC) has to take into account transaction costs
on top of price for the equity and existing NFD
– Equity determined as the minimum requested by the financing bank(i.e. from 20 to 30% of the TC)
4. Valuation:d. Other valuation methodologies
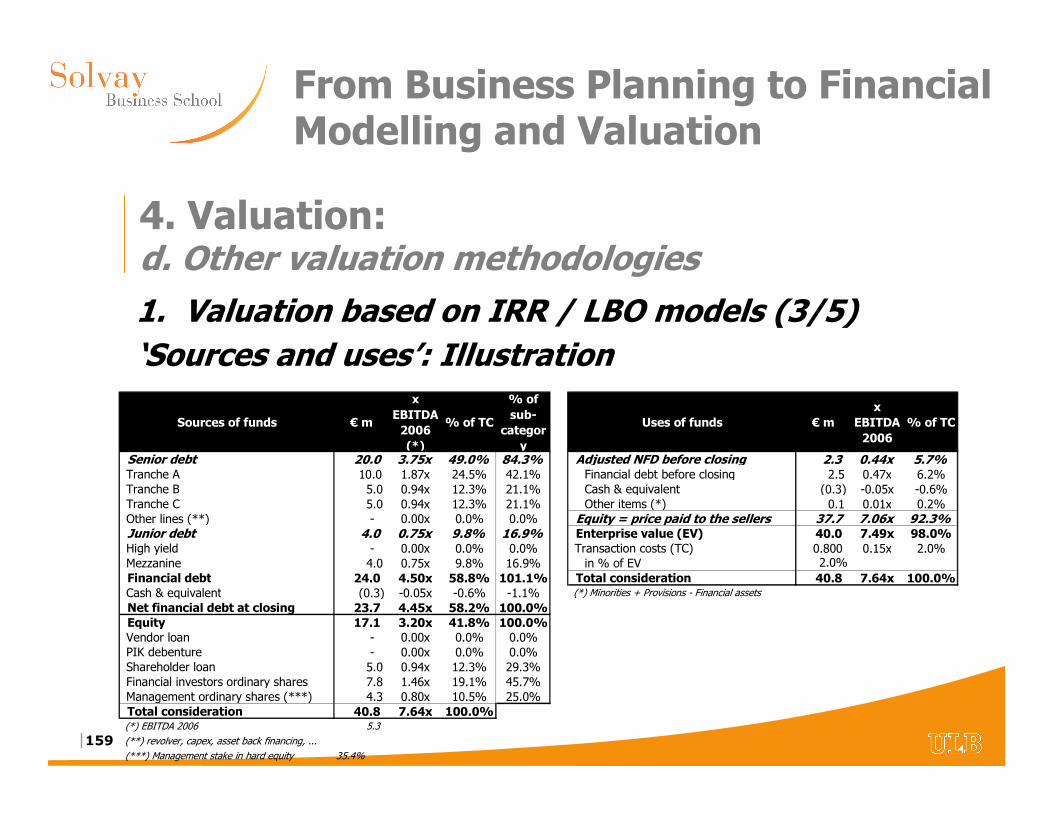
|159
From Business Planning to Financial Modelling and Valuation
1. Valuation based on IRR / LBO models (3/5)‘Sources and uses’: Illustration
4. Valuation:d. Other valuation methodologies
Sources of funds € m
x EBITDA 2006 (*)
% of TC
% of sub-
category
Uses of funds € mx
EBITDA 2006
% of TC
Senior debt 20.0 3.75x 49.0% 84.3% Adjusted NFD before closing 2.3 0.44x 5.7%Tranche A 10.0 1.87x 24.5% 42.1% Financial debt before closing 2.5 0.47x 6.2%Tranche B 5.0 0.94x 12.3% 21.1% Cash & equivalent (0.3) -0.05x -0.6%Tranche C 5.0 0.94x 12.3% 21.1% Other items (*) 0.1 0.01x 0.2%Other lines (**) - 0.00x 0.0% 0.0% Equity = price paid to the sellers 37.7 7.06x 92.3%Junior debt 4.0 0.75x 9.8% 16.9% Enterprise value (EV) 40.0 7.49x 98.0%High yield - 0.00x 0.0% 0.0% Transaction costs (TC) 0.800 0.15x 2.0%Mezzanine 4.0 0.75x 9.8% 16.9% in % of EV 2.0%
Financial debt 24.0 4.50x 58.8% 101.1% Total consideration 40.8 7.64x 100.0%Cash & equivalent (0.3) -0.05x -0.6% -1.1% (*) Minorities + Provisions - Financial assets
Net financial debt at closing 23.7 4.45x 58.2% 100.0%Equity 17.1 3.20x 41.8% 100.0%Vendor loan - 0.00x 0.0% 0.0%PIK debenture - 0.00x 0.0% 0.0%Shareholder loan 5.0 0.94x 12.3% 29.3%Financial investors ordinary shares 7.8 1.46x 19.1% 45.7%Management ordinary shares (***) 4.3 0.80x 10.5% 25.0%Total consideration 40.8 7.64x 100.0%(*) EBITDA 2006 5.3
(**) revolver, capex, asset back financing, ...
(***) Management stake in hard equity 35.4%
|160
From Business Planning to Financial Modelling and Valuation
1. Valuation based on IRR / LBO models (4/5)In practice:• Step 4: Adjust your financial plan for the new financial
structure assumptions
• Step 5: Determine the entry for which a satisfactory IRR may be reached– Minimum IRR for leverage transaction >20% (cf. remuneration of
additional risks)
– Need to assume realistic exit multiples
• Entry multiple = benchmark
• Sensitivity analysis are conservatism are key
4. Valuation:d. Other valuation methodologies
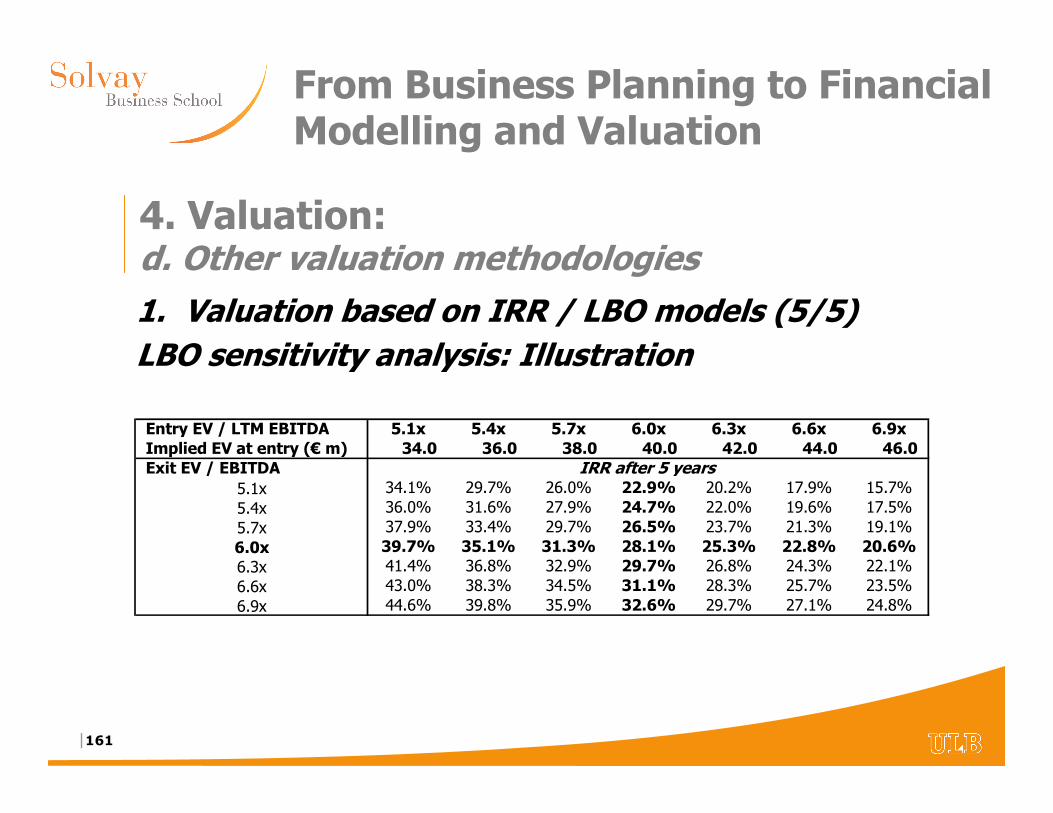
|161
From Business Planning to Financial Modelling and Valuation
1. Valuation based on IRR / LBO models (5/5)LBO sensitivity analysis: Illustration
4. Valuation:d. Other valuation methodologies
Entry EV / LTM EBITDA 5.1x 5.4x 5.7x 6.0x 6.3x 6.6x 6.9xImplied EV at entry (€ m) 34.0 36.0 38.0 40.0 42.0 44.0 46.0 Exit EV / EBITDA
5.1x 34.1% 29.7% 26.0% 22.9% 20.2% 17.9% 15.7%
5.4x 36.0% 31.6% 27.9% 24.7% 22.0% 19.6% 17.5%
5.7x 37.9% 33.4% 29.7% 26.5% 23.7% 21.3% 19.1%
6.0x 39.7% 35.1% 31.3% 28.1% 25.3% 22.8% 20.6%6.3x 41.4% 36.8% 32.9% 29.7% 26.8% 24.3% 22.1%
6.6x 43.0% 38.3% 34.5% 31.1% 28.3% 25.7% 23.5%
6.9x 44.6% 39.8% 35.9% 32.6% 29.7% 27.1% 24.8%
IRR after 5 years
|162
From Business Planning to Financial Modelling and Valuation
2. Sum-of-the-parts / Net asset value (1/4)• Useful valuation tool for conglomerates with diversified
activities, holding companies or real estate companies
• Necessary if there are significant minorities or joint-venture
• Need to assess the appropriate discount / premium depending on objective and subjective parameters– Overheads due / profit generate by the holding activities
– Corporate governance issues
– Ability to create above benchmarks value by systematic portfolioarbitrage
– Market benchmarks
• Also used in liquidation context
4. Valuation:d. Other valuation methodologies
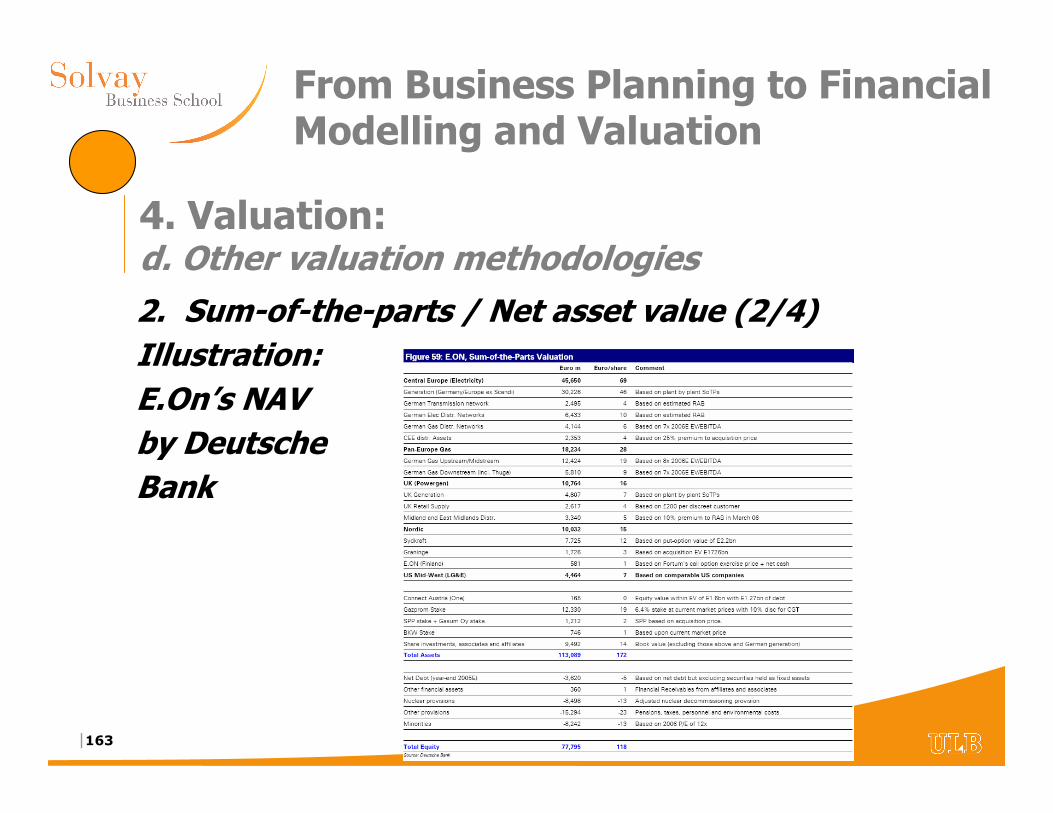
|163
From Business Planning to Financial Modelling and Valuation
2. Sum-of-the-parts / Net asset value (2/4)Illustration: E.On’s NAV by DeutscheBank
4. Valuation:d. Other valuation methodologies
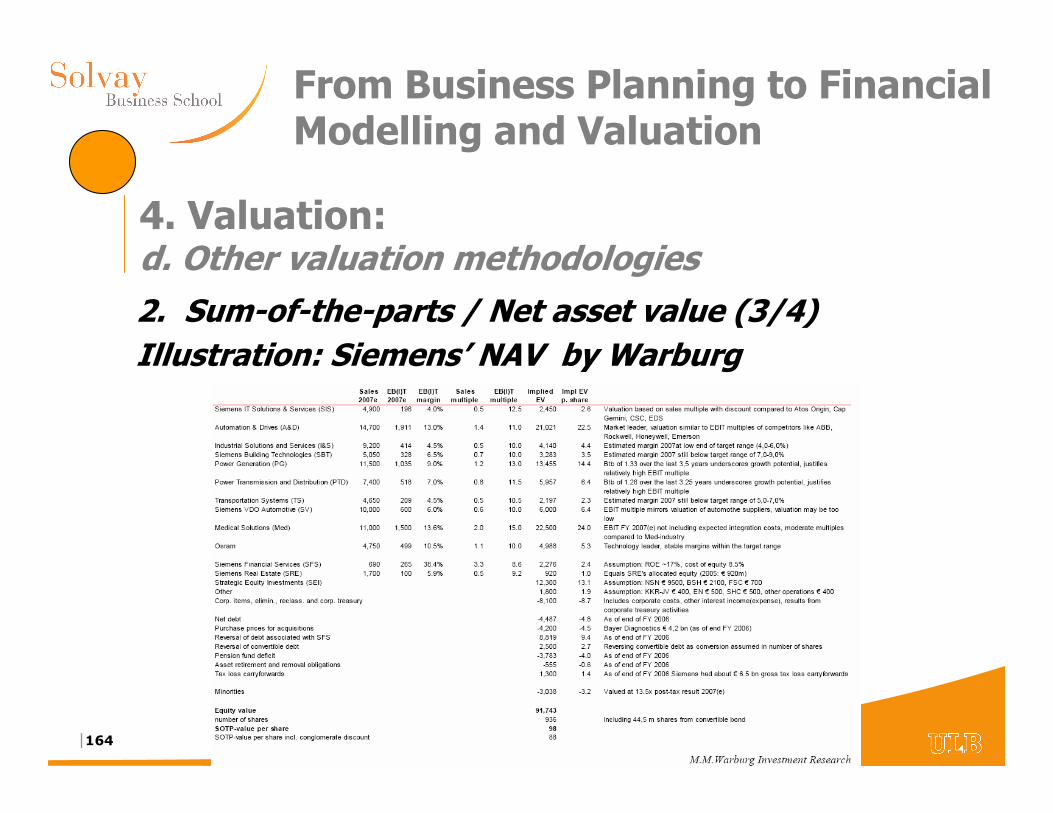
|164
From Business Planning to Financial Modelling and Valuation
2. Sum-of-the-parts / Net asset value (3/4)Illustration: Siemens’ NAV by Warburg
4. Valuation:d. Other valuation methodologies
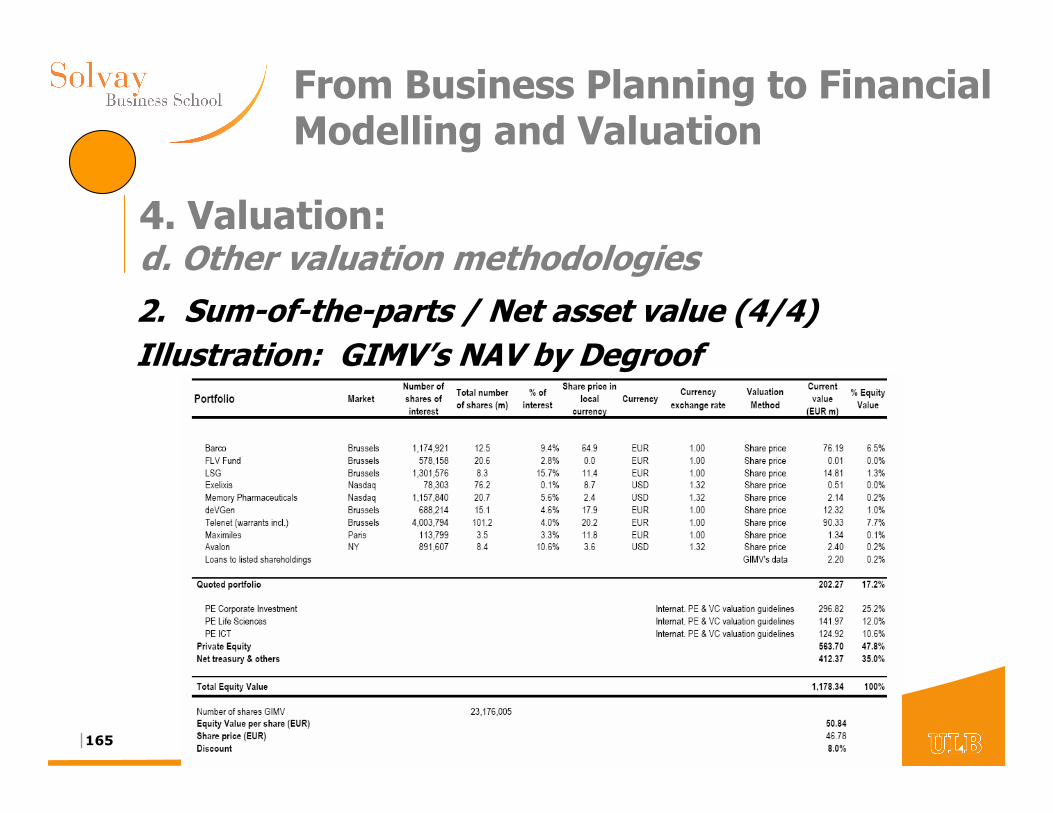
|165
From Business Planning to Financial Modelling and Valuation
2. Sum-of-the-parts / Net asset value (4/4)Illustration: GIMV’s NAV by Degroof
4. Valuation:d. Other valuation methodologies
|166
From Business Planning to Financial Modelling and Valuation
3. Pay-back• Number of years to pay-back the initial investment
• Doesn’t take into account the cost of opportunity
• Initially used in the context of an investment decision (e.g.capex approval procedure). Also applicable for an equity investment in a company
• Useful to assess the risk associated to an investment. To be used as a double check rather than the ultimate tool to assess the value of a company
4. Valuation:d. Other valuation methodologies
|167
From Business Planning to Financial Modelling and Valuation
5. Appendices
|168
From Business Planning to Financial Modelling and Valuation
5. Appendicesa. Bibliography• “Valuation / Measuring and Managing the Value of Companies”, Tim
Koller, Marc Goedahart and David Wessels, McKinsey & Company (fourth edition)
• “Principles of Corporate Finance”, Richard Brealey and Stewart Myers, McGraw Hill (fourth edition)
• “Corporate Turnaround / Managing companies in distress”, Stuart Slatter and David Lovett, Pinguin
• “Financial Buy-outs / Value drivers, deal structuring, financial instruments and funds”, Hugues Lamon, Larcier
• “Finance”, Michel Levasseur and Aimable Quintart, Economica(second edition)
• “Financial Management / Method and Meaning”, Anthony G. Puxtyand J. Colin Dodds, Chapman & Hall (second edition)
• “Management of Company Finance”, J.M. Samuels, F.M. Wilkes and R.E. Brayshaw, Chapman & Hall (fifth edition)
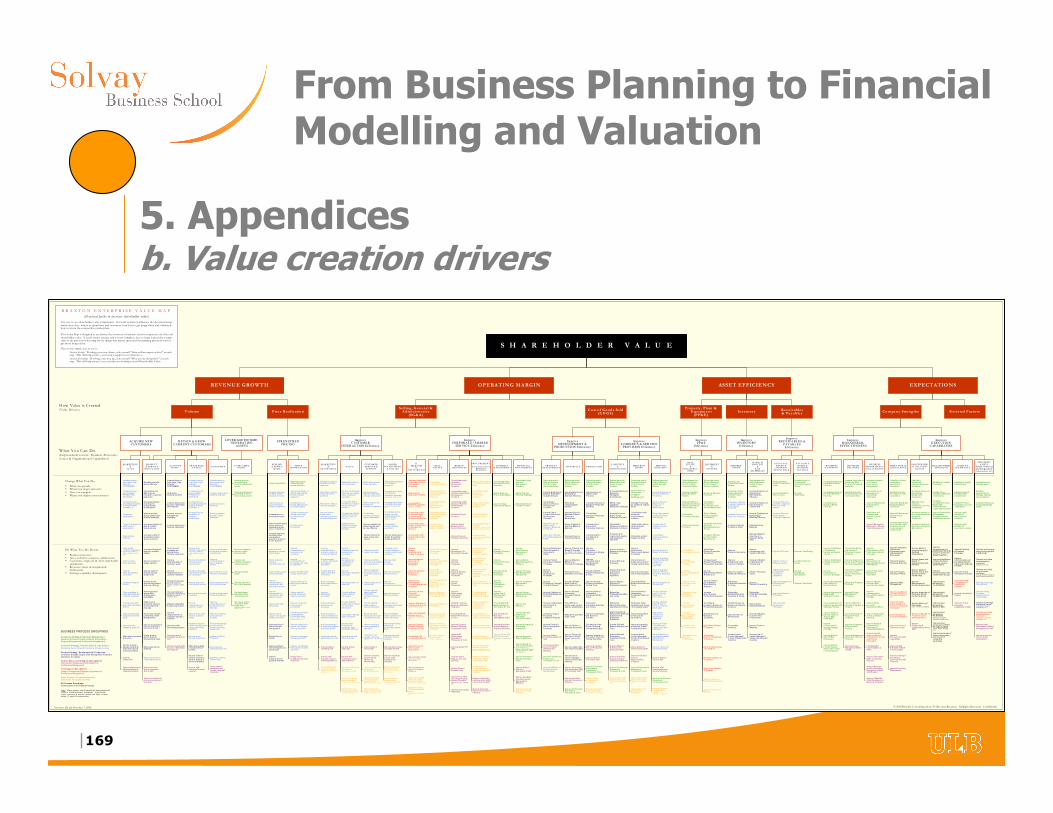
|169
From Business Planning to Financial Modelling and Valuation
5. Appendicesb. Value creation drivers
M A R KE T IN G
&
SA LE S
A C C O U N TM GM T .
C R O S S-S ELL/U P- SELL
R ET EN TIO N
D E M AN D
& SU P PLY
MG M T.
PR IC EOPTI M I ZA TI O N
M A R K E TIN G
&
AD V ER T ISI N G
Vo lume Pric e R ea liz a tio n
REVENUE GROWTH
SA LE S
C U ST OM ER
SE R V I C E &
SUP PO R T
O R D ER
FU L FIL L M E NT
& B I LLI N G
IT,
TELE C OM&
N ET W OR K IN G
R EA LE ST AT E
H U M A NR E S O UR C ES
PR OC U R E M E N T
(E xc lu di ng P ro du ct io nMa teria ls &
Mer ch an di se )
B U S INE S SM AN A G EM EN T
FI N A NC I A LM A N A GE M E N T
Se lling, Genera l &Adm inistrat ive
(SG&A)
M A T E R IA L S P R O D UC TI ONM E R C H A N-
D IS IN G
L OG IS TIC S
&
D I STR I B U TIO N
PR OD U C TDE V ELO PM EN T
C o st o f Goods So ld(COGS)
OPERATING MARGIN
R EA LES T AT E
&
I NFR A ST R U C -TU R E
EQ U I PM EN T
&
SYS TEM S
FI N IS H EDG OO D S
W OR K INPR O C ESS
&
R A WM A TE R I ALS
Prope rty , Plant &Equi pmen t(PP&E )
Inventor y Receivab les& Payable s
A C C O U N TS,
N OT ES &IN TER E ST
R EC EI V A B L E
A C C O U NT S,
N O TES &INT ER EST
PAY A B L E
ASSET EFFICIENCY
S H A R E H O L D E R V A L U E
B U S INE S SP L AN N I N G
PR O G R AMD ELI V ER Y
B U SI N ESS
PER FOR MA NC E
M A N AG EM EN T
O PER A TI O N A LE XC E LLE NC E
PA R TN E R SH IP
& C O LLA B O-
R A TI O N
R E LA TIO N SH IPSTR EN GT H
AG I L I TY &FLE XIB I LIT Y
Company Streng ths External Fac to rs
EXPECTATIONS
Focus sales staff &advertis ing on high erma rgin produc ts/ser vices
Incr ease u se o f low er-cost sales ch ann els(tele sa les, ou tle ts, se lf -serv ice , e tc. )
Imp rove sa lesfor ecasting &camp aign mgm t.p ro cesses a nd to ols
Imp roverel a tion sh ip/ac co untdevelop men tp ro cesses
Imp rove skills ofsales staff
P ro vide staff withbe tter custome rinfo rma tio n
Imp rove sta ffincen tives ar oun dsales e ffic iency
Imp rovelea d ge ne ra tio n,qua lifica tion &assignmen tp ro cesses
Imp rovefield sa les & te lesa lesp ro cesses
Conso lida te / Re alignS ales T err ito ries
Imp rove a dver tis ing &sales fo cu s on high er-value custome rs/seg men ts
Imp rove te rms withsales ch ann els
Imp rove te rms withser vice provider s(n etwo rk s vcs ., airline s, e tc. )
Imp rove te rms onlea se d sales a ssets(com pu te rs, v eh icle s, etc .)
T ar get ne wg eog ra ph ie s
T ar get ne w se gme ntswithin c urr entg eog ra ph ie s
Expa nd sa leschanne ls
De ve lo p an d/oracqu ir e n ew p roduct& se rvice o ffe r in gs
Pu rsue jo in t ven tu re /pa rtne rsh ip / OE Mar rang eme nts
Inc reas e focus o nh ig h- va lue / high -p oten ti a lCUSTOMERS
Inc reas e focus o nmo st pr ofitablePRODU CTS &SE RVICE S
Inc reas e focus o nmo st effective SA LES& A DVERTISINGCHANN ELS
Impro ve b randstr ength & goo d will
Inc reas e time sp en tse llin g
Imp ro ve qua lity anda ssig nme nt of sa le slea ds
Pr ovide sa les sta ffwith b etter in fo rmat io n& too ls
Imp ro vese llin g skills
Imp ro ve a lig nme nt ofsta ff inc en tives w ithstr a teg ic o bjec tives
Impro vesa les & mar ke tingp ro ce sses
T ailor m ar ke ting &sa les app ro ache s tocusto mer segments
Offer tailor ed p ro ducts& ser vi ces
Ev olve pr odu ct /se rvice fe atur es,functiona lity & valu e
Impro ve tota lcusto mer expe rien ce(pu rch as in g, fu lf illm en t,u sa ge , s u pp ort , serv ice ,e tc . )
Increase focus o nhi gh- va lue / high -po ten tialCUSTOMERS
Impro ver espo nsiven ess tocusto mer feed ba ck
Impro veun de rstan ding o fcusto mer ne eds
Pr oactive l y ma nag etra nsitio n po in ts(en ds of c on tra cts , le as es ,e tc . )
Ta ilo r accou ntmana gem entap pr oa ch es tocusto mer segments
Ma in ta in comp etitivefunction ality & va lu e
T ailor cr oss/up -saleo ffe rs to cu stomern eeds
Imp leme nt volu me-a nd /o r b read th -b asedp ricing a nd a ffinityp rog ram s
Offe r value -a dd in gp roduct & se rviceb und les
Imp ro ve cros s/up -sel lp roce sses
Imp leme nt p roac tivea nd r eactive cr oss/up -sell ca mpa ig ns
Imp ro ve staffin ce ntives fo r cross/u p-sa les
Imp ro ve iden tifica tiono f cr oss/up -saleo ppo rtun ities
In cr ea se focus onh igh- value / high -p oten tia lCUSTOME RS
In cr ea se focus onm ost p ro fitab leP RODUCTS/S ERV IC ES
In cr ea se focus onm ost e ffective S ALE S& ADVE RTISINGCHANNEL S
Improv e re ten tio n an dwin- ba ck p rocesses
Bu ild c usto mersa tisfac tion andre tention in to staffinc entives
Improv eun der stand ing ofch urn /de fe ctiondr ive rs
Improv ed ID o f chur n /de fection c and ida tes
Inc reas e fo cus o nhigh -va lue / h ig h-po tenti alCUS TOMERS
Improv eco mpe titive ness o fpr od uct & s erviceofferings
Shor ten tim e tomar ket
Impr ove bran dawar ene ss / e leva tebr an d imag e
Impr ove deve lo pme ntan d pr otection o fintell ectu al ca pital(pa te nts , c o pyrig hts , e tc. )
Obta in exclusivelicen se s,distri bu to rships, e tc.
Impr ove prod uct/se rvi ce fe atu res andfunct io na lity
Impr ovepr od uct / se rvicequ ality & re lia bilit y
Impr ove prod uct /se rvi ce li fecycleman ag eme nt
Impr ovecommun ica ti on/coor dina tion withdistri bu tion cente rs
Impr ovecommun ica ti on/coor dina tion withsa les cha nne ls
Imp rove focus o nhig her va luecusto mer s, p rod ucts/se r vice s & c han ne ls
Ra tio nalize / r efocuschanne l str ate gies
Ra tio nalize / r efocuspr od uct & se rvicepo rtfolios
Ra tio nalize / r efocustar ge te d custo mersegmen ts
Im pr ove ca mpa ig n /ch ann el manag eme ntprocesses & tools
Im pr ove skills o fmar ke ting sta ff
Im pr ove staffin ce ntive s a rou ndmar ke ting e fficiency
Im pr ove marke t /cu stome r info rma tio n& ana lytica lprocesses
Im pr ove pr od uct/se rvice spe cifica tionprocesses
Im pr ove pr od uct /se rvice lau nchprocesses
Pr ovide sta ff withbetter compe titivein formation
Im pr oveadver tisingprocesses
Im pr ove te rms withadver tising cha nn els
Im pr ove te rms withse rvice p ro vide rs(re se arc he rs, inform at ionse rvices, e tc. )
Imp r ove emp has is onp roduct qu ality an dser vice e fficie ncy
De sign prod ucts fo reas e-of -use / se lf-service
Ro ute low -valuetransactions to lo wer -cost sales ch ann els
Imp rove r ou tin g ofservice requ ests torigh t sta ff
Incr ease us e o fche ape r cha nne ls( con t ac t c e nt er s, I VR , f ield sa le s,w eb et c . )
Imp rove p er formanceassessme ntp ro cesses & too ls
Imp rove w o rkfor cep lann in g an d dispatchp ro cesses & too ls
Imp rove cap acity/demand p la nn in gp ro cesses, skills andtoo l s
Imp rove ser vice &sup port process es
Imp rove skills ofservice staff
Pr o vide staff w ithbetter customerinfo rma tio n(pr ofiles , his torie s,e tc.)
Imp rove inc en tivesa ro und se rv icee fficienc y &e ffe ctive ness
Imp rove terms withservice prov ider s(ne tw o rk s ervic e s,o uts ou rc e d fun ct io ns , e tc. )
Imp rove terms onlease d se rv ice a ssets(com pu te rs, ve h icles , etc.)
Imp ro ve forecasting ,p la nn in g &p rior itiz ation skills &too ls
Imp ro ve cre dita nalysisp ro ce ss es
Impro ve skil ls of orde rma na gem ent sta ff
P rovide staf f w ithb ette r c ustome r an do rd er in fo rm ation
Impro ve incen tiv esa ro und orde rma na gem ente fficie ncy
Impro ve p ick / pa ck /ship processes
Impro vep ro visio ning /installation p ro cesses
Impro ve invoicin g /b il l i ng p roce sses
Impro ve retu rn sma na gem ent po lic ies& p roce sses
Impro ve terms withser vice pr ovider s( d eliv er y se rv ices , ou t so ur ce d
f u nc t ion s, e tc . )
Imp ro ve terms onlea sed asse ts(c omp u te rs, ve hic les , etc .)
Co nsol ida te / Re -arc hitect Da ta S tor es
Incre ase Util ization o fIT/Ne twor k Re so ur ces(Se r ve rs, Ro ute rs etc .)
Impr ove C apacity/De man d P lan ningPr oces se s & T ools
Impr oveDe sign ,De ve lopment &Testing Proce ss es
Impr ove Ops. /Ma in tena nce /Ch an ge Ma na gem entPr oces se s
Impr ove E nd Us erSu pp or t &Ad mini str ationPr oces se s
Impr ove S elect io n,Acqu isition &Co ntr actingPr oces se s
Impr ove Installa tion /De ploymen tPr oces se s
Impr ove S kills of S taff(Te c hn ica l & Proje ctMa n ag em en t)
Impr ove/C onsolida teMa nageria l In fo.(Ut iliza t ion , Performa nce ,
e tc . )
Impr ove Inc en tivesAr ou nd IT /N etwo rkEffi cien cy
Impr ove T erms withSe rvice P ro vide rs(Co nt rac tors, N etwo rkServ ic e s, Co nsulta nts, e tc. )
Impr ove T erms onPu rcha sed /LeasedAsse ts(Se r ve rs, PC s, Sw itch es ,e tc . )
Imp ro ve Terms onP urch ased / Leas edR ea l Estate, Fu rn itu re& Fixtures
In crea se U til iza tio n ofR ea l Estate
Imp ro ve Cap acity/D ema nd P lann ingP roce sses & Too l s
Imp ro ve RE Design &D evelop men tP roce sses
Impro ve Ope ra tio na lP roce sses(A dm inistra tio n, Se curit y,En ergy , HVA C &M ain ten an ce )
Imp ro ve RES election , Acquisition& Con trac tingP roce sses
Impro ve REImpro vemen t &D ep lo yme ntP roce sses
Impro ve Terms wi thS ervice Pr ovid er s(S ecurity , Ene rg y, e tc. )
Imp ro ve Terms onImpro vemen ts(H VAC, Ca bling , e tc. )
Impr ove Te rm s withTh ir d P ar ty Pr odu ct/Se rvice Pro vide rs(Pa yr o ll, Be ne f its , Train ing ,etc )
Re duce Sa lar y /Be nefits Costs
Impr ove Capacity/De man d P lan ningPr ocesse s & To ols
Impr ove HRPe rforma nceAsse ssmen tPr ocesse s & To ols
Impr oveRe cruitmen t / On-Bo ar ding P roce sses
Impr ove Skills o f HRStaf f
Pr ovide Sta ff withBe tter HR Info rma tio n& To ols
Impr oveTrai ningPr ocesse s
Impr oveSa la ry & Ben efitsAd min istr ationPr ocesse s
Impr ovePa yrollPr ocesse s
Impr ovePe rforma nceAsse ssmen tPr ocesse s
Ra tio na lize ve nd or /supplie r po rtfo lio
Inc reas e focus o nh ig he r value ven dor /supplie r pa rtne rshi ps
Imp ro ve collab or ationwith vendo rs/sup plier s
Inc reas e Use ofL ower-Cost Cha nn els(Se lf -Serv ice , e tc. )
Imp ro ve assignmen to f resou rces top ro cu re men ttr ansac tio ns
Impro ve D ema ndPla nnin g Proc esse s &T ools
Imp ro ve P ro ductPr ocur emen tPr ocesses(Eq u ip me nt , Su pp lies etc. )
Imp ro ve S er vicePr ocur emen tPr ocesses(Tra ve l, C on t ra ct L ab or,e tc . )
Imp ro ve C ontr actin ga nd Ne go tia tio n Skillso f Pr ocur em ent S taff
P r ovide S ta ff withBe tte r P ro duct &Se rvice In fo rmation
Impro ve Incen tivesAr ound Pro cu re men tE fficien cy
Impro ve Te rms o nEq uipm ent & Supp lies
Imp ro ve Te rms w ithSe rvice Pro vid er s(Eq u ip me nt Ma inte na nce,D elivery, Wa reh ou sin g, etc. )
Imp r ove Terms withSer vice Prov ider s(C on t ra cto r s, Co nsult a nts,etc. )
Imp r oveStra tegic P la nn in gPro cesses
Imp r ove Skill s ofBusi nessMan agemen t S ta ff
P ro vide S taff withBette r Manage ria lIn fo rmation & T oo ls
Imp r ove Ince ntive sAro un d Busine ssP lann ing Effi cien cy
Imp r ovePro gr am P la nn in gPro cesses
Imp r ove Cap ita lBud getingPro cesses
Imp r ovePro gr amMan agemen tPro cesses
Imp r oveAccou nting &Mea sur e men tPro cesses
Impr ove Te rm s withFina ncia l S er vic esPr ovide rs
Impr oveCas h/T reas uryMan ag eme ntPr actices
Impr ove Skills o fFina ncia lMan ag eme nt S taff
Impr ove Ta xEffic iency
Impr ove Inc entivesAr ou nd F in an ci alMan ag eme ntEffic iency
Impr ove De bt &Equ ity Man ag eme ntEffic iency
Incre ase Focu s onMa te ria ls -E ffic ie ntProd uctio nMe ch ani sms
Ra tio na lize and/o rRe focu s Bu sines sUn its & Produ ctPo rtfolio
Incre ase Empha sis o nDesign ing fo rMa te ria ls Eff ic iency
Ra tio na lizevend or /supp lierpo rtfolio
Fo cu s e ffor ts onhig her -va lu e vendor /supp lie r rela tionsh ip s
Impr ove Terms o nMa te ria ls Pu rchases
Ra tio na lize Or de rQuan tities and Timin g
Impr ove Pe r fo rm anceAsse ssmen tProc esse s & Too ls
Impr ove De man dFo reca st ingProc esse s, Skills &To ols
Impr ove Or d ering an dRece ip t P roce sses(Raw M at er ia ls , I n te rmedia t eMa t eria ls, Fin ishe d C om p onen t s ,e tc )
Impr ove Ma teria l sE ffici ency ofProd uctio n Processe s
Impr ove Co ntr actingan d Nego tia tion Skill sof Pu rcha sing S taff
P rov ide S ta f f withBe tte r Pr od uctInforma ti on & To ols
Design Products toUse Cost- Effectiv eMa te ria ls
Impr ove Terms withSe rv ice s Pr ovide rs(De live ry , Ware ho using ,e tc. )
Rationa lize a nd/o rR efocus BusinessUnits & Pr od uctP or tfo li o
Imp rove Focus onH ig he r- Va lueP ro ducts
Rationa lizeP ro duction Quan titi esand Tim ing
Incr ease U se o fLow er-C ostP ro duction C han ne ls
Imp rove Terms w ithS er vices P rovide rs(Outs ou rc e d f un ct ion s, e tc. )
Imp rove Termson Eq uipmentP ur ch ases
Imp rove Produ ctionP er forman ceA ss essmen tP ro ce sses & Too ls
Imp rove DemandFor ecastin gP ro ce sses, S kil ls &Too ls
Imp rove Capac ityP la nn in g Pr ocesse s,S ki lls & To ols
Imp roveP ro ductionS ch edu ling & S ta gingP ro ce sses
Imp rove Ut il iza t io n ofP ro duction C han ne ls /R ed uce Downtime
Imp rove Skills ofP ro duction S ta ff
P ro vide S taff w ithB etter P roduction In fo& T oo ls
Imp rove In centi ve sA ro und Pr od uctionE ffi c ie ncy
Imp rove Coo rd inati onw ith B usinessP ar tner s
Imp roveManu factu rin g &Qua lity Con trolP ro ce sses
Ra tio nalize and /orRe fo cus Busine ssUn its & Pro du ctPo rtfolio
Ra tio nalize ve ndo r/su pp lie r po rtfolio
Improve focus o nhi ghe r- va lue ve nd or /su pp lie r r elation sh ips
Improve Te rms onMerchand isePu rcha se s
Ra tio nalize Or derQu antities a nd T im ing/ C on so lida te Orde rs
Improve Pe rfo rma nceAssessmen tPr ocesse s & To ols
Improve DemandFo re castingPr ocesse s, Skills a ndTo ols
Improve assig nme ntof reso urce s totra nsactio ns
ImproveMerchand iseOr de ring and Rec eip tPr ocesse s
Improve Skills o fMe rchand isin g S taff
P r ovide S ta ff withBe tte r Info rma tion andTo ols
Improve Incen tivesAr oundMerchand isin gEfficien cy
Improve coor din ationwith ve nd ors/supp lie rs
Improve Te rms withSe rvices Prov id er s(D e liv e ry, Ware ho us ing ,etc . )
Rat iona lize and /o rRefocus Busine ssUni ts & Pro ductPor tfo lio
In cr ea se E mph asis onDes ignin g /Pac ka gingfo r Distribu tion
Incr ease Q uality /C on siste ncy ofMa teria ls
Rat iona lizePr odu ction Qua ntitiesand Timing
Rat iona lizeMer ch an dise Ord erQua ntitie s and Timing
In cr ea se U se o fLower -C os t L ogisticsand Distr ib utionCha nn els
Im pr ove Inve ntor yRec eipt an d S tor ag ePr ocesses
Im pr ove Tr an sp or tand De live ryPr ocesses /Algorithms
Im pr ove Skills o fIn ve nto ry a ndDistr ib ution S ta ff
Pr ovide Sta ff wi thBet ter In formation a ndToo ls
Im pr ove Ince ntivesAr oun d Inv ento ry /Distr ib ution E fficie ncy
Im pr ove Per forman ceAssessm entPr ocesses & To ols
Im pr ove Dem andFor ecastingPr ocesses, S kills &Too ls
Im pr ove Te rms withSer vices P ro vid er s(T ran sp ort , W are ho us ing ,etc .)
Im prov e Fo cu s onHigh er -V alueCustomer Se gme nts& Prod ucts
Ration alize / Re alignPr odu ct De ve lo pmentE ffor ts
In cr ea se Use ofLo wer -Cost P ro ductDevelo pmentCha nn els
Im prov e Pe rforma nceAssessmen tPr ocesses & To ols
Im prov e Prod uctCon ce ption / Initia tio nPr ocesses
Im prov e Utiliza tion o fPr odu ct De ve lo pmentCha nn els
Im prov e Skills o fPr odu ct De ve lo pmentS taff
Im prov e De finition o fPr odu ct / S er vi ceSpe cif ica ti ons
Im prov e Incent ive sAr oun d Pr od uctDevelo pmentE ffic iency
Im prov ePr ototyping , Pi loting &Te sting Pr ocesses
Im prov eDesign &Develo pmentPr ocesses
Im prov e Iden tif ica tion/ D isco ntinuatio n ofUnsuc ce ss fulE ffor ts
Li ce nse or Acquir ePr odu cts &In tellectua l Pr ope rty
De ve lop Low Re alEsta te Bu sine ssMode ls
Re du ce N umb er o fDa ta Cen ters, B r anchOffice s, Dea ler sh ips,Re tail Outlets, etc.
Ou tsour ce B usin essF unc tio ns
Incre aseUse o f Le ased R ea lEsta te
Impr ove T ermso n Pr ope rty andF acilitie s
Co nsolida te /Re co nfigu re Fac ilities
Incre aseUse o f Fle xib leF acilitie s
Divest/Avoid LowUtilizationRe al Esta te
Ra tiona lize and /o rR e focus BusinessUn its & Produc t/S e rvice Po rtfolios
Ou tso ur ce BusinessF un ctions
In crea seU se o f L ea sedP ro du ction E qu ipmen t
Imp ro ve Te rms on ITS ystems
In crea se U se o fF lexib le / E xpa nd ab leP ro du ction E qu ipmen t
In crea se E mph asis onDesig n forM anu factu rabil ity &S e rvice
D ivest/Avo i d Lo wU tiliza tio nE qu ipmen t
Imp ro veE ffe ctive ne ss o f P la ntM ainten an ce
Impr ove T ermso n In frastr uctu re
Divest/Avoid LowUtilizationInfrastr uctur e
Incre aseUse o f Fle xib le /Expa nd ableInfrastr uctur e
Incre aseUse o f Le asedInfrastr uctur e
R ationa liz e an d/orR efocus B usin essU nits & Pr oduc tP ortfo lio s
R ationa liz e / RefocusC usto mer Seg men ts& D istrib utionC hanne ls
D evelop L ow-Inven tory Busine ssMode ls
Increase Emphasiso n Bu ild -to-Or de r
Imp ro ve T erms o nMer chand ise
Impro veC ollabo ra tio n withV endo rs / Partne rs
Imp ro veD ema nd F orec asti ng
C onsolida teInven tory
Imp ro ve L og istics /D istribu tio n Eff icien cy
Identify / D ivest Low -D ema nd & Obso le teInven tory
Rationali ze a nd /o rRefo cus Busine ssUnits & P ro ductPor tfolios
Sho rte n Prod uctionCycles
Rationali ze R awMater ials
In cr ea se Util i za tio no f Ju st-In -Tim ePr ocur eme nt
Im pr oveDem and For ecas tin g
Im pr ove Te rms onMater ials
Dive st / A voidObso lete M ater ials
Reduce Sa les o nAcco unt / Issu ance o fNo te s
Reduce Number &S ize of Loans
Incre ase Focus OnCustome r S egmentswith Lo w Cr editNeeds
Tigh ten A /R T erms
Tigh ten T erms onNo te s an d Lo an s
Impr ove Managemen tof Delinq ue ntAcco unts
Incr easeDe bt Le ve ls
Imp rove C redit R ati ng
Leng then Paymen tCyc le s
Re du ce C ost o f Deb t
Imp roveDe bt/Eq uityMa nagement
Imp rove Id entification/ Pr ed ictio n ofIndustry and Mar ke tT re nd s
Improve Id entificationo f Oppo rtu nitie s an dT hr ea ts
Imp roveF ormula tion ofB usiness S tr ateg ie s
Imp rove A lig nme nt ofB udg ets w ithS tr ate gic Pr ior itie s
Imp rove A lig nme nt ofC apital P r og rams withS tr ate gic Pr ior itie s
Imp rove A bil ity toIden tify, Assess, &A cq uire M&AC and idate s
ImproveC ommu nica t io nA round S tra tegicP rior itie s
Im pr ove S tru ctu ringand Lau nch ofCohes ive Pr og ramPortfol io s
Im pr ove Coo rd ina tion/ Co mmu nica tio nAcr oss Pr og rams &Pr ojec ts
Im pr ove Pr ojectMan age men tPr ocesses
Im pr ove A lignm ent ofPr ojec ts with Pr og ram/ Bu sin ess Ob je ctive s
ImproveMeas uremen t ofOp er ation al/F inan cia lPe rfo rma nce
Improve Anal ysis o fManager ialIn forma tio n
Improve Ab ility toFocu s on Mos tImpo rtan t In fo rmation
ImproveCo mmun ica tio nAr ou nd Imp ro ve men tPr ior ities
Improve Ab ilityto La unchImprovem ent E ffor ts
Improve Qual ity &Co nsisten cy o fPe rfo rma nceAsse ssmen t M etho ds
Pr ovide B ette rCa re er Option s &Pa th s
Improve Emp loyee s’S take in CompanySu cc ess
Improve Mo ne ta ryand No n-Mon etar yRe co gnit ion o f S ta ffCo ntr ib utions
Improve b readth ,depth , qu ality andti melines s o f b usin esspe rfo rma ncein forma tio n
Imp ro ve E ffe ctive nesso f Org ani zationa lS truc tures
Imp ro ve E ffe ctive nesso f Go ve rn anceMo de ls
Imp ro vePro ce ss InnovationCapa bilities
Imp ro ve D epth& B re adth o f S ta ffT echnica l Skills
Imp rove Spe ed andQua lity o fComm unica tion w ithPar tne rs
Imp rove Abi lity toIn tegrate Me rged &Acq uir edOrgan ization s
Improve Abi lity toIden tify, Asse ss andImp leme nt JVs &Par tne rships
Imp roveMan age men t o fPar tne r Re la tionships
Imp rove In tegr a tion ofProce ss es Acr o ssPar tne r Ne tw orks
Impr ove va luede live red toCU STOMERS
Impr ove va luede live red toPA RTNERS(Ve nd ors / Sup pliers,Ch an ne ls Partne rs, etc . )
Impr ove va luede live red toEMP LOY EES
Impr ove identi ficat ionof op po rtun itie s toincre ase va lue tosta keholde rs
Impr oveUn der stand ing ofStakeh olde r Inte re sts(Cu sto me rs , S h areh old ers ,Em plo ye e s, Su pp liers ,Pa rtne rs , Alum ni, etc . )
Impr ove conver sio n ofstr on g r elationship sinto sources o fco mpe titivead va ntag e
Impr oveCo mmun ica tion withStakeh olde r Gro ups
Improve a gility/f lexibility o fo rg an iza tion als tructur es
Improve a gility/f lexibility o fg ove rna nce mod els
Imp rove F lexib ilityo f B usinessP roce sses
Improve V er sa til ity ofP eop le
Imp rove flexi bility& ve rsa til ity of ITs ystems andp la tfo rms
Ra tio na liz ecusto mer po rtfolio
Impro ver espo nsiven ess tocusto mer re qu ests /inquir ies
Impro ve tr acking o fcusto mer inter actio ns(pu rch ase s, su pp o rtreq ue sts , etc .)
Improv e ide ntif icatio nof va lu ab le custome rre lationship s
Re fo cu s re ten tio npr ior itie s / r efinestr ateg ies
Cr ea te bar rie rs tosw itching
So lic it an d r esp on d tocu stom er fe edb ack
Implem ent A ffin ityPr og ra ms
Incre ase emp hasison d iffe re ntia tedpr od ucts / se rvices
Impr ove demandfor ecasting
Incre ase emp hasison suppl y cha inman ag eme nt(produc tion , d is tribution& s ales pi pe l ines)
Im pr oveund ersta ndin g ofcu stome r, pr oduct &ch ann el pr ofitab ility
Con so lid ate /outsour ce se rvice &sup po rt op er ation s
Diffe renti ate se rv icetr ea tmen t ofcustomers / s egmen ts
Pr o vide staff w ithbetter p rodu ct /service information
Impr ove Financ ialRisk Managemen tEffectiv ene ss
Inc reas e use of lowe r-cost de liver y/ins ta lla tion ch an nels(se lf-service , p artn ers, e tc . )
Inc reas e use of lowe r-cost bil l in g chan ne ls(au to ma ted , s elf -s ervic eetc. )
Diffe r entiate treatme ntof cu stomer s /segmen ts
Imp rove em pha sis o nde sign fo r p acking /sh i ppin g effic ien cy
consolida te and /o rou tsou rce o rde rfulf il lmen t fu ncti ons(p ic k, pa c k & s hip /ins ta ll / p r ov isio n)
Co nsolidate /ou tsou rce b ill ingop er ation s
Co nsol ida te a nd /o rOu tsou rce D esig n,De ve lopment &De ploymen t S e rvices
Co nsol ida te a nd /o rOu tsou rce Oper ations& Ma in te na nceSe rvice s
Co nsol ida te a nd /o rOu tsou rce E nd Use rSu pp or t
C onso lida teC orpo ra te Fac ilitie s
C onso lida te and/o rO utso ur ce Design &D evelop men tF un ct ions
Ra tiona lize ITAp plica tio n Po rtfolio
C onso lida te and/o rO utso ur ceImpro vemen t &D ep lo yme nt
C onso lida te and/o rO utso ur ce Prope rtyM ana ge men tF un ct ions
In crea se U se o fL ower-C ost Re alE state / Fa cilitie s
Co nso lid ate a nd/o rOu ts ou rc e Bene fitsAd min istr ationFunctio ns
Ou ts ou rc e Payro llFunctio ns
Co nso lid ate a nd/o rOu ts ou rc eRe cruitmen tFunctio ns
r efine a nd /o r r efocusvendor /supp lierstr a teg ies
Sta nda rdize P rodu ctCa talog s(Eq u ip me nt , O f f ice Su pp lie s,Pro mo t ion al Ma terials, e tc. )
Co nsolida te and /orOu tso ur cePr ocur emen tF unctio ns
Con so lid ate / A lig nBusi ness Pla nnin gFunction s
Refine B usin essP lann ing Str ateg ies
Imp r ove / AlignGove rna nce Mod els
Con so l id ate / A lignFina ncia lMan ag eme ntFunctions
Ref ine Fina ncia lPlanning S tra te gies
Impr ove Incen tivesArou nd P rocu remen tE ffici ency
Incr ease E mph asis onDesign for Pr odu cti onE ffi c ie ncy
Con sol ida te /Outsou rce Pr odu cti onFun ction s
Ref ine / A lignLog istics &Distr ib ution S tr ate gies
In cr ea se Focus onHighe r -Va l uePr odu cts & P ar tner s
Con so lid ate /Outsour ce Lo gistics &Distr ib ution Fun ctions
Rationali ze / re focusp roduct po rtfolio
R ationa lize / re focu sp ro du ct por tfolio
Con so lida te /Outsou rce Pr od uctDevelo pmentFu nction s
In cr ea se Emph asis onModul ar, E xten sib le ,Scalab le D esig ns
Conso lida teIT S ystemsP ro du ction L in es /S e rvice Mecha nism s
Increase Emphasis onH ig h-Tu rn P ro ducts
In cr ea se Emph asis onDesi gnin g forMan ufactur in gEffic iency
Im pr oveCollabor ation w ithVen do rs / Pa rtn er s
In cr ea se Emph asis onDesi gnin g forMater ials E ffi cie ncy
Incr ease Fo cus o nVe nd or s withFav orable P aymen tTerms
Increase Em pha sis o nInteg rated B usin essP la nn in g
Increase Use o fS ce nar io- Ba sedP la nn in g
In crea se Emph asis onEn te rp rise-W id ePr ogr am P la nn in g &Exe cu tion
Incre ase Emp hasison Pr oactivePe rfo rma nceManagement
ImproveDe te rmin ation o f K eyPe rfo rma nce Met rics& Ta r gets
Estab lish a Cu ltu reCente re d onOper ation alExcellenc e
Esta blish apar tne rship /exte nded-en ter pr iseor ie ntat ion
Incr ease e mph asis onpar tne rships ,mer ge rs andacquisit ions
Es tablish an o utside -In mindse t
Estab lish processinn ovation as a keycomp eten cy
Es tablishma nag eme nt of ke ysta keholde rre lation shi ps asor gan izatio na l p rio rity
E stab lish an Agility/F lexib ility B ias
E stab lish speed &f lexibility as keyc omp eten cie s
Incre ase Use ofEmp loye e Se lf-Se rvice Channe ls
Impr ove Cost / Qualityof Benef its
Incr ease Integ ratio no f Bu sin essPro ce sses A crossOrg aniza tiona lBoun da ries
Imp rovePar tne rship &Collab or ation S kills ofS taff
Imp rove u til iza tion ofsales staff
Imp rove u til iza tio n o fservice staff
P ro vide staff withbe tter p roduct, se rv ice& c omp etitiveinfo rma tio n
Imp rove p er forman ceassessme ntp ro cesses & to ols
Imple men t Integ ratedAp plica tio ns A crossthe E xten de dEn ter pr ise
Co nsol ida te IT /Ne twor k E quipmen t(De vice s & F ac ilit ie s)
U tilize MoreE ffic ien t Pr odu ctionE qu ipmen t
Imp ro ve Qua lity /C onsistenc y ofM anu factu ringM ater ials
Version: Dr aft, Octobe r 7, 2002 © 2002 Deloitte Con sulting (Soon To Become Braxton ). All Right s Rese rved. Confidential.
How Value is C reated(V alue Drivers)
W hat You Can Do(Improvem ent L evers: B usine ss Proce sse s ,
A sse ts & Organi zat ional Capabi li ties)
Oth er Sh ared / C o r po r at e Serv ices(R ea l Es tate, P rocur eme nt & Othe r)
Hum an Res ou r ce S tr ateg y & Ma n a gem e nt(R ec ru itme nt, Developmen t, Adm inist ration &Pe rformance Man ag eme nt)
IT S tr at eg y & Man a geme n t
(D es ig n, Develo pme nt, D eplo yme nt, O pe ra tio ns &Pe rformance Man ag eme nt)
Co r p or ate Str ateg y & Bu si n ess M an ag e m en t(B us in ess & Financial S tr ateg y, Merge rs & Acquis ition s,Prog ra m Managemen t & P er formance Mana ge men t)
Imp ro ve value /d ecre ase p rices
Imp ro ve Q ualityMa na gem ent
Imp ro ve S har ing o fKnow le dg e( Inter na lly and withPa r tn er s)
Imp rove Sha rin g ofKno wledge(In tra - a nd In ter-Co mp an y)
Imp ro ve B usinessConti nu ity P lann ing
Improve A bil ity toS pin-Off N ewB usinesse s
Str en gthe n an dCo mmun ica teM issi on , V isio n &Va lu es
Impr ove focus onpr ice -ins ensitivecustom er seg men ts
Inc reas e em pha sis o ndifferen tia te d pr icingacr oss custo mersegmen ts
Imp roveun de rstand ing o fcus to mer pr icesensitiv ity
A lign a dver ti s in g withpr icing stra tegie s
Imp rove tailor ing o foffe ring s to custo merne ed s
Imp lemen t d iffe ren ti a lpr icing mecha nisms
In crea se E mph asiso n Prev en tativeM ainten an ce
De fer / C hangeT iming o f CapitalIn vestmen ts
Conso lida te /In crea se U til iza tion ofP ro du ction E qu ipmen t
Incre ase Fo cu s onManager ial (v s.Acco un tin g)In forma tio n
Im proveDE VE LO PME NT &
PROD UCT ION E fficie ncy
ImproveC UST OM E R
INTER ACT ION E fficie ncy
Im proveCO R P OR AT E / SH AR E D
SER VIC E E ff ic iency
STR EN GTH E NP R IC ING
Incre ase fo cu s onpr od uct i nnovation
Improveun de rstand ing o fpr o duct/ser vice valueto c usto mer s
Inc reas e focus o npr icing effectiven ess /pr ice op timiza tio n
AC Q UIR E NE WC UST OME R S
R E TAIN & G ROWC UR R ENT CUS T OM E RS
PR OD U C T
& SER V I C E
IN N O VA T ION
Incre ase focu s onR&D , p roductinno va tion , & p rod uctlead er sh ip
Br oa den pr od uct &se rvice o ffe rin gs
Impr ove pr od uct /se rvice R&D& dep loymen tca pa bilities
Ad apt cu rrentpr oducts & se rvice sfor n ew seg men ts /ch an nels
Im provePP & E
E fficiency
Imp roveIN VEN TO RY
E ffic iency
ImproveR EC E IVA BL E S &
P AYAB LE SE fficie ncy
Imp roveM ANAG ERIAL
E FFE C TIV EN ES S
Im proveE XE C UTIO N
C AP AB ILITIES
Impr ove pr od uct /se rvice in nova tionsk ills o f sta ff
SER VI C ED E LIVE R Y
In cr ea se E mph asis onS er vice Avoida nce /P re vent ion
Des ig n Se rv ice s forS er vice E ffic iency /S elf -S er vice
Rou te L ow -Va lueT ransactions toL ower -Cost Sa le sChanne ls
Imp ro ve R ou tin g ofS er vice Req uests toR igh t Se rviceM echan isms
In cr ea se U se o fC heape r Se rviceChanne ls
Imp ro ve P er formanceA ssessme ntP ro cesses & Too ls
Imp ro ve W or kfor ceP lann in g /Di sp atch /A ssignmentP ro cessesa nd T oo ls
Imp ro ve C ap acity/D emand P la nn in gP ro cesses, Skills andT oo ls
Imp ro ve S er vice &S uppor t P ro ce ss es
Imp ro ve S kil ls ofS er vice S taff
P ro vide Staf f w ithB etter C usto merIn fo rm ation(P rof i les , H ist or ies , e t c. )
Imp ro ve S taffIn cen tives Ar oun dS er vice E ffic iency
Imp ro ve Terms w ithS er vice Prov id er s
Imp ro ve Terms o nL ea se d Serv iceA ssets(C om pu t er s , V e hic les , e t c. )
Consolida te /Outso ur ce ServiceOpe ra tions
D iffer en tia teT rea tme nt ofC us to mer s /S egmen ts
P ro vide Staf f w ithB etter P ro du ct /S er vice / C ontr actIn fo rm ation
Rati ona lize and/orR efocus B usines sUnits & Se rv ice sOffe red
Imp ro ve U til i za tio n o fS er vice S taff
Imp ro ve Foc us onH ighe r- Va lu eCus to merRela tion sh ip s
Ch arge customers fo rser vice s p re viou slypr o vide d fre e o fcha rge
A lign p r odu ct &ser vice pr ic es withval ue to cus tome rs
E stab lish Produc tInnovation a s a C or eC omp eten cy
Improve P ro du ctInnovation P roce sses
Improve P ro du ctInnovationC apa bilities of S taff
Improve Assig nmento f Ac co un ta bility &Au th or ity
Improve E ffectiven esso f Go ve rn anc eMode ls
Ra tion alize P ro gramPortfol io s
Cance l Ine ffective /Obsolete P rogr ams &Pr ojec ts
Im pr ove Tr acking ofPr ogr am /P ro jectPr ogr ess
Im pr ove Assign men tof Resou rces toPr ojec ts
Im pr ove Pr ojectMan age men t S killsof S taff
Im pr ove Manag ementof Ven do rs / Se rvicePr ovid ers
Esta blish P ro gr am/Pr ojec t D el iver y as aCo re Co mpe tency
Increase Em pha sis o nP roactive Bu sine ssP la nn in g
L EVE R AG E INC OM E -GE NE RAT IN G
AS SET S
Develop , spin -o ff &se ll ne w bu sine sses
Im prov e investme ntre tu r ns on ca sh /treasu ry fund s
Li ce nse / sellin tellectua l ca pita l toothe r en te rpr ises
Imp ro ve br andstre ng th & goo d will
Improv e br andstr ength & good w il l
C ASH / A SSETM G M T.
Sell app r ecia te das se ts
In cr ea se emp hasis ongener ating re venuefrom com pan y assets
In cr ea se fo cus ondevelo ping a ndpr otec tin g intel lectualca pital
Sell busine sses /busine ss u nits toothe r en te rpr ises
Incre ase Focus onCred it-Wor thyCustome r S egments
Impr ove Co ll ectionsProc esse s
Impr ove Cr ed itAsse ssmen tProc esse s
Diffe re ntiate Cr ed itTr ea tm ent ofCustome rs /Segmen ts
Imp ro veu nde rstan ding ofcustome r needs
In cr ea se focus one xp an sion o fcustome rr e la tio nships
Im pr ove pr od uct /se rvice withd rawa l &re tir eme nt pr ocesse s
Acquir e competito rs
Impr ove F ocus o nSe rvice L evelAg re eme nts
Incre ase Use ofDista nce / On- LineLea rning
Establi sh c ustome rco mmu nitie s
B ypass cu rren tcha nne ls / b ecomeprima ry cu stome rinte rface
Imp ro ve cros s- se lla nd u pg rade mode ls
Ap ply br and to ne w /un branded pr odu cts
STR AT EG IC
ASSET S(P eo pl e, Tech nol o g y,I nt e llec t ua l Capi tal ,P hy si ca l R es our ces ,R elat i ons h ips , e t c. )
Develop and le ve ra gestro ng /u niqu e pa rtn erre la tionships
Develop & Lev erag eStro ng B ra nd
Develop S tro ngCustomerRelationsh ip s &Comm uniti es
Develop and u til izeun ique physica lre sour ces(fa cilit ies, la nd , e tc. )
Develop and u til izeun ique humanre sour ces(th ou gh t le ad ers , m an ag ers ,su bje ct ma t te r e xpe rts, e tc. )
Develop & Lev erag eIn te lle ctual C ap ita l(C op yrig hts, Paten ts,Trad em arks, etc . )
Incr ease fo cus onstra tegic assets
Imp rove AssetDevelopmen t S kills ofManagemen t & S ta ff
Imp rove In cent ive sAro und As se tDevelopmen t
Establishdevelop men t o fstra tegic assets a skey compe te ncy
Incr ease e mph asis onleve rag ing stra tegicassets
S ho rten th e Va lu eCha in / Elim ina teUnn ece ssar y S te ps
Improve D ev elop men ta nd A nalysis o fB usiness Ca se s
Imp ro ve s ecur ity o fsystems a nd d ata
Impr ove A llocat ion o fSha r ed / Ove r hea dCos ts
Imp ro ve R ecru itingEffectiven ess
Impr ove Re lations hipMa nag eme ntSt rateg ies for KeyStakeh olde r Gro ups
Impr ove va luede live red toSH AREHOLDERS
B R A X T O N E N T E R P R I S E V A L U E M A P
( Pr act ical paths to in crease shareholder valu e )
It is e asy to say share holder v alue is impor tan t. It is h ard to make it inf luence the decisions beingmade every day - where to spend time and resources, h ow b est to get things d one and , u ltimate ly ,how to win in the compe titive marketplace.
This Value Map is designed to accelera te the conn ectio n b etween actions companies can take andshareholder va lue . It is not rocket science and it is not complete, but we hope it provides a jump-star t to the pro cess of fo cus ing on the things th at mat ter mo st and d ete rminin g prac tical ways toge t tho se th ings done .
Here is one simple way to use it…
Start at th e top: Working your way down , ask your self "How will we improve th is?" at e achs tep . This will he lp ensure your tactic s support your ob jec tive s.
Start at th e bottom: Working y our way up , ask yourself "Why are we doing this?" at e achs tep . This will he lp ensure your ac tivities a re leading toward Shareholder Va lue .
Cus to m er S tr a teg y, R e la t ion shi p s & I n ter ac ti o n s
(M ar ke ti ng, Sales, D elive ry/Pr ovi sionin g, B ill i ng & S er vice )
Pr o du c t S tr ategy , D e ve lo pm en t & Pr o du c tio n(In novat ion & Design , Su pply Cha in Man age men t, P r oductio nOpe rations & Lo gisti cs)
BUSINESS PROCESS GROUPINGS
Ra tio na li ze an d/orRe focus B usin essUn its & Pr odu ct/Se rvice P or tfo lio s
Im proveL O GIST IC S & SE R VIC E
PROVISION E fficien cy
Ration alize a nd /o rRefo cu s Busine ssUnits & P ro duct/Ser vic e Po rtfol ios
Imp ro ve P hysica lSecu rity o f P eop le
Imp rovec omm unicati on a ndk nowled ge tr ans ferw ith in and ou tsid e thec omp any
A l l Pr o ce ss G ro u p in g s(A ction a pp li es to all proc ess groupings)
Co nso lid ate a nd/o rOu ts ou rc e Le arn ing &De velopmen tFunctio ns
Improve Ma na ger ialEmp ha si s o n People /Ta len t De ve lo pme nt
Improve / Esta blishTa len t Ma nag eme ntMode ls & Pro gr am s
Ide ntify and re -pr ioritize sta keholde rre lation shi ps
Impr ove va luede live red to OTHE RSTAKE HOL DERS(Pu blic , A lumni, An alysts ,etc . )
Sh orten o rder -to -d eliver y cycle t im e /Imp ro ve p rodu ct &se rvice ava ilability
Incre ase emphasison d esign forco nfigu ra bility /cu stom izat ion
Impr ove pr od uct /se rvice p latform andpo rtfolio str ate gies
Incre ase emphasis ontim e- to -m ar ke t /tim e- to -vol ume
Incre ase number o fsu ccessfu l pr o duct /se rvice la unches
Incre ase u tiliza tion o fmod ular , re usablede sign s
Impr ove ne twor k o fde sign par tne rs
Impr ove r euse o fpr oduct / se rviceco mpo ne nts
Impr ove managementof pr od uct life cycle s( lau nc h th r oug h r et i r e ment )
Increase em pha sis o nac coun t / r elati onshipde ve lopm ent
Impro ve a ccou ntmana gem ent skills ofsta ff
Impr ove incen tives forpr oduct d evelopmen t /inno va tion
Impro ve incen tives fo rac coun t / r elati onshipde ve lopm ent
Impro ve accoun tmana gem entstr ateg ies
Imp ro ve or der -to -d elive ry cycle time /imp ro ve pr odu ct &ser vice avail ab ility
Imp ro ve to ta lcustome r expe rie nce(p urcha sin g, fulf illm en t ,u s ag e, su pp o rt , se rvic e,e tc. )
Imp rove exe cut ion o fma rket- and sup ply-dr iven p rom otions
Improve str u ctu ringan d pr icing ofpr o motions
Improve coo rd in ationwith supp lie rs & sa le schanne ls
Impr ove use ofsupp ly- a nd cap acity-dr ive n pr omo tions
Inc reas e use ofpr o motions
Ra tio na lize and /orr efocus pr od uct /ser vice por tfolios
Imp r ove focu s onseg men ts with lowe rave r age cost -to -s erve
Im prov e Co llab ora tionwith Par tne rs &Customers
Incre ase us e ofve nd or -ma naged /ve nd or -w ar eho usedinvento ry
Imp ro ve due -d ater eliab ili ty / reduc einq uir ie s
Ma na ge Pr ocur emen to n a Na tio nal / Globa lBa sis
Imp ro ve Lever ag in go f Na tio na l / Gl obalPu rcha sin g Power
Incre ase Focu s onComponent Reu se
Redu ce P ro cu re men tCycle Times
Impr ove collabo r atio nwith vend or s/sup plie r s
Im pr ove Design /Stru ctur e o fDistr ib ution N etwork s
Alig n Prod uctio n &Mer ch an dise Ord er ingSch edu les withDistr ib utionSch edu les
Im pr ove Retr ievalPr ocesses
Manage Pu rcha si ngon a National / Glo ba lBa sis
Re fin e / R efoc usGo ve rn anceStr ateg ie s(C o mmo n vs . L oc alMe rch an dising , e t c. )
Improve Le ve ra gingof Na tiona l / G lo ba lPu rcha sing Power
Inc reas e Use ofVe ndo r-M ana ge d /Ve ndo r-Wa rehous edInv en to ry
Incre ase use ofvend or -man aged /vend or -war eh ou sedinven to ry
Increase Use ofVe ndo r-Mana ged /Ve ndo r-Wa re house dInvento ry
Im prov e Prod uct &Ser vic e Intr odu ctionPr ocesses
Ra tio na li zePr od uctio n Facilitie s
R ationa liz eP roduction Qu an tities& T iming
R ationa liz eMer chand ise Ord erQ uan t ities & Timing
Increase Use o fV endo r-Man age d /V endo r-Warehous edInven tory
Rationali zePr odu ction Qua ntities& Tim ing
In cr ea se Emph asis onUse of Comm onCom pon en ts
In cr ea se Util i za tio no f Standa rdiz edCom pon en ts
Man age Mater ialsSou rcing on aNational / Glo balBasi s
In cr ea se Use ofVen do r-Man aged /Ven do r-War eh ou se dIn ve ntor y
Inc reas e emp ha sis o ncu stom er r e te ntion
Pr oactive ly managetra nsition p oints(e nd s o f co ntr acts,leases, e tc.)
Offer va lue -add ingpr od uct/ser vicebu ndle s
Impr ove Fo cus onEmp loye e Re ten tion
Esta blish / Impr oveEmp loye e Re ten tionPr og rams
Change What You Do
� What you provid e� Whom you ta rge t and serve� How you compe te� Where you deploy your re sour ces
Do What You Do B ett er
� Business p rocesses� Intr a- and int er-company collabor ation� Customer s, employee & oth er stakeholder
satisfac tion� Resour ce/Asset deve lo pment &
deployment� St ra tegic capability development
U tilize More Eff icien tIT S ystems
U tilize MoreF lexib le / E xpa nd ab leIT S ystems
Imp ro ve Ma inte nan ceo f IT S yste ms
In crea se U til iza tion ofIT S ystems
D ivest Low -U til iza tio nIT S ystems
Imp ro ve Te rms onP ro du ction E qu ipmen t
Imp rove A bil ity toF ocus C omp anyR esour ces o n Hi gh -P rior ity In itia tives
Incr ease emphasis oncro ss -division , cr oss-b usin ess- un it an dcro ss -com pan ycollab or ation
Incr ease p roactiv ity inpur suing pa rtne rshi ps,mer ge rs &acquisit ions
Increase em pha sis o ncusto mer sa tisfaction
Impro ve q ualityas surance p ro grams
Sell / lea se excessca pacity to othe ren te rp rises(pr odu ct io n c ap acit y , s er v iceca p ac it y, et c . )
Co ordina te pricing o fcomp le men tarypr o ducts/se r vice s( r az o rs v. b lad es / p r od uct v.s hip p ing c h arges , et c .)
Imp rove p ri ce/mar ginknow le dg e of sta ff
Bu ild p r odu ctpr o fitab ility into salesinc en tives
Rat iona lize S er vicePr ovide r Por tfolio
Impr ove Inv estmentMan ag eme ntEffic iency
Impr ove Ca pitalInve stme nt Ana lysisEffectiv ene ss
Impr ove Qu ality ofFina ncia l In fo rm ation(As se t , Performa n ce ,Bu dg et , Pric e, Co st , Pa yroll,Tre as ury , D eb to r, C re d ito r,Ta x, Ris k , e tc. )
Impr ove Bu dge tin g &Fo reca stingCap ab ilities
Impr ove Financ ialRep or ting E fficien cy
Pr ovide Sta ff wi thBet ter Asse tInformation(Fixe d & Va riab le )
Not e: M any a ct ion s could logically be as so ciat ed wit hot he r or mult ipl e proce ss g roupings . In p ar tic ular ,
m an y c ust om e r & prod uct ac t ions are likely t o ha vehe avy IT and H R c om po ne nts )
Imp rove in tegr a tion ofIT systems acrosspar tne r ne twork s
Incr ease e mph asis onope ra tio na l inte grat ionwith par tne rs
Re move ba rrie rs tosw itch ing
Impro ve con tr actma na gem entp ro ce sses(ne g ot iat ion , e x ec ut io n an dcom plia nce)
r efine and /o r r efoc usve ndo r/sup plierstr ateg ies
Co nsolida te a nd /o rou tsou rcemerchand isin gfunctions
Esta blish cro ss-companyco llab or ation a s a keycompe te ncy
Imp ro ve r eliab ility o fIT systems/p latforms(PC s , s ervers , n etwo rks,e tc. )
Imp ro ve b re ad th ,d epth , q uality an dtimeli ness of b usinessinfo rma tio n
Imp ro ve a ccess tob usin ess info rma tion
Develop and u til izeun ique techn ic alre sour ces(a pp lica t io n s, ne tw ork s,eq uip men t , e tc. )
|170
From Business Planning to Financial Modelling and Valuation
5. Appendicesc. Some goodies (1/2)• Acquisition is fun, integration is hell• Acquisitions don’t lead to strategy, strategy leads to acquisition• If you can’t beat them, buy them• How do you mean how much is a dollar?… a dollar is a dollar• The dollar is our currency but it is your problem• War is a continuation of politics by other means• Strategy is an art, tactics a science• The fascinating trinity of war: violent emotion, chance, rational
calculation• Co-opetition is a valid alternative to competition• Investments are profit of tomorrow and employments of the day after• When building goes, all goes• Resistance to change is denial of growth• You can teach a monkey to do a fairness opinion
|171
From Business Planning to Financial Modelling and Valuation
5. Appendicesc. Some goodies (2/2)• Cash is king• Be an entrepreneur is changing an existing order• In France: Don’t put all eggs in the same basket – In the US: put
them is the same basket. But watch the basket• Sell in May and go away• Chance is on your side half of the time• Most beautiful strategies are written in the past• Today, it is not enough to be competitive on one’s market• You cannot predict future, you can prepare it• A strategy must be flexible• Success is not a goal, it is a consequence• A business: 80% sweat, 20% chance … and the rest is creativity• Strategy is resource allocation• Facts, facts, facts