Embed Size (px)
Citation preview

2016 - A COMPREHENSIVE SURVEY OF 14 METROPOLITAN STATISTICAL AREAS
From Air Mattresses to Unregulated Business:
AN ANALYSIS OF THE OTHER SIDE OF AIRBNB


CONTENTSFrom Air Mattresses to Unregulated Business: An Analysis of the Other Side of Airbnb
City Spotlight: Phoenix, Arizona
City Spotlight: Los Angeles, California
City Spotlight: Chicago, Illinois
City Spotlight: Miami, Florida
City Spotlight: Boston, Massachusetts
City Spotlight: New York, New York
City Spotlight: Philadelphia, Pennsylvania
City Spotlight: San Francisco, California

Data SourceThe data used in this analysis were sourced from Airdna, which tracks Airbnb revenues and operations and provides pricing and revenue data to Airbnb operators. Airdna conducts a continuous search of the Airbnb web site, resulting in each Airbnb listing being analyzed once every seven days.
The data cover 14 of the nation’s largest metropolitan statistical areas (MSAs): New York, Chicago, Los Angeles, Philadelphia, Miami, Houston, Dallas, Phoenix, San Antonio, San Diego, San Francisco, Boston, Austin and Washington, D.C. The research focuses on hosts who rent multiple units and the length of time they are renting their units.
Kalibri Labs, a hospitality research firm, sorted the data, which included Airbnb operators from October 2014 through September 2015.
Exclusions: All data exclude all shared rooms and units and unique units, such as boats, tree houses, and tents.
Additional Information:John W. O’Neill, MAI, ISHC, Ph.D., professor of hospitality management and director of the Center for Hospitality Real Estate Strategy in the School of Hospitality Management at Penn State University and Yuxia Ouyang, doctoral student, conducted the analysis and developed the key findings. They examined over 448,000 lines of data and over 10.2 million variables.
This study was primarily funded by the American Hotel & Lodging Educational Foundation. Additional funds provided by the American Hotel & Lodging Association. Penn State University received no funding for the study.
Glossary of Terms Host: Person or entity renting out at least one residential unit on the Airbnb platform.
Full-time operator: Any host renting out unit(s) 360 or more days per year.
Multi-unit operator: Any host renting out two or more units.
Variable operator: Host renting a variable number of units (1, 2, or more) 360 days or more days per year
Mega-operator: Any host renting out three or more units.
A NATIONAL VIEW: EXECUTIVE SUMMARYAs the popularity of short-term rental platforms grows in the public arena, this analysis takes a closer look at the hosts dominating one of the most trafficked platforms, Airbnb. The company, valued at some $25 billion, has a reported 2 million listings worldwide. In media interviews and public materials, Airbnb suggests that its hosts largely use the platform to supplement their income. It states that “a typical listing earns $5,110 a year, and is typically shared less than 4 nights per month.”1
But that does not represent the full picture.
This analysis represents the first comprehensive look at the commercial activity being conducted on Airbnb. The analysis of hundreds of thousands of data points reveals a notable trend with respect to two overlapping groups of hosts, multiple-unit operators who rent out two or more units, and full-time operators who rent their unit(s) 360 or more days per year. These two subsets of operators generate a substantial amount of Airbnb’s revenue. Hosts who rent fewer than 360 days, but still far more than occasionally (for instance, more than 180 days), also contribute greatly to Airbnb’s bottom line.
This analysis also includes additional, city-level analyses that provide greater detail about the commercial activity being conducted on Airbnb in the 14 major metropolitan areas studied.
1. https://www.airbnbaction.com/data-on-the-airbnb-community-in-nyc/

KEY FINDINGSTwo overlapping groups of operators, multiple-unit operators and full-time operators, are a growing percentage of total Airbnb hosts and generate a very significant share of the company’s revenue in major U.S. cities. The analysis revealed the following key findings in the 14 cities studied from October 2014 through September 2015.
Multi-Unit HostsThere is a rapid expansion of multi-unit operators, defined as hosts renting out two or more units, on Airbnb. We found
this to be the case in all 14 of the cities we analyzed, which also represent some of the largest cities in the country.
Full-Time HostsA growing number of hosts are using the Airbnb platform to operate full-time businesses. 26% of Airbnb’s revenue
is derived from this group of full-time hosts. They are becoming bigger and more prominent.
By The Numbers
Multiple-unit operators (2+ units) account for nearly 40% of the revenue
on Airbnb in the 14 cities studied;
That translates to over $500 million of the $1.3 billion in revenues Airbnb generated
from whole units in those cities.
2,772 full-time operators (renting 360+ days per year just like a hotel) recorded $347,479,616 in revenue or a very high
average of $125,353 per host during the
time period studied.
The growth in Airbnb hosts accelerated over the summer months and
then remained steady.
The cities with the largest number of
full-time operators include:
24.0% 62.1% 30.4% 32.1%
$1.3 billion Revenue$500 Million
New YorkNearly a quarter (24%) of Airbnb’s revenue
($107,471,333) came from
full-time hosts who made
up 3% of operators.
MiamiAlmost two-thirds (62%)
of Airbnb’s revenue ($76,159,487) came from
multi-unit hosts who made
up 30% of operators.
Los AngelesAlmost a third (30%) of Airbnb’s revenue
($79,619,092) came from
full-time hosts who made
up 4% of operators.
San FranciscoAlmost a third (32%) of Airbnb’s revenue
($58,803,933) came from
multi-unit hosts who made
up 14.9% of operators.
East Coast:New York
and Miami
West Coast:Los Angeles and
San Francisco

NATIONAL TRENDSAirbnb host revenue has increased significantly. The total 14-city sample shows that monthly operator revenue increased from $93.2 million in October of 2014 to $139.0 million in September of 2015, representing a 49% increase. Monthly revenue peaked during the summer of 2015 when there was $150,228,110 revenue in July and $145,544,831 in August, though revenue remained near those levels in September 2015, as well, at $139,007,806.
The highest revenue growth rate was from multi-unit operators who rent out 2 units on Airbnb. In
the 12 months studied, the revenue derived from these operators rose 102%, from $13.2 million in
October 2014 to $26.7 million in September 2015. At the same time, the number of these operators
increased 62%, from 2,215 in October 2014 to 3,590 in September 2015.
The rate of growth of mega-operators (those renting out three or more units) was the largest,
increasing from 1,397 in October 2014 to 2,319 in September 2015, a 66% increase. These operators
generated $21.1 million in revenue in October 2014 and $31.4 million in September 2015, a 49%
increase over 12 months.
These mega-operators generated a very substantial share of revenue. They represented 6.5% of all
operators, but generated nearly a quarter (24.6%) of revenue ($328,299,944) during the period studied.
The broader subgroup of multi-unit operators who rented two or more units represented 16.1% of
total hosts, generating 39.3% of revenue.
Full-time operators offering units at least 360 days over the 12 months from October 2014 through
September 2015 generated an even more disproportionate share of revenue. They represented only
3.5% of operators, but generated 26.0% of revenue.
Appendix 1: Full-Time and Multi-Unit Operators Data TablesIn order to produce this analysis, John W. O’Neill, MAI, ISHC, Ph.D., professor of hospitality management
and director of the Center for Hospitality Real Estate Strategy in the School of Hospitality Management at
Penn State University and Yuxia Ouyang, doctoral student, reviewed Airbnb listing data in 14 major cities
from October 2014 through September 2015. The tables below provide a detailed snapshot of the data
and calculations reflected in the analysis.
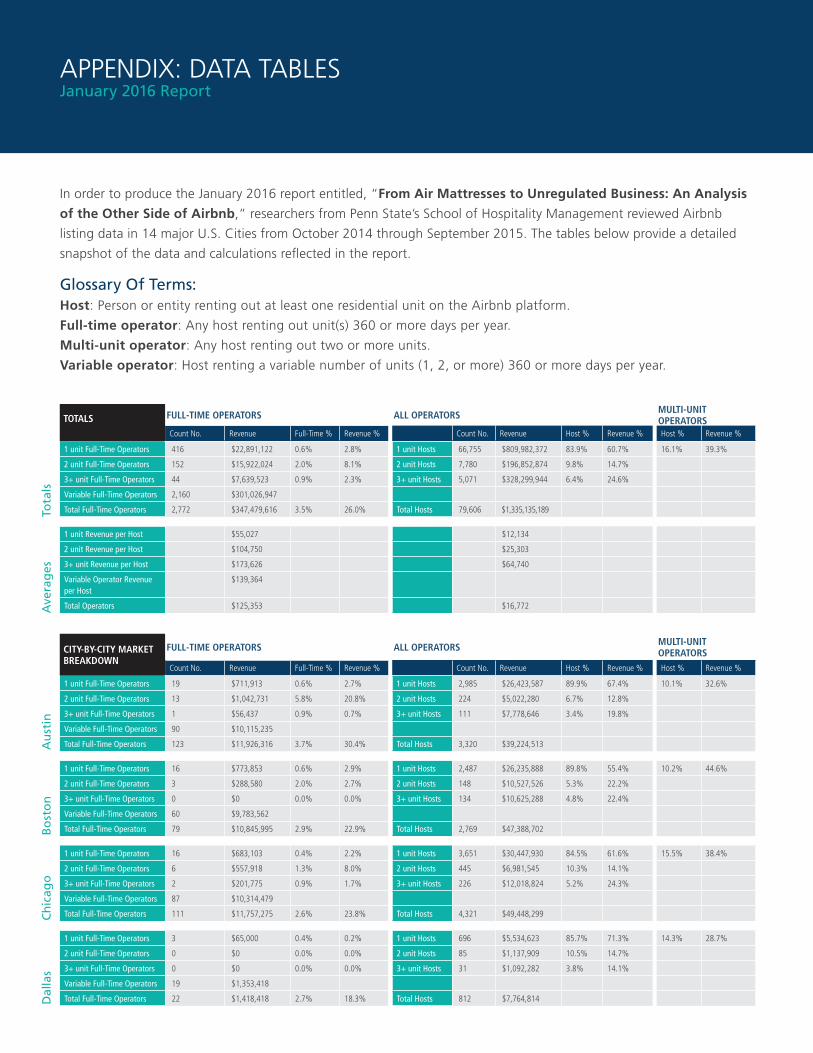
APPENDIX: DATA TABLESJanuary 2016 Report
In order to produce the January 2016 report entitled, “From Air Mattresses to Unregulated Business: An Analysis of the Other Side of Airbnb,” researchers from Penn State’s School of Hospitality Management reviewed Airbnb
listing data in 14 major U.S. Cities from October 2014 through September 2015. The tables below provide a detailed
snapshot of the data and calculations reflected in the report.
Glossary Of Terms:Host: Person or entity renting out at least one residential unit on the Airbnb platform.
Full-time operator: Any host renting out unit(s) 360 or more days per year.
Multi-unit operator: Any host renting out two or more units.
Variable operator: Host renting a variable number of units (1, 2, or more) 360 or more days per year.
FULL-TIME OPERATORS ALL OPERATORS MULTI-UNIT OPERATORS
Count No. Revenue Full-Time % Revenue % Count No. Revenue Host % Revenue % Host % Revenue %
1 unit Full-Time Operators 19 $711,913 0.6% 2.7% 1 unit Hosts 2,985 $26,423,587 89.9% 67.4% 10.1% 32.6%
2 unit Full-Time Operators 13 $1,042,731 5.8% 20.8% 2 unit Hosts 224 $5,022,280 6.7% 12.8%
3+ unit Full-Time Operators 1 $56,437 0.9% 0.7% 3+ unit Hosts 111 $7,778,646 3.4% 19.8%
Variable Full-Time Operators 90 $10,115,235
Total Full-Time Operators 123 $11,926,316 3.7% 30.4% Total Hosts 3,320 $39,224,513
1 unit Full-Time Operators 16 $773,853 0.6% 2.9% 1 unit Hosts 2,487 $26,235,888 89.8% 55.4% 10.2% 44.6%
2 unit Full-Time Operators 3 $288,580 2.0% 2.7% 2 unit Hosts 148 $10,527,526 5.3% 22.2%
3+ unit Full-Time Operators 0 $0 0.0% 0.0% 3+ unit Hosts 134 $10,625,288 4.8% 22.4%
Variable Full-Time Operators 60 $9,783,562
Total Full-Time Operators 79 $10,845,995 2.9% 22.9% Total Hosts 2,769 $47,388,702
1 unit Full-Time Operators 16 $683,103 0.4% 2.2% 1 unit Hosts 3,651 $30,447,930 84.5% 61.6% 15.5% 38.4%
2 unit Full-Time Operators 6 $557,918 1.3% 8.0% 2 unit Hosts 445 $6,981,545 10.3% 14.1%
3+ unit Full-Time Operators 2 $201,775 0.9% 1.7% 3+ unit Hosts 226 $12,018,824 5.2% 24.3%
Variable Full-Time Operators 87 $10,314,479
Total Full-Time Operators 111 $11,757,275 2.6% 23.8% Total Hosts 4,321 $49,448,299
1 unit Full-Time Operators 3 $65,000 0.4% 0.2% 1 unit Hosts 696 $5,534,623 85.7% 71.3% 14.3% 28.7%
2 unit Full-Time Operators 0 $0 0.0% 0.0% 2 unit Hosts 85 $1,137,909 10.5% 14.7%
3+ unit Full-Time Operators 0 $0 0.0% 0.0% 3+ unit Hosts 31 $1,092,282 3.8% 14.1%
Variable Full-Time Operators 19 $1,353,418
Total Full-Time Operators 22 $1,418,418 2.7% 18.3% Total Hosts 812 $7,764,814
Ch
icag
oB
ost
on
Au
stin
Dal
las
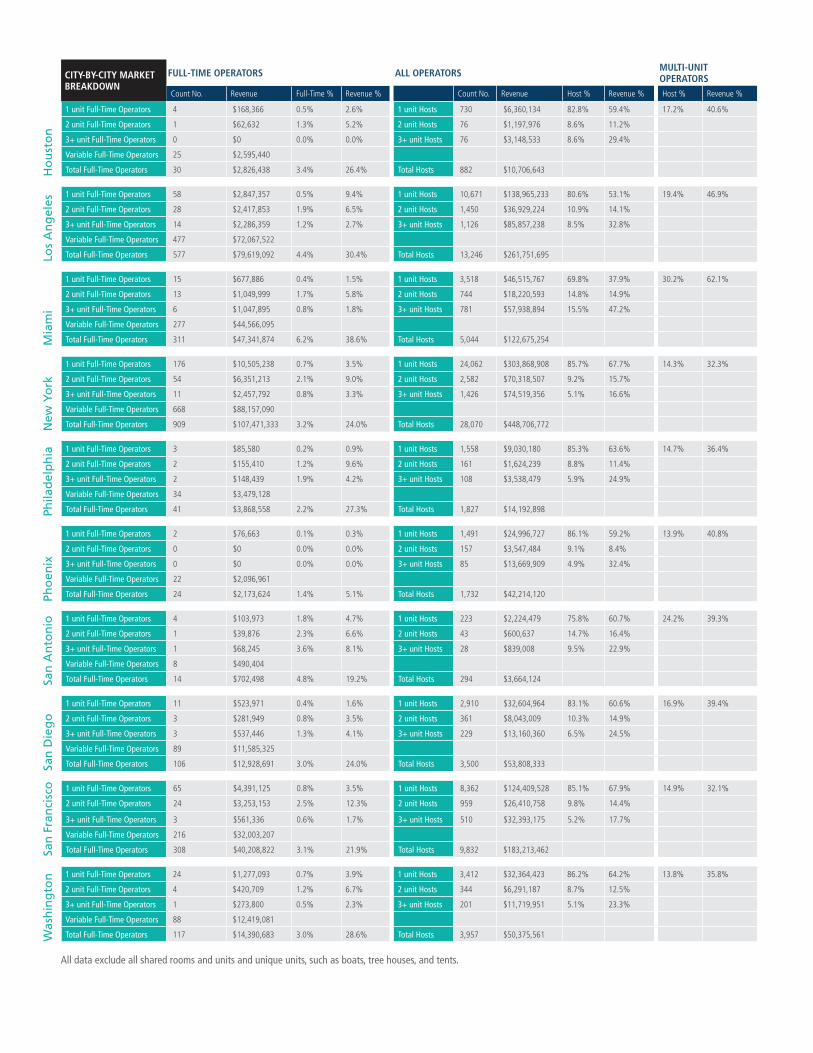
CITY-BY-CITY MARKET BREAKDOWN
FULL-TIME OPERATORS ALL OPERATORS MULTI-UNIT OPERATORS
Count No. Revenue Full-Time % Revenue % Count No. Revenue Host % Revenue % Host % Revenue %
1 unit Full-Time Operators 416 $22,891,122 0.6% 2.8% 1 unit Hosts 66,755 $809,982,372 83.9% 60.7% 16.1% 39.3%
2 unit Full-Time Operators 152 $15,922,024 2.0% 8.1% 2 unit Hosts 7,780 $196,852,874 9.8% 14.7%
3+ unit Full-Time Operators 44 $7,639,523 0.9% 2.3% 3+ unit Hosts 5,071 $328,299,944 6.4% 24.6%
Variable Full-Time Operators 2,160 $301,026,947
Total Full-Time Operators 2,772 $347,479,616 3.5% 26.0% Total Hosts 79,606 $1,335,135,189
1 unit Revenue per Host $55,027 $12,134
2 unit Revenue per Host $104,750 $25,303
3+ unit Revenue per Host $173,626 $64,740
Variable Operator Revenue per Host
$139,364
Total Operators $125,353 $16,772
Tota
lsA
vera
ges
TOTALS
From Air Mattresses to Unregulated Business: An Analysis of the Other Side of Airbnb
City Spotlight:
PHOENIX, ARIZONA
FULL-TIME OPERATORS ALL OPERATORS MULTI-UNIT OPERATORS
Count No. Revenue Full-Time % Revenue % Count No. Revenue Host % Revenue % Host % Revenue %
1 unit Full-Time Operators 4 $168,366 0.5% 2.6% 1 unit Hosts 730 $6,360,134 82.8% 59.4% 17.2% 40.6%
2 unit Full-Time Operators 1 $62,632 1.3% 5.2% 2 unit Hosts 76 $1,197,976 8.6% 11.2%
3+ unit Full-Time Operators 0 $0 0.0% 0.0% 3+ unit Hosts 76 $3,148,533 8.6% 29.4%
Variable Full-Time Operators 25 $2,595,440
Total Full-Time Operators 30 $2,826,438 3.4% 26.4% Total Hosts 882 $10,706,643
1 unit Full-Time Operators 58 $2,847,357 0.5% 9.4% 1 unit Hosts 10,671 $138,965,233 80.6% 53.1% 19.4% 46.9%
2 unit Full-Time Operators 28 $2,417,853 1.9% 6.5% 2 unit Hosts 1,450 $36,929,224 10.9% 14.1%
3+ unit Full-Time Operators 14 $2,286,359 1.2% 2.7% 3+ unit Hosts 1,126 $85,857,238 8.5% 32.8%
Variable Full-Time Operators 477 $72,067,522
Total Full-Time Operators 577 $79,619,092 4.4% 30.4% Total Hosts 13,246 $261,751,695
1 unit Full-Time Operators 15 $677,886 0.4% 1.5% 1 unit Hosts 3,518 $46,515,767 69.8% 37.9% 30.2% 62.1%
2 unit Full-Time Operators 13 $1,049,999 1.7% 5.8% 2 unit Hosts 744 $18,220,593 14.8% 14.9%
3+ unit Full-Time Operators 6 $1,047,895 0.8% 1.8% 3+ unit Hosts 781 $57,938,894 15.5% 47.2%
Variable Full-Time Operators 277 $44,566,095
Total Full-Time Operators 311 $47,341,874 6.2% 38.6% Total Hosts 5,044 $122,675,254
1 unit Full-Time Operators 176 $10,505,238 0.7% 3.5% 1 unit Hosts 24,062 $303,868,908 85.7% 67.7% 14.3% 32.3%
2 unit Full-Time Operators 54 $6,351,213 2.1% 9.0% 2 unit Hosts 2,582 $70,318,507 9.2% 15.7%
3+ unit Full-Time Operators 11 $2,457,792 0.8% 3.3% 3+ unit Hosts 1,426 $74,519,356 5.1% 16.6%
Variable Full-Time Operators 668 $88,157,090
Total Full-Time Operators 909 $107,471,333 3.2% 24.0% Total Hosts 28,070 $448,706,772
1 unit Full-Time Operators 3 $85,580 0.2% 0.9% 1 unit Hosts 1,558 $9,030,180 85.3% 63.6% 14.7% 36.4%
2 unit Full-Time Operators 2 $155,410 1.2% 9.6% 2 unit Hosts 161 $1,624,239 8.8% 11.4%
3+ unit Full-Time Operators 2 $148,439 1.9% 4.2% 3+ unit Hosts 108 $3,538,479 5.9% 24.9%
Variable Full-Time Operators 34 $3,479,128
Total Full-Time Operators 41 $3,868,558 2.2% 27.3% Total Hosts 1,827 $14,192,898
1 unit Full-Time Operators 2 $76,663 0.1% 0.3% 1 unit Hosts 1,491 $24,996,727 86.1% 59.2% 13.9% 40.8%
2 unit Full-Time Operators 0 $0 0.0% 0.0% 2 unit Hosts 157 $3,547,484 9.1% 8.4%
3+ unit Full-Time Operators 0 $0 0.0% 0.0% 3+ unit Hosts 85 $13,669,909 4.9% 32.4%
Variable Full-Time Operators 22 $2,096,961
Total Full-Time Operators 24 $2,173,624 1.4% 5.1% Total Hosts 1,732 $42,214,120
1 unit Full-Time Operators 4 $103,973 1.8% 4.7% 1 unit Hosts 223 $2,224,479 75.8% 60.7% 24.2% 39.3%
2 unit Full-Time Operators 1 $39,876 2.3% 6.6% 2 unit Hosts 43 $600,637 14.7% 16.4%
3+ unit Full-Time Operators 1 $68,245 3.6% 8.1% 3+ unit Hosts 28 $839,008 9.5% 22.9%
Variable Full-Time Operators 8 $490,404
Total Full-Time Operators 14 $702,498 4.8% 19.2% Total Hosts 294 $3,664,124
1 unit Full-Time Operators 11 $523,971 0.4% 1.6% 1 unit Hosts 2,910 $32,604,964 83.1% 60.6% 16.9% 39.4%
2 unit Full-Time Operators 3 $281,949 0.8% 3.5% 2 unit Hosts 361 $8,043,009 10.3% 14.9%
3+ unit Full-Time Operators 3 $537,446 1.3% 4.1% 3+ unit Hosts 229 $13,160,360 6.5% 24.5%
Variable Full-Time Operators 89 $11,585,325
Total Full-Time Operators 106 $12,928,691 3.0% 24.0% Total Hosts 3,500 $53,808,333
1 unit Full-Time Operators 65 $4,391,125 0.8% 3.5% 1 unit Hosts 8,362 $124,409,528 85.1% 67.9% 14.9% 32.1%
2 unit Full-Time Operators 24 $3,253,153 2.5% 12.3% 2 unit Hosts 959 $26,410,758 9.8% 14.4%
3+ unit Full-Time Operators 3 $561,336 0.6% 1.7% 3+ unit Hosts 510 $32,393,175 5.2% 17.7%
Variable Full-Time Operators 216 $32,003,207
Total Full-Time Operators 308 $40,208,822 3.1% 21.9% Total Hosts 9,832 $183,213,462
1 unit Full-Time Operators 24 $1,277,093 0.7% 3.9% 1 unit Hosts 3,412 $32,364,423 86.2% 64.2% 13.8% 35.8%
2 unit Full-Time Operators 4 $420,709 1.2% 6.7% 2 unit Hosts 344 $6,291,187 8.7% 12.5%
3+ unit Full-Time Operators 1 $273,800 0.5% 2.3% 3+ unit Hosts 201 $11,719,951 5.1% 23.3%
Variable Full-Time Operators 88 $12,419,081
Total Full-Time Operators 117 $14,390,683 3.0% 28.6% Total Hosts 3,957 $50,375,561
All data exclude all shared rooms and units and unique units, such as boats, tree houses, and tents.
Pho
enix
San
An
ton
ioSa
n D
ieg
oSa
n F
ran
cisc
oW
ash
ing
ton
Phila
del
ph
iaM
iam
iN
ew Y
ork
Los
An
gel
es
CITY-BY-CITY MARKET BREAKDOWN
Ho
ust
on

MARCH, 2016
From Air Mattresses to Unregulated Business: An Analysis of the Other Side of Airbnb
City Spotlight:
PHOENIX, ARIZONA

Data SourceThe data used in this report were sourced from Airdna, which tracks Airbnb revenues and operations and provides pricing and revenue data to Airbnb operators. Airdna conducts a continuous search of the Airbnb web site, resulting in each Airbnb listing being analyzed once every seven days.
The data cover 14 of the nation’s largest metropolitan statistical areas (MSAs): New York, Chicago, Los Angeles, Philadelphia, Miami, Houston, Dallas, Phoenix, San Antonio, San Diego, San Francisco, Boston, Austin and Washington, D.C. The research focuses on hosts who rent multiple units and the length of time they are renting their units.
Kalibri Labs, a hospitality research firm, sorted the data, which included Airbnb operators from October 2014 through September 2015.
Exclusions: All data exclude all shared rooms and units and unique units, such as boats, tree houses, and tents.
Additional Information:John W. O’Neill, MAI, ISHC, Ph.D., professor of hospitality management and director of the Center for Hospitality Real Estate Strategy in the School of Hospitality Management at Penn State University and Yuxia Ouyang, doctoral student, conducted the analysis and developed the key findings. They examined over 448,000 lines of data and over 10.2 million variables.
This study was primarily funded by the American Hotel & Lodging Educational Foundation. Additional funds provided by the American Hotel & Lodging Association. Penn State University received no funding for the study.
Glossary of Terms Host: Person or entity renting out at least one residential unit on the Airbnb platform.
Full-time operator: Any host renting out unit(s) 360 or more days per year.
Multi-unit operator: Any host renting out two or more units.
BACKGROUNDIn January, 2016, the American Hotel & Lodging Association (AH&LA) released an analysis providing a view of the commercial activity being conducted on Airbnb in the nation’s largest metropolitan statistical areas (MSAs). John W. O’Neill, MAI, ISHC, Ph.D., professor of hospitality management and director of the Center for Hospitality Real Estate Strategy in the School of Hospitality Management at Penn State University, conducted the analysis of over 448,000 lines of data and over 10.2 million variables and developed the key findings, which include:
� More than a quarter (26%) of Airbnb’s revenue in 14 of the nation’s largest markets – $347
million – came from operators who list properties for rent full-time, or for 360 days or more
during 12 months from October 2014 through September 2015.
� Based on a rigorous analysis of Airbnb listing data in 14 major U.S. metropolitan areas over the
course of a full year, commercial operators in the nation’s largest cities generate a substantial
share of the company’s revenue by renting out multiple residential properties year-round.
� The number of people renting out two or more residential properties on Airbnb appears to be
growing, and nearly 40% of the company’s revenue in 14 of the nation’s largest cities is generated
by these “multi-unit operators,” totaling more than half a billion dollars a year.
The following analysis provides greater detail about the commercial activity being conducted on
Airbnb the Phoenix MSA.

KEY FINDINGS: PHOENIX REGIONThe data show that Airbnb operators listing residential properties for rent for the bulk of the year
drive a disproportionate share of the company’s revenue in the Phoenix MSA.
Number of Days Operator Lists Unit for Rent
Number of Operators 10/2014 – 9/2015
Revenue Generated 10/2014 – 9/2015
% of Airbnb Operator Population 10/2014 – 9/2015
% of Airbnb’s Revenue 10/2014 – 9/2015
30+ Days / Year 1,478 $41,246,320 85.33% 97.71%
180+ Days / Year 245 $9,112,300 14.15% 21.59%
360+ Days / Year 24 $2,173,623 1.39% 5.15%
The five Phoenix area ZIP codes with the most properties listed on Airbnb account for nearly
$8 million, or 19% of Airbnb’s revenue in the Phoenix MSA.
ZIP Code Neighborhoods Host Count 10/2014 – 9/2015
Property Count 10/2014 – 9/2015
Revenue 10/2014 – 9/2015
85251 Scottsdale, Las Viviendas, Desert Cove, Waterfront 191 235 $3,100,631
85254 Greenway Park, Cactus Glen, Desert Trails 76 142 $1,657,416
85260 Northsight, Encata, Sundown Vista 75 91 $1,268,313
85281 Tempe, University Heights, Lindon Park 82 85 $1,072,307
85006 Coronado, Avalon, Kenwood 54 70 $794,527
Total 478 623 $7,893,194
If Airbnb operators in the Phoenix area followed the same tax rubric as other local lodging
businesses in the City of Phoenix, in the 12 months between October 2014 and September 2015
they would have owed municipal governments in the region more than $5 million in local taxes.
City of Phoenix Lodging Taxes
State Sales Tax City Sales Tax Total Phoenix Tax Rate
Airbnb’s Phoenix Regional Revenue
Airbnb’s Estimated Tax Obligation
7.27% 5.3% 12.57% $42,214,119 $5,306,314
Almost all of Airbnb’s revenue in the Phoenix area – 97% or more than $41 million – comes from operators who list units for
rent for more than 30 days per year.
Almost a quarter (21%) of Airbnb’s Phoenix-area revenue – more than $9 million – comes from operators who list properties
for rent more than 180 days a year.21%
More than a third (41%) of Airbnb’s revenue in the Phoenix region – $17 million – comes from operators who list
multiple units for rent.
$41M
41%

APPENDIX: PHOENIX METROPOLITAN STATISTICAL AREA DATA TABLESRevenue Analysis by ZIP CodeZIP Code
Property Count 10/2014 – 9/2015
Revenue 10/2014 – 9/2015
ZIP Code Host Count 10/2014 – 9/2015
Revenue 10/2014 – 9/2015
85251 235 $3,100,631 85251 191 $3,100,631
85254 142 $1,657,416 85281 82 $1,072,307
85260 91 $1,268,313 85254 76 $1,657,416
85281 85 $1,072,307 85260 75 $1,268,313
85006 70 $794,527 85018 62 $1,683,640
85018 69 $1,683,640 85250 55 $673,071
85014 63 $916,822 85006 54 $794,527
85250 61 $673,071 85016 52 $912,988
85016 54 $912,988 85258 49 $940,262
85258 54 $940,262 85014 48 $916,822
Frequent Hosts
Number of Days Operator Lists Unit(s) for Rent
Operator Count 10/2014 – 9/2015
Revenue 10/2014 – 9/2015
Percent of Operators Who List Unit(s) for Multiple Days 10/2014 – 9/2015
Percent of Revenue From Operators Who List Unit(s) for Multiple Days 10/2014 – 9/2015
Total 1,732 $42,214,120 – –
30+ days 1,478 $41,246,321 85.33% 97.71%
60+ days 921 $31,215,121 53.18% 73.94%
90+ days 665 $27,106,524 38.39% 64.21%
120+ days 456 $12,216,520 26.33% 28.94%
180+ days 245 $9,112,301 14.15% 21.59%
360+ days 24 $2,173,624 1.39% 5.15%
From Air Mattresses to Unregulated Business: An Analysis of the Other Side of Airbnb
City Spotlight:
LOS ANGELES, CALIFORNIA

MARCH, 2016
From Air Mattresses to Unregulated Business: An Analysis of the Other Side of Airbnb
City Spotlight:
LOS ANGELES, CALIFORNIA

Data SourceThe data used in this report were sourced from Airdna, which tracks Airbnb revenues and operations and provides pricing and revenue data to Airbnb operators. Airdna conducts a continuous search of the Airbnb web site, resulting in each Airbnb listing being analyzed once every seven days.
The data cover 14 of the nation’s largest metropolitan statistical areas (MSAs): New York, Chicago, Los Angeles, Philadelphia, Miami, Houston, Dallas, Phoenix, San Antonio, San Diego, San Francisco, Boston, Austin and Washington, D.C. The research focuses on hosts who rent multiple units and the length of time they are renting their units.
Kalibri Labs, a hospitality research firm, sorted the data, which included Airbnb operators from October 2014 through September 2015.
Exclusions: All data exclude all shared rooms and units and unique units, such as boats, tree houses, and tents.
Additional Information:John W. O’Neill, MAI, ISHC, Ph.D., professor of hospitality management and director of the Center for Hospitality Real Estate Strategy in the School of Hospitality Management at Penn State University and Yuxia Ouyang, doctoral student, conducted the analysis and developed the key findings. They examined over 448,000 lines of data and over 10.2 million variables.
This study was primarily funded by the American Hotel & Lodging Educational Foundation. Additional funds provided by the American Hotel & Lodging Association. Penn State University received no funding for the study.
Glossary of Terms Host: Person or entity renting out at least one residential unit on the Airbnb platform.
Full-time operator: Any host renting out unit(s) 360 or more days per year.
Multi-unit operator: Any host renting out two or more units.
BACKGROUNDIn 2016, the American Hotel & Lodging Association (AH&LA) released an analysis providing a view of the commercial activity being conducted on Airbnb in the nation’s largest metropolitan statistical areas (MSAs). John W. O’Neill, MAI, ISHC, Ph.D., professor of hospitality management and director of the Center for Hospitality Real Estate Strategy in the School of Hospitality Management at Penn State University, conducted the analysis of over 448,000 lines of data and over 10.2 million variables and developed the key findings, which include:
� More than a quarter (26%) of Airbnb’s revenue in 14 of the nation’s largest markets – $347
million – came from operators who listed properties for rent full-time, or for 360 days or more,
during 12 months from October 2014 through September 2015.
� Based on a rigorous analysis of Airbnb listing data in 14 major U.S. metropolitan areas over the
course of a full year, commercial operators in the nation’s largest cities generate a substantial
share of the company’s revenue by renting out multiple residential properties year-round.
� The number of people renting out two or more residential properties on Airbnb appears to be
growing, and nearly 40% of the company’s revenue in 14 of the nation’s largest cities is generated
by these “multi-unit operators,” totaling more than half a billion dollars a year.
The following analysis provides greater detail about the commercial activity being conducted on
Airbnb in the Los Angeles MSA.

KEY FINDINGS: LOS ANGELES REGIONThe data show that Airbnb operators listing residential properties for rent for the bulk of the year
drive a disproportionate share of the company’s revenue in the LA region.
Number of Days Operator Lists Unit for Rent
Number of Operators 10/2014 – 9/2015
Revenue Generated 10/2014 – 9/2015
% of Airbnb Operator Population 10/2014 – 9/2015
% of Airbnb’s Revenue 10/2014 – 9/2015
30+ Days / Year 11,096 $257,583,147 83.77% 98.41%
180+ Days / Year 2,941 $181,547,646 22.20% 69.36%
360+ Days / Year 577 $79,619,092 4.36% 30.42%
The five LA area ZIP codes with the most properties listed on Airbnb account for nearly $81
million, or 31% of Airbnb’s revenue in the LA metropolitan area.
ZIP Code Neighborhoods Host Count 10/2014 – 9/2015
Property Count 10/2014 – 9/2015
Revenue 10/2014 – 9/2015
90291 Venice, Venice Beach, Oakwood 1,082 1,582 $32,857,565
90046 West Hollywood, Hollywood Hills, Laurel Canyon 883 1,125 $18,028,931
90028 Hollywood 595 964 $14,806,487
90026 Angelino Heights, Silver Lake, Echo Park 606 702 $10,065,162
90036 Fairfax, La Brea, Miracle Mile 402 544 $7,972,326
Total 3,568 4,917 $83,730,471
If Airbnb in the LA region followed the same tax rubric as other local lodging businesses in the
City of Los Angeles, in the 12 months between October 2014 and September 2015 they would
have owed municipal governments in the region more than $41 million in local taxes.
City of Los Angeles Lodging Taxes
Room Tax Assessment Tax Tourism Fee Total City of LA Lodging Tax Rate
Airbnb’s LA Regional Revenue
Airbnb’s Estimated Tax Obligation
14% .2% 1.5% 15.7% $261,751,695 $41,095,016
Almost three-fourths (69%) of Airbnb’s LA-area revenue – more than $180 million – comes from operators who list properties for
rent more than 180 days per year.
Almost all of Airbnb’s revenue in the LA-area – 98% or more than $250 million – comes from operators who list units for rent
more than 30 days per year.98%
More than 30% of Airbnb’s revenue in the LA area came from the 4.4% of operators who listed properties for rent for
more than 360 days per year.
$180M
30%

APPENDIX: LOS ANGELES METROPOLITAN STATISTICAL AREA DATA TABLESRevenue Analysis by ZIP CodeZIP Code
Property Count 10/2014 – 9/2015
Revenue 10/2014 – 9/2015
ZIP Code Host Count 10/2014 – 9/2015
Revenue 10/2014 – 9/2015
90291 1,582 $32,857,565 90291 1,082 $32,857,565
90046 1,125 $18,028,931 90046 883 $18,028,931
90028 964 $14,806,487 90026 606 $10,065,162
90026 702 $10,065,162 90028 595 $14,806,487
90036 544 $7,972,326 90027 414 $5,058,872
90068 485 $8,263,758 90069 408 $7,737,891
90027 476 $5,058,872 90036 402 $7,972,326
90069 473 $7,737,891 90068 402 $8,263,758
90405 438 $6,782,431 90405 397 $6,782,431
90292 402 $7,001,520 90292 313 $7,001,520
Frequent Hosts
Number of Days Operator Lists Unit(s) for Rent
Operator Count 10/2014 – 9/2015
Revenue 10/2014 – 9/2015
Percent of Operators Who List Unit(s) for Multiple Days 10/2014 – 9/2015
Percent of Revenue From Operators Who List Unit(s) for Multiple Days 10/2014 – 9/2015
Total 13,246 $261,751,695 – –
30+ days 11,096 $257,583,147 83.77% 98.41%
60+ days 8,089 $245,573,376 61.07% 93.82%
90+ days 6,004 $229,957,872 45.33% 87.85%
120+ days 4,659 $213,790,685 35.17% 81.68%
180+ days 2,941 $181,547,646 22.20% 69.36%
360+ days 577 $79,619,092 4.36% 30.42%
From Air Mattresses to Unregulated Business: An Analysis of the Other Side of Airbnb
City Spotlight:
CHICAGO, ILLINOIS

MAY, 2016
From Air Mattresses to Unregulated Business: An Analysis of the Other Side of Airbnb
City Spotlight:
CHICAGO, ILLINOIS

Data SourceThe data used in this report were sourced from Airdna, which tracks Airbnb revenues and operations and provides pricing and revenue data to Airbnb operators. Airdna conducts a continuous search of the Airbnb web site, resulting in each Airbnb listing being analyzed once every seven days.
The data cover 14 of the nation’s largest metropolitan statistical areas (MSAs): New York, Chicago, Los Angeles, Philadelphia, Miami, Houston, Dallas, Phoenix, San Antonio, San Diego, San Francisco, Boston, Austin and Washington, D.C. The research focuses on hosts who rent multiple units and the length of time they are renting their units.
Kalibri Labs, a hospitality research firm, sorted the data, which included Airbnb operators from October 2014 through September 2015.
Exclusions: All data exclude all shared rooms and units and unique units, such as boats, tree houses, and tents.
Additional Information:John W. O’Neill, MAI, ISHC, Ph.D., professor of hospitality management and director of the Center for Hospitality Real Estate Strategy in the School of Hospitality Management at Penn State University and Yuxia Ouyang, doctoral student, conducted the analysis and developed the key findings. They examined over 448,000 lines of data and over 10.2 million variables.
This study was primarily funded by the American Hotel & Lodging Educational Foundation. Additional funds provided by the American Hotel & Lodging Association. Penn State University received no funding for the analysis.
Glossary of Terms Host: Person or entity renting out at least one residential unit on the Airbnb platform.
Full-time operator: Any host renting out unit(s) 360 or more days per year.
Multi-unit operator: Any host renting out two or more units.
BACKGROUNDIn 2016, the American Hotel & Lodging Association (AH&LA) released an analysis providing a view of the commercial activity being conducted on Airbnb in the nation’s largest metropolitan statistical areas (MSAs). John W. O’Neill, MAI, ISHC, Ph.D., professor of hospitality management and director of the Center for Hospitality Real Estate Strategy in the School of Hospitality Management at Penn State University, conducted the analysis of over 448,000 lines of data and over 10.2 million variables and developed the key findings, which include:
� More than a quarter (26%) of Airbnb’s revenue in 14 of the nation’s largest markets –
$347 million – came from operators who listed properties for rent full-time, or for
360 days or more during 12 months from October 2014 through September 2015.
� Based on a rigorous analysis of Airbnb listing data in 14 major U.S. metropolitan areas over the
course of a full year, commercial operators in the nation’s largest cities generate a substantial
share of the company’s revenue by renting out multiple residential properties year-round.
� The number of people renting out two or more residential properties on Airbnb appears to be
growing, and nearly 40% of the company’s revenue in 14 of the nation’s largest cities is generated
by these “multi-unit operators,” totaling more than half a billion dollars a year.
The following analysis provides greater detail about the commercial activity being conducted on
Airbnb in the Chicago MSA.

KEY FINDINGS: CHICAGO REGIONThe data show that Airbnb operators listing residential properties for rent for the bulk of the year drive a disproportionate share of the company’s revenue in the Chicago region.
Number of Days Operator Lists Unit(s) for Rent
Number of Operators 10/2014 – 9/2015
Revenue Generated 10/2014 – 9/2015
% of Airbnb Operator Population 10/2014 – 9/2015
% of Airbnb’s Revenue 10/2014 – 9/2015
30+ Days / Year 3,210 $47,602,833 74.29% 96.27%
180+ Days / Year 635 $28,828,196 14.7% 58.3%
360+ Days / Year 111 $11,757,274 2.57% 23.78%
The five Chicago area ZIP codes with the most properties listed on Airbnb account for more than $20 million, or 41% of Airbnb’s revenue in the Chicago metropolitan area.
ZIP Code Neighborhoods Host Count 10/2014 – 9/2015
Property Count 10/2014 – 9/2015
Revenue 10/2014 – 9/2015
60657 Lake View, Boystown 391 434 $3,291,856
60611 Magnificent Mile, Streeterville 314 419 $4,622,857
60614 Lincoln Park, Sheffield Neighbors, Old Town Triangle 364 411 $4,179,342
60610 Old Town, Gold Coast 324 393 $4,415,188
60622 Wicker Park, West Town 291 333 $3,671,681
Total 1,684 1,990 $20,180,924
Almost all of Airbnb’s revenue in the Chicago region – 96% or more than $47 million – comes from operators who list units
for rent more than 30 days per year.
More than half (58%) of Airbnb’s Chicago-area revenue – almost $29 million – comes from operators who list properties
for rent more than 180 days per year. $29M
Operators listing multiple units for rent drove more than one-third (38%) of Airbnb’s revenue in the Chicago region –
$19 million.
96%
38%

APPENDIX: CHICAGO METROPOLITAN STATISTICAL AREA DATA TABLESRevenue Analysis by ZIP CodeZip Code
Property Count 10/2014 – 9/2015
Revenue 10/2014 – 9/2015
Zip Code Host Count 10/2014 – 9/2015
Revenue 10/2014 – 9/2015
60657 434 $3,291,856 60657 391 $3,291,856
60611 419 $4,622,857 60614 364 $4,179,342
60614 411 $4,179,342 60610 324 $4,415,188
60610 393 $4,415,188 60611 314 $4,622,857
60622 333 $3,671,681 60647 297 $2,906,511
60647 324 $2,906,511 60622 291 $3,671,681
60654 271 $2,296,983 60654 247 $2,296,983
60613 265 $2,233,421 60613 245 $2,233,421
60601 258 $2,913,019 60601 211 $2,913,019
60640 211 $1,538,997 60640 184 $1,538,997
Frequent Hosts
Number of Days Operator Lists Unit(s) for Rent
Operator Count 10/2014 – 9/2015
Revenue 10/2014 – 9/2015
Percent of Operators Who List Unit(s) for Multiple Days 10/2014 – 9/2015
Percent of Revenue From Operators Who List Unit(s) for Multiple Days 10/2014 – 9/2015
Total 4,321 $49,448,299.10 – –
30+ days 3,210 $47,602,834 74.29% 96.27%
60+ days 2,173 $43,882,554 50.29% 88.74%
90+ days 1,505 $39,414,950 34.83% 79.71%
120+ days 1,092 $35,595,780 25.27% 71.99%
180+ days 635 $28,828,197 14.70% 58.30%
360+ days 111 $11,757,275 2.57% 23.78%

JUNE, 2016
From Air Mattresses to Unregulated Business: An Analysis of the Other Side of Airbnb
City Spotlight:
MIAMI, FLORIDA

Data SourceThe data used in this report were sourced from Airdna, which tracks Airbnb revenues and operations and provides pricing and revenue data to Airbnb operators. Airdna conducts a continuous search of the Airbnb web site, resulting in each Airbnb listing being analyzed once every seven days.
The data cover 14 of the nation’s largest metropolitan statistical areas (MSAs): New York, Chicago, Los Angeles, Philadelphia, Miami, Houston, Dallas, Phoenix, San Antonio, San Diego, San Francisco, Boston, Austin and Washington, D.C. The research focuses on hosts who rent multiple units and length of time that hosts rent out their unit(s).
Kalibri Labs, a hospitality research firm, sorted the data, which included Airbnb operators from October 2014 through September 2015.
Exclusions: All data exclude all shared rooms and units and unique units, such as boats, tree houses, and tents.
Additional Information:John W. O’Neill, MAI, ISHC, Ph.D., professor of hospitality management and director of the Center for Hospitality Real Estate Strategy in the School of Hospitality Management at Penn State University and Yuxia Ouyang, doctoral student, conducted the analysis and developed the key findings. They examined over 448,000 lines of data and over 10.2 million variables.
This study was primarily funded by the American Hotel & Lodging Educational Foundation. Additional funds provided by the American Hotel & Lodging Association. Penn State University received no funding for the study.
Glossary of Terms Host: Person or entity renting out at least one residential unit on the Airbnb platform.
Full-time operator: Any host renting out unit(s) 360 or more days per year.
Multi-unit operator: Any host renting out two or more units.
BACKGROUNDIn 2016, the American Hotel & Lodging Association (AH&LA) released an analysis providing a
view of the commercial activity being conducted on Airbnb in the nation’s largest metropolitan
statistical areas (MSAs). John W. O’Neill, MAI, ISHC, Ph.D., professor of hospitality management
and director of the Center for Hospitality Real Estate Strategy in the School of Hospitality
Management at Penn State University, conducted the analysis of over 448,000 lines of data and
over 10.2 million variables and developed the key findings, which include:
� More than a quarter (26%) of Airbnb’s revenue in 14 of the nation’s largest markets – $347
million – came from operators who listed properties for rent full-time, or for 360 days or more,
during 12 months from October 2014 through September 2015.
� Based on a rigorous analysis of Airbnb listing data in 14 major U.S. metropolitan areas over the
course of a full year, commercial operators in the nation’s largest cities generate a substantial
share of the company’s revenue by renting out multiple residential properties and/or renting
properties year-round.
� The number of people renting out two or more residential properties on Airbnb appears to be
growing, and nearly 40% of the company’s revenue in 14 of the nation’s largest cities is generated
by these “multi-unit operators,” totaling more than half a billion dollars a year.
The following analysis provides greater detail about the commercial activity being conducted on
Airbnb in the Miami MSA.

KEY FINDINGS: MIAMI REGIONThe data show that Airbnb operators listing residential properties for rent for the bulk of the year
drive a large percentage of the company’s revenue in the Miami region.
Number of Days Operator Lists Unit(s) for Rent
Number of Operators 10/2014 – 9/2015
Revenue Generated 10/2014 – 9/2015
% of Airbnb Operator Population 10/2014 – 9/2015
% of Airbnb’s Revenue 10/2014 – 9/2015
30+ Days / Year 4,533 $121,727,626 89.87 % 99.23%
180+ Days / Year 1,412 $93,584,435 27.99% 76.29%
360+ Days / Year 311 $47,341,874 6.17% 38.59%
The five Miami-area ZIP codes with the most properties listed on Airbnb from October 2014 through September
2015, accounted for more than $79 million, or 65% of Airbnb’s revenue in the Miami metropolitan area.
ZIP Code Neighborhoods Airbnb Operator Count10/2014 – 9/2015
Property Count 10/2014 – 9/2015
Airbnb Revenue 10/14 – 9/15
33139 South Beach, South Pointe, City Center 1,427 2,930 $45,687,010
33140 Bayshore, Mid-Beach 365 833 $11,534,012
33160 Golden Beach, Eastern Shores, Sunny Isles Beach 319 704 $8,742,640
33141 North Beach, North Bay Village 368 617 $7,520,232
33131 Downtown Miami, Brickell Key 287 424 $5,859,474
Total 2,766 5,508 $79,343,367
If Airbnb in the Miami region followed the same tax rubric as other local lodging businesses
in the City of Miami, in the 12 months between October 2014 and September 2015 Airbnb
operators in the metropolitan area would have owed almost $16 million in taxes.
City of Miami Lodging Taxes
Florida State Sales Tax
City of Miami Tax
City of Miami Hotel Room Occupancy Tax
Total City of Miami Lodging Tax Rate
Airbnb’s Miami Regional Revenue (10/14 – 9/15)
Airbnb’s Estimated Tax Obligation
7% 3% 3% 13% $122,675,254 $15,947,783
Operators listing multiple residential units for rent drove nearly
two-thirds (62%, the highest percentage of any city studied)
of Airbnb’s revenue in the Miami region, or more than $76 million.
Three-quarters (76%) of Airbnb’s Miami-area revenue, over
$93 million, came from operators who listed properties for rent
more than 180 days per year.
Full-time operators listing residential properties for rent 360 days or
more per year generated more than $47 million – 39% of Airbnb’s
revenue, the highest percentage of any city studied – in the Miami area.
62%
76%
39%

APPENDIX: MIAMI METROPOLITAN STATISTICAL AREA DATA TABLESRevenue Analysis by ZIP CodeZip Code
Property Count 10/2014 – 9/2015
Revenue 10/2014 – 9/2015
Zip Code Host Count 10/2014 – 9/2015
Revenue 10/2014 – 9/2015
33139 2,930 $45,687,010 33139 1,427 $45,687,010
33140 833 $11,534,012 33141 368 $7,520,232
33160 704 $8,742,640 33140 365 $11,534,012
33141 617 $7,520,232 33160 319 $8,742,640
33131 424 $5,859,474 33131 287 $5,859,474
33019 376 $3,633,028 33132 235 $4,555,822
33132 356 $4,555,822 33019 182 $3,633,028
33130 225 $2,100,584 33137 168 $1,738,627
33137 191 $1,738,627 33130 160 $2,100,584
33304 148 $1,459,188 33133 93 $1,659,930
Frequent Hosts
Number of Days Operator Lists Unit(s) for Rent
Operator Count 10/2014 – 9/2015
Revenue 10/2014 – 9/2015
Percent of Operators Who List Unit(s) for Multiple Days 10/2014 – 9/2015
Percent of Revenue From Operators Who List Unit(s) for Multiple Days 10/2014 – 9/2015
Total 5,044 $122,675,254 – –
30+ days 4,533 $121,727,627 89.87% 99.23%
60+ days 3,505 $118,179,990 69.49% 96.34%
90+ days 2,745 $112,926,256 54.42% 92.05%
120+ days 2,154 $106,338,476 42.70% 86.68%
180+ days 1,412 $93,584,435 27.99% 76.29%
360+ days 311 $47,341,874 6.17% 38.59%

JUNE, 2016
From Air Mattresses to Unregulated Business: An Analysis of the Other Side of Airbnb
City Spotlight:
BOSTON, MASSACHUSETTS

Data SourceThe data used in this report were sourced from Airdna, which tracks Airbnb revenues and operations and provides pricing and revenue data to Airbnb operators. Airdna conducts a continuous search of the Airbnb web site, resulting in each Airbnb listing being analyzed once every seven days.
The data cover 14 of the nation’s largest metropolitan statistical areas (MSAs): New York, Chicago, Los Angeles, Philadelphia, Miami, Houston, Dallas, Phoenix, San Antonio, San Diego, San Francisco, Boston, Austin and Washington, D.C. The research focuses on hosts who rent multiple units and length of time that hosts rent out their unit(s).
Kalibri Labs, a hospitality research firm, sorted the data, which included Airbnb operators from October 2014 through September 2015.
Exclusions: All data exclude all shared rooms and units and unique units, such as boats, tree houses, and tents.
Additional Information:John W. O’Neill, MAI, ISHC, Ph.D., professor of hospitality management and director of the Center for Hospitality Real Estate Strategy in the School of Hospitality Management at Penn State University and Yuxia Ouyang, doctoral student, conducted the analysis and developed the key findings. They examined over 448,000 lines of data and over 10.2 million variables.
This study was primarily funded by the American Hotel & Lodging Educational Foundation. Additional funds provided by the American Hotel & Lodging Association. Penn State University received no funding for the study.
Glossary of Terms Host: Person or entity renting out at least one residential unit on the Airbnb platform.
Full-time operator: Any host renting out unit(s) 360 or more days per year.
Multi-unit operator: Any host renting out two or more units.
BACKGROUNDIn 2016, the American Hotel & Lodging Association (AH&LA) released an analysis providing a
view of the commercial activity being conducted on Airbnb in the nation’s largest metropolitan
statistical areas (MSAs). John W. O’Neill, MAI, ISHC, Ph.D., professor of hospitality management
and director of the Center for Hospitality Real Estate Strategy in the School of Hospitality
Management at Penn State University, conducted the analysis of over 448,000 lines of data and
over 10.2 million variables and developed the key findings, which include:
� More than a quarter (26%) of Airbnb’s revenue in 14 of the nation’s largest markets – $347
million – came from operators who listed properties for rent full-time, or for 360 days or more,
during 12 months from October 2014 through September 2015.
� Based on a rigorous analysis of Airbnb listing data in 14 major U.S. metropolitan areas over the
course of a full year, commercial operators in the nation’s largest cities generate a substantial
share of the company’s revenue by renting out multiple residential properties and/or renting
properties year-round.
� The number of people renting out two or more residential properties on Airbnb appears to be
growing, and nearly 40% of the company’s revenue in 14 of the nation’s largest cities is generated
by these “multi-unit operators,” totaling more than half a billion dollars a year.
The following analysis provides greater detail about the commercial activity being conducted on
Airbnb in the Boston MSA.

KEY FINDINGS: BOSTON REGIONThe data show that Airbnb operators listing residential properties for rent for the bulk of the year
drive a large percentage of the company’s revenue in the Boston region.
Number of Days Operator Lists Unit(s) for Rent
Number of Operators 10/2014 – 9/2015
Revenue Generated 10/2014 – 9/2015
% of Airbnb Operator Population 10/2014 – 9/2015
% of Airbnb’s Revenue 10/2014 – 9/2015
30+ Days / Year 1,882 $39,218,458 67.97% 82.76%
180+ Days / Year 431 $24,846,265 15.57% 52.43%
360+ Days / Year 79 $10,845,995 2.85% 22.89%
The five Boston-area ZIP codes with the most properties listed on Airbnb from October 2014
through September 2015 accounted for more than $13 million, or 28% of Airbnb’s revenue in
the Boston metropolitan area.
ZIP Code
Neighborhoods Airbnb Operator Count10/2014 – 9/2015
Property Count 10/2014 – 9/2015
Airbnb Revenue 10/14 – 9/15
02139 Mid-Cambridge, East Cambridge, Riverside, Cambridgeport 205 254 $3,427,482
02116 Back Bay, Bay Village, Columbus 179 250 $2,629,783
02138 North Cambridge, Cambridge Highlands, West Cambridge 204 239 $2,974,939
02118 Central, Fenway, South End, North Dorchester 142 183 $ 2,486,161
02114 West End, Beacon Hill 134 158 $1,926,928
Total 864 1,084 $13,445,293
More than half (52%) of Airbnb’s Boston-area revenue – almost $25 million – comes from operators who listed properties
for rent more than 180 days per year.
Almost all of Airbnb’s revenue in the Boston region – 83% or almost $40 million – comes from operators who list units for
rent more than 30 days per year.
Operators listing multiple units for rent drove almost half (45%)
of Airbnb’s revenue in the Boston region – $21 million.
$25M
83%
45%
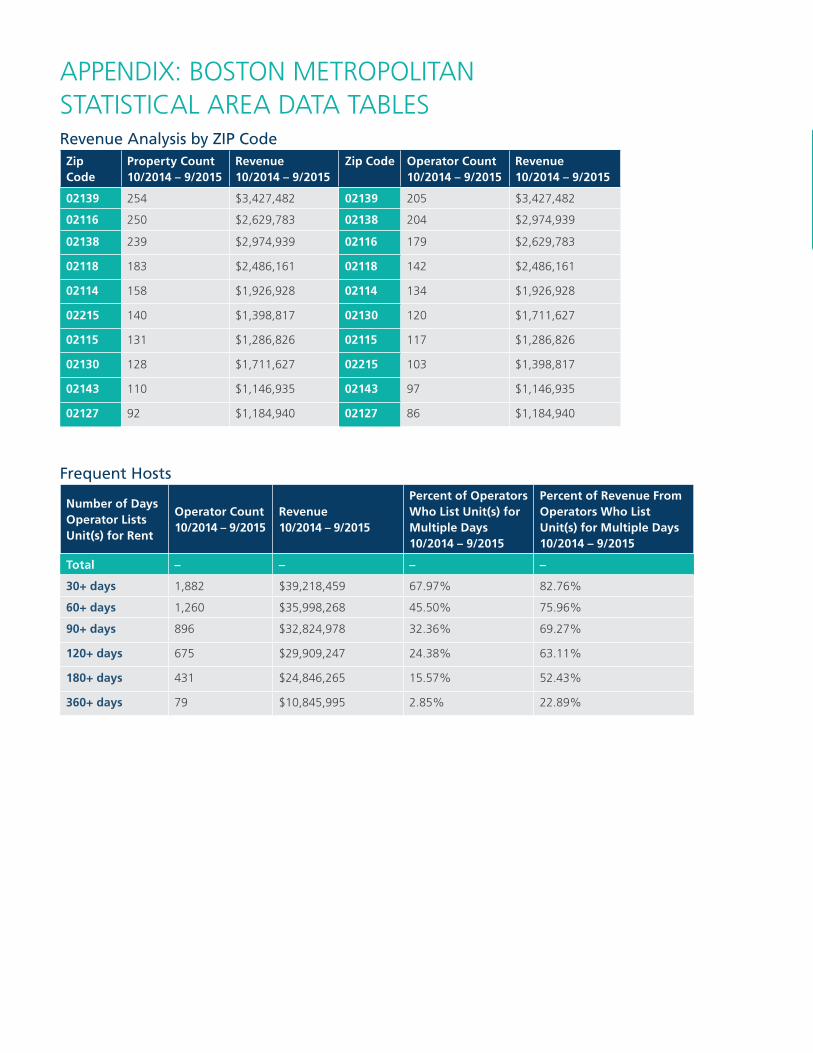
APPENDIX: BOSTON METROPOLITAN STATISTICAL AREA DATA TABLESRevenue Analysis by ZIP CodeZip Code
Property Count 10/2014 – 9/2015
Revenue 10/2014 – 9/2015
Zip Code Operator Count 10/2014 – 9/2015
Revenue 10/2014 – 9/2015
02139 254 $3,427,482 02139 205 $3,427,482
02116 250 $2,629,783 02138 204 $2,974,939
02138 239 $2,974,939 02116 179 $2,629,783
02118 183 $2,486,161 02118 142 $2,486,161
02114 158 $1,926,928 02114 134 $1,926,928
02215 140 $1,398,817 02130 120 $1,711,627
02115 131 $1,286,826 02115 117 $1,286,826
02130 128 $1,711,627 02215 103 $1,398,817
02143 110 $1,146,935 02143 97 $1,146,935
02127 92 $1,184,940 02127 86 $1,184,940
Frequent Hosts
Number of Days Operator Lists Unit(s) for Rent
Operator Count 10/2014 – 9/2015
Revenue 10/2014 – 9/2015
Percent of Operators Who List Unit(s) for Multiple Days 10/2014 – 9/2015
Percent of Revenue From Operators Who List Unit(s) for Multiple Days 10/2014 – 9/2015
Total – – – –
30+ days 1,882 $39,218,459 67.97% 82.76%
60+ days 1,260 $35,998,268 45.50% 75.96%
90+ days 896 $32,824,978 32.36% 69.27%
120+ days 675 $29,909,247 24.38% 63.11%
180+ days 431 $24,846,265 15.57% 52.43%
360+ days 79 $10,845,995 2.85% 22.89%

JUNE, 2016
From Air Mattresses to Unregulated Business: An Analysis of the Other Side of Airbnb
City Spotlight:
NEW YORK, NEW YORK

Data SourceThe data used in this report were sourced from Airdna, which tracks Airbnb revenues and operations and provides pricing and revenue data to Airbnb operators. Airdna conducts a continuous search of the Airbnb web site, resulting in each Airbnb listing being analyzed once every seven days.
The data cover 14 of the nation’s largest metropolitan statistical areas (MSAs): New York, Chicago, Los Angeles, Philadelphia, Miami, Houston, Dallas, Phoenix, San Antonio, San Diego, San Francisco, Boston, Austin and Washington, D.C. The research focuses on hosts who rent multiple units and length of time that hosts rent out their unit(s).
Kalibri Labs, a hospitality research firm, sorted the data, which included Airbnb operators from October 2014 through September 2015.
Exclusions: All data exclude all shared rooms and units and unique units, such as boats, tree houses, and tents.
Additional Information:John W. O’Neill, MAI, ISHC, Ph.D., professor of hospitality management and director of the Center for Hospitality Real Estate Strategy in the School of Hospitality Management at Penn State University and Yuxia Ouyang, doctoral student, conducted the analysis and developed the key findings. They examined over 448,000 lines of data and over 10.2 million variables.
This study was primarily funded by the American Hotel & Lodging Educational Foundation. Additional funds provided by the American Hotel & Lodging Association. Penn State University received no funding for the study.
Glossary of Terms Host: Person or entity renting out at least one residential unit on the Airbnb platform.
Full-time operator: Any host renting out unit(s) 360 or more days per year.
Multi-unit operator: Any host renting out two or more units.
BACKGROUNDIn 2016, the American Hotel & Lodging Association (AH&LA) released an analysis providing a
view of the commercial activity being conducted on Airbnb in the nation’s largest metropolitan
statistical areas (MSAs). John W. O’Neill, MAI, ISHC, Ph.D., professor of hospitality management
and director of the Center for Hospitality Real Estate Strategy in the School of Hospitality
Management at Penn State University, conducted the analysis of over 448,000 lines of data and
over 10.2 million variables and developed the key findings, which include:
� More than a quarter (26%) of Airbnb’s revenue in 14 of the nation’s largest markets – $347
million – came from operators who listed properties for rent full-time, or for 360 days or more,
during 12 months from October 2014 through September 2015.
� Based on a rigorous analysis of Airbnb listing data in 14 major U.S. metropolitan areas over the
course of a full year, commercial operators in the nation’s largest cities generate a substantial
share of the company’s revenue by renting out multiple residential properties and/or renting
properties year-round.
� The number of people renting out two or more residential properties on Airbnb appears to be
growing, and nearly 40% of the company’s revenue in 14 of the nation’s largest cities is generated
by these “multi-unit operators,” totaling more than half a billion dollars a year.
The following analysis provides greater detail about the commercial activity being conducted on
Airbnb in the New York City MSA.

KEY FINDINGS: NEW YORK CITY REGIONThe data show that Airbnb operators listing residential properties for rent for the bulk of the year
drive a large percentage of the company’s revenue in the New York City region.
Number of Days Operator Lists Unit(s) for Rent
Number of Operators 10/2014 – 9/2015
Revenue Generated 10/2014 – 9/2015
% of Airbnb Operator Population 10/2014 – 9/2015
% of Airbnb’s Revenue 10/2014 – 9/2015
30+ Days / Year 21,623 $432,861,637 77.03% 96.47%
180+ Days / Year 4,712 $265,478,756 16.79% 59.17%
360+ Days / Year 909 $107,471,333 3.24% 23.95%
The five New York City-area ZIP codes with the most properties listed on Airbnb from October
2014 through September 2015 accounted for more than $95 million, or 21% of Airbnb’s revenue
in the New York MSA.
ZIP Code
Neighborhoods Airbnb Operator Count10/2014 – 9/2015
Property Count 10/2014 – 9/2015
Airbnb Revenue 10/14 – 9/15
11211 Williamsburg 1,349 1,443 $18,905,453
10011 Chelsea 1,120 1,181 $18,095,204
10003 Union Square, Gramercy Park 1,090 1,165 $20,175,660
10002 Lower East Side 1,036 1,115 $19,363,658
10009 East Village 1,013 1,100 $18,598,365
Total 5,608 6,004 $95,138,340
If Airbnb operators in the New York City area followed the same tax rubric as other lodging
businesses in New York City, in the 12 months between October 2014 and September 2015 they
would have owed municipal governments in the region more than $75 million.
City of New York Lodging Taxes
State Tax
City Sales Tax
Transportation District Surcharge
Hotel Room Occupancy Tax
Total Tax Rate
NY Unit Fee
Occupancy Tax
Total Fee/Night
Sold Room Nights
Airbnb’s NYC Regional Revenue
Airbnb’s Estimated Tax Obligation
4% 4.5% .375% 5.88% 14.75% $1.50 $2.00 $3.50 2,582,659 $448,706,771 $75,223,555
Nearly one-quarter of Airbnb’s revenue in the New York City area – 24% or more than $107 million – comes from operators
who list units for rent full-time.
More than half (59%) of Airbnb’s New York City revenue – over $265 million – comes from operators who listed units for
rent more than 180 days per year.
Operators listing multiple units for rent drove almost one-third (32%) of Airbnb’s revenue in the New York City region –
$145 million.
$265M
32%
24%

APPENDIX: NEW YORK CITY METROPOLITAN STATISTICAL AREA DATA TABLESRevenue Analysis by ZIP CodeZip Code
Property Count 10/2014 – 9/2015
Revenue 10/2014 – 9/2015
Zip Code Host Count 10/2014 – 9/2015
Revenue 10/2014 – 9/2015
11211 1,443 $18,905,453 11211 1,349 $18,905,453
10011 1,181 $18,095,204 10011 1,120 $18,095,204
10003 1,165 $20,175,660 10003 1,090 $20,175,660
10002 1,115 $19,363,658 10002 1,036 $19,363,658
10009 1,100 $18,598,365 10014 1,018 $19,070,874
10014 1,085 $19,070,874 10009 1,013 $18,598,365
10019 1,027 $20,378,469 10019 897 $20,378,469
10012 926 $18,464,117 10012 870 $18,464,117
10016 765 $10,386,529 11238 711 $7,532,799
11238 764 $7,532,799 10016 708 $10,386,529
Frequent Hosts
Number of Days Operator Lists Unit(s) for Rent
Operator Count 10/2014 – 9/2015
Revenue 10/2014 – 9/2015
Percent of Operators Who List Unit(s) for Multiple Days 10/2014 – 9/2015
Percent of Revenue From Operators Who List Unit(s) for Multiple Days 10/2014 – 9/2015
Total 28,070 $448,706,772 – –
30+ days 21,623 $432,861,638 77.03% 96.47%
60+ days 14,789 $398,392,112 52.69% 88.79%
90+ days 10,403 $358,837,333 37.06% 79.97%
120+ days 7,681 $323,158,044 27.36% 72.02%
180+ days 4,712 $265,478,757 16.79% 59.17%
360+ days 909 $107,471,333 3.24% 23.95%

SEPTEMBER, 2016
From Air Mattresses to Unregulated Business: An Analysis of the Other Side of Airbnb
City Spotlight:
PHILADELPHIA, PENNSYLVANIA

Data SourceThe data used in this report were sourced from Airdna, which tracks Airbnb revenues and operations and provides pricing and revenue data to Airbnb operators. Airdna conducts a continuous search of the Airbnb web site, resulting in each Airbnb listing being analyzed once every seven days.
The data cover 14 of the nation’s largest metropolitan statistical areas (MSAs): New York, Chicago, Los Angeles, Philadelphia, Miami, Houston, Dallas, Phoenix, San Antonio, San Diego, San Francisco, Boston, Austin and Washington, D.C. The research focuses on hosts who rent multiple units and length of time that hosts rent out their unit(s).
Kalibri Labs, a hospitality research firm, sorted the data, which included Airbnb operators from October 2014 through September 2015.
Exclusions: All data exclude all shared rooms and units and unique units, such as boats, tree houses, and tents.
Additional Information:John W. O’Neill, MAI, ISHC, Ph.D., professor of hospitality management and director of the Center for Hospitality Real Estate Strategy in the School of Hospitality Management at Penn State University and Yuxia Ouyang, doctoral student, conducted the analysis and developed the key findings. They examined over 448,000 lines of data and over 10.2 million variables.
This study was primarily funded by the American Hotel & Lodging Educational Foundation. Additional funds provided by the American Hotel & Lodging Association. Penn State University received no funding for the study.
Glossary of Terms Host: Person or entity renting out at least one residential unit on the Airbnb platform.
Full-time operator: Any host renting out unit(s) 360 or more days per year.
Multi-unit operator: Any host renting out two or more units.
BACKGROUNDIn 2016, the American Hotel & Lodging Association (AH&LA) released an analysis providing a
view of the commercial activity being conducted on Airbnb in the nation’s largest metropolitan
statistical areas (MSAs). John W. O’Neill, MAI, ISHC, Ph.D., professor of hospitality management
and director of the Center for Hospitality Real Estate Strategy in the School of Hospitality
Management at Penn State University, conducted the analysis of over 448,000 lines of data and
over 10.2 million variables and developed the key findings, which include:
� More than a quarter (26%) of Airbnb’s revenue in 14 of the nation’s largest markets – $347
million – came from operators who listed properties for rent full-time, or for 360 days or more,
during 12 months from October 2014 through September 2015.
� Based on a rigorous analysis of Airbnb listing data in 14 major U.S. metropolitan areas over the
course of a full year, commercial operators in the nation’s largest cities generate a substantial
share of the company’s revenue by renting out multiple residential properties and/or renting
properties year-round.
� The number of people renting out two or more residential properties on Airbnb appears to be
growing, and nearly 40% of the company’s revenue in 14 of the nation’s largest cities is generated
by these “multi-unit operators,” totaling more than half a billion dollars a year.
The following analysis provides greater detail about the commercial activity being conducted on
Airbnb in the Philadelphia MSA.

KEY FINDINGS: PHILADELPHIA REGIONThe data show that Airbnb operators listing residential properties for rent for the bulk of the year
drive a large percentage of the company’s revenue in the Philadelphia region.
Number of Days Operator Lists Unit(s) for Rent
Number of Operators 10/2014 – 9/2015
Revenue Generated 10/2014 – 9/2015
% of Airbnb Operator Population 10/2014 – 9/2015
% of Airbnb’s Revenue 10/2014 – 9/2015
30+ Days / Year 1,167 $13,383,017 63.98% 94.29%
180+ Days / Year 232 $8,152,419 12.72% 57.44%
360+ Days / Year 41 $3,868,558 2.25% 27.26%
The 5 Philadelphia-area ZIP codes with the most properties listed on Airbnb from October 2014
through September 2015 accounted for more than $7 million, or nearly half of Airbnb’s revenue
in the Philadelphia metropolitan area.
ZIP Code
Neighborhoods Airbnb Operator Count10/2014 – 9/2015
Property Count 10/2014 – 9/2015
Airbnb Revenue 10/14 – 9/15
19103 Rittenhouse Square 286 426 $3,486,012
19130 Fairmount District 167 176 $835,173
19146 Devils Pocket 160 169 $1,094,784
19147 Queen Village 152 168 $1,229,632
19107 Center City 147 156 $970,012
Total 912 1,095 $7,615,613
More than half (57%) of Airbnb’s Philadelphia revenue – over $8 million – comes from operators who listed properties for
rent more than 180 days per year.
Over one-quarter of Airbnb’s revenue in the Philadelphia area – 27% or almost $4 million – comes from operators who listed
units for rent full time.
Operators listing multiple units for rent drove over one-third (36%) of Airbnb’s revenue in the Philadelphia region –
over $5 million.
36%
$8M
27%

APPENDIX: PHILADELPHIA METROPOLITAN STATISTICAL AREA DATA TABLESRevenue Analysis by ZIP CodeZip Code
Property Count 10/2014 – 9/2015
Revenue 10/2014 – 9/2015
Zip Code Host Count 10/2014 – 9/2015
Revenue 10/2014 – 9/2015
19103 426 $3,486,012 19103 286 $3,486,012
19130 176 $835,173 19130 167 $835,173
19146 169 $1,094,784 19146 160 $1,094,784
19147 168 $1,229,632 19147 152 $1,229,632
19107 156 $970,012 19107 147 $970,012
19106 102 $845,872 19106 92 $845,872
19104 85 $372,382 19123 77 $331,873
19123 80 $331,873 19104 73 $372,382
19125 67 $365,342 19125 62 $365,342
19143 66 $459,728 19143 60 $459,728
Frequent Hosts
Number of Days Operator Lists Unit(s) for Rent
Operator Count 10/2014 – 9/2015
Revenue 10/2014 – 9/2015
Percent of Operators Who List Unit(s) for Multiple Days 10/2014 – 9/2015
Percent of Revenue From Operators Who List Unit(s) for Multiple Days 10/2014 – 9/2015
Total 1824 $14,192,897.67 – –
30+ days 1167 $13,383,017.20 63.98% 94.29%
60+ days 765 $12,137,080.23 41.94% 85.52%
90+ days 565 $11,123,496.71 30.98% 78.37%
120+ days 409 $10,081,476.51 22.42% 71.03%
180+ days 232 $8,152,418.70 12.72% 57.44%
360+ days 41 $3,868,557.65 2.25% 27.26%

AUGUST, 2016
From Air Mattresses to Unregulated Business: An Analysis of the Other Side of Airbnb
City Spotlight:
SAN FRANCISCO, CALIFORNIA
Data SourceThe data used in this report were sourced from Airdna, which tracks Airbnb revenues and operations and provides pricing and revenue data to Airbnb operators. Airdna conducts a continuous search of the Airbnb web site, resulting in each Airbnb listing being analyzed once every seven days.
The data cover 14 of the nation’s largest metropolitan statistical areas (MSAs): New York, Chicago, Los Angeles, Philadelphia, Miami, Houston, Dallas, Phoenix, San Antonio, San Diego, San Francisco, Boston, Austin and Washington, D.C. The research focuses on hosts who rent multiple units and length of time that hosts rent out their unit(s).
Kalibri Labs, a hospitality research firm, sorted the data, which included Airbnb operators from October 2014 through September 2015.
Exclusions: All data exclude all shared rooms and units and unique units, such as boats, tree houses, and tents.
Additional Information:John W. O’Neill, MAI, ISHC, Ph.D., professor of hospitality management and director of the Center for Hospitality Real Estate Strategy in the School of Hospitality Management at Penn State University and Yuxia Ouyang, doctoral student, conducted the analysis and developed the key findings. They examined over 448,000 lines of data and over 10.2 million variables.
This study was primarily funded by the American Hotel & Lodging Educational Foundation. Additional funds provided by the American Hotel & Lodging Association. Penn State University received no funding for the study.
Glossary of Terms Host: Person or entity renting out at least one residential unit on the Airbnb platform.
Full-time operator: Any host renting out unit(s) 360 or more days per year.
Multi-unit operator: Any host renting out two or more units.
BACKGROUNDIn 2016, the American Hotel & Lodging Association (AH&LA) released an analysis providing a
view of the commercial activity being conducted on Airbnb in the nation’s largest metropolitan
statistical areas (MSAs). John W. O’Neill, MAI, ISHC, Ph.D., professor of hospitality management
and director of the Center for Hospitality Real Estate Strategy in the School of Hospitality
Management at Penn State University, conducted the analysis of over 448,000 lines of data and
over 10.2 million variables and developed the key findings, which include:
� More than a quarter (26%) of Airbnb’s revenue in 14 of the nation’s largest markets – $347
million – came from operators who listed properties for rent full-time, or for 360 days or more,
during 12 months from October 2014 through September 2015.
� Based on a rigorous analysis of Airbnb listing data in 14 major U.S. metropolitan areas over the
course of a full year, commercial operators in the nation’s largest cities generate a substantial
share of the company’s revenue by renting out multiple residential properties and/or renting
properties year-round.
� The number of people renting out two or more residential properties on Airbnb appears to be
growing, and nearly 40% of the company’s revenue in 14 of the nation’s largest cities is generated
by these “multi-unit operators,” totaling more than half a billion dollars a year.
The following analysis provides greater detail about the commercial activity being conducted on
Airbnb in the San Francisco MSA.

KEY FINDINGS: SAN FRANCISCO REGIONThe data show that Airbnb operators listing residential properties for rent for the bulk of the year
drive a large percentage of the company’s revenue in the San Francisco region.
Number of Days Operator Lists Unit(s) for Rent
Number of Operators 10/2014 – 9/2015
Revenue Generated 10/2014 – 9/2015
% of Airbnb Operator Population 10/2014 – 9/2015
% of Airbnb’s Revenue 10/2014 – 9/2015
30+ Days / Year 7,423 $176,846,967 75.50% 96.53%
180+ Days / Year 1,908 $117,074,238 19.41% 63.90%
360+ Days / Year 308 $40,208,821 3.13% 21.95%
The five San Francisco-area ZIP codes with the most properties listed on Airbnb from October 2014 through September 2015 accounted for more than $97 million, or over half of Airbnb’s revenue in the San Francisco MSA.
ZIP Code
Neighborhoods Airbnb Operator Count10/2014 – 9/2015
Property Count 10/2014 – 9/2015
Airbnb Revenue 10/14 – 9/15
94110 Mission District, Bernal Heights 797 891 $17,144,886
94109 Russian Hill 651 705 $9,261,121
94117 Haight-Ashbury 526 591 $11,954,364
94114 The Castro, Noe Valley 506 567 $11,536,424
94107 Potrero Hill 393 424 $7,474,730
Total 2,873 3,178 $57,371,525
If Airbnb operators in the San Francisco area followed the same tax rubric as other lodging businesses in San Francisco, in the 12 months between October 2014 and September 2015 they would have owed municipal governments in the region more than $30 million.
San Francisco Area Lodging Taxes
Room Tax CA Tourism Fee Tld Assessment Total City of San Francisco Lodging Tax Rate
Airbnb’s San Francisco Revenue
Airbnb’s Estimated Tax Obligation
14% .28% 2.25% 16.53% $183,213,462 $30,285,185
Nearly one-quarter of Airbnb’s revenue in the San Francisco area – 22%
or more than $40 million comes from operators who list units for rent full-time.
Nearly two-thirds (64%) of Airbnb’s San Francisco-area revenue – over $117 million – comes from operators who listed properties
for rent more than 180 days per year.
Operators listing multiple units for rent drove almost one-third
(32%) of Airbnb’s revenue in the San Francisco region – $58 million.
32%
$117M
22%
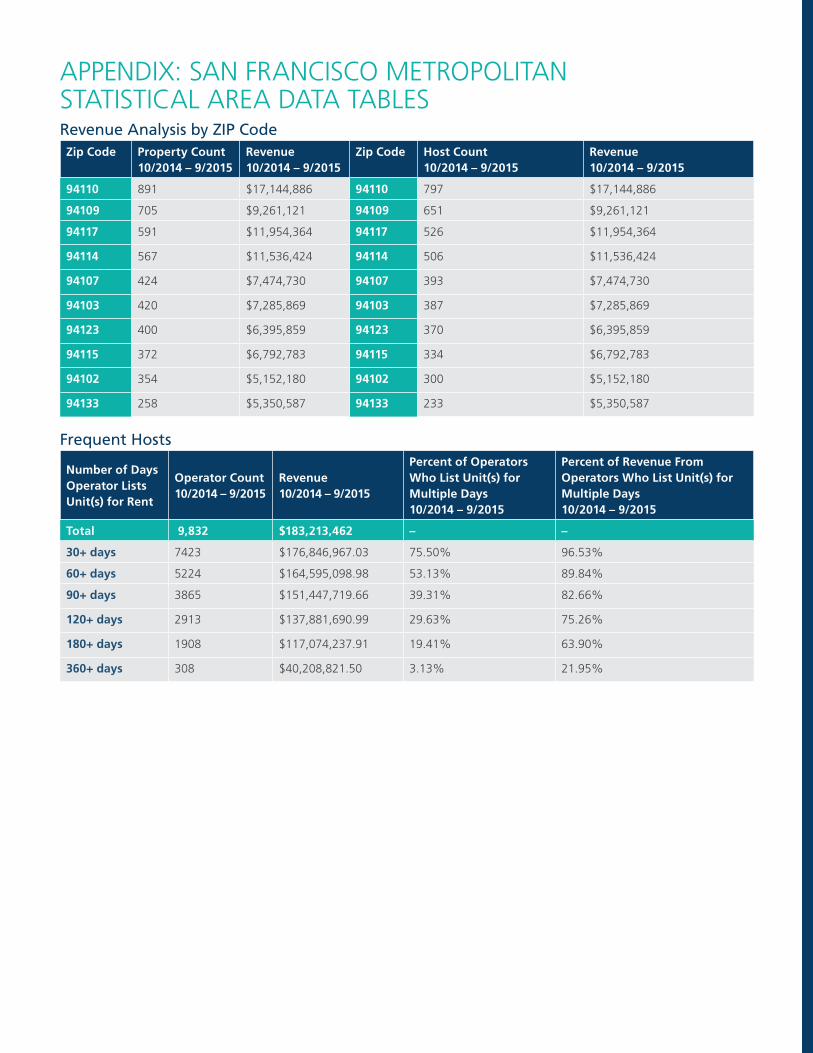
APPENDIX: SAN FRANCISCO METROPOLITAN STATISTICAL AREA DATA TABLESRevenue Analysis by ZIP CodeZip Code Property Count
10/2014 – 9/2015Revenue 10/2014 – 9/2015
Zip Code Host Count 10/2014 – 9/2015
Revenue 10/2014 – 9/2015
94110 891 $17,144,886 94110 797 $17,144,886
94109 705 $9,261,121 94109 651 $9,261,121
94117 591 $11,954,364 94117 526 $11,954,364
94114 567 $11,536,424 94114 506 $11,536,424
94107 424 $7,474,730 94107 393 $7,474,730
94103 420 $7,285,869 94103 387 $7,285,869
94123 400 $6,395,859 94123 370 $6,395,859
94115 372 $6,792,783 94115 334 $6,792,783
94102 354 $5,152,180 94102 300 $5,152,180
94133 258 $5,350,587 94133 233 $5,350,587
Frequent Hosts
Number of Days Operator Lists Unit(s) for Rent
Operator Count 10/2014 – 9/2015
Revenue 10/2014 – 9/2015
Percent of Operators Who List Unit(s) for Multiple Days 10/2014 – 9/2015
Percent of Revenue From Operators Who List Unit(s) for Multiple Days 10/2014 – 9/2015
Total 9,832 $183,213,462 – –
30+ days 7423 $176,846,967.03 75.50% 96.53%
60+ days 5224 $164,595,098.98 53.13% 89.84%
90+ days 3865 $151,447,719.66 39.31% 82.66%
120+ days 2913 $137,881,690.99 29.63% 75.26%
180+ days 1908 $117,074,237.91 19.41% 63.90%
360+ days 308 $40,208,821.50 3.13% 21.95%