Embed Size (px)
Citation preview
American Economic Journal: Economic Policy 2016, 8(2): 125–153 http://dx.doi.org/10.1257/pol.20140215
125
Friendship at Work: Can Peer Effects Catalyze Female Entrepreneurship?†
By Erica Field, Seema Jayachandran, Rohini Pande, and Natalia Rigol*
Does the lack of peers contribute to the observed gender gap in entrepreneurial success? A random sample of customers of India’s largest women’s bank was offered two days of business counseling, and a random subsample was invited to attend with a friend. The intervention significantly increased participants’ business activity, but only if they were trained with a friend. Those trained with a friend were more likely to have taken out business loans, were less likely to be housewives, and reported increased business activity and higher household income, with stronger impacts among women subject to social norms that restrict female mobility. (JEL G21, J16, J24, L26, M53, O16, Z13)
Women in rich and poor countries alike are less likely than men to succeed as entrepreneurs (Kelly et al. 2011; de Mel, McKenzie, and Woodruff 2008). A
common policy response in low-income settings, where female educational attain-ment is relatively low, is to prescribe business training and counseling programs. Yet, a growing body of experimental evidence suggests that simple deficits in busi-ness or accounting know-how are not at the heart of the gender gap in performance (McKenzie and Woodruff 2014).
Here, we ask whether the low number of successful female micro-entrepreneurs may directly contribute to their weaker performance by limiting positive peer effects on business behaviors. Our analysis makes use of a field experiment in which a randomly selected set of clients from India’s largest women’s bank, SEWA Bank, was provided a short (two half-days, with two hours of in-class training per day) business counseling program. During the program, women were taught basic finan-cial literacy and business skills and were shown a film showcasing successful role models in their community. They also worked with the trainer to first set a six-month
* Field: Department of Economics, Duke University, 213 Social Sciences Building, Box 90097, Durham, NC 27708 (e-mail: [email protected]); Jayachandran: Department of Economics, Northwestern University, 2001 Sheridan Road, Room 302, Evanston, IL 60208 (e-mail: [email protected]); Pande: Harvard Kennedy School, Harvard University, Mailbox 46, 79 John F. Kennedy Street, Cambridge, MA 02138 (e-mail: [email protected]); Rigol: Department of Economics, Massachusetts Institute of Technology, 50 Memorial Drive, Cambridge, MA 02142 (e-mail: [email protected]). We are grateful to Manasee Desai, Katherine Durlacher, Mallika Thomas, and Divya Varma for excellent research assistance, to the staff of SEWA for their cooperation and support. This research was made possible by a generous grant from the Harvard Kennedy School Women and Public Policy Program and a CMF-IFMR research grant. We thank two anonymous referees for comments and the Centre for Microfinance at the Institute for Financial Management and Research (IFMR) for hosting the study.
† Go to http://dx.doi.org/10.1257/pol.20140215 to visit the article page for additional materials and author disclosure statement(s) or to comment in the online discussion forum.
126 AmErIcAn EconomIc JournAL: EconomIc PoLIcy mAy 2016
financial goal and then to break that goal down into actionable steps. Fiscal disci-pline, particularly saving, was emphasized as key to achieving the target, and partic-ipants were informed about the different savings products available from the bank. The key experimental variation on which we focus is that a random half of the potential participants were invited to attend the training and counseling sessions with a peer of their choice.
Program take-up was roughly 70 percent, and over 90 percent of peer-treated women who attended training were accompanied by a friend. Given the program’s emphasis on short-run goal setting, we focus our analysis on impacts observed four months after training. Bank administrative data suggest that treated women were more likely to take out a loan relative to the control group of women who were not invited to training sessions. This higher loan incidence may, however, simply reflect greater familiarity with bank products or confidence that their loan application would be successful. More revealing are the substantial differences in borrowing behavior across those invited to attend alone and those invited to attend with a friend: only women invited with a friend have a higher propensity to borrow, and they almost exclusively used the marginal loans for business purposes. Furthermore, survey data show that, four months later, those invited with a friend report differences in busi-ness behavior, including a higher volume of business and more stated business plans to increase revenues, while women invited alone experience no change in these out-comes relative to the control group. Perhaps most strikingly, those invited with a friend also report significantly higher household income and expenditures and are less likely to report their occupation as “housewife.”
The observed benefits from training with a peer could operate through multiple mechanisms. The presence of peers may influence a woman’s classroom experi-ence—she may exhibit greater business confidence in a more supportive environ-ment, or may feel more competitive pressure when among peers to absorb the material covered. Equally, having a friend as a training partner may strengthen the social network that a woman relies on for support after the training is over. This support could include financial assistance, information, or even just ongoing encouragement to strive to attain business goals. Our experiment was not designed to disentangle these potential mechanisms. That said, we find some suggestive evi-dence that women who attended with a friend may have set systematically different goals for themselves during the training. This interpretation is consistent with the fact that, relative to women invited alone for training, women invited with a friend do not seem to be more likely to engage in suggested business practices, such as record-keeping, or to discuss business matters with family and friends, and are no more confident about business skills after the training.
A different way to examine channels of influence is to ask whether the observed impacts for training with a friend are concentrated in particular demographic groups. Social norms are commonly cited as a constraint on labor force participation in India that restrict female mobility and, thus, women’s access to business networks (Klasen and Pieters 2015). If mobility constraints are binding, then the women most likely to benefit from professional peer interactions are those most subject to social stric-tures. Consistent with this, the impacts of peer training on business loans and labor supply are concentrated among women belonging to groups with more restrictive
VoL. 8 no. 2 127Field et al.: Peer eFFects and Female entrePreneurs
social norms.1 Being invited to attend the training with a peer does not have a statis-tically significant effect on attendance, which suggests that access to networks, not immobility per se, limits female entrepreneurship.
Our paper contributes to two growing, but largely distinct, experimental litera-tures on peer effects in learning and the impact of business training programs. In low-income settings, the literature on peer effects in learning has largely focused on schools. Duflo, Dupas, and Kremer (2011) finds evidence of ability-based peer effects in learning and Rao (2014) finds limited evidence of income-based peer effects in learning but significant effects for rich students’ willingness to interact with poor students. On peer effects in entrepreneurship learning, two recent papers exploit random variation in class section assignment at Harvard Business School to examine subsequent workplace outcomes. Lerner and Malmendier (2013) find that having more peers with prior entrepreneurial experiences reduces subsequent unsuccessful attempts at entrepreneurial activity, which they attribute to learning from peers. Shue (2013) finds that subsequent managerial and compensation out-comes are more similar within sections than across sections. Our setting is very distinct in that we focus on low-income women in urban India that operate mostly informal enterprises rather than on business professionals.
Turning to business training programs for micro-entrepreneurs in low-income settings, experimental studies point to modest positive program impacts with sig-nificant heterogeneity (for a complete review, see McKenzie and Woodruff 2014).2 LaFortune, Perticará, and Tessada (2013) examine peer effects in a business train-ing program in Chile where peer-treated participants are assigned with partici-pants with similar prior attachment to the workplace, defined using an index of propensity to work. They find limited evidence that matching participants by work-place attachment influences subsequent labor supply. However, they do find that (nonexperimental) variation in peers’ average propensity to work raises a partici-pant’s labor supply.
Our paper extends these literatures in multiple ways. First, we focus on peer effects for the population that is typically targeted by business training programs in low-income settings, namely female micro-entrepreneurs. Although our eligibility criteria were lenient—that clients be between 18 and 50 years old and that they had actively saved at SEWA Bank in the previous two years (i.e., between 2005 and 2006)—the majority of women in our study sample also share the demographic characteristics of typical microfinance participants in India: married women who are self-employed and earn between $2 and $3 per day. Second, we consider the role of friends as peers. In environments where social norms limit women’s inter-actions with strangers, it is important to ask whether training with self-identified friends (with whom interactions are likely less restricted) can have an impact. Thus,
1 The business counseling and training program was also analyzed in Field, Jayachandran, and Pande (2010), where we examined differences between the control and treatment groups irrespective of whether they were invited with a friend. In that paper, we showed that average treatment impacts also varied with the individual’s caste and religion, which were linked to social norms on mobility.
2 In terms of curriculum, the most related paper is Karlan and Valdivia (2011), who evaluate a program in Peru that used training materials from the same group, Freedom from Hunger, as we do. Similarly to them, we find that business training can increase loan demand from the microfinance institution.
128 AmErIcAn EconomIc JournAL: EconomIc PoLIcy mAy 2016
in addition to shedding light on the role of peer networks and, thereby, potential barriers to female microenterprise activity, our findings have implications on how to design business training and counseling programs to maximize their influence. Given our suggestive evidence that peer effects operate through making participants more ambitious in the goals they set or more accountable to those goals once set, we posit that the presence of friends as peers is likely to be particularly influential in training programs that involve personalized business plans or goal setting rather than simple information provision.
The remainder of the paper is organized as follows. Section I describes the busi-ness counseling intervention and outlines our hypotheses regarding likely impacts. We follow this by describing the study design, sample, and data sources. Section II presents the empirical results and Section III concludes.
I. Intervention and Study Design
Between September 2006 and April 2007, we worked with staff from India’s largest women’s bank, SEWA Bank, to provide over 400 female bank clients in Ahmedabad, the capital of Gujarat, India, access to a two-day business counseling program.3 Below we first describe the counseling program that we evaluate and then our data sources and analysis plan.
A. Business counseling: context and Program Details
SEWA Bank’s 170,000 member-clients are primarily women who work in home-based occupations, such as stitching and tailoring, piece-rate work (e.g., making incense sticks), vegetable vending, construction work, and rag picking. SEWA Bank offers savings accounts, individual loan products (rather than the joint-liabil-ity group lending often associated with microcredit), pension accounts, and other financial products to its clients. All clients are required to have a savings account and need to be active savers for at least two years prior to being considered for a loan. Roughly a quarter of SEWA clients eventually transition into borrowing; we selected study clients from the pool of loan eligible SEWA clients, i.e., clients with an active savings account for the previous two years.
In the early 2000s, SEWA Bank initiated a five-day financial literacy training program, which used lessons, games, and videos to teach its clients basic account-ing skills, interest rate calculations, the importance of avoiding excess debt, and long-term “life-cycle” planning, among other topics. More recently, it started a second five-day course that teaches business skills, such as marketing, cost reduc-tion, investment, and customer service. Anecdotally, and in line with the bank’s overall mission to serve and empower its clients, individualized business counseling occurred frequently during both programs.
3 SEWA Bank was created in 1974 by the Self-Employed Women’s Association, a trade union for poor self-employed women based in the city of Ahmedabad. While formally a trade union, SEWA is an all-around advo-cacy and support group for self-employed women, and banking is one of the services SEWA provides its members.
VoL. 8 no. 2 129Field et al.: Peer eFFects and Female entrePreneurs
To investigate factors influencing female entrepreneurial outcomes, we collab-orated with SEWA Bank to design a streamlined two-day training module, which combined elements of the existing financial literacy and business skills curricula that were based on a well-known Freedom from Hunger curriculum, and added new material focused on aspirations. The two-day training module (a total of four hours) was taught by the regular SEWA Bank instructors who had been teaching the two five-day financial literacy and business skills classes. The rationale for combining course material across the two courses was that the two types of skills are comple-mentary; many self-employed women in this setting do not possess basic numeracy skills, which are clearly valuable in making sound business decisions (e.g., assess-ing the returns on a potential investment relative to the interest rate on a loan that could finance the investment), yet may also lack the ability to create business goals to apply these skills to. We chose to implement a very short, streamlined course in order to ascertain whether women’s aspirations and willingness to take up goals (complemented with a review of skills needed to attain them) could be influenced with an intervention that could easily be scaled up. The two-day module emphasized financial prudence, aimed to raise aspirations, and provided a structured way to identify and work towards a financial goal. Our choice of how to condense the two five-day trainings relied on information from focus group discussions with women who had attended SEWA trainings in 2006, in which we asked about training ele-ments they found most useful, what they implemented in the short run, and what they retained or abandoned in the long run.
Women were encouraged to save more and to reduce “frivolous” spending (for example, on tea and snacks). They were also shown a short film showcasing the lives of a few successful SEWA members who used good financial practices to bring themselves out of poverty. Finally, at the end of the first day women received a homework sheet in which they had to identify (overnight) a financial goal they would like to achieve over the next six months. During the second day of train-ing, the participants worked in groups to identify steps they could take to achieve their goal such as reducing wasteful expenditure and changing sub-optimal business practices. They completed the worksheet which broke down their goal into smaller achievable steps (the Appendix provides the worksheet). The aim was to motivate the women to set their sights higher and to identify concrete ways to improve their financial and business practices.
Our interest in women’s ability to implement these goals motivated our focus on relatively short-run (four months post-intervention) outcomes. To isolate the influ-ence of peer support, we designed the intervention so that a randomly selected half of the participants were invited to come alone, while the other half were encouraged to bring a close friend or relative of their own choosing, preferably someone who shared their occupation. To accomplish this, we asked women in both treatment groups at the outset to name and provide the contact information for three friends, one of whom might be invited to attend with them. For women randomly assigned to the treatment-with-friend group, we subsequently visited a randomly selected friend and invited her to attend the same training session.
130 AmErIcAn EconomIc JournAL: EconomIc PoLIcy mAy 2016
B. Program Implementation
Our sample consisted of 636 women age 18 to 50 who had actively saved or bor-rowed from SEWA Bank between December 2004 and January 2006. We followed a two-stage selection process: first, we selected all 435 eligible women from a pool of 1900 SEWA clients for whom a socioeconomic survey, which we use for baseline data, had recently been conducted. Second, in February 2007, we randomly selected an additional 201 women from the entire SEWA Bank customer database (using the eligibility criteria listed above), and conducted a brief baseline survey for these clients.
Of the 636 participants, 212 clients were randomized into the control group, 217 were selected for the first treatment arm—train alone—and 207 were selected for the second treatment arm—train with a friend. We followed a two-step stratified randomization procedure: the first stratification is provided by the two-stage selec-tion procedure described above (the randomization for the first 435 women and the additional 201 clients occurred at different times). Second, we stratified by SEWA branch, with a woman being classified by one of the four bank branches nearest to her home. Occupation, religion, caste, and other socio-demographic characteristics are often correlated with the area in which the woman lives, so branch stratification helped balance the sample on these characteristics. In addition, trainings occurred at all four branches (with women recruited for the trainings at their nearest branches). The overall treatment group, combining both arms, consists of 424 women.
Women were randomly assigned into control, treated alone, and treated with friend groups. Surveyors were unaware of the individual’s treatment status at the time of the baseline survey. After the completion of the baseline survey, surveyors were given a list of women to recruit for training. Typically, two surveyors, accom-panied by a local SEWA bank officer (“saathi”), went to invite each woman in the treatment group. The woman was informed that many women had previously attended business training and had reported benefiting from it. In addition, she was informed that she would receive tea and snacks at each training, and if she attended both days of the training, she would receive Rs 40 to cover her travel expenses. Women were not otherwise financially compensated for attending the training. During recruitment, the woman was also shown a business training certificate of participation and a photograph of training participants, which she would receive upon completion of the training on the second day. The estimated cost of providing the training is Rs 157 (about US$4 in 2007) per participant, including the instructor fee, classroom costs, recruitment, snacks, and transportation reimbursement.
Each study client invited for the training was informed that one of her friends may be invited to the same training if enough spots were available. She was then asked to list the names, occupations, and addresses of three friends, two from her occupation and one with a different occupation. For women in the treatment-with-friend group, we randomly selected one of the three friends listed and a surveyor visited the woman’s friend and invited her to attend the same training session.
We had a single instructor team, and thus training sessions rotated among the four locations, with the order and schedule determined by classroom availability in the SEWA branches. Women were recruited to attend a particular training session
VoL. 8 no. 2 131Field et al.: Peer eFFects and Female entrePreneurs
at their nearest SEWA branch. Typically eight study participants were invited for training per session—four from the treatment-alone group and four from the treat-ment-with-friend group. Actual attendance was, therefore, up to 12 if all study par-ticipants attended and those eligible to do so brought friends. Toward the end of the intervention, nine or ten women were often recruited, including women who were unable to attend earlier. The morning of the training, the recruiters would return to the women’s homes to remind them about the training later that afternoon. Those who had telephones were also called as an additional reminder.
In total, we conducted 57 two-day training sessions over an eight-month period from September 2006 to April 2007, and 292 women from the sample attended training. In the estimation, each woman’s randomly assigned treatment status rather than her attendance at training is used to identify the program effects.4
For analysis purposes, the 212 women who were randomized into the control group were assigned to a training session. We followed the same protocol as for the treatment group and assigned control women to a treatment session at their nearest SEWA location. In 32 percent of groups, we assigned 3 control members; in 65 per-cent, we assigned 4 control members; and in the remaining 3 percent (two groups), 5 control participants were assigned per group. For the follow-up survey, control group and treatment clients in the same session were surveyed at the same time. In our regression analysis we cluster standard errors by training session.
C. Data
Our analysis makes use of three data sources: a baseline survey, a follow-up sur-vey after the intervention, and SEWA Bank administrative data. We have adminis-trative data for the full sample of 636 women.5
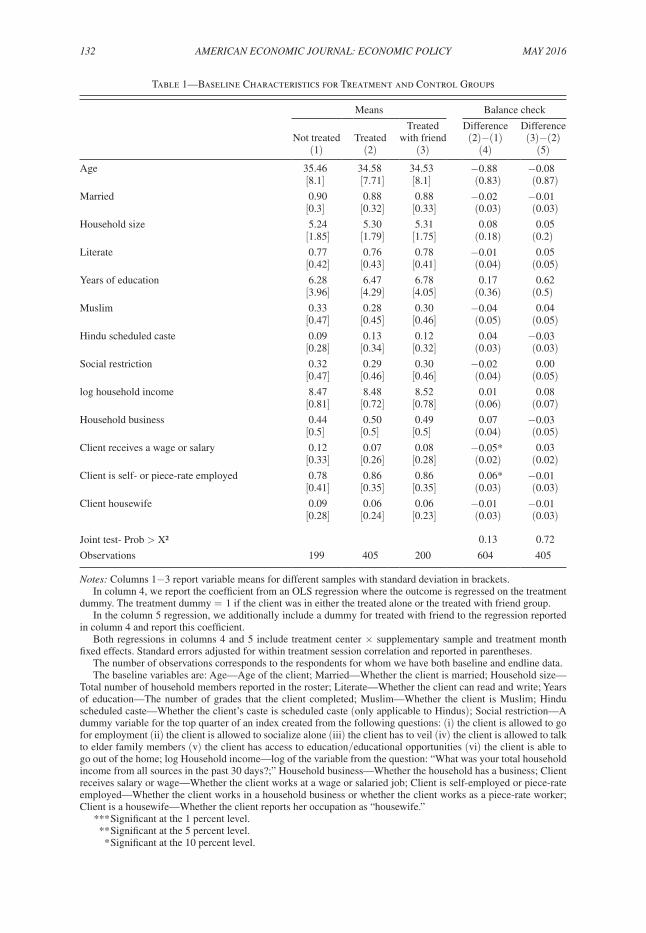
The baseline survey was administered to the original sample of 435 women in early 2006. The supplementary sample of 201 clients received a separate short base-line survey; for the treatment group, the survey was conducted at the same visit when the woman was recruited for training, and for the control group, it was conducted (without recruitment) at a similar time. Columns 1–3 of Table 1 report descriptive statistics from the baseline survey, separately for the control, the two treatment arms pooled, and the treated-with-friend arm.
The average age of women in the sample is 35 years. A little less than 90 percent are married, and about 30 percent are Muslim (most of the others are Hindu). About 76 percent of the women are literate and have an average of 6.4 years of education. Over 83 percent are employed in a household enterprise or in a piece rate activity such as stitching, and 7 percent are housewives. Our study participants live in house-holds with an average of 5.3 occupants and Rs 5,717 monthly income. For roughly half our sample, a portion of that household income is earned from a household
4 We observe the following deviations between intended training and actual training status: two women from the control group were mistakenly recruited and attended the training, one with a friend. In addition, three women from the treatment arm with no friend invited a friend to attend. Twelve women in the treatment-with-friend arm came alone.
5 Since the publication of Field, Jayachandran, and Pande (2010), we have obtained SEWA Bank administrative data for the full sample of 636 clients.
132 AmErIcAn EconomIc JournAL: EconomIc PoLIcy mAy 2016
Table 1—Baseline Characteristics for Treatment and Control Groups
Means Balance check
Not treated TreatedTreated
with friendDifference (2)−(1)
Difference (3)−(2)
(1) (2) (3) (4) (5)
Age 35.46 34.58 34.53 −0.88 −0.08[8.1] [7.71] [8.1] (0.83) (0.87)
Married 0.90 0.88 0.88 −0.02 −0.01[0.3] [0.32] [0.33] (0.03) (0.03)
Household size 5.24 5.30 5.31 0.08 0.05[1.85] [1.79] [1.75] (0.18) (0.2)
Literate 0.77 0.76 0.78 −0.01 0.05[0.42] [0.43] [0.41] (0.04) (0.05)
Years of education 6.28 6.47 6.78 0.17 0.62[3.96] [4.29] [4.05] (0.36) (0.5)
Muslim 0.33 0.28 0.30 −0.04 0.04[0.47] [0.45] [0.46] (0.05) (0.05)
Hindu scheduled caste 0.09 0.13 0.12 0.04 −0.03[0.28] [0.34] [0.32] (0.03) (0.03)
Social restriction 0.32 0.29 0.30 −0.02 0.00[0.47] [0.46] [0.46] (0.04) (0.05)
log household income 8.47 8.48 8.52 0.01 0.08[0.81] [0.72] [0.78] (0.06) (0.07)
Household business 0.44 0.50 0.49 0.07 −0.03[0.5] [0.5] [0.5] (0.04) (0.05)
Client receives a wage or salary 0.12 0.07 0.08 −0.05* 0.03[0.33] [0.26] [0.28] (0.02) (0.02)
Client is self- or piece-rate employed 0.78 0.86 0.86 0.06* −0.01[0.41] [0.35] [0.35] (0.03) (0.03)
Client housewife 0.09 0.06 0.06 −0.01 −0.01[0.28] [0.24] [0.23] (0.03) (0.03)
Joint test- Prob > X² 0.13 0.72
Observations 199 405 200 604 405
notes: Columns 1−3 report variable means for different samples with standard deviation in brackets.In column 4, we report the coefficient from an OLS regression where the outcome is regressed on the treatment
dummy. The treatment dummy = 1 if the client was in either the treated alone or the treated with friend group.In the column 5 regression, we additionally include a dummy for treated with friend to the regression reported
in column 4 and report this coefficient. Both regressions in columns 4 and 5 include treatment center × supplementary sample and treatment month
fixed effects. Standard errors adjusted for within treatment session correlation and reported in parentheses.The number of observations corresponds to the respondents for whom we have both baseline and endline data.The baseline variables are: Age—Age of the client; Married—Whether the client is married; Household size—
Total number of household members reported in the roster; Literate—Whether the client can read and write; Years of education—The number of grades that the client completed; Muslim—Whether the client is Muslim; Hindu scheduled caste—Whether the client’s caste is scheduled caste (only applicable to Hindus); Social restriction—A dummy variable for the top quarter of an index created from the following questions: (i) the client is allowed to go for employment (ii) the client is allowed to socialize alone (iii) the client has to veil (iv) the client is allowed to talk to elder family members (v) the client has access to education/educational opportunities (vi) the client is able to go out of the home; log Household income—log of the variable from the question: “What was your total household income from all sources in the past 30 days?;” Household business—Whether the household has a business; Client receives salary or wage—Whether the client works at a wage or salaried job; Client is self-employed or piece-rate employed—Whether the client works in a household business or whether the client works as a piece-rate worker; Client is a housewife—Whether the client reports her occupation as “housewife.”
*** Significant at the 1 percent level. ** Significant at the 5 percent level. * Significant at the 10 percent level.
VoL. 8 no. 2 133Field et al.: Peer eFFects and Female entrePreneurs
enterprise. The demographic profile of our study clients is similar to microfinance borrowers and microentrepreneurs in other parts of India. Like clients in Hyderabad (Banerjee et al. 2015) and Kolkata (Field et al. 2013), the median household lives on approximately two to three dollars per day, households have an average of five members, and approximately half the households operate a household business.The composition of household enterprises is also very similar, with tailoring and stitching services dominating. One important distinction may be that women in Ahmedabad, Gujarat, face stricter social norms, although we lack comparable data to test this.
The follow-up survey occurred on a rolling basis, typically four months after a participant was recruited to attend her training event. All clients assigned to a training session, both treatment and control, were administered the survey at the same time, and the survey was completed for 604 women. The low attrition rate of 5 percent was similar across the three groups.6 The follow-up survey gathered data on income, business practices, labor supply, and household expenditures.
Several factors are likely to have contributed to the relatively high rate of reten-tion when compared to training programs evaluated in other studies (McKenzie and Woodruff 2014). First, a relatively short time elapsed between the training and the sur-vey (4.3 months on average). Second, our study clients belonged to a large organiza-tion with which the clients maintained ties even after the study was complete. Finally, SEWA maintains up-to-date records of its members which facilitated client tracking.
SEWA Bank’s administrative data, which tracks clients’ account activity on a transaction level, provides information on whether the client took out a loan from SEWA after the training and for what purpose, which we use as outcome measures. To create a comparable measure from survey data, we consider the four-month span after each client’s training day.
D. Estimation Strategy
Randomization of treatment arms allows us to estimate regressions of the form
(1) y i = α + β 1 · Trea t i + β 2 · TreatedWithFrien d i + X i · γ + u i .
y i is an outcome measure for individual i , and Trea t i is an indicator variable that equals 1 if she was assigned to receive the training and 0 otherwise. TreatedWithFrien d i equals 1 if the individual was additionally invited to training with a friend. The coef-ficient β 2 is the differential effect of being assigned to training with a friend, relative to being assigned to training alone. The vector X i includes stratification indicators (interactions of the dummy for the SEWA training center and a dummy for whether the individual was part of the original or supplementary sample) and training month dummies.
Standard errors are clustered by training session to allow for correlated errors, reflecting a common training experience or the similar timing of collection of the follow-up data.
6 The composition by treatment status for the follow-up survey was 205 from the treat-alone group, 200 from the treat with a friend group, and 199 from the control group.
134 AmErIcAn EconomIc JournAL: EconomIc PoLIcy mAy 2016
In the regression tables, panel A shows the β 1 and β 2 coefficients for the estimat-ing equation (1). In panel B, we show θ 1 from the pooled regression,
(2) y i = δ + θ 1 · Trea t i + X i · λ + ϵ i .
Table 1 columns 4 and 5 report randomization balance checks. In column 4, we report θ 1 from estimating equation (2) and in column 5 β 2 from estimating equation (1). Treatment and control groups are balanced along observable baseline charac-teristics, with two exceptions: treatment clients are significantly less likely to report being wage- or salary-employed and more likely to be self-employed or piece-rate workers. It is worth noting, however, that differences in some variables, while insig-nificant, are moderately large in magnitude. That being said, in a joint test of all observables, we cannot reject the hypothesis that the baseline characteristics of the treated and control samples are statistically identical. While our main analysis focuses on the pure experimental estimates, in online Appendix Table 3 we show that the results are robust to the inclusion of Table 1 controls.
II. Results
In this section we examine program impacts four months after the training occurred. We start by examining program take-up and then turn to program impacts on participants’ financial and business behavior and household economic outcomes. Given evidence that impacts varied by participants’ peer treatment status, we next examine additional outcomes to gain some insight on channels of influence. Finally, in order to provide greater evidence on one potential channel, we investigate whether women who belong to castes that place stronger strictures on female mobility bene-fited differentially from the program.
A. Program Take-up
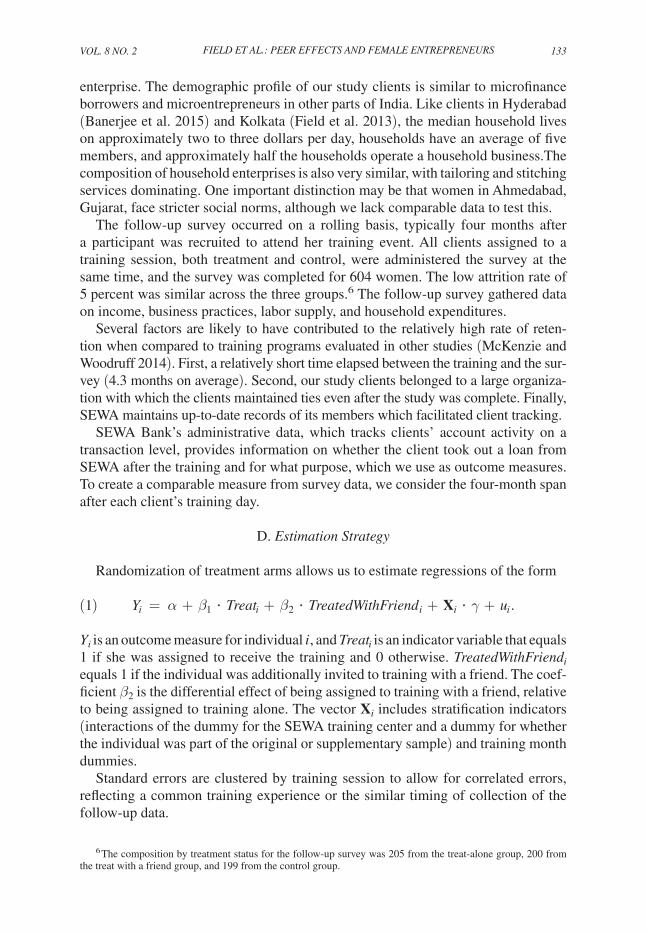
Table 2 examines program take-up. Column 1 panel B shows that 68 percent of women assigned to treatment (and two in the control group) attended the training. Column 2 examines the effect of treatment assignment on attending with a friend. Strikingly, nearly all Treated with Friend attendees attended with a friend (panel A).7 Overall, take-up rates for our training are consistent with other training studies that offer free-of-charge counseling: McKenzie and Woodruff (2014) find that atten-dance across 16 business training RCT studies is, on average, 65 percent.
Throughout, we focus on intention-to-treat (ITT) estimates since one may be concerned by differential selection across treatment arms, both on average and on specific observable characteristics. Column 1 in Table 2 panel A reports weak evi-dence that assignment to peer-treatment encouraged take-up: the point estimate of 0.07 on Treated with Friend in column 1 suggests that being invited with a friend
7 The only noncompliance in the attendance protocol comes from three clients who were assigned to Treated Alone but attended a training meeting with a friend and two clients who were assigned to the control but attended the training (one alone and one with a friend). Conditional on attending the first day, over 97 percent completed the training.
VoL. 8 no. 2 135Field et al.: Peer eFFects and Female entrePreneurs
increased take-up by 11.5 percent over the invited alone group and the effect has a p-value of 0.115. To check whether differential take-up across treatment arms can quantitatively explain differences in observed treatment effects, online Appendix Table 6 estimates treatment-on-treated effects where we instrumented for take-up with the treatment dummies. Consistent with the ITT estimates, we find larger impacts for Treated with Friend than for Treated Alone.
As we examine in online Appendix Table 7, those who selected into training, in general, likely faced fewer social restrictions—they were older, more likely to be mar-ried and to live in larger households (the latter may be a consequence of age and mar-ital status differences), and more likely to belong to lower castes (scheduled caste). Later in this section, we directly examine whether impacts vary by social restrictions faced by the woman. Finally, there are no significant differences in observable char-acteristics of those who trained alone and those who trained with peers.
B. Financial Behavior
In Table 3 we use a combination of administrative and survey data to examine changes in participants’ financial behavior.
Table 2—Business Counseling Program Take-Up
Trained
Trained with friend
(1) (2)
Panel A. Peer effectTreated 0.64*** 0.01
(0.04) (0.01)Treated with friend 0.07 0.65***
(0.05) (0.04)
Panel B. Pooled effectTreated 0.68*** 0.33***
(0.03) (0.02)
Observations 636 636
Mean for control group 0.01 0.00[0.10] [0.07]
notes: Panel A presents the coefficient estimates of an OLS regression that regresses the dependent variable in the column heading on “ Treated” (a dummy for whether a client is in the “ Treated alone” or “ Treated with friend” group) and on “Treated with friend.” This is the specification presented in equation (1) in the text. Panel B presents the coefficient estimates of an OLS regression that regresses the dependent variable in the column heading on “Treated.” This is the specification presented in equation (2) in the text.
Regressions include treatment center × supplementary sample and treatment month fixed effects. Standard errors adjusted for within treatment session correlation and reported in pa-rentheses. We report the mean of the control group and the standard deviation (in brackets).
Outcomes in the columns: Column 1—Whether the client attended at least one day of the two-day training; Column 2—Whether the client attended at least one day of the two-day training with a friend.
*** Significant at the 1 percent level. ** Significant at the 5 percent level. * Significant at the 10 percent level.
136 AmErIcAn EconomIc JournAL: EconomIc PoLIcy mAy 2016
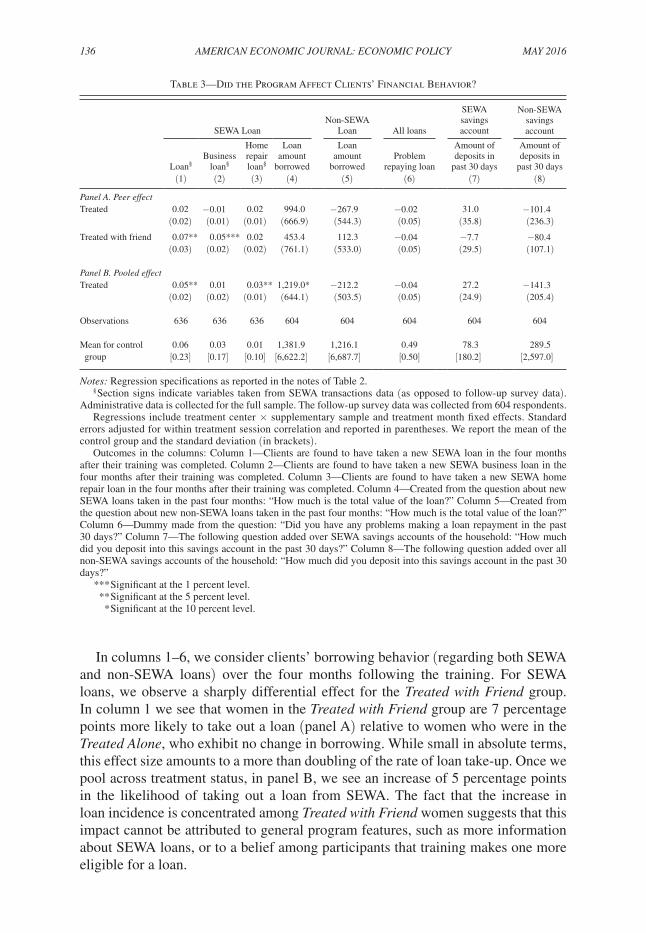
In columns 1–6, we consider clients’ borrowing behavior (regarding both SEWA and non-SEWA loans) over the four months following the training. For SEWA loans, we observe a sharply differential effect for the Treated with Friend group. In column 1 we see that women in the Treated with Friend group are 7 percentage points more likely to take out a loan (panel A) relative to women who were in the Treated Alone, who exhibit no change in borrowing. While small in absolute terms, this effect size amounts to a more than doubling of the rate of loan take-up. Once we pool across treatment status, in panel B, we see an increase of 5 percentage points in the likelihood of taking out a loan from SEWA. The fact that the increase in loan incidence is concentrated among Treated with Friend women suggests that this impact cannot be attributed to general program features, such as more information about SEWA loans, or to a belief among participants that training makes one more eligible for a loan.
Table 3—Did the Program Affect Clients’ Financial Behavior?
SEWA Loan
Non-SEWA
Loan
All loans
SEWA savings account
Non-SEWA savings account
Loan§Business
loan§
Home repair loan§
Loan amount
borrowed
Loan amount
borrowedProblem
repaying loan
Amount of deposits in
past 30 days
Amount of deposits in
past 30 days(1) (2) (3) (4) (5) (6) (7) (8)
Panel A. Peer effectTreated 0.02 −0.01 0.02 994.0 −267.9 −0.02 31.0 −101.4
(0.02) (0.01) (0.01) (666.9) (544.3) (0.05) (35.8) (236.3)Treated with friend 0.07** 0.05*** 0.02 453.4 112.3 −0.04 −7.7 −80.4
(0.03) (0.02) (0.02) (761.1) (533.0) (0.05) (29.5) (107.1)
Panel B. Pooled effectTreated 0.05** 0.01 0.03** 1,219.0* −212.2 −0.04 27.2 −141.3
(0.02) (0.02) (0.01) (644.1) (503.5) (0.05) (24.9) (205.4)
Observations 636 636 636 604 604 604 604 604
Mean for control 0.06 0.03 0.01 1,381.9 1,216.1 0.49 78.3 289.5 group [0.23] [0.17] [0.10] [6,622.2] [6,687.7] [0.50] [180.2] [2,597.0]
notes: Regression specifications as reported in the notes of Table 2.§ Section signs indicate variables taken from SEWA transactions data (as opposed to follow-up survey data).
Administrative data is collected for the full sample. The follow-up survey data was collected from 604 respondents.Regressions include treatment center × supplementary sample and treatment month fixed effects. Standard
errors adjusted for within treatment session correlation and reported in parentheses. We report the mean of the control group and the standard deviation (in brackets).
Outcomes in the columns: Column 1—Clients are found to have taken a new SEWA loan in the four months after their training was completed. Column 2—Clients are found to have taken a new SEWA business loan in the four months after their training was completed. Column 3—Clients are found to have taken a new SEWA home repair loan in the four months after their training was completed. Column 4—Created from the question about new SEWA loans taken in the past four months: “How much is the total value of the loan?” Column 5—Created from the question about new non-SEWA loans taken in the past four months: “How much is the total value of the loan?” Column 6—Dummy made from the question: “Did you have any problems making a loan repayment in the past 30 days?” Column 7—The following question added over SEWA savings accounts of the household: “How much did you deposit into this savings account in the past 30 days?” Column 8—The following question added over all non-SEWA savings accounts of the household: “How much did you deposit into this savings account in the past 30 days?”
*** Significant at the 1 percent level. ** Significant at the 5 percent level. * Significant at the 10 percent level.
VoL. 8 no. 2 137Field et al.: Peer eFFects and Female entrePreneurs
In keeping with their stated intention to meet a woman’s lifetime needs, SEWA Bank offers a range of loan products which seek to meet their clients’ myriad necessities. These include business loans, house repair loans, loans for children’s education and marriage and asset loans. The interest rates are identical across loan categories; therefore clients do not face incentives to misreport purpose of loan when filing their application.8 The administrative data show that two-thirds of the increased loan taking was for business or house repair loans, with the remaining one-third covering education, marriage, jewelry, and other expenses. In column 2 of Table 3, we see that the increase in business loans is concentrated among the Treated with Friend group while, in column 3, treatment has a similar impact on house repair loan for both treatment groups, a 3 percentage point change that is significant only when pooled. Many women operate their businesses from home, so the home versus business use are not mutually exclusive. The training, therefore, could have had the level effect of inducing both types of treatment clients to take out home repair loans for general improvement of the business. Yet clients in the Treated with Friend group were more likely to incur business-specific loans.
We lack administrative data on the amount borrowed and therefore rely on self-reported loan amounts (column 4). Consistent with the administrative data, total amount borrowed increases by Rs 1,219 and the effect is significant at the 10 percent level though imprecisely estimated. The treatment-specific estimates in panel A are even noisier, making it difficult to assess whether women in the Treated with Friend sample took on a larger amount of debt from SEWA Bank. In col-umn 5, we see that the total amount borrowed from non-SEWA sources, including formal and informal lenders, did not change significantly, though we cannot rule out changes that are smaller than Rs 1,000. In interpreting the differential impact on SEWA and non-SEWA loans, it is worth noting that training-induced exposure to SEWA loan products cannot explain differential take-up of loans and loan type for Treated Alone and Treated with Friend groups. But it is possible that, conditional on the training raising the demand for loans in the Treated with Friend group, SEWA loans were preferable to loans from other formal or informal lenders: clients already had a relationship with SEWA bank via savings accounts or previous loans and, at approximately 18 percent APR, the SEWA loans were offered at competitive rates. Additionally, SEWA is by far the largest—and arguably only—formal loan provider available to women of this income level at the time of the study. Reassuringly, col-umn 6 (from survey data) shows that clients in neither treatment group report greater problems repaying their loans. This suggests that the training did not encourage clients to enter into an excessive amount of business debt.
Columns 7–8 use survey data to examine the treatment effects on savings. The survey only asked about savings behavior over the previous 30 days and we use this data to construct 2 outcome variables: the total amount deposited in their SEWA sav-ings account (column 7) and the total amount deposited in their non-SEWA savings
8 In the administrative data, we observe that loans carried an 18 percent annual percentage rate (APR) if below Rs 25,000 and 18.5 percent APR if above, with loans sizes varying individually (we do not observe this or informa-tion on tenure or repayment schedules in the administrative data). We do recognize that it is likely that some fraction of clients redirect their loan amount to other immediate needs that they had not anticipated while filing their loan.
138 AmErIcAn EconomIc JournAL: EconomIc PoLIcy mAy 2016
account (column 8).9 Overall, we do not observe any significant treatment effects on participants’ saving behavior, athough standard errors are too large to rule out differ-ences of less than approximately 26 percent in a deposit in the previous 30 days, and the point estimates indicate nontrivial differences in magnitude. The observed null, albeit noisy, effect on savings offers reassurance that our survey responses are not driven by reporting bias, since in that case we may have expected social desirability to lead treated respondents to inflate their savings behavior.
Several hypotheses arise to explain the change in borrowing but not in savings behavior, despite the fact that the latter and not the former was emphasized in the training. First, some savings responses may be unobservable in our data: in our sur-vey clients only reported on deposits made into formal savings accounts (SEWA and non-SEWA). It is possible that treatment clients finance business investment through informal savings (e.g., savings at home), and this behavior may be particularly likely when savings are reinvested quickly into business activities. In addition, our survey only asks about savings in the last 30 days; increases in savings may have occurred soon after training and, therefore, fall outside the recall period of the question. (In contrast, we observe all new loans in the four months between training and follow-up.)
Second, it is possible that—in the presence of differences in outstanding debt between the treatment and control group—the absence of a lower rate of savings among the treatment group indicates a higher propensity to save. Put differently, the fact that treatment clients are not making fewer savings deposits despite making more loan payments is consistent with the view that treatment increased the pro-pensity to save. Another way to see this is that the total amount of income that the client is putting aside from earnings to potentially finance investments appears to be higher among treatment clients. Below, in Table 4, column 2, we report how much of the respondent’s monthly income was set aside for business investment. Although noisy and insignificant, the point estimate implies that business spending was over 50 percent higher in the Treated with Friend group. Since the survey was conducted several months after the training, it is possible that differences in investment were even larger very soon after the course ended.
Finally, in terms of why some clients clearly preferred to finance business invest-ments via borrowing rather than via saving, we can only speculate, but there are many potential explanations in the literature. For instance, it is possible that loans provided a necessary commitment device to address interpersonal or intrahousehold barriers to saving.
C. Business Behavior
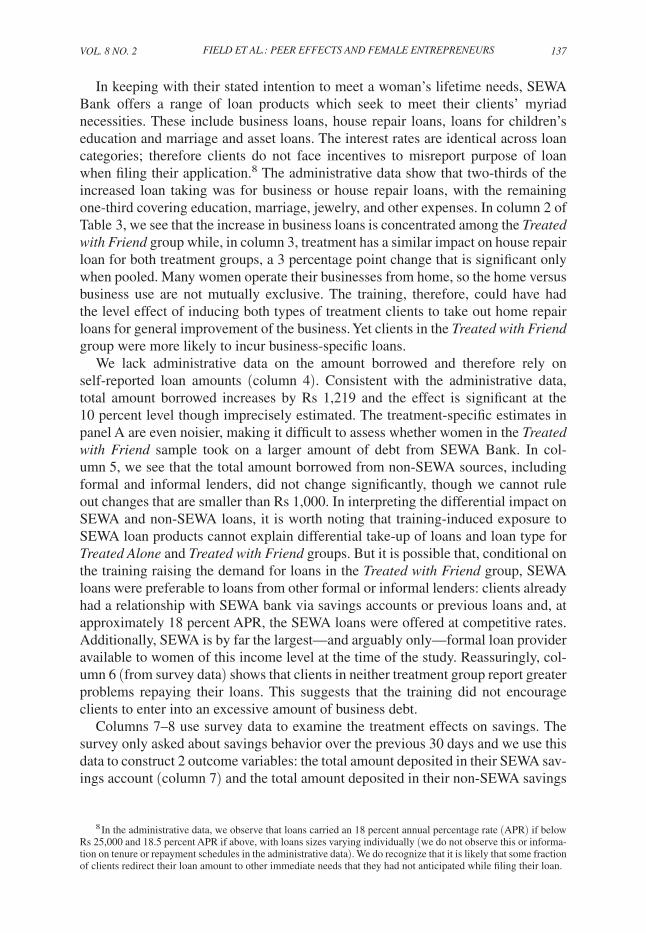
Given that treatment induced women to incur more business loans, in Table 4, we examine the effects of the training on their business activities.
We first consider direct labor and capital inputs. In column 1, panel B, we see that treated clients increased their labor supply by 4 hours per week, which corresponds to a 17 percent increase. Treated with Friend clients show slightly but insignificantly
9 The administrative data that we received from SEWA were incomplete and did not contain data on loan or savings balances.
VoL. 8 no. 2 139Field et al.: Peer eFFects and Female entrePreneurs
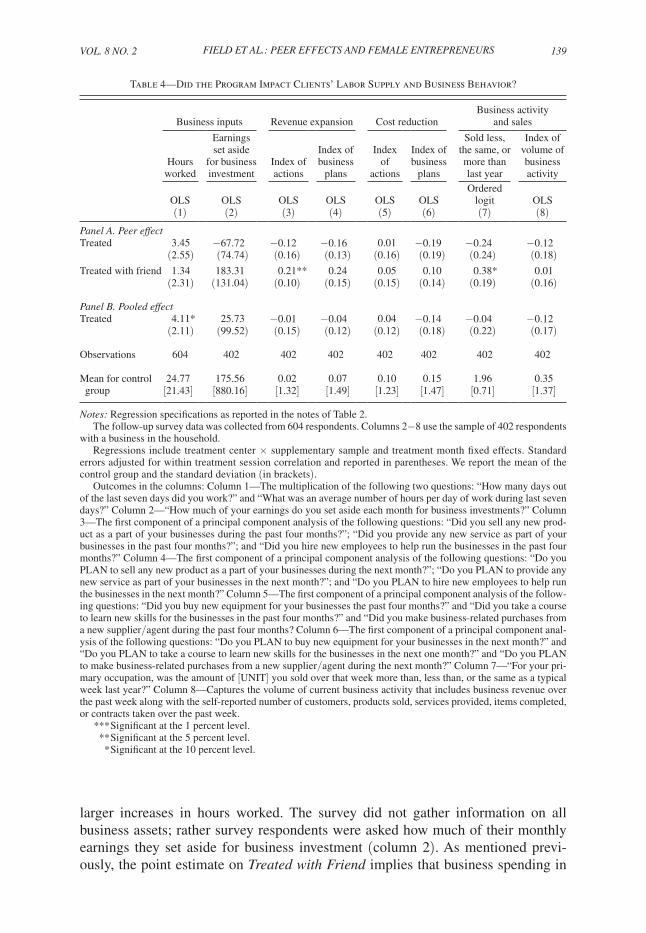
larger increases in hours worked. The survey did not gather information on all business assets; rather survey respondents were asked how much of their monthly earnings they set aside for business investment (column 2). As mentioned previ-ously, the point estimate on Treated with Friend implies that business spending in
Table 4—Did the Program Impact Clients’ Labor Supply and Business Behavior?
Business inputs
Revenue expansion
Cost reduction
Business activity and sales
Hours worked
Earnings set aside
for business investment
Index of actions
Index of business
plans
Index of
actions
Index of business
plans
Sold less, the same, or more than last year
Index of volume of business activity
OLS OLS OLS OLS OLS OLSOrdered
logit OLS(1) (2) (3) (4) (5) (6) (7) (8)
Panel A. Peer effectTreated 3.45 −67.72 −0.12 −0.16 0.01 −0.19 −0.24 −0.12
(2.55) (74.74) (0.16) (0.13) (0.16) (0.19) (0.24) (0.18)Treated with friend 1.34 183.31 0.21** 0.24 0.05 0.10 0.38* 0.01
(2.31) (131.04) (0.10) (0.15) (0.15) (0.14) (0.19) (0.16)
Panel B. Pooled effectTreated 4.11* 25.73 −0.01 −0.04 0.04 −0.14 −0.04 −0.12
(2.11) (99.52) (0.15) (0.12) (0.12) (0.18) (0.22) (0.17)
Observations 604 402 402 402 402 402 402 402
Mean for control 24.77 175.56 0.02 0.07 0.10 0.15 1.96 0.35 group [21.43] [880.16] [1.32] [1.49] [1.23] [1.47] [0.71] [1.37]
notes: Regression specifications as reported in the notes of Table 2.The follow-up survey data was collected from 604 respondents. Columns 2−8 use the sample of 402 respondents
with a business in the household. Regressions include treatment center × supplementary sample and treatment month fixed effects. Standard
errors adjusted for within treatment session correlation and reported in parentheses. We report the mean of the control group and the standard deviation (in brackets).
Outcomes in the columns: Column 1—The multiplication of the following two questions: “How many days out of the last seven days did you work?” and “What was an average number of hours per day of work during last seven days?” Column 2—“How much of your earnings do you set aside each month for business investments?” Column 3—The first component of a principal component analysis of the following questions: “Did you sell any new prod-uct as a part of your businesses during the past four months?”; “Did you provide any new service as part of your businesses in the past four months?”; and “Did you hire new employees to help run the businesses in the past four months?” Column 4—The first component of a principal component analysis of the following questions: “Do you PLAN to sell any new product as a part of your businesses during the next month?”; “Do you PLAN to provide any new service as part of your businesses in the next month?”; and “Do you PLAN to hire new employees to help run the businesses in the next month?” Column 5—The first component of a principal component analysis of the follow-ing questions: “Did you buy new equipment for your businesses the past four months?” and “Did you take a course to learn new skills for the businesses in the past four months?” and “Did you make business-related purchases from a new supplier/agent during the past four months? Column 6—The first component of a principal component anal-ysis of the following questions: “Do you PLAN to buy new equipment for your businesses in the next month?” and “Do you PLAN to take a course to learn new skills for the businesses in the next one month?” and “Do you PLAN to make business-related purchases from a new supplier/agent during the next month?” Column 7—“For your pri-mary occupation, was the amount of [UNIT] you sold over that week more than, less than, or the same as a typical week last year?” Column 8—Captures the volume of current business activity that includes business revenue over the past week along with the self-reported number of customers, products sold, services provided, items completed, or contracts taken over the past week.
*** Significant at the 1 percent level. ** Significant at the 5 percent level. * Significant at the 10 percent level.
140 AmErIcAn EconomIc JournAL: EconomIc PoLIcy mAy 2016
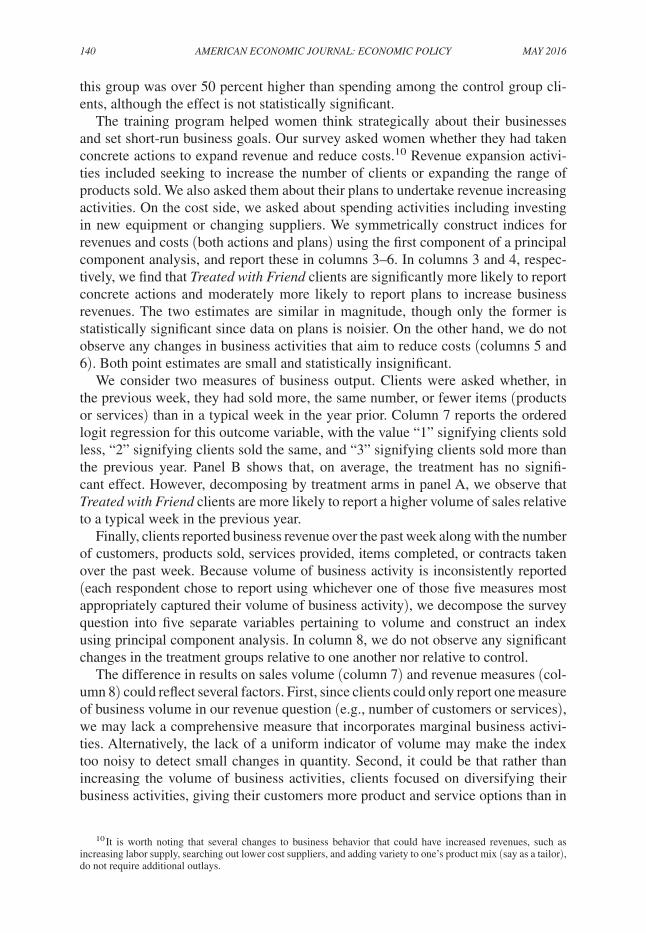
this group was over 50 percent higher than spending among the control group cli-ents, although the effect is not statistically significant.
The training program helped women think strategically about their businesses and set short-run business goals. Our survey asked women whether they had taken concrete actions to expand revenue and reduce costs.10 Revenue expansion activi-ties included seeking to increase the number of clients or expanding the range of products sold. We also asked them about their plans to undertake revenue increasing activities. On the cost side, we asked about spending activities including investing in new equipment or changing suppliers. We symmetrically construct indices for revenues and costs (both actions and plans) using the first component of a principal component analysis, and report these in columns 3–6. In columns 3 and 4, respec-tively, we find that Treated with Friend clients are significantly more likely to report concrete actions and moderately more likely to report plans to increase business revenues. The two estimates are similar in magnitude, though only the former is statistically significant since data on plans is noisier. On the other hand, we do not observe any changes in business activities that aim to reduce costs (columns 5 and 6). Both point estimates are small and statistically insignificant.
We consider two measures of business output. Clients were asked whether, in the previous week, they had sold more, the same number, or fewer items (products or services) than in a typical week in the year prior. Column 7 reports the ordered logit regression for this outcome variable, with the value “1” signifying clients sold less, “2” signifying clients sold the same, and “3” signifying clients sold more than the previous year. Panel B shows that, on average, the treatment has no signifi-cant effect. However, decomposing by treatment arms in panel A, we observe that Treated with Friend clients are more likely to report a higher volume of sales relative to a typical week in the previous year.
Finally, clients reported business revenue over the past week along with the number of customers, products sold, services provided, items completed, or contracts taken over the past week. Because volume of business activity is inconsistently reported (each respondent chose to report using whichever one of those five measures most appropriately captured their volume of business activity), we decompose the survey question into five separate variables pertaining to volume and construct an index using principal component analysis. In column 8, we do not observe any significant changes in the treatment groups relative to one another nor relative to control.
The difference in results on sales volume (column 7) and revenue measures (col-umn 8) could reflect several factors. First, since clients could only report one measure of business volume in our revenue question (e.g., number of customers or services), we may lack a comprehensive measure that incorporates marginal business activi-ties. Alternatively, the lack of a uniform indicator of volume may make the index too noisy to detect small changes in quantity. Second, it could be that rather than increasing the volume of business activities, clients focused on diversifying their business activities, giving their customers more product and service options than in
10 It is worth noting that several changes to business behavior that could have increased revenues, such as increasing labor supply, searching out lower cost suppliers, and adding variety to one’s product mix (say as a tailor), do not require additional outlays.
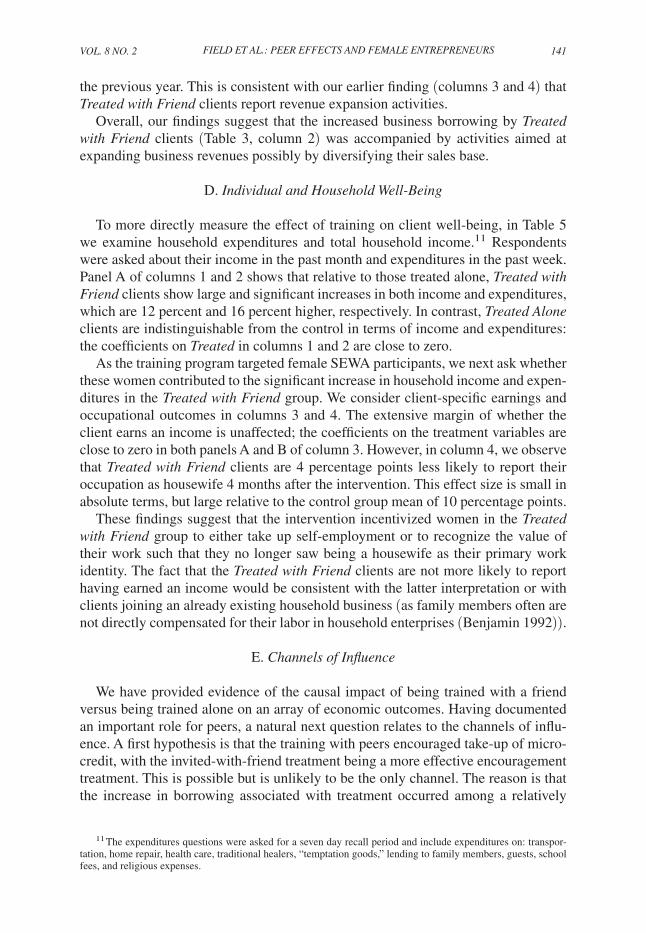
VoL. 8 no. 2 141Field et al.: Peer eFFects and Female entrePreneurs
the previous year. This is consistent with our earlier finding (columns 3 and 4) that Treated with Friend clients report revenue expansion activities.
Overall, our findings suggest that the increased business borrowing by Treated with Friend clients (Table 3, column 2) was accompanied by activities aimed at expanding business revenues possibly by diversifying their sales base.
D. Individual and Household Well-Being
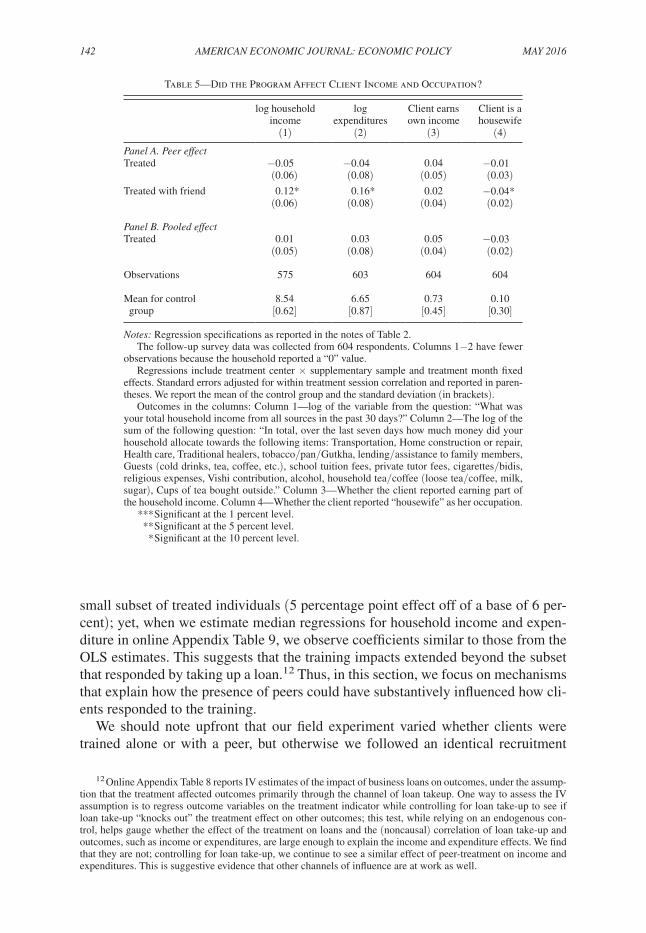
To more directly measure the effect of training on client well-being, in Table 5 we examine household expenditures and total household income.11 Respondents were asked about their income in the past month and expenditures in the past week. Panel A of columns 1 and 2 shows that relative to those treated alone, Treated with Friend clients show large and significant increases in both income and expenditures, which are 12 percent and 16 percent higher, respectively. In contrast, Treated Alone clients are indistinguishable from the control in terms of income and expenditures: the coefficients on Treated in columns 1 and 2 are close to zero.
As the training program targeted female SEWA participants, we next ask whether these women contributed to the significant increase in household income and expen-ditures in the Treated with Friend group. We consider client-specific earnings and occupational outcomes in columns 3 and 4. The extensive margin of whether the client earns an income is unaffected; the coefficients on the treatment variables are close to zero in both panels A and B of column 3. However, in column 4, we observe that Treated with Friend clients are 4 percentage points less likely to report their occupation as housewife 4 months after the intervention. This effect size is small in absolute terms, but large relative to the control group mean of 10 percentage points.
These findings suggest that the intervention incentivized women in the Treated with Friend group to either take up self-employment or to recognize the value of their work such that they no longer saw being a housewife as their primary work identity. The fact that the Treated with Friend clients are not more likely to report having earned an income would be consistent with the latter interpretation or with clients joining an already existing household business (as family members often are not directly compensated for their labor in household enterprises (Benjamin 1992)).
E. channels of Influence
We have provided evidence of the causal impact of being trained with a friend versus being trained alone on an array of economic outcomes. Having documented an important role for peers, a natural next question relates to the channels of influ-ence. A first hypothesis is that the training with peers encouraged take-up of micro-credit, with the invited-with-friend treatment being a more effective encouragement treatment. This is possible but is unlikely to be the only channel. The reason is that the increase in borrowing associated with treatment occurred among a relatively
11 The expenditures questions were asked for a seven day recall period and include expenditures on: transpor-tation, home repair, health care, traditional healers, “temptation goods,” lending to family members, guests, school fees, and religious expenses.
142 AmErIcAn EconomIc JournAL: EconomIc PoLIcy mAy 2016
small subset of treated individuals (5 percentage point effect off of a base of 6 per-cent); yet, when we estimate median regressions for household income and expen-diture in online Appendix Table 9, we observe coefficients similar to those from the OLS estimates. This suggests that the training impacts extended beyond the subset that responded by taking up a loan.12 Thus, in this section, we focus on mechanisms that explain how the presence of peers could have substantively influenced how cli-ents responded to the training.
We should note upfront that our field experiment varied whether clients were trained alone or with a peer, but otherwise we followed an identical recruitment
12 Online Appendix Table 8 reports IV estimates of the impact of business loans on outcomes, under the assump-tion that the treatment affected outcomes primarily through the channel of loan takeup. One way to assess the IV assumption is to regress outcome variables on the treatment indicator while controlling for loan take-up to see if loan take-up “knocks out” the treatment effect on other outcomes; this test, while relying on an endogenous con-trol, helps gauge whether the effect of the treatment on loans and the (noncausal) correlation of loan take-up and outcomes, such as income or expenditures, are large enough to explain the income and expenditure effects. We find that they are not; controlling for loan take-up, we continue to see a similar effect of peer-treatment on income and expenditures. This is suggestive evidence that other channels of influence are at work as well.
Table 5—Did the Program Affect Client Income and Occupation?
log household income
log expenditures
Client earns own income
Client is a housewife
(1) (2) (3) (4)
Panel A. Peer effectTreated −0.05 −0.04 0.04 −0.01
(0.06) (0.08) (0.05) (0.03)Treated with friend 0.12* 0.16* 0.02 −0.04*
(0.06) (0.08) (0.04) (0.02)
Panel B. Pooled effectTreated 0.01 0.03 0.05 −0.03
(0.05) (0.08) (0.04) (0.02)
Observations 575 603 604 604
Mean for control 8.54 6.65 0.73 0.10 group [0.62] [0.87] [0.45] [0.30]
notes: Regression specifications as reported in the notes of Table 2.The follow-up survey data was collected from 604 respondents. Columns 1−2 have fewer
observations because the household reported a “0” value.Regressions include treatment center × supplementary sample and treatment month fixed
effects. Standard errors adjusted for within treatment session correlation and reported in paren-theses. We report the mean of the control group and the standard deviation (in brackets).
Outcomes in the columns: Column 1—log of the variable from the question: “What was your total household income from all sources in the past 30 days?” Column 2—The log of the sum of the following question: “In total, over the last seven days how much money did your household allocate towards the following items: Transportation, Home construction or repair, Health care, Traditional healers, tobacco/pan/Gutkha, lending/assistance to family members, Guests (cold drinks, tea, coffee, etc.), school tuition fees, private tutor fees, cigarettes/bidis, religious expenses, Vishi contribution, alcohol, household tea/coffee (loose tea/coffee, milk, sugar), Cups of tea bought outside.” Column 3—Whether the client reported earning part of the household income. Column 4—Whether the client reported “housewife” as her occupation.
*** Significant at the 1 percent level. ** Significant at the 5 percent level. * Significant at the 10 percent level.
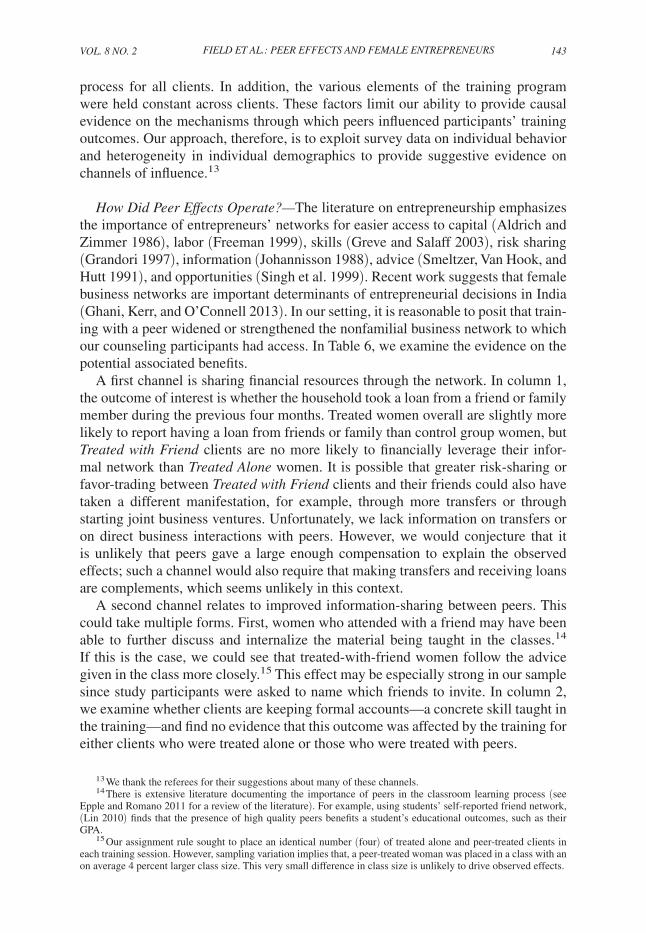
VoL. 8 no. 2 143Field et al.: Peer eFFects and Female entrePreneurs
process for all clients. In addition, the various elements of the training program were held constant across clients. These factors limit our ability to provide causal evidence on the mechanisms through which peers influenced participants’ training outcomes. Our approach, therefore, is to exploit survey data on individual behavior and heterogeneity in individual demographics to provide suggestive evidence on channels of influence.13
How Did Peer Effects operate?—The literature on entrepreneurship emphasizes the importance of entrepreneurs’ networks for easier access to capital (Aldrich and Zimmer 1986), labor (Freeman 1999), skills (Greve and Salaff 2003), risk sharing (Grandori 1997), information (Johannisson 1988), advice (Smeltzer, Van Hook, and Hutt 1991), and opportunities (Singh et al. 1999). Recent work suggests that female business networks are important determinants of entrepreneurial decisions in India (Ghani, Kerr, and O’Connell 2013). In our setting, it is reasonable to posit that train-ing with a peer widened or strengthened the nonfamilial business network to which our counseling participants had access. In Table 6, we examine the evidence on the potential associated benefits.
A first channel is sharing financial resources through the network. In column 1, the outcome of interest is whether the household took a loan from a friend or family member during the previous four months. Treated women overall are slightly more likely to report having a loan from friends or family than control group women, but Treated with Friend clients are no more likely to financially leverage their infor-mal network than Treated Alone women. It is possible that greater risk-sharing or favor-trading between Treated with Friend clients and their friends could also have taken a different manifestation, for example, through more transfers or through starting joint business ventures. Unfortunately, we lack information on transfers or on direct business interactions with peers. However, we would conjecture that it is unlikely that peers gave a large enough compensation to explain the observed effects; such a channel would also require that making transfers and receiving loans are complements, which seems unlikely in this context.
A second channel relates to improved information-sharing between peers. This could take multiple forms. First, women who attended with a friend may have been able to further discuss and internalize the material being taught in the classes.14 If this is the case, we could see that treated-with-friend women follow the advice given in the class more closely.15 This effect may be especially strong in our sample since study participants were asked to name which friends to invite. In column 2, we examine whether clients are keeping formal accounts—a concrete skill taught in the training—and find no evidence that this outcome was affected by the training for either clients who were treated alone or those who were treated with peers.
13 We thank the referees for their suggestions about many of these channels. 14 There is extensive literature documenting the importance of peers in the classroom learning process (see
Epple and Romano 2011 for a review of the literature). For example, using students’ self-reported friend network, (Lin 2010) finds that the presence of high quality peers benefits a student’s educational outcomes, such as their GPA.
15 Our assignment rule sought to place an identical number (four) of treated alone and peer-treated clients in each training session. However, sampling variation implies that, a peer-treated woman was placed in a class with an on average 4 percent larger class size. This very small difference in class size is unlikely to drive observed effects.
144 AmErIcAn EconomIc JournAL: EconomIc PoLIcy mAy 2016
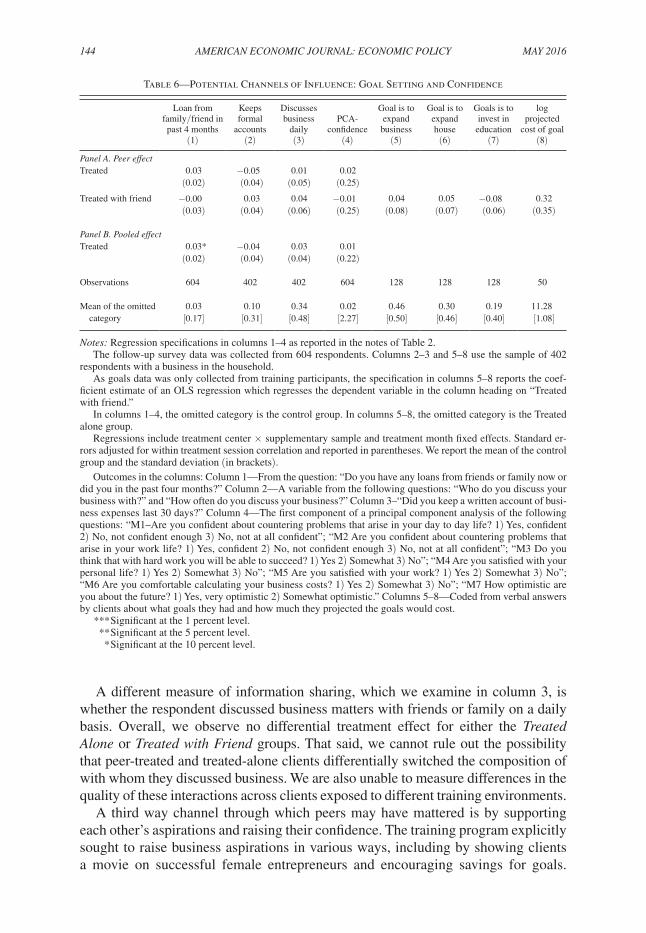
A different measure of information sharing, which we examine in column 3, is whether the respondent discussed business matters with friends or family on a daily basis. Overall, we observe no differential treatment effect for either the Treated Alone or Treated with Friend groups. That said, we cannot rule out the possibility that peer-treated and treated-alone clients differentially switched the composition of with whom they discussed business. We are also unable to measure differences in the quality of these interactions across clients exposed to different training environments.
A third way channel through which peers may have mattered is by supporting each other’s aspirations and raising their confidence. The training program explicitly sought to raise business aspirations in various ways, including by showing clients a movie on successful female entrepreneurs and encouraging savings for goals.
Table 6—Potential Channels of Influence: Goal Setting and Confidence
Loan from family/friend in past 4 months
Keeps formal
accounts
Discusses business
dailyPCA-
confidence
Goal is to expand business
Goal is to expand house
Goals is to invest in
education
log projected
cost of goal(1) (2) (3) (4) (5) (6) (7) (8)
Panel A. Peer effectTreated 0.03 −0.05 0.01 0.02
(0.02) (0.04) (0.05) (0.25)Treated with friend −0.00 0.03 0.04 −0.01 0.04 0.05 −0.08 0.32
(0.03) (0.04) (0.06) (0.25) (0.08) (0.07) (0.06) (0.35)
Panel B. Pooled effectTreated 0.03* −0.04 0.03 0.01
(0.02) (0.04) (0.04) (0.22)
Observations 604 402 402 604 128 128 128 50
Mean of the omitted 0.03 0.10 0.34 0.02 0.46 0.30 0.19 11.28 category [0.17] [0.31] [0.48] [2.27] [0.50] [0.46] [0.40] [1.08]
notes: Regression specifications in columns 1–4 as reported in the notes of Table 2.The follow-up survey data was collected from 604 respondents. Columns 2–3 and 5–8 use the sample of 402
respondents with a business in the household.As goals data was only collected from training participants, the specification in columns 5–8 reports the coef-
ficient estimate of an OLS regression which regresses the dependent variable in the column heading on “Treated with friend.”
In columns 1–4, the omitted category is the control group. In columns 5–8, the omitted category is the Treated alone group.
Regressions include treatment center × supplementary sample and treatment month fixed effects. Standard er-rors adjusted for within treatment session correlation and reported in parentheses. We report the mean of the control group and the standard deviation (in brackets).
Outcomes in the columns: Column 1—From the question: “Do you have any loans from friends or family now or did you in the past four months?” Column 2—A variable from the following questions: “Who do you discuss your business with?” and “How often do you discuss your business?” Column 3–“Did you keep a written account of busi-ness expenses last 30 days?” Column 4—The first component of a principal component analysis of the following questions: “M1–Are you confident about countering problems that arise in your day to day life? 1) Yes, confident 2) No, not confident enough 3) No, not at all confident”; “M2 Are you confident about countering problems that arise in your work life? 1) Yes, confident 2) No, not confident enough 3) No, not at all confident”; “M3 Do you think that with hard work you will be able to succeed? 1) Yes 2) Somewhat 3) No”; “M4 Are you satisfied with your personal life? 1) Yes 2) Somewhat 3) No”; “M5 Are you satisfied with your work? 1) Yes 2) Somewhat 3) No”; “M6 Are you comfortable calculating your business costs? 1) Yes 2) Somewhat 3) No”; “M7 How optimistic are you about the future? 1) Yes, very optimistic 2) Somewhat optimistic.” Columns 5–8—Coded from verbal answers by clients about what goals they had and how much they projected the goals would cost.
*** Significant at the 1 percent level. ** Significant at the 5 percent level. * Significant at the 10 percent level.
VoL. 8 no. 2 145Field et al.: Peer eFFects and Female entrePreneurs
Women who were invited to attend with peers may have found themselves in a more comfortable and supportive environment which facilitated the effectiveness of the training at raising aspirations. At follow-up, women were asked seven questions to ascertain their level of confidence.16 These seven measures were combined into a confidence index using the first component of a principal component analysis. Column 4 shows that neither treatment influenced the reported confidence levels of participants four months post-intervention.
Finally, we examine whether training with peers helped women set higher goals in the short run. Some suggestive evidence comes from the goal worksheets filled out by women at the end of the first day of training. (The Appendix describes the data collected.) These worksheets, which were to be filled out at home, gave clients who attended both days the opportunity to identify a financial goal they wished to achieve. On the second day, methods for achieving that goal were reviewed with the group and the trainers. We were able to retrieve the goal sheets for only a subset of the clients trained, and examine stated goals in columns 5–7. (Since the control group clients did not fill out goal sheets, our sample consists of women in the treat-ment arms and the omitted category in the regressions is the treated-alone arm.) The reduced sample size limits the precision and interpretability of estimated treatment effects. The two most common goal categories were to start or expand a business (column 5) and to buy/repair a house (column 6). The latter would often entail converting a room in the house to a business or shop location. Examples of goals include “To open a shop; to take more catering orders to increase income,” and “To open my own agarbatti [incense] center, for which I need my own small place.” Reported goals match the observed loan demand in Table 3, and we find weak evi-dence that clients in the Treated with Friend group are more likely to set business goals. Consistent with these clients setting more ambitious goals, the plans in the Treated with Friend arm are also projected to cost more (column 8).
It is possible that some of the observed differences in behavior across treatment arms reflects spillovers. First, there could be negative impacts on those trained alone of being trained in the presence of others with friends. For instance, participants who come alone may be less likely to talk to anyone during the training if other participants in their group already know one another, compared to a scenario where every participant had come alone.
So did peer effects matter in part because of the disadvantage they confer to nonnetworked individuals? In the context of our experiment, one way of assessing this is to exploit variation in the number of Treated with Friend clients assigned per group. We estimate regressions where we exclude clients in the Treated with Friend group and ask whether treatment effects for clients in the Treated Alone group (rel-ative to the control group) vary with the fraction of Treated with Friend individuals in that group, conditional on total group size. We do this two ways, using the exoge-nous but limited variation induced by random assignment and using the endogenous
16 The seven questions were: (i) “Are you confident about countering problems that arise in your day-to-day life?” (ii) “Are you confident about countering problems that arise in your work life?” (iii) “Do you think that with hard work you will be able to succeed?” (iv) “Are you satisfied with your personal life?” (v) “Are you satisfied with your work?” (vi) “Are you comfortable calculating your business costs?” (vii) “How optimistic are you about the future?” For more information see the variable creation description in the Appendix.
146 AmErIcAn EconomIc JournAL: EconomIc PoLIcy mAy 2016
but larger variation in who actually showed up for training. In both specifications, we fail to find any consistent evidence of negative peer externalities.
We should also note that our overall treatment impacts may be muted if there are positive spillovers to the control group. While we lack data to directly test this, our sample of trained women is relatively small compared to the number of SEWA cli-ents in the catchment area of a training center. Additionally, when we replace control clients within a given training group with randomly selected control clients from a different SEWA training center, all of our results remain very similar, both in terms of significance and in magnitude. This, combined with the absence of peer treatment effects on discussing business with a friend, leads us to believe that positive spill-overs to the control group are unlikely to be large enough to be a concern. Finally, the follow-up survey occurred on a rolling basis and typically at four months after the training; this may be too short a time period for spillovers to manifest.17
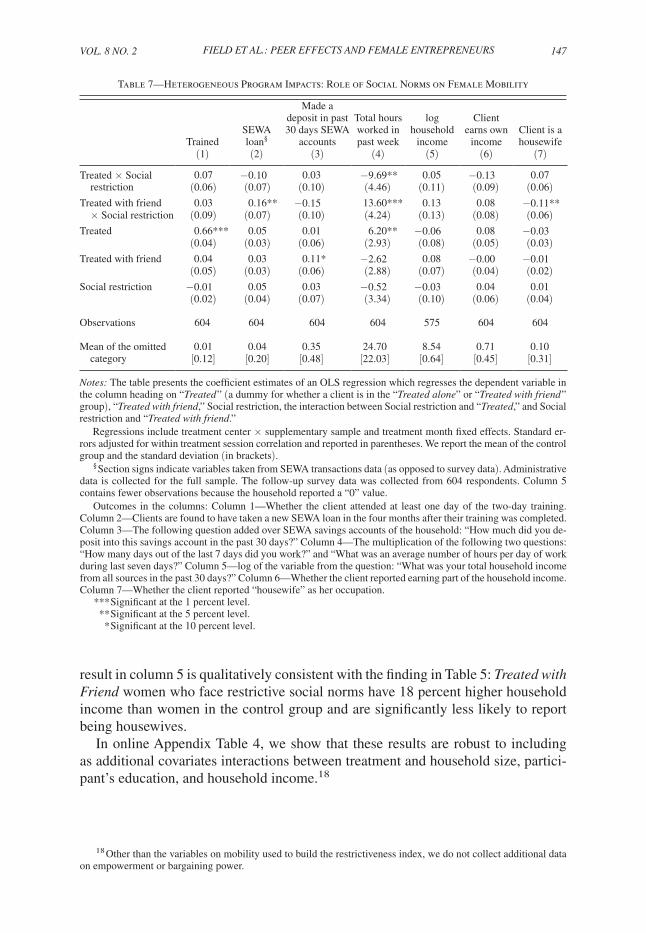
Did Peer Effects Vary with Social norms?—Female labor force participation in India is exceptionally low at 27 percent: India ranks 168 out of 186 in the world for this marker. A commonly cited reason is social norms, which restrict female mobility and thereby the economic empowerment of women (World Bank 2011). Our results suggest that women trained with a peer were more likely to gain economically from the training and, strikingly, four months later were less likely to report being housewives. A complementary way of understanding how peer effects operate is, therefore, to ask whether responsiveness to treatment varied with the restrictiveness of social norms faced by women. As we have previously docu-mented in Field, Jayachandran, and Pande (2010), social norms related to mobility vary by caste and religion in India, and upper-caste women benefited from the treatment relative to both more restricted groups (Muslims) and less restricted ones (scheduled castes).
In Table 7, we interact treatment status directly with an indicator of social restric-tion (online Appendix Table 1 replicates this analysis using the social group catego-rization used in Field, Jayachandran, and Pande (2010)). The indicator is a dummy for the top quartile of an index created through a point system of the following six criteria: whether the woman (i) can seek employment, (ii) can socialize alone, (iii) does not have to wear a veil, (iv) can speak to elder family members, (v) has access to educational opportunities, and (vi) can freely go outside the home.
In column 1, we do not find differential take-up when recruited with a friend, even among women from more conservative backgrounds. In contrast, for outcome measures, the main Treated with Friend findings in Tables 3–5 are concentrated among women who face greater restrictions on their mobility.
Specifically, in column 2 we see that Treated with Friend clients who face more social restrictions are 0.06 percentage points (or 150 percent) more likely to take out a SEWA loan than unrestricted women in the control, although they are no more likely to have higher savings (column 3). This subsample also works nearly four more hours per week than women in the control group. Although noisy, the income
17 In our sample, the mean duration between the treatment and follow-up data collection is 4.3 months with a standard deviation of 2.2 months.
VoL. 8 no. 2 147Field et al.: Peer eFFects and Female entrePreneurs
result in column 5 is qualitatively consistent with the finding in Table 5: Treated with Friend women who face restrictive social norms have 18 percent higher household income than women in the control group and are significantly less likely to report being housewives.
In online Appendix Table 4, we show that these results are robust to including as additional covariates interactions between treatment and household size, partici-pant’s education, and household income.18
18 Other than the variables on mobility used to build the restrictiveness index, we do not collect additional data on empowerment or bargaining power.
Table 7—Heterogeneous Program Impacts: Role of Social Norms on Female Mobility
TrainedSEWA loan§
Made a deposit in past 30 days SEWA
accounts
Total hours worked in past week
log household
income
Client earns own
incomeClient is a housewife
(1) (2) (3) (4) (5) (6) (7)
Treated × Social 0.07 −0.10 0.03 −9.69** 0.05 −0.13 0.07 restriction (0.06) (0.07) (0.10) (4.46) (0.11) (0.09) (0.06)Treated with friend 0.03 0.16** −0.15 13.60*** 0.13 0.08 −0.11** × Social restriction (0.09) (0.07) (0.10) (4.24) (0.13) (0.08) (0.06)Treated 0.66*** 0.05 0.01 6.20** −0.06 0.08 −0.03
(0.04) (0.03) (0.06) (2.93) (0.08) (0.05) (0.03)Treated with friend 0.04 0.03 0.11* −2.62 0.08 −0.00 −0.01
(0.05) (0.03) (0.06) (2.88) (0.07) (0.04) (0.02)Social restriction −0.01 0.05 0.03 −0.52 −0.03 0.04 0.01
(0.02) (0.04) (0.07) (3.34) (0.10) (0.06) (0.04)
Observations 604 604 604 604 575 604 604
Mean of the omitted 0.01 0.04 0.35 24.70 8.54 0.71 0.10 category [0.12] [0.20] [0.48] [22.03] [0.64] [0.45] [0.31]
notes: The table presents the coefficient estimates of an OLS regression which regresses the dependent variable in the column heading on “Treated ” (a dummy for whether a client is in the “Treated alone” or “Treated with friend ” group), “Treated with friend,” Social restriction, the interaction between Social restriction and “Treated,” and Social restriction and “Treated with friend.”
Regressions include treatment center × supplementary sample and treatment month fixed effects. Standard er-rors adjusted for within treatment session correlation and reported in parentheses. We report the mean of the control group and the standard deviation (in brackets).
§ Section signs indicate variables taken from SEWA transactions data (as opposed to survey data). Administrative data is collected for the full sample. The follow-up survey data was collected from 604 respondents. Column 5 contains fewer observations because the household reported a “0” value.
Outcomes in the columns: Column 1—Whether the client attended at least one day of the two-day training. Column 2—Clients are found to have taken a new SEWA loan in the four months after their training was completed. Column 3—The following question added over SEWA savings accounts of the household: “How much did you de-posit into this savings account in the past 30 days?” Column 4—The multiplication of the following two questions: “How many days out of the last 7 days did you work?” and “What was an average number of hours per day of work during last seven days?” Column 5—log of the variable from the question: “What was your total household income from all sources in the past 30 days?” Column 6—Whether the client reported earning part of the household income. Column 7—Whether the client reported “housewife” as her occupation.
*** Significant at the 1 percent level. ** Significant at the 5 percent level. * Significant at the 10 percent level.
148 AmErIcAn EconomIc JournAL: EconomIc PoLIcy mAy 2016
Thus, it appears that the observed differences are not proxying for obvious eco-nomic characteristics though we, of course, note the caveat that our measures of social norms may, in part, capture other unobservable client characteristics.
Overall, Table 7 suggests that Treat with Friend clients who face more social restrictions responded to the treatment by changing business behavior rather than by being more likely to take up the training. This, together with the results in Table 6, suggests that an important aspect of peer treatment was the support women received in identifying and implementing business goals. That being said, the bundled nature of our treatment implies that our evidence remains necessarily suggestive and points to the need for future research.
III. Conclusion
A series of recent “cash-drop” studies examine female entrepreneurship and find women enterprise owners to be significantly less productive than their male counterparts (de Mel, McKenzie, and Woodruff 2008; Fafchamps et al. 2011). One possible way of interpreting those results is that women are not good entrepreneurs. However, our findings challenge such a conclusion. Specifically, women who attend a business training with a friend are able to expand their businesses and increase household earnings and expenditures. This suggests that rather than being bad entre-preneurs, women may be constrained in ways that men are not.
Despite the proliferation of financial inclusion efforts in developing countries over the past few decades, financial institutions targeting the poor, such as micro-finance institutions, still face problems reaching sufficient numbers of borrowers to stay afloat, and the successful ones are having trouble scaling up operations (Armendáriz and Morduch 2010). Our results suggest that one potentially important factor limiting financial inclusion efforts is inadequate peer support among many of the women who have the potential to start or expand entrepreneurial activities. Involving a friend led participants in our two-day training program to double their demand for loans and significantly expand their business activity, resulting in higher household income. Those who belonged to more restrictive social groups were particularly sensitive to peer involvement. Thus, programs designed to empower women through business training or by giving them loans or cash grants (de Mel, McKenzie, and Woodruff 2014) may be more successful if they harness peer sup-port as part of the program design, particularly when working with clients from restrictive social backgrounds.
It is also surprising that demand for bank services can be influenced simply by encouraging female entrepreneurs to form concrete goals and aspirations. In our study, all women were familiar with bank loans available through the partner insti-tution well before the training (as they were members of SEWA Bank with savings accounts), and during the training these women were neither taught about financing through loans nor encouraged to borrow. Rather, simply encouraging them to focus on concrete goals in the presence of a friend changed their demand for bank loans. This suggests that debt-aversion and lack of information about financial services are not the only roots of low demand for credit among female entrepreneurs, as is often

VoL. 8 no. 2 149Field et al.: Peer eFFects and Female entrePreneurs
suggested. These results contribute to the growing body of evidence on the impor-tance of personal networks for individual wellbeing.
IV. Training Appendix
A. outline of Training
Page references are to Freedom from Hunger training module
Day 1: How to think like a business person
• Introduction[5 min]
– Bicycle chain game: Get participants to introduce themselves: their name, business, and how long they have been doing it
• Yourunabusiness,pg7[10 min]
– Definition of a business is earning profits – Types of business: manufacturing, services, and trading
• Traits of a successful entrepreneur, pg12 [30 min: 15 min story + 15 min discussion]
– Reshmaben and Rahimaben story and discussion – Ask each woman to identify one trait of Reshmaben and one trait of
Rahimaben that they have
• Howtokeeptrackofcostsincludingavoidwastefulexpense,pg45–49[30 min]
– Many costs in a business; important to think about all of them – Explain through example such as tailoring business, pg 48 – Direct costs: raw material such as cloth – Indirect costs such as costs of electricity for sewing machine during home-
based work, repairing sewing machine, interest costs
• Avoidwastefulspendingsuchastoomanycupsoftea,pan
• Howtotrackincomeandcalculateprofit,pg61[15 min]
– Keep track of income and expenses – Income minus expenses equals profits – Profits go to household expenses + saving + investing to expand business
• Shouldbeopentoexpandingyourbusiness[15 min]
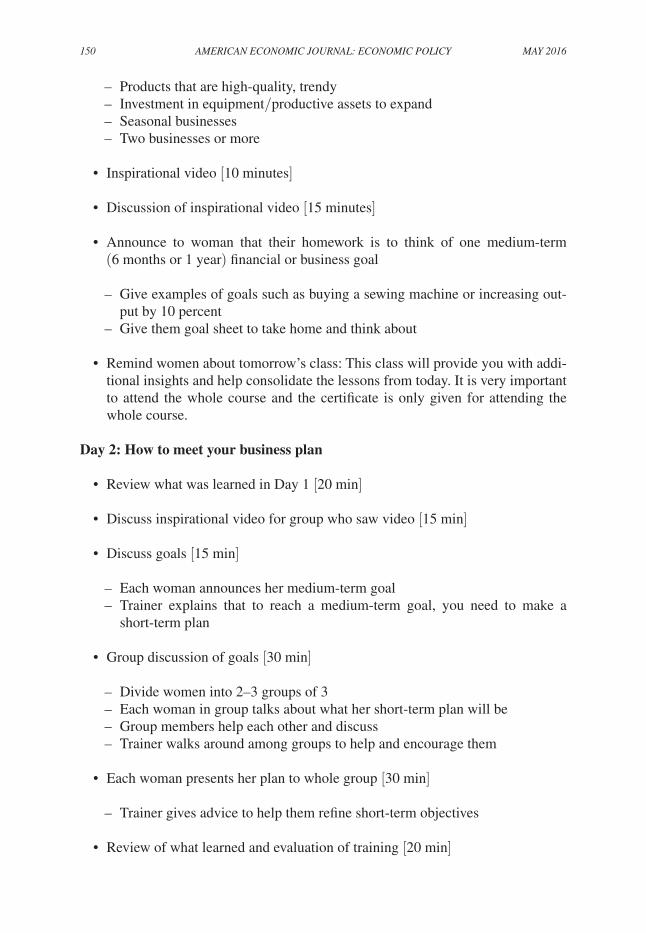
150 AmErIcAn EconomIc JournAL: EconomIc PoLIcy mAy 2016
– Products that are high-quality, trendy – Investment in equipment/productive assets to expand – Seasonal businesses – Two businesses or more
• Inspirationalvideo[10 minutes]
• Discussionofinspirationalvideo[15 minutes]
• Announce to woman that their homework is to think of one medium-term(6 months or 1 year) financial or business goal
– Give examples of goals such as buying a sewing machine or increasing out-put by 10 percent
– Give them goal sheet to take home and think about
• Remindwomenabouttomorrow’sclass:Thisclasswillprovideyouwithaddi-tional insights and help consolidate the lessons from today. It is very important to attend the whole course and the certificate is only given for attending the whole course.
Day 2: How to meet your business plan
• ReviewwhatwaslearnedinDay1[20 min]
• Discussinspirationalvideoforgroupwhosawvideo[15 min]
• Discussgoals[15 min]
– Each woman announces her medium-term goal – Trainer explains that to reach a medium-term goal, you need to make a
short-term plan
• Groupdiscussionofgoals[30 min]
– Divide women into 2–3 groups of 3 – Each woman in group talks about what her short-term plan will be – Group members help each other and discuss – Trainer walks around among groups to help and encourage them
• Eachwomanpresentsherplantowholegroup[30 min]
– Trainer gives advice to help them refine short-term objectives
• Reviewofwhatlearnedandevaluationoftraining[20 min]

VoL. 8 no. 2 151Field et al.: Peer eFFects and Female entrePreneurs
• Give out certificates and each woman states what she learned in particular [10 min]
B. Business Training Worksheet
Training date:Name: Literate: Business:Age:Approximate household income:
DAY 1: HOMEWORKAnswer questions 1 through 4 on this page only BEFORE class tomorrow.
1. List one specific goal or dream that you want to accomplish:
2. Approximately how much will it cost to accomplish this goal? Rs
3. How far can you get towards this goal dream in one year: Rs
4. Write down every personal and business expense yesterday:
DAY 2: Personal financial plan and business goals
1. How much you must save each week to accomplish your 1-year goal: Rs
2. List one or two sources of wasteful expenditure in your household or busi-ness: a) Rs b) Rs
3. How much money do you waste each week on this? Rs
4. List one other nonfinancial thing you can change to increase business profit: Rs
5. Monthly financial plan:
A. Monthly business income:
B. Total household expenses:
C. Total business expenses:
D. Amount each month towards business goal:
E. Amount each month towards old age savings:

152 AmErIcAn EconomIc JournAL: EconomIc PoLIcy mAy 2016
F. Amount each month towards emergency savings:
G. Amount each month towards other savings:
H. Purpose of other savings:
(a)
(b)
Signature:
REFERENCES
Aldrich, Howard, and Catherine Zimmer. 1986. “Entrepreneurship through Social Networks.” http://www.researchgate.net/profile/Howard_Aldrich/publication/228264225_Entrepreneurship_Through_Social_Networks/links/02e7c519547ccc47a9000000.pdf.
Armendáriz, Beatriz, and Jonathan Morduch. 2010. The Economics of microfinance. Cambridge: MIT Press.
Banerjee, Abhijit, Esther Duflo, Rachel Glennerster, and Cynthia Kinnan. 2015. “The Miracle of Microfinance? Evidence from a Randomized Evaluation.” American Economic Journal: Applied Economics 7 (1): 22–53.
Benjamin, Dwayne. 1992. “Household Composition, Labor Markets, and Labor Demand: Testing for Separation in Agricultural Household Models.” Econometrica 60 (2): 287–322.
de Mel, Suresh, David McKenzie, and Christopher Woodruff. 2008. “Returns to Capital in Microen-terprises: Evidence from a Field Experiment.” Quarterly Journal of Economics 123 (4): 1329–72.
de Mel, Suresh, David McKenzie, and Christopher Woodruff. 2014. “Business training and female enterprise start-up, growth, and dynamics: Experimental evidence from Sri Lanka.” Journal of Development Economics 106: 199–210.
Duflo, Esther, Pascaline Dupas, and Michael Kremer. 2011. “Peer Effects, Teacher Incentives, and the Impact of Tracking: Evidence from a Randomized Evaluation in Kenya.” American Economic review 101 (5): 1739–74.
Epple, Dennis, and Richard Romano. 2011. “Peer effects in education: A survey of the theory and evi-dence.” In Handbook of Social Economics, Vol. 1, edited by Jess Benhabib, Alberto Bisin, and Mat-thew O. Jackson, 1053–1163. Amsterdam: North-Holland.
Fafchamps, Marcel, David McKenzie, Simon Quinn, and Christopher Woodruff. 2011. “Female Microenterprises and the Fly-Paper Effect: Evidence from a Randomized Experiment in Ghana.” http://siteresources.worldbank.org/DEC/Resources/Female_Microenterprises_and_theFly-paper_Effect.pdf.
Field, Erica, Seema Jayachandran, and Rohini Pande. 2010. “Do Traditional Institutions Constrain Female Entrepreneurship? A Field Experiment on Business Training in India.” American Economic review 100 (2): 125–29.
Field, Erica, Seema Jayachandran, Rohini Pande, and Natalia Rigol. 2016. “Friendship at Work: Can Peer Effects Catalyze Female Entrepreneurship?: Dataset.” American Economic Journal: Eco-nomic Policy. http://dx.doi.org/10.1257/pol.20140215.
Field, Erica, Rohini Pande, John Papp, and Natalia Rigol. 2013. “Does the Classic Microfinance Model Discourage Entrepreneurship Among the Poor? Experimental Evidence from India.” Amer-ican Economic review 103 (6): 2196–2226.
Freeman, John. 1999. “Venture capital as an economy of time.” In Corporate Social capital and Lia-bility, edited by Roger Th. A. J. Leenders and Shaul M. Gabbay, 460–79. Norwell, MA: Kluwer Academic Publishers.
Ghani, Ejaz, William R. Kerr, and Stephen D. O’Connell. 2013. “Local industrial structures and female entrepreneurship in India.” Journal of Economic Geography 13 (6): 929–64.
Grandori, Anna. 1997. “An Organizational Assessment of Interfirm Coordination Modes.” organiza-tion Studies 18 (6): 897–925.
VoL. 8 no. 2 153Field et al.: Peer eFFects and Female entrePreneurs
Greve, Arent, and Janet W. Salaff. 2003. “Social networks and entrepreneurship.” Entrepreneurship Theory and Practice 28 (1): 1–22.
Johannisson, Bengt. 1988. “Business formation: A network approach.” Scandinavian Journal of man-agement 4 (3): 83–99.
Karlan, Dean, and Martin Valdivia. 2011. “Teaching Entrepreneurship: Impact of Business Train-ing on Microfinance Clients and Institutions.” review of Economics and Statistics 93 (2): 510–27.
Kelley, Donna J. Abdul Ali, Edward J. Rogoff, Candida Brush, Andrew Corbett, Mahdi Majbouri, and Diana Hechevarria. 2011. Global Entrepreneurship monitor. New York: Baruch College.
Klasen, Stephan, and Janneke Pieters. 2015. “What Explains the Stagnation of Female Labor Force Participation in Urban India?” World Bank Economic review 29 (3): 449–78.
LaFortune, Jeanne, Marcela Perticará, and José Tessada. 2013. “Are (Random) Friends Good for Business? Peer Effects in Training and Entrepreneurship Courses.” http://www.inesad.edu.bo/bcde2013/papers/BCDE2013-70.pdf.
Lerner, Josh, and Ulrike Malmendier. 2013. “With a Little Help from My (Random) Friends: Suc-cess and Failure in Post-Business School Entrepreneurship.” review of Financial Studies 26 (10): 2411–52.
Lin, Xu. 2010. “Identifying Peer Effects in Student Academic Achievement by Spatial Autoregressive Models with Group Unobservables.” Journal of Labor Economics 28 (4): 825–60.
McKenzie, David, and Christopher Woodruff. 2014. “What Are We Learning from Business Training and Entrepreneurship Evaluations around the Developing World?” World Bank research observer 29 (1): 48–82.
Rao, Gautam. 2014. “Familiarity Does Not Breed Contempt: Diversity, Discrimination and Gen-erosity in Delhi Schools.” https://www.economics.utoronto.ca/index.php/index/research/downloadSeminarPaper/44410.
Shue, Kelly. 2013. “Executive Networks and Firm Policies: Evidence from the Random Assignment of MBA Peers.” review of Financial Studies 26 (6): 1401–42.
Singh, Robert P., Gerald E. Hills, G. T. Lumpkin, and Ralph C. Hybels. 1999. “The Entrepreneurial Opportunity Recognition Process: Examining the Role of Self-Perceived Alertness and Social Net-works.” Academy of management Annual meeting Proceedings 1999 (1): G1–6.
Smeltzer, Larry R., Barry L. Van Hook, and Roger W. Hutt. 1991. “Analysis of the Use of Advisors as Information Sources in Venture Startups.” Journal of Small Business management 29 (3): 10–20.
World Bank. 2011. World Development report 2012: Gender Equality and Development. Washington, DC: World Bank Publications.