Embed Size (px)
Citation preview
Friends, Family, and the Flat World:
The Geography of Crowdfunding∗
Ajay Agrawal, Christian Catalini, Avi GoldfarbUniversity of Toronto
June 6, 2011
Abstract
The internet facilitates instant and inexpensive communication across large distances. Perhapsthe most striking feature of online “crowdfunding” is the broad geographic dispersion of investorsin small, early-stage projects. This contrasts with existing theories that predict entrepreneursand investors will be co-located due to distance-sensitive costs. We examine a crowdfundingsetting that connects artist-entrepreneurs with investors over the internet for financing musicalprojects. The average distance between artists and investors is about 5,000 km, suggesting areduced role for spatial proximity. Still, distance does play a role. Within a single round offinancing, local investors invest relatively early, and they appear less responsive to decisions byother investors. We show this geography effect is driven by investors who likely have a personalconnection with the artist-entrepreneur (“family and friends”). Although the online platformseems to eliminate most distance-related economic frictions such as monitoring progress, pro-viding input, and gathering information, it does not eliminate social-related frictions.
JEL Classifications: R12, Z11, L17, G21, G24Keywords: Entrepreneurial finance, crowdfunding, internet, family and friends, local bias, so-cial networks.
∗We thank Pierre Azoulay, Iain Cockburn, Gary Dushnitsky, Richard Florida, Jeff Furman, Ig Horstmann, NicolaLacetera, Karim Lakhani, Matt Marx, Ed Roberts, Tim Simcoe, Scott Stern, Will Strange, Catherine Tucker, Pai-LingYin, and seminar participants at MIT, the Roundtable on Engineering and Entrepreneurship Research at GeorgiaTech, Boston University, the Martin Prosperity Institute, the MIT Open Innovation Conference, NYU, Wharton,and the University of Toronto for comments. We thank Liz Lyons who provided excellent research assistance.We also thank Johan Vosmeijer and Dagmar Heijmans, co-founders of Sellaband, for their industry insights andoverall cooperation with this study. This research was funded by the Martin Prosperity Institute, the NET Institute(www.netinst.org), and the Social Sciences and Humanities Research Council of Canada. Errors remain our own.c©2010 by Ajay Agrawal, Christian Catalini, Avi Goldfarb. All rights reserved. Short sections of text, not to exceed
two paragraphs, may be quoted without explicit permission provided that full credit, including c©notice, is given tothe source.
1 Introduction
The internet facilitates instant and inexpensive communication across large distances. In many
ways, online platforms can help people overcome offline frictions that inhibit market transactions.
In this paper we explore which of these frictions are overcome at an online crowdfunding platform.
Perhaps the most striking characteristic of crowdfunding is the geographic dispersion of investors.
For example, in our data from a crowdfunding website that facilitates investments in early-stage
musicians seeking financing, we find a mean distance between artist-entrepreneur and investor of
approximately 5,000 km.
Although distant investors are common for publicly traded companies, theory predicts that
investors in early stage entrepreneurial ventures will tend to be local. That is because gathering
information, monitoring progress, and providing input are particularly important for investors in
early stage ventures and the costs of these activities are sensitive to distance. Most empirical
evidence to date supports these claims (Tribus 1970, Florida and Kenney 1988, Florida and Smith
1993, Lerner 1995, Sorenson and Stuart 2001, Powell, Koput, Bowie, and Smith-Doerr 2002, Zook
2002, Mason 2007).
Specifically, Sorenson and Stuart (2005) report that the average distance between lead VC and
target firm is approximately 70 miles. Similarly, Sohl (1999) and Wong (2002) report that angel
investors locate close to the entrepreneurs they finance (more than 50% are within half a day of
travel).
The geographic dispersion of investment evident in our data implies that crowdfunding in our
setting largely overcomes the distance-related economic frictions usually associated with financing
entrepreneurial ventures. That is not because the artist-entrepreneurs seeking financing on this site
are not early stage. To the contrary, they are unsigned artists seeking capital to record their first
album. Most are young, have limited reputations as artists or entrepreneurs, and appear to have
minimal resources.
Instead, it appears that the online platform provides an environment purposely designed for
early stage artist-entrepreneurs where they can showcase prototypes of their music, present a busi-
ness plan outlining how they will spend their funds, and directly pitch their project to a community
1
of online investors. In this way, and consistent with prior research in retail and advertising that
examines how the online setting allows people to overcome offline barriers to market transactions
(Choi and Bell 2010, Brynjolfsson, Hu, and Rahman 2009, Goldfarb and Tucker 2010), the platform
can help reduce market frictions associated with geographic distance.
Although the role of geography appears to be greatly diminished in our data when we consider
aggregate investment at the end of the funding process, an important distinction between local and
distant investors comes into sharp relief when we examine investment patterns over time within
a single round of financing. We employ a difference-in-difference-like approach to compare first
the difference between local and distant investors in terms of their propensity to invest in a given
period and then how this difference changes with the publicly visible investment decisions of others.
We find that the timing of distant, but not local, investments is very responsive to the investment
decisions of others.
Why might local investors differ so greatly from distant investors in their responsiveness to the
investment decisions of others? The entrepreneurial finance literature makes frequent reference to
the role of family and friends (F&F) as an important source of capital for early stage ventures.1
Parker (2009) reports that 31% of start-ups’ funds come from family and friends. Researchers have
emphasized family and friends’ informational advantages concerning the quality of the entrepreneur.
For example, Cumming and Johan (2009) assert that “Apart from the founding entrepreneur’s
savings, family and friends [...] are a common source of capital for earliest-stage entrepreneurial
firms. An entrepreneur without a track record typically has an easier time raising this type of
capital because these investors will have known the entrepreneur for a long time. In other words,
information asymmetries faced by [family and friends] are lower than those faced by other sources
of capital.” Given the local nature of social networks (Hampton and Wellman 2002), these family
and friends are disproportionately likely to be local.
We code each investor-artist pair with an indicator variable for “family and friends” (F&F) based
on particular behavioral traits they exhibit on the website (and check robustness using information
1Despite the acknowledged importance of F&F, there are surprisingly few empirical studies focussed on this formof investment, likely owing to a paucity of data. However, as Cumming and Johan (2009) note, “Recent effortsspurred by the Kaufmann Foundation have begun to fill this gap, but there is significant work to be done in gatheringsystematic data.”
2
from 18 artists who specifically identified their friends and family among their investors). We find
that F&F are disproportionately co-located with the artists they invest in, although, importantly,
there are also many local investors who are not F&F and many F&F investors who are distant.
We then apply another “difference” to our empirical analysis, comparing how the effect of other
investors’ investment decisions on the propensity to invest in a given period is mediated by distance
after controlling for F&F. The distance effect disappears.
We interpret this result as implying that the crowdfunding platform eliminates most distance-
related economic frictions normally associated with financing early stage projects, such as acquiring
information (e.g., local reputation, stage presence), monitoring progress, and providing input.2
However, it does not eliminate frictions associated with the type of information about the artist-
entrepreneur that is more likely to be held by personally connected individuals. This interpretation
emphasizing the importance of interpersonal relations in entrepreneurial finance is consistent with
the findings of Nanda and Khanna (2010), who report that cross-border social networks play a
particularly key role when access to capital is especially difficult.
Finally, we examine which types of information personally connected individuals appear to use.
Our results suggest that search costs likely explain much of the difference between F&F investors
and other investors. Specifically, the difference is primarily driven by the first investment made.
We see little difference between the timing of investments made after the first. Of the various types
of information that F&F have (e.g., knowledge of of the artist’s underlying quality, tendency to
persevere, recover from setbacks, succeed in other endeavors), this suggests that simple knowledge
of the artist matters a great deal. Non-F&F investors need to rely on the search engine and
recommendation systems provided by the crowdfunding platform; in contrast, F&F investors do
not face these search costs. Because search can be cumbersome, even online (Lynch and Ariely
2000, Smith and Brynjolfsson 2001, Baye, Morgan, and Scholten 2006), F&F investors behave
differently because they are not guided in the same way by the recommendation engines (Fleder
and Hosanagar 2009).
2In the following section we point out that although “investors” on crowd-funding sites may have philanthropic orother utility-seeking motivations that are not strictly pecuniary, they are still faced with allocating scarce resourcesand, as the literature on philanthropy suggests, are influenced by similar transaction costs.
3
These results lead us to speculate that there may be path dependency in the process of accessing
distant investors online. To the extent that distant investors disproportionately rely on information
revealed in the investment decisions of others, friends and family might play an important role in
making early investments that generate that information. Conti, Thursby, and Rothaermel (2010)
argue that investments by family and friends can signal the entrepreneurial commitment to the
venture. If true in the crowdfunding setting, this would imply a limitation to the “equal access for
all” potential of the internet. Communications technologies enable entrepreneurs from anywhere
to access capital globally, but in reality only those entrepreneurs with a sufficient base of offline
support may be able to do so.
Although crowdfunding is presently small in terms of overall economic activity, it is growing
in both the variety of sectors to which is applied (e.g., music, sports, video games, education,
retail) and the overall value of transactions (Lawton and Marom 2010). Crowdfunding systems
enable users to make investments in various types of projects and ventures, often in small amounts,
outside of a regulated exchange, using online social media platforms that facilitate direct interaction
between investors as well as with the individual(s) raising funds. To our knowledge this is the
first empirical examination of the geography of crowdfunding.In our discussion, we build on several
papers that have documented the importance of herding in crowdfunding settings mostly using data
from Prosper.com, including Zhang and Liu (2010) and Freedman and Jin (2010). Furthermore
Freedman and Jin (2010) and Lin, Prabhala, and Viswanathan (2009) both document the important
role of online social groups in online lending. Broadly, these papers are complementary to our
examination of how herding-like behavior differs by offline social proximity.
2 Empirical Setting
2.1 Sellaband
Sellaband is an Amsterdam-based, online platform that enables unsigned musicians to raise financ-
ing to produce an album. Launched on August 15, 2006, it was one of the first mainstream websites
of its kind and has been referred to as the “granddaddy of crowdfunding” (Kappel 2009). At the
4
time of our data, the Sellaband website worked as follows:3
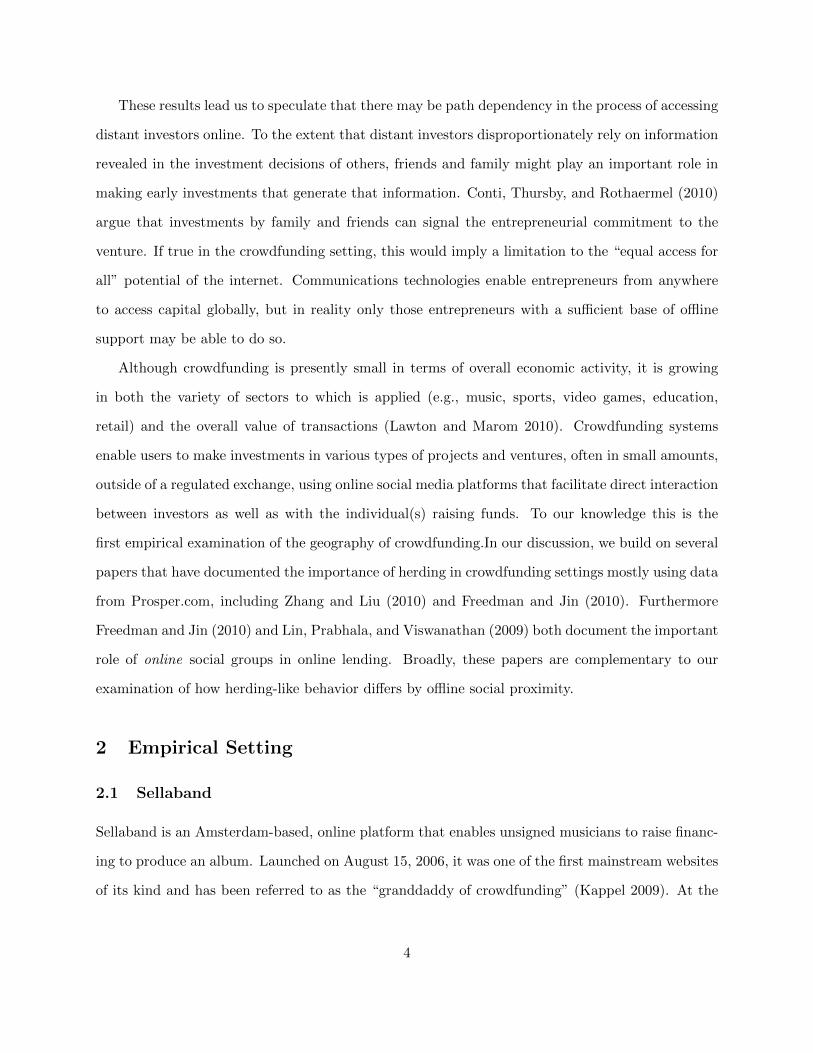
Musical artists set up a profile page on Sellaband, at no charge, where they include a photo,
bio, links, blog postings, and up to three demo songs.4 Investors search the website, learn about
artist-entrepreneurs, listen to their demos and, if they choose, buy one or more shares in an artist’s
future album at $10 per share. Investors see information posted by the artist as well as how much
financing the artist has raised to date. Figure 1 provides a picture of a typical artist profile. Funds
raised are held in escrow and may not be accessed until the artist has sold 5,000 shares (raising
$50,000). Upon raising $50,000, the artist may spend those funds according to a plan they develop
that is approved by Sellaband to record their album. As they incur expenses, they send vendor
invoices to Sellaband for payment. After the album is completed, the revenues from album sales
are split equally three ways between the artist, investors, and Sellaband. Investors also receive a
compact disc (CD). During our period of observation, approximately three years, 34 artists raised
the full $50,000.
The individuals and groups posting their music on Sellaband are typically early-stage artists
who have never signed a contract with a record label, recorded a professional album, or performed
live outside of local pubs or cafes. At this stage of their careers, their income from live shows
and music sales is negligible. In other words, these individuals face many of the same financing
challenges and constraints as entrepreneurs in many other settings. Artists on Sellaband use it
to raise capital to finance the recording of an album. They market themselves, develop a budget,
create a plan for promoting their product, and raise financing. Sellaband therefore provides a
platform for artists to engage in entrepreneurial activities with a community of investors. For these
reasons, we sometimes refer to them as “artist-entrepreneurs”.
Similarly, in describing our results we refer to the people providing funds as “investors”. Of
course, many of these investors may also have philanthropic or other utility seeking motivations.
3The website has changed substantially since September 2009, reducing the focus on early-stage artists, limitingthe ability to receive a monetary return, and allowing more flexibility to artists in the amount they can raise andhow they can use their funds.
4A “demo,” short for “demonstration recording,” is an informal recording made solely for the purpose of pitchinga song rather than for release. It is effectively a prototype of the song that they plan to later record professionally.It is a way for musicians to approximate their ideas and convey them to record labels, producers, or other artists(Passman 2009).
5

Some crowdfunding platforms are explicitly designed with philanthropic intentions. For example,
Kiva, a platform which focuses on lending to entrepreneurs in developing countries, does not allow
lenders to charge interest and thus provides no mechanism for earning a return on their capital.
Galak, Small, and Stephen (2011) document that crowdfunding on Kiva is a hybrid decision, with
both financial and charitable aspects. On Sellaband, a platform designed to accommodate profit-
seeking investment motivations by way of a revenue sharing agreement that is tied to the level
of investment, individuals may also be motivated by non-pecuniary returns such as utility from
being philanthropic to help artists achieve their goals. However, even philanthropically-motivated
individuals must allocate scarce resources. While they may not be focused on a pecuniary return
on investment, they are focused on some type of return on their investment and therefore are
motivated to select wisely amongst many projects competing for their donations. As Stanley Katz
states in his Handbook chapter on philanthropy in the arts (Katz 2006), philanthropic initiatives
are increasingly “demanding short-term, measurable deliverables contracted up-front with grantees,
and holding grantees strictly accountable for what they do and do not do (Porter and Kramer (1999);
Rimel (1999)). At the “venture” end of the new philanthropy, the entrepreneurial techniques of
venture capital are being applied (Letts, Ryan, and Grossman (1997)). Donees are analogized
to start-up firms, donors partner with them, establishing specific and measurable benchmarks,
and continuing their investments only if periodic goals are met” (page 1311). Sellaband artist-
entrepreneurs compete for investors. They pitch their projects and enter into contracts that commit
them to sharing their revenue with investors. In summary, even individuals who commit funds to
projects for non-pecuniary reasons are likely to be sensitive to the types of costs that traditionally
favor financial transactions between co-located individuals. As such, we refer to individuals who
participate in crowdfunding as investors throughout the paper, keeping in mind that they may not
be motivated by purely pecuniary returns on their investment.
2.2 Data
Our data contain every investment made on Sellaband from its launch in August 2006 until Septem-
ber 2009. Over this period, there were 4,712 artist-entrepreneurs on Sellaband who received at least
6
one $10 investment. Of these, 34 raised the $50,000 required to access their capital to finance the
making of their album. The distribution of investments in these artists is highly skewed: these 34
raised 73% of the $2,322,750 invested on the website.
To explore the role of geography in the crowdfunding of early-stage entrepreneurial projects,
we used geographic information disclosed by artist-entrepreneurs and investors on Sellaband. For
artists, location was cross-checked with their official website, MySpace, and Facebook profiles. We
used the Google Maps APIs5 to retrieve latitude and longitude for each location6 and to standardize
city names. We then manually checked locations and in the case of multiple or ambiguous matches
either cleaned further or coded as missing. Finally, we calculated geodesic distances between artists
and investors using a method developed by Thaddeus Vincenty and implemented by Austin Nichols
(Nichols 2003). In our focal sample, we have distance measures for 90% of artist-investor pairs.
The other data we use in our main specifications is the cumulative investment raised by the
artist from all investors as of the previous week. In some specifications, we also use song and video
uploads that artists post on the website and investor proximity to concert locations (and the dates
of those concerts).
We focus our analysis on investments in the 34 artists who raised $50,000, examining the
timing of investment and types of investors. We focus on these 34 for several reasons. First,
they are more comparable with each other in terms of their performance on the site because they
have each successfully gone through the full funding cycle. Second, we eliminate concerns about
right truncation of the data by focusing on artists who complete the funding cycle. Third, we
have geographic location information for the vast majority of the investors in these 34 artists
because investors must give their location in order to receive their CD. Fourth, focusing on these
34 eliminates musicians who use Sellaband sporadically and do not treat the platform as a place
for entrepreneurial activity. Finally, since these 34 artists account for nearly three-quarters of all
funds raised on Sellaband, we argue that little information is lost by focusing on them (and our
robustness checks to other samples confirm this).
5See http://code.google.com/apis/maps/ (accessed 13-04-2010)6According to the data available, we used country, region, city name, and zipcode or country-region-city triads or
country-city pairs.
7

The main sample is therefore constructed by taking the 34 artists who reach $50,000 during
our observation period. Artists enter the sample when they receive their first investment and exit
when they reach the target. The resulting panel is unbalanced. We identify every investor who
invested at least once in one of these 34 artists. Investors enter the sample when they make their
first investment on Sellaband (in any artist) because their profile becomes visible to artists and
other investors at that time. Investors never exit the sample.
Our main ($50K) sample of artist-investor pairs is the Cartesian product of the 34 successful
artists and all investors who invest at least once in one of them. Each pair appears during each
week in which both the artist and the investor are in the sample.7 Because we use artist-investor
pair fixed effects in our regression analysis, pairs with no investments are dropped. There are
18,827 artist-investor pairs with at least one investment from the investor in the artist and 709,471
artist-investor-week observations.
We present descriptive statistics for the $50K sample in Table 1a. Of these successful artists, the
average takes approximately one year (53 weeks) to reach $50,000, although there is considerable
variation around the mean from just under two months to more than two years. The source of
financing is widely distributed; on average artists raise their financing from 609 different investors.
Across the 34 $50K-artists, there are 8,149 unique investors. On average, these investors invest in
2.5 $50K-artists, making 4.3 distinct investments (i.e., they often invest on more than one occasion
in a single artist). They invest a total of $227 across all $50K-artists during the period under study.
In terms of artistic effort, these artists post 4.3 demo songs on their profile during the fundraising
process, above and beyond the songs they post when they first launch their profile.8
In the full sample of artists (Table 1b), the average artist only has 11.4 investors. Overall,
investors spend an average of $226 on Sellaband, spread over 3.5 artists and 5.5 different investment
occasions.
7For example, if Artist 1 receives her first investment in week 10 and reaches $50K in week 20, then she will appearin the sample from weeks 10 through 20. If Investor 2 made his first investment in week 5, then he is paired withArtist 1 for weeks 10 through 20. If Investor 3 made his first investment in Week 18, then he is paired with Artist 1for weeks 18 through 20.
8Many artists launch their profile with three songs - the maximum number the system accommodates. It is likelythat all of these $50K-artists launched their profile with three songs, meaning the average number of songs per artistis 7.3 (3+4.3). We only have data on songs added, not the number of songs posted at the time of launching a newprofile.
8
2.3 Geographic variance on Sellaband
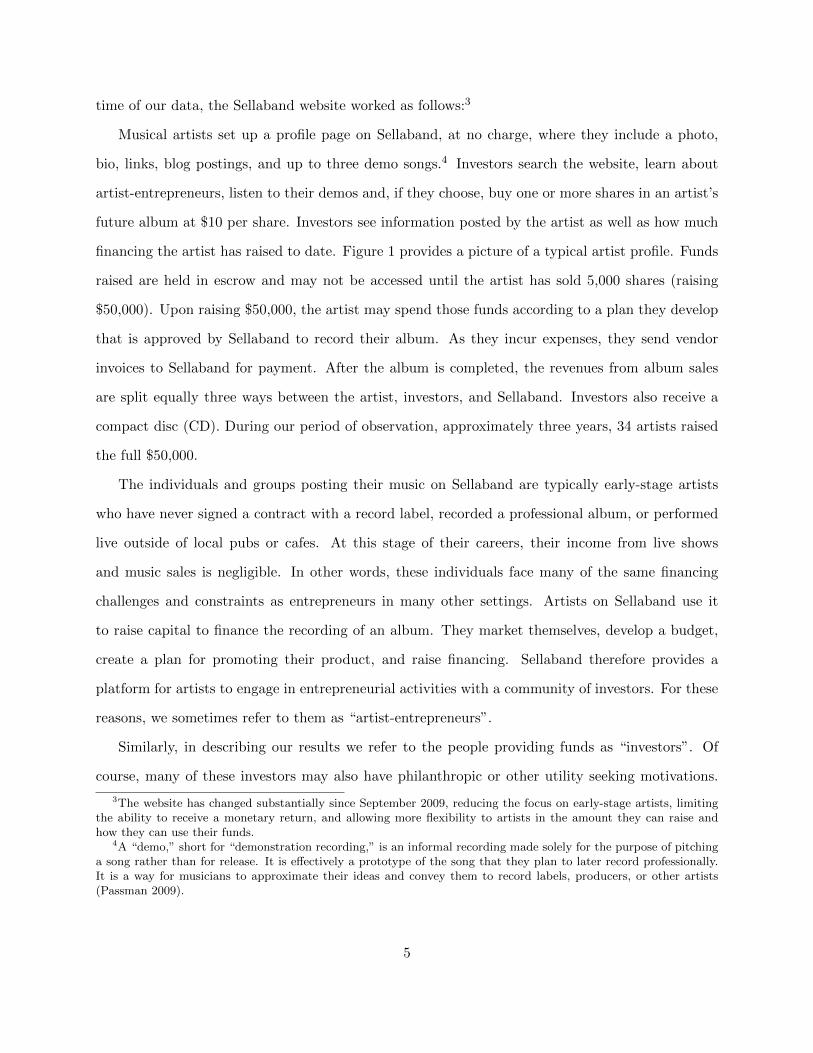
Figure 2a presents the geographic distribution of the 34 artists who raise $50K. They are distributed
over five continents with the majority in Europe and the United States. Figure 2b illustrates the
geographic distribution of investors in these artists. They represent 80 countries and are also
particularly concentrated in Europe and the eastern United States.
Despite this wide geographic variation, investors are disproportionately likely to invest in local
artists. Conditional on making at least one investment in any artist on Sellaband, 2.8% of individ-
uals who are within 100 km of an artist invest.9 In contrast, only 0.8% of investors who are distant
to an artist invest. In this way, investors are disproportionately local. At the same time, there are
many more distant investors and therefore in aggregate they account for the vast majority of total
investments.
3 Empirical Strategy
Our econometric analysis is a straightforward framework at the artist-investor-week level. Investor
i will invest in artist a in week t if the expected value from investment is positive:
vait = βCumulativeInvat−1 + γXait + µai + ψt + εait
where vait is the value of investing in artist a at time t by investor i. The value from investment
includes both the monetary expected return of investment as well as any consumption utility derived
from investing in that artist. β is the perceived marginal value of cumulative investment as of the
previous week. For example, a higher cumulative investment may indicate that more investors
perceive the artist to be of high quality and therefore a better investment. Alternatively, investors
may derive more consumption utility from investing in artists who are closer to the $50K threshold.
In our main specification, CumulativeInvat−1 is included as a vector of dummy variables defined
by the $10000 cumulative investment thresholds. In addition, γ is the perceived marginal value
9In order to simplify the analysis, we group all artist-investor pairs within 100 km as “local” and all others as“distant.”Our results are robust to other thresholds.
9

of the controls (Xait) including a control for time since the artist began on Sellaband, µai is an
artist-investor fixed effect to control for overall tastes of the investor, ψt is a week fixed effect to
control for changes in the Sellaband environment over time, and εait is an idiosyncratic error term.
Because vait is a latent variable, we instead examine the decision to invest. Therefore, to
understand the value to the investor in investing in artist a at time t we use the following discrete
choice specification:
1(Investait) = βCumulativeInvat−1 + γXait + µai + ψt + εait
Consistent with the suggestions of Angrist and Pischke (2009), we estimate this using a linear
probability model although we show robustness to alternative specifications. Likely because our
covariates are binary, the vast majority of the predicted probabilities of our estimates lie between
zero and one. Therefore the potential bias of the linear probability model is reduced in our esti-
mation (Horrace and Oaxaca 2006). The fixed effects mean that our analysis examines the timing
of investment for artist-investor pairs where we observe at least one investment. The fixed effects
completely capture the artist-investor pairs in which we never see investment, and these pairs can
therefore be removed from the analysis without any empirical consequences. Standard errors are
clustered at the artist-investor pair level. Cumulative investment is measured at the artist-week
level. Because the average artist in our main sample has over 600 investors, the cumulative invest-
ment number is not driven by any individual investor.10
In order to understand the role of distance, we separately estimate local and distant artist-
investor pairs.11
1(Investait) = βlCumulativeInvat−1 + γX lait + µlai + ψl
t + εlait if local
1(Investait) = βdCumulativeInvat−1 + γXdait + µdai + ψd
t + εdait if distant
10We address the potential for bias due to the use of fixed effects when several investors invest just once by showingrobustness to random effects and to limiting the sample to investors who invest in the artist at least twice.
11We estimate separately for clarity of presentation. All results are robust to using interaction terms in simultaneousestimation of local and distance.
10

Furthermore, in order to understand the role of F&F, we interact F&F with cumulative investment
in each of these separately estimated local and distant equations.
1(Investait) = βlCumulativeInvat−1+θlF&Fai×CumulativeInvat−1+γX
lait+µ
lai+ψ
lt+ε
lait if local
1(Investait) = βdCumulativeInvat−1+θdF&Fai×CumulativeInvat−1+γX
dait+µ
dai+ψ
dt +εdait if distant
The main effect of F&F will drop out due to collinearity with the artist-investor fixed effects. With
this empirical approach we examine when an investor chooses to invest in a particular artist, con-
ditional on at least one investment by that investor in that artist. Investors often invest more than
once in the same artist during a single $50,000 round of fundraising. We assume that the timing of
investment is driven by the change in cumulative investment rather than by another change that is
specific to the artist-investor pair. We also assume that the artist-investor and week fixed effects as
well as other covariates control for omitted variables. Our main results hold as long as there is not
an omitted variable that drives lagged cumulative investment, an increase in the value of distant
investing, and a simultaneous decrease in the value of local investing. One plausible variable that
might fit such a description is concert touring. As an artist gains visibility, they may be more able
to tour to more distant locations. We therefore control for investor proximity to live performances
by the artists.
4 Results
We build our results in three steps. First, we document that investors’ propensity to invest in a
given week increases as the artist visibly accumulates capital on the site. Second, we show that local
investors do not follow this pattern. Instead they are most likely to invest early in the cycle, before
an artist has raised $10,000. Finally, we show that this difference between local and distant investors
11

is entirely explained by the group of investors we label Friends and Family (F&F). We focus on
one specification in the paper but document robustness to numerous alternative specifications in
the appendix.12
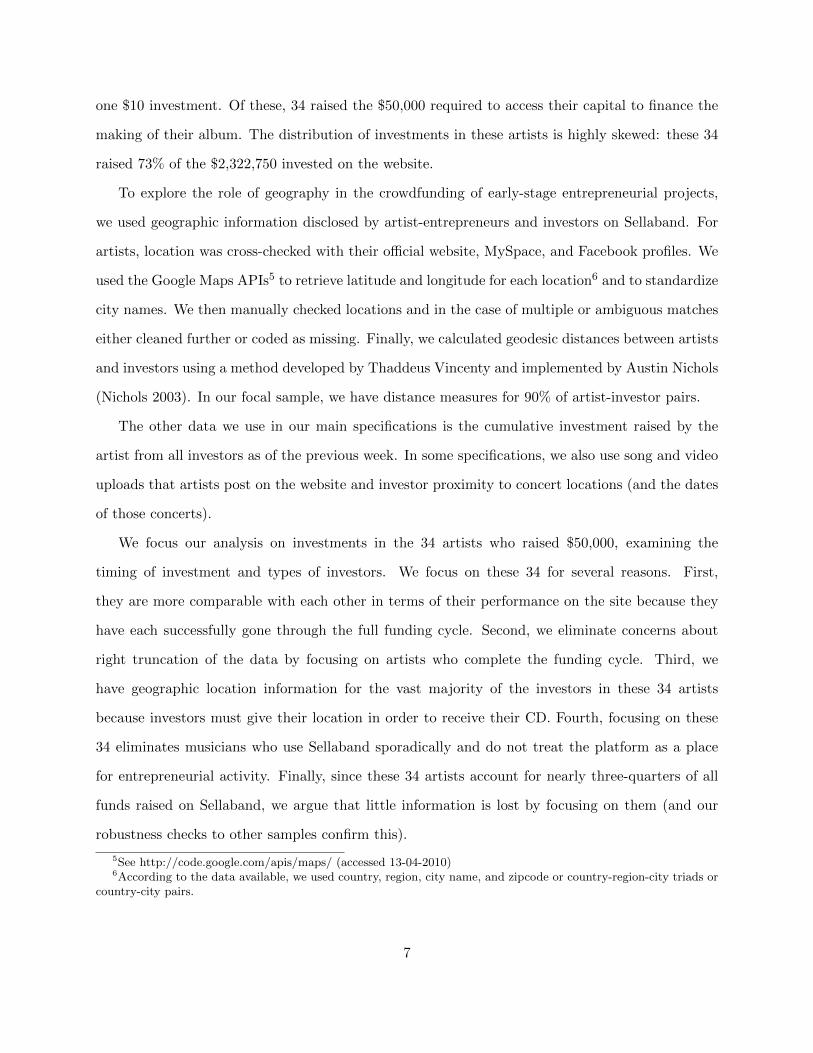
Investment propensity increases with funds raised. In Table 3 column 1 we show that investment
propensity increases as a ($50K) artist accumulates investment. As discussed earlier, the use of
the $50K sample ensures this is not a simple selection story where only the better artists appear
in the sample with higher cumulative investment. Relative to an artist with less than $10,000 in
investment, a given investor is 2.1 percentage points more likely to invest in a given week if the
artist has $10,000-$20,000 and 8.4 percentage points more likely to invest if they have more than
$40,000. These increases are large relative to a weekly base rate of 4.1% during the first $10,000.
We illustrate the estimates of the increase in propensity to invest in a given week over different
capital levels in Figure 3a. Because we use a linear probability model, this means we can simply
plot the coefficient values.
This acceleration of investment as an artist gets closer to $50,000 is consistent with Zhang and
Liu (2010) who document a similar pattern on Prosper.com. Like Zhang and Liu (2010), we argue
that this is suggestive evidence of path dependency: past investment may increase the propensity
to invest. It is only suggestive because, in the absence of a truly exogenous shock to investment,
we cannot reject the possibility that some other activity may cause the acceleration in investment.
Nevertheless, to the extent that the fixed effects and the covariates control such activities, the
underlying pattern in the data, combined with the prominent placement of cumulative investment
information on the website, suggest that high levels of cumulative investment may cause an increase
in the rate at which new investment arrives.
Local and distant investors are different. In columns 2 and 3 we stratify the data between local
and distant investors. Local investors are more likely to invest over the first $20,000 than later. In
contrast, the results for distant investors resemble the results shown in column 1. In Figure 3b we
provide a graphical representation of the propensity to invest at different stages in the investment
cycle. Local and distant investors clearly display distinct patterns; distant investors’ propensity to
12In the appendix, we show that our results are robust to alternative samples, covariates, and functional forms.
12

invest rises as the artist accumulates capital, whereas local investors’ propensity does not.
In the appendix, we show that this general relationship is broadly robust to many other spec-
ifications. The only notable difference in several of the robustness checks is a flatter relationship
between investment propensity and cumulative investment for local investors. Still, the key dis-
tinction for our purposes is that distant investors significantly increase their propensity to invest
as the artist accumulates capital whereas local investors do not.
Friends and Family. Next, we show that a particular type of investor, whom we label as
“Friends and Family” (F&F) of a particular artist, explains the observed difference between local
and distant investors. These individuals likely joined this market-making platform to fund that
particular artist. We define F&F by the following three characteristics:
1. The F&F investor invested in the focal artist before investing in any other (i.e. the investor
is likely to have joined the system for the focal artist)
2. The F&F investor’s investment in the focal artist is their largest investment
3. The investor invests in no more than three other artists (i.e. the focal artist remains a key
reason for being on the site)
To examine the validity of our measure, we examine whether these investors exhibit behavior
that suggests that they are a distinct group. We find that they use the website much less intensively
than other investors for communication with artists, suggesting that they have other channels of
communication. In addition, they invest disproportionately early in the funding cycle: 34% of the
first $500 comes from this group while only 22% of all funding comes from this group. Finally, they
are disproportionately local.
We also surveyed information from 18 successful artists on Sellaband on the investors they
knew independently of Sellaband. Specifically, we sent each their list of investors and asked them
to identify all family members and friends that they knew prior to joining Sellaband. Our measure
captured 76% of the investors that these 18 artists identified, as well as a number of investors that
the artists did not know personally.
In columns 4 and 5 of table 3, we run our main specification on local and distant investors,
13

but include an interaction of capital levels with an indicator for F&F. The results show that local
and distant investors are qualitatively similar, conditional on F&F. Particularly, for both local and
distant investors, F&F tend to invest early in the funding cycle and non-F&F tend to invest later.
We illustrate this result in Figure 3c which shows that non-F&F investors, both local and distant,
increase their propensity to invest as the artist accumulates capital whereas F&F investors do not.
A potential concern with our interpretation of these results is that our definition only proxies
for Friends and Family. It is likely that we include many investors who are not really F&F, and
that we exclude some investors that are F&F. In order to address this concern, In table 4, we show
that the qualitative results are robust to the subsample of 18 artists who identified their Friends
and Family to us.
In summary, our results suggest that there is little systematic difference between local and
distant investors, except to the extent that social networks (as measured by F&F) are dispropor-
tionately local.
4.1 What do F&F investors know?
Next, we provide some suggestive evidence on the type of asymmetry between F&F and other
investors. Specifically, we examine whether the asymmetry is primarily about the first investment
or about subsequent investments as well. If it is about the first investment, it suggests that the key
asymmetry is an information asymmetry, perhaps related to the search costs for non-F&F investors
to identify artists that they do not know outside of sellaband. In contrast, if the difference between
F&F investing and non-F&F investing persists after the first investment it suggests a role for more
than information on search attributes, such as offline monitoring.
In table 5, we drop all first investments (and consequently all investors who invest on only one
occasion). It shows no difference between F&F and other investors, or between local and distant
investors. After the first investment, all investors become increasingly likely to invest again as the
artist approaches $50K. This suggests that, conditional on identifying an artist and deciding that
they are worth investing it, the key difference between F&F and non-F&F investment patterns goes
14

away.
5 Conclusion
We examine the role of distance in an online platform for financing early stage artist-artists. We find
that investment patterns over time are independent of geographic distance between artist and in-
vestor after controlling for the artist’s offline social network. This result contrasts with the existing
literature that emphasizes the importance of spatial proximity in entrepreneurial finance. Instead,
our result suggests that online mechanisms can reduce economic frictions associated with invest-
ing in early-stage projects over long distances. Only the spatial correlation of pre-existing social
networks is not resolved, and the online mechanisms do not yet eliminate frictions related to infor-
mation that is easily conveyed through a social network, particularly those related to information on
search attributes. This is consistent with prior research on online activity that shows many, but not
all, distance-related frictions are reduced in the online setting (Blum and Goldfarb 2006, Hortacsu,
Martinez-Jerez, and Douglas 2009).
Furthermore, our result emphasizes the important role that friends and family may play online
and offline in generating early investment in entrepreneurial ventures. Consistent with Conti,
Thursby, and Rothaermel (2010), we speculate that this early investment may serve as a signal of
entrepreneurial commitment. Later investors may use this signal thereby increasing the likelihood
of further funding by way of access to distant sources of capital.
Finally, we comment on the implications of crowdfunding in our particular industry setting,
recorded music. Over the past two decades, this industry has experienced significant changes. In-
dustry revenues have declined by approximately 50% over 10 years, which many industry experts
attribute to piracy through online file sharing (Passman 2009). At the same time, costs associated
with the production and distribution of music have also dropped substantially due to the devel-
opment of inexpensive production software and the digital distribution of music over the internet.
However, production costs are not zero and recording artists are commonly cash constrained. In
the vertically integrated industry set-up, large record companies provided both financing and a
full suite of services (e.g., producer, studio, cover design, distribution, auxiliary musicians) in ex-
15

change for ownership of or equity in the artists’ intellectual property. As the major labels decline
in importance, artists have fewer options to relieve cash constraints by borrowing against, or selling
equity in, their intellectual property. Crowdfunding helps overcome that constraint by creating a
market for the most salient asset available to aspiring new artists – their ideas, vision, and future
intellectual property – thereby facilitating financing from distant strangers. Thus, crowdfunding
may help reduce an important market failure.
16
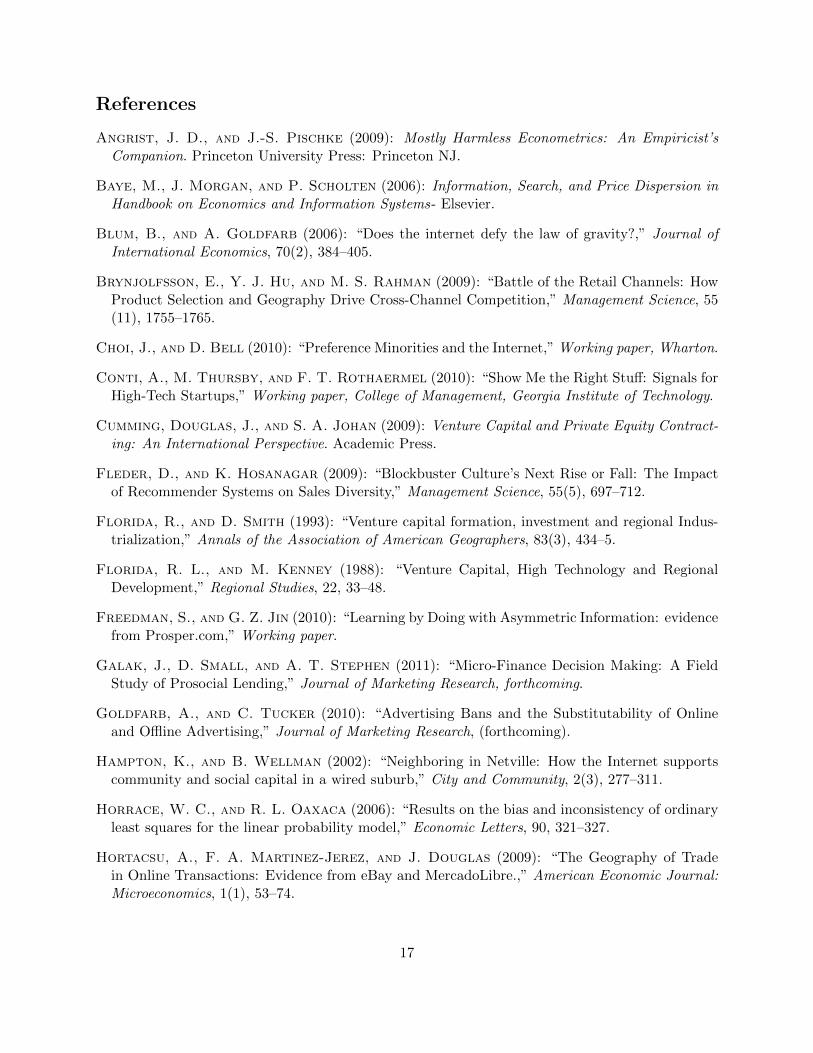
References
Angrist, J. D., and J.-S. Pischke (2009): Mostly Harmless Econometrics: An Empiricist’sCompanion. Princeton University Press: Princeton NJ.
Baye, M., J. Morgan, and P. Scholten (2006): Information, Search, and Price Dispersion inHandbook on Economics and Information Systems- Elsevier.
Blum, B., and A. Goldfarb (2006): “Does the internet defy the law of gravity?,” Journal ofInternational Economics, 70(2), 384–405.
Brynjolfsson, E., Y. J. Hu, and M. S. Rahman (2009): “Battle of the Retail Channels: HowProduct Selection and Geography Drive Cross-Channel Competition,” Management Science, 55(11), 1755–1765.
Choi, J., and D. Bell (2010): “Preference Minorities and the Internet,” Working paper, Wharton.
Conti, A., M. Thursby, and F. T. Rothaermel (2010): “Show Me the Right Stuff: Signals forHigh-Tech Startups,” Working paper, College of Management, Georgia Institute of Technology.
Cumming, Douglas, J., and S. A. Johan (2009): Venture Capital and Private Equity Contract-ing: An International Perspective. Academic Press.
Fleder, D., and K. Hosanagar (2009): “Blockbuster Culture’s Next Rise or Fall: The Impactof Recommender Systems on Sales Diversity,” Management Science, 55(5), 697–712.
Florida, R., and D. Smith (1993): “Venture capital formation, investment and regional Indus-trialization,” Annals of the Association of American Geographers, 83(3), 434–5.
Florida, R. L., and M. Kenney (1988): “Venture Capital, High Technology and RegionalDevelopment,” Regional Studies, 22, 33–48.
Freedman, S., and G. Z. Jin (2010): “Learning by Doing with Asymmetric Information: evidencefrom Prosper.com,” Working paper.
Galak, J., D. Small, and A. T. Stephen (2011): “Micro-Finance Decision Making: A FieldStudy of Prosocial Lending,” Journal of Marketing Research, forthcoming.
Goldfarb, A., and C. Tucker (2010): “Advertising Bans and the Substitutability of Onlineand Offline Advertising,” Journal of Marketing Research, (forthcoming).
Hampton, K., and B. Wellman (2002): “Neighboring in Netville: How the Internet supportscommunity and social capital in a wired suburb,” City and Community, 2(3), 277–311.
Horrace, W. C., and R. L. Oaxaca (2006): “Results on the bias and inconsistency of ordinaryleast squares for the linear probability model,” Economic Letters, 90, 321–327.
Hortacsu, A., F. A. Martinez-Jerez, and J. Douglas (2009): “The Geography of Tradein Online Transactions: Evidence from eBay and MercadoLibre.,” American Economic Journal:Microeconomics, 1(1), 53–74.
17

Kappel, T. (2009): “Ex ante crowdfunding and the recording industry: a model for the U.S.?,”LLAE Law Review, 29, 375–385.
Katz, S. N. (2006): Handbook of The Economics of Art and Culture -chap. Philanthropy, pp.1300–1321, no. 37. North-Holland.
Lawton, K., and D. Marom (2010): The Crowdfunding Revolution. Social Networking MeetsVenture Financing. Amazon Digital Services.
Lerner, J. (1995): “Venture Capitalists and the Oversight of Private Firms,” Journal of Finance,50, 310–318.
Lin, M., N. Prabhala, and S. Viswanathan (2009): “Judging Borrowers by the company theykeep: social networks and adverse selection in online Peer-to-Peer lending,” Working paper.
Lynch, J. G., and D. Ariely (2000): “Wine online: Search cost affect competition on price,quality, and distribution,” Marketing Science, 19(1), 83–103.
Mason, C. (2007): “Venture capital: a geographical perspective,” in H Landstrom (ed) Handbookof Research on Venture Capital, Edward Elgar, Cheltenham, pp. 86–112.
Nanda, R., and T. Khanna (2010): “Diasporas and Domestic Entrepreneurs: Evidence from theIndian Software Industry,” Journal of Economics and Management Strategy, (forthcoming).
Nichols, A. (2003): “Vincenty: Stata module to calculate distances on the Earth’s surface,”Statistical Software Components.
Parker, S. C. (2009): The Economics of Entrepreneurship. Cambridge University Press.
Passman, D. (2009): All you need to know about the music business. Free Press, New York.
Powell, W. W., K. W. Koput, J. I. Bowie, and L. Smith-Doerr (2002): “The SpatialClustering of Science and Capital: Accounting for Biotech Firm-Venture Capital Relationships,”Regional Studies, 36(3), 291–305.
Smith, M., and E. Brynjolfsson (2001): “Consumer Decision-making at an Internet Shopbot:Brand Still Matters,” Journal of Industrial Economics, 49(4), 541–558.
Sohl, J. E. (1999): “The early-stage equity market in the USA,” Venture Capital: An InternationalJournal of Entrepreneurial Finance, 1, 101–120.
Sorenson, O., and T. E. Stuart (2001): “Syndication Networks and the Spatial Distributionof Venture Capital Investments,” American Journal of Sociology, 106(6), 1546–1588.
(2005): “The Evolution of venture capital investment networks,” Working paper.
Tribus, M. (1970): “Panel on government and new business proceedings,” Venture Capital andManagement, Management Seminar, Boston College, Boston, MA, May 28.
Wong, A. (2002): “Angel Finance: The Other venture capital,” University of Chicago GraduateSchool of Business Working Paper.
18

Zhang, J., and P. Liu (2010): “Observational Learning in Microloan Markets: Evidence fromProsper.com.,” Working paper, MIT.
Zook, M. A. (2002): “Grounded capital: venture financing and the geography of the Internetindustry, 1994–2000,” Journal of Economic Geography, 2(2), 151–177.
19
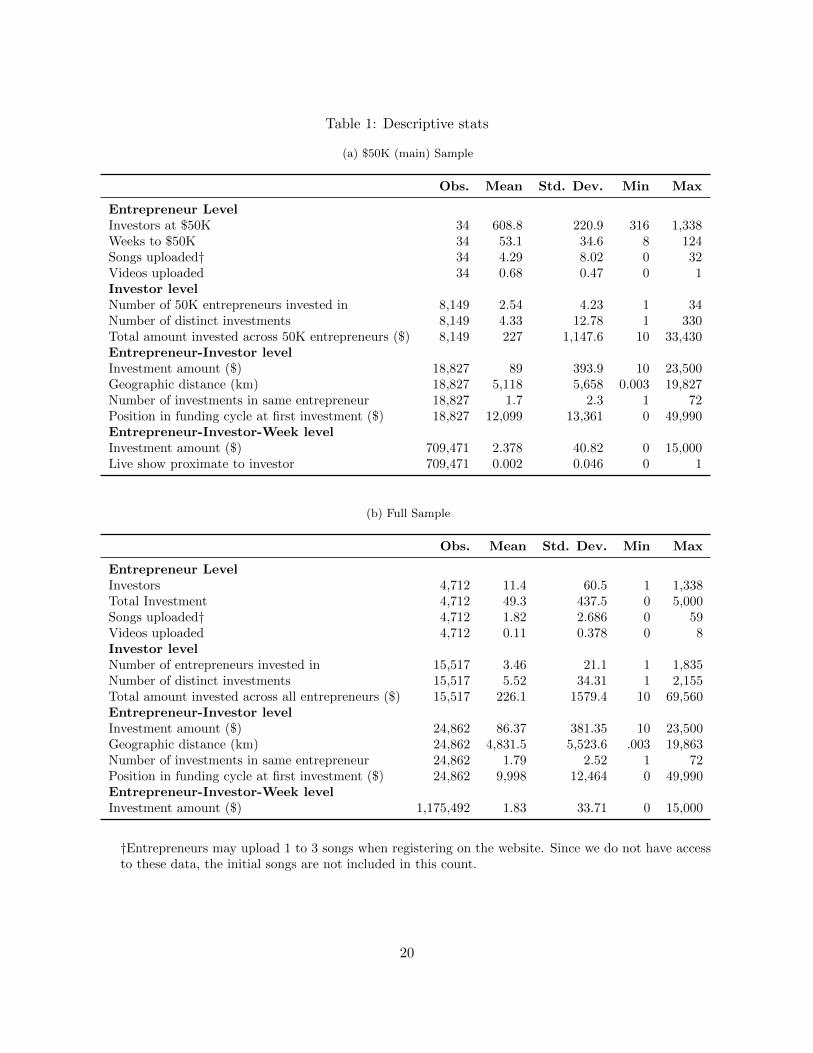
Table 1: Descriptive stats
(a) $50K (main) Sample
Obs. Mean Std. Dev. Min Max
Entrepreneur LevelInvestors at $50K 34 608.8 220.9 316 1,338Weeks to $50K 34 53.1 34.6 8 124Songs uploaded† 34 4.29 8.02 0 32Videos uploaded 34 0.68 0.47 0 1Investor levelNumber of 50K entrepreneurs invested in 8,149 2.54 4.23 1 34Number of distinct investments 8,149 4.33 12.78 1 330Total amount invested across 50K entrepreneurs ($) 8,149 227 1,147.6 10 33,430Entrepreneur-Investor levelInvestment amount ($) 18,827 89 393.9 10 23,500Geographic distance (km) 18,827 5,118 5,658 0.003 19,827Number of investments in same entrepreneur 18,827 1.7 2.3 1 72Position in funding cycle at first investment ($) 18,827 12,099 13,361 0 49,990Entrepreneur-Investor-Week levelInvestment amount ($) 709,471 2.378 40.82 0 15,000Live show proximate to investor 709,471 0.002 0.046 0 1
(b) Full Sample
Obs. Mean Std. Dev. Min Max
Entrepreneur LevelInvestors 4,712 11.4 60.5 1 1,338Total Investment 4,712 49.3 437.5 0 5,000Songs uploaded† 4,712 1.82 2.686 0 59Videos uploaded 4,712 0.11 0.378 0 8Investor levelNumber of entrepreneurs invested in 15,517 3.46 21.1 1 1,835Number of distinct investments 15,517 5.52 34.31 1 2,155Total amount invested across all entrepreneurs ($) 15,517 226.1 1579.4 10 69,560Entrepreneur-Investor levelInvestment amount ($) 24,862 86.37 381.35 10 23,500Geographic distance (km) 24,862 4,831.5 5,523.6 .003 19,863Number of investments in same entrepreneur 24,862 1.79 2.52 1 72Position in funding cycle at first investment ($) 24,862 9,998 12,464 0 49,990Entrepreneur-Investor-Week levelInvestment amount ($) 1,175,492 1.83 33.71 0 15,000
†Entrepreneurs may upload 1 to 3 songs when registering on the website. Since we do not have accessto these data, the initial songs are not included in this count.
20
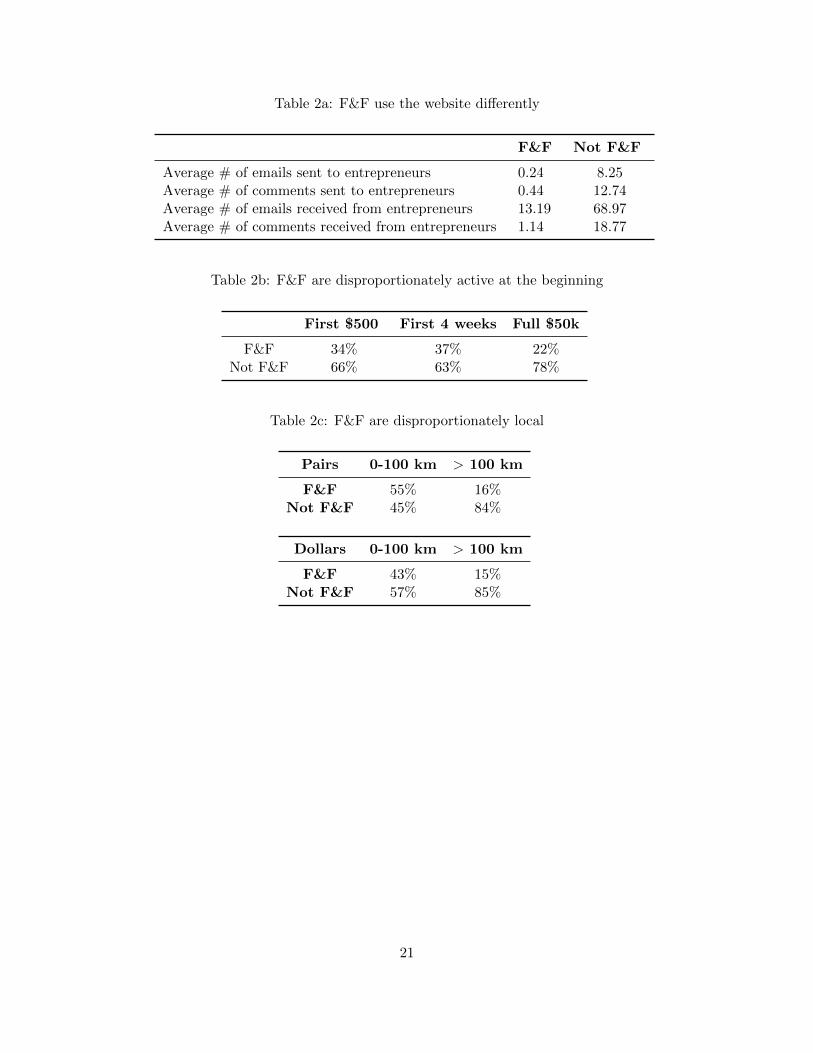
Table 2a: F&F use the website differently
F&F Not F&F
Average # of emails sent to entrepreneurs 0.24 8.25Average # of comments sent to entrepreneurs 0.44 12.74Average # of emails received from entrepreneurs 13.19 68.97Average # of comments received from entrepreneurs 1.14 18.77
Table 2b: F&F are disproportionately active at the beginning
First $500 First 4 weeks Full $50k
F&F 34% 37% 22%Not F&F 66% 63% 78%
Table 2c: F&F are disproportionately local
Pairs 0-100 km > 100 km
F&F 55% 16%Not F&F 45% 84%
Dollars 0-100 km > 100 km
F&F 43% 15%Not F&F 57% 85%
21
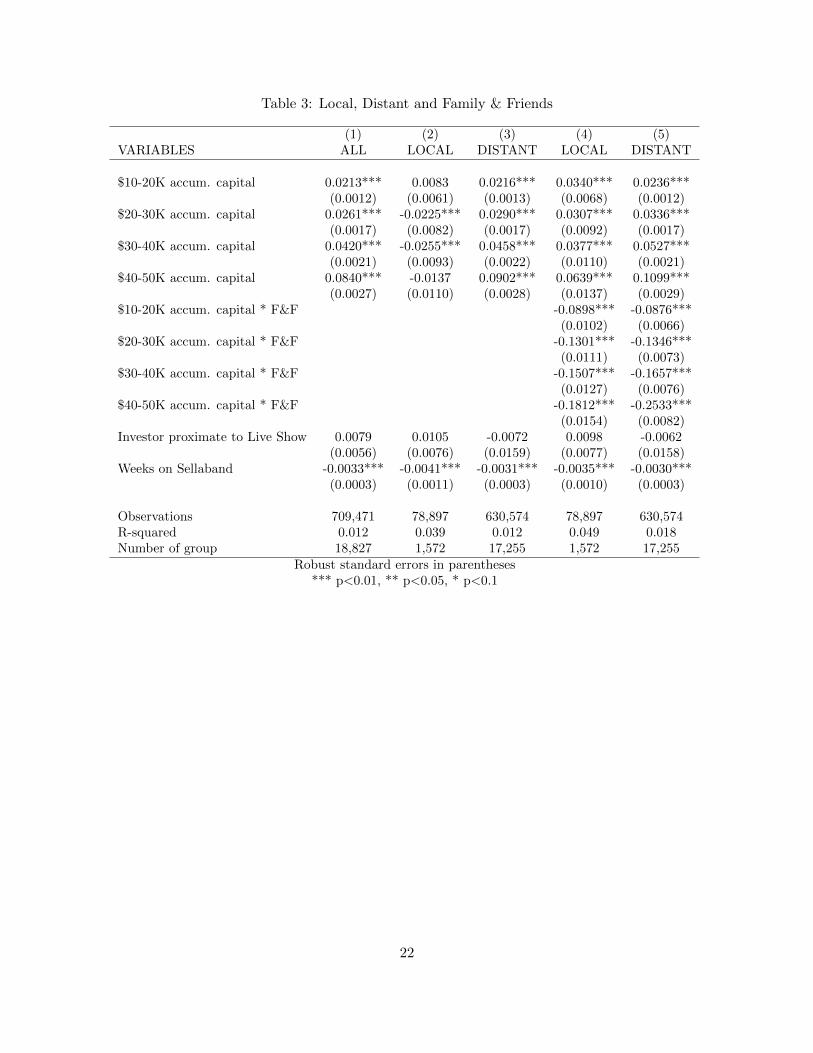
Table 3: Local, Distant and Family & Friends
(1) (2) (3) (4) (5)VARIABLES ALL LOCAL DISTANT LOCAL DISTANT
$10-20K accum. capital 0.0213*** 0.0083 0.0216*** 0.0340*** 0.0236***(0.0012) (0.0061) (0.0013) (0.0068) (0.0012)
$20-30K accum. capital 0.0261*** -0.0225*** 0.0290*** 0.0307*** 0.0336***(0.0017) (0.0082) (0.0017) (0.0092) (0.0017)
$30-40K accum. capital 0.0420*** -0.0255*** 0.0458*** 0.0377*** 0.0527***(0.0021) (0.0093) (0.0022) (0.0110) (0.0021)
$40-50K accum. capital 0.0840*** -0.0137 0.0902*** 0.0639*** 0.1099***(0.0027) (0.0110) (0.0028) (0.0137) (0.0029)
$10-20K accum. capital * F&F -0.0898*** -0.0876***(0.0102) (0.0066)
$20-30K accum. capital * F&F -0.1301*** -0.1346***(0.0111) (0.0073)
$30-40K accum. capital * F&F -0.1507*** -0.1657***(0.0127) (0.0076)
$40-50K accum. capital * F&F -0.1812*** -0.2533***(0.0154) (0.0082)
Investor proximate to Live Show 0.0079 0.0105 -0.0072 0.0098 -0.0062(0.0056) (0.0076) (0.0159) (0.0077) (0.0158)
Weeks on Sellaband -0.0033*** -0.0041*** -0.0031*** -0.0035*** -0.0030***(0.0003) (0.0011) (0.0003) (0.0010) (0.0003)
Observations 709,471 78,897 630,574 78,897 630,574R-squared 0.012 0.039 0.012 0.049 0.018Number of group 18,827 1,572 17,255 1,572 17,255
Robust standard errors in parentheses*** p<0.01, ** p<0.05, * p<0.1
22
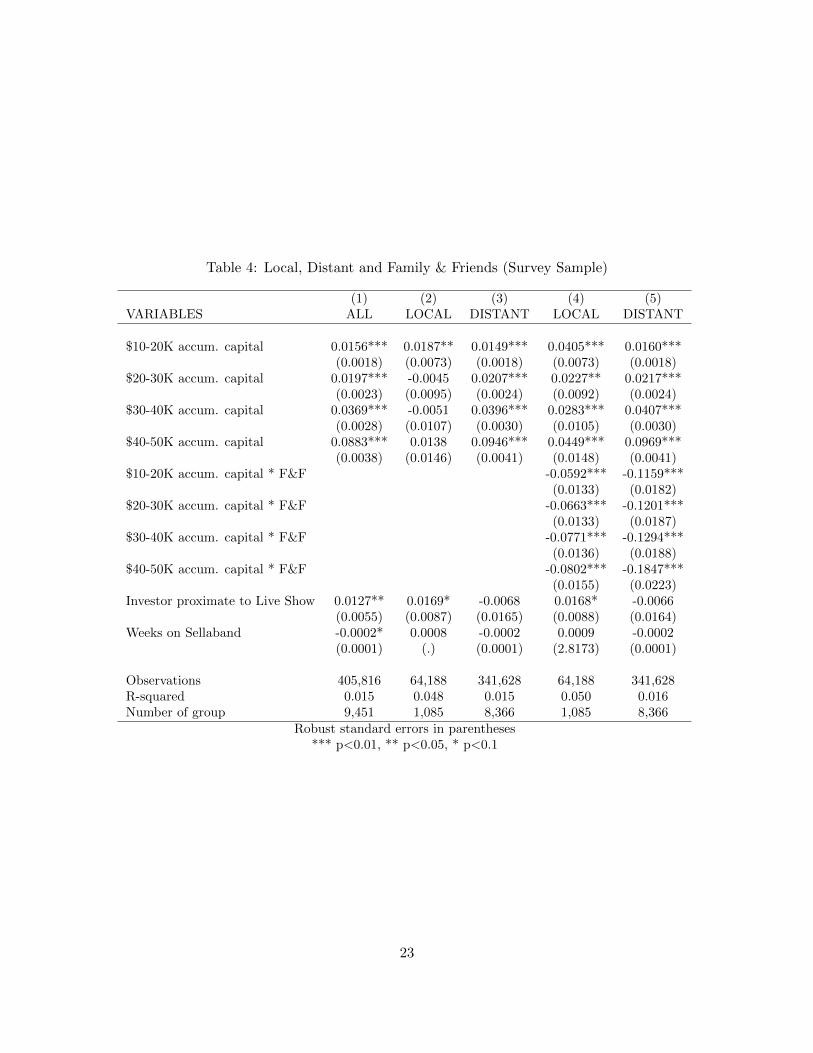
Table 4: Local, Distant and Family & Friends (Survey Sample)
(1) (2) (3) (4) (5)VARIABLES ALL LOCAL DISTANT LOCAL DISTANT
$10-20K accum. capital 0.0156*** 0.0187** 0.0149*** 0.0405*** 0.0160***(0.0018) (0.0073) (0.0018) (0.0073) (0.0018)
$20-30K accum. capital 0.0197*** -0.0045 0.0207*** 0.0227** 0.0217***(0.0023) (0.0095) (0.0024) (0.0092) (0.0024)
$30-40K accum. capital 0.0369*** -0.0051 0.0396*** 0.0283*** 0.0407***(0.0028) (0.0107) (0.0030) (0.0105) (0.0030)
$40-50K accum. capital 0.0883*** 0.0138 0.0946*** 0.0449*** 0.0969***(0.0038) (0.0146) (0.0041) (0.0148) (0.0041)
$10-20K accum. capital * F&F -0.0592*** -0.1159***(0.0133) (0.0182)
$20-30K accum. capital * F&F -0.0663*** -0.1201***(0.0133) (0.0187)
$30-40K accum. capital * F&F -0.0771*** -0.1294***(0.0136) (0.0188)
$40-50K accum. capital * F&F -0.0802*** -0.1847***(0.0155) (0.0223)
Investor proximate to Live Show 0.0127** 0.0169* -0.0068 0.0168* -0.0066(0.0055) (0.0087) (0.0165) (0.0088) (0.0164)
Weeks on Sellaband -0.0002* 0.0008 -0.0002 0.0009 -0.0002(0.0001) (.) (0.0001) (2.8173) (0.0001)
Observations 405,816 64,188 341,628 64,188 341,628R-squared 0.015 0.048 0.015 0.050 0.016Number of group 9,451 1,085 8,366 1,085 8,366
Robust standard errors in parentheses*** p<0.01, ** p<0.05, * p<0.1
23
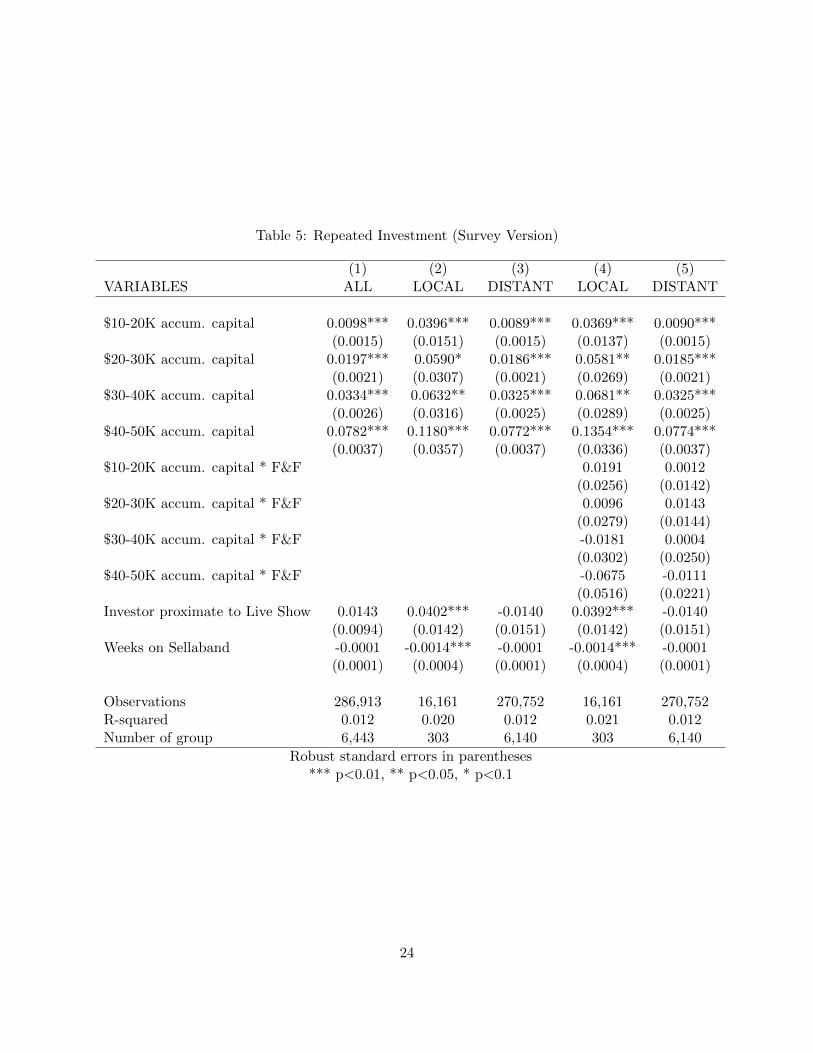
Table 5: Repeated Investment (Survey Version)
(1) (2) (3) (4) (5)VARIABLES ALL LOCAL DISTANT LOCAL DISTANT
$10-20K accum. capital 0.0098*** 0.0396*** 0.0089*** 0.0369*** 0.0090***(0.0015) (0.0151) (0.0015) (0.0137) (0.0015)
$20-30K accum. capital 0.0197*** 0.0590* 0.0186*** 0.0581** 0.0185***(0.0021) (0.0307) (0.0021) (0.0269) (0.0021)
$30-40K accum. capital 0.0334*** 0.0632** 0.0325*** 0.0681** 0.0325***(0.0026) (0.0316) (0.0025) (0.0289) (0.0025)
$40-50K accum. capital 0.0782*** 0.1180*** 0.0772*** 0.1354*** 0.0774***(0.0037) (0.0357) (0.0037) (0.0336) (0.0037)
$10-20K accum. capital * F&F 0.0191 0.0012(0.0256) (0.0142)
$20-30K accum. capital * F&F 0.0096 0.0143(0.0279) (0.0144)
$30-40K accum. capital * F&F -0.0181 0.0004(0.0302) (0.0250)
$40-50K accum. capital * F&F -0.0675 -0.0111(0.0516) (0.0221)
Investor proximate to Live Show 0.0143 0.0402*** -0.0140 0.0392*** -0.0140(0.0094) (0.0142) (0.0151) (0.0142) (0.0151)
Weeks on Sellaband -0.0001 -0.0014*** -0.0001 -0.0014*** -0.0001(0.0001) (0.0004) (0.0001) (0.0004) (0.0001)
Observations 286,913 16,161 270,752 16,161 270,752R-squared 0.012 0.020 0.012 0.021 0.012Number of group 6,443 303 6,140 303 6,140
Robust standard errors in parentheses*** p<0.01, ** p<0.05, * p<0.1
24

Figure 1: Sellaband screenshot
25
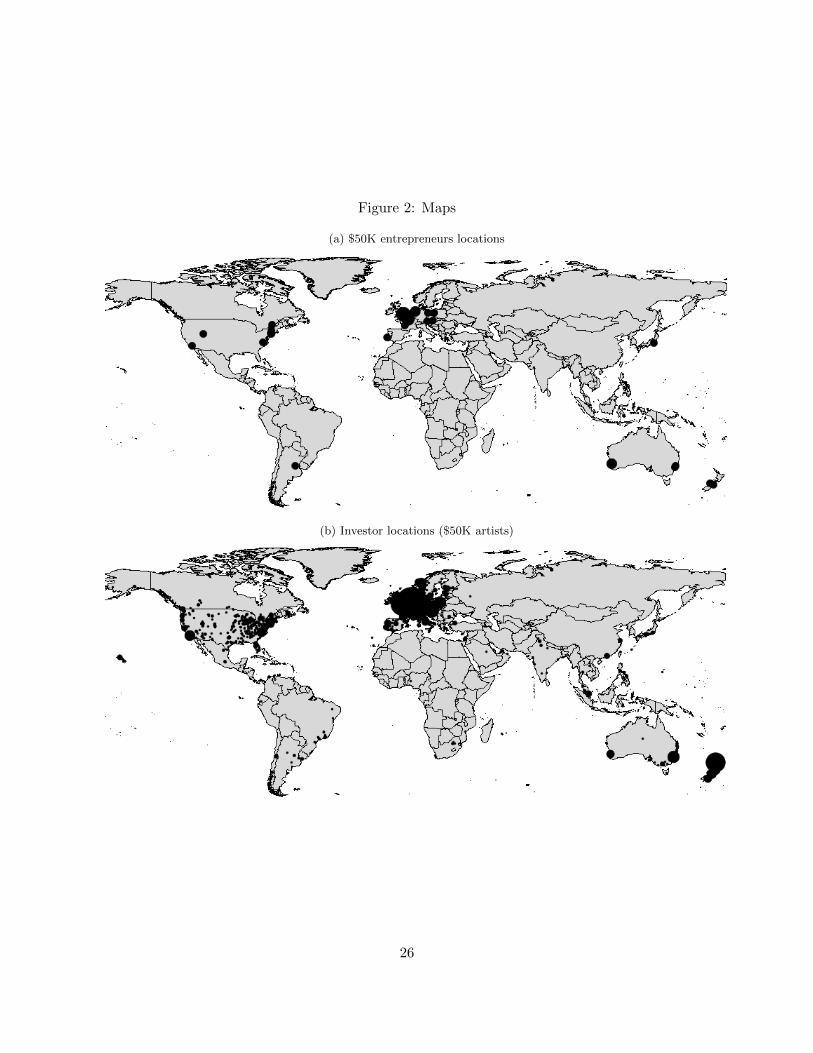
Figure 2: Maps
(a) $50K entrepreneurs locations
(b) Investor locations ($50K artists)
26
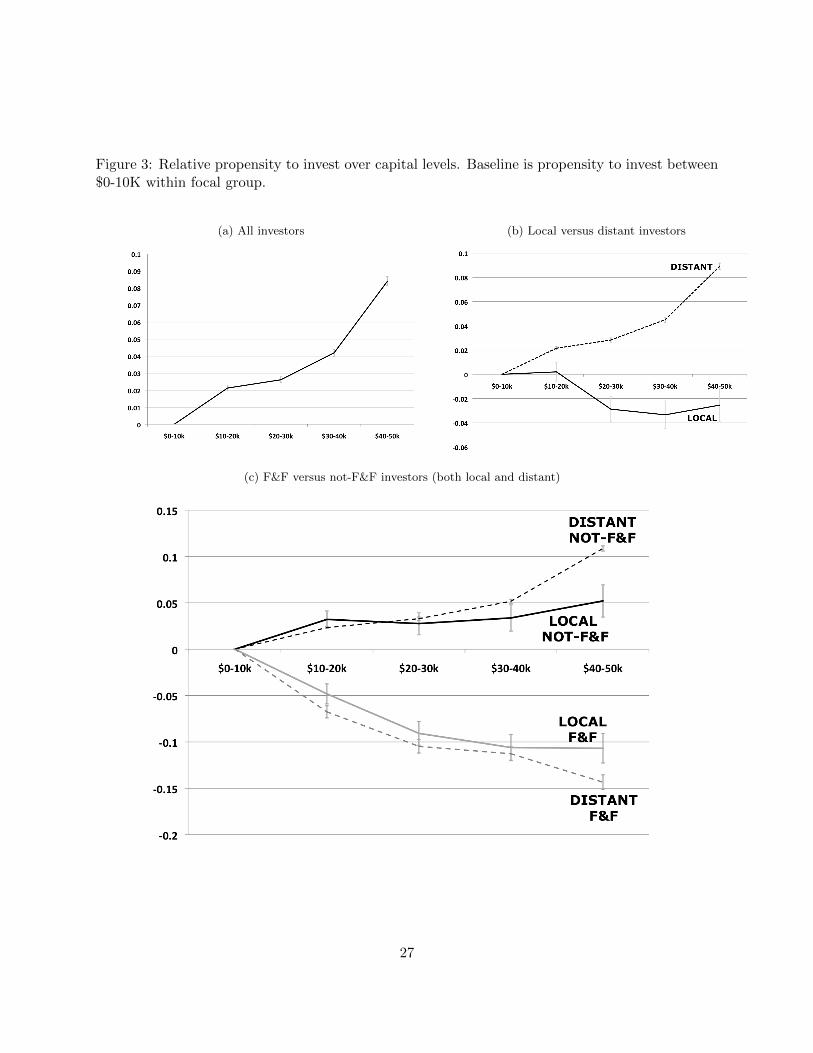
Figure 3: Relative propensity to invest over capital levels. Baseline is propensity to invest between$0-10K within focal group.
(a) All investors (b) Local versus distant investors
(c) F&F versus not-F&F investors (both local and distant)
27
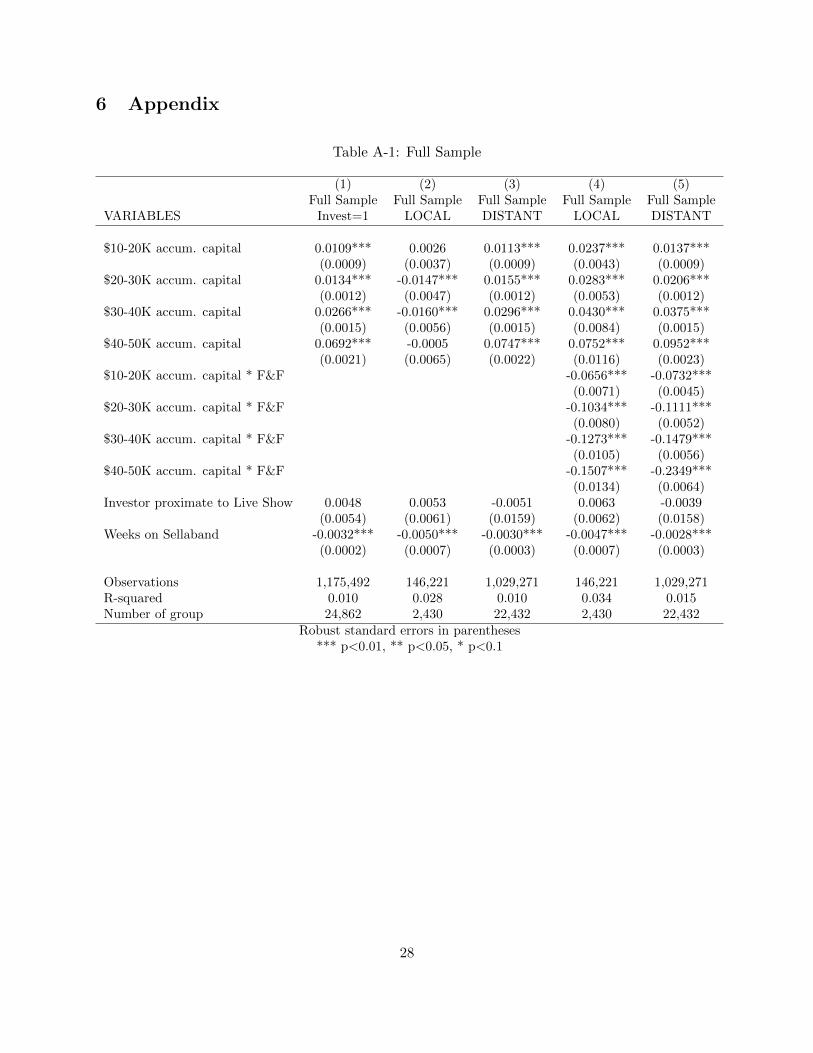
6 Appendix
Table A-1: Full Sample
(1) (2) (3) (4) (5)Full Sample Full Sample Full Sample Full Sample Full Sample
VARIABLES Invest=1 LOCAL DISTANT LOCAL DISTANT
$10-20K accum. capital 0.0109*** 0.0026 0.0113*** 0.0237*** 0.0137***(0.0009) (0.0037) (0.0009) (0.0043) (0.0009)
$20-30K accum. capital 0.0134*** -0.0147*** 0.0155*** 0.0283*** 0.0206***(0.0012) (0.0047) (0.0012) (0.0053) (0.0012)
$30-40K accum. capital 0.0266*** -0.0160*** 0.0296*** 0.0430*** 0.0375***(0.0015) (0.0056) (0.0015) (0.0084) (0.0015)
$40-50K accum. capital 0.0692*** -0.0005 0.0747*** 0.0752*** 0.0952***(0.0021) (0.0065) (0.0022) (0.0116) (0.0023)
$10-20K accum. capital * F&F -0.0656*** -0.0732***(0.0071) (0.0045)
$20-30K accum. capital * F&F -0.1034*** -0.1111***(0.0080) (0.0052)
$30-40K accum. capital * F&F -0.1273*** -0.1479***(0.0105) (0.0056)
$40-50K accum. capital * F&F -0.1507*** -0.2349***(0.0134) (0.0064)
Investor proximate to Live Show 0.0048 0.0053 -0.0051 0.0063 -0.0039(0.0054) (0.0061) (0.0159) (0.0062) (0.0158)
Weeks on Sellaband -0.0032*** -0.0050*** -0.0030*** -0.0047*** -0.0028***(0.0002) (0.0007) (0.0003) (0.0007) (0.0003)
Observations 1,175,492 146,221 1,029,271 146,221 1,029,271R-squared 0.010 0.028 0.010 0.034 0.015Number of group 24,862 2,430 22,432 2,430 22,432
Robust standard errors in parentheses*** p<0.01, ** p<0.05, * p<0.1
28

Table A-2: $1K Sample
(1) (2) (3) (4) (5)$1K Sample $1K Sample $1K Sample $1K Sample $1K Sample
VARIABLES Invest=1 LOCAL DISTANT LOCAL DISTANT
$10-20K accum. capital 0.0108*** 0.0026 0.0113*** 0.0237*** 0.0138***(0.0009) (0.0037) (0.0009) (0.0043) (0.0009)
$20-30K accum. capital 0.0133*** -0.0148*** 0.0155*** 0.0281*** 0.0205***(0.0012) (0.0048) (0.0012) (0.0054) (0.0012)
$30-40K accum. capital 0.0267*** -0.0159*** 0.0297*** 0.0429*** 0.0376***(0.0015) (0.0057) (0.0015) (0.0085) (0.0015)
$40-50K accum. capital 0.0692*** 0.0001 0.0747*** 0.0752*** 0.0952***(0.0021) (0.0066) (0.0022) (0.0116) (0.0023)
$10-20K accum. capital * F&F -0.0656*** -0.0735***(0.0071) (0.0046)
$20-30K accum. capital * F&F -0.1034*** -0.1113***(0.0080) (0.0052)
$30-40K accum. capital * F&F -0.1271*** -0.1481***(0.0105) (0.0056)
$40-50K accum. capital * F&F -0.1500*** -0.2350***(0.0134) (0.0064)
Investor proximate to Live Show 0.0049 0.0059 -0.0053 0.0068 -0.0042(0.0054) (0.0061) (0.0159) (0.0062) (0.0158)
Weeks on Sellaband -0.0031*** -0.0050*** -0.0029*** -0.0047*** -0.0028***(0.0002) (0.0007) (0.0003) (0.0007) (0.0003)
Observations 1,155,845 142,923 1,012,922 142,923 1,012,922R-squared 0.010 0.028 0.010 0.034 0.015Number of group 24,411 2,375 22,036 2,375 22,036
Robust standard errors in parentheses*** p<0.01, ** p<0.05, * p<0.1
29
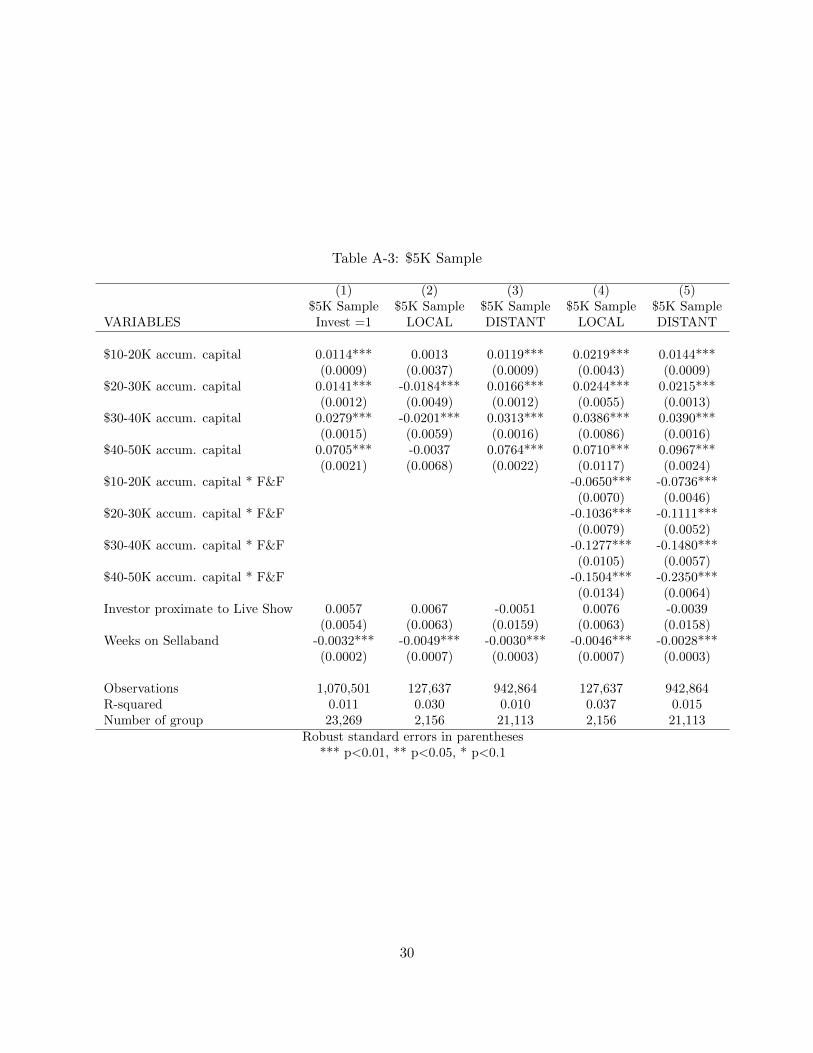
Table A-3: $5K Sample
(1) (2) (3) (4) (5)$5K Sample $5K Sample $5K Sample $5K Sample $5K Sample
VARIABLES Invest =1 LOCAL DISTANT LOCAL DISTANT
$10-20K accum. capital 0.0114*** 0.0013 0.0119*** 0.0219*** 0.0144***(0.0009) (0.0037) (0.0009) (0.0043) (0.0009)
$20-30K accum. capital 0.0141*** -0.0184*** 0.0166*** 0.0244*** 0.0215***(0.0012) (0.0049) (0.0012) (0.0055) (0.0013)
$30-40K accum. capital 0.0279*** -0.0201*** 0.0313*** 0.0386*** 0.0390***(0.0015) (0.0059) (0.0016) (0.0086) (0.0016)
$40-50K accum. capital 0.0705*** -0.0037 0.0764*** 0.0710*** 0.0967***(0.0021) (0.0068) (0.0022) (0.0117) (0.0024)
$10-20K accum. capital * F&F -0.0650*** -0.0736***(0.0070) (0.0046)
$20-30K accum. capital * F&F -0.1036*** -0.1111***(0.0079) (0.0052)
$30-40K accum. capital * F&F -0.1277*** -0.1480***(0.0105) (0.0057)
$40-50K accum. capital * F&F -0.1504*** -0.2350***(0.0134) (0.0064)
Investor proximate to Live Show 0.0057 0.0067 -0.0051 0.0076 -0.0039(0.0054) (0.0063) (0.0159) (0.0063) (0.0158)
Weeks on Sellaband -0.0032*** -0.0049*** -0.0030*** -0.0046*** -0.0028***(0.0002) (0.0007) (0.0003) (0.0007) (0.0003)
Observations 1,070,501 127,637 942,864 127,637 942,864R-squared 0.011 0.030 0.010 0.037 0.015Number of group 23,269 2,156 21,113 2,156 21,113
Robust standard errors in parentheses*** p<0.01, ** p<0.05, * p<0.1
30
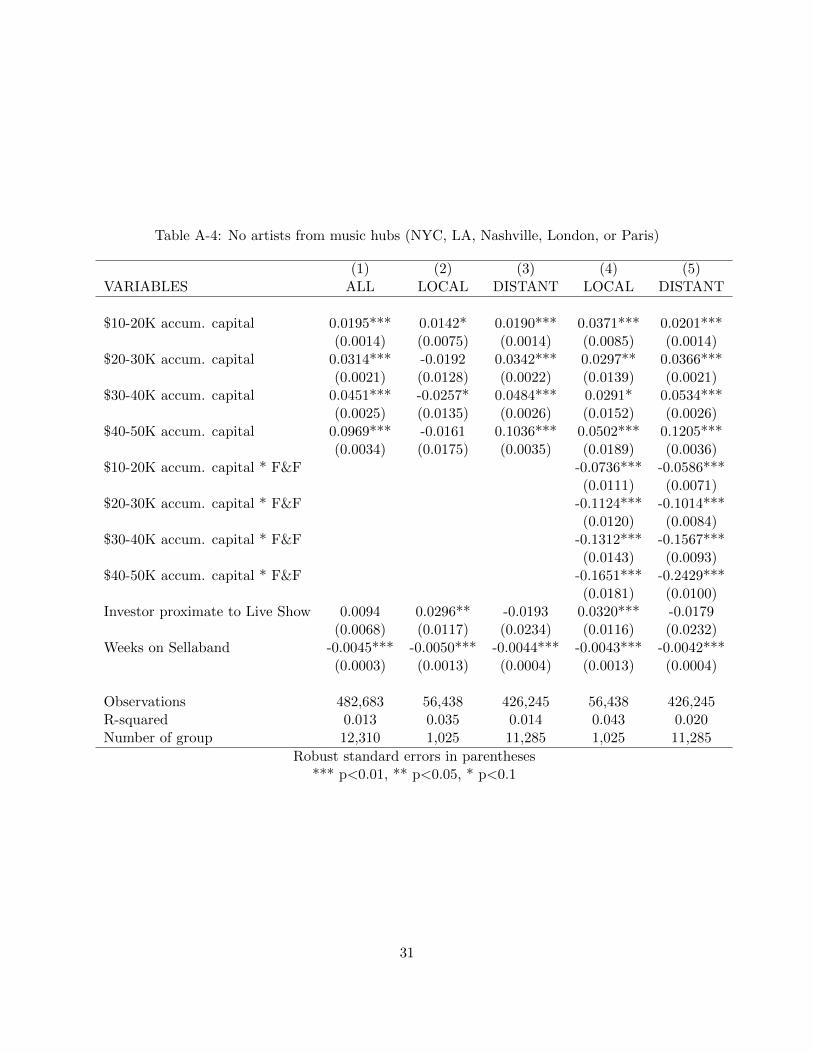
Table A-4: No artists from music hubs (NYC, LA, Nashville, London, or Paris)
(1) (2) (3) (4) (5)VARIABLES ALL LOCAL DISTANT LOCAL DISTANT
$10-20K accum. capital 0.0195*** 0.0142* 0.0190*** 0.0371*** 0.0201***(0.0014) (0.0075) (0.0014) (0.0085) (0.0014)
$20-30K accum. capital 0.0314*** -0.0192 0.0342*** 0.0297** 0.0366***(0.0021) (0.0128) (0.0022) (0.0139) (0.0021)
$30-40K accum. capital 0.0451*** -0.0257* 0.0484*** 0.0291* 0.0534***(0.0025) (0.0135) (0.0026) (0.0152) (0.0026)
$40-50K accum. capital 0.0969*** -0.0161 0.1036*** 0.0502*** 0.1205***(0.0034) (0.0175) (0.0035) (0.0189) (0.0036)
$10-20K accum. capital * F&F -0.0736*** -0.0586***(0.0111) (0.0071)
$20-30K accum. capital * F&F -0.1124*** -0.1014***(0.0120) (0.0084)
$30-40K accum. capital * F&F -0.1312*** -0.1567***(0.0143) (0.0093)
$40-50K accum. capital * F&F -0.1651*** -0.2429***(0.0181) (0.0100)
Investor proximate to Live Show 0.0094 0.0296** -0.0193 0.0320*** -0.0179(0.0068) (0.0117) (0.0234) (0.0116) (0.0232)
Weeks on Sellaband -0.0045*** -0.0050*** -0.0044*** -0.0043*** -0.0042***(0.0003) (0.0013) (0.0004) (0.0013) (0.0004)
Observations 482,683 56,438 426,245 56,438 426,245R-squared 0.013 0.035 0.014 0.043 0.020Number of group 12,310 1,025 11,285 1,025 11,285
Robust standard errors in parentheses*** p<0.01, ** p<0.05, * p<0.1
31
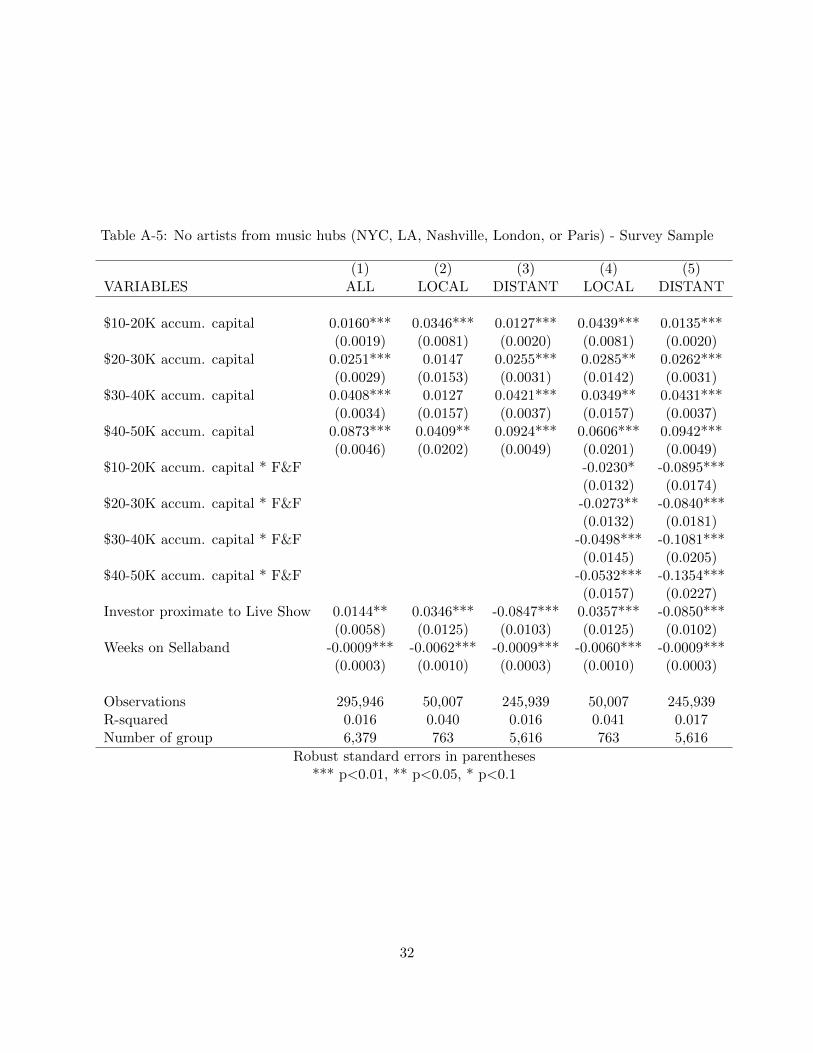
Table A-5: No artists from music hubs (NYC, LA, Nashville, London, or Paris) - Survey Sample
(1) (2) (3) (4) (5)VARIABLES ALL LOCAL DISTANT LOCAL DISTANT
$10-20K accum. capital 0.0160*** 0.0346*** 0.0127*** 0.0439*** 0.0135***(0.0019) (0.0081) (0.0020) (0.0081) (0.0020)
$20-30K accum. capital 0.0251*** 0.0147 0.0255*** 0.0285** 0.0262***(0.0029) (0.0153) (0.0031) (0.0142) (0.0031)
$30-40K accum. capital 0.0408*** 0.0127 0.0421*** 0.0349** 0.0431***(0.0034) (0.0157) (0.0037) (0.0157) (0.0037)
$40-50K accum. capital 0.0873*** 0.0409** 0.0924*** 0.0606*** 0.0942***(0.0046) (0.0202) (0.0049) (0.0201) (0.0049)
$10-20K accum. capital * F&F -0.0230* -0.0895***(0.0132) (0.0174)
$20-30K accum. capital * F&F -0.0273** -0.0840***(0.0132) (0.0181)
$30-40K accum. capital * F&F -0.0498*** -0.1081***(0.0145) (0.0205)
$40-50K accum. capital * F&F -0.0532*** -0.1354***(0.0157) (0.0227)
Investor proximate to Live Show 0.0144** 0.0346*** -0.0847*** 0.0357*** -0.0850***(0.0058) (0.0125) (0.0103) (0.0125) (0.0102)
Weeks on Sellaband -0.0009*** -0.0062*** -0.0009*** -0.0060*** -0.0009***(0.0003) (0.0010) (0.0003) (0.0010) (0.0003)
Observations 295,946 50,007 245,939 50,007 245,939R-squared 0.016 0.040 0.016 0.041 0.017Number of group 6,379 763 5,616 763 5,616
Robust standard errors in parentheses*** p<0.01, ** p<0.05, * p<0.1
32
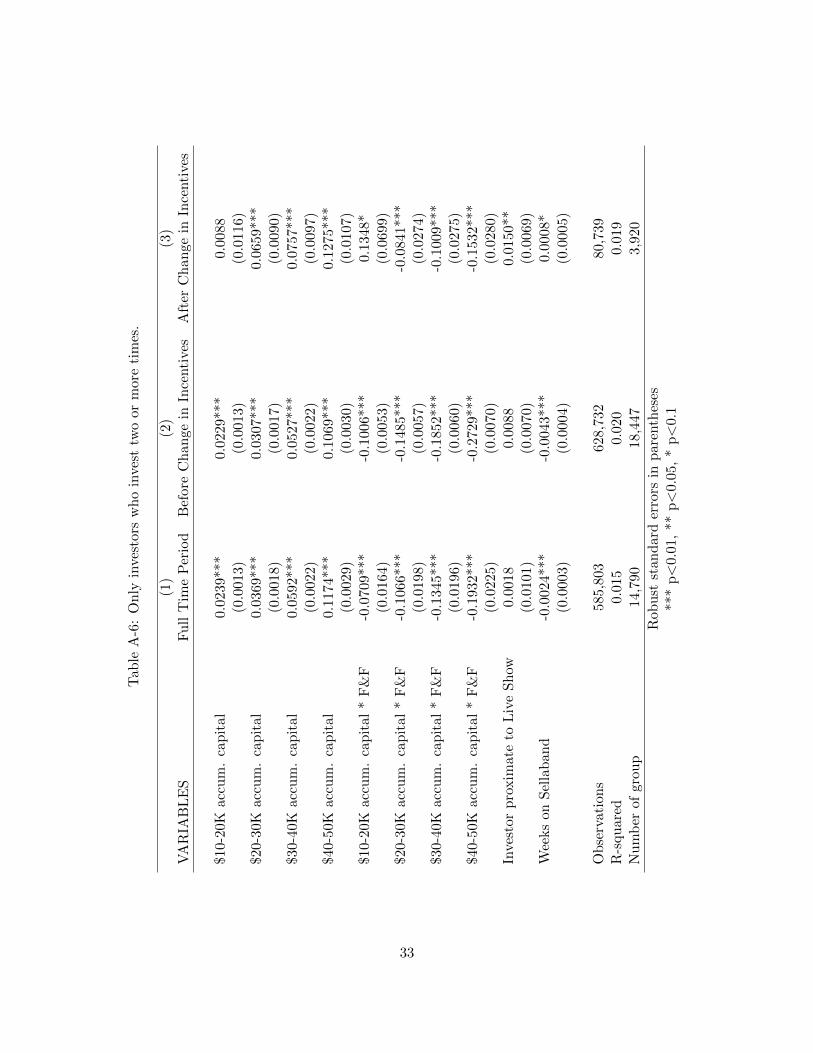
Tab
leA
-6:
On
lyin
vest
ors
who
inve
sttw
oor
mor
eti
mes
.
(1)
(2)
(3)
VA
RIA
BL
ES
Fu
llT
ime
Per
iod
Bef
ore
Ch
ange
inIn
centi
ves
Aft
erC
han
gein
Ince
nti
ves
$10-2
0Kac
cum
.ca
pit
al
0.02
39**
*0.
0229
***
0.00
88(0
.001
3)(0
.001
3)(0
.011
6)$2
0-3
0K
acc
um
.ca
pit
al0.
0369
***
0.03
07**
*0.
0659
***
(0.0
018)
(0.0
017)
(0.0
090)
$30-4
0K
acc
um
.ca
pit
al0.
0592
***
0.05
27**
*0.
0757
***
(0.0
022)
(0.0
022)
(0.0
097)
$40-5
0K
acc
um
.ca
pit
al0.
1174
***
0.10
69**
*0.
1275
***
(0.0
029)
(0.0
030)
(0.0
107)
$10-2
0K
acc
um
.ca
pit
al*
F&
F-0
.070
9***
-0.1
006*
**0.
1348
*(0
.016
4)(0
.005
3)(0
.069
9)$2
0-3
0K
acc
um
.ca
pit
al*
F&
F-0
.106
6***
-0.1
485*
**-0
.084
1***
(0.0
198)
(0.0
057)
(0.0
274)
$30-4
0K
acc
um
.ca
pit
al*
F&
F-0
.134
5***
-0.1
852*
**-0
.100
9***
(0.0
196)
(0.0
060)
(0.0
275)
$40-5
0K
acc
um
.ca
pit
al*
F&
F-0
.193
2***
-0.2
729*
**-0
.153
2***
(0.0
225)
(0.0
070)
(0.0
280)
Inve
stor
pro
xim
ate
toL
ive
Sh
ow0.
0018
0.00
880.
0150
**(0
.010
1)(0
.007
0)(0
.006
9)W
eeks
on
Sel
lab
and
-0.0
024*
**-0
.004
3***
0.00
08*
(0.0
003)
(0.0
004)
(0.0
005)
Ob
serv
ati
on
s58
5,80
362
8,73
280
,739
R-s
qu
are
d0.
015
0.02
00.
019
Nu
mb
erof
grou
p14
,790
18,4
473,
920
Rob
ust
stan
dar
der
rors
inp
aren
thes
es**
*p<
0.01
,**
p<
0.05
,*
p<
0.1
33
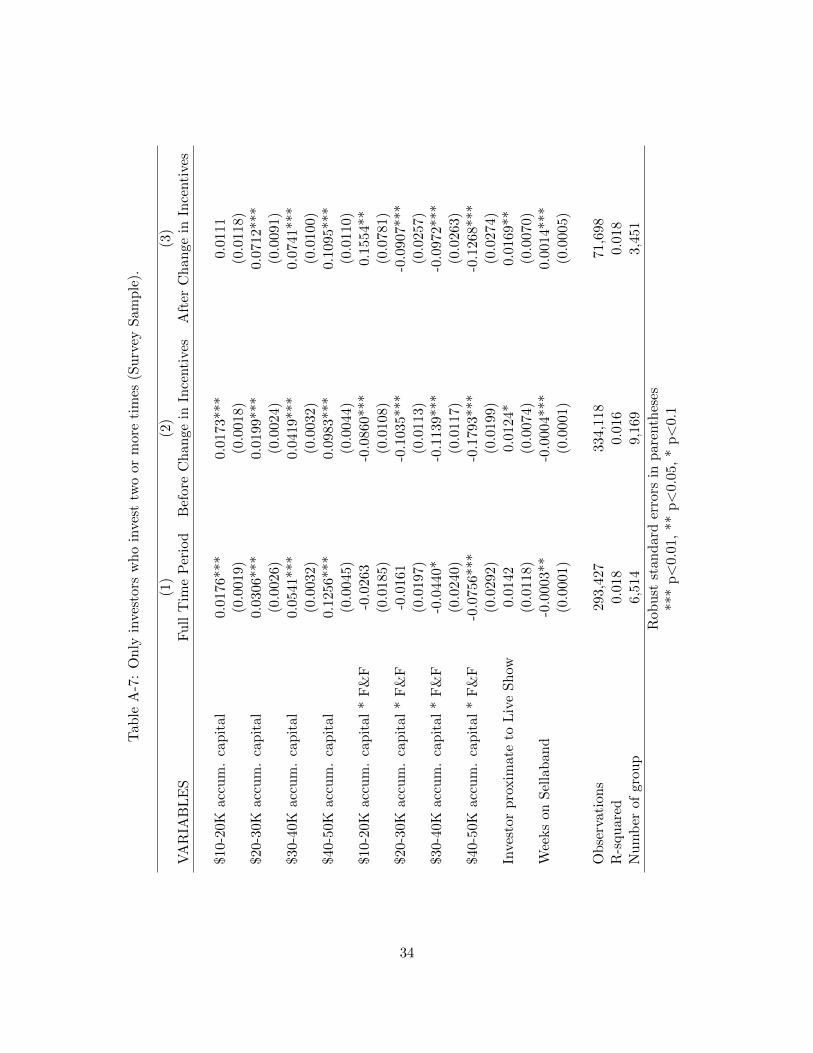
Tab
leA
-7:
On
lyin
vest
ors
who
inve
sttw
oor
mor
eti
mes
(Su
rvey
Sam
ple
).
(1)
(2)
(3)
VA
RIA
BL
ES
Fu
llT
ime
Per
iod
Bef
ore
Ch
ange
inIn
centi
ves
Aft
erC
han
gein
Ince
nti
ves
$10-2
0Kac
cum
.ca
pit
al
0.01
76**
*0.
0173
***
0.01
11(0
.001
9)(0
.001
8)(0
.011
8)$2
0-3
0K
acc
um
.ca
pit
al0.
0306
***
0.01
99**
*0.
0712
***
(0.0
026)
(0.0
024)
(0.0
091)
$30-4
0K
acc
um
.ca
pit
al0.
0541
***
0.04
19**
*0.
0741
***
(0.0
032)
(0.0
032)
(0.0
100)
$40-5
0K
acc
um
.ca
pit
al0.
1256
***
0.09
83**
*0.
1095
***
(0.0
045)
(0.0
044)
(0.0
110)
$10-2
0K
acc
um
.ca
pit
al*
F&
F-0
.026
3-0
.086
0***
0.15
54**
(0.0
185)
(0.0
108)
(0.0
781)
$20-3
0K
acc
um
.ca
pit
al*
F&
F-0
.016
1-0
.103
5***
-0.0
907*
**(0
.019
7)(0
.011
3)(0
.025
7)$3
0-4
0K
acc
um
.ca
pit
al*
F&
F-0
.044
0*-0
.113
9***
-0.0
972*
**(0
.024
0)(0
.011
7)(0
.026
3)$4
0-5
0K
acc
um
.ca
pit
al*
F&
F-0
.075
6***
-0.1
793*
**-0
.126
8***
(0.0
292)
(0.0
199)
(0.0
274)
Inve
stor
pro
xim
ate
toL
ive
Sh
ow0.
0142
0.01
24*
0.01
69**
(0.0
118)
(0.0
074)
(0.0
070)
Wee
ks
on
Sel
lab
and
-0.0
003*
*-0
.000
4***
0.00
14**
*(0
.000
1)(0
.000
1)(0
.000
5)
Ob
serv
ati
on
s29
3,42
733
4,11
871
,698
R-s
qu
are
d0.
018
0.01
60.
018
Nu
mb
erof
grou
p6,
514
9,16
93,
451
Rob
ust
stan
dar
der
rors
inp
aren
thes
es**
*p<
0.01
,**
p<
0.05
,*
p<
0.1
34
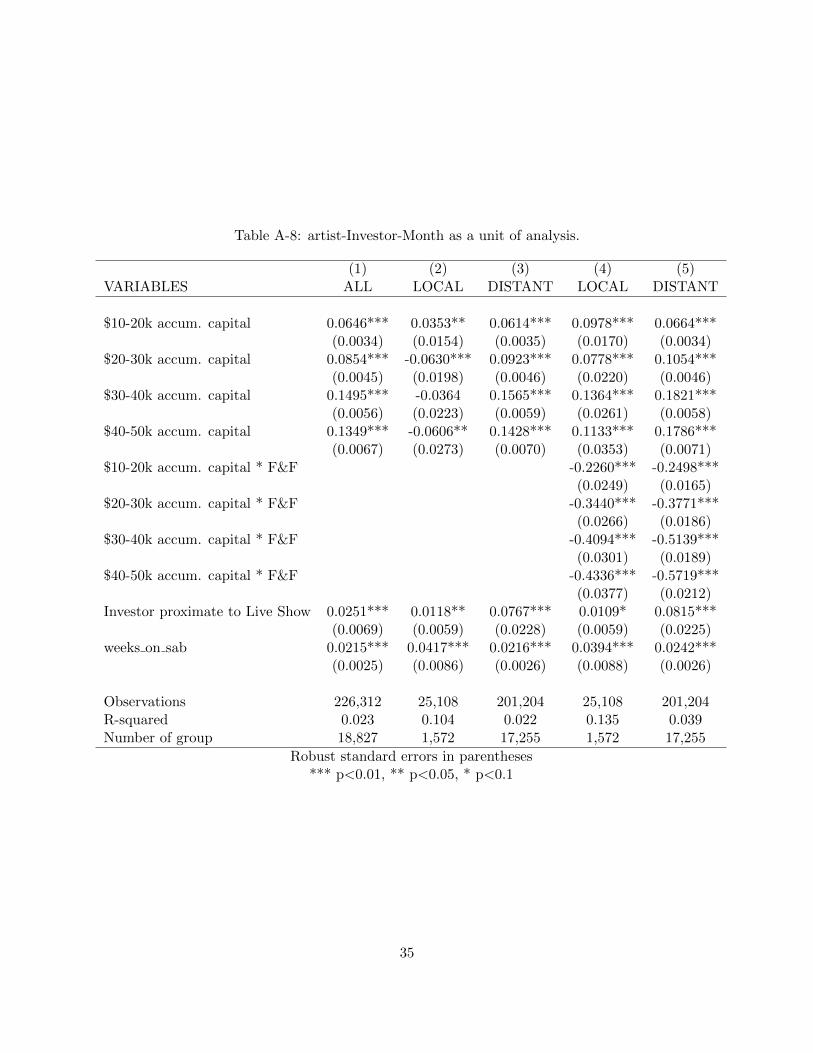
Table A-8: artist-Investor-Month as a unit of analysis.
(1) (2) (3) (4) (5)VARIABLES ALL LOCAL DISTANT LOCAL DISTANT
$10-20k accum. capital 0.0646*** 0.0353** 0.0614*** 0.0978*** 0.0664***(0.0034) (0.0154) (0.0035) (0.0170) (0.0034)
$20-30k accum. capital 0.0854*** -0.0630*** 0.0923*** 0.0778*** 0.1054***(0.0045) (0.0198) (0.0046) (0.0220) (0.0046)
$30-40k accum. capital 0.1495*** -0.0364 0.1565*** 0.1364*** 0.1821***(0.0056) (0.0223) (0.0059) (0.0261) (0.0058)
$40-50k accum. capital 0.1349*** -0.0606** 0.1428*** 0.1133*** 0.1786***(0.0067) (0.0273) (0.0070) (0.0353) (0.0071)
$10-20k accum. capital * F&F -0.2260*** -0.2498***(0.0249) (0.0165)
$20-30k accum. capital * F&F -0.3440*** -0.3771***(0.0266) (0.0186)
$30-40k accum. capital * F&F -0.4094*** -0.5139***(0.0301) (0.0189)
$40-50k accum. capital * F&F -0.4336*** -0.5719***(0.0377) (0.0212)
Investor proximate to Live Show 0.0251*** 0.0118** 0.0767*** 0.0109* 0.0815***(0.0069) (0.0059) (0.0228) (0.0059) (0.0225)
weeks on sab 0.0215*** 0.0417*** 0.0216*** 0.0394*** 0.0242***(0.0025) (0.0086) (0.0026) (0.0088) (0.0026)
Observations 226,312 25,108 201,204 25,108 201,204R-squared 0.023 0.104 0.022 0.135 0.039Number of group 18,827 1,572 17,255 1,572 17,255
Robust standard errors in parentheses*** p<0.01, ** p<0.05, * p<0.1
35
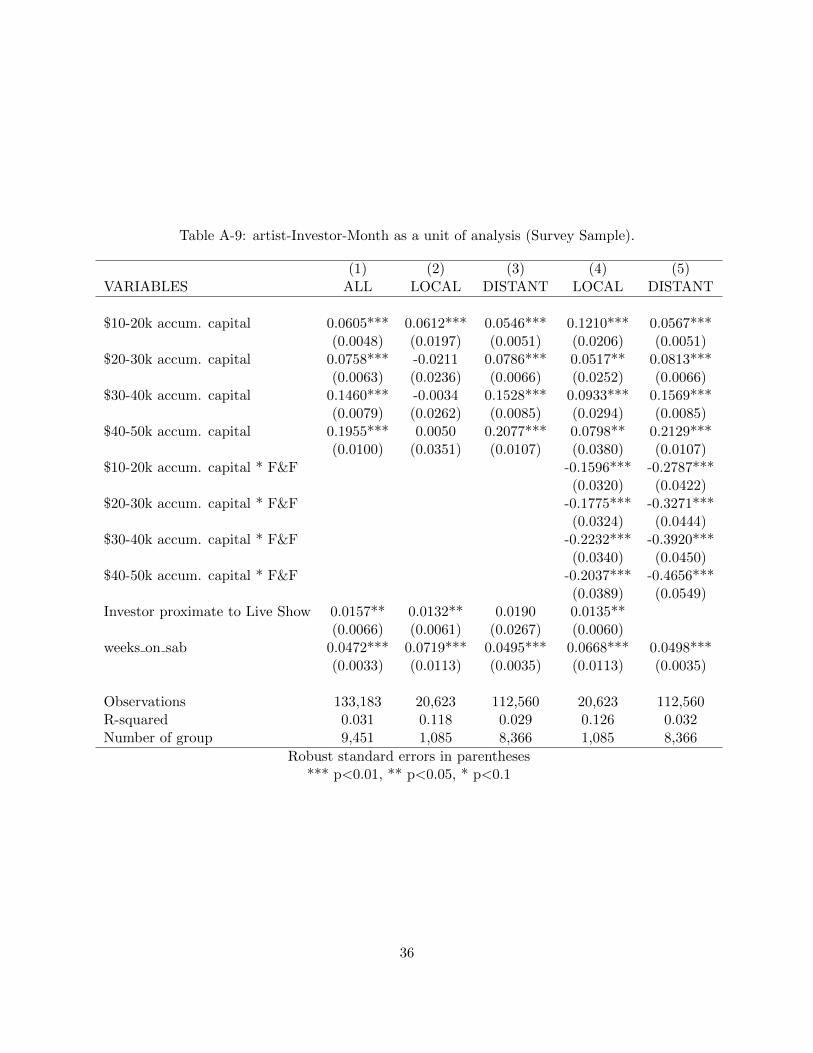
Table A-9: artist-Investor-Month as a unit of analysis (Survey Sample).
(1) (2) (3) (4) (5)VARIABLES ALL LOCAL DISTANT LOCAL DISTANT
$10-20k accum. capital 0.0605*** 0.0612*** 0.0546*** 0.1210*** 0.0567***(0.0048) (0.0197) (0.0051) (0.0206) (0.0051)
$20-30k accum. capital 0.0758*** -0.0211 0.0786*** 0.0517** 0.0813***(0.0063) (0.0236) (0.0066) (0.0252) (0.0066)
$30-40k accum. capital 0.1460*** -0.0034 0.1528*** 0.0933*** 0.1569***(0.0079) (0.0262) (0.0085) (0.0294) (0.0085)
$40-50k accum. capital 0.1955*** 0.0050 0.2077*** 0.0798** 0.2129***(0.0100) (0.0351) (0.0107) (0.0380) (0.0107)
$10-20k accum. capital * F&F -0.1596*** -0.2787***(0.0320) (0.0422)
$20-30k accum. capital * F&F -0.1775*** -0.3271***(0.0324) (0.0444)
$30-40k accum. capital * F&F -0.2232*** -0.3920***(0.0340) (0.0450)
$40-50k accum. capital * F&F -0.2037*** -0.4656***(0.0389) (0.0549)
Investor proximate to Live Show 0.0157** 0.0132** 0.0190 0.0135**(0.0066) (0.0061) (0.0267) (0.0060)
weeks on sab 0.0472*** 0.0719*** 0.0495*** 0.0668*** 0.0498***(0.0033) (0.0113) (0.0035) (0.0113) (0.0035)
Observations 133,183 20,623 112,560 20,623 112,560R-squared 0.031 0.118 0.029 0.126 0.032Number of group 9,451 1,085 8,366 1,085 8,366
Robust standard errors in parentheses*** p<0.01, ** p<0.05, * p<0.1
36
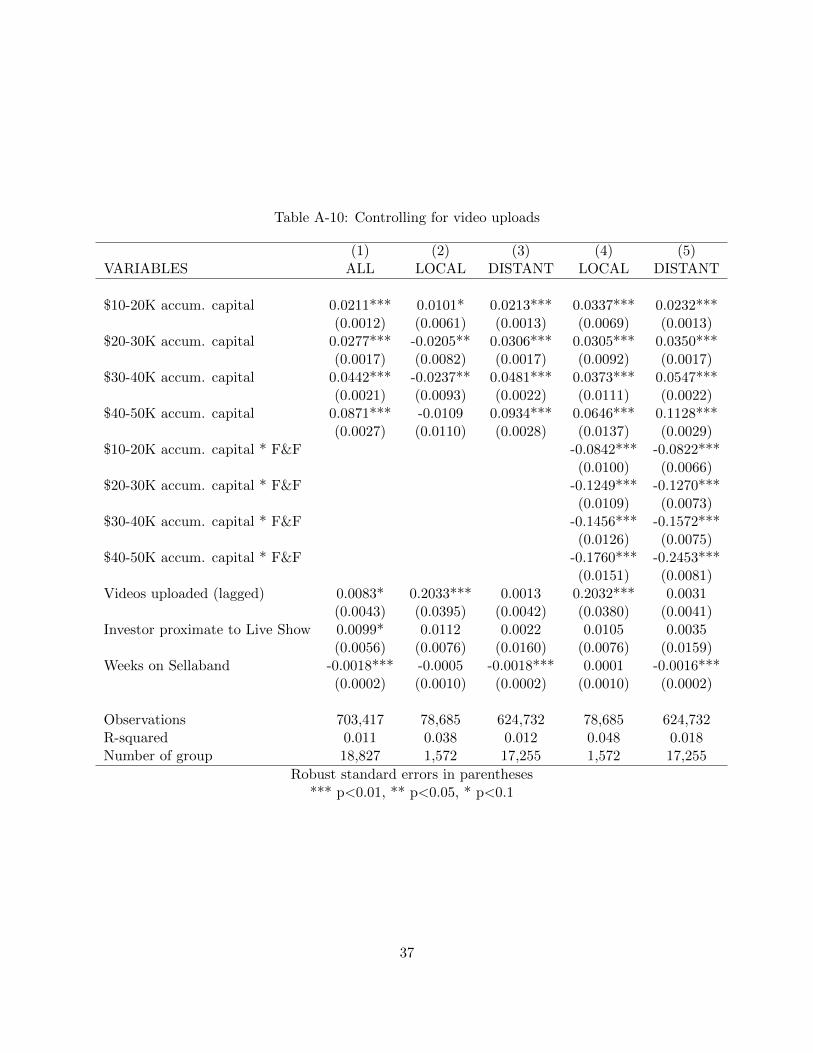
Table A-10: Controlling for video uploads
(1) (2) (3) (4) (5)VARIABLES ALL LOCAL DISTANT LOCAL DISTANT
$10-20K accum. capital 0.0211*** 0.0101* 0.0213*** 0.0337*** 0.0232***(0.0012) (0.0061) (0.0013) (0.0069) (0.0013)
$20-30K accum. capital 0.0277*** -0.0205** 0.0306*** 0.0305*** 0.0350***(0.0017) (0.0082) (0.0017) (0.0092) (0.0017)
$30-40K accum. capital 0.0442*** -0.0237** 0.0481*** 0.0373*** 0.0547***(0.0021) (0.0093) (0.0022) (0.0111) (0.0022)
$40-50K accum. capital 0.0871*** -0.0109 0.0934*** 0.0646*** 0.1128***(0.0027) (0.0110) (0.0028) (0.0137) (0.0029)
$10-20K accum. capital * F&F -0.0842*** -0.0822***(0.0100) (0.0066)
$20-30K accum. capital * F&F -0.1249*** -0.1270***(0.0109) (0.0073)
$30-40K accum. capital * F&F -0.1456*** -0.1572***(0.0126) (0.0075)
$40-50K accum. capital * F&F -0.1760*** -0.2453***(0.0151) (0.0081)
Videos uploaded (lagged) 0.0083* 0.2033*** 0.0013 0.2032*** 0.0031(0.0043) (0.0395) (0.0042) (0.0380) (0.0041)
Investor proximate to Live Show 0.0099* 0.0112 0.0022 0.0105 0.0035(0.0056) (0.0076) (0.0160) (0.0076) (0.0159)
Weeks on Sellaband -0.0018*** -0.0005 -0.0018*** 0.0001 -0.0016***(0.0002) (0.0010) (0.0002) (0.0010) (0.0002)
Observations 703,417 78,685 624,732 78,685 624,732R-squared 0.011 0.038 0.012 0.048 0.018Number of group 18,827 1,572 17,255 1,572 17,255
Robust standard errors in parentheses*** p<0.01, ** p<0.05, * p<0.1
37
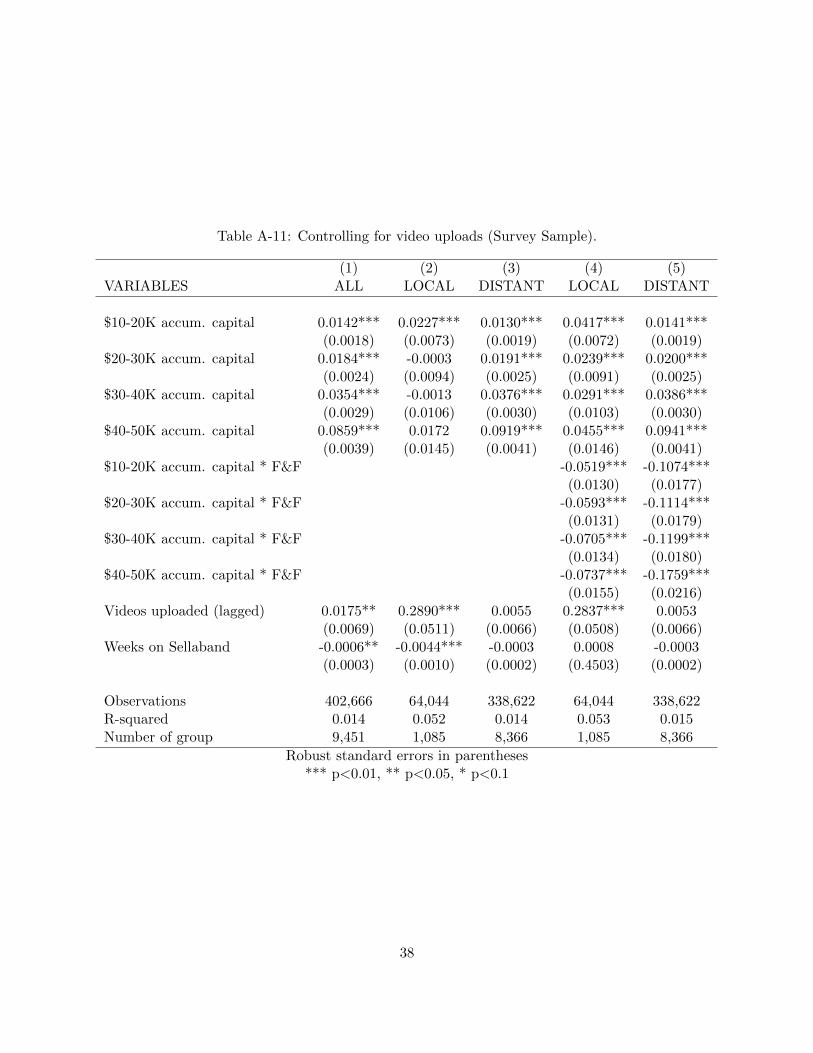
Table A-11: Controlling for video uploads (Survey Sample).
(1) (2) (3) (4) (5)VARIABLES ALL LOCAL DISTANT LOCAL DISTANT
$10-20K accum. capital 0.0142*** 0.0227*** 0.0130*** 0.0417*** 0.0141***(0.0018) (0.0073) (0.0019) (0.0072) (0.0019)
$20-30K accum. capital 0.0184*** -0.0003 0.0191*** 0.0239*** 0.0200***(0.0024) (0.0094) (0.0025) (0.0091) (0.0025)
$30-40K accum. capital 0.0354*** -0.0013 0.0376*** 0.0291*** 0.0386***(0.0029) (0.0106) (0.0030) (0.0103) (0.0030)
$40-50K accum. capital 0.0859*** 0.0172 0.0919*** 0.0455*** 0.0941***(0.0039) (0.0145) (0.0041) (0.0146) (0.0041)
$10-20K accum. capital * F&F -0.0519*** -0.1074***(0.0130) (0.0177)
$20-30K accum. capital * F&F -0.0593*** -0.1114***(0.0131) (0.0179)
$30-40K accum. capital * F&F -0.0705*** -0.1199***(0.0134) (0.0180)
$40-50K accum. capital * F&F -0.0737*** -0.1759***(0.0155) (0.0216)
Videos uploaded (lagged) 0.0175** 0.2890*** 0.0055 0.2837*** 0.0053(0.0069) (0.0511) (0.0066) (0.0508) (0.0066)
Weeks on Sellaband -0.0006** -0.0044*** -0.0003 0.0008 -0.0003(0.0003) (0.0010) (0.0002) (0.4503) (0.0002)
Observations 402,666 64,044 338,622 64,044 338,622R-squared 0.014 0.052 0.014 0.053 0.015Number of group 9,451 1,085 8,366 1,085 8,366
Robust standard errors in parentheses*** p<0.01, ** p<0.05, * p<0.1
38
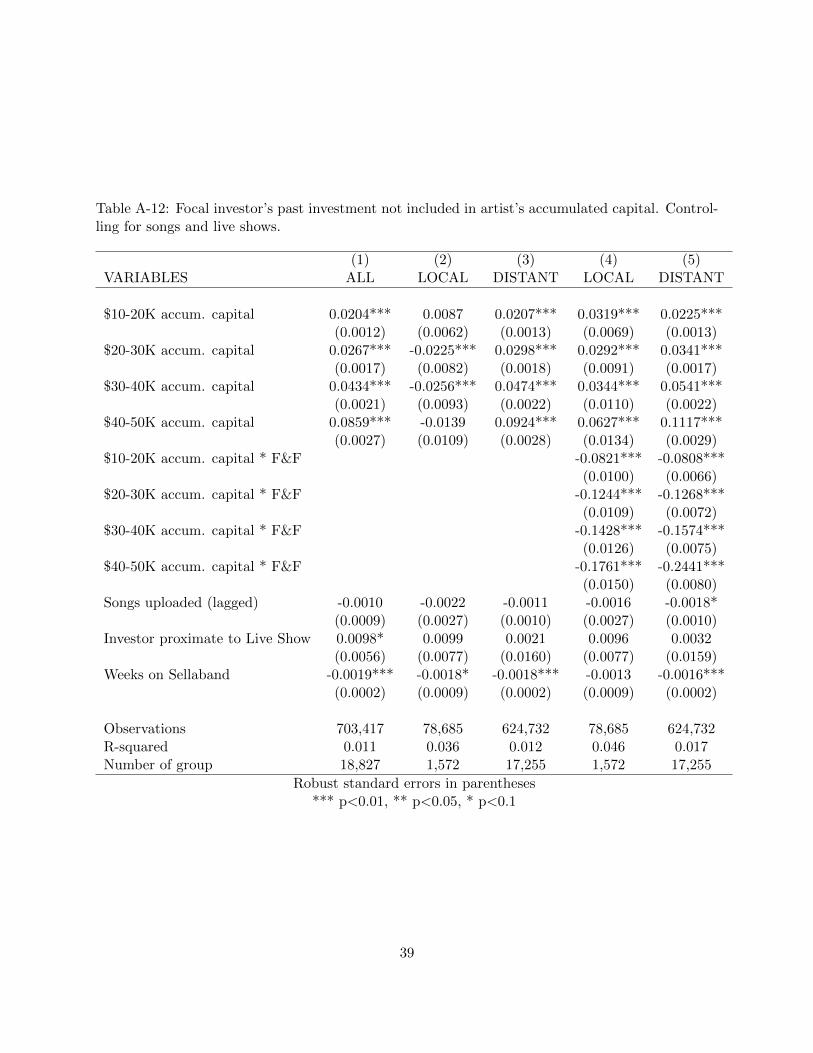
Table A-12: Focal investor’s past investment not included in artist’s accumulated capital. Control-ling for songs and live shows.
(1) (2) (3) (4) (5)VARIABLES ALL LOCAL DISTANT LOCAL DISTANT
$10-20K accum. capital 0.0204*** 0.0087 0.0207*** 0.0319*** 0.0225***(0.0012) (0.0062) (0.0013) (0.0069) (0.0013)
$20-30K accum. capital 0.0267*** -0.0225*** 0.0298*** 0.0292*** 0.0341***(0.0017) (0.0082) (0.0018) (0.0091) (0.0017)
$30-40K accum. capital 0.0434*** -0.0256*** 0.0474*** 0.0344*** 0.0541***(0.0021) (0.0093) (0.0022) (0.0110) (0.0022)
$40-50K accum. capital 0.0859*** -0.0139 0.0924*** 0.0627*** 0.1117***(0.0027) (0.0109) (0.0028) (0.0134) (0.0029)
$10-20K accum. capital * F&F -0.0821*** -0.0808***(0.0100) (0.0066)
$20-30K accum. capital * F&F -0.1244*** -0.1268***(0.0109) (0.0072)
$30-40K accum. capital * F&F -0.1428*** -0.1574***(0.0126) (0.0075)
$40-50K accum. capital * F&F -0.1761*** -0.2441***(0.0150) (0.0080)
Songs uploaded (lagged) -0.0010 -0.0022 -0.0011 -0.0016 -0.0018*(0.0009) (0.0027) (0.0010) (0.0027) (0.0010)
Investor proximate to Live Show 0.0098* 0.0099 0.0021 0.0096 0.0032(0.0056) (0.0077) (0.0160) (0.0077) (0.0159)
Weeks on Sellaband -0.0019*** -0.0018* -0.0018*** -0.0013 -0.0016***(0.0002) (0.0009) (0.0002) (0.0009) (0.0002)
Observations 703,417 78,685 624,732 78,685 624,732R-squared 0.011 0.036 0.012 0.046 0.017Number of group 18,827 1,572 17,255 1,572 17,255
Robust standard errors in parentheses*** p<0.01, ** p<0.05, * p<0.1
39
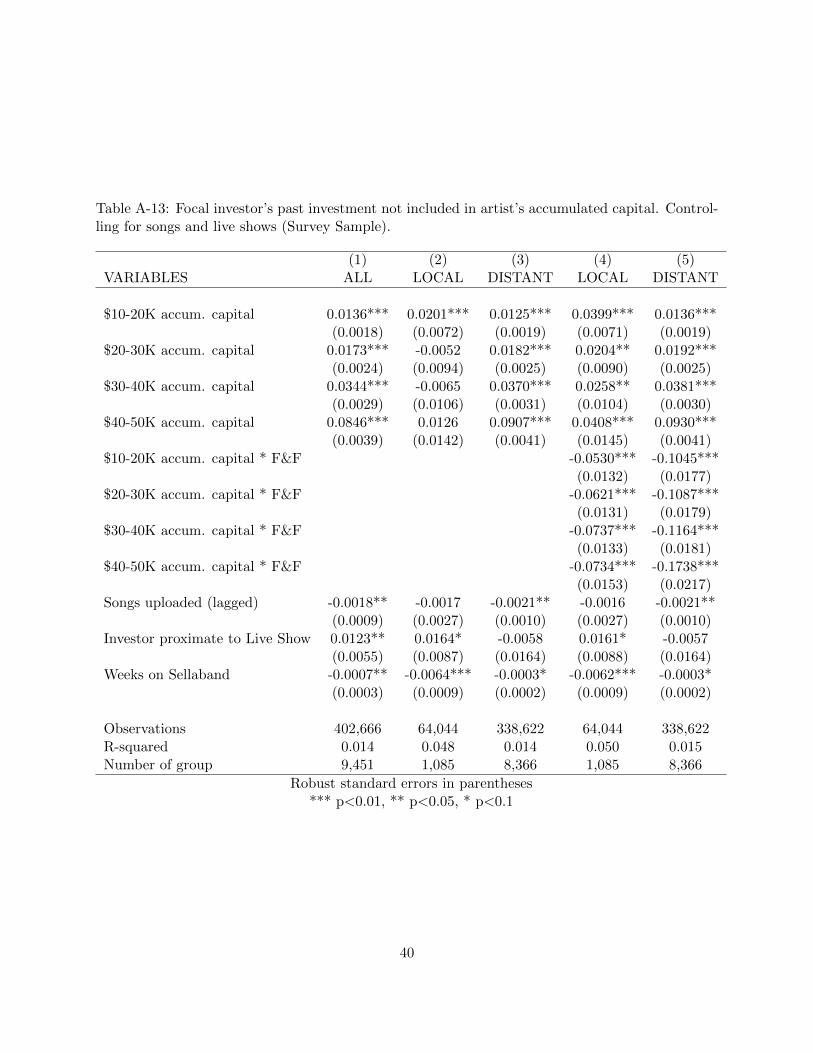
Table A-13: Focal investor’s past investment not included in artist’s accumulated capital. Control-ling for songs and live shows (Survey Sample).
(1) (2) (3) (4) (5)VARIABLES ALL LOCAL DISTANT LOCAL DISTANT
$10-20K accum. capital 0.0136*** 0.0201*** 0.0125*** 0.0399*** 0.0136***(0.0018) (0.0072) (0.0019) (0.0071) (0.0019)
$20-30K accum. capital 0.0173*** -0.0052 0.0182*** 0.0204** 0.0192***(0.0024) (0.0094) (0.0025) (0.0090) (0.0025)
$30-40K accum. capital 0.0344*** -0.0065 0.0370*** 0.0258** 0.0381***(0.0029) (0.0106) (0.0031) (0.0104) (0.0030)
$40-50K accum. capital 0.0846*** 0.0126 0.0907*** 0.0408*** 0.0930***(0.0039) (0.0142) (0.0041) (0.0145) (0.0041)
$10-20K accum. capital * F&F -0.0530*** -0.1045***(0.0132) (0.0177)
$20-30K accum. capital * F&F -0.0621*** -0.1087***(0.0131) (0.0179)
$30-40K accum. capital * F&F -0.0737*** -0.1164***(0.0133) (0.0181)
$40-50K accum. capital * F&F -0.0734*** -0.1738***(0.0153) (0.0217)
Songs uploaded (lagged) -0.0018** -0.0017 -0.0021** -0.0016 -0.0021**(0.0009) (0.0027) (0.0010) (0.0027) (0.0010)
Investor proximate to Live Show 0.0123** 0.0164* -0.0058 0.0161* -0.0057(0.0055) (0.0087) (0.0164) (0.0088) (0.0164)
Weeks on Sellaband -0.0007** -0.0064*** -0.0003* -0.0062*** -0.0003*(0.0003) (0.0009) (0.0002) (0.0009) (0.0002)
Observations 402,666 64,044 338,622 64,044 338,622R-squared 0.014 0.048 0.014 0.050 0.015Number of group 9,451 1,085 8,366 1,085 8,366
Robust standard errors in parentheses*** p<0.01, ** p<0.05, * p<0.1
40
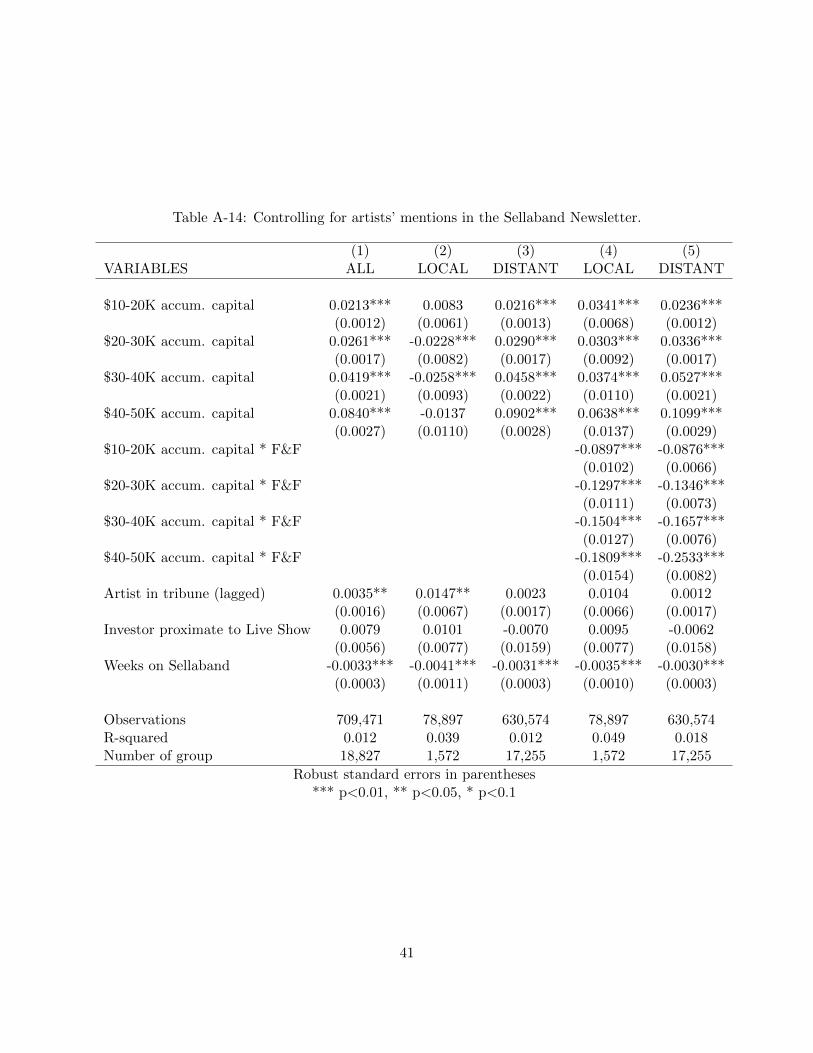
Table A-14: Controlling for artists’ mentions in the Sellaband Newsletter.
(1) (2) (3) (4) (5)VARIABLES ALL LOCAL DISTANT LOCAL DISTANT
$10-20K accum. capital 0.0213*** 0.0083 0.0216*** 0.0341*** 0.0236***(0.0012) (0.0061) (0.0013) (0.0068) (0.0012)
$20-30K accum. capital 0.0261*** -0.0228*** 0.0290*** 0.0303*** 0.0336***(0.0017) (0.0082) (0.0017) (0.0092) (0.0017)
$30-40K accum. capital 0.0419*** -0.0258*** 0.0458*** 0.0374*** 0.0527***(0.0021) (0.0093) (0.0022) (0.0110) (0.0021)
$40-50K accum. capital 0.0840*** -0.0137 0.0902*** 0.0638*** 0.1099***(0.0027) (0.0110) (0.0028) (0.0137) (0.0029)
$10-20K accum. capital * F&F -0.0897*** -0.0876***(0.0102) (0.0066)
$20-30K accum. capital * F&F -0.1297*** -0.1346***(0.0111) (0.0073)
$30-40K accum. capital * F&F -0.1504*** -0.1657***(0.0127) (0.0076)
$40-50K accum. capital * F&F -0.1809*** -0.2533***(0.0154) (0.0082)
Artist in tribune (lagged) 0.0035** 0.0147** 0.0023 0.0104 0.0012(0.0016) (0.0067) (0.0017) (0.0066) (0.0017)
Investor proximate to Live Show 0.0079 0.0101 -0.0070 0.0095 -0.0062(0.0056) (0.0077) (0.0159) (0.0077) (0.0158)
Weeks on Sellaband -0.0033*** -0.0041*** -0.0031*** -0.0035*** -0.0030***(0.0003) (0.0011) (0.0003) (0.0010) (0.0003)
Observations 709,471 78,897 630,574 78,897 630,574R-squared 0.012 0.039 0.012 0.049 0.018Number of group 18,827 1,572 17,255 1,572 17,255
Robust standard errors in parentheses*** p<0.01, ** p<0.05, * p<0.1
41
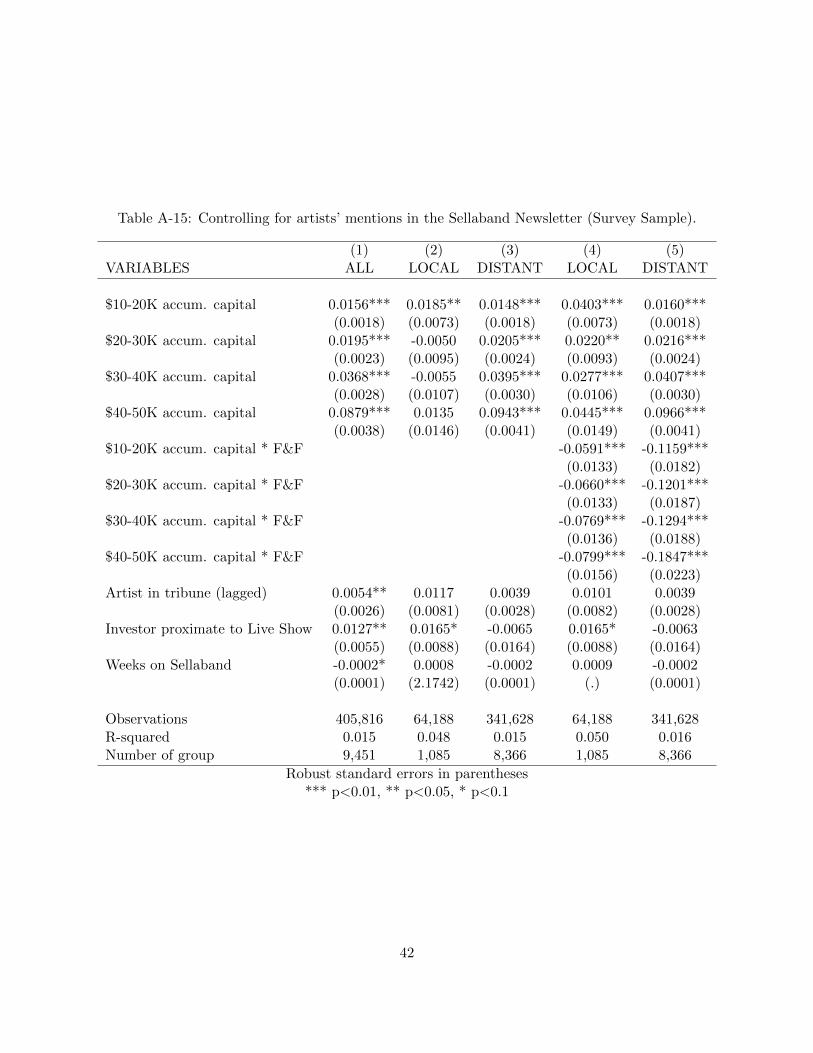
Table A-15: Controlling for artists’ mentions in the Sellaband Newsletter (Survey Sample).
(1) (2) (3) (4) (5)VARIABLES ALL LOCAL DISTANT LOCAL DISTANT
$10-20K accum. capital 0.0156*** 0.0185** 0.0148*** 0.0403*** 0.0160***(0.0018) (0.0073) (0.0018) (0.0073) (0.0018)
$20-30K accum. capital 0.0195*** -0.0050 0.0205*** 0.0220** 0.0216***(0.0023) (0.0095) (0.0024) (0.0093) (0.0024)
$30-40K accum. capital 0.0368*** -0.0055 0.0395*** 0.0277*** 0.0407***(0.0028) (0.0107) (0.0030) (0.0106) (0.0030)
$40-50K accum. capital 0.0879*** 0.0135 0.0943*** 0.0445*** 0.0966***(0.0038) (0.0146) (0.0041) (0.0149) (0.0041)
$10-20K accum. capital * F&F -0.0591*** -0.1159***(0.0133) (0.0182)
$20-30K accum. capital * F&F -0.0660*** -0.1201***(0.0133) (0.0187)
$30-40K accum. capital * F&F -0.0769*** -0.1294***(0.0136) (0.0188)
$40-50K accum. capital * F&F -0.0799*** -0.1847***(0.0156) (0.0223)
Artist in tribune (lagged) 0.0054** 0.0117 0.0039 0.0101 0.0039(0.0026) (0.0081) (0.0028) (0.0082) (0.0028)
Investor proximate to Live Show 0.0127** 0.0165* -0.0065 0.0165* -0.0063(0.0055) (0.0088) (0.0164) (0.0088) (0.0164)
Weeks on Sellaband -0.0002* 0.0008 -0.0002 0.0009 -0.0002(0.0001) (2.1742) (0.0001) (.) (0.0001)
Observations 405,816 64,188 341,628 64,188 341,628R-squared 0.015 0.048 0.015 0.050 0.016Number of group 9,451 1,085 8,366 1,085 8,366
Robust standard errors in parentheses*** p<0.01, ** p<0.05, * p<0.1
42
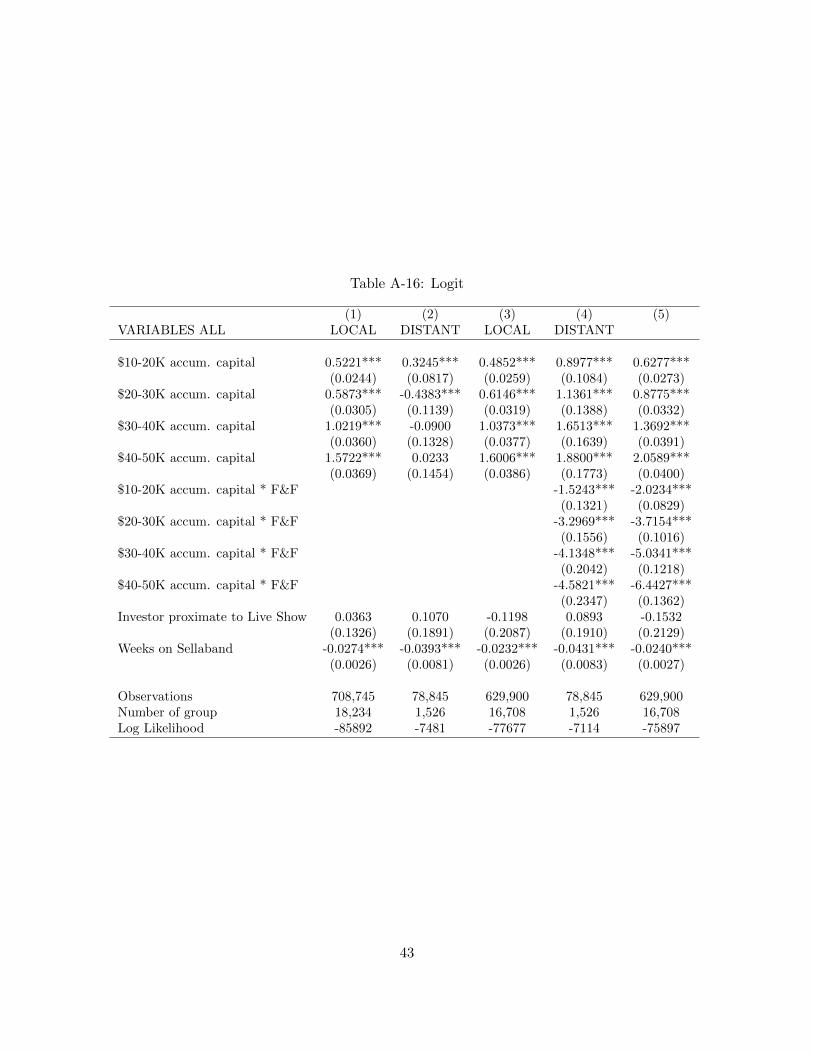
Table A-16: Logit
(1) (2) (3) (4) (5)VARIABLES ALL LOCAL DISTANT LOCAL DISTANT
$10-20K accum. capital 0.5221*** 0.3245*** 0.4852*** 0.8977*** 0.6277***(0.0244) (0.0817) (0.0259) (0.1084) (0.0273)
$20-30K accum. capital 0.5873*** -0.4383*** 0.6146*** 1.1361*** 0.8775***(0.0305) (0.1139) (0.0319) (0.1388) (0.0332)
$30-40K accum. capital 1.0219*** -0.0900 1.0373*** 1.6513*** 1.3692***(0.0360) (0.1328) (0.0377) (0.1639) (0.0391)
$40-50K accum. capital 1.5722*** 0.0233 1.6006*** 1.8800*** 2.0589***(0.0369) (0.1454) (0.0386) (0.1773) (0.0400)
$10-20K accum. capital * F&F -1.5243*** -2.0234***(0.1321) (0.0829)
$20-30K accum. capital * F&F -3.2969*** -3.7154***(0.1556) (0.1016)
$30-40K accum. capital * F&F -4.1348*** -5.0341***(0.2042) (0.1218)
$40-50K accum. capital * F&F -4.5821*** -6.4427***(0.2347) (0.1362)
Investor proximate to Live Show 0.0363 0.1070 -0.1198 0.0893 -0.1532(0.1326) (0.1891) (0.2087) (0.1910) (0.2129)
Weeks on Sellaband -0.0274*** -0.0393*** -0.0232*** -0.0431*** -0.0240***(0.0026) (0.0081) (0.0026) (0.0083) (0.0027)
Observations 708,745 78,845 629,900 78,845 629,900Number of group 18,234 1,526 16,708 1,526 16,708Log Likelihood -85892 -7481 -77677 -7114 -75897
43
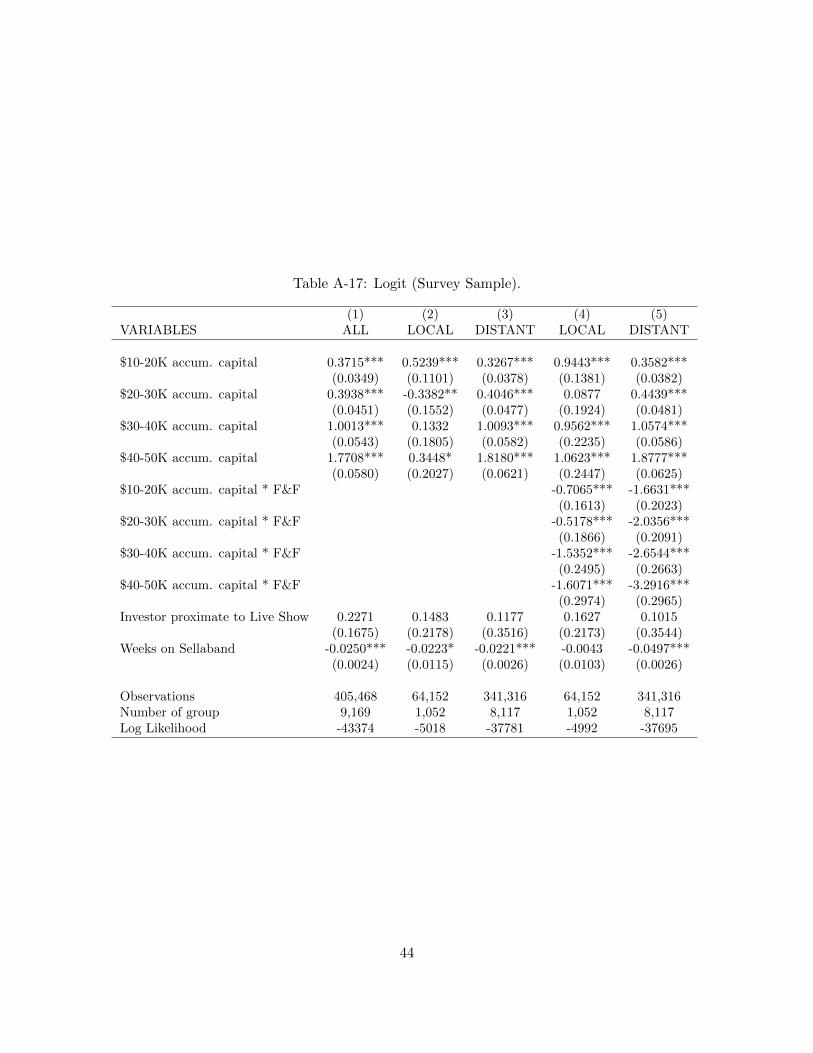
Table A-17: Logit (Survey Sample).
(1) (2) (3) (4) (5)VARIABLES ALL LOCAL DISTANT LOCAL DISTANT
$10-20K accum. capital 0.3715*** 0.5239*** 0.3267*** 0.9443*** 0.3582***(0.0349) (0.1101) (0.0378) (0.1381) (0.0382)
$20-30K accum. capital 0.3938*** -0.3382** 0.4046*** 0.0877 0.4439***(0.0451) (0.1552) (0.0477) (0.1924) (0.0481)
$30-40K accum. capital 1.0013*** 0.1332 1.0093*** 0.9562*** 1.0574***(0.0543) (0.1805) (0.0582) (0.2235) (0.0586)
$40-50K accum. capital 1.7708*** 0.3448* 1.8180*** 1.0623*** 1.8777***(0.0580) (0.2027) (0.0621) (0.2447) (0.0625)
$10-20K accum. capital * F&F -0.7065*** -1.6631***(0.1613) (0.2023)
$20-30K accum. capital * F&F -0.5178*** -2.0356***(0.1866) (0.2091)
$30-40K accum. capital * F&F -1.5352*** -2.6544***(0.2495) (0.2663)
$40-50K accum. capital * F&F -1.6071*** -3.2916***(0.2974) (0.2965)
Investor proximate to Live Show 0.2271 0.1483 0.1177 0.1627 0.1015(0.1675) (0.2178) (0.3516) (0.2173) (0.3544)
Weeks on Sellaband -0.0250*** -0.0223* -0.0221*** -0.0043 -0.0497***(0.0024) (0.0115) (0.0026) (0.0103) (0.0026)
Observations 405,468 64,152 341,316 64,152 341,316Number of group 9,169 1,052 8,117 1,052 8,117Log Likelihood -43374 -5018 -37781 -4992 -37695
44
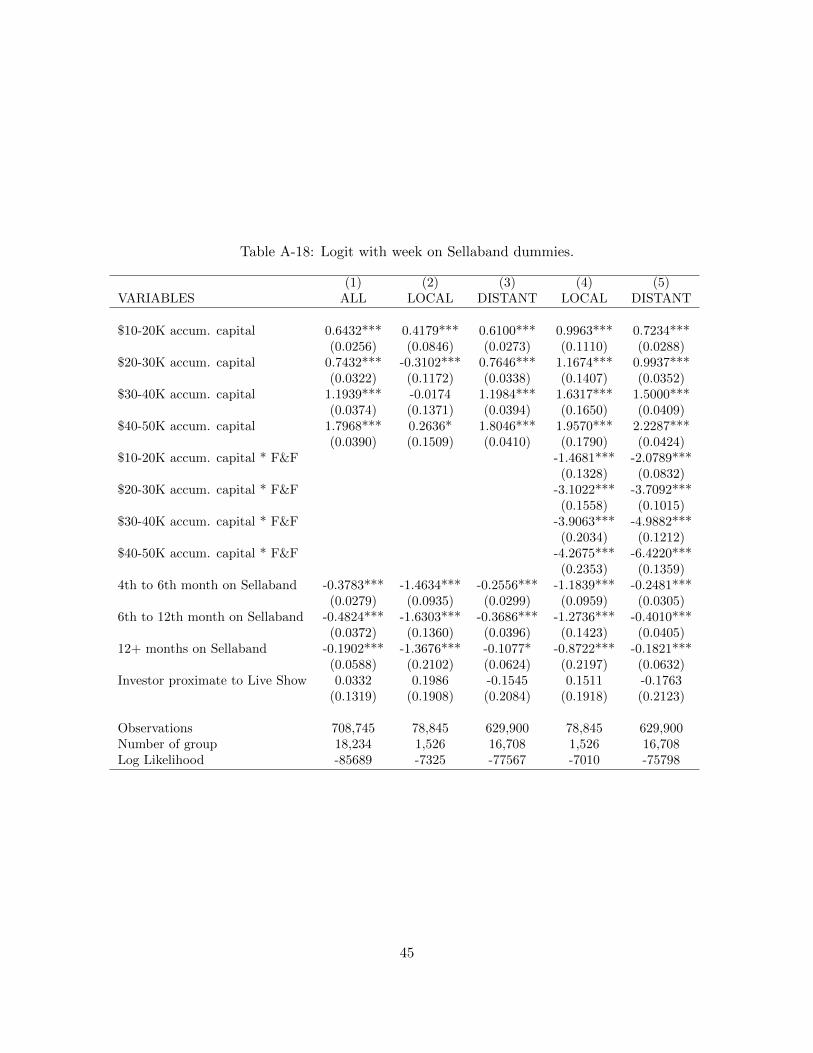
Table A-18: Logit with week on Sellaband dummies.
(1) (2) (3) (4) (5)VARIABLES ALL LOCAL DISTANT LOCAL DISTANT
$10-20K accum. capital 0.6432*** 0.4179*** 0.6100*** 0.9963*** 0.7234***(0.0256) (0.0846) (0.0273) (0.1110) (0.0288)
$20-30K accum. capital 0.7432*** -0.3102*** 0.7646*** 1.1674*** 0.9937***(0.0322) (0.1172) (0.0338) (0.1407) (0.0352)
$30-40K accum. capital 1.1939*** -0.0174 1.1984*** 1.6317*** 1.5000***(0.0374) (0.1371) (0.0394) (0.1650) (0.0409)
$40-50K accum. capital 1.7968*** 0.2636* 1.8046*** 1.9570*** 2.2287***(0.0390) (0.1509) (0.0410) (0.1790) (0.0424)
$10-20K accum. capital * F&F -1.4681*** -2.0789***(0.1328) (0.0832)
$20-30K accum. capital * F&F -3.1022*** -3.7092***(0.1558) (0.1015)
$30-40K accum. capital * F&F -3.9063*** -4.9882***(0.2034) (0.1212)
$40-50K accum. capital * F&F -4.2675*** -6.4220***(0.2353) (0.1359)
4th to 6th month on Sellaband -0.3783*** -1.4634*** -0.2556*** -1.1839*** -0.2481***(0.0279) (0.0935) (0.0299) (0.0959) (0.0305)
6th to 12th month on Sellaband -0.4824*** -1.6303*** -0.3686*** -1.2736*** -0.4010***(0.0372) (0.1360) (0.0396) (0.1423) (0.0405)
12+ months on Sellaband -0.1902*** -1.3676*** -0.1077* -0.8722*** -0.1821***(0.0588) (0.2102) (0.0624) (0.2197) (0.0632)
Investor proximate to Live Show 0.0332 0.1986 -0.1545 0.1511 -0.1763(0.1319) (0.1908) (0.2084) (0.1918) (0.2123)
Observations 708,745 78,845 629,900 78,845 629,900Number of group 18,234 1,526 16,708 1,526 16,708Log Likelihood -85689 -7325 -77567 -7010 -75798
45
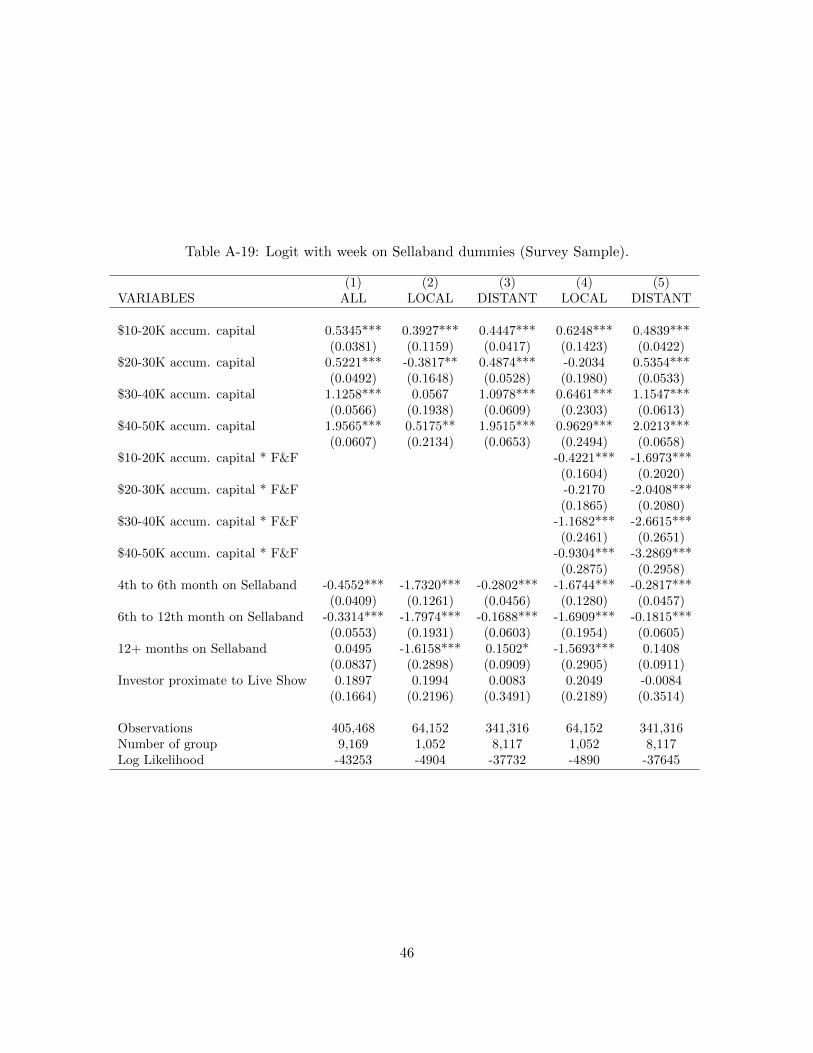
Table A-19: Logit with week on Sellaband dummies (Survey Sample).
(1) (2) (3) (4) (5)VARIABLES ALL LOCAL DISTANT LOCAL DISTANT
$10-20K accum. capital 0.5345*** 0.3927*** 0.4447*** 0.6248*** 0.4839***(0.0381) (0.1159) (0.0417) (0.1423) (0.0422)
$20-30K accum. capital 0.5221*** -0.3817** 0.4874*** -0.2034 0.5354***(0.0492) (0.1648) (0.0528) (0.1980) (0.0533)
$30-40K accum. capital 1.1258*** 0.0567 1.0978*** 0.6461*** 1.1547***(0.0566) (0.1938) (0.0609) (0.2303) (0.0613)
$40-50K accum. capital 1.9565*** 0.5175** 1.9515*** 0.9629*** 2.0213***(0.0607) (0.2134) (0.0653) (0.2494) (0.0658)
$10-20K accum. capital * F&F -0.4221*** -1.6973***(0.1604) (0.2020)
$20-30K accum. capital * F&F -0.2170 -2.0408***(0.1865) (0.2080)
$30-40K accum. capital * F&F -1.1682*** -2.6615***(0.2461) (0.2651)
$40-50K accum. capital * F&F -0.9304*** -3.2869***(0.2875) (0.2958)
4th to 6th month on Sellaband -0.4552*** -1.7320*** -0.2802*** -1.6744*** -0.2817***(0.0409) (0.1261) (0.0456) (0.1280) (0.0457)
6th to 12th month on Sellaband -0.3314*** -1.7974*** -0.1688*** -1.6909*** -0.1815***(0.0553) (0.1931) (0.0603) (0.1954) (0.0605)
12+ months on Sellaband 0.0495 -1.6158*** 0.1502* -1.5693*** 0.1408(0.0837) (0.2898) (0.0909) (0.2905) (0.0911)
Investor proximate to Live Show 0.1897 0.1994 0.0083 0.2049 -0.0084(0.1664) (0.2196) (0.3491) (0.2189) (0.3514)
Observations 405,468 64,152 341,316 64,152 341,316Number of group 9,169 1,052 8,117 1,052 8,117Log Likelihood -43253 -4904 -37732 -4890 -37645
46
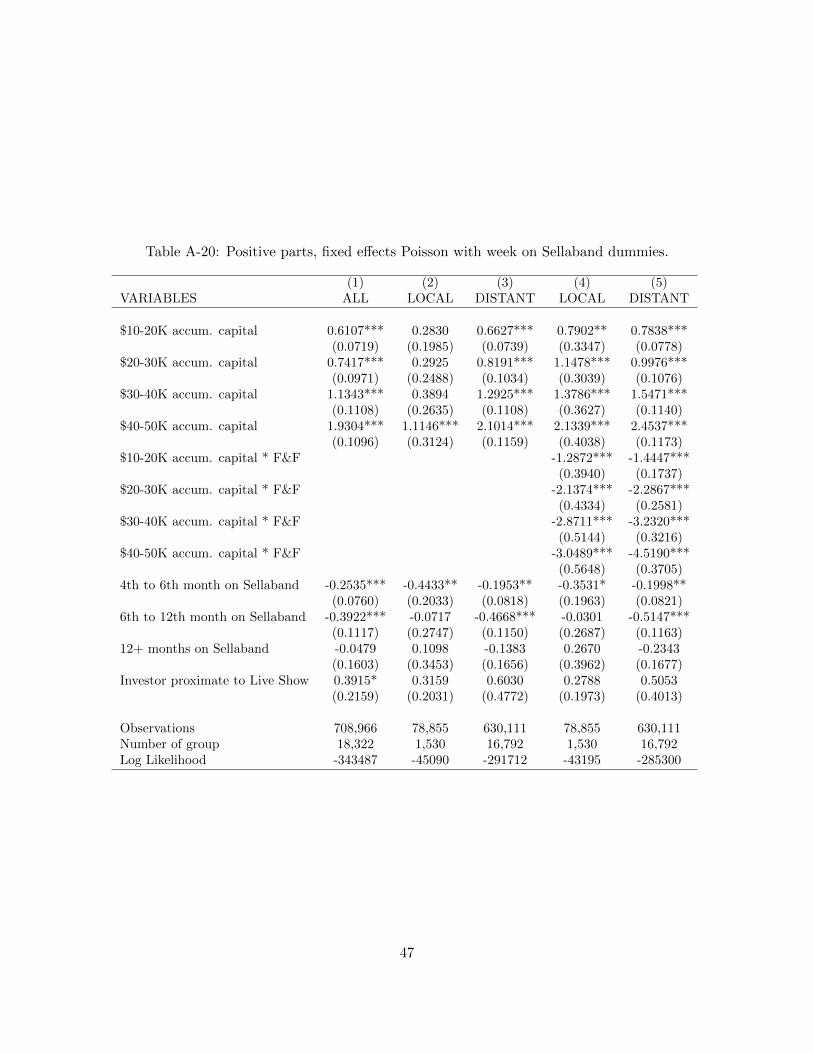
Table A-20: Positive parts, fixed effects Poisson with week on Sellaband dummies.
(1) (2) (3) (4) (5)VARIABLES ALL LOCAL DISTANT LOCAL DISTANT
$10-20K accum. capital 0.6107*** 0.2830 0.6627*** 0.7902** 0.7838***(0.0719) (0.1985) (0.0739) (0.3347) (0.0778)
$20-30K accum. capital 0.7417*** 0.2925 0.8191*** 1.1478*** 0.9976***(0.0971) (0.2488) (0.1034) (0.3039) (0.1076)
$30-40K accum. capital 1.1343*** 0.3894 1.2925*** 1.3786*** 1.5471***(0.1108) (0.2635) (0.1108) (0.3627) (0.1140)
$40-50K accum. capital 1.9304*** 1.1146*** 2.1014*** 2.1339*** 2.4537***(0.1096) (0.3124) (0.1159) (0.4038) (0.1173)
$10-20K accum. capital * F&F -1.2872*** -1.4447***(0.3940) (0.1737)
$20-30K accum. capital * F&F -2.1374*** -2.2867***(0.4334) (0.2581)
$30-40K accum. capital * F&F -2.8711*** -3.2320***(0.5144) (0.3216)
$40-50K accum. capital * F&F -3.0489*** -4.5190***(0.5648) (0.3705)
4th to 6th month on Sellaband -0.2535*** -0.4433** -0.1953** -0.3531* -0.1998**(0.0760) (0.2033) (0.0818) (0.1963) (0.0821)
6th to 12th month on Sellaband -0.3922*** -0.0717 -0.4668*** -0.0301 -0.5147***(0.1117) (0.2747) (0.1150) (0.2687) (0.1163)
12+ months on Sellaband -0.0479 0.1098 -0.1383 0.2670 -0.2343(0.1603) (0.3453) (0.1656) (0.3962) (0.1677)
Investor proximate to Live Show 0.3915* 0.3159 0.6030 0.2788 0.5053(0.2159) (0.2031) (0.4772) (0.1973) (0.4013)
Observations 708,966 78,855 630,111 78,855 630,111Number of group 18,322 1,530 16,792 1,530 16,792Log Likelihood -343487 -45090 -291712 -43195 -285300
47
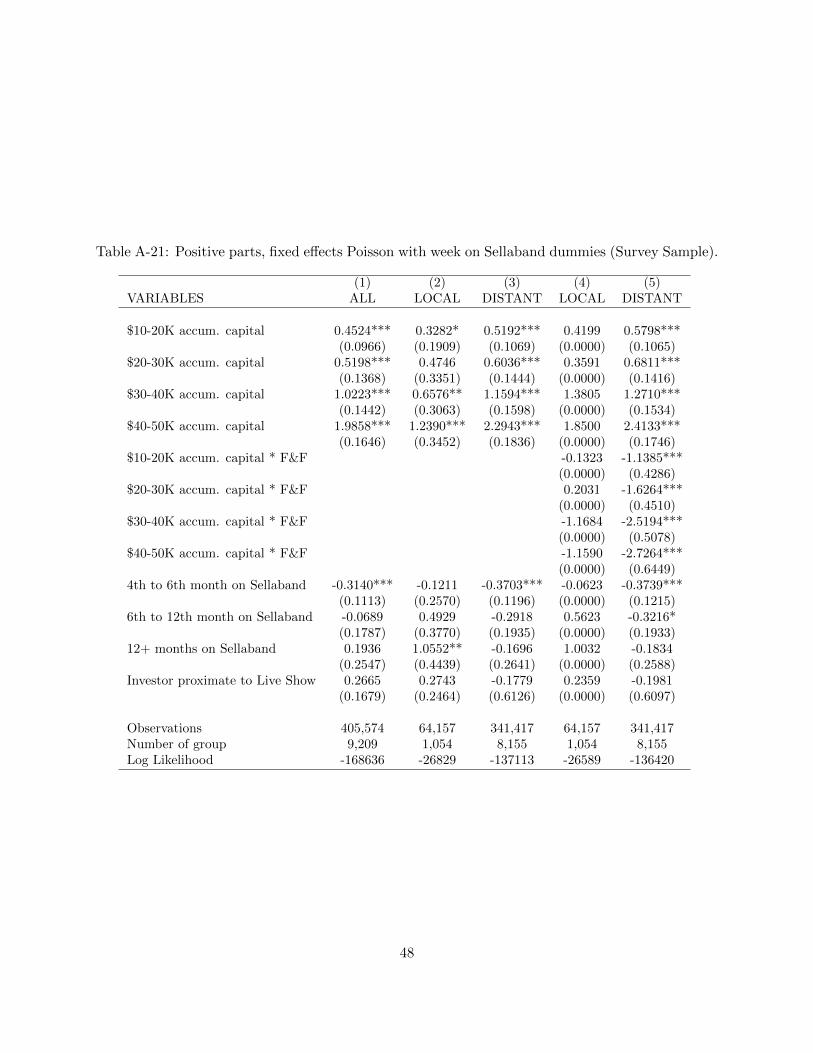
Table A-21: Positive parts, fixed effects Poisson with week on Sellaband dummies (Survey Sample).
(1) (2) (3) (4) (5)VARIABLES ALL LOCAL DISTANT LOCAL DISTANT
$10-20K accum. capital 0.4524*** 0.3282* 0.5192*** 0.4199 0.5798***(0.0966) (0.1909) (0.1069) (0.0000) (0.1065)
$20-30K accum. capital 0.5198*** 0.4746 0.6036*** 0.3591 0.6811***(0.1368) (0.3351) (0.1444) (0.0000) (0.1416)
$30-40K accum. capital 1.0223*** 0.6576** 1.1594*** 1.3805 1.2710***(0.1442) (0.3063) (0.1598) (0.0000) (0.1534)
$40-50K accum. capital 1.9858*** 1.2390*** 2.2943*** 1.8500 2.4133***(0.1646) (0.3452) (0.1836) (0.0000) (0.1746)
$10-20K accum. capital * F&F -0.1323 -1.1385***(0.0000) (0.4286)
$20-30K accum. capital * F&F 0.2031 -1.6264***(0.0000) (0.4510)
$30-40K accum. capital * F&F -1.1684 -2.5194***(0.0000) (0.5078)
$40-50K accum. capital * F&F -1.1590 -2.7264***(0.0000) (0.6449)
4th to 6th month on Sellaband -0.3140*** -0.1211 -0.3703*** -0.0623 -0.3739***(0.1113) (0.2570) (0.1196) (0.0000) (0.1215)
6th to 12th month on Sellaband -0.0689 0.4929 -0.2918 0.5623 -0.3216*(0.1787) (0.3770) (0.1935) (0.0000) (0.1933)
12+ months on Sellaband 0.1936 1.0552** -0.1696 1.0032 -0.1834(0.2547) (0.4439) (0.2641) (0.0000) (0.2588)
Investor proximate to Live Show 0.2665 0.2743 -0.1779 0.2359 -0.1981(0.1679) (0.2464) (0.6126) (0.0000) (0.6097)
Observations 405,574 64,157 341,417 64,157 341,417Number of group 9,209 1,054 8,155 1,054 8,155Log Likelihood -168636 -26829 -137113 -26589 -136420
48
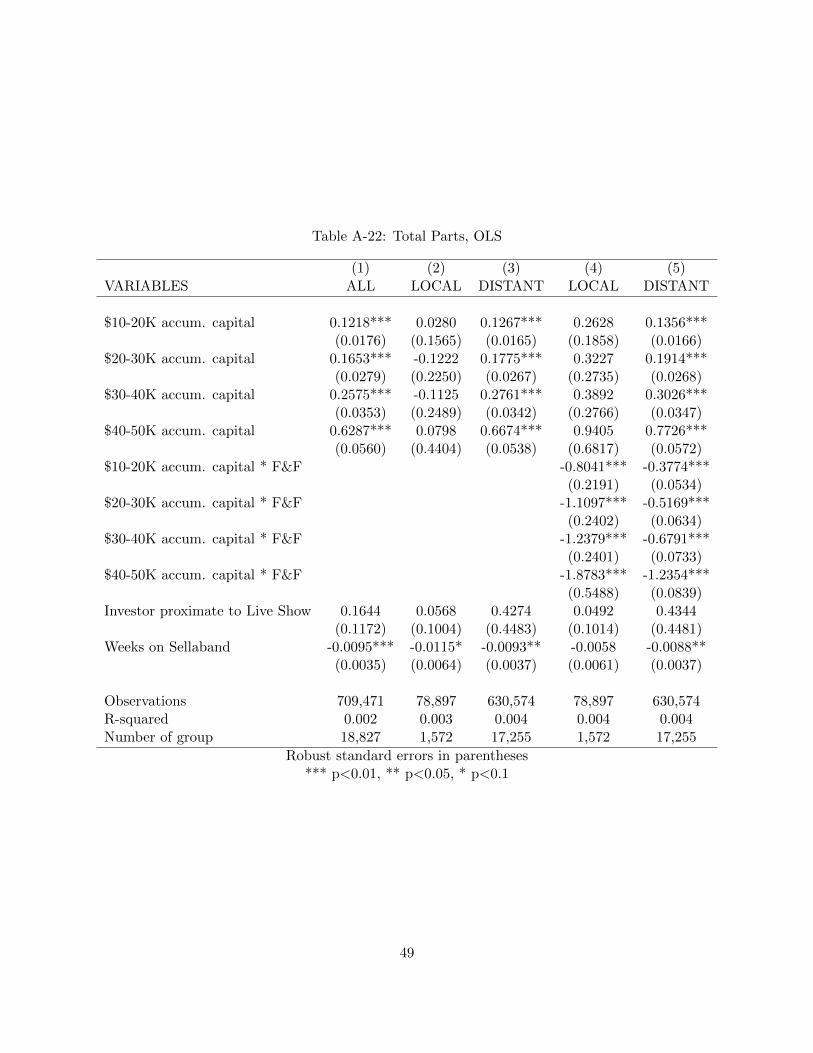
Table A-22: Total Parts, OLS
(1) (2) (3) (4) (5)VARIABLES ALL LOCAL DISTANT LOCAL DISTANT
$10-20K accum. capital 0.1218*** 0.0280 0.1267*** 0.2628 0.1356***(0.0176) (0.1565) (0.0165) (0.1858) (0.0166)
$20-30K accum. capital 0.1653*** -0.1222 0.1775*** 0.3227 0.1914***(0.0279) (0.2250) (0.0267) (0.2735) (0.0268)
$30-40K accum. capital 0.2575*** -0.1125 0.2761*** 0.3892 0.3026***(0.0353) (0.2489) (0.0342) (0.2766) (0.0347)
$40-50K accum. capital 0.6287*** 0.0798 0.6674*** 0.9405 0.7726***(0.0560) (0.4404) (0.0538) (0.6817) (0.0572)
$10-20K accum. capital * F&F -0.8041*** -0.3774***(0.2191) (0.0534)
$20-30K accum. capital * F&F -1.1097*** -0.5169***(0.2402) (0.0634)
$30-40K accum. capital * F&F -1.2379*** -0.6791***(0.2401) (0.0733)
$40-50K accum. capital * F&F -1.8783*** -1.2354***(0.5488) (0.0839)
Investor proximate to Live Show 0.1644 0.0568 0.4274 0.0492 0.4344(0.1172) (0.1004) (0.4483) (0.1014) (0.4481)
Weeks on Sellaband -0.0095*** -0.0115* -0.0093** -0.0058 -0.0088**(0.0035) (0.0064) (0.0037) (0.0061) (0.0037)
Observations 709,471 78,897 630,574 78,897 630,574R-squared 0.002 0.003 0.004 0.004 0.004Number of group 18,827 1,572 17,255 1,572 17,255
Robust standard errors in parentheses*** p<0.01, ** p<0.05, * p<0.1
49
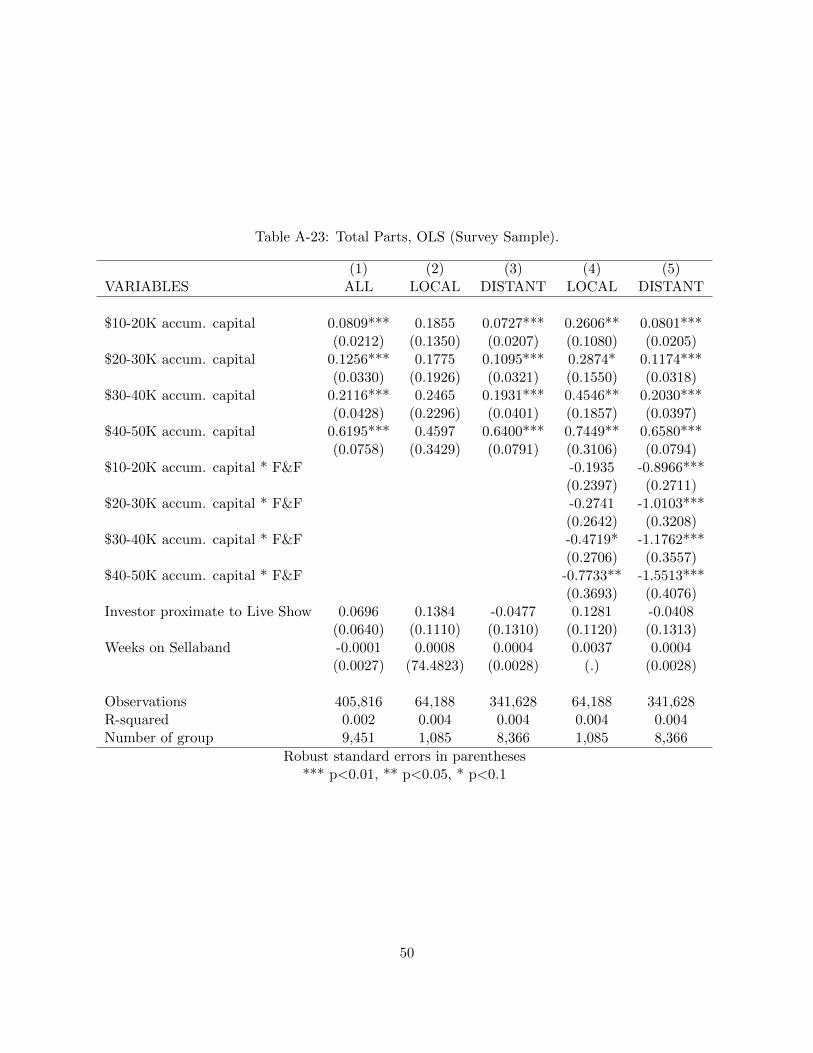
Table A-23: Total Parts, OLS (Survey Sample).
(1) (2) (3) (4) (5)VARIABLES ALL LOCAL DISTANT LOCAL DISTANT
$10-20K accum. capital 0.0809*** 0.1855 0.0727*** 0.2606** 0.0801***(0.0212) (0.1350) (0.0207) (0.1080) (0.0205)
$20-30K accum. capital 0.1256*** 0.1775 0.1095*** 0.2874* 0.1174***(0.0330) (0.1926) (0.0321) (0.1550) (0.0318)
$30-40K accum. capital 0.2116*** 0.2465 0.1931*** 0.4546** 0.2030***(0.0428) (0.2296) (0.0401) (0.1857) (0.0397)
$40-50K accum. capital 0.6195*** 0.4597 0.6400*** 0.7449** 0.6580***(0.0758) (0.3429) (0.0791) (0.3106) (0.0794)
$10-20K accum. capital * F&F -0.1935 -0.8966***(0.2397) (0.2711)
$20-30K accum. capital * F&F -0.2741 -1.0103***(0.2642) (0.3208)
$30-40K accum. capital * F&F -0.4719* -1.1762***(0.2706) (0.3557)
$40-50K accum. capital * F&F -0.7733** -1.5513***(0.3693) (0.4076)
Investor proximate to Live Show 0.0696 0.1384 -0.0477 0.1281 -0.0408(0.0640) (0.1110) (0.1310) (0.1120) (0.1313)
Weeks on Sellaband -0.0001 0.0008 0.0004 0.0037 0.0004(0.0027) (74.4823) (0.0028) (.) (0.0028)
Observations 405,816 64,188 341,628 64,188 341,628R-squared 0.002 0.004 0.004 0.004 0.004Number of group 9,451 1,085 8,366 1,085 8,366
Robust standard errors in parentheses*** p<0.01, ** p<0.05, * p<0.1
50
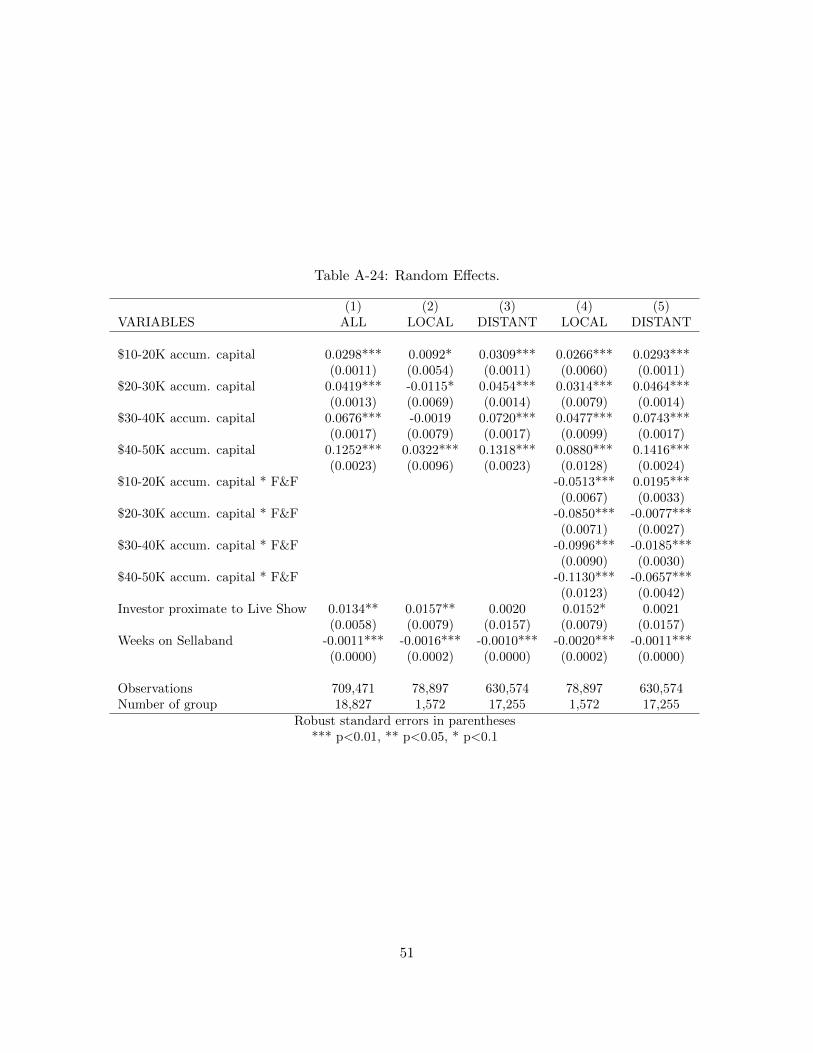
Table A-24: Random Effects.
(1) (2) (3) (4) (5)VARIABLES ALL LOCAL DISTANT LOCAL DISTANT
$10-20K accum. capital 0.0298*** 0.0092* 0.0309*** 0.0266*** 0.0293***(0.0011) (0.0054) (0.0011) (0.0060) (0.0011)
$20-30K accum. capital 0.0419*** -0.0115* 0.0454*** 0.0314*** 0.0464***(0.0013) (0.0069) (0.0014) (0.0079) (0.0014)
$30-40K accum. capital 0.0676*** -0.0019 0.0720*** 0.0477*** 0.0743***(0.0017) (0.0079) (0.0017) (0.0099) (0.0017)
$40-50K accum. capital 0.1252*** 0.0322*** 0.1318*** 0.0880*** 0.1416***(0.0023) (0.0096) (0.0023) (0.0128) (0.0024)
$10-20K accum. capital * F&F -0.0513*** 0.0195***(0.0067) (0.0033)
$20-30K accum. capital * F&F -0.0850*** -0.0077***(0.0071) (0.0027)
$30-40K accum. capital * F&F -0.0996*** -0.0185***(0.0090) (0.0030)
$40-50K accum. capital * F&F -0.1130*** -0.0657***(0.0123) (0.0042)
Investor proximate to Live Show 0.0134** 0.0157** 0.0020 0.0152* 0.0021(0.0058) (0.0079) (0.0157) (0.0079) (0.0157)
Weeks on Sellaband -0.0011*** -0.0016*** -0.0010*** -0.0020*** -0.0011***(0.0000) (0.0002) (0.0000) (0.0002) (0.0000)
Observations 709,471 78,897 630,574 78,897 630,574Number of group 18,827 1,572 17,255 1,572 17,255
Robust standard errors in parentheses*** p<0.01, ** p<0.05, * p<0.1
51
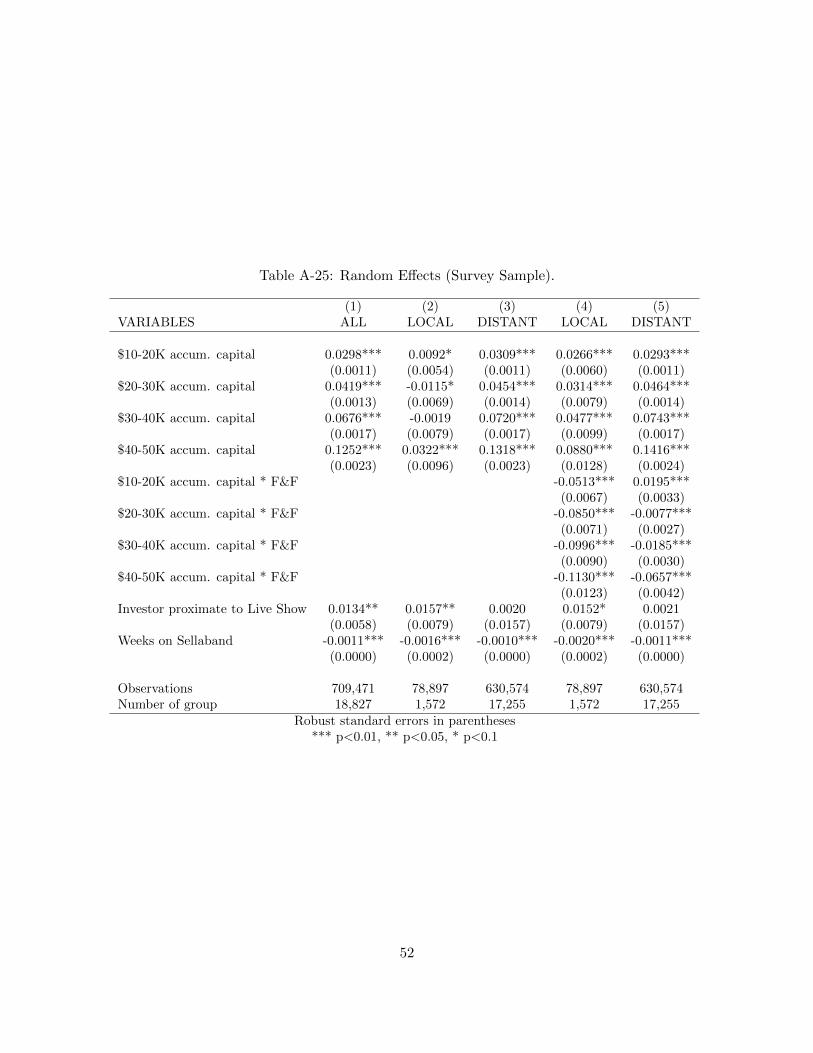
Table A-25: Random Effects (Survey Sample).
(1) (2) (3) (4) (5)VARIABLES ALL LOCAL DISTANT LOCAL DISTANT
$10-20K accum. capital 0.0298*** 0.0092* 0.0309*** 0.0266*** 0.0293***(0.0011) (0.0054) (0.0011) (0.0060) (0.0011)
$20-30K accum. capital 0.0419*** -0.0115* 0.0454*** 0.0314*** 0.0464***(0.0013) (0.0069) (0.0014) (0.0079) (0.0014)
$30-40K accum. capital 0.0676*** -0.0019 0.0720*** 0.0477*** 0.0743***(0.0017) (0.0079) (0.0017) (0.0099) (0.0017)
$40-50K accum. capital 0.1252*** 0.0322*** 0.1318*** 0.0880*** 0.1416***(0.0023) (0.0096) (0.0023) (0.0128) (0.0024)
$10-20K accum. capital * F&F -0.0513*** 0.0195***(0.0067) (0.0033)
$20-30K accum. capital * F&F -0.0850*** -0.0077***(0.0071) (0.0027)
$30-40K accum. capital * F&F -0.0996*** -0.0185***(0.0090) (0.0030)
$40-50K accum. capital * F&F -0.1130*** -0.0657***(0.0123) (0.0042)
Investor proximate to Live Show 0.0134** 0.0157** 0.0020 0.0152* 0.0021(0.0058) (0.0079) (0.0157) (0.0079) (0.0157)
Weeks on Sellaband -0.0011*** -0.0016*** -0.0010*** -0.0020*** -0.0011***(0.0000) (0.0002) (0.0000) (0.0002) (0.0000)
Observations 709,471 78,897 630,574 78,897 630,574Number of group 18,827 1,572 17,255 1,572 17,255
Robust standard errors in parentheses*** p<0.01, ** p<0.05, * p<0.1
52
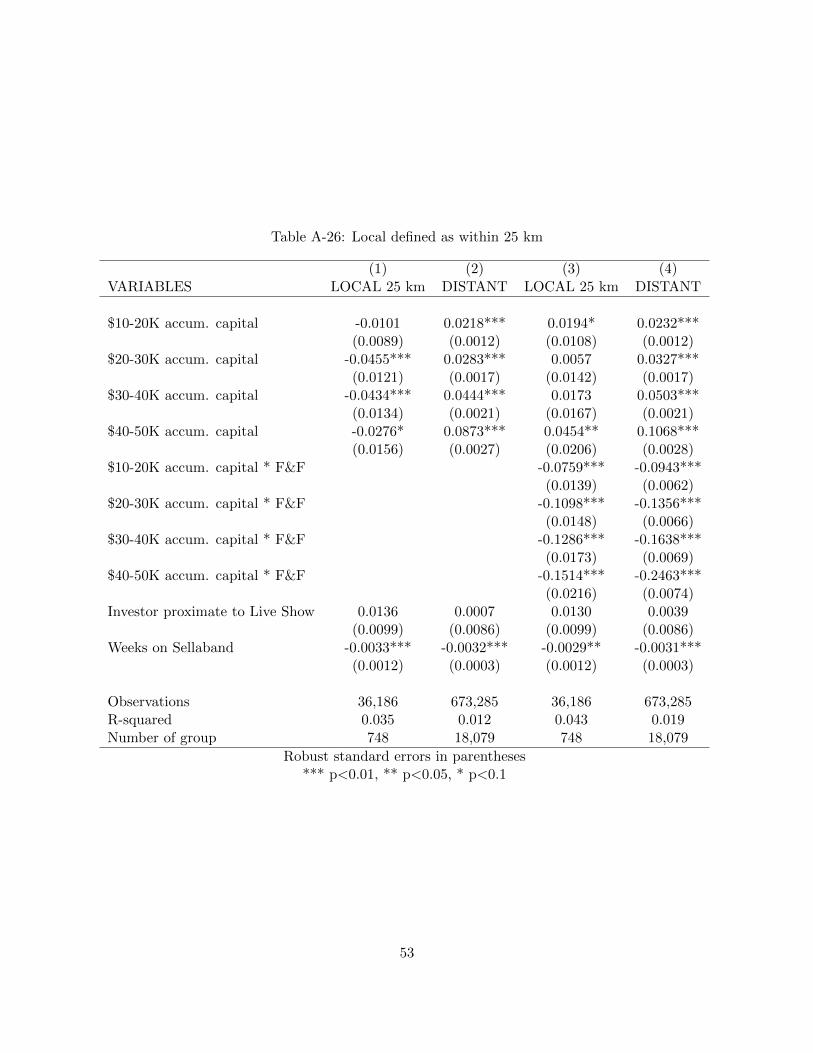
Table A-26: Local defined as within 25 km
(1) (2) (3) (4)VARIABLES LOCAL 25 km DISTANT LOCAL 25 km DISTANT
$10-20K accum. capital -0.0101 0.0218*** 0.0194* 0.0232***(0.0089) (0.0012) (0.0108) (0.0012)
$20-30K accum. capital -0.0455*** 0.0283*** 0.0057 0.0327***(0.0121) (0.0017) (0.0142) (0.0017)
$30-40K accum. capital -0.0434*** 0.0444*** 0.0173 0.0503***(0.0134) (0.0021) (0.0167) (0.0021)
$40-50K accum. capital -0.0276* 0.0873*** 0.0454** 0.1068***(0.0156) (0.0027) (0.0206) (0.0028)
$10-20K accum. capital * F&F -0.0759*** -0.0943***(0.0139) (0.0062)
$20-30K accum. capital * F&F -0.1098*** -0.1356***(0.0148) (0.0066)
$30-40K accum. capital * F&F -0.1286*** -0.1638***(0.0173) (0.0069)
$40-50K accum. capital * F&F -0.1514*** -0.2463***(0.0216) (0.0074)
Investor proximate to Live Show 0.0136 0.0007 0.0130 0.0039(0.0099) (0.0086) (0.0099) (0.0086)
Weeks on Sellaband -0.0033*** -0.0032*** -0.0029** -0.0031***(0.0012) (0.0003) (0.0012) (0.0003)
Observations 36,186 673,285 36,186 673,285R-squared 0.035 0.012 0.043 0.019Number of group 748 18,079 748 18,079
Robust standard errors in parentheses*** p<0.01, ** p<0.05, * p<0.1
53
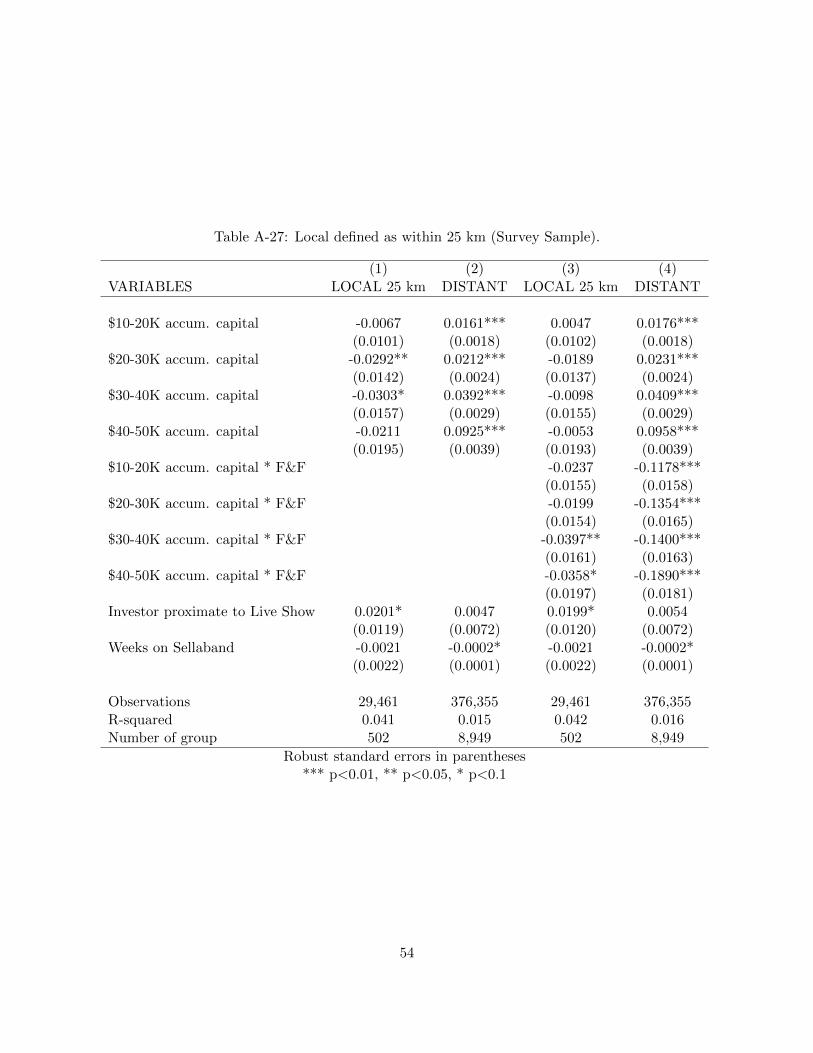
Table A-27: Local defined as within 25 km (Survey Sample).
(1) (2) (3) (4)VARIABLES LOCAL 25 km DISTANT LOCAL 25 km DISTANT
$10-20K accum. capital -0.0067 0.0161*** 0.0047 0.0176***(0.0101) (0.0018) (0.0102) (0.0018)
$20-30K accum. capital -0.0292** 0.0212*** -0.0189 0.0231***(0.0142) (0.0024) (0.0137) (0.0024)
$30-40K accum. capital -0.0303* 0.0392*** -0.0098 0.0409***(0.0157) (0.0029) (0.0155) (0.0029)
$40-50K accum. capital -0.0211 0.0925*** -0.0053 0.0958***(0.0195) (0.0039) (0.0193) (0.0039)
$10-20K accum. capital * F&F -0.0237 -0.1178***(0.0155) (0.0158)
$20-30K accum. capital * F&F -0.0199 -0.1354***(0.0154) (0.0165)
$30-40K accum. capital * F&F -0.0397** -0.1400***(0.0161) (0.0163)
$40-50K accum. capital * F&F -0.0358* -0.1890***(0.0197) (0.0181)
Investor proximate to Live Show 0.0201* 0.0047 0.0199* 0.0054(0.0119) (0.0072) (0.0120) (0.0072)
Weeks on Sellaband -0.0021 -0.0002* -0.0021 -0.0002*(0.0022) (0.0001) (0.0022) (0.0001)
Observations 29,461 376,355 29,461 376,355R-squared 0.041 0.015 0.042 0.016Number of group 502 8,949 502 8,949
Robust standard errors in parentheses*** p<0.01, ** p<0.05, * p<0.1
54
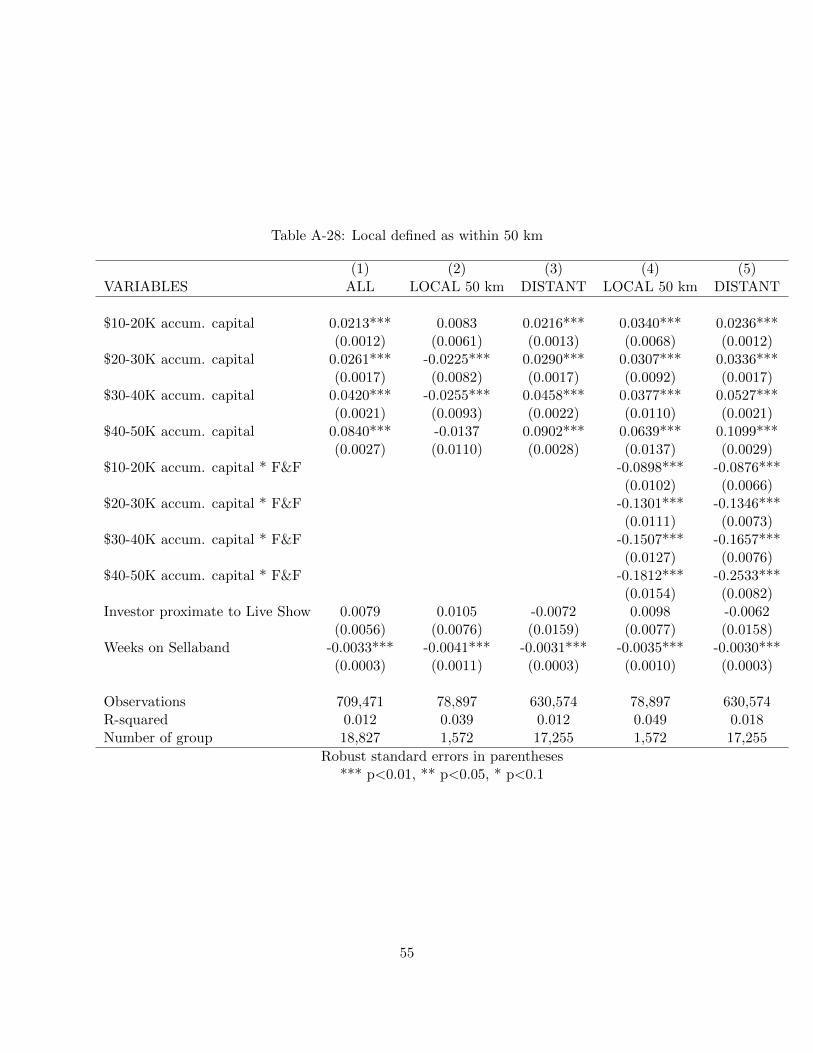
Table A-28: Local defined as within 50 km
(1) (2) (3) (4) (5)VARIABLES ALL LOCAL 50 km DISTANT LOCAL 50 km DISTANT
$10-20K accum. capital 0.0213*** 0.0083 0.0216*** 0.0340*** 0.0236***(0.0012) (0.0061) (0.0013) (0.0068) (0.0012)
$20-30K accum. capital 0.0261*** -0.0225*** 0.0290*** 0.0307*** 0.0336***(0.0017) (0.0082) (0.0017) (0.0092) (0.0017)
$30-40K accum. capital 0.0420*** -0.0255*** 0.0458*** 0.0377*** 0.0527***(0.0021) (0.0093) (0.0022) (0.0110) (0.0021)
$40-50K accum. capital 0.0840*** -0.0137 0.0902*** 0.0639*** 0.1099***(0.0027) (0.0110) (0.0028) (0.0137) (0.0029)
$10-20K accum. capital * F&F -0.0898*** -0.0876***(0.0102) (0.0066)
$20-30K accum. capital * F&F -0.1301*** -0.1346***(0.0111) (0.0073)
$30-40K accum. capital * F&F -0.1507*** -0.1657***(0.0127) (0.0076)
$40-50K accum. capital * F&F -0.1812*** -0.2533***(0.0154) (0.0082)
Investor proximate to Live Show 0.0079 0.0105 -0.0072 0.0098 -0.0062(0.0056) (0.0076) (0.0159) (0.0077) (0.0158)
Weeks on Sellaband -0.0033*** -0.0041*** -0.0031*** -0.0035*** -0.0030***(0.0003) (0.0011) (0.0003) (0.0010) (0.0003)
Observations 709,471 78,897 630,574 78,897 630,574R-squared 0.012 0.039 0.012 0.049 0.018Number of group 18,827 1,572 17,255 1,572 17,255
Robust standard errors in parentheses*** p<0.01, ** p<0.05, * p<0.1
55
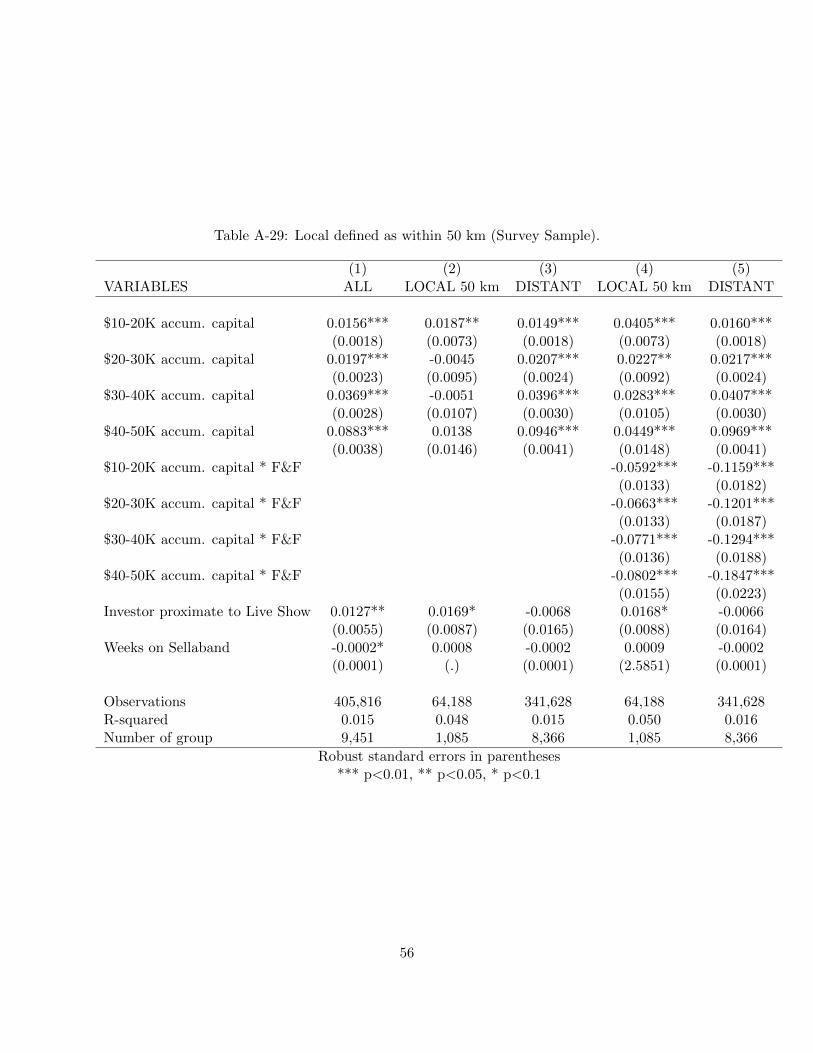
Table A-29: Local defined as within 50 km (Survey Sample).
(1) (2) (3) (4) (5)VARIABLES ALL LOCAL 50 km DISTANT LOCAL 50 km DISTANT
$10-20K accum. capital 0.0156*** 0.0187** 0.0149*** 0.0405*** 0.0160***(0.0018) (0.0073) (0.0018) (0.0073) (0.0018)
$20-30K accum. capital 0.0197*** -0.0045 0.0207*** 0.0227** 0.0217***(0.0023) (0.0095) (0.0024) (0.0092) (0.0024)
$30-40K accum. capital 0.0369*** -0.0051 0.0396*** 0.0283*** 0.0407***(0.0028) (0.0107) (0.0030) (0.0105) (0.0030)
$40-50K accum. capital 0.0883*** 0.0138 0.0946*** 0.0449*** 0.0969***(0.0038) (0.0146) (0.0041) (0.0148) (0.0041)
$10-20K accum. capital * F&F -0.0592*** -0.1159***(0.0133) (0.0182)
$20-30K accum. capital * F&F -0.0663*** -0.1201***(0.0133) (0.0187)
$30-40K accum. capital * F&F -0.0771*** -0.1294***(0.0136) (0.0188)
$40-50K accum. capital * F&F -0.0802*** -0.1847***(0.0155) (0.0223)
Investor proximate to Live Show 0.0127** 0.0169* -0.0068 0.0168* -0.0066(0.0055) (0.0087) (0.0165) (0.0088) (0.0164)
Weeks on Sellaband -0.0002* 0.0008 -0.0002 0.0009 -0.0002(0.0001) (.) (0.0001) (2.5851) (0.0001)
Observations 405,816 64,188 341,628 64,188 341,628R-squared 0.015 0.048 0.015 0.050 0.016Number of group 9,451 1,085 8,366 1,085 8,366
Robust standard errors in parentheses*** p<0.01, ** p<0.05, * p<0.1
56

Tab
leA
-30:
Ifge
ogra
ph
icin
form
atio
nis
mis
sin
g,co
ded
asd
ista
nt
(1)
(2)
(3)
(4)
(5)
VA
RIA
BL
ES
Inves
t=
1w
ith
NA
sL
OC
AL
DIS
TA
NT
orN
As
LO
CA
LD
IST
AN
Tor
NA
s
$10-2
0K
acc
um
.ca
pit
al0.
0180
***
0.00
830.
0181
***
0.03
40**
*0.
0232
***
(0.0
012)
(0.0
061)
(0.0
012)
(0.0
068)
(0.0
012)
$20
-30K
acc
um
.ca
pit
al0.
0216
***
-0.0
225*
**0.
0240
***
0.03
07**
*0.
0317
***
(0.0
016)
(0.0
082)
(0.0
017)
(0.0
092)
(0.0
017)
$30
-40K
acc
um
.ca
pit
al0.
0357
***
-0.0
255*
**0.
0388
***
0.03
77**
*0.
0493
***
(0.0
020)
(0.0
093)
(0.0
021)
(0.0
110)
(0.0
021)
$40
-50K
acc
um
.ca
pit
al0.
0731
***
-0.0
137
0.07
80**
*0.
0639
***
0.10
57**
*(0
.002
6)(0
.011
0)(0
.002
7)(0
.013
7)(0
.002
8)$10
-20K
acc
um
.ca
pit
al*
F&
F-0
.089
8***
-0.1
120*
**(0
.010
2)(0
.005
3)$2
0-3
0K
acc
um
.ca
pit
al*
F&
F-0
.130
1***
-0.1
462*
**(0
.011
1)(0
.005
5)$3
0-4
0K
acc
um
.ca
pit
al*
F&
F-0
.150
7***
-0.1
709*
**(0
.012
7)(0
.005
7)$4
0-5
0K
acc
um
.ca
pit
al*
F&
F-0
.181
2***
-0.2
440*
**(0
.015
4)(0
.006
0)In
vest
orp
roxim
ate
toL
ive
Sh
ow0.
0054
0.01
05-0
.010
80.
0098
-0.0
075
(0.0
053)
(0.0
076)
(0.0
125)
(0.0
077)
(0.0
126)
Wee
ks
onS
ella
ban
d-0
.003
3***
-0.0
041*
**-0
.003
2***
-0.0
035*
**-0
.003
0***
(0.0
003)
(0.0
011)
(0.0
003)
(0.0
010)
(0.0
003)
Ob
serv
atio
ns
783,
372
78,8
9770
4,47
578
,897
704,
475
R-s
qu
ared
0.01
20.
039
0.01
10.
049
0.02
0N
um
ber
ofgr
oup
20,8
261,
572
19,2
541,
572
19,2
54
Rob
ust
stan
dar
der
rors
inp
aren
thes
es**
*p<
0.01
,**
p<
0.05
,*
p<
0.1
57
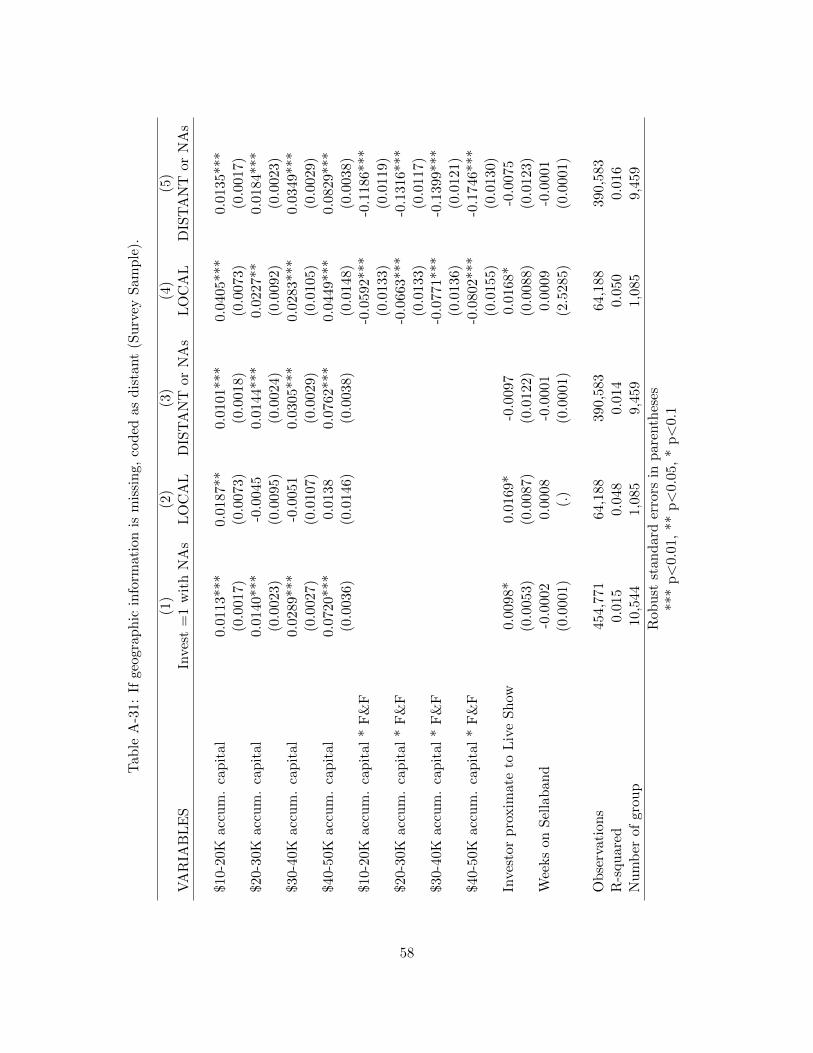
Tab
leA
-31:
Ifge
ogra
ph
icin
form
atio
nis
mis
sin
g,co
ded
asd
ista
nt
(Su
rvey
Sam
ple
).
(1)
(2)
(3)
(4)
(5)
VA
RIA
BL
ES
Inves
t=
1w
ith
NA
sL
OC
AL
DIS
TA
NT
orN
As
LO
CA
LD
IST
AN
Tor
NA
s
$10-2
0Kac
cum
.ca
pit
al
0.01
13**
*0.
0187
**0.
0101
***
0.04
05**
*0.
0135
***
(0.0
017)
(0.0
073)
(0.0
018)
(0.0
073)
(0.0
017)
$20-3
0Kac
cum
.ca
pit
al
0.01
40**
*-0
.004
50.
0144
***
0.02
27**
0.01
84**
*(0
.002
3)(0
.009
5)(0
.002
4)(0
.009
2)(0
.002
3)$3
0-4
0Kac
cum
.ca
pit
al
0.02
89**
*-0
.005
10.
0305
***
0.02
83**
*0.
0349
***
(0.0
027)
(0.0
107)
(0.0
029)
(0.0
105)
(0.0
029)
$40-5
0Kac
cum
.ca
pit
al
0.07
20**
*0.
0138
0.07
62**
*0.
0449
***
0.08
29**
*(0
.003
6)(0
.014
6)(0
.003
8)(0
.014
8)(0
.003
8)$1
0-2
0Kac
cum
.ca
pit
al
*F
&F
-0.0
592*
**-0
.118
6***
(0.0
133)
(0.0
119)
$20-3
0Kac
cum
.ca
pit
al
*F
&F
-0.0
663*
**-0
.131
6***
(0.0
133)
(0.0
117)
$30-4
0Kac
cum
.ca
pit
al
*F
&F
-0.0
771*
**-0
.139
9***
(0.0
136)
(0.0
121)
$40-5
0Kac
cum
.ca
pit
al
*F
&F
-0.0
802*
**-0
.174
6***
(0.0
155)
(0.0
130)
Inve
stor
pro
xim
ate
toL
ive
Sh
ow0.
0098
*0.
0169
*-0
.009
70.
0168
*-0
.007
5(0
.005
3)(0
.008
7)(0
.012
2)(0
.008
8)(0
.012
3)W
eeks
on
Sel
lab
and
-0.0
002
0.00
08-0
.000
10.
0009
-0.0
001
(0.0
001)
(.)
(0.0
001)
(2.5
285)
(0.0
001)
Ob
serv
ati
on
s45
4,77
164
,188
390,
583
64,1
8839
0,58
3R
-squ
are
d0.
015
0.04
80.
014
0.05
00.
016
Nu
mb
erof
gro
up
10,5
441,
085
9,45
91,
085
9,45
9
Rob
ust
stan
dar
der
rors
inp
aren
thes
es**
*p<
0.01
,**
p<
0.05
,*
p<
0.1
58
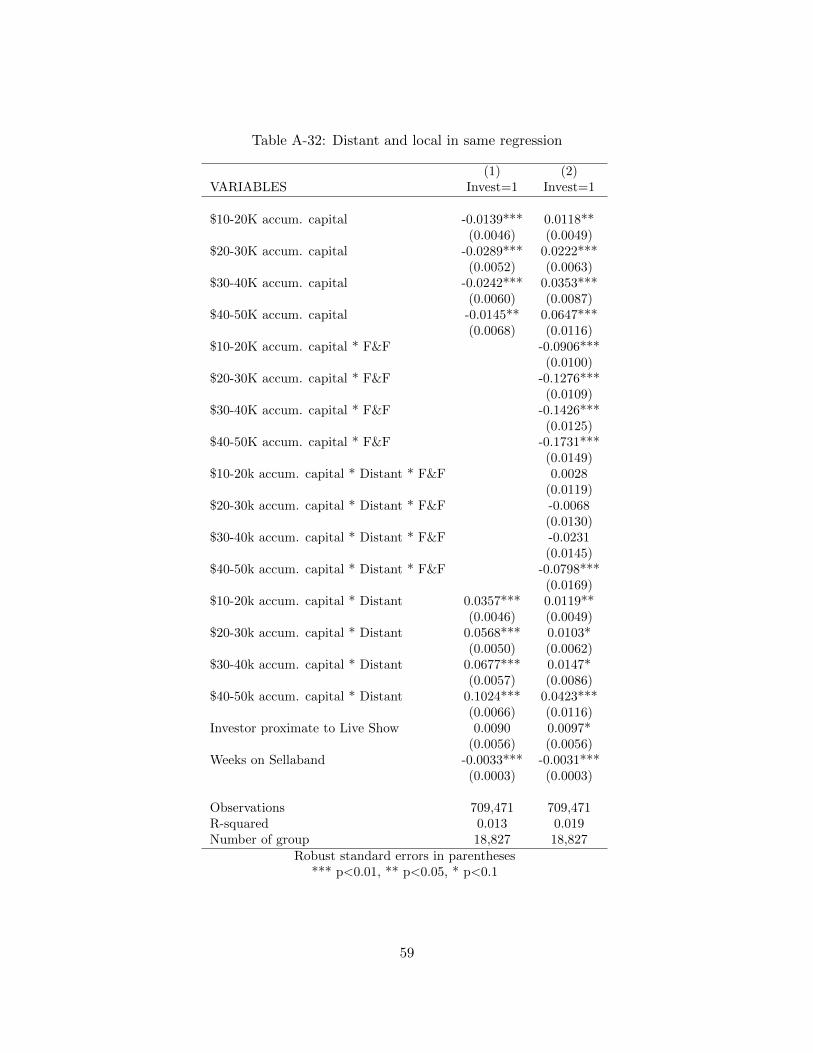
Table A-32: Distant and local in same regression
(1) (2)VARIABLES Invest=1 Invest=1
$10-20K accum. capital -0.0139*** 0.0118**(0.0046) (0.0049)
$20-30K accum. capital -0.0289*** 0.0222***(0.0052) (0.0063)
$30-40K accum. capital -0.0242*** 0.0353***(0.0060) (0.0087)
$40-50K accum. capital -0.0145** 0.0647***(0.0068) (0.0116)
$10-20K accum. capital * F&F -0.0906***(0.0100)
$20-30K accum. capital * F&F -0.1276***(0.0109)
$30-40K accum. capital * F&F -0.1426***(0.0125)
$40-50K accum. capital * F&F -0.1731***(0.0149)
$10-20k accum. capital * Distant * F&F 0.0028(0.0119)
$20-30k accum. capital * Distant * F&F -0.0068(0.0130)
$30-40k accum. capital * Distant * F&F -0.0231(0.0145)
$40-50k accum. capital * Distant * F&F -0.0798***(0.0169)
$10-20k accum. capital * Distant 0.0357*** 0.0119**(0.0046) (0.0049)
$20-30k accum. capital * Distant 0.0568*** 0.0103*(0.0050) (0.0062)
$30-40k accum. capital * Distant 0.0677*** 0.0147*(0.0057) (0.0086)
$40-50k accum. capital * Distant 0.1024*** 0.0423***(0.0066) (0.0116)
Investor proximate to Live Show 0.0090 0.0097*(0.0056) (0.0056)
Weeks on Sellaband -0.0033*** -0.0031***(0.0003) (0.0003)
Observations 709,471 709,471R-squared 0.013 0.019Number of group 18,827 18,827
Robust standard errors in parentheses*** p<0.01, ** p<0.05, * p<0.1
59
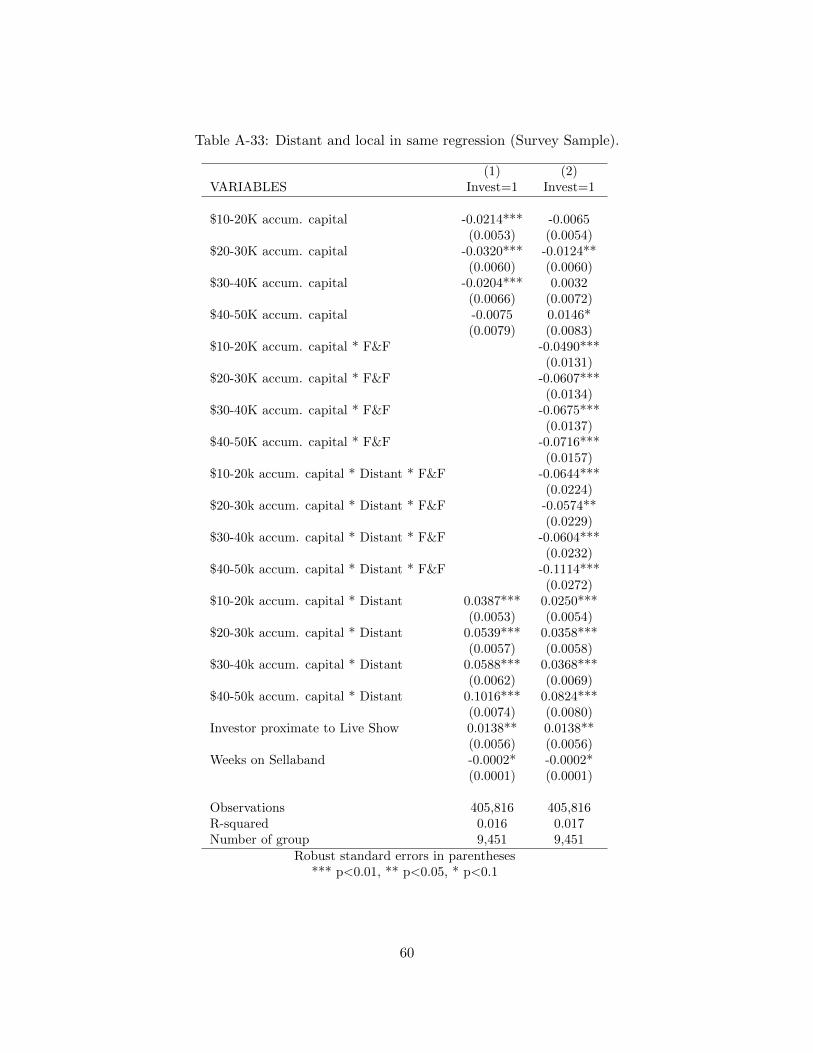
Table A-33: Distant and local in same regression (Survey Sample).
(1) (2)VARIABLES Invest=1 Invest=1
$10-20K accum. capital -0.0214*** -0.0065(0.0053) (0.0054)
$20-30K accum. capital -0.0320*** -0.0124**(0.0060) (0.0060)
$30-40K accum. capital -0.0204*** 0.0032(0.0066) (0.0072)
$40-50K accum. capital -0.0075 0.0146*(0.0079) (0.0083)
$10-20K accum. capital * F&F -0.0490***(0.0131)
$20-30K accum. capital * F&F -0.0607***(0.0134)
$30-40K accum. capital * F&F -0.0675***(0.0137)
$40-50K accum. capital * F&F -0.0716***(0.0157)
$10-20k accum. capital * Distant * F&F -0.0644***(0.0224)
$20-30k accum. capital * Distant * F&F -0.0574**(0.0229)
$30-40k accum. capital * Distant * F&F -0.0604***(0.0232)
$40-50k accum. capital * Distant * F&F -0.1114***(0.0272)
$10-20k accum. capital * Distant 0.0387*** 0.0250***(0.0053) (0.0054)
$20-30k accum. capital * Distant 0.0539*** 0.0358***(0.0057) (0.0058)
$30-40k accum. capital * Distant 0.0588*** 0.0368***(0.0062) (0.0069)
$40-50k accum. capital * Distant 0.1016*** 0.0824***(0.0074) (0.0080)
Investor proximate to Live Show 0.0138** 0.0138**(0.0056) (0.0056)
Weeks on Sellaband -0.0002* -0.0002*(0.0001) (0.0001)
Observations 405,816 405,816R-squared 0.016 0.017Number of group 9,451 9,451
Robust standard errors in parentheses*** p<0.01, ** p<0.05, * p<0.1
60
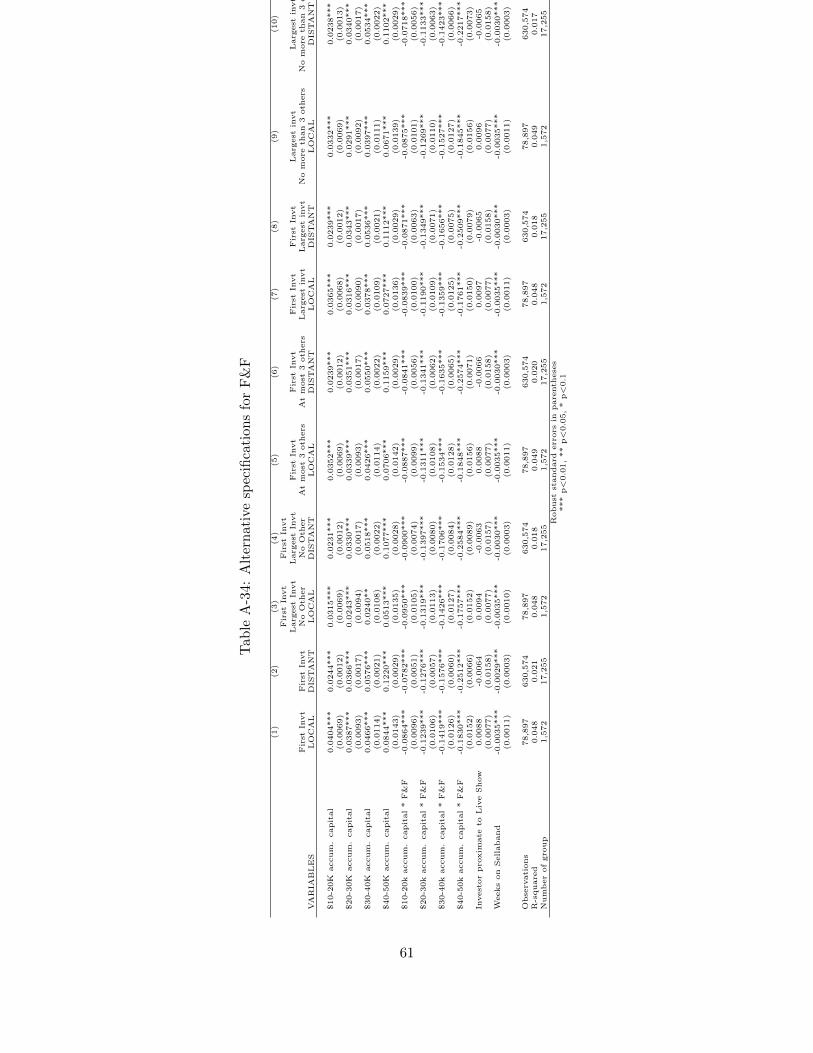
Tab
leA
-34:
Alt
ern
ativ
esp
ecifi
cati
ons
for
F&
F
(1)
(2)
(3)
(4)
(5)
(6)
(7)
(8)
(9)
(10)
First
Invt
First
Invt
Larg
est
Invt
Larg
est
Invt
First
Invt
First
Invt
First
Invt
First
Invt
Larg
est
invt
Larg
est
invt
First
Invt
First
Invt
No
Oth
er
No
Oth
er
Atmost
3oth
ers
Atmost
3oth
ers
Larg
est
invt
Larg
est
invt
No
more
than
3oth
ers
No
more
than
3oth
ers
VARIA
BLES
LOCAL
DIS
TANT
LOCAL
DIS
TANT
LOCAL
DIS
TANT
LOCAL
DIS
TANT
LOCAL
DIS
TANT
$10-2
0K
accum.capital
0.0404***
0.0244***
0.0315***
0.0231***
0.0352***
0.0239***
0.0365***
0.0239***
0.0332***
0.0238***
(0.0069)
(0.0012)
(0.0069)
(0.0012)
(0.0069)
(0.0012)
(0.0068)
(0.0012)
(0.0069)
(0.0013)
$20-3
0K
accum.capital
0.0387***
0.0366***
0.0243***
0.0330***
0.0339***
0.0351***
0.0316***
0.0343***
0.0291***
0.0340***
(0.0093)
(0.0017)
(0.0094)
(0.0017)
(0.0093)
(0.0017)
(0.0090)
(0.0017)
(0.0092)
(0.0017)
$30-4
0K
accum.capital
0.0466***
0.0576***
0.0240**
0.0518***
0.0426***
0.0550***
0.0378***
0.0536***
0.0397***
0.0534***
(0.0114)
(0.0021)
(0.0108)
(0.0022)
(0.0114)
(0.0022)
(0.0109)
(0.0021)
(0.0111)
(0.0022)
$40-5
0K
accum.capital
0.0844***
0.1220***
0.0513***
0.1077***
0.0706***
0.1159***
0.0727***
0.1112***
0.0671***
0.1102***
(0.0143)
(0.0029)
(0.0135)
(0.0028)
(0.0142)
(0.0029)
(0.0136)
(0.0029)
(0.0139)
(0.0029)
$10-2
0k
accum.capital*
F&F
-0.0864***
-0.0782***
-0.0950***
-0.0900***
-0.0887***
-0.0841***
-0.0839***
-0.0871***
-0.0875***
-0.0718***
(0.0096)
(0.0051)
(0.0105)
(0.0074)
(0.0099)
(0.0056)
(0.0100)
(0.0063)
(0.0101)
(0.0056)
$20-3
0k
accum.capital*
F&F
-0.1239***
-0.1276***
-0.1319***
-0.1397***
-0.1311***
-0.1341***
-0.1190***
-0.1349***
-0.1269***
-0.1133***
(0.0106)
(0.0057)
(0.0113)
(0.0080)
(0.0108)
(0.0062)
(0.0109)
(0.0071)
(0.0110)
(0.0063)
$30-4
0k
accum.capital*
F&F
-0.1419***
-0.1576***
-0.1426***
-0.1706***
-0.1534***
-0.1635***
-0.1359***
-0.1656***
-0.1527***
-0.1423***
(0.0126)
(0.0060)
(0.0127)
(0.0084)
(0.0128)
(0.0065)
(0.0125)
(0.0075)
(0.0127)
(0.0066)
$40-5
0k
accum.capital*
F&F
-0.1830***
-0.2512***
-0.1757***
-0.2584***
-0.1848***
-0.2574***
-0.1761***
-0.2509***
-0.1845***
-0.2217***
(0.0152)
(0.0066)
(0.0152)
(0.0089)
(0.0156)
(0.0071)
(0.0150)
(0.0079)
(0.0156)
(0.0073)
Investorpro
xim
ate
toLiveShow
0.0088
-0.0064
0.0094
-0.0063
0.0088
-0.0066
0.0097
-0.0065
0.0096
-0.0065
(0.0077)
(0.0158)
(0.0077)
(0.0157)
(0.0077)
(0.0158)
(0.0077)
(0.0158)
(0.0077)
(0.0158)
Weekson
Sellaband
-0.0035***
-0.0029***
-0.0035***
-0.0030***
-0.0035***
-0.0030***
-0.0035***
-0.0030***
-0.0035***
-0.0030***
(0.0011)
(0.0003)
(0.0010)
(0.0003)
(0.0011)
(0.0003)
(0.0011)
(0.0003)
(0.0011)
(0.0003)
Obse
rvations
78,897
630,574
78,897
630,574
78,897
630,574
78,897
630,574
78,897
630,574
R-square
d0.048
0.021
0.048
0.018
0.049
0.020
0.048
0.018
0.049
0.017
Numberofgro
up
1,572
17,255
1,572
17,255
1,572
17,255
1,572
17,255
1,572
17,255
Robust
standard
errors
inpare
nth
ese
s***
p<0.01,**
p<0.05,*
p<0.1
61


![[Crowdfunding] Equity Based CrowdFunding platform _Opentrade](https://img.pdfslide.us/doc/110x75/589a9d6e1a28abfc1a8b4c51/crowdfunding-equity-based-crowdfunding-platform-opentrade-59106092114ac.jpg)