Embed Size (px)
Citation preview

Friday 25 January 2013 – AfternoonAS GCE MATHEMATICS (MEI)
4766/01 Statistics 1
QUESTION PAPER
*4732980113*
INSTRUCTIONS TO CANDIDATES
These instructions are the same on the Printed Answer Book and the Question Paper.
• The Question Paper will be found in the centre of the Printed Answer Book.• Write your name, centre number and candidate number in the spaces provided on the
Printed Answer Book. Please write clearly and in capital letters.• Write your answer to each question in the space provided in the Printed Answer
Book. Additional paper may be used if necessary but you must clearly show your candidate number, centre number and question number(s).
• Use black ink. HB pencil may be used for graphs and diagrams only.• Read each question carefully. Make sure you know what you have to do before starting
your answer.• Answer all the questions.• Do not write in the bar codes.• You are permitted to use a scientific or graphical calculator in this paper.• Final answers should be given to a degree of accuracy appropriate to the context.
INFORMATION FOR CANDIDATES
This information is the same on the Printed Answer Book and the Question Paper.
• The number of marks is given in brackets [ ] at the end of each question or part question on the Question Paper.
• You are advised that an answer may receive no marks unless you show sufficient detail of the working to indicate that a correct method is being used.
• The total number of marks for this paper is 72.• The Printed Answer Book consists of 12 pages. The Question Paper consists of 4 pages.
Any blank pages are indicated.
INSTRUCTION TO EXAMS OFFICER / INVIGILATOR
• Do not send this Question Paper for marking; it should be retained in the centre or recycled. Please contact OCR Copyright should you wish to re-use this document.
This paper has been pre modified for carrier language
OCR is an exempt CharityTurn over
© OCR 2013 [H/102/2650]DC (LEG/CGW) 61801/3
Candidates answer on the Printed Answer Book.
OCR supplied materials:• Printed Answer Book 4766/01• MEI Examination Formulae and Tables (MF2)
Other materials required:• Scientific or graphical calculator
Duration: 1 hour 30 minutes
2
4766/01 Jan13© OCR 2013
Section A (36 marks)
1 The stem and leaf diagram illustrates the heights in metres of 25 young oak trees.
345678
400241
62146
7235
835
948
96 8 9
Key: 4 2 represents 4.2
(i) State the type of skewness of the distribution. [1]
(ii) Use your calculator to find the mean and standard deviation of these data. [3]
(iii) Determine whether there are any outliers. [4]
2 The probability distribution of the random variable X is given by the formula
P X r k r 12= = -_ _i i for r = 2, 3, 4, 5.
(i) Show the probability distribution in a table, and find the value of k. [3]
(ii) Find E X_ i and Var X_ i. [5]
3 Each weekday Alan drives to work. On his journey, he goes over a level crossing. Sometimes he has to wait at the level crossing for a train to pass.
• W is the event that Alan has to wait at the level crossing.• L is the event that Alan is late for work.
You are given that P .L W 0 4=_ i , P 0.07W =_ i and P 0.08L Wj =_ i .
(i) Calculate P L Wk_ i. [2]
(ii) Draw a Venn diagram, showing the events L and W. Fill in the probability corresponding to each of the four regions of your diagram. [3]
(iii) Determine whether the events L and W are independent, explaining your method clearly. [3]
4 At a dog show, three out of eleven dogs are to be selected for a national competition.
(i) Find the number of possible selections. [2]
(ii) Five of the eleven dogs are terriers. Assuming that the dogs are selected at random, find the probability that at least two of the three dogs selected for the national competition are terriers. [5]

3
4766/01 Jan13 Turn over© OCR 2013
5 Malik is playing a game in which he has to throw a 6 on a fair six-sided die to start the game. Find the probability that
(i) Malik throws a 6 for the first time on his third attempt, [3]
(ii) Malik needs at most ten attempts to throw a 6. [2]
Section B (36 marks)
6 The heights x cm of 100 boys in Year 7 at a school are summarised in the table below.
Height 125 G x G 140 140 < x G 145 145 < x G 150 150 < x G 160 160 < x G 170
Frequency 25 29 24 18 4
(i) Estimate the number of boys who have heights of at least 155 cm. [2]
(ii) Calculate an estimate of the median height of the 100 boys. [3]
(iii) Draw a histogram to illustrate the data. [5]
The histogram below shows the heights of 100 girls in Year 7 at the same school.
0
1
2
0 125 130 135 140 145 150height (cm)
155 160 165 170 175 180
3
freq
uenc
y de
nsity
4
5
6
7
(iv) How many more girls than boys had heights exceeding 160 cm? [3]
(v) Calculate an estimate of the mean height of the 100 girls. [5]

4
4766/01 Jan13© OCR 2013
Copyright Information
OCR is committed to seeking permission to reproduce all third-party content that it uses in its assessment materials. OCR has attempted to identify and contact all copyright holders whose work is used in this paper. To avoid the issue of disclosure of answer-related information to candidates, all copyright acknowledgements are reproduced in the OCR Copyright Acknowledgements Booklet. This is produced for each series of examinations and is freely available to download from our public website (www.ocr.org.uk) after the live examination series.
If OCR has unwittingly failed to correctly acknowledge or clear any third-party content in this assessment material, OCR will be happy to correct its mistake at the earliest possible opportunity.
For queries or further information please contact the Copyright Team, First Floor, 9 Hills Road, Cambridge CB2 1GE.
OCR is part of the Cambridge Assessment Group; Cambridge Assessment is the brand name of University of Cambridge Local Examinations Syndicate (UCLES), which is itself a department of the University of Cambridge.
7 A coffee shop provides free internet access for its customers. It is known that the probability that a randomly selected customer is accessing the internet is 0.35, independently of all other customers.
(i) 10 customers are selected at random.
(A ) Find the probability that exactly 5 of them are accessing the internet. [3]
(B ) Find the probability that at least 5 of them are accessing the internet. [2]
(C ) Find the expected number of these customers who are accessing the internet. [2]
Another coffee shop also provides free internet access. It is suspected that the probability that a randomly selected customer at this coffee shop is accessing the internet may be different from 0.35. A random sample of 20 customers at this coffee shop is selected. Of these, 10 are accessing the internet.
(ii) Carry out a hypothesis test at the 5% significance level to investigate whether the probability for this coffee shop is different from 0.35. Give a reason for your choice of alternative hypothesis. [9]
(iii) To get a more reliable result, a much larger random sample of 200 customers is selected over a period of time, and another hypothesis test is carried out. You are given that 90 of the 200 customers were accessing the internet. You are also given that, if X has the binomial distribution with parameters n = 200 and p = 0.35, then P 0.0022X 90H =_ i . Using the same hypotheses and significance level which you used in part (ii), complete this test. [2]

Friday 25 January 2013 – AfternoonAS GCE MATHEMATICS (MEI)
4766/01 Statistics 1
PRINTED ANSWER BOOK
INSTRUCTIONS TO CANDIDATESThese instructions are the same on the Printed Answer Book and the Question Paper.• The Question Paper will be found in the centre of the Printed Answer Book.• Write your name, centre number and candidate number in the spaces provided on the
Printed Answer Book. Please write clearly and in capital letters.• Write your answer to each question in the space provided in the Printed Answer
Book. Additional paper may be used if necessary but you must clearly show your candidate number, centre number and question number(s).
• Use black ink. HB pencil may be used for graphs and diagrams only.• Read each question carefully. Make sure you know what you have to do before starting
your answer.• Answer all the questions.• Do not write in the bar codes.• You are permitted to use a scientific or graphical calculator in this paper.• Final answers should be given to a degree of accuracy appropriate to the context.
INFORMATION FOR CANDIDATESThis information is the same on the Printed Answer Book and the Question Paper.• The number of marks is given in brackets [ ] at the end of each question or part
question on the Question Paper.• You are advised that an answer may receive no marks unless you show sufficient detail
of the working to indicate that a correct method is being used.• The total number of marks for this paper is 72.• The Printed Answer Book consists of 12 pages. The Question Paper consists of 4 pages.
Any blank pages are indicated.
* 4 7 6 6 0 1 *
This paper has been pre modified for carrier language
OCR is an exempt CharityTurn over
© OCR 2013 [H/102/2650]DC (LEG/CGW) 61803/3
Candidates answer on this Printed Answer Book.
OCR supplied materials:• Question Paper 4766/01 (inserted)• MEI Examination Formulae and Tables (MF2)
Other materials required:• Scientific or graphical calculator
*4732990113*
Duration: 1 hour 30 minutes

2
© OCR 2013
1 (i)
1 (ii)
1 (iii)

3
Turn over© OCR 2013
2 (i)
2 (ii)

4
© OCR 2013
3 (i)
3 (ii)
3 (iii)

5
Turn over© OCR 2013
4 (i)
4 (ii)

6
© OCR 2013
5 (i)
5 (ii)
6 (i)
6 (ii)
7
Turn over© OCR 2013
6 (iii)

8
© OCR 2013
6 (iv)
6 (v)

9
Turn over© OCR 2013
7 (i) (A)
7 (i) (B)
7 (i) (C)

10
© OCR 2013
7 (ii)
(answer space continued on next page)

11
Turn over© OCR 2013
7 (ii) (continued)
7 (iii)
(answer space continued on next page)

Oxford Cambridge and RSA Examinations
GCE
Mathematics (MEI) Advanced Subsidiary GCE
Unit 4766: Statistics 1
Mark Scheme for January 2013

OCR (Oxford Cambridge and RSA) is a leading UK awarding body, providing a wide range of qualifications to meet the needs of candidates of all ages and abilities. OCR qualifications include AS/A Levels, Diplomas, GCSEs, Cambridge Nationals, Cambridge Technicals, Functional Skills, Key Skills, Entry Level qualifications, NVQs and vocational qualifications in areas such as IT, business, languages, teaching/training, administration and secretarial skills. It is also responsible for developing new specifications to meet national requirements and the needs of students and teachers. OCR is a not-for-profit organisation; any surplus made is invested back into the establishment to help towards the development of qualifications and support, which keep pace with the changing needs of today’s society. This mark scheme is published as an aid to teachers and students, to indicate the requirements of the examination. It shows the basis on which marks were awarded by Examiners. It does not indicate the details of the discussions which took place at an Examiners’ meeting before marking commenced. All Examiners are instructed that alternative correct answers and unexpected approaches in candidates’ scripts must be given marks that fairly reflect the relevant knowledge and skills demonstrated. Mark schemes should be read in conjunction with the published question papers and the Report on the Examination. OCR will not enter into any discussion or correspondence in connection with this mark scheme. © OCR 2013

4766 Mark Scheme January 2013
1
Annotations and abbreviations
Annotation Meaning
and
BOD Benefit of doubt
FT Follow through
ISW Ignore subsequent working
M0, M1 Method mark awarded 0, 1
A0, A1 Accuracy mark awarded 0, 1
B0, B1 Independent mark awarded 0, 1
SC Special case
^ Omission sign
MR Misread
Highlighting
Other abbreviations in mark scheme Meaning
E1 Mark for explaining
U1 Mark for correct units
G1 Mark for a correct feature on a graph
M1 dep* Method mark dependent on a previous mark, indicated by *
cao Correct answer only
oe Or equivalent
rot Rounded or truncated
soi Seen or implied
www Without wrong working

4766 Mark Scheme January 2013
2
Subject-specific Marking Instructions for GCE Mathematics (MEI) Statistics strand a Annotations should be used whenever appropriate during your marking.
The A, M and B annotations must be used on your standardisation scripts for responses that are not awarded either 0 or full marks. It is vital that you annotate standardisation scripts fully to show how the marks have been awarded. For subsequent marking you must make it clear how you have arrived at the mark you have awarded.
b An element of professional judgement is required in the marking of any written paper. Remember that the mark scheme is designed to assist in marking incorrect solutions. Correct solutions leading to correct answers are awarded full marks but work must not be judged on the answer alone, and answers that are given in the question, especially, must be validly obtained; key steps in the working must always be looked at and anything unfamiliar must be investigated thoroughly. Correct but unfamiliar or unexpected methods are often signalled by a correct result following an apparently incorrect method. Such work must be carefully assessed. When a candidate adopts a method which does not correspond to the mark scheme, award marks according to the spirit of the basic scheme; if you are in any doubt whatsoever (especially if several marks or candidates are involved) you should contact your Team Leader.
c The following types of marks are available. M A suitable method has been selected and applied in a manner which shows that the method is essentially understood. Method marks are not usually lost for numerical errors, algebraic slips or errors in units. However, it is not usually sufficient for a candidate just to indicate an intention of using some method or just to quote a formula; the formula or idea must be applied to the specific problem in hand, eg by substituting the relevant quantities into the formula. In some cases the nature of the errors allowed for the award of an M mark may be specified. A Accuracy mark, awarded for a correct answer or intermediate step correctly obtained. Accuracy marks cannot be given unless the associated Method mark is earned (or implied). Therefore M0 A1 cannot ever be awarded. B Mark for a correct result or statement independent of Method marks. E A given result is to be established or a result has to be explained. This usually requires more working or explanation than the establishment of an unknown result.

4766 Mark Scheme January 2013
3
Unless otherwise indicated, marks once gained cannot subsequently be lost, eg wrong working following a correct form of answer is ignored. Sometimes this is reinforced in the mark scheme by the abbreviation isw. However, this would not apply to a case where a candidate passes through the correct answer as part of a wrong argument.
d When a part of a question has two or more ‘method’ steps, the M marks are in principle independent unless the scheme specifically says otherwise; and similarly where there are several B marks allocated. (The notation ‘dep *’ is used to indicate that a particular mark is dependent on an earlier, asterisked, mark in the scheme.) Of course, in practice it may happen that when a candidate has once gone wrong in a part of a question, the work from there on is worthless so that no more marks can sensibly be given. On the other hand, when two or more steps are successfully run together by the candidate, the earlier marks are implied and full credit must be given.
e The abbreviation ft implies that the A or B mark indicated is allowed for work correctly following on from previously incorrect results. Otherwise, A and B marks are given for correct work only — differences in notation are of course permitted. A (accuracy) marks are not given for answers obtained from incorrect working. When A or B marks are awarded for work at an intermediate stage of a solution, there may be various alternatives that are equally acceptable. In such cases, exactly what is acceptable will be detailed in the mark scheme rationale. If this is not the case please consult your Team Leader. Sometimes the answer to one part of a question is used in a later part of the same question. In this case, A marks will often be ‘follow through’. In such cases you must ensure that you refer back to the answer of the previous part question even if this is not shown within the image zone. You may find it easier to mark follow through questions candidate-by-candidate rather than question-by-question.
f Wrong or missing units in an answer should not lead to the loss of a mark unless the scheme specifically indicates otherwise. Candidates are expected to give numerical answers to an appropriate degree of accuracy. 3 significant figures may often be the norm for this, but this always needs to be considered in the context of the problem in hand. For example, in quoting probabilities from Normal tables, we generally expect some evidence of interpolation and so quotation to 4 decimal places will often be appropriate. But even this does not always apply – quotations of the standard critical points for significance tests such as 1.96, 1.645, 2.576 (maybe even 2.58 – but not 2.57) will commonly suffice, especially if the calculated value of a test statistic is nowhere near any of these values. Sensible discretion must be exercised in such cases. Discretion must also be exercised in the case of small variations in the degree of accuracy to which an answer is given. For example, if 3 significant figures are expected (either because of an explicit instruction or because the general context of a problem demands it) but only 2 are given, loss of an accuracy ("A") mark is likely to be appropriate; but if 4 significant figures are given, this should not normally be penalised. Likewise, answers which are slightly deviant from what is expected in a very minor manner (for example a Normal probability given, after an attempt at interpolation, as 0.6418 whereas 0.6417 was expected) should not be penalised. However, answers which are grossly over- or under-specified should normally result in the loss of a mark. This includes cases such as, for example, insistence that the value of a test statistic is (say) 2.128888446667 merely because that is the value that happened to come off the candidate's calculator.

4766 Mark Scheme January 2013
4
Note that this applies to answers that are given as final stages of calculations; intermediate working should usually be carried out, and quoted, to a greater degree of accuracy to avoid the danger of premature approximation. The situation regarding any particular cases where the accuracy of the answer may be a marking issue should be detailed in the mark scheme rationale. If in doubt, contact your Team Leader.
g Rules for replaced work If a candidate attempts a question more than once, and indicates which attempt he/she wishes to be marked, then examiners should do as the candidate requests.
If there are two or more attempts at a question which have not been crossed out, examiners should mark what appears to be the last (complete) attempt and ignore the others. NB Follow these maths-specific instructions rather than those in the assessor handbook.
h Genuine misreading (of numbers or symbols, occasionally even of text) occurs. If this results in the object and/or difficulty of the question being considerably changed, it is likely that all the marks for that question, or section of the question, will be lost. However, misreads are often such that the object and/or difficulty remain substantially unaltered; these cases are considered below. The simple rule is that all method ("M") marks [and of course all independent ("B") marks] remain accessible but at least some accuracy ("A") marks do not. It is difficult to legislate in an overall sense beyond this global statement because misreads, even when the object and/or difficulty remains unchanged, can vary greatly in their effects. For example, a misread of 1.02 as 10.2 (perhaps as a quoted value of a sample mean) may well be catastrophic; whereas a misread of 1.6748 as 1.6746 may have so slight an effect as to be almost unnoticeable in the candidate's work. A misread should normally attract some penalty, though this would often be only 1 mark and should rarely if ever be more than 2. Commonly in sections of questions where there is a numerical answer either at the end of the section or to be obtained and commented on (eg the value of a test statistic), this answer will have an "A" mark that may actually be designated as "cao" [correct answer only]. This should be interpreted strictly – if the misread has led to failure to obtain this value, then this "A" mark must be withheld even if all method marks have been earned. It will also often be the case that such a mark is implicitly "cao" even if not explicitly designated as such. On the other hand, we commonly allow "fresh starts" within a question or part of question. For example, a follow-through of the candidate's value of a test statistic is generally allowed (and often explicitly stated as such within the marking scheme), so that the candidate may exhibit knowledge of how to compare it with a critical value and draw conclusions. Such "fresh starts" are not affected by any earlier misreads.

4766 Mark Scheme January 2013
5
A misread may be of a symbol rather than a number – for example, an algebraic symbol in a mathematical expression. Such misreads are more likely to bring about a considerable change in the object and/or difficulty of the question; but, if they do not, they should be treated as far as possible in the same way as numerical misreads, mutatis mutandis. This also applied to misreads of text, which are fairly rare but can cause major problems in fair marking. The situation regarding any particular cases that arise while you are marking for which you feel you need detailed guidance should be discussed with your Team Leader. Note that a miscopy of the candidate’s own working is not a misread but an accuracy error.
4766 Mark Scheme January 2013
6
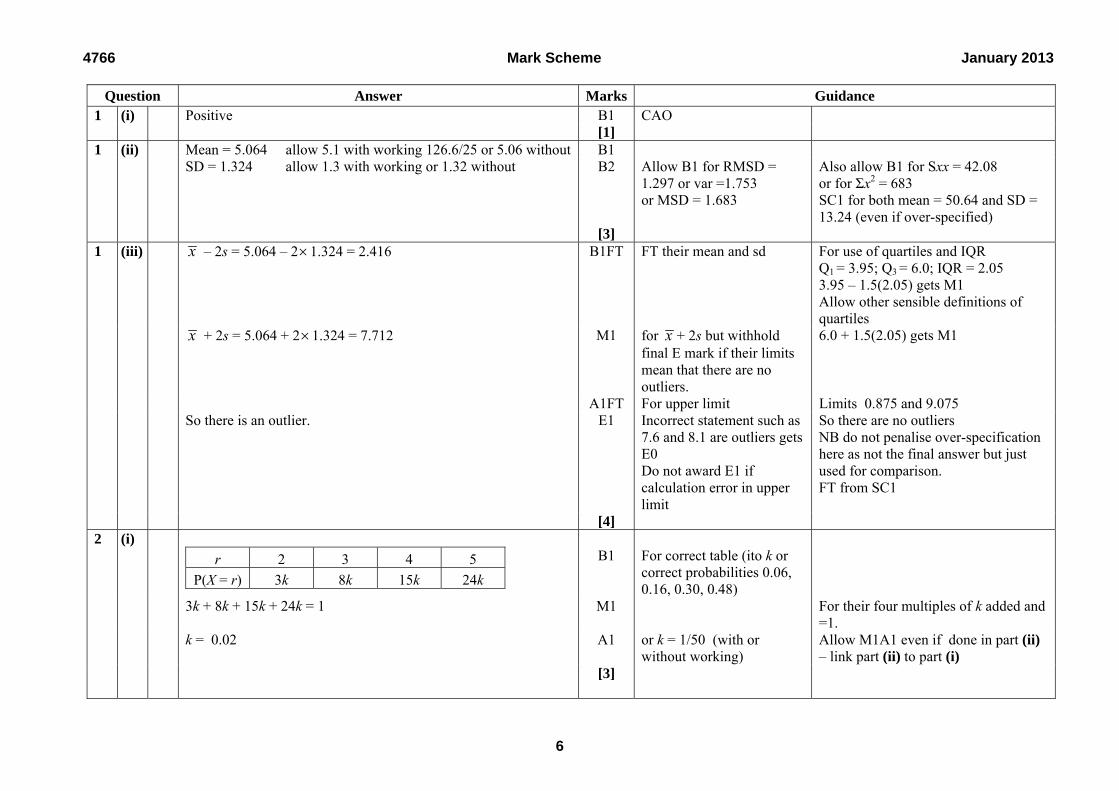
Question Answer Marks Guidance 1 (i) Positive B1 CAO [1] 1 (ii) Mean = 5.064 allow 5.1 with working 126.6/25 or 5.06 without B1 SD = 1.324 allow 1.3 with working or 1.32 without B2 Allow B1 for RMSD =
1.297 or var =1.753 or MSD = 1.683
Also allow B1 for Sxx = 42.08 or for Σx2 = 683 SC1 for both mean = 50.64 and SD = 13.24 (even if over-specified)
[3] 1 (iii) x – 2s = 5.064 – 21.324 = 2.416 B1FT FT their mean and sd For use of quartiles and IQR
Q1 = 3.95; Q3 = 6.0; IQR = 2.05 3.95 – 1.5(2.05) gets M1 Allow other sensible definitions of quartiles
x + 2s = 5.064 + 21.324 = 7.712 M1
for x + 2s but withhold final E mark if their limits mean that there are no outliers.
6.0 + 1.5(2.05) gets M1
A1FT For upper limit Limits 0.875 and 9.075 So there is an outlier. E1 Incorrect statement such as
7.6 and 8.1 are outliers gets E0 Do not award E1 if calculation error in upper limit
So there are no outliers NB do not penalise over-specification here as not the final answer but just used for comparison. FT from SC1
[4] 2 (i)
r 2 3 4 5
P(X = r) 3k 8k 15k 24k
B1
For correct table (ito k or correct probabilities 0.06, 0.16, 0.30, 0.48)
3k + 8k + 15k + 24k = 1 M1 For their four multiples of k added and =1.
k = 0.02 A1 or k = 1/50 (with or without working)
Allow M1A1 even if done in part (ii) – link part (ii) to part (i)
[3]

4766 Mark Scheme January 2013
7
Question Answer Marks Guidance 2 (ii) E(X) = (2 0.06) (3 0.16) (4 0.30) (5 0.48) 4.2
M1
For Σrp (at least 3 terms correct Provided 4 reasonable probabilities seen.
If probs wrong but sum = 1 allow full marks here. If sum ≠ 1 allow max M1A0M1 M0A0 (provided all probabilities between 0 and 1)
or 21/5
A1 cao Or ito k NB E(X) = 210k , E(X2) = 924k gets M1A0M1M0A0. E(X) = 210k , Var (X) = 924k – (210k)2 gets M1A0M1M1A0.
E(X2) = (4 0.06) (9 0.16) (16 0.30) (25 0.48) 18.48 M1 For Σr2p (at least 3 terms correct)
Var(X) = 18.48 – 4.22 M1 dep for – their E(X)² = 0.84 = 21/25 A1 FT their E(X) provided
Var(X) > 0 (and of course E(X2) is correct)
Use of E(X – µ)2 gets M1 for attempt at (x – µ)2 should see (–2.2)2, (–1.2)2, (–0.2)2, 0.82, (if E(X) wrong FT their E(X)) (all 4 correct for M1), then M1 for Σp(x – µ)2 (at least 3 terms correct with their probabilities) Division by 4 or other spurious value at end gives max M1A1M1M1A0, or M1A0M1M1A0 if E(X) also divided by 4. Unsupported correct answers get 5 marks
[5] 3 (i)
( ) ( | ) ( ) 0.4 0.07 0.028P L W P L W P W
M1
For ( | ) ( )P L W P W
A1 cao [2]

4766 Mark Scheme January 2013
8
Question Answer Marks Guidance 3 (ii)
B1 For two labelled intersecting circles
B1 For at least 2 correct probabilities.
FT their 0.028 provided < 0.038
B1 For remaining probabilities
[3] 3 (iii)
( ) 0.028, ( ) ( ) 0.038 0.07 0.00266P L W P L P W
M1
For correct use of
( ) ( )P L P W If P(L) wrong, max M1A0E0. No marks if P(W) wrong
Or EG P( | ) 0.4,P( ) 0.038L W L Not equal so not independent M1 is for comparing with some attempt at numbers P( | ) with P( )L W L , A1 for 0.038 If P(L) wrong, max M1A0E0
A1 For 0.00266 Not equal so not independent E1*
dep on M1
Allow ‘they are dependent’ Do not award E1 if P( )wrongL W
[3] 4 (i)
11
3
M1
Seen
= 165 A1 Cao [2]
0.01 0.028
0.92
L W
0.042

4766 Mark Scheme January 2013
9
Question Answer Marks Guidance 4 (ii) 5 6 5 6
2 1 3 0 60 10 70 1411 11 165 165 165 33
3 3
= 0.424
M1
For intention to add correct two fractional terms
Or For attempt at correct two terms
M1 For numerator of first term For prod of 3 correct fractions =4/33 Alternative
1 – P(1 or 0) = 1 – 5 6 5 6 5 4
311 10 9 11 10 9
= 5 4
111 33
= 14
33
M1 for 1 – P(1 or 0) , M1 for first product, M1 for ×3, M1 for
second product, A1
M1 For numerator of sec term Do not penalise omission
of 6
0
For whole expression ie 5 4 6 4
311 10 9 11
(= 3 × 0.1212…)
M1 For correct denominator For attempt at
5 4 3 2
11 10 9 33
A1 cao cao [5] Use of binomial can get max first M1 5 (i) 2
5 1 25
6 6 216
(= 0.116)
M1 For 5/6 (or 1 – 1/6) seen
If extra term or whole number factor present give M1M0A0
M1 For whole product A1 cao Allow 0.12 with working [3] 5 (ii) 10
51 1 0.1615 0.8385
6
M1
For (5/6)10 (without extra terms)
Allow 0.838 or 0.839 without working and 0.84 with working. For addition P(X = 1) +…+ P(X = 10) give M1A1 for 0.84 or better, otherwise M0A0
A1 cao [2]

4766 Mark Scheme January 2013
10
Question Answer Marks Guidance 6 (i) 4 + ½ of 18 = 4 + 9 =13 M1 For ½ of 18 A1 cao 13/100 gets M1A0 [2] 6 (ii) (Median) = 50.5th value M1
For 50.5 seen SC2 for use of 50th value leading to
Est = 140 + (25 /29 × 5) = 144.3 (SC1 if over-specified)
Est = 140 +
25.55
29
or = 140 + 50.5 25
554 25
M1 For attempt to find this value or Est = 145 –
3.55
29
= 144.4
= 144.4 A1 NB no marks for mean = 144.35 [3] NB Watch for over-specification

4766 Mark Scheme January 2013
11
Question Answer Marks Guidance 6 (iii)
Height FrequencyGroup width
Frequency density
125 ≤ x ≤ 140 25 15 1.67
140 < x ≤ 145 29 5 5.80
145 < x ≤ 150 24 5 4.80
150 < x ≤ 160 18 10 1.80
160 < x ≤ 170 4 10 0.40
M1
For fd’s - at least 3 correct Accept any suitable unit for fd such as eg freq per cm.
M1 can be also be gained from freq per 10 – 16.7, 58, 48, 18, 4 (at least 3 correct) or freq per 5 – 8.35, 29, 24, 9, 2
A1 correct to at least one dp allow 1.66 but not 1.6 for first fd
for all correct. If fd not explicitly given, M1 A1 can be gained from all heights correct (within one square) on histogram (and M1A0 if at least 3 correct)
G1
linear scales on both axes and label on vertical axis
Linear scale and label on vertical axis IN RELATION to first M1 mark ie fd or frequency density or if relevant freq/10, etc (NOT eg fd/10). However allow scale given as fd×10, or similar Accept f/w or f/cw (freq/width or freq/class width) Can also be gained from an accurate key G0 if correct label but not fd’s.
W1
width of bars Must be drawn at 125, 140 etc NOT 124.5 or 125.5 etc NO GAPS ALLOWED Must have linear scale. No inequality labels on their own such as 125≤S<140, etc but allow if a clear horizontal linear scale is also given. Ignore horizontal label.
H1 height of bars Height of bars – must be linear vertical scale. FT of heights dep on at least 3 heights correct and all must agree with their

4766 Mark Scheme January 2013
12
Question Answer Marks Guidance fds If fds not given and at least 3 heights correct then max M1A0G1W1H0 Allow restart with correct heights if given fd wrong (for last three marks only)
[5] 6 (iv) 4 boys 0.6 × 15 M1 For 0.6 × 15 Or 45 × 0.2 = 9 (number of squares
and 0.2 per square) = 9 girls A1 For 9 girls So 5 more girls A1 cao [3] 6 (v)
Frequencies and midpoints for girls are
Height 132.5 142.5 147.5 155 167.5
Frequency 18 23 31 19 9
B1
For at least three frequencies correct
B1 At least three midpoints correct
No further marks if not using midpoints
So mean = (132.5 18) (142.5 23) (147.5 31) (155 19) (167.5 9)
100
= (2385) (3277.5) (4572.5) (2945) (1507.5)
100
M1 For attempt at ∑xf For sight of at least 3 xf pairs M1*
Dep on M1
For division by 100
= 146.9 (Exact answer 146.875)
A1 Cao NB Watch for over-specification
Allow answer 146.9 or 147 but not 150 NB Accept answers seen without working (from calculator) Use of ‘not quite right’ midpoints such as 132.49 or 132.51 etc can get B1B0M1M1A0
[5]
4766 Mark Scheme January 2013
13
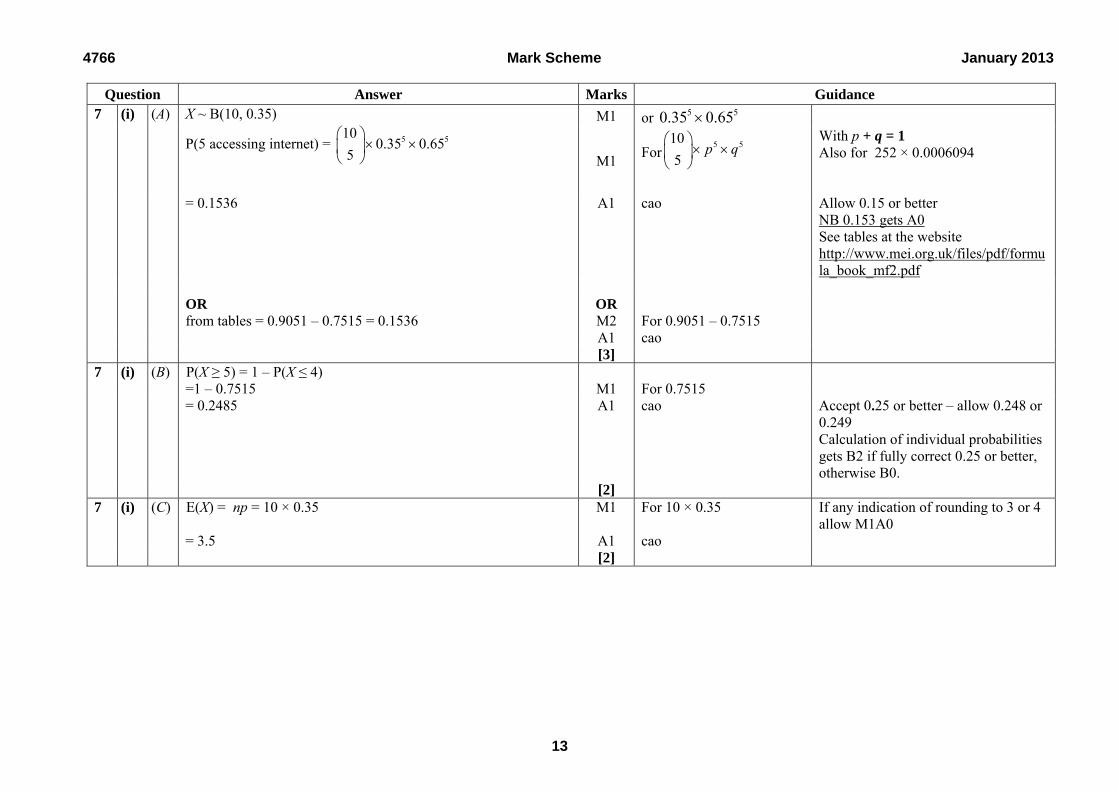
Question Answer Marks Guidance 7 (i) (A) X ~ B(10, 0.35)
P(5 accessing internet) = 5 5100.35 0.65
5
M1 or 5 50.35 0.65
M1 For
5 510
5p q
With p + q = 1 Also for 252 × 0.0006094
= 0.1536 A1 cao Allow 0.15 or better NB 0.153 gets A0 See tables at the website http://www.mei.org.uk/files/pdf/formula_book_mf2.pdf
OR OR from tables = 0.9051 – 0.7515 = 0.1536 M2 For 0.9051 – 0.7515 A1 cao [3] 7 (i) (B) P(X ≥ 5) = 1 – P(X ≤ 4) =1 – 0.7515 M1 For 0.7515 = 0.2485 A1 cao Accept 0.25 or better – allow 0.248 or
0.249 Calculation of individual probabilities gets B2 if fully correct 0.25 or better, otherwise B0.
[2] 7 (i) (C) E(X) = np = 10 × 0.35 M1 For 10 × 0.35 If any indication of rounding to 3 or 4
allow M1A0 = 3.5 A1 cao [2]

4766 Mark Scheme January 2013
14
Question Answer Marks Guidance 7 (ii) Let X ~ B(20, 0.35) Let p = probability of a customer using the internet (for
population) B1 For definition of p in
context Minimum needed for B1 is p = probability of using internet. Allow p = P(using internet) Definition of p must include word probability (or chance or proportion or percentage or likelihood but NOT possibility). Preferably as a separate comment. However can be at end of H0 as long as it is a clear definition ‘p = the probability of using internet’, Do NOT allow ‘p = the probability of using internet is different’
H0: p = 0.35 B1 For H0 Allow p=35%, allow only p or θ or π or ρ. However allow any single symbol if defined (including x) Allow H0 = p=0.35, Allow H0 : p=7/20or p=35/100 Allow NH and AH in place of H0 and H1 Do not allow H0 : P(X=x) = 0.35 Do not allow H0: =0.35, =35%, P(0.35), p(x)=0.35, x=0.35 (unless x correctly defined as a probability) Do not allow H0 and H1 reversed For hypotheses given in words allow Maximum B0B1B1 Hypotheses in words must include probability (or chance or proportion or percentage) and the figure 0.35 oe Thus eg H0 : p(using internet) = 0.35, H1 : p(using internet) ≠ 0.35 gets B0B1B1

4766 Mark Scheme January 2013
15
Question Answer Marks Guidance H1: p 0.35 B1 For H1 Allow ‘p < 0.35 or p > 0.35’in place of
p 0.35 H1 has this form because the test is to investigate whether the
proportion is different, (rather than lower or higher). E1 Do not allow if H1 wrong.
P(X ≥ 10) B1 For notation P(X ≥ 10) or P(X > 9) or 1 – P(X ≤ 9) (as long as no incorrect notation)
This mark may be implied by 0.1218 as long as no incorrect notation. No further marks if point probs used - P(X = 10) = 0.0686 (do not even give the notation mark for correct notation) DO NOT FT wrong H1, but see extra notes
= 1 – 0.8782 = 0.1218 B1* For 0.1218 Allow 0.12 Or for 1 – 0.8782 Indep of previous mark
> 2.5% M1* dep
For comparison with 2.5%
So not significant. A1* Allow ‘accept H0’ or ‘reject H1’ Conclude that there is not enough evidence to indicate that the
probability is different. (Must state ‘probability’, not just ‘p’) E1*
dep on A1
Must include ‘sufficient evidence’ or something similar such as ‘to suggest that’ ie an element of doubt either in the A or E mark.
ALTERNATIVE METHOD FOR FINAL 5 MARKS
Critical region method LOWER TAIL P(X ≤ 2) = 0.0121 < 2.5% P(X ≤ 3) = 0.0444 > 2.5%
B1
For either probability
Do not insist on correct notation as candidates have to work out two probabilities for full marks. If only upper tail of CR given (or only upper tail justified), allow max 4/5 for final 5 marks.
UPPER TAIL P(X ≥ 11) = 1 – P(X ≤ 10) = 1 – 0.9468 = 0.0532 > 2.5% P(X ≥ 12) = 1 – P(X ≤ 11) = 1 – 0.9804 = 0.0196 < 2.5%
B1
For either probability
4766 Mark Scheme January 2013
16
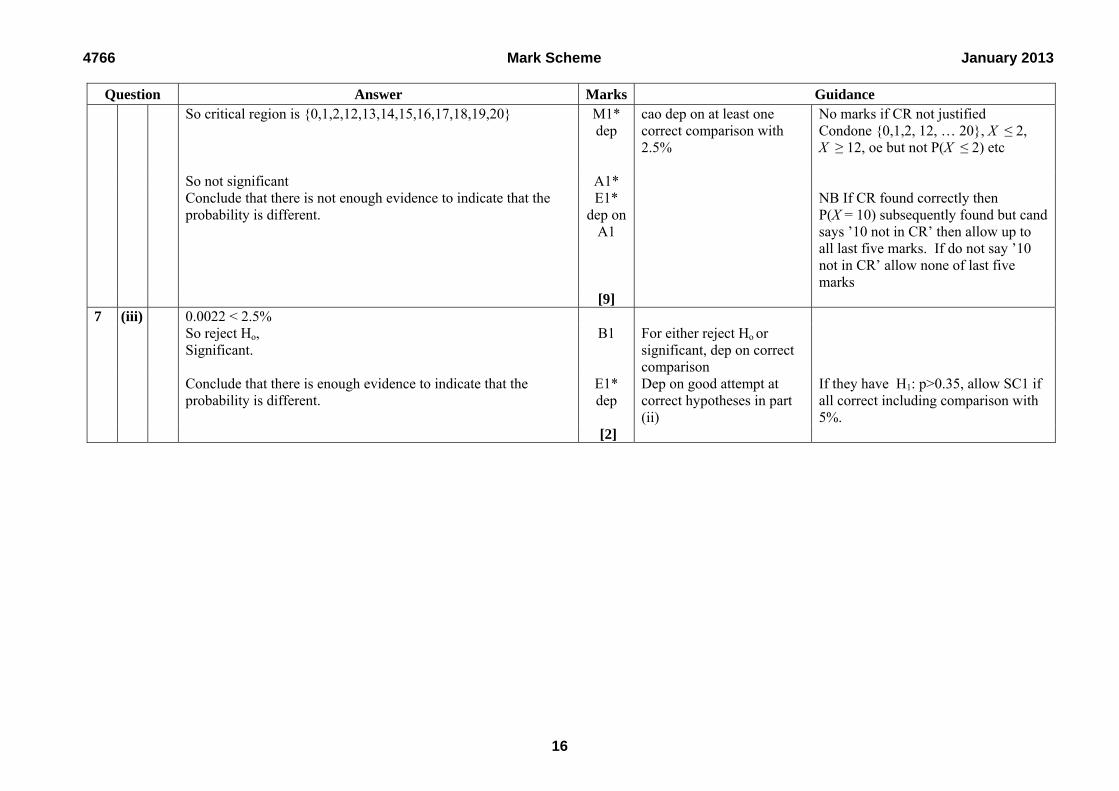
Question Answer Marks Guidance So critical region is {0,1,2,12,13,14,15,16,17,18,19,20} M1*
dep cao dep on at least one correct comparison with 2.5%
No marks if CR not justified Condone {0,1,2, 12, … 20}, X ≤ 2, X ≥ 12, oe but not P(X ≤ 2) etc
So not significant A1* Conclude that there is not enough evidence to indicate that the
probability is different. E1*
dep on A1
NB If CR found correctly then P(X = 10) subsequently found but cand says ’10 not in CR’ then allow up to all last five marks. If do not say ’10 not in CR’ allow none of last five marks
[9] 7 (iii) 0.0022 < 2.5% So reject Ho,
Significant. B1 For either reject Ho or
significant, dep on correct comparison
Conclude that there is enough evidence to indicate that the probability is different.
E1* dep
Dep on good attempt at correct hypotheses in part (ii)
If they have H1: p>0.35, allow SC1 if all correct including comparison with 5%.
[2]

4766 Mark Scheme January 2013
17
APPENDIX NOTE RE OVER-SPECIFICATION OF ANSWERS If answers are grossly over-specified, deduct the final answer mark in every case. Probabilities should also be rounded to a sensible degree of accuracy. In general final non-probability answers should not be given to more than 4 significant figures. Allow probabilities given to 5 sig fig. Additional notes re Q7 part ii Comparison with 97.5% method If 97.5% seen anywhere then B1 for P(X ≤ 9) B1 for 0.8782 M1* for comparison with 97.5% dep on second B1 A1* for not significant oe E1* Smallest critical region method: Smallest critical region that 10 could fall into is {10,11,12,13,14,15, 16, 17, 18,19,20} gets B1 and has size 0.1218 gets B1, This is > 2.5% gets M1*, A1*, E1* as per scheme NB These marks only awarded if 10 used, not other values. Use of k method with no probabilities quoted: This gets zero marks. Use of k method with one probability quoted: Mark as per scheme Line diagram method and Bar chart method No marks unless correct probabilities shown on diagram, then mark as per scheme. Upper tailed test done with H1: p>0.35 Hyp gets max B1B1B0E0 If compare with 5% give SC2 for P(X ≥ 10) = 1 – 0.8782 = 0.1218 > 5% and SC1 for final conclusion (must be ‘larger than’ not ‘different from’) If compare with 2.5% no further marks B0B0M0A0E0 Lower tailed test done with H1: p<0.35 No marks out of last 5.

Oxford Cambridge and RSA Examinations is a Company Limited by Guarantee Registered in England Registered Office; 1 Hills Road, Cambridge, CB1 2EU Registered Company Number: 3484466 OCR is an exempt Charity OCR (Oxford Cambridge and RSA Examinations) Head office Telephone: 01223 552552 Facsimile: 01223 552553 © OCR 2013
OCR (Oxford Cambridge and RSA Examinations) 1 Hills Road Cambridge CB1 2EU OCR Customer Contact Centre Education and Learning Telephone: 01223 553998 Facsimile: 01223 552627 Email: [email protected] www.ocr.org.uk For staff training purposes and as part of our quality assurance programme your call may be recorded or monitored

Oxford Cambridge and RSA Examinations
GCE
Mathematics (MEI)
Advanced GCE A2 7895-8
Advanced Subsidiary GCE AS 3895-8
OCR Report to Centres
January 2013

OCR Report to Centres – January 2013
31
4766 Statistics 1
General Comments
The level of difficulty of the paper appeared to be appropriate for the candidates and indeed they performed slightly better than last January. Even most of those candidates who used long-winded methods were able to complete the paper in the allocated time. The majority of candidates were generally well prepared and handled the standard parts of questions very well. Most candidates supported their numerical answers with appropriate explanations and working. There was relatively little use of additional answer sheets and very few candidates attempted parts of questions in answer sections intended for a different question/part. It is pleasing to report that once again the statement of the hypotheses in question 7 was generally well answered, with most candidates again not only giving their hypotheses in terms of p but also defining p. However, because this was a two-tailed test candidates were less successful in carrying out the test, particularly those who used a critical region approach. Rather fewer candidates lost marks due to over specification than last year, but some still lost two or three marks altogether. It should be noted that although answers should not usually be given to more than 4 significant figures, when an answer is an exact whole number such as a combination, it may be appropriate to give it to full accuracy. Candidates should be advised that it is the number of significant figures that is important, not the number of decimal places. For instance in question 6(v), a number of candidates gave the full answer of 146.875 then thought that they had rounded appropriately by giving an answer of 146.88, often stating ‘to 2 dp’. Unfortunately this lost them a mark for over-specification. Comments on Individual Questions 1(i) Approximately 95% of candidates scored this mark.
(ii) There were many fully correct answers. Most used the relevant formulas rather than
using the built in functions on their calculators. A few candidates found the variance or the rmsd, and these gained a method mark. The most common error was not to use the key and thus get answers ten times too high. This error was severely penalised, but full marks were allowed in part (iii) for a follow through.
(iii) The limits for outliers were widely known and correctly used by most candidates. Even those with incorrect mean and standard deviation were able to gain 3 or all 4 marks if they followed through correctly. Some candidates used the quartiles method, despite often having got part (ii) correct, but some of these made errors, losing some if not all of the marks.
2(i) Nearly all candidates were able to calculate the correct coefficients of k and sum the terms to get 50k. Work was generally neatly presented and well structured. Only a very few candidates failed to get the correct answer of 1/50. A small number of candidates did not show the probabilities in a table, thus losing 1 mark.
(ii) Once again, a substantial majority of candidates scored full marks. The most common errors were just calculating E(X²) believing that to be the variance, finding E(X²) - E(X) or dividing their answers by 4 or some other factor. Those whose probabilities did not sum to 1 were only able to gained two marks out of the 5 available.

OCR Report to Centres – January 2013
32
3(i) This question was well answered, with about 80% of candidates scoring both marks.
(ii) Almost all candidates gained the first mark for two labelled intersecting circles. Many
candidates put their answer from part (i) into the intersection but then did not subtract
their value from P(W) so put 0.07 instead of (0.07 – their answer to (i)) in the other
part of the circle labelled W. However, a reasonable number of candidates gained full
credit, either having the correct 0.01 and 0.92 in the other parts or by following
through correctly.
(iii) The vast majority of candidates tried to show non-independence by comparing P(L) x P(W) with P(L intersect W). However most of these did not have the correct value of P(L) and many had P(W) wrong, despite its value being given in the question. A small number of candidates compared P(LIW) with P(L) and these were more often successful.
4(i) This part was usually correctly answered, although a few candidates found 11P3 instead of 11C3.
(ii) There was a mixed response to this question. Most candidates used the fractions
rather than the combinations method but many of these omitted the multiplier of 3
whether finding P(2) + P(3) or finding 1 – (P(0) + P(1)). Roughly 25% of candidates
gained just 1 mark only for adding P(2) and P(3) but using a binomial distribution.
5(i) This was well answered with the most candidates gaining all 3 marks. Some
calculated (1/6)3 and so scored 0 and some just scored 1 for 5/6.
(ii) Only about 25% of candidates gained marks in this part – most either misread or
misinterpreted the question and calculated the probability of needing exactly 10
attempts. Some candidates read the question correctly but spent time calculating all
the probabilities from 1 to 10 and summing them, usually successfully. Very few used
the method stated in the mark scheme.
6(i) On the whole, this question was answered well. The most common incorrect answer was 22, which was seen fairly frequently. A small minority of candidates wrote 9 + 4, but then calculated incorrectly (both 11 and 12 seen).
(ii) Only about 10% of candidates produced totally correct answers. Many scored SC2 for finding the 50th, rather than 50.5th, value. Those that did state that they were looking for 50.5th value often just gave the mid-value, rather than using interpolation. Many candidates lost a mark due to over-specification.
(iii) The histogram was generally completed rather better than in previous years. Most candidates were able to calculate frequency densities correctly, and they also usually labelled the axes correctly. A fairly common error was to round the first frequency density down to 1.6 rather than to 1.7. Some made errors with careless drawing of bars, making slips with incorrect heights.
(iv) Roughly 90% of candidates scored full marks here.

OCR Report to Centres – January 2013
33
(v) Many candidates did everything correctly but gave the final answer as 146.875 or 146.88 thus losing the final mark for over-specifying. The scheme allowed for a slip in both the frequencies and the mid-points and candidates were still able to gain 4 marks. The most common error was giving the final mid-point as 165 rather than 167.5.
7(i)(A) Most candidates successfully used the formula, a relatively small number using
tables. A few who used the binomial formula omitted the coefficient, but on the whole
this question was answered better than in previous years.
(i)(B) Again many fully correct responses were seen. Candidates usually used the correct table but a common wrong answer was 1 – P(X≤ 5) rather than 1 – P(X≤ 4). Some candidates used the lengthy method of finding the individual probabilities of 5 or more and then adding, sometimes successfully but in many cases with errors.
(i)(C) Almost all candidates multiplied 0.35 by 10, but about 20% of them either rounded to 4 or truncated to 3, thus losing the second mark.
(ii) Most candidates were able to identify that this was a two-tailed test and were able to
correctly state the null and alternative hypotheses. However, some candidates failed
to define p and others failed to explain why it was two-tailed. Some of the weaker
candidates used poor notation when defining their hypotheses. Rather more
candidates used the critical region method than finding P(X≥10). However, those who
used the probability method were generally more successful. Those who tried to find
the critical region often included either 3 or 11 and so lost the final three marks.
Unfortunately, a significant number of candidates made comparisons with 5% instead
of 2.5%, or omitted the comparison altogether and so again lost the last three marks.
A disappointing number found P(X=10) thus losing all of the final 5 marks. It was
pleasing to see that the majority of candidates did however realise that justification,
with probabilities, is needed whichever method they employ. Conclusions, for those
who get this far, were usually correct. However care should be taken to explain in
words their findings including an element of doubt in their conclusion. Those
answering by the critical region method should be aware that '10 is not in CR' is not
enough, they also need to add ‘insufficient evidence to reject the null hypothesis’ and
then go on to give an answer in context.
(iii) Under half of the candidature scored either mark in this question. Many did not attempt it. A disappointing proportion compared with 5% even though they had correctly compared with 2.5% in part (ii). A further significant proportion failed to correctly state their conclusion within the context of the question.