Embed Size (px)
Citation preview

Friday 10 June 2016 – MorningGCSE GATEWAY SCIENCE SCIENCE B
B712/02 Science modules B2, C2, P2 (Higher Tier)
H
INSTRUCTIONS TO CANDIDATES
• Write your name, centre number and candidate number in the boxes above. Please write clearly and in capital letters.
• Use black ink. HB pencil may be used for graphs and diagrams only.• Answer all the questions.• Read each question carefully. Make sure you know what you have to do before starting
your answer.• Write your answer to each question in the space provided. If additional space is required,
you should use the lined page(s) at the end of this booklet. The question number(s) must be clearly shown.
• Do not write in the bar codes.
INFORMATION FOR CANDIDATES
• The quality of written communication is assessed in questions marked with a pencil ( ).
• A list of equations can be found on page 2.• The Periodic Table can be found on the back page.• The number of marks is given in brackets [ ] at the end of each question or part
question.• The total number of marks for this paper is 85.• This document consists of 28 pages. Any blank pages are indicated.
* B 7 1 2 0 2 *
OCR is an exempt CharityTurn over
© OCR 2016 [D/601/6896]DC (DTC) 81947/5
Candidates answer on the Question Paper.A calculator may be used for this paper.
OCR supplied materials:None
Other materials required:• Pencil• Ruler (cm/mm)
*3151772762*
Duration: 1 hour 30 minutes
Oxford Cambridge and RSA

2
© OCR 2016
EQUATIONS
energy = mass × specific heat capacity × temperature change
energy = mass × specific latent heat
efficiency = useful energy output (× 100%)total energy input
wave speed = frequency × wavelength
power = voltage × current
energy supplied = power × time
average speed = distancetime
distance = average speed × time
s = (u + v)2
× t
acceleration = change in speedtime taken
force = mass × acceleration
weight = mass × gravitational field strength
work done = force × distance
power = work donetime
power = force × speed
KE = 12
mv2
momentum = mass × velocity
force = change in momentumtime
GPE = mgh
mgh = 12
mv2
resistance = voltagecurrent

3
Turn over© OCR 2016
Answer all the questions.
SECTION A – Module B2
1 Look at the picture of a sperm whale.
(a) Sperm whales were once hunted.
Hunting of sperm whales was made illegal to prevent the number falling to a critical level.
(i) Explain why it is important that the number of sperm whales does not fall to a critical level.
...........................................................................................................................................
...................................................................................................................................... [1]
(ii) Describe two reasons why it is difficult to prevent whales being hunted.
1 ........................................................................................................................................
...........................................................................................................................................
2 ........................................................................................................................................
...........................................................................................................................................[2]
(b) Some other species of whales are still being hunted as sustainable resources.
Explain how whale populations can be sustained.
...................................................................................................................................................
...................................................................................................................................................
...................................................................................................................................................
.............................................................................................................................................. [2]
[Total: 5]

4
© OCR 2016
2 Jack reads this information about relationships between organisms.
Organisms involved Information about the relationship between the organisms
bees
and
flowers
Bees transfer pollen from one flower to another.
Bees make less honey in years when there are fewer flowers.
acacia trees
and
ants
Ants feed on nectar from the trees.
The ants kill trees next to the acacia tree they live on.
mistletoe plants
and
birch trees
The mistletoe plant gets nutrients from the tree.
Trees with mistletoe growing on them are usually smaller than those with no mistletoe.
(a) Jack makes a statement about the relationships.
All of the relationshipsdescribe examples ofmutualism.
Is Jack correct? ............................
Explain your answer.
...................................................................................................................................................
...................................................................................................................................................
...................................................................................................................................................
.............................................................................................................................................. [2]
(b) Jack finds out about another type of mutualism.
Leguminous plants have root nodules with bacteria living inside the nodule.
Explain why this is an example of mutualism.
...................................................................................................................................................
...................................................................................................................................................
.............................................................................................................................................. [2]
[Total: 4]

5
Turn over© OCR 2016
3 Look at the picture of some limestone rock.
(a) The limestone formed millions of years ago at the bottom of a shallow sea.
Acid rain is now weathering the rock.
Explain how carbon became locked up in the limestone and how weathering contributes to global warming.
The quality of written communication will be assessed in your answer to this question.
...................................................................................................................................................
...................................................................................................................................................
...................................................................................................................................................
...................................................................................................................................................
...................................................................................................................................................
...................................................................................................................................................
...................................................................................................................................................
...................................................................................................................................................
.............................................................................................................................................. [6]
(b) Acid rain is one type of air pollution.
Some organisms living on trees and rocks can be used to indicate the levels of air pollution.
These organisms are one of many different types of indicator species.
Write down the name of this type of indicator species that lives on trees and rocks.
.............................................................................................................................................. [1]
[Total: 7]

6
© OCR 2016
4 Matt and Ellie are investigating the animals living in a lake.
They collect some of the animals.
(a) Ellie identifies some of the beetles they collect and writes their names in a table.
Beetle Common name Binomial name
A whirligig beetle Gyrinus natator
B hairy whirligig beetle Orectochilus villosus
C great diving beetle Dytiscus marginalis
D there is no common name for this beetle Dytiscus latissimus
Ellie makes this statement about the beetles.
Beetles A and B are more closelyrelated than the other beetles becausethey are both called whirligig beetles.
Is Ellie correct? ............................
Explain your answer.
...................................................................................................................................................
.............................................................................................................................................. [1]
(b) Matt finds some information about the biomass values for the lake in winter and spring.
Look at the table.
Trophic levelBiomass in mg dry mass per m3
Winter Spring
producers 4 100
primary consumers 10 12
secondary consumers 2 6

7
Turn over© OCR 2016
The diagram below shows the pyramid of biomass for winter.
wintersecondary consumers
primary consumers
producers
(i) Draw the pyramid of biomass for spring on the grid below.
Make sure the bars are drawn to the same scale and labelled.
spring
[2]
(ii) The pyramid of biomass for winter is a different shape to the spring pyramid of biomass.
Describe one way the winter pyramid is different in shape and suggest a reason for the difference.
...........................................................................................................................................
...........................................................................................................................................
...................................................................................................................................... [2]
[Total: 5]

8
© OCR 2016
5 Look at the pictures of different birds.
puffin herring gull penguin
(a) Classifying these birds as seabirds is an artificial classification.
Explain why.
...................................................................................................................................................
.............................................................................................................................................. [1]
(b) Puffins live in the Arctic.
Penguins live in the Antarctic.
Suggest reasons why puffins and penguins are both similar and different.
...................................................................................................................................................
...................................................................................................................................................
...................................................................................................................................................
...................................................................................................................................................
.............................................................................................................................................. [3]
[Total: 4]

9
Turn over© OCR 2016
SECTION B – Module C2
6 Look at the diagram of the structure of the Earth.
(a) The surface of the Earth is made up of tectonic plates.
This was first suggested by a scientist called Wegener in 1914.
The theory of tectonic plates is now widely accepted.
Explain why theories proposed by scientists like Wegener take some time to become widely accepted.
...................................................................................................................................................
...................................................................................................................................................
...................................................................................................................................................
.............................................................................................................................................. [2]
(b) The theory of plate tectonics can be used to explain subduction.
What is subduction and how does it happen?
You may wish to draw a labelled diagram.
...................................................................................................................................................
...................................................................................................................................................
...................................................................................................................................................
...................................................................................................................................................
.............................................................................................................................................. [3]
[Total: 5]

10
© OCR 2016
7 Rachel is making some fertilisers by neutralising acids with alkalis.
Complete the table.
Name of fertiliser Name of alkali used Name of acid used
ammonium phosphate ammonia phosphoric acid
potassium nitrate potassium hydroxide .........................................
......................................... ammonia sulfuric acid
[2]
[Total: 2]

11
Turn over© OCR 2016
BLANK PAGE
Question 8 begins on page 12
PLEASE DO NOT WRITE ON THIS PAGE

12
© OCR 2016
8 Look at the table. It shows some properties of different metals.
Metal Densityin g / cm3
Relative electrical
conductivity
Relative strength
Melting pointin °C
Cost per tonne
in £
A 8.9 64 13 1083 3800
B 7.7 11 21 1510 440
C 2.7 40 15 660 1350
(a) Look at the diagram. It shows electricity pylon wires.
electricity pylon wires
Jo says that metal A is the best for making electricity pylon wires.
Dave says that metal C is the best.
Evaluate metals A and C for making electricity pylon wires.
...................................................................................................................................................
...................................................................................................................................................
...................................................................................................................................................
...................................................................................................................................................
...................................................................................................................................................
...................................................................................................................................................
...................................................................................................................................................
...................................................................................................................................................
.............................................................................................................................................. [3]

13
Turn over© OCR 2016
(b) Metals A, B and C can be used to make the body of a bus.
body of bus
Describe the advantages and disadvantages of metals A, B and C for making the body of a bus.
...................................................................................................................................................
...................................................................................................................................................
...................................................................................................................................................
...................................................................................................................................................
.............................................................................................................................................. [3]
[Total: 6]
Question 9 begins on page 14

14
© OCR 2016
9 Sulfur trioxide, SO3, is made in a chemical factory.
It is used to make sulfuric acid.
The equations show how sulfur trioxide is made.
2SO2 + O2 2SO3
sulfur dioxide
+ oxygen sulfur trioxide
Look at the graph below.
It shows how the percentage yield of sulfur trioxide changes as the temperature changes.
1000600 8004002000
40
80
20
60
100
temperature in °C
percentageyield ofsulfur
trioxide
(a) How does increasing the temperature affect the percentage yield?
.............................................................................................................................................. [1]

15
Turn over© OCR 2016
(b) The conditions used in the reaction are
• 450 °C • low pressure • catalyst of vanadium(V) oxide.
(i) Suggest why a catalyst is used.
...................................................................................................................................... [1]
(ii) Suggest why a temperature of 450 °C rather than 200 °C is used.
Use ideas about rate of reaction and percentage yield.
...........................................................................................................................................
...........................................................................................................................................
...........................................................................................................................................
...........................................................................................................................................
...................................................................................................................................... [2]
(c) In another industrial process, nitrogen, N2, reacts with hydrogen, H2, to make ammonia, NH3.
Write a balanced symbol equation for this reaction.
.............................................................................................................................................. [2]
[Total: 6]
16
© OCR 2016
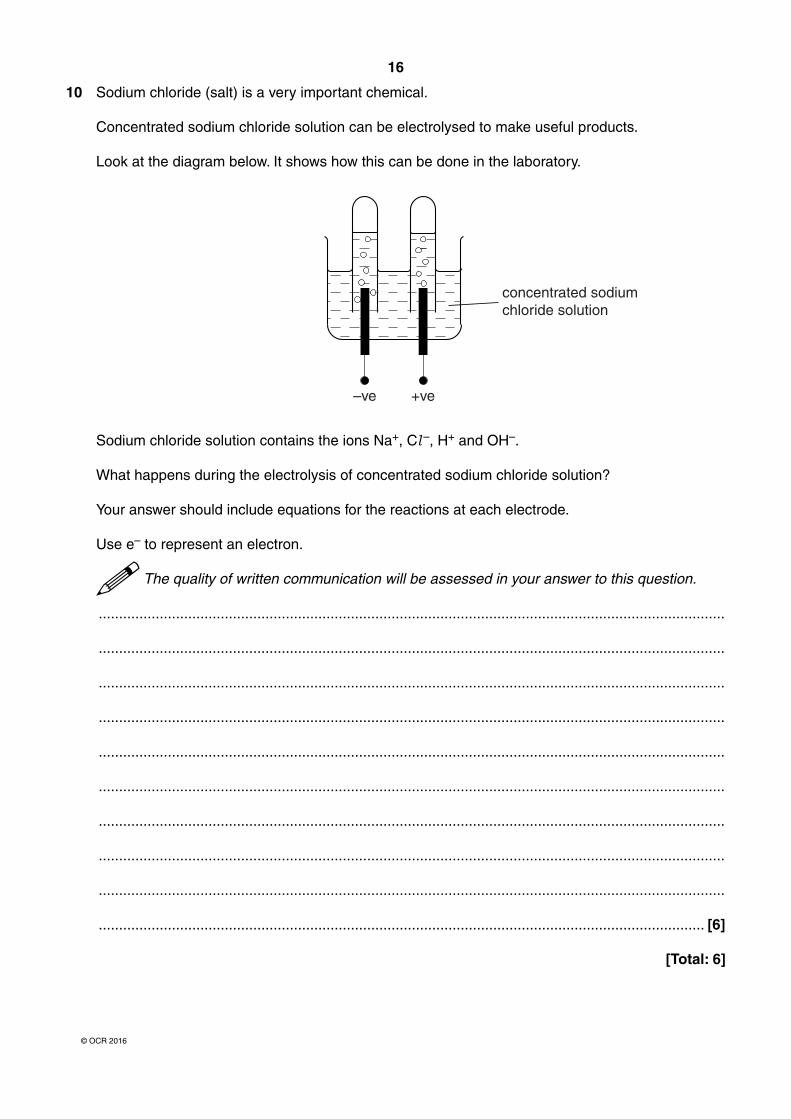
10 Sodium chloride (salt) is a very important chemical.
Concentrated sodium chloride solution can be electrolysed to make useful products.
Look at the diagram below. It shows how this can be done in the laboratory.
–ve +ve
concentrated sodiumchloride solution
Sodium chloride solution contains the ions Na+, Cl –, H+ and OH–.
What happens during the electrolysis of concentrated sodium chloride solution?
Your answer should include equations for the reactions at each electrode.
Use e– to represent an electron.
The quality of written communication will be assessed in your answer to this question.
..........................................................................................................................................................
..........................................................................................................................................................
..........................................................................................................................................................
..........................................................................................................................................................
..........................................................................................................................................................
..........................................................................................................................................................
..........................................................................................................................................................
..........................................................................................................................................................
..........................................................................................................................................................
..................................................................................................................................................... [6]
[Total: 6]

17
Turn over© OCR 2016
SECTION C – Module P2
11 Nuclear radiation can be alpha, beta or gamma radiation.
(a) Draw one line from each radiation to its correct use.
radiation use
alpha paper thickness gauge
beta non-destructive testing
gamma smoke detector
[2]
(b) Polly and Oliver were talking about the factory that is near their home.
Polly said that the factory produces dangerous radioactive waste.
Oliver said that if the waste was put into thick aluminium cans it could be stored safely.
Is Oliver correct? ............................
Explain your answer.
...................................................................................................................................................
...................................................................................................................................................
...................................................................................................................................................
.............................................................................................................................................. [2]
[Total: 4]

18
© OCR 2016
12 (a) Most of our electrical energy is produced in large power stations.
A large power station produces up to 2000 MW of power.
Some of our electrical energy is now produced by wind farms.
A wind farm is made up of several wind turbines.
Each turbine produces up to 2 MW of power.
Suggest one reason why some people are for more wind farms and one reason why others are against.
reason for ..................................................................................................................................
...................................................................................................................................................
reason against ..........................................................................................................................
...................................................................................................................................................[2]
(b) Some companies are now designing and heating their offices using passive solar heating.
Explain how passive solar heating works and suggest why the position of the windows is important.
...................................................................................................................................................
...................................................................................................................................................
...................................................................................................................................................
...................................................................................................................................................
.............................................................................................................................................. [3]
[Total: 5]

19
© OCR 2016 Turn over for the remainder of question 13
13 Power stations generate electricity.
coal
boiler and furnace
steam turbinegenerator transformer
transformerNational Grid lines
pylon pylon
cooling tower
Look at the data for a coal-fired power station.
efficiency of power station 30%
average electrical energy generated each second 1.5 × 10⁶ J
heat energy produced by 1 kg of coal 2 × 10⁴ J
(a) Describe in detail the different stages in the production of electricity from this power station and use the information to calculate the mass of coal (in kg) burnt each second.
The quality of written communication will be assessed in your answer to this question.
...................................................................................................................................................
...................................................................................................................................................
...................................................................................................................................................
...................................................................................................................................................
...................................................................................................................................................
...................................................................................................................................................
...................................................................................................................................................
...................................................................................................................................................
...................................................................................................................................................
.............................................................................................................................................. [6]

20
© OCR 2016
(b) Ruth investigates the output of a model a.c. generator.
Look at the graph below showing the voltage output of the generator.
voltagein
volts
–2
–1
0
1
2
0.2 0.3 0.40.1time in seconds
She increases the number of rotations of the coil each second.
How will this affect the output of this generator?
Draw your answer on the graph. [2]
[Total: 8]

21
Turn over© OCR 2016
14 Sam wants to reduce his energy costs.
He fits a wind generator to his house.
The generator produces 1.8 kWh (kilowatt hour) of energy each day (24 hours).
(a) Calculate the average power output of the generator in kW.
answer ............................................... kW [2]
(b) Electricity costs 16p per kWh.
How much money will Sam save on his electricity bills each day?
answer ............................................... pence [1]
(c) A factory needs 100 kW of electrical power to operate its machinery.
Energy is wasted in transmitting the electricity from the power station to the factory.
Look at the data showing the effect of using different transmission voltages for the power cables to the factory.
Transmission voltage in volts 1000 2000 5000 10 000
Energy wasted per second for each km of cable in W / km 8000 2000 320 80
10 000 volts is the most efficient voltage for the transmission of 100 kW of electricity.
Explain why.
...................................................................................................................................................
...................................................................................................................................................
...................................................................................................................................................
.............................................................................................................................................. [2]
[Total: 5]

22
© OCR 2016
15 Comets are objects in our solar system that orbit the Sun with highly elliptical orbits.
Look at the diagram below showing the path of a comet and its speed at different points on the path.
A B C D E
90 km / s
30 km / s
30 km / s
1 km / s
(a) Where is the Sun on the diagram?
Choose from: A B C D E
answer .........................
Use information from the diagram and ideas about forces to explain your answer.
...................................................................................................................................................
...................................................................................................................................................
...................................................................................................................................................
.............................................................................................................................................. [2]
(b) There is an asteroid belt between Mars and Jupiter.
Some people think that some asteroids in this belt could join together to form a new planet.
There is no sign of this happening.
Explain why.
...................................................................................................................................................
...................................................................................................................................................
.............................................................................................................................................. [1]
[Total: 3]

23
Turn over© OCR 2016
BLANK PAGE
Question 16 begins on page 24
PLEASE DO NOT WRITE ON THIS PAGE

24
© OCR 2016
SECTION D
16 (a) Look at Graph 1. This bar chart shows how electricity was produced in different parts of the world.
The width of each bar is a measure of the total amount of electricity produced in 2008.
Electricity production in 2008
0
20
40
60
80
100
10
30
50
70
90
parts of the world
percentageproduction
China
coal oil gas nuclear hydro-electric
Japan Canada USA UK Rest of Europe
Key
Graph 1

25
© OCR 2016 Turn over for the remainder of question 16
(i) Look at the percentage of electricity produced from coal in each part of the world.
Put these parts of the world in the correct order. Put the highest first.
highest percentage from coal ...................................................
...................................................
...................................................
...................................................
...................................................
lowest percentage from coal ................................................... [2]
(ii) China, USA and the rest of Europe generated the largest amounts of electricity in 2008.
Suggest why they need to produce the largest amounts of electricity.
...........................................................................................................................................
...................................................................................................................................... [1]
(iii) What other conclusions can you make from this bar chart about electricity production in different parts of the world?
...........................................................................................................................................
...........................................................................................................................................
...........................................................................................................................................
...........................................................................................................................................
...................................................................................................................................... [3]

26
© OCR 2016
(b) The production of electricity from nuclear fuels changed between 1971 and 2010.
Look at Graph 2.
• The bars show the total world electricity produced from nuclear fuels (in TWh).
• The line shows the percentage of world electricity produced from nuclear fuels.
20 3000
2500
2000
1500
1000
500
18
16
14
12
10
8
6
4
2
0
TWh%
Year
1971
1972
1973
1974
1975
1976
1977
1978
1979
1980
1981
1982
1983
1984
1985
1986
1987
1988
1989
1990
1991
1992
1993
1994
1995
1996
1997
1998
1999
2000
2001
2002
2003
2004
2005
2006
2007
2008
2009
2010
Percentage produced from nuclear fuels
Total world electricity produced fromnuclear fuels
Graph 2
What conclusions can you make from Graph 2?
...................................................................................................................................................
...................................................................................................................................................
.............................................................................................................................................. [2]
(c) Using Graphs 1 and 2, suggest what problems may arise for electricity production during the next 30 years.
...................................................................................................................................................
...................................................................................................................................................
...................................................................................................................................................
.............................................................................................................................................. [2]
[Total: 10]
END OF QUESTION PAPER

27
© OCR 2016
Oxford Cambridge and RSA
Copyright Information
OCR is committed to seeking permission to reproduce all third-party content that it uses in its assessment materials. OCR has attempted to identify and contact all copyright holders whose work is used in this paper. To avoid the issue of disclosure of answer-related information to candidates, all copyright acknowledgements are reproduced in the OCR Copyright Acknowledgements Booklet. This is produced for each series of examinations and is freely available to download from our public website (www.ocr.org.uk) after the live examination series.
If OCR has unwittingly failed to correctly acknowledge or clear any third-party content in this assessment material, OCR will be happy to correct its mistake at the earliest possible opportunity.
For queries or further information please contact the Copyright Team, First Floor, 9 Hills Road, Cambridge CB2 1GE.
OCR is part of the Cambridge Assessment Group; Cambridge Assessment is the brand name of University of Cambridge Local Examinations Syndicate (UCLES), which is itself a department of the University of Cambridge.
ADDITIONAL ANSWER SPACE
If additional space is required, you should use the following lined page(s). The question number(s) must be clearly shown in the margins.
..................................................................................................................................................................
..................................................................................................................................................................
..................................................................................................................................................................
..................................................................................................................................................................
..................................................................................................................................................................
..................................................................................................................................................................
..................................................................................................................................................................
..................................................................................................................................................................
..................................................................................................................................................................
..................................................................................................................................................................
..................................................................................................................................................................
..................................................................................................................................................................
..................................................................................................................................................................
..................................................................................................................................................................
..................................................................................................................................................................
..................................................................................................................................................................
..................................................................................................................................................................
..................................................................................................................................................................
..................................................................................................................................................................
..................................................................................................................................................................

28
© OCR 2016
The
Peri
odic
Tab
le o
f th
e El
emen
ts
* T
he la
ntha
noid
s (a
tom
ic n
umbe
rs 5
8-71
) an
d th
e ac
tino
ids
(ato
mic
num
bers
90-
103)
hav
e be
en o
mit
ted.
The
rela
tive
ato
mic
mas
ses
of c
oppe
r an
d ch
lori
ne h
ave
not
been
rou
nded
to
the
near
est
who
le n
umbe
r.
12
34
56
70
Key
1 Hhy
drog
en
1
4 He
heliu
m
2
7 Lilit
hium 3
9 Bebe
rylli
um
4
rela
tive
ato
mic
mas
sat
omic
sym
bol
nam
e
atom
ic (
prot
on)
num
ber
11 Bbo
ron
5
12 Cca
rbon 6
14 Nni
trog
en
7
16 Oox
ygen 8
19 Ffl
uori
ne
9
20 Ne
neon 10
23 Na
sodi
um
11
24 Mg
mag
nesi
um
12
27 Al
alum
iniu
m
13
28 Sisi
licon
14
31 Pph
osph
orus
15
32 Ssu
lfur
16
35.5 Cl
chlo
rine
17
40 Ar
argo
n
18
39 Kpo
tass
ium
19
40 Caca
lciu
m
20
45 Scsc
andi
um
21
48 Titi
tani
um
22
51 Vva
nadi
um
23
52 Crch
rom
ium
24
55 Mn
man
gane
se
25
56 Fe iron 26
59 Co coba
lt
27
59 Ni
nick
el
28
63.5
Cu copp
er
29
65 Zn zinc 30
70 Ga
galli
um
31
73 Ge
germ
aniu
m
32
75 As
arse
nic
33
79 Sese
leni
um
34
80 Brbr
omin
e
35
84 Krkr
ypto
n
36
85 Rbru
bidi
um
37
88 Srst
ront
ium
38
89 Yyt
triu
m
39
91 Zrzi
rcon
ium
40
93 Nb
niob
ium
41
96 Mo
mol
ybde
num
42
[98] Tc
tech
neti
um
43
101
Ruru
then
ium
44
103
Rhrh
odiu
m
45
106
Pdpa
lladi
um
46
108
Ag
silv
er
47
112
Cdca
dmiu
m
48
115In
indi
um
49
119
Sn tin 50
122
Sban
tim
ony
51
128
Tete
lluri
um
52
127 I
iodi
ne
53
131
Xe xeno
n
54
133
Csca
esiu
m
55
137
Baba
rium
56
139
La*
lant
hanu
m
57
178
Hf
hafn
ium
72
181
Tata
ntal
um
73
184
Wtu
ngst
en
74
186
Rerh
eniu
m
75
190
Os
osm
ium
76
192Ir
irid
ium
77
195
Ptpl
atin
um
78
197
Au
gold 79
201
Hg
mer
cury
80
204
Tlth
alliu
m
81
207
Pb lead 82
209
Bibi
smut
h
83
[209
]Po
polo
nium
84
[210
]A
tas
tati
ne
85
[222
]Rn rado
n
86
[223
]Fr
fran
cium
87
[226
]Ra
radi
um
88
[227
]A
c*ac
tini
um
89
[261
]Rf
ruth
erfo
rdiu
m
104
[262
]D
bdu
bniu
m
105
[266
]Sg
seab
orgi
um
106
[264
]Bh
bohr
ium
107
[277
]H
sha
ssiu
m
108
[268
]M
tm
eitn
eriu
m
109
[271
]D
sda
rmst
adti
um
110
[272
]Rg
roen
tgen
ium
111
Elem
ents
wit
h at
omic
num
bers
112
-116
hav
e be
en r
epor
ted
but
not
fully
auth
enti
cate
d