Embed Size (px)
Citation preview
Frictional properties of olivine at high temperaturewith applications to the strength and dynamicsof the oceanic lithosphere
D. S. H. King1 and C. Marone1
Received 8 June 2012; revised 22 October 2012; accepted 23 October 2012; published 15 December 2012.
[1] Faulting and brittle deformation of mantle rocks occurs in many tectonic settingssuch as oceanic transform faults, oceanic detachment faults, subduction zones, andcontinental rifts. However, few data exist that directly explore the frictional propertiesof peridotite rocks. Improved constraints on the brittle deformation of peridotite isimportant for a more complete understanding of the rheological properties of thelithosphere. Furthermore, our comparatively detailed understanding of plastic deformationin olivine allows us to explore the possible role of thermally activated intracrystallinedeformation mechanisms in macroscopically brittle processes. It has been hypothesized,and some experimental data indicate, that plastic yielding by dislocation glide(low temperature plasticity) determines the direct effect in the rate and state frictionalconstitutive formulation. Plastic flow may also have important implications for the bluntingor necking at asperity contacts that influences the time and/or displacement dependentfriction evolution effect and frictional healing. We present results from saw cutexperiments on fine grained synthetic olivine fault gouge conducted in a gas-mediumdeformation apparatus in the temperature range of 400–1000�C with 100 MPa confiningpressure. We conducted velocity stepping tests to explore the rate and temperaturedependence of sliding stability. We also conducted slide-hold-slide experiments toinvestigate the time and temperature dependence of fault zone restrengthening(frictional healing). The mechanical data and microstructural observations allow us toexplore the role of thermally activated processes in frictional sliding. The data indicatesystematic temperature dependenceof rate and state variables that can be attributed toplastic yielding at grain to grain contacts. We explore the implications of such temperaturedependent behavior for controlling the base of the seismogenic zone in the oceaniclithosphere, and we seek insight into possible mechanistic models for the interactionsbetween fracture and flow that could lead to improved constraints on the strengthof the lithosphere.
Citation: King, D. S. H., and C. Marone (2012), Frictional properties of olivine at high temperature with applications to thestrength and dynamics of the oceanic lithosphere, J. Geophys. Res., 117, B12203, doi:10.1029/2012JB009511.
1. Introduction
[2] Experimental studies of rock deformation, in both thebrittle and plastic regimes, are largely motivated by the needfor physically meaningful constitutive equations representingmaterial behavior ranging from the scale of individual faultsto global tectonics [Dieterich, 1979; Kohlstedt et al., 1995;Marone, 1998a; Hirth and Kohlstedt, 2003]. Such constitu-tive equations model the material response of a rock to an
applied force or imposed rate of deformation. A particularlypoorly constrained regime of deformation behavior is thesemi-brittle regime, in which brittle fracture and plastic flowact simultaneously and interact with one another.[3] Within the depth range where the yield stress of brittle
fracture is less than that of plastic flow, pressure is thedominant variable controlling rock strength and the upperlimit of the stress that can be sustained in the lithosphere canbe calculated by Byerlee’s law [Byerlee, 1978]. As pressureincreases deeper in the lithosphere, thermally activatedplastic creep mechanisms accommodate deformation, andtemperature becomes the dominant variable controlling rockstrength (for a given strain rate) [Brace and Kohlstedt,1980]. This framework captures important large-scale pat-terns in the variation of rock strength with depth. However,as stated by Brace and Kohlstedt [1980], the yield envelopesdeveloped through such analysis provide only an upper limit
1Department of Geosciences, Pennsylvania State University, UniversityPark, Pennsylvania, USA.
Corresponding author: D. S. H. King, Department of Geosciences,Pennsylvania State University, 510 Deike Bldg., University Park,PA 16802, USA. ([email protected])
©2012. American Geophysical Union. All Rights Reserved.0148-0227/12/2012JB009511
JOURNAL OF GEOPHYSICAL RESEARCH, VOL. 117, B12203, doi:10.1029/2012JB009511, 2012
B12203 1 of 16
to the strength of the lithosphere. Strain localization andlithologic variation can lead to significant weakening rela-tive to simple yield envelopes.[4] In order to quantitatively understand the conditions
under which strain localization occurs and its effects on rockstrength, constitutive equations must capture the set of con-ditions for which deformation is both stable and unstable.Thus, a focus for unified models of deformation has been toidentify conditions for which materials strengthen withincreasing velocity or strain rate (and remain stable) and forwhich materials weaken with increasing velocity (and areunstable) [e.g., Hobbs et al., 1990; Montesi and Zuber,2002]. The rate and state friction (hereafter RSF) constitu-tive framework [Dieterich, 1979; Ruina, 1983] [Marone,1998a, and references therein], which applies to frictionalsliding or frictional shear, is formulated to capture the tran-sient and steady state response to changes in shearing rate,normal stress, temperature and other variables. RSF behav-ior has been observed for a wide range of materials andconditions [e.g., Dieterich, 1979; Li et al., 2011]. However,the underlying microphysical processes are poorly under-stood and these laws remain largely empirical. In contrast,the constitutive equations describing fully plastic flow havea well understood microphysical basis, but they are devel-oped primarily for steady state flow and do not provide a fulldescription of transient behavior. As a result, these laws donot provide a means for predicting the conditions underwhich localized deformation occurs, and thus are not capableof fully describing ductile shear zones and other featurescommonly observed in the geological record.[5] Part of the solution to bridging the brittle and ductile
constitutive frameworks may lie in understanding the role ofthermally activated deformation mechanisms in controllingthe deformation of asperity contacts in semi-brittle flow. Theinterpretation that an Arrhenius activated rate process con-trolling creep at asperities is the physical basis for the frictiondirect effect has been presented in several studies [Heslotet al., 1994; Sleep, 1997; Baumberger and Berthoud, 1999;Nakatani, 2001; Rice et al., 2001; Beeler et al., 2007]. Sev-eral experimental studies have also found transitions in slid-ing stability as a function temperature [Shimamoto, 1986].Notably, a common observation appears to be a transitionfrom stable sliding at low temperatures, to unstable sliding atintermediate temperatures, and back to stable sliding at hightemperatures. This behavior has been observed in wet granitefault gouge [Blanpied et al., 1995], wet gabbro gouge [Heet al., 2007], San Andreas fault gouge [Tembe et al., 2009],ilite-quartz gouge [den Hartog et al., 2012], and in olivine-rich rocks [Stesky et al., 1974; Stesky, 1978; Boettcher et al.,2007]. The temperatures of the transitions vary among thedifferent materials, but the common observation suggests thattransitions in physical mechanisms as a function of temper-ature may explain the observed behavior.[6] An observable proxy for the transition from unstable to
stable sliding in Earth’s crust is the depth extent of seismicity[e.g., Marone and Scholz, 1988; Scholz, 1998]. Severalstudies have demonstrated that the depth distribution ofseismicity at oceanic transform faults varies by location as afunction of geothermal gradient with the cutoff at 600�C[Abercrombie and Ekstrom, 2001]. Similarly, the depthextent of seismicity for oceanic intraplate earthquakes variesas a function of heatflow, and crustal age [Sibson, 1984] with
the cutoff at the 600–750�C isotherm. These observationssuggest that temperature is the dominant variable in control-ling the transition from unstable to stable sliding at the baseof the seismogenic zone.[7] Alteration phases, such as serpentine, play a signifi-
cant role in the dynamics of faulting in the oceanic crust anduppermost mantle [e.g., Escartin et al., 1997, 2001], just asphylosilicates play an important role in a variety of crustalfault zone processes [e.g. Tenthorey et al., 1998; Bos andSpiers, 2000; Niemeijer and Spiers, 2006; Tenthorey andCox, 2006]. However, the P-T conditions at the base of theseismogenic zone are such that the dominant lithology islikely to be relatively unaltered peridotite. Few data exist forthe frictional properties of olivine rich rocks, so additionalexperimental constraints are valuable. Further, becausethe plastic creep mechanisms for olivine are well-constrained,it is an ideal material to investigate the interactions betweenbrittle and ductile deformation mechanisms.[8] The frictional behavior of olivine at elevated tem-
peratures was explored by Boettcher et al. [2007]. Theauthors performed velocity steps to investigate the temper-ature dependence of the stability parameter (a-b) (describedin section 2.1). In this study, we seek to expand the data setfor frictional sliding of olivine to explore its mechanicalresponse in the context of rate and state friction laws. Similarto Boettcher et al. [2007], we use San Carlos olivine andconduct our experiments in a gas-medium deformationapparatus. Unlike Boettcher et al. [2007], we use a saw cutgeometry in which a thin layer of gouge is deformedbetween two angled forcing blocks, whereas those authorsdeformed a cylindrical specimen and allowed deformation tolocalize during the course of deformation. We explore anarrower range of confining pressure (50–150 MPa, with themajority of the experiments conducted at 100 MPa), but weexplore a larger range of temperature (400–600�C).
2. Experimental Procedure
[9] Crushed single crystals of olivine from San Carlos, AZwere sorted to <75 mm by settling the powder in water.In two experiments, powder was packed directly into acopper jacket between two disks of porous alumina with auniaxial load of �5 MPa. In all other experiments (the bulkof this study), the olivine powder was placed between twoangled and serrated tungsten pistons. Into one of the pistonswe drilled a 2-mm diameter hole that aligned with the ther-mocouple hole in the top alumina and zirconia pistons(Figure 1). Adjacent to the sample, the hole was filled with asmall amount of porous alumina cement that acted as a filterto keep the powder in place but allow the pore fluid (air) todrain to atmospheric pressure. To achieve as close as pos-sible to a consistent layer thickness among the differentexperiment runs, and uniform layer thickness within eachsample assembly, a thick slurry was prepared by mixing1.2 g of powder with 5 mL of deionized water. We do nothave a method of directly measuring layer thickness duringthe experiment, but this mass of powder corresponds tonominally 1 mm thickness for the area of the pistons ifcompletely dense, so we expect that layer thickness starts outslightly thicker than 1 mm. The slurry was carefully appliedto one of the pistons and the pistons were nested togetherinside of a clear plastic sleeve so that the uniformity of layer
KING AND MARONE: THE BASE OF THE SEISMOGENIC ZONE B12203B12203
2 of 16
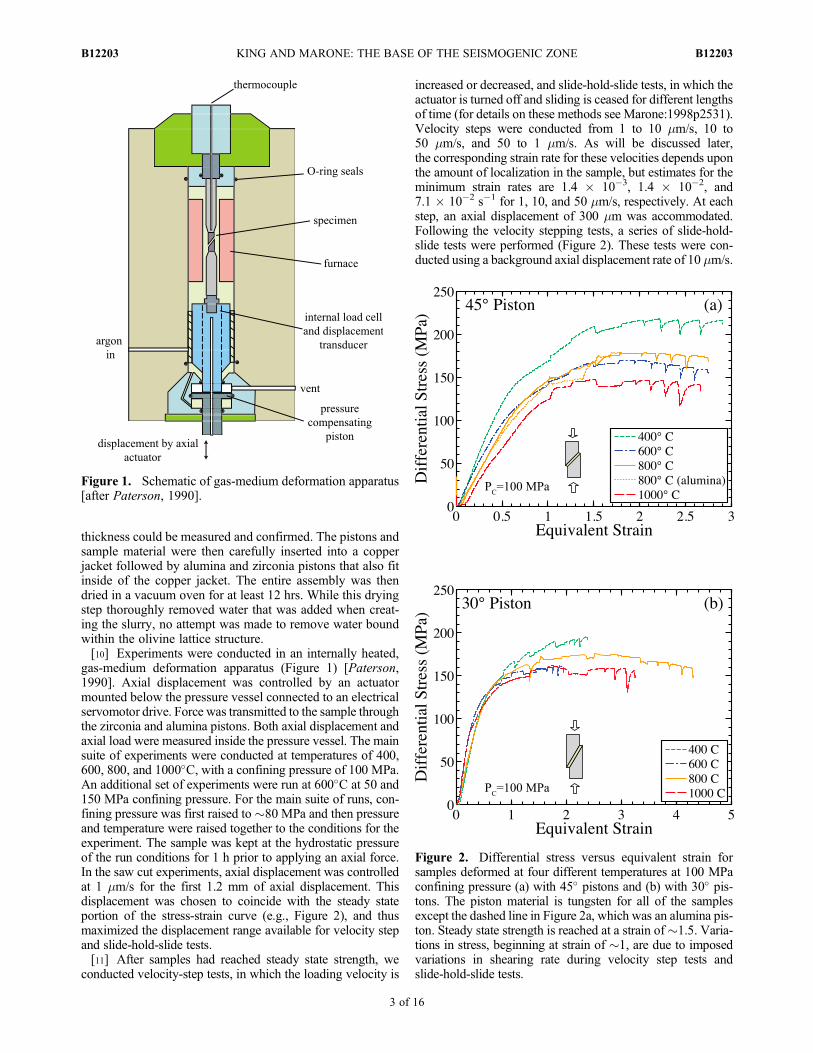
thickness could be measured and confirmed. The pistons andsample material were then carefully inserted into a copperjacket followed by alumina and zirconia pistons that also fitinside of the copper jacket. The entire assembly was thendried in a vacuum oven for at least 12 hrs. While this dryingstep thoroughly removed water that was added when creat-ing the slurry, no attempt was made to remove water boundwithin the olivine lattice structure.[10] Experiments were conducted in an internally heated,
gas-medium deformation apparatus (Figure 1) [Paterson,1990]. Axial displacement was controlled by an actuatormounted below the pressure vessel connected to an electricalservomotor drive. Force was transmitted to the sample throughthe zirconia and alumina pistons. Both axial displacement andaxial load were measured inside the pressure vessel. The mainsuite of experiments were conducted at temperatures of 400,600, 800, and 1000�C, with a confining pressure of 100 MPa.An additional set of experiments were run at 600�C at 50 and150 MPa confining pressure. For the main suite of runs, con-fining pressure was first raised to �80 MPa and then pressureand temperature were raised together to the conditions for theexperiment. The sample was kept at the hydrostatic pressureof the run conditions for 1 h prior to applying an axial force.In the saw cut experiments, axial displacement was controlledat 1 mm/s for the first 1.2 mm of axial displacement. Thisdisplacement was chosen to coincide with the steady stateportion of the stress-strain curve (e.g., Figure 2), and thusmaximized the displacement range available for velocity stepand slide-hold-slide tests.[11] After samples had reached steady state strength, we
conducted velocity-step tests, in which the loading velocity is
increased or decreased, and slide-hold-slide tests, in which theactuator is turned off and sliding is ceased for different lengthsof time (for details on these methods see Marone:1998p2531).Velocity steps were conducted from 1 to 10 mm/s, 10 to50 mm/s, and 50 to 1 mm/s. As will be discussed later,the corresponding strain rate for these velocities depends uponthe amount of localization in the sample, but estimates for theminimum strain rates are 1.4 � 10�3, 1.4 � 10�2, and7.1 � 10�2 s�1 for 1, 10, and 50 mm/s, respectively. At eachstep, an axial displacement of 300 mm was accommodated.Following the velocity stepping tests, a series of slide-hold-slide tests were performed (Figure 2). These tests were con-ducted using a background axial displacement rate of 10 mm/s.
Figure 1. Schematic of gas-medium deformation apparatus[after Paterson, 1990].
Figure 2. Differential stress versus equivalent strain forsamples deformed at four different temperatures at 100 MPaconfining pressure (a) with 45� pistons and (b) with 30� pis-tons. The piston material is tungsten for all of the samplesexcept the dashed line in Figure 2a, which was an alumina pis-ton. Steady state strength is reached at a strain of�1.5. Varia-tions in stress, beginning at strain of �1, are due to imposedvariations in shearing rate during velocity step tests andslide-hold-slide tests.
KING AND MARONE: THE BASE OF THE SEISMOGENIC ZONE B12203B12203
3 of 16
After strength had reached a steady value, the actuator wasturned off for hold times of 15, 100, 300, and 1000 s. Loadingthen began again at 10 mm/s and 200 mm of displacement wasimposed between each hold. Because the boundary conditionfor this test is that of constant load point position, if the samplecreeps, elastic unloading will occur. The testing apparatusincludes several elastic elements (steel end plug, ceramic pis-tons, and tungsten forcing block) between the actuator and thesliding surface. Consistent with previous works, we found thatcreep relaxation occurred during the hold periods. Velocitystep tests and slide-hold-slide tests were stopped after a max-imum axial displacement of�3.5 mm, which is limited due tothe risk of tearing the jacket at greater displacement.[12] To facilitate comparison of mechanical data with both
brittle and ductile deformation experiments, we presentresults in terms of differential stress and the friction coeffi-cient, m. We do not correct force measurements for thestrength of the jacket because the strength of copper is neg-ligible (<1 MPa) above �400�CC, as demonstrated in thecorrection factors for copper jackets developed inMoore andLockner [2008]. For the rate and state modeling, the frictioncoefficient m (shear stress t normalized by the normal stresssn) was calculated from the differential stress sdif, the angleof the gouge layer relative to the axial load f, and the con-fining pressure Pc according to:
m ¼ tsn
¼ sdif sin 2fð Þ2 sdif sin2 fð Þ þ Pc
� � : ð1Þ
[13] After deformation, when possible, the gouge layer wascarefully removed from the piston. A portion of the samplewas placed in a furnace in air at 950�C for �40 minutes tooxidize the sample and decorate the dislocations [Kohlstedtet al., 1976]. The samples were then vacuum impregnatedwith a low viscosity epoxy, cut perpendicular to the shearplane and parallel to the shearing direction, and polishedusing diamond lapping film to a 0.3-mm finish. The polishedsections were then examined using a reflected light micro-scope and a scanning electron microscope (SEM).
2.1. Rate and State Frictional Constitutive Framework
[14] Constitutive equations relating friction m to slidingvelocity V and a state variable q are powerful tools forapplying laboratory results to examine the dynamics ofearthquakes and faulting [Dieterich, 1979; Ruina, 1983].The rate/state framework has been successful in modelingobserved behavior of natural fault systems. However, amajor problem associated with these laws is a lack ofunderstanding of the micro-scale physical processes thatdictate state variable evolution and frictional sliding behav-ior. Here, we interrogate the efficacy of the rate/state con-stitutive laws for our data. We begin by presenting resultsfrom a modeling exercise in which best-fit RSF constitutiveparameters were determined. In section 4, we discuss thepossible physical basis for the parameters. The basic form ofthese laws [e.g. Marone, 1998a] is
m ¼ m0 þ a lnV
V0
� �þ b ln
V0qDc
� �ð2Þ
where m0 is a constant reference friction for steady state slipat velocity V0, a and b are empirical constants, and Dc is the
critical slip distance. The stability of sliding is determined bythe combined parameter (a – b) and elastic, continuumcoupling with the surroundings [Rice and Ruina, 1983].If (a � b) ≥ 0, the material deforms in a stable mode becauseit strengthens with increasing velocity. If (a� b) < 0, materialdeformation is potentially unstable because it weakens withincreasing velocity [Scholz, 1998]. Equation (4) must becoupled with an evolution equation for the state variable qand a description of elastoplastic continuum interactionsbetween frictional processes and the surrounding material.We use a 1D model to describe elastic interactions betweenthe gouge layer and the testing apparatus. For the modeling inour analysis, we use the formulation of Ruina [1983]:
dqdt
¼ �VqDc
lnVqDc
� �: ð3Þ
This equation emphasizes the dependence of the state vari-able on slip and sliding velocity, and it may fit more accu-rately the frictional response to perturbations in slip velocity[Bayart et al., 2006].
3. Results
3.1. Comparison of Sample Geometries
[15] The mechanical data from the two sets of saw cutexperiments (45� and 30� pistons) are similar, with bothshowing a period of stress increase that is independent oftemperature, followed by inelastic strain at approximatelyconstant strength (Figure 2). All of the experiments wereconducted to approximately the same amount of axial dis-placement, which translates to similar strain in the sampleswith 45� pistons in which great care was taken to preparelayers of the same thickness. In the samples deformed with30� piston, greater variation in sample thickness led to greatervariation in the strain experienced by the samples. In general,both sets show similar mechanical responses to imposedshearing. The primary difference is that the samples deformedwith a 30� piston reach a steady state differential stress at lessdisplacement (or a lower strain) than the samples deformedwith 45� pistons. Presumably, with a 45� piston the sampleexperiences greater compaction over a longer portion of thedisplacement, which leads a to a more gradual loading curve.[16] One concern that arose when conducting the experi-
ments was slight bending at the edges of tungsten pistons atthe higher temperatures (800 and 1000�C). The problem wasless significant with the 45� pistons in which the thickness ofthe tapered end of the piston was greater, but still occurred tosome extent. To evaluate if this bending contributed signif-icantly to the mechanical data, an experiment was conductedat 800�C using alumina pistons cut at 45� with the surfacesserrated using a saw blade, as for the tungsten pistons. Theresults from this experiment, plotted as the dashed line inFigure 2a, reveal both a similar magnitude of stress and asimilar mechanical response to velocity steps. This similaritywith the two different piston materials suggests that it isappropriate to interpret the mechanical results as reflective ofthe strength of the sample material.
3.2. Effects of Temperature on Strength and Friction
[17] In both sets of saw cut experiments (45� and 30� pis-tons), shear strength decreases with increasing temperature
KING AND MARONE: THE BASE OF THE SEISMOGENIC ZONE B12203B12203
4 of 16
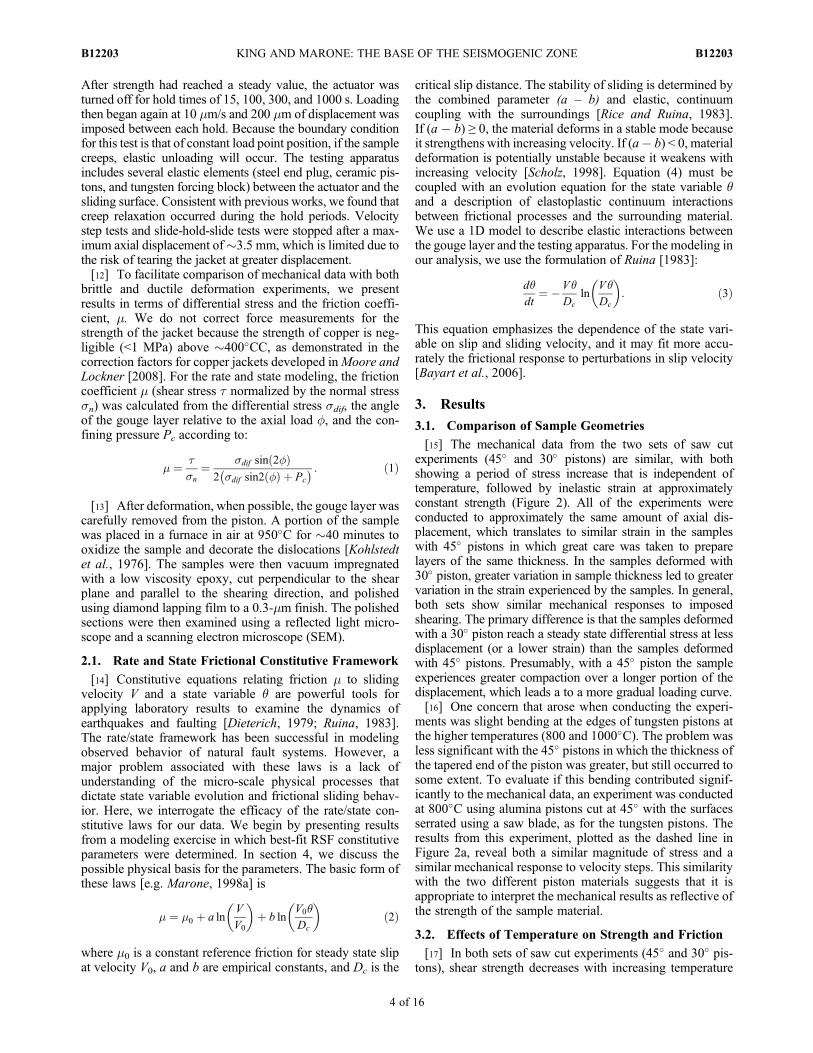
with the exception of the reversal of the samples deformed at600 and 800�C (Figure 2). Particularly in the experimentswith 45� pistons, early in the experiments, the 800�C samplesslide at about the same stress, or a slightly lower stress thanthe 600�C sample. The friction values are similar for the twosliding angles, with both showing a coefficient of slidingfriction of 0.45 to 0.5 (Figure 3). Later in the experiment, the800�C samples continue to strengthen more than the 600�Csample. These results suggest that some strain- or time-dependent strengthening process is active at 800�C that is notsignificant at lower temperatures. Possible mechanisms areconsidered in the discussion.
3.3. Effect of Mean Stress
[18] To explore the pressure sensitivity of deformation,experiments were performed at 50, 100 and 150 MPa at600�C. The mechanical data are plotted in Figure 4. The datashow the expected increase in peak stress with increasing pres-sure. The strength of the lowest pressure experiment (50 MPa)continues to increase with increasing displacement (strainhardens), while the two samples deformed at higher pressurereach a peak stress before weakening with increasing dis-placement (strain weakening). The strain weakening trendbegins after less displacement at 150 MPa than it does at100 MPa.
3.4. Transient Response of Gouge to Velocity Steps
[19] To explore the mechanical response of the powders tostepwise changes in velocity, a series of velocity steps wereperformed starting at 1.2 mm of axial displacement. The mainpurpose of these tests was to explore the temperature and strainrate conditions for which the material behavior is velocityweakening or velocity strengthening. Both sets of experimentswith different piston angles result in the same general patternsof stress evolution at the different temperatures that wereexplored. The tests reveal two transitions between velocitystrengthening and velocity weakening behavior. At 400�C,the sample behavior is velocity strengthening for all rate steps.At 600�C, sample behavior is nearly velocity neutral with theevolution closer to velocity weakening in rate steps withgreater sliding velocity. At 800�C, all of the rate steps showvelocity weakening behavior. At 1000�C, all of the samplesrespond with velocity strengthening behavior. The mechanicaldata for the three rate steps in the set of samples with 45�pistons are presented in Figure 5. To compare the data from thefour different temperatures, a linear fit was made to the
Figure 3. Friction coefficient (calculated from equation (1))is plotted versus equivalent strain for samples deformed at fourdifferent temperatures at 100 MPa confining pressure (a) with45� pistons and (b) with 30� pistons. The piston material istungsten for all of the samples except the dashed line inFigure 3a, which was an alumina piston. Steady state strengthis reached at a strain of�1.5. Variations in stress, beginning atstrain of�1, are due to imposed variations in shearing rate dur-ing velocity step tests and slide-hold-slide tests.
Figure 4. Differential stress versus shear displacement forsamples deformed at 600�C at three different confining pres-sures. Variations in strength are due to imposed variations inshearing rate during velocity step tests and slide-hold-slidetests.
KING AND MARONE: THE BASE OF THE SEISMOGENIC ZONE B12203B12203
5 of 16
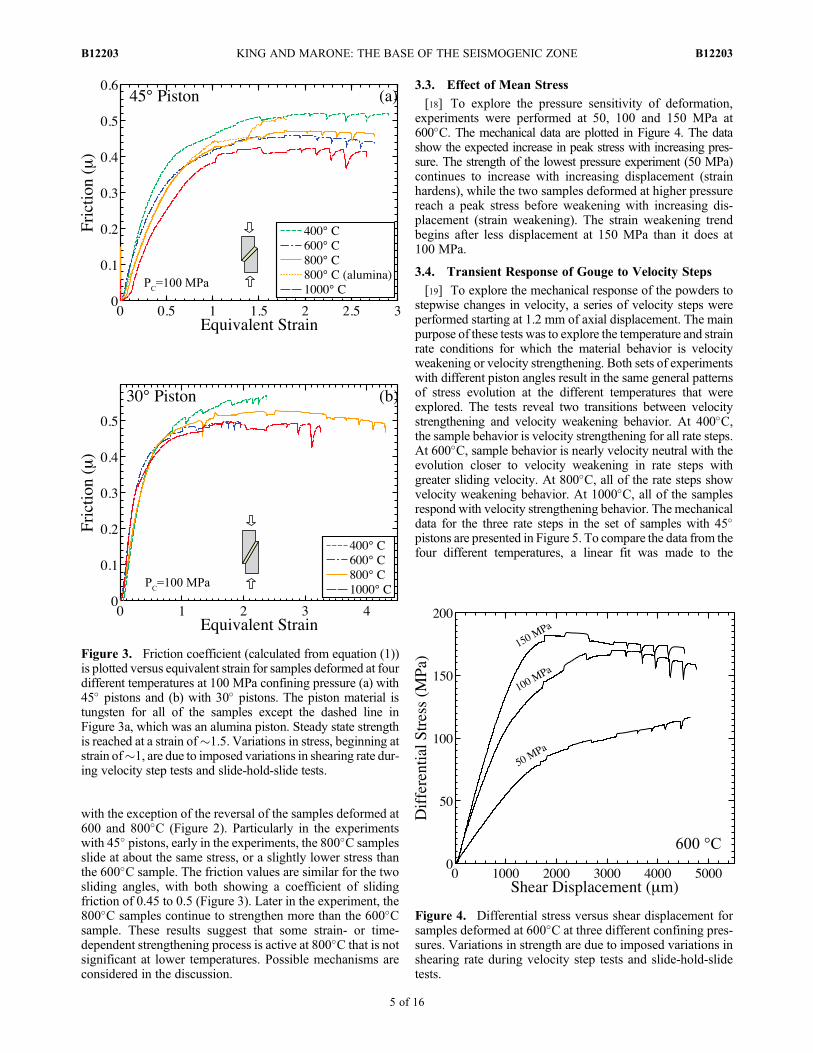
background strain hardening and removed. The data are pre-sented as the change in m as a function of displacement(Figure 5).3.4.1. One State Variable[20] We modeled friction velocity step tests with the RSF
laws in order to explore the direct and transient response to therate steps in more detail. As described in section 2.1, we usedthe state variable evolution law of Ruina [1983], whichemphasizes the role of displacement and contact junctionlifetime given by the ratio ofDc to V. In Figures 5a, 5b, and 5c,the data for the three different rate steps are plotted as pointsand the model fit is plotted as a line. Figure 5 shows data at twoscales, to give a better indication of the quality of the fit. InFigure 5d, the approximate magnitudes of a, b, and DC areindicated graphically for the sample deformed at 400�C. Thecomparison with the sample deformed at 800�C demonstratesthe significant difference in b (evolution parameter) betweenthe two temperatures. Figure 5e presents the first 150 mm ofdisplacement for all of the temperatures analyzed. The modeldoes not fit the data as well for steps down in velocity(Figure 5f). The data consistently have a more gradual drop inm compared to the model, as indicated in Figure 5f.[21] Systematic trends in the rate and state parameters with
temperature are apparent in the data (Figure 6). In general,all of the rate and state parameters, a, b, and Dc, increasewith increasing temperature. The direct effect (a parameter)
remains approximately constant at temperatures rangingfrom 400–800�C, with a significant increase at 1000�C(Figure 6a). The evolution effect (b parameter) increasesapproximately linearly with increasing temperature with theexception that b for the velocity drop from 50 mm/s to 1 mm/sis essentially zero at 1000�C (Figure 6c). However, as men-tioned above, the model has significantly greater misfit in thesteps down in velocity, and this is a poorly constrained value.The critical slip distance (DC) also increases approximatelylinearly with increasing temperature with significant scatterat 600�C (Figure 6b).[22] We are able to compare modeled values of a and DC
to those of Boettcher et al. [2007] (see their Figure 12). Thestudy of Boettcher et al. [2007] modeled only steps down invelocity. Considering the overall trend in DC observed here(disregarding for the moment the anomalously high valuesfor steps up in velocity at 600�C) the two data sets are inexcellent agreement with values ranging from �50–200.The different behavior for steps up in velocity at 600�Ccould result from a different process or from changes in thedegree of shear localization with velocity [e.g., Marone andKilgore, 1993; Marone et al., 2009]. The values of a in thisstudy are greater than the values in Boettcher et al. [2007] byabout a factor of two. This could be due to the fact thatBoettcher et al. modeled their data with the Dieterich (aging)friction evolution law, whereas we used the Ruina (slip) law,or it could be due in part to differences for velocity increasesversus decreases. Particularly at 1000�C, the value of a islower in the step down in velocity, which is quite close to thevalue determined in Boettcher et al. [2007].[23] Patterns in the data related to the sliding velocities are
also apparent, again with significant scatter. Perhaps moststriking is that the samples deformed at 400�C and 800�Chave essentially no variation in the rate and state parameterswithin the range of sliding velocities we explored. Thevalues of the direct effect increase with increasing slidingvelocity for the other temperatures.[24] The direct effect and evolution parameter combine to
determine the friction stability parameter (a-b), presented in(Figure 6d). This plot further reveals what can be seen in theraw data (Figure 5a): 1) that the gouge is velocity strength-ening for all rate steps at 400�C, 2) it is velocity weakeningfor all rate steps at 800�C, and 3) it is conditionally weak-ening for samples deformed at 600 and 1000�C, with velocityweakening behavior more likely with steps up in velocityrather than steps down. The friction parameter (a � b) doesnot appear to vary with sliding velocity for the lowest tem-perature, but it varies significantly with sliding velocity athigher temperatures.3.4.2. Two State Variables[25] We also fit our friction data with a two state variable
friction law, to determine if a two-mechanism model isappropriate for interpreting the observed frictional behavior[e.g., Reinen et al., 1992, 1994; Chester and Higgs, 1992;Chester, 1995].
m ¼ m0 þ a lnV
V0
� �þ b1 ln
V0qDC1
� �þ b2 ln
V0qDC2
� �ð4Þ
A comparison of the model fits for the rate step from 1 mm/sto 10 mm/s are presented in Figure 7. For the sampledeformed at 400�C, the two models fit the data essentially
Figure 5. Detail of the friction response for three types ofvelocity step tests at each temperature. Data are shown as dots.Lines are best-fit rate-state friction models. Figures 5d–5fshow detail of selected curves in Figures 5a–5c.Note that fric-tion response for velocity decrease from 50 to 1 mm/s at1000�C is not fit well.
KING AND MARONE: THE BASE OF THE SEISMOGENIC ZONE B12203B12203
6 of 16
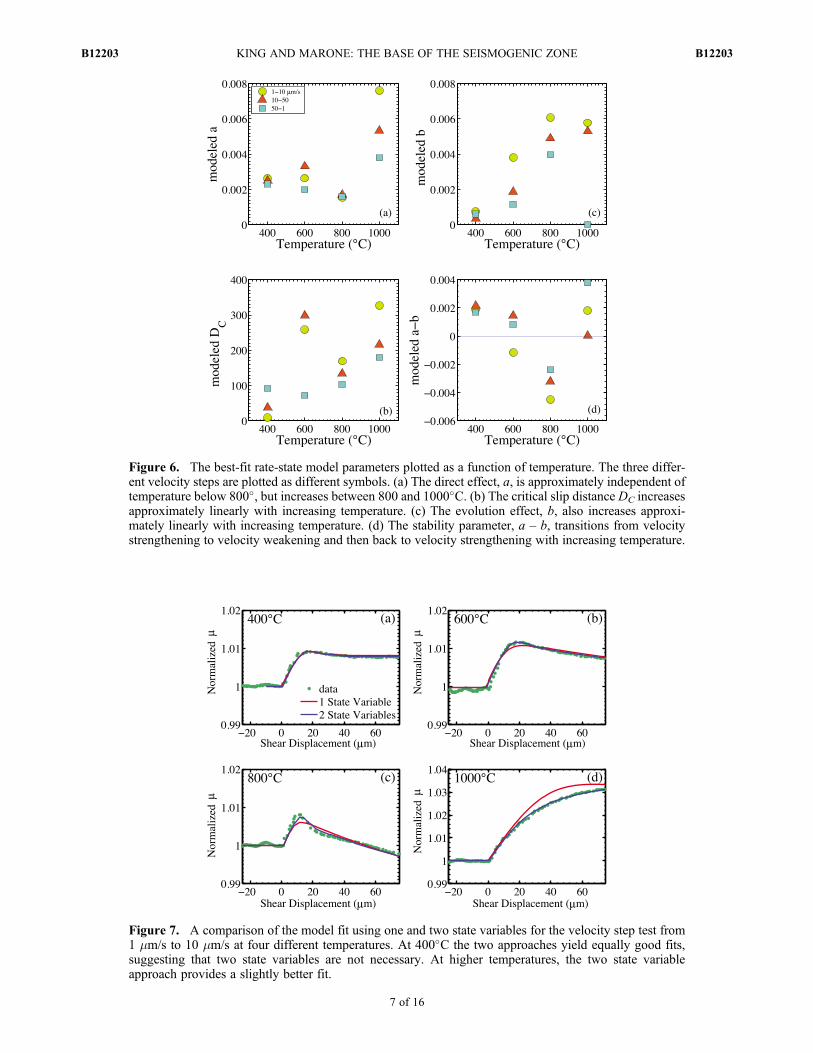
Figure 6. The best-fit rate-state model parameters plotted as a function of temperature. The three differ-ent velocity steps are plotted as different symbols. (a) The direct effect, a, is approximately independent oftemperature below 800�, but increases between 800 and 1000�C. (b) The critical slip distance DC increasesapproximately linearly with increasing temperature. (c) The evolution effect, b, also increases approxi-mately linearly with increasing temperature. (d) The stability parameter, a – b, transitions from velocitystrengthening to velocity weakening and then back to velocity strengthening with increasing temperature.
Figure 7. A comparison of the model fit using one and two state variables for the velocity step test from1 mm/s to 10 mm/s at four different temperatures. At 400�C the two approaches yield equally good fits,suggesting that two state variables are not necessary. At higher temperatures, the two state variableapproach provides a slightly better fit.
KING AND MARONE: THE BASE OF THE SEISMOGENIC ZONE B12203B12203
7 of 16
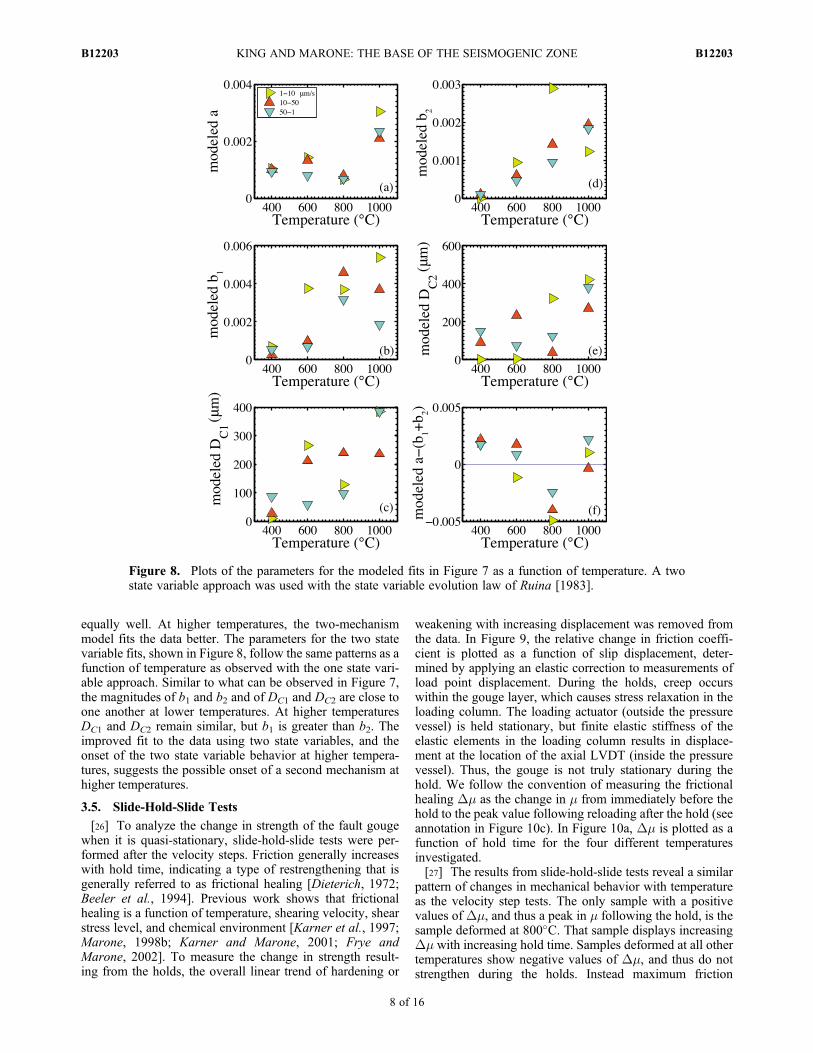
equally well. At higher temperatures, the two-mechanismmodel fits the data better. The parameters for the two statevariable fits, shown in Figure 8, follow the same patterns as afunction of temperature as observed with the one state vari-able approach. Similar to what can be observed in Figure 7,the magnitudes of b1 and b2 and of DC1 and DC2 are close toone another at lower temperatures. At higher temperaturesDC1 and DC2 remain similar, but b1 is greater than b2. Theimproved fit to the data using two state variables, and theonset of the two state variable behavior at higher tempera-tures, suggests the possible onset of a second mechanism athigher temperatures.
3.5. Slide-Hold-Slide Tests
[26] To analyze the change in strength of the fault gougewhen it is quasi-stationary, slide-hold-slide tests were per-formed after the velocity steps. Friction generally increaseswith hold time, indicating a type of restrengthening that isgenerally referred to as frictional healing [Dieterich, 1972;Beeler et al., 1994]. Previous work shows that frictionalhealing is a function of temperature, shearing velocity, shearstress level, and chemical environment [Karner et al., 1997;Marone, 1998b; Karner and Marone, 2001; Frye andMarone, 2002]. To measure the change in strength result-ing from the holds, the overall linear trend of hardening or
weakening with increasing displacement was removed fromthe data. In Figure 9, the relative change in friction coeffi-cient is plotted as a function of slip displacement, deter-mined by applying an elastic correction to measurements ofload point displacement. During the holds, creep occurswithin the gouge layer, which causes stress relaxation in theloading column. The loading actuator (outside the pressurevessel) is held stationary, but finite elastic stiffness of theelastic elements in the loading column results in displace-ment at the location of the axial LVDT (inside the pressurevessel). Thus, the gouge is not truly stationary during thehold. We follow the convention of measuring the frictionalhealing Dm as the change in m from immediately before thehold to the peak value following reloading after the hold (seeannotation in Figure 10c). In Figure 10a, Dm is plotted as afunction of hold time for the four different temperaturesinvestigated.[27] The results from slide-hold-slide tests reveal a similar
pattern of changes in mechanical behavior with temperatureas the velocity step tests. The only sample with a positivevalues of Dm, and thus a peak in m following the hold, is thesample deformed at 800�C. That sample displays increasingDm with increasing hold time. Samples deformed at all othertemperatures show negative values of Dm, and thus do notstrengthen during the holds. Instead maximum friction
Figure 8. Plots of the parameters for the modeled fits in Figure 7 as a function of temperature. A twostate variable approach was used with the state variable evolution law of Ruina [1983].
KING AND MARONE: THE BASE OF THE SEISMOGENIC ZONE B12203B12203
8 of 16
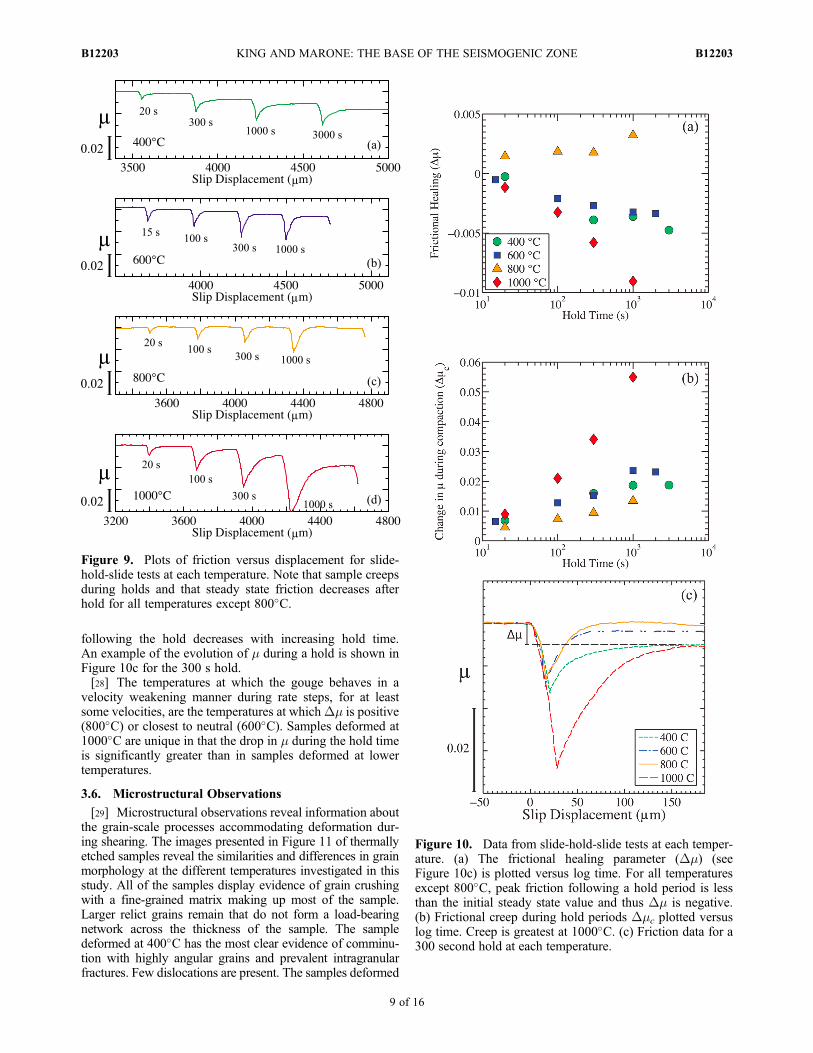
following the hold decreases with increasing hold time.An example of the evolution of m during a hold is shown inFigure 10c for the 300 s hold.[28] The temperatures at which the gouge behaves in a
velocity weakening manner during rate steps, for at leastsome velocities, are the temperatures at whichDm is positive(800�C) or closest to neutral (600�C). Samples deformed at1000�C are unique in that the drop in m during the hold timeis significantly greater than in samples deformed at lowertemperatures.
3.6. Microstructural Observations
[29] Microstructural observations reveal information aboutthe grain-scale processes accommodating deformation dur-ing shearing. The images presented in Figure 11 of thermallyetched samples reveal the similarities and differences in grainmorphology at the different temperatures investigated in thisstudy. All of the samples display evidence of grain crushingwith a fine-grained matrix making up most of the sample.Larger relict grains remain that do not form a load-bearingnetwork across the thickness of the sample. The sampledeformed at 400�C has the most clear evidence of comminu-tion with highly angular grains and prevalent intragranularfractures. Few dislocations are present. The samples deformed
Figure 9. Plots of friction versus displacement for slide-hold-slide tests at each temperature. Note that sample creepsduring holds and that steady state friction decreases afterhold for all temperatures except 800�C.
Figure 10. Data from slide-hold-slide tests at each temper-ature. (a) The frictional healing parameter (Dm) (seeFigure 10c) is plotted versus log time. For all temperaturesexcept 800�C, peak friction following a hold period is lessthan the initial steady state value and thus Dm is negative.(b) Frictional creep during hold periods Dmc plotted versuslog time. Creep is greatest at 1000�C. (c) Friction data for a300 second hold at each temperature.
KING AND MARONE: THE BASE OF THE SEISMOGENIC ZONE B12203B12203
9 of 16
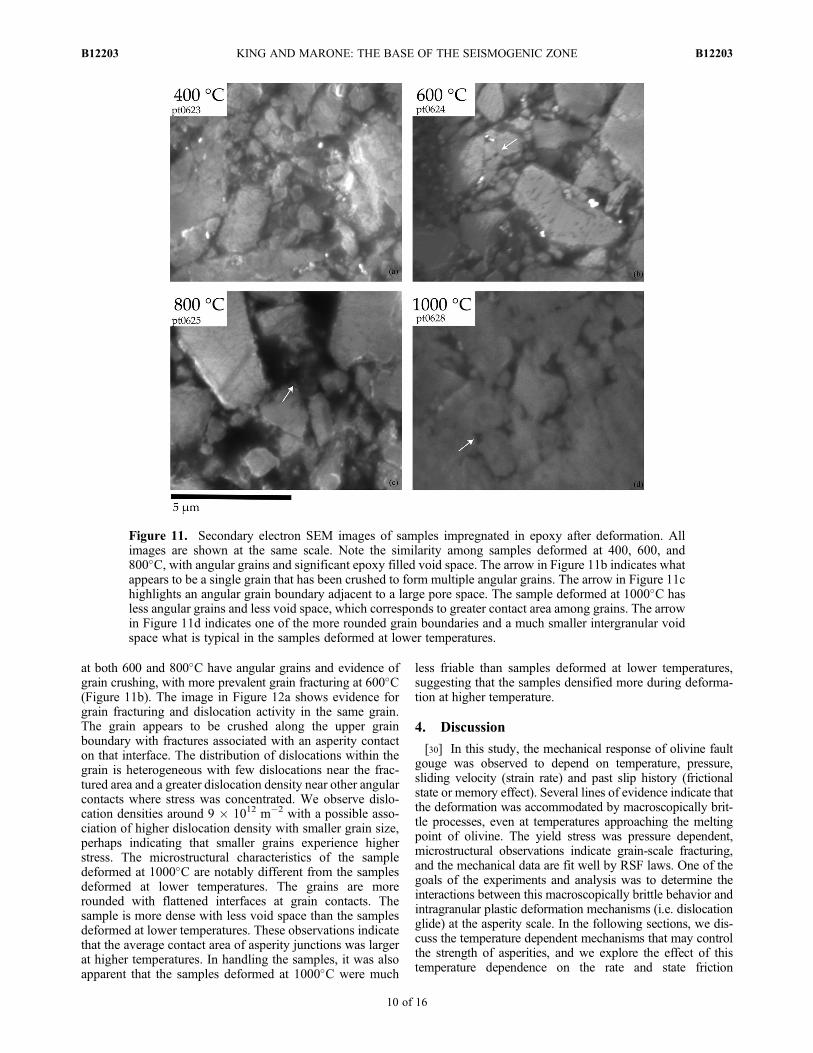
at both 600 and 800�C have angular grains and evidence ofgrain crushing, with more prevalent grain fracturing at 600�C(Figure 11b). The image in Figure 12a shows evidence forgrain fracturing and dislocation activity in the same grain.The grain appears to be crushed along the upper grainboundary with fractures associated with an asperity contacton that interface. The distribution of dislocations within thegrain is heterogeneous with few dislocations near the frac-tured area and a greater dislocation density near other angularcontacts where stress was concentrated. We observe dislo-cation densities around 9 � 1012 m�2 with a possible asso-ciation of higher dislocation density with smaller grain size,perhaps indicating that smaller grains experience higherstress. The microstructural characteristics of the sampledeformed at 1000�C are notably different from the samplesdeformed at lower temperatures. The grains are morerounded with flattened interfaces at grain contacts. Thesample is more dense with less void space than the samplesdeformed at lower temperatures. These observations indicatethat the average contact area of asperity junctions was largerat higher temperatures. In handling the samples, it was alsoapparent that the samples deformed at 1000�C were much
less friable than samples deformed at lower temperatures,suggesting that the samples densified more during deforma-tion at higher temperature.
4. Discussion
[30] In this study, the mechanical response of olivine faultgouge was observed to depend on temperature, pressure,sliding velocity (strain rate) and past slip history (frictionalstate or memory effect). Several lines of evidence indicate thatthe deformation was accommodated by macroscopically brit-tle processes, even at temperatures approaching the meltingpoint of olivine. The yield stress was pressure dependent,microstructural observations indicate grain-scale fracturing,and the mechanical data are fit well by RSF laws. One of thegoals of the experiments and analysis was to determine theinteractions between this macroscopically brittle behavior andintragranular plastic deformation mechanisms (i.e. dislocationglide) at the asperity scale. In the following sections, we dis-cuss the temperature dependent mechanisms that may controlthe strength of asperities, and we explore the effect of thistemperature dependence on the rate and state friction
Figure 11. Secondary electron SEM images of samples impregnated in epoxy after deformation. Allimages are shown at the same scale. Note the similarity among samples deformed at 400, 600, and800�C, with angular grains and significant epoxy filled void space. The arrow in Figure 11b indicates whatappears to be a single grain that has been crushed to form multiple angular grains. The arrow in Figure 11chighlights an angular grain boundary adjacent to a large pore space. The sample deformed at 1000�C hasless angular grains and less void space, which corresponds to greater contact area among grains. The arrowin Figure 11d indicates one of the more rounded grain boundaries and a much smaller intergranular voidspace what is typical in the samples deformed at lower temperatures.
KING AND MARONE: THE BASE OF THE SEISMOGENIC ZONE B12203B12203
10 of 16
parameters (described earlier in section 2.1). The results pro-vide insights into the physical mechanisms that underlie rateand state frictional behavior.
4.1. The Strength of Asperities
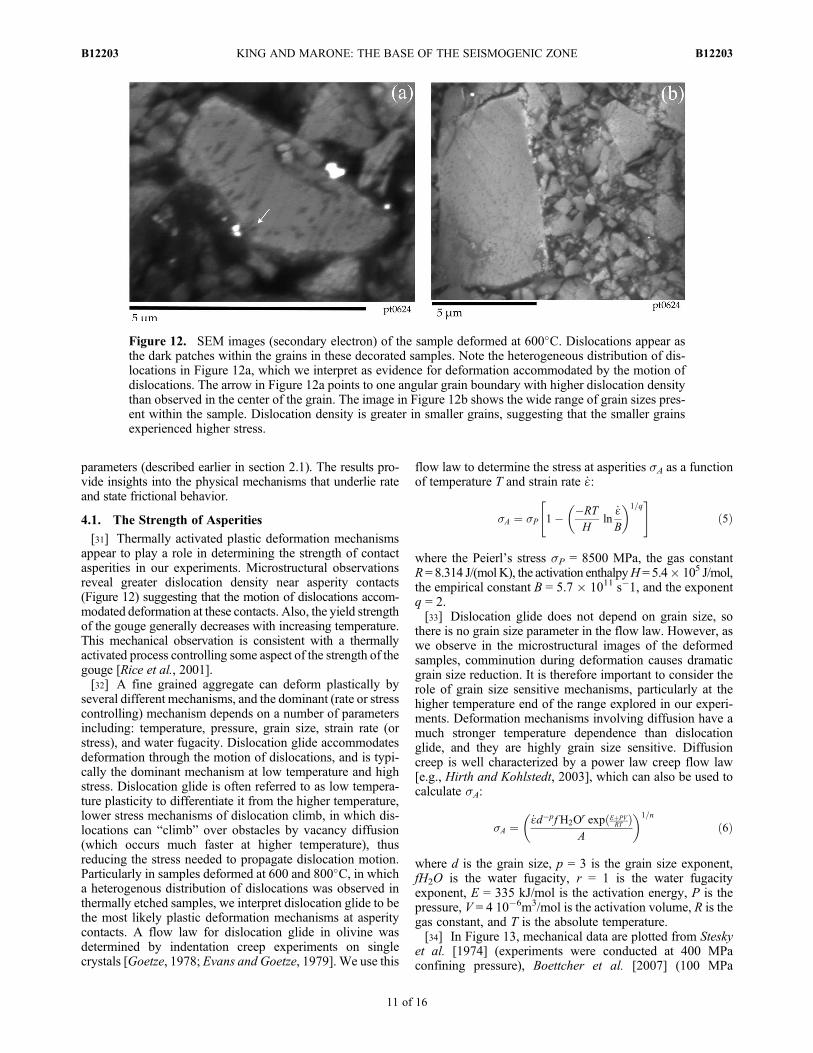
[31] Thermally activated plastic deformation mechanismsappear to play a role in determining the strength of contactasperities in our experiments. Microstructural observationsreveal greater dislocation density near asperity contacts(Figure 12) suggesting that the motion of dislocations accom-modated deformation at these contacts. Also, the yield strengthof the gouge generally decreases with increasing temperature.This mechanical observation is consistent with a thermallyactivated process controlling some aspect of the strength of thegouge [Rice et al., 2001].[32] A fine grained aggregate can deform plastically by
several different mechanisms, and the dominant (rate or stresscontrolling) mechanism depends on a number of parametersincluding: temperature, pressure, grain size, strain rate (orstress), and water fugacity. Dislocation glide accommodatesdeformation through the motion of dislocations, and is typi-cally the dominant mechanism at low temperature and highstress. Dislocation glide is often referred to as low tempera-ture plasticity to differentiate it from the higher temperature,lower stress mechanisms of dislocation climb, in which dis-locations can “climb” over obstacles by vacancy diffusion(which occurs much faster at higher temperature), thusreducing the stress needed to propagate dislocation motion.Particularly in samples deformed at 600 and 800�C, in whicha heterogenous distribution of dislocations was observed inthermally etched samples, we interpret dislocation glide to bethe most likely plastic deformation mechanisms at asperitycontacts. A flow law for dislocation glide in olivine wasdetermined by indentation creep experiments on singlecrystals [Goetze, 1978; Evans and Goetze, 1979]. We use this
flow law to determine the stress at asperities sA as a functionof temperature T and strain rate _ɛ:
sA ¼ sP 1� �RT
Hln
_ɛB
� �1=q" #
ð5Þ
where the Peierl’s stress sP = 8500 MPa, the gas constantR= 8.314 J/(mol K), the activation enthalpyH = 5.4� 105 J/mol,the empirical constant B = 5.7 � 1011 s�1, and the exponentq = 2.[33] Dislocation glide does not depend on grain size, so
there is no grain size parameter in the flow law. However, aswe observe in the microstructural images of the deformedsamples, comminution during deformation causes dramaticgrain size reduction. It is therefore important to consider therole of grain size sensitive mechanisms, particularly at thehigher temperature end of the range explored in our experi-ments. Deformation mechanisms involving diffusion have amuch stronger temperature dependence than dislocationglide, and they are highly grain size sensitive. Diffusioncreep is well characterized by a power law creep flow law[e.g., Hirth and Kohlstedt, 2003], which can also be used tocalculate sA:
sA ¼ _ɛd�pfH2Or exp EþPV
RTð ÞA
� �1=n
ð6Þ
where d is the grain size, p = 3 is the grain size exponent,fH2O is the water fugacity, r = 1 is the water fugacityexponent, E = 335 kJ/mol is the activation energy, P is thepressure, V = 4 10�6m3/mol is the activation volume, R is thegas constant, and T is the absolute temperature.[34] In Figure 13, mechanical data are plotted from Stesky
et al. [1974] (experiments were conducted at 400 MPaconfining pressure), Boettcher et al. [2007] (100 MPa
Figure 12. SEM images (secondary electron) of the sample deformed at 600�C. Dislocations appear asthe dark patches within the grains in these decorated samples. Note the heterogeneous distribution of dis-locations in Figure 12a, which we interpret as evidence for deformation accommodated by the motion ofdislocations. The arrow in Figure 12a points to one angular grain boundary with higher dislocation densitythan observed in the center of the grain. The image in Figure 12b shows the wide range of grain sizes pres-ent within the sample. Dislocation density is greater in smaller grains, suggesting that the smaller grainsexperienced higher stress.
KING AND MARONE: THE BASE OF THE SEISMOGENIC ZONE B12203B12203
11 of 16
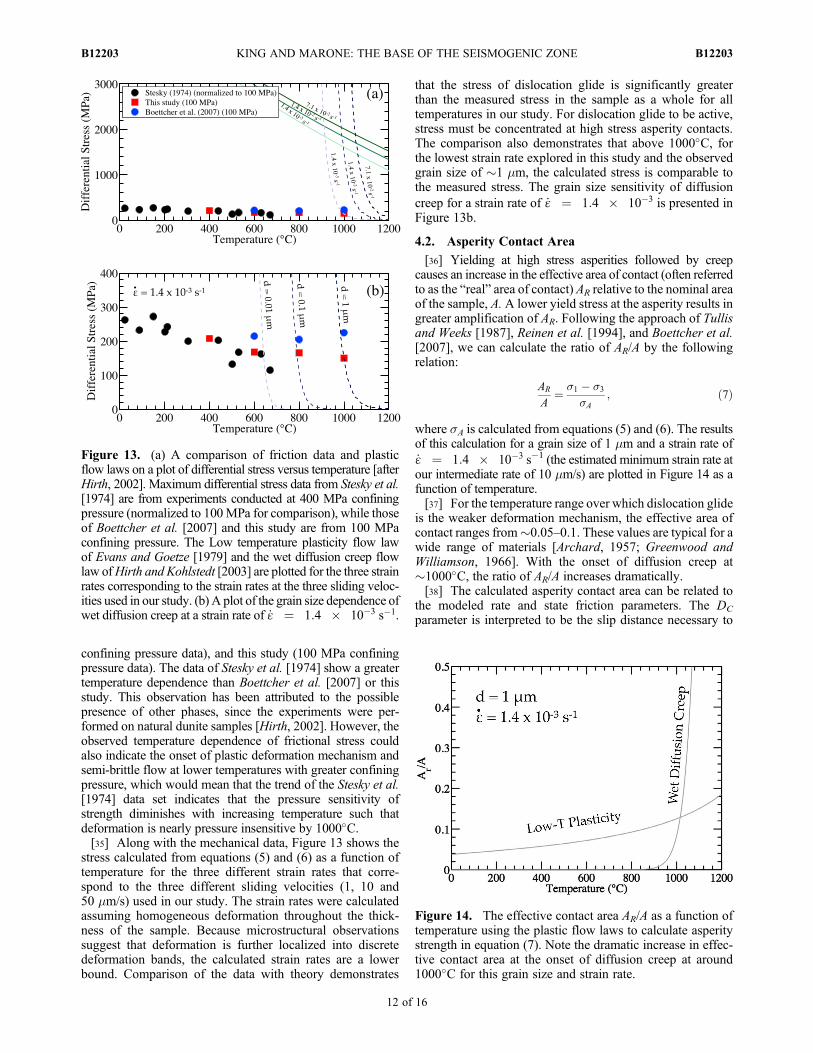
confining pressure data), and this study (100 MPa confiningpressure data). The data of Stesky et al. [1974] show a greatertemperature dependence than Boettcher et al. [2007] or thisstudy. This observation has been attributed to the possiblepresence of other phases, since the experiments were per-formed on natural dunite samples [Hirth, 2002]. However, theobserved temperature dependence of frictional stress couldalso indicate the onset of plastic deformation mechanism andsemi-brittle flow at lower temperatures with greater confiningpressure, which would mean that the trend of the Stesky et al.[1974] data set indicates that the pressure sensitivity ofstrength diminishes with increasing temperature such thatdeformation is nearly pressure insensitive by 1000�C.[35] Along with the mechanical data, Figure 13 shows the
stress calculated from equations (5) and (6) as a function oftemperature for the three different strain rates that corre-spond to the three different sliding velocities (1, 10 and50 mm/s) used in our study. The strain rates were calculatedassuming homogeneous deformation throughout the thick-ness of the sample. Because microstructural observationssuggest that deformation is further localized into discretedeformation bands, the calculated strain rates are a lowerbound. Comparison of the data with theory demonstrates
that the stress of dislocation glide is significantly greaterthan the measured stress in the sample as a whole for alltemperatures in our study. For dislocation glide to be active,stress must be concentrated at high stress asperity contacts.The comparison also demonstrates that above 1000�C, forthe lowest strain rate explored in this study and the observedgrain size of �1 mm, the calculated stress is comparable tothe measured stress. The grain size sensitivity of diffusioncreep for a strain rate of _ɛ ¼ 1:4 � 10�3 is presented inFigure 13b.
4.2. Asperity Contact Area
[36] Yielding at high stress asperities followed by creepcauses an increase in the effective area of contact (often referredto as the “real” area of contact) AR relative to the nominal areaof the sample, A. A lower yield stress at the asperity results ingreater amplification of AR. Following the approach of Tullisand Weeks [1987], Reinen et al. [1994], and Boettcher et al.[2007], we can calculate the ratio of AR/A by the followingrelation:
AR
A¼ s1 � s3
sA; ð7Þ
where sA is calculated from equations (5) and (6). The resultsof this calculation for a grain size of 1 mm and a strain rate of_ɛ ¼ 1:4 � 10�3 s�1 (the estimated minimum strain rate atour intermediate rate of 10 mm/s) are plotted in Figure 14 as afunction of temperature.[37] For the temperature range over which dislocation glide
is the weaker deformation mechanism, the effective area ofcontact ranges from�0.05–0.1. These values are typical for awide range of materials [Archard, 1957; Greenwood andWilliamson, 1966]. With the onset of diffusion creep at�1000�C, the ratio of AR/A increases dramatically.[38] The calculated asperity contact area can be related to
the modeled rate and state friction parameters. The DC
parameter is interpreted to be the slip distance necessary to
Figure 13. (a) A comparison of friction data and plasticflow laws on a plot of differential stress versus temperature [afterHirth, 2002]. Maximum differential stress data from Stesky et al.[1974] are from experiments conducted at 400 MPa confiningpressure (normalized to 100MPa for comparison), while thoseof Boettcher et al. [2007] and this study are from 100 MPaconfining pressure. The Low temperature plasticity flow lawof Evans and Goetze [1979] and the wet diffusion creep flowlaw ofHirth and Kohlstedt [2003] are plotted for the three strainrates corresponding to the strain rates at the three sliding veloc-ities used in our study. (b) A plot of the grain size dependence ofwet diffusion creep at a strain rate of _ɛ ¼ 1:4 � 10�3 s�1.
Figure 14. The effective contact area AR/A as a function oftemperature using the plastic flow laws to calculate asperitystrength in equation (7). Note the dramatic increase in effec-tive contact area at the onset of diffusion creep at around1000�C for this grain size and strain rate.
KING AND MARONE: THE BASE OF THE SEISMOGENIC ZONE B12203B12203
12 of 16
renew grain contacts. Increasing asperity contact area shouldcorrespond to a longer DC. Our results demonstrate that DC
increases with increasing temperature (Figure 6b).
4.3. Effect of Temperature on the Direct Effectand Evolution Effect
[39] While initially introduced as an empirical parameter[e.g., Dieterich, 1979; Ruina, 1983], the aln(V/V *) term ofequation (4) is widely interpreted to arise from a thermallyactivated process at asperity contacts for a broad range ofmaterials and conditions [e.g., Chester, 1995; Baumbergerand Berthoud, 1999; Rice et al., 2001; Nakatani, 2001;Beeler et al., 2007]. The general form of such a process is:
V ¼ V1 exp�E
kBT
� �; ð8Þ
where V is the sliding velocity, T is temperature, andkB = 1.38 � 10�23 m2kg/s2K is Boltzman’s constant. Theactivation energy has the form E = E′ � tAW in whichtA = msA is the average shear stress at asperity contacts andWis the activation volume. V1 is not an arbitrary velocity, butcan be regarded as a frequency of attempts over an activationbarrier times a slip distance per successful attempt [Riceet al., 2001]. By substituting equation (8) into equation (4)and rearranging, a theoretical formulation for the a parame-ter, such as that presented by Baumberger and Berthoud[1999], can be derived:
a ¼ kBT
sAW: ð9Þ
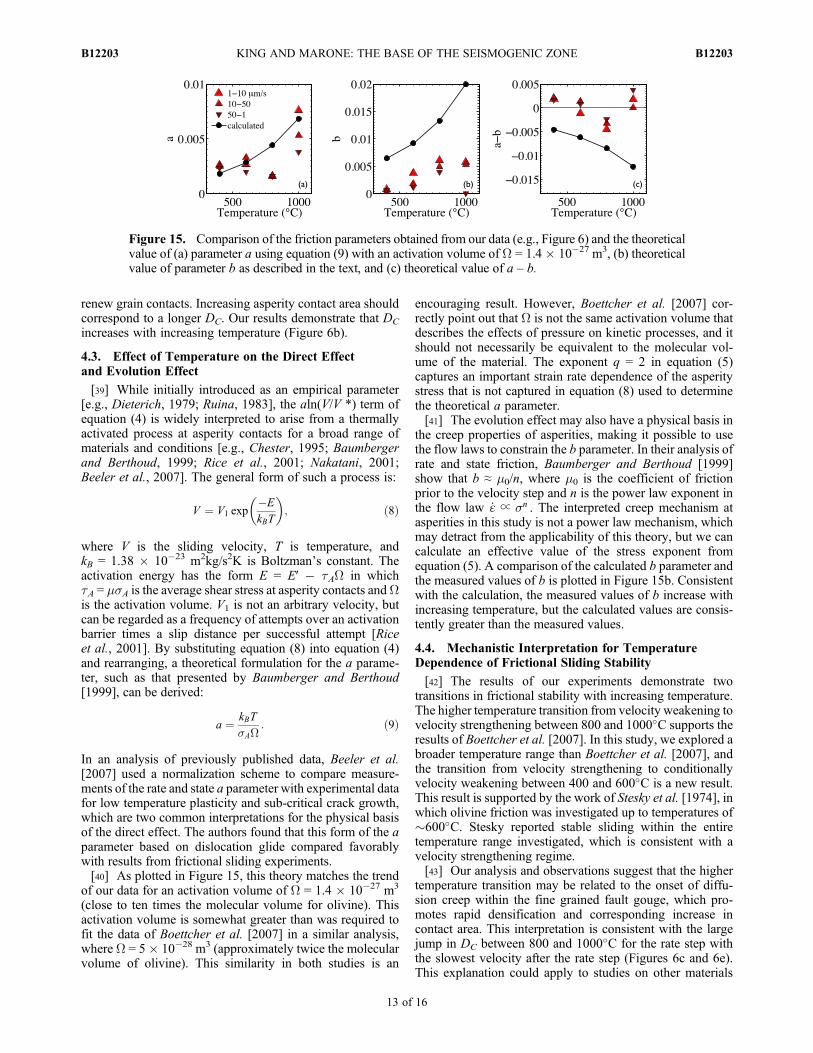
In an analysis of previously published data, Beeler et al.[2007] used a normalization scheme to compare measure-ments of the rate and state a parameter with experimental datafor low temperature plasticity and sub-critical crack growth,which are two common interpretations for the physical basisof the direct effect. The authors found that this form of the aparameter based on dislocation glide compared favorablywith results from frictional sliding experiments.[40] As plotted in Figure 15, this theory matches the trend
of our data for an activation volume of W = 1.4 � 10�27 m3
(close to ten times the molecular volume for olivine). Thisactivation volume is somewhat greater than was required tofit the data of Boettcher et al. [2007] in a similar analysis,where W = 5� 10�28 m3 (approximately twice the molecularvolume of olivine). This similarity in both studies is an
encouraging result. However, Boettcher et al. [2007] cor-rectly point out that W is not the same activation volume thatdescribes the effects of pressure on kinetic processes, and itshould not necessarily be equivalent to the molecular vol-ume of the material. The exponent q = 2 in equation (5)captures an important strain rate dependence of the asperitystress that is not captured in equation (8) used to determinethe theoretical a parameter.[41] The evolution effect may also have a physical basis in
the creep properties of asperities, making it possible to usethe flow laws to constrain the b parameter. In their analysis ofrate and state friction, Baumberger and Berthoud [1999]show that b ≈ m0/n, where m0 is the coefficient of frictionprior to the velocity step and n is the power law exponent inthe flow law _ɛ ∝ sn . The interpreted creep mechanism atasperities in this study is not a power law mechanism, whichmay detract from the applicability of this theory, but we cancalculate an effective value of the stress exponent fromequation (5). A comparison of the calculated b parameter andthe measured values of b is plotted in Figure 15b. Consistentwith the calculation, the measured values of b increase withincreasing temperature, but the calculated values are consis-tently greater than the measured values.
4.4. Mechanistic Interpretation for TemperatureDependence of Frictional Sliding Stability
[42] The results of our experiments demonstrate twotransitions in frictional stability with increasing temperature.The higher temperature transition from velocity weakening tovelocity strengthening between 800 and 1000�C supports theresults of Boettcher et al. [2007]. In this study, we explored abroader temperature range than Boettcher et al. [2007], andthe transition from velocity strengthening to conditionallyvelocity weakening between 400 and 600�C is a new result.This result is supported by the work of Stesky et al. [1974], inwhich olivine friction was investigated up to temperatures of�600�C. Stesky reported stable sliding within the entiretemperature range investigated, which is consistent with avelocity strengthening regime.[43] Our analysis and observations suggest that the higher
temperature transition may be related to the onset of diffu-sion creep within the fine grained fault gouge, which pro-motes rapid densification and corresponding increase incontact area. This interpretation is consistent with the largejump in DC between 800 and 1000�C for the rate step withthe slowest velocity after the rate step (Figures 6c and 6e).This explanation could apply to studies on other materials
Figure 15. Comparison of the friction parameters obtained from our data (e.g., Figure 6) and the theoreticalvalue of (a) parameter a using equation (9) with an activation volume of W = 1.4 � 10�27 m3, (b) theoreticalvalue of parameter b as described in the text, and (c) theoretical value of a – b.
KING AND MARONE: THE BASE OF THE SEISMOGENIC ZONE B12203B12203
13 of 16
with a similar transition in sliding stability with temperature.In the experiments of Blanpied et al. [1995], the transitionfrom velocity weakening to velocity strengthening isobserved in wet granite gouge at around 300�C, which is anappropriate temperature for diffusion creep to initiate at thestrain rates in the experiment [van Noort et al., 2008; vanNoort and Spiers, 2009]. Notably, the transition is notobserved in dry granite gouge, which should require a highertemperature for the activation of creep mechanisms.[44] A mechanistic interpretation for the lower tempera-
ture transition in sliding stability may lie simply in the dif-ferent dependence of a and b on temperature (black line inFigure 15). While the existing theory for the b parameter,described above, does not fit the magnitude of the data well, itdoes capture the trend of increasing value of b with increasingtemperature. The frictional stability parameter (a � b) is pre-dicted to be increasingly velocity weakening with increasingtemperature. The over-prediction of b from theory may resultfrom uncertainties in the relationship between stress and strainrate at these conditions [Boettcher et al., 2007].[45] The higher temperature switch from velocity weak-
ening to velocity strengthening between 800 and 1000�Cobserved in the data is a divergence from the trend describedabove and presented in Figure 15, which would predictincreasingly velocity weakening behavior with increasingtemperature. This higher temperature switch is more difficultto explain within this theoretical framework. With b ≈ m0/n,the only way to significantly decrease b is to significantlyincrease tn. We are not aware of a physically meaningfulmechanism for a large increase in n relative to low temper-ature plasticity. Our microstructural observations and ouranalysis of flow laws suggest an increasing importance ofdiffusion creep in this temperature range. Because n = 1 fordiffusion creep, this mechanism switch does not solve theproblem described above. Thus, our observations suggestthat this theoretical framework for b does not capture someimportant aspects of the temperature dependence of defor-mation. Perhaps as the grain contact area increases dramat-ically (as predicted in this temperature range in the analysis
of Figure 14) and viscous flow becomes a more importantcomponent of deformation, the apparent power law expo-nent framework for b no longer holds.
4.5. Implications
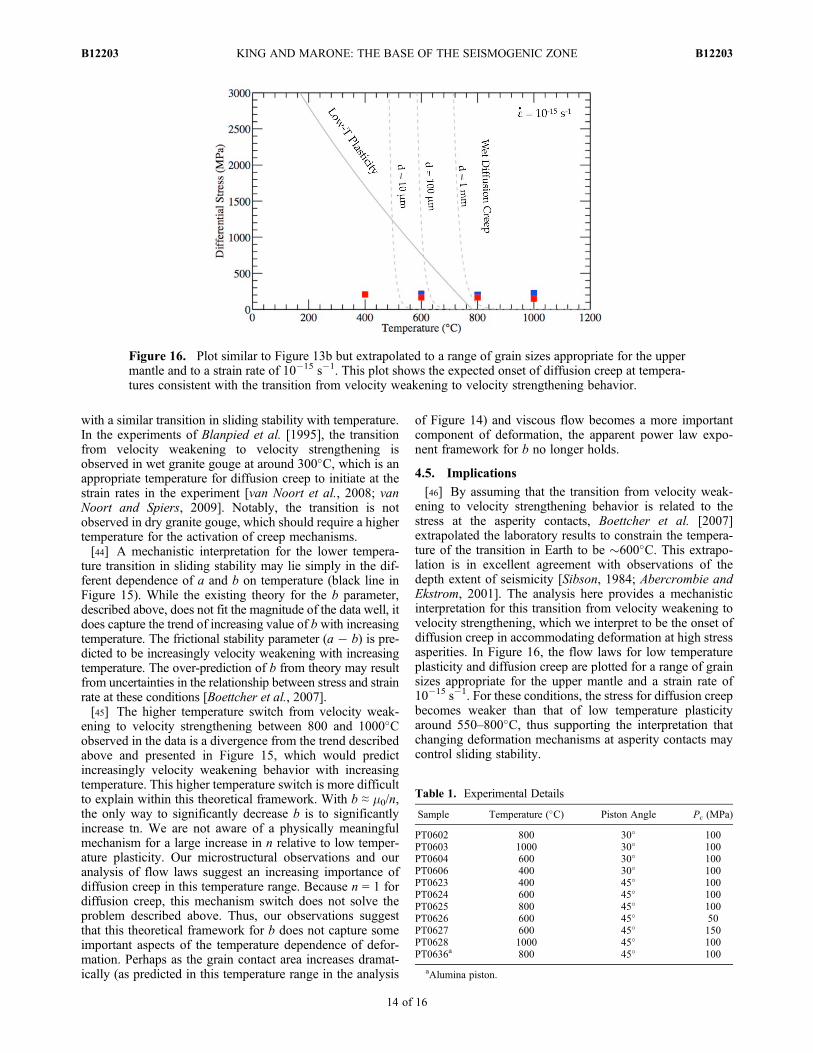
[46] By assuming that the transition from velocity weak-ening to velocity strengthening behavior is related to thestress at the asperity contacts, Boettcher et al. [2007]extrapolated the laboratory results to constrain the tempera-ture of the transition in Earth to be �600�C. This extrapo-lation is in excellent agreement with observations of thedepth extent of seismicity [Sibson, 1984; Abercrombie andEkstrom, 2001]. The analysis here provides a mechanisticinterpretation for this transition from velocity weakening tovelocity strengthening, which we interpret to be the onset ofdiffusion creep in accommodating deformation at high stressasperities. In Figure 16, the flow laws for low temperatureplasticity and diffusion creep are plotted for a range of grainsizes appropriate for the upper mantle and a strain rate of10�15 s�1. For these conditions, the stress for diffusion creepbecomes weaker than that of low temperature plasticityaround 550–800�C, thus supporting the interpretation thatchanging deformation mechanisms at asperity contacts maycontrol sliding stability.
Figure 16. Plot similar to Figure 13b but extrapolated to a range of grain sizes appropriate for the uppermantle and to a strain rate of 10�15 s�1. This plot shows the expected onset of diffusion creep at tempera-tures consistent with the transition from velocity weakening to velocity strengthening behavior.
Table 1. Experimental Details
Sample Temperature (�C) Piston Angle Pc (MPa)
PT0602 800 30� 100PT0603 1000 30� 100PT0604 600 30� 100PT0606 400 30� 100PT0623 400 45� 100PT0624 600 45� 100PT0625 800 45� 100PT0626 600 45� 50PT0627 600 45� 150PT0628 1000 45� 100PT0636a 800 45� 100
aAlumina piston.
KING AND MARONE: THE BASE OF THE SEISMOGENIC ZONE B12203B12203
14 of 16
[47] A similar variation in sliding stability with tempera-ture with velocity strengthening at low and high temperaturesand velocity weakening at intermediate temperatures hasbeen observed in other materials [Blanpied et al., 1995; Heet al., 2007; Tembe et al., 2009; den Hartog et al., 2012].Additionally, experimental studies have found that in somesettings, the weakening predicted from mineral alteration isnot enough to explain geological observations, and thermallyactivated dissolution-precipitation creep processes may beimportant to consider [Smith and Faulkner, 2010]. This worksupports the interpretation that this temperature dependencecan be understood through relating the RSF parameters toplastic deformation at asperity contacts. All of these materialsare weaker than olivine, and have lower activation energiesfor plastic deformation, so the lower temperatures at whichthe stability transition is observed is consistent with theinterpreted role of plastic deformation.
5. Conclusions
[48] We observe multiple transitions in frictional slidingstability with temperature in sheared layers of fine grainedolivine gouge. These transitions can be understood throughthe role of plastic deformation at asperity contacts. Thematerial becomes increasingly velocity weakening withincreasing temperature within the temperature range thatdislocation glide is the dominant yielding mechanism at
asperities. At higher temperatures, with dependence upongrain size and strain rate, diffusion creep processes canweaken the asperity contacts leading to increased contactarea and densification. These transitions in sliding stabilityobserved in laboratory experiments can be extrapolated toupper mantle conditions and are consistent with observationsof the depth extent of seismicity along oceanic transformfaults (Tables 1 and 2).
[49] Acknowledgments. This material is based upon work supported bythe National Science Foundation Award EAR-0948246 (to DSHK) as wellas EAR-0950517 and EAR-0911569 (to CM). We thank David Kohlstedtfor allowing the use of laboratory facilities supported by the National ScienceFoundation Award EAR-1214876. We also thank Y. Bernabe, L. Montesi,and an anonymous reviewer for critical comments that improved the paper.
ReferencesAbercrombie, R., and G. Ekstrom (2001), Earthquake slip on oceanic trans-form faults, Nature, 410(6824), 74–77.
Archard, J. (1957), Elastic deformation and the laws of friction, Proc. R.Soc. London, Series A, 243(1233), 190–205.
Baumberger, T., and P. Berthoud (1999), Physical analysis of the state- andrate-dependent friction law. II. Dynamic friction, Phys. Rev. B, 60(6),3928–3939.
Bayart, E., A. Rubin, and C. Marone, (2006), Evolution of fault friction fol-lowing large velocity jumps, Eos Trans. AGU, 87(52), Fall Meet. Suppl.,Abstract S31A-0180.
Beeler, N., T. E. Tullis, and J. Weeks (1994), The roles of time and dis-placement in the evolution dffect in rock friction, Geophys. Res. Lett.,21(18), 1987–1990.
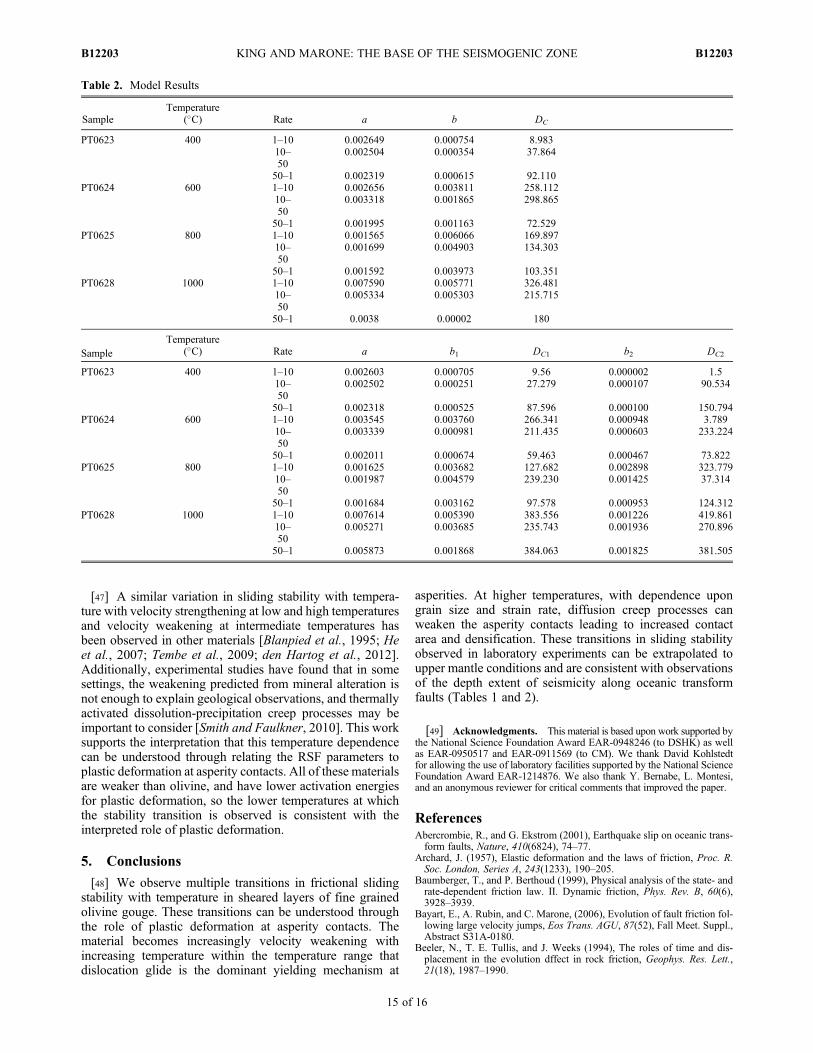
Table 2. Model Results
SampleTemperature
(�C) Rate a b DC
PT0623 400 1–10 0.002649 0.000754 8.98310–50
0.002504 0.000354 37.864
50–1 0.002319 0.000615 92.110PT0624 600 1–10 0.002656 0.003811 258.112
10–50
0.003318 0.001865 298.865
50–1 0.001995 0.001163 72.529PT0625 800 1–10 0.001565 0.006066 169.897
10–50
0.001699 0.004903 134.303
50–1 0.001592 0.003973 103.351PT0628 1000 1–10 0.007590 0.005771 326.481
10–50
0.005334 0.005303 215.715
50–1 0.0038 0.00002 180
SampleTemperature
(�C) Rate a b1 DC1 b2 DC2
PT0623 400 1–10 0.002603 0.000705 9.56 0.000002 1.510–50
0.002502 0.000251 27.279 0.000107 90.534
50–1 0.002318 0.000525 87.596 0.000100 150.794PT0624 600 1–10 0.003545 0.003760 266.341 0.000948 3.789
10–50
0.003339 0.000981 211.435 0.000603 233.224
50–1 0.002011 0.000674 59.463 0.000467 73.822PT0625 800 1–10 0.001625 0.003682 127.682 0.002898 323.779
10–50
0.001987 0.004579 239.230 0.001425 37.314
50–1 0.001684 0.003162 97.578 0.000953 124.312PT0628 1000 1–10 0.007614 0.005390 383.556 0.001226 419.861
10–50
0.005271 0.003685 235.743 0.001936 270.896
50–1 0.005873 0.001868 384.063 0.001825 381.505
KING AND MARONE: THE BASE OF THE SEISMOGENIC ZONE B12203B12203
15 of 16
Beeler, N. M., T. E. Tullis, A. K. Kronenberg, and L. A. Reinen (2007), Theinstantaneous rate dependence in low temperature laboratory rock frictionand rock deformation experiments, J. Geophys. Res., 112, B07310,doi:10.1029/2005JB003772.
Blanpied, M., D. Lockner, and J. Byerlee (1995), Frictional slip of granite athydrothermal conditions, J. Geophys. Res., 100(B7), 13,045–13,064.
Boettcher, M. S., G. Hirth, and B. Evans (2007), Olivine friction at the baseof oceanic seismogenic zones, J. Geophys. Res., 112, B01205, doi:10.1029/2006JB004301.
Bos, B., and C. Spiers (2000), Effect of phyllosilicates on fluid-assistedhealing of gouge-bearing faults, Earth Planet. Sci. Lett., 184(1), 199–210.
Brace, W., and D. L. Kohlstedt (1980), Limits on lithospheric stressimposed by laboratory experiments, J. Geophys. Res., 85, 6248–6252.
Byerlee, J. (1978), Friction of rocks, Pure Appl. Geophys., 116, 615–627.Chester, F. (1995), A rheologic model for wet crust applied to strike-slipfaults, J. Geophys. Res., 100, 13,033–13,044.
Chester, F., and N. Higgs (1992), Multimechanism friction constitutivemodel for ultrafine quartz gouge at hypocentral conditions, J. Geophys.Res., 97(B2), 1859–1870.
den Hartog, S. A. M., C. J. Peach, D. A. M. de Winter, C. J. Spiers, andT. Shimamoto (2012), Frictional properties of megathrust fault gougesat low sliding velocities: New data on effects of normal stress and temper-ature, J. Struct. Geol., 38, 156–171.
Dieterich, J. (1972), Time-dependent friction as a possible mechanism foraftershocks, J. Geophys. Res., 77, 3771–3781.
Dieterich, J. (1979), Modeling of rock friction: 1. Experimental results andconstitutive equations, J. Geophys. Res., 84(B5), 2161–2170.
Escartin, J., G. Hirth, and B. Evans (1997), Effects of serpentinization onthe lithospheric strength and the style of normal faulting at slow-spreadingridges, Earth Planet. Sci. Lett., 151(3–4), 181–189.
Escartin, J., G. Hirth, and B. Evans (2001), Strength of slightly serpenti-nized peridotites: Implications for the tectonics of oceanic lithosphere,Geology, 29(11), 1023–1026.
Evans, B., and C. Goetze (1979), The temperature variation of hardness ofolivine and its implications for polycrystalline yield stress, J. Geophys.Res., 84(B10), 5505–5524.
Frye, K. M., and C. Marone (2002), Effect of humidity on granular frictionat room temperature, J. Geophys. Res., 107(B11), 2309, doi:10.1029/2001JB000654.
Goetze, C. (1978), Mechanisms of creep in olivine, Philos. Trans. R. Soc.London, Ser. A, 288, 99–119.
Greenwood, J., and J. Williamson (1966), Contact of nominally flat sur-faces, Proc. R. Soc. London, Ser. A, 295(1442), 300–319.
He, C., Z. Wang, and W. Yao (2007), Frictional sliding of gabbro gougeunder hydrothermal conditions, Tectonophysics, 445(3–4), 353–362.
Heslot, F., T. Baumberger, B. Perrin, B. Caroli, and C. Caroli (1994),Creep, stick-slip, and dry-friction dynamics—Experiments and a heuristicmodel, Phys. Rev. E, 49(6), 4973–4988.
Hirth, G. (2002), Laboratory constraints on the rheology of the upper man-tle, in Reviews in Mineralogy and Geochemistry, edited by S.-Y. Karatoand H.-R. Wenk, pp. 97–120, Mineral. Soc. of Am., Washington, D. C.
Hirth, G., and D. L. Kohlstedt (2003), Rheology of the upper mantle and themantle wedge: A view from the experimentalists, in Inside the SubductionFactory, Geophys. Monogr. Ser., vol. 138, pp. 83–105, AGU, Washington,D. C.
Hobbs, B. E., H. Muhlhaus, and A. Ord (1990), Instability, softening andlocalization of deformation, Geol. Soc. Spec. Publ., 54, 143–165.
Karner, S., and C. Marone (2001), Frictional restrengthening in simulatedfault gouge: Effect of shear load perturbations, J. Geophys. Res., 106(B9),19,319–19,337.
Karner, S., C. Marone, and B. Evans (1997), Laboratory study of fault heal-ing and lithification in simulated fault gouge under hydrothermal condi-tions, Tectonophysics, 277, 41–55.
Kohlstedt, D. L., C. Goetze, W. B. Durham, and J. Sande (1976), New tech-nique for decorating dislocations in olivine, Science, 191, 1045–1046.
Kohlstedt, D. L., B. Evans, and S. J. Mackwell (1995), Strength of the lith-osphere: Constraints imposed by laboratory experiments, J. Geophys.Res., 100(B9), 17,587–17,602.
Li, Q., T. E. Tullis, D. Goldsby, and R. W. Carpick (2011), Frictional age-ing from interfacial bonding and the origins of rate and state friction,Nature, 480(7376), 233–236.
Marone, C. (1998a), Laboratory-derived friction laws and their applicationto seismic faulting, Annu. Rev. Earth Planet. Sci., 26(1), 643–696.
Marone, C. (1998b), The effect of loading rate on static friction and the rateof fault healing during the earthquake cycle, Nature, 391, 69–72.
Marone, C., and B. Kilgore (1993), Scaling of the critical slip distance forseismic faulting with shear strain in fault zones, Nature, 362(6421),618–621.
Marone, C., and C. Scholz (1988), The depth of seismic faulting and theupper transition from stable to unstable slip regimes, Geophys. Res. Lett.,15(6), 621–624.
Marone, C., M. Cocco, E. Richardson, and E. Tinti (2009), The critical slipdistance for seismic and aseismic fault zones of finite width, in Fault-ZoneProperties and Earthquake Rupture Dynamics, edited by E. Fukuyama,pp. 135–162, Elsevier, New York.
Montesi, L. G. J., and M. T. Zuber (2002), A unified description of locali-zation for application to large-scale tectonics, J. Geophys. Res., 107(B3),2045, doi:10.1029/2001JB000465.
Moore, D. E., and D. A. Lockner (2008), Talc friction in the temperaturerange 25 degrees–400 degrees C: Relevance for fault-zone weakening,Tectonophysics, 449, 120–132.
Nakatani, M. (2001), Conceptual and physical clarification of rate and statefriction: Frictional sliding as a thermally activated rheology, J. Geophys.Res., 106(B7), 13,347–13,380.
Niemeijer, A. R., and C. J. Spiers (2006), Velocity dependence of strengthand healing behaviour in simulated phyllosilicate-bearing fault gouge,Tectonophysics , 427 , 231–253.
Paterson, M. S. (1990), Rock deformation experimentation, in The Brittle-Ductile Transition in Rocks: The Heard Volume, Geophys. Monogr. Ser.,vol. 56, edited by A. G. Duba et al., pp. 187–194, AGU, Washington,D. C.
Reinen, L. A., T. E. Tullis, and J. Weeks, J. (1992), Two-mechanism modelfor frictional sliding of serpentinite, Geophys. Res. Lett., 19(15), 1535–1538.
Reinen, L. A., J. Weeks, and T. E. Tullis (1994), The frictional behavior oflizardite and antigorite serpentinites: Experiments, constitutive models,and implications for natural faults, Pure Appl. Geophys., 143(1/2/3),317–358.
Rice, J. R., and A. L. Ruina (1983), Stability of steady frictional slipping,J. Appl. Mech., 50(2), 343–349.
Rice, J. R., N. Lapusta, and K. Ranjith (2001), Rate and state dependentfriction and the stability of sliding between elastically deformable solids,J. Mech. Phys. Solids, 49(9), 1865–1898.
Ruina, A. (1983), Slip instability and state variable friction laws, J. Geophys.Res., 88(B12), 10,359–10,370.
Scholz, C. (1998), Earthquakes and friction laws, Nature, 391, 37–42.Shimamoto, T. (1986), Transition between frictional slip and ductile flowfor halite shear zones at room temperature, Science, 231(4739), 711–714.
Sibson, R. H. (1984), Roughness at the base of the seismogenic zone:Contributing factors, J. Geophys. Res., 89(B7), 5791–5799.
Sleep, N. (1997), Application of a unified rate and state friction theory tothe mechanics of fault zones with strain localization, J. Geophys. Res.,102(B2), 2875–2895.
Smith, S. A. F., and D. R. Faulkner (2010), Laboratory measurements of thefrictional properties of the Zuccale low-angle normal fault, Elba Island,Italy, J. Geophys. Res., 115, B02407, doi:10.1029/2008JB006274.
Stesky, R., W. Brace, and D. Riley (1974), Friction in faulted rock at hightemperature and pressure, Tectonophysics, 23, 177–203.
Stesky, R. M. (1978), Rock friction-effect of confining pressure, tempera-ture, and pore pressure, Pure Appl. Geophys., 116(4–5), 690–704.
Tembe, S., D. Lockner, and T.-F. Wong (2009), Constraints on the stressstate of the San Andreas Fault with analysis based on core and cuttings fromSan Andreas Fault Observatory at Depth (SAFOD) drilling phases 1 and 2,J. Geophys. Res., 114, B11401, doi:10.1029/2008JB005883.
Tenthorey, E., and S. F. Cox (2006), Cohesive strengthening of fault zonesduring the interseismic period: An experimental study, J. Geophys. Res.,111, B09202, doi:10.1029/2005JB004122.
Tenthorey, E., C. Scholz, E. Aharonov, and A. Leger (1998), Precipitationsealing and diagenesis: 1. Experimental results, J. Geophys. Res., 103,23,951–23,967.
Tullis, T. E., and J. Weeks (1987), Micromechanics of frictional resistanceof calcite, Eos Trans. AGU, 68, 405.
van Noort, R., and C. J. Spiers (2009), Kinetic effects of microscale plastic-ity at grain boundaries during pressure solution, J. Geophys. Res., 114,B03206, doi:10.1029/2008JB005634.
van Noort, R., C. J. Spiers, and G. M. Pennock (2008), Compaction of gran-ular quartz under hydrothermal conditions: Controlling mechanisms andgrain boundary processes, J. Geophys. Res., 113, B12206, doi:10.1029/2008JB005815.
KING AND MARONE: THE BASE OF THE SEISMOGENIC ZONE B12203B12203
16 of 16


![Effect of strain localization on frictional behavior of ...cjm38/papers_talks/RathbunMaroneJGR2010.pdf1. Introduction [2] The localization of strain in brittle shear zones has broad](https://img.pdfslide.us/doc/110x75/5f0f1e097e708231d442935e/effect-of-strain-localization-on-frictional-behavior-of-cjm38paperstalks.jpg)


![Physical properties of surface outcrop cataclastic fault rocks ...cjm38/papers_talks/BoultonetalG3...2. Surface Exposure Fault Rocks [5] Over the last 5–8 Ma, oblique slip on the](https://img.pdfslide.us/doc/110x75/6071e9f1236d51699829a330/physical-properties-of-surface-outcrop-cataclastic-fault-rocks-cjm38paperstalksboultonetalg3.jpg)