Embed Size (px)
Citation preview

LUND UNIVERSITY
PO Box 117221 00 Lund+46 46-222 00 00
Friction Stir Welding of Copper Canisters Using Power and Temperature Control
Cederqvist, Lars
Published: 2011-01-01
Link to publication
Citation for published version (APA):Cederqvist, L. (2011). Friction Stir Welding of Copper Canisters Using Power and Temperature Control
General rightsCopyright and moral rights for the publications made accessible in the public portal are retained by the authorsand/or other copyright owners and it is a condition of accessing publications that users recognise and abide by thelegal requirements associated with these rights.
• Users may download and print one copy of any publication from the public portal for the purpose of privatestudy or research. • You may not further distribute the material or use it for any profit-making activity or commercial gain • You may freely distribute the URL identifying the publication in the public portalTake down policyIf you believe that this document breaches copyright please contact us providing details, and we will removeaccess to the work immediately and investigate your claim.

Division of Machine Design • Department of Design SciencesFaculty of Engineering LTH • Lund University
2011
Friction Stir Welding of Copper Canisters Using Power and Temperature Control
Lars Cederqvist
Lars Ced
erqvist Frictio
n Stir W
eldin
g o
f Co
pp
er Can
isters Usin
g Po
wer an
d Tem
peratu
re Co
ntro
l Lun
d 2011
Division of Machine Design, Department of Design SciencesFaculty of Engineering LTH, Lund UniversityP.O. Box 118, SE-221 00 LUND, Swedenwww.mkon.lth.se
ISBN 978-91-7473-136-1ISRN LUTMDN/TMKT-11/1026-SE
Print by Media-Tryck, Lund 2011
PhD Thesis


Friction stir welding of copper canisters
using power and temperature control
Lars Cederqvist

ii
Copyright © Lars Cederqvist
Division of Machine Design, Department of Design Sciences
Faculty of Engineering LTH, Lund University
Box 118
221 00 LUND
ISBN 978-91-7473-136-1
Printed in Sweden by Media-Tryck, Lund University
Lund 2011

iii
Acknowledgments
First, I would like to thank Håkan Rydén, Manager of the Encapsulation Technol-
ogy Department at the Swedish Nuclear Fuel and Waste Management Company
(SKB), for suggesting 5 years ago that my planned research on the friction stir
welding process was doctoral thesis material. I would also like to thank my em-
ployer SKB for the financial support of this study.
Secondly, I would like to thank my supervisor Professor Gunnar Bolmsjö for his
support and suggestions during this study. Your contacts such as Dr. Anders Rob-
ertsson, Dr. Tore Hägglund and Olof Garpinger at the Department of Automatic
Control at Lund University also contributed to this study greatly. Special thanks to
Olof Garpinger, now at Xdin AB, for spending most of his recent working hours
on applying his control knowledge and licentiate thesis to develop the controller. I
would also like to thank Dr. Tomas Öberg, Linnaeus University, for assisting in
numerous experimental designs and analysis.
I‘m also very grateful to Dr. Anthony Reynolds, University of South Carolina, for
introducing me to (the unlimited potential of) the friction stir welding process
during my graduate studies. Together with Dr. Carl Sorensen, Brigham Young
University, you have also provided valuable feedback and suggestions throughout
this work.
Special thanks to Dick Andrews, The Welding Institute, for the initial research and
development to friction stir weld 50 mm thick copper including the design of the
probe geometry and selection of tool materials.
Obviously, this work could not have been successfully completed without consid-
erable contributions from colleagues at SKB. Special thanks to Mikael Tigerström
for assisting with weld tests and all other practical issues, Sören Claesson for as-
sisting with weld zone evaluations and Ulf Ronneteg for providing non-destructive
testing results. I would like to thank Christer Persson and Per Eriksson, ESAB, for
uncountable visits to update the research possibilities of the welding equipment
including controller implementation.
My beloved parents Gunnar and Eva I would like to thank for many things, among
them suggesting and supporting my academic career in the United States.
But most of all, I would like to thank my dearest ones; Therese, Vincent and Ida
for making life wonderful.
Oskarshamn, April 2011
Lars Cederqvist

iv
v
Abstract
This thesis presents the development to reliably seal 50 mm thick copper canisters
containing the Swedish nuclear waste using friction stir welding. To avoid defects
and welding tool fractures, it is important to control the tool temperature within a
process window of approximately 790 to 910°C. The welding procedure requires
variable power input throughout the 45 minute long weld cycle to keep the tool
temperature within its process window. This is due to variable thermal boundary
conditions throughout the weld cycle. The tool rotation rate is the input parameter
used to control the power input and tool temperature, since studies have shown
that it is the most influential parameter, which makes sense since the product of
tool rotation rate and spindle torque is power input.
In addition to the derived control method, the reliability of the welding procedure
was optimized by other improvements. The weld cycle starts in the lid above the
joint line between the lid and the canister to be able to abort a weld during the
initial phase without rejecting the canister. The tool shoulder geometry was modi-
fied to a convex scroll design that has shown a self-stabilizing effect on the power
input. The use of argon shielding gas reduced power input fluctuations i.e. process
disturbances, and the tool probe was strengthened against fracture by adding sur-
face treatment and reducing stress concentrations through geometry adjustments.
In the study, a clear relationship was shown between power input and tool temper-
ature. This relationship can be used to more accurately control the process within
the process window, not only for this application but for other applications where
a slow responding tool temperature needs to be kept within a specified range. Sim-
ilarly, the potential of the convex scroll shoulder geometry in force-controlled
welding mode for use in applications with other metals and thicknesses is evident.
The variable thermal boundary conditions throughout the weld cycle, together with
the risk of fast disturbances in the spindle torque, requires control of both the pow-
er input and the tool temperature to achieve a stable, robust and repeatable process.
A cascade controller is used to efficiently suppress fast power input disturbances
reducing their impact on the tool temperature. The controller is tuned using a re-
cently presented method for robust PID control. Results show that the controller
keeps the temperature within ±10°C of the desired value during the 360º long joint
line sequence. Apart from the cascaded control structure, good process knowledge
and control strategies adapted to different weld sequences i.e. different thermal
boundary conditions have contributed to the successful results.
Keywords: Friction stir welding, copper, temperature control, PID control.

vii
Populärvetenskaplig summering
Svensk Kärnbränslehantering AB, SKB, har i uppdrag att ta hand om allt radioak-
tivt avfall från de svenska kärnkraftverken. En av förutsättningarna för att SKB
ska få tillstånd att uppföra inkapslings- och slutförvarsanläggningarna är att metod
och teknik för att försluta kapslarna finns. De förslutna kapslarna ska uppfylla de
krav på långsiktig säkerhet som SKB, myndigheterna och andra intressenter stäl-
ler.
Denna avhandling beskriver den process, friction stir welding (FSW), som utveck-
lats för förslutning av de cirka 6000 kapslar som behövs för det avfall som produ-
cerats och kommer att produceras vid de svenska kärnkraftverken. Kapseln har ett
cirka femtio millimeter tjockt kopparhölje som består av tre komponenter; rör,
lock och botten som svetsas samman till ett integrerat hölje. Forskningsarbetet
med att utveckla svetsprocessen har bedrivits vid SKB:s Kapsellaboratorium i
Oskarshamn. FSW som är en variant av friktionssvetsning uppfanns 1991 på The
Welding Institute, och är en fasttillståndsprocess, det vill säga inte en smältsvets-
metod.
För att minimera defektbildning i svetsgodset och för att säkerställa att svetsverk-
tyget inte går sönder, är det viktigt att verktygstemperaturen hålls inom ett inter-
vall mellan cirka 790 och 910°C, att jämföra med kopparns smälttemperatur på
1080°C. För att uppnå detta krävs det att det roterande svetsverktyget genererar en
varierande effekt under den 45 minuter långa svetscykeln eftersom de termiska
förhållandena förändras beroende på uppvärmning och geometriska förutsättning-
ar.
Utförda studier på kopparkapslarna visar att verktygets rotationshastighet är bäst
lämpad för styrning av verktygstemperaturen. Detta är ett logiskt resultat med
tanke på att den, av verktyget, genererade effekten ges av multiplikation mellan
just rotationshastigheten och rotationsmotorns moment som fordras för att uppnå
denna rotationshastighet. Genererad effekt har därför visat sig korrelera väl med
verktygstemperaturen, vilket underlättar styrning av den. Genom att använda en så
kallad kaskadregulator med två individuella PI-regulatorer (Proportionell-
Integrerande), för effekt- och temperaturstyrning, kan man effektivt undertrycka
momentstörningar som förekommer under svetscykeln. Dessa störningar syns
nämligen betydligt tidigare i effektsignalen än i temperaturmätningarna. För att
kunna hantera de varierande termiska förhållandena har kaskadregulatorns inställ-
ningar sedan anpassats beroende på skede i svetscykeln. Regleringen har möjlig-
gjort repeterbara svetsar med verktygstemperaturer runt hela foglinjen inom ±10°C
från börvärdet. Med andra ord, svetsar som med god marginal ligger innanför det
tillåtna processfönstret på cirka ±60°C.

viii
Avhandlingen redogör dessutom för en rad andra förbättringar av svetsprocessen i
syfte att optimera dess tillförlitlighet. Istället för att starta svetscykeln vid foglinjen
mellan lock och rör är starten placerad 75 mm ovanför foglinjen. Detta minskar
riskerna för svetsdefekter vid foglinjen eftersom borrhålet är placerat så att det
bearbetas bort efter svetsning samt att startsekvensen då verktygets frammatnings-
hastighet accelereras upp vid relativt låg temperatur också innebär risk för defekt-
bildning. Man har dessutom möjligheten att avbryta processen i tid ifall något
skulle gå snett under det initiala skedet utan att behöva kassera lock och kapsel.
Svetsverktygets skuldra har fått en ny, konvex, utformning som har visat sig ha en
självstabiliserande inverkan på den genererade effekten. Tappen på svetsverktyget
har i sin tur förstärkts mot eventuella brott genom ytbehandling och minskning av
detaljer som leder till stresskoncentrationer. Vidare har användandet av argon, som
skyddsgas runt verktyget, reducerat såväl momentstörningarna som oxidbildning.

ix
Publications
This thesis includes the following appended publications:
Paper A
Cederqvist L, Öberg T. 2007. Reliability study of friction stir welded canisters
containing Sweden‘s nuclear waste. Reliability Engineering and System Safety 93,
1491-1499.
Paper B Cederqvist L, Sorensen C D, Reynolds A P, Öberg T. 2009. Improved process
stability during friction stir welding of 5 cm thick copper canisters through shoul-
der geometry and parameter studies. Science and Technology in Welding and
Joining 46(2), 178–184.
Paper C Cederqvist L, Garpinger O, Hägglund T, Robertsson A. 2011. Cascade control of
the friction stir welding process to seal canisters for spent nuclear fuel. Submitted
to Control Engineering Practice in January, 2011.
It should be noted that a reference to for example section C 3.2.2 or Figure C-5 in
the thesis means that it is section 3.2.2 or Figure C-5 in paper C.
Other publications not appended in the thesis:
Paper D Cederqvist L. 2004. FSW to seal 50 mm thick copper canisters – a weld that lasts
for 100,000 years. Proceedings of 5th International Symposium on Friction Stir
Welding, September 14-16, Metz, France.
Paper E Cederqvist L. 2006. FSW to manufacture and seal 5 cm thick copper canisters for
Sweden‘s nuclear waste. Proceedings of 6th International Symposium on Friction
Stir Welding, October 10-13, Saint-Sauveur, Canada.
Paper F Cederqvist L, Bolmsjö G, Sorensen C D. 2008. Adaptive control of novel welding
process to seal canisters containing Sweden‘s nuclear waste using PID algorithms.
Proceedings of the 18th International Conference on Flexible Automation and In-
telligent Manufacturing, June 30 - July 2, Skövde, Sweden.

x
Paper G Cederqvist L, Johansson R, Robertsson A, Bolmsjö G. 2009. Faster temperature
response and repeatable power input to aid automatic control of friction stir weld-
ed copper canisters. Proceedings of Friction Stir Welding and Processing V, Feb-
ruary 15-19, San Francisco, USA, pp. 39-43.
Paper H Cederqvist L, Sorensen C D, Reynolds A P, Garpinger O. 2010. Reliable FSW of
copper canisters using improved process and controller controlling power input
and tool temperature. Proceedings of 8th International Symposium on Friction Stir
Welding, May 18-20, Timmendorfer Strand, Germany.
Paper I Cederqvist L, Garpinger O, Hägglund T, Robertsson A. 2010. Cascaded control of
power input and welding temperature during sealing of spent nuclear fuel canis-
ters. Proceedings of 3rd annual ASME Dynamic Systems and Control Conference,
September 9-12, Cambridge, USA.
Also presented and published at the 14th biannual Swedish national conference on
Automatic Control, June 8-9 2010, Lund, Sweden.
Paper J Cederqvist L, Garpinger O, Hägglund T, Robertsson A. 2011. Reliable sealing of
copper canisters through cascaded control of power input and probe temperature.
Proceedings of Friction Stir Welding and Processing VI, February 27-March 3,
San Diego, USA.

xi
Table of Contents
1 Introduction ............................................................................................... 1
1.1 Background and Motivation ............................................................................... 2
1.2 Objectives .......................................................................................................... 2
1.3 Scope and Limitations ....................................................................................... 3
1.4 Research Methodology ...................................................................................... 4
1.5 Outline of thesis ................................................................................................. 4
2 Friction stir welding .................................................................................. 7
2.1 Principle ............................................................................................................. 7
2.2 The weld cycle ................................................................................................. 11
2.3 Equipment and welding objects ....................................................................... 12
2.4 Experimental setup .......................................................................................... 16
2.5 Discontinuities ................................................................................................. 18
2.6 External parameters ........................................................................................ 20
2.7 Process disturbances ...................................................................................... 20
3 Closed loop control ................................................................................ 23
3.1 PID control ....................................................................................................... 24
3.2 Cascade control ............................................................................................... 26
3.3 Feed-forward ................................................................................................... 26
3.4 Gain scheduling ............................................................................................... 26
3.5 Controller for the FSW process ....................................................................... 27
3.6 Closed loop control of FSW ............................................................................. 29
4 Development of the welding procedure ................................................ 31
4.1 TWI development program .............................................................................. 31
4.2 Control method during initial welds ................................................................. 33
4.3 Parameter study .............................................................................................. 34
4.4 Control method after parameter study ............................................................. 34
4.5 Shoulder geometry study ................................................................................. 35
4.6 Initial automatic control approach .................................................................... 36

xii
4.7 Final automatic control approach .................................................................... 39
4.8 Probe life development .................................................................................... 46
4.9 Discussion ....................................................................................................... 49
5 Conclusions ............................................................................................ 53
5.1 Main contributions ........................................................................................... 53
5.2 Suggestions for future work ............................................................................. 55
6 Summaries of publications .................................................................... 57
6.1 Paper A ............................................................................................................ 57
6.2 Paper B ............................................................................................................ 58
6.3 Paper C............................................................................................................ 59
6.4 Paper D............................................................................................................ 60
6.5 Paper E ............................................................................................................ 61
6.6 Paper F ............................................................................................................ 62
6.7 Paper G ........................................................................................................... 63
6.8 Paper H............................................................................................................ 64
6.9 Paper I ............................................................................................................. 65
6.10 Paper J .......................................................................................................... 65
7 Acronyms ................................................................................................ 67
8 References .............................................................................................. 69
Paper A ....................................................................................................... 75
Paper B ....................................................................................................... 95
Paper C ..................................................................................................... 113
1
1 Introduction
The Swedish Nuclear Fuel and Waste Management Company (SKB) is responsi-
ble for managing and disposing all radioactive waste from Swedish nuclear power
plants in such a way to secure maximum safety for human beings and the envi-
ronment. The method of final disposal of the spent nuclear fuel is based on three
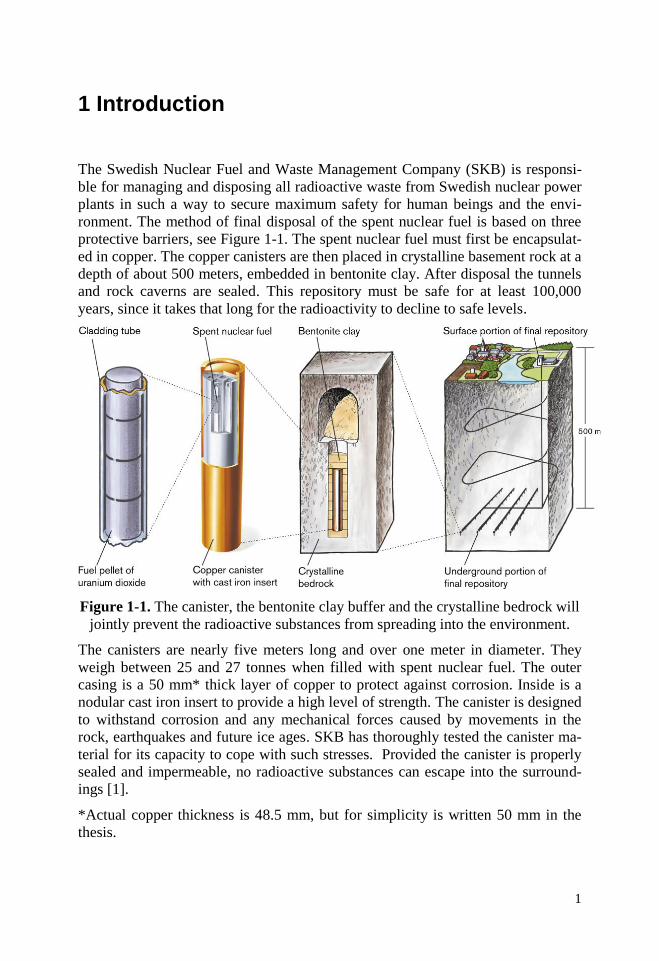
protective barriers, see Figure 1-1. The spent nuclear fuel must first be encapsulat-
ed in copper. The copper canisters are then placed in crystalline basement rock at a
depth of about 500 meters, embedded in bentonite clay. After disposal the tunnels
and rock caverns are sealed. This repository must be safe for at least 100,000
years, since it takes that long for the radioactivity to decline to safe levels.
Figure 1-1. The canister, the bentonite clay buffer and the crystalline bedrock will
jointly prevent the radioactive substances from spreading into the environment.
The canisters are nearly five meters long and over one meter in diameter. They
weigh between 25 and 27 tonnes when filled with spent nuclear fuel. The outer
casing is a 50 mm* thick layer of copper to protect against corrosion. Inside is a
nodular cast iron insert to provide a high level of strength. The canister is designed
to withstand corrosion and any mechanical forces caused by movements in the
rock, earthquakes and future ice ages. SKB has thoroughly tested the canister ma-
terial for its capacity to cope with such stresses. Provided the canister is properly
sealed and impermeable, no radioactive substances can escape into the surround-
ings [1].
*Actual copper thickness is 48.5 mm, but for simplicity is written 50 mm in the
thesis.

2
1.1 Background and Motivation
In 1997 SKB decided to investigate the potential of friction stir welding (FSW) on
50 mm thick copper at The Welding Institute (TWI) in Cambridge, England. The
development program at TWI showed that 50 mm thick copper plates and 50 mm
thick copper rings cut from tubes could be joined with FSW [2], and a welding
tool was developed that could last a full weld cycle. However, during longer weld
cycles the developed welding procedure with constant input parameters could not
keep the process within its process window, as described in section 4.1, since ei-
ther the process got too cold or too hot.
If the tool temperature gets too high (for an extended period of time), there is a
risk that the welding tool fractures which will result in a rejected canister with
expensive and extended work to open the canister and recover the nuclear waste.
Similarly, too low tool temperatures may result in discontinuities in the weld (so-
called wormholes) that could, depending on size, also lead to a rejected canister.
The reason why the input parameters can not be held constant throughout a full
weld cycle is because the welding procedure to seal copper canisters requires vari-
able power input throughout the weld cycle to keep the tool temperature within its
process window. This is due to variable thermal boundary conditions throughout
the different sequences in the weld cycle.
Since SKB will join approximately 12,000 lids and bases to the copper tubes, start-
ing around 2025, the need of a repeatable and reliable welding procedure is evi-
dent. Also, to keep the planned production rate of approximately one canister de-
posited per working day, rejected canisters must be limited to less than one per-
cent.
1.2 Objectives
The aim of this thesis study is to develop a welding procedure that repeatedly and
reliably can produce defect-free canisters by keeping the tool temperature within
its process window.
In other words, the objective is to maintain the tool temperature as far away from
the boundaries of the process window as possible. This also means that the devel-
oped welding procedure needs to be able to handle changes and disturbances to the
process efficiently.
Another way of keeping the tool temperature away from the boundaries of the
process window is by increasing the size of the process window. As a result, an-
other objective of the study was to increase the safety factor against tool fracture.
3
1.3 Scope and Limitations
The thesis contains the development of a robust and reliable welding procedure for
50 mm thick copper canisters, although most of the findings are expected to be
generic to the FSW process. The development has included, but was not limited to:
new joint line geometry and location, new weld start location, new tool shoulder
and probe geometries, modified input parameter used to control the tool tempera-
ture, use of argon shielding gas, and cascade control.
It has not been the focus of the study to characterize the discontinuities and weld
zone microstructure during every step of the development as described in section
1.3.1 and 1.3.2. Instead the results from the non-destructive testing have been used
together with destructive testing to, for example, define the process window for
the tool temperature.
1.3.1 Discontinuities
Possible discontinuities are described in section 2.5. No development in this thesis
has lead to increased size of discontinuities or increased risk of discontinuities
forming. Instead the development has led to a welding procedure with parameter
settings further away from settings where discontinuities are formed. In addition,
by optimizing the probe length and by more constant tool depth through use of a
convex scroll shoulder and argon shielding gas, the joint line hooking discontinui-
ty is limited to approximately 2 mm in size [A]. It should be noted that the reduc-
tion of the 50 mm corrosion barrier by 2 mm is acceptable since the maximum
reduction in copper thickness due to normal operation welding is expected to be 10
mm for a population of 6,000 canisters [3].
1.3.2 Weld zone characteristics
The development of the welding procedure has changed the microstructure of the
weld zone modestly (see Figure B-10), but since the development has only im-
proved the weld zone properties, the focus of this study has not been on the weld
zone characteristics. For example, probe development (i.e. surface treatment) has
led to less containment of metal particles, from an average of 6 ppm Ni using un-
coated probes to <1 ppm when using surface treated probes [3]. In addition, the
use of argon shielding gas has led to less oxide inclusions, from an average of 11
ppm when welding in air to 1.8 ppm when welding in argon [3].
The main function of the copper is the corrosion resistance, and studies [4-5] on
the weld zone including metal and oxide inclusions concluded that, for example, it
is highly unlikely that grain boundary corrosion could be a concern in the reposito-
ry environment. It was also concluded that small particles from the tool probe do
not pose a risk for accelerated corrosion of the weld zone, and that a negative ef-
fect of copper oxides close to the surface could not be detected.

4
1.3.3 Control development
The author of the thesis developed the initial controller using the cascade loops of
power input and probe temperature. Due to the limited possibilities to optimize the
initial controller (see section 4.6) other than by trial and error hand tuning, the
author took counsel from experienced control professors and researchers at the
Department of Automatic Control at Lund University, on how to develop both the
cascade structure and controller tuning method in accordance with current control
theory. The resulting method uses a newly developed design procedure for robust
PID control [6]. While this method is described briefly in this thesis, it should be
noted that it is not a contribution by the author of the thesis.
1.3.4 Force-controlled welding mode
The canister is difficult to centre in the welding machine, resulting in a canister
eccentricity of approximately ± 1 mm. As a result, all welds made have been pro-
duced in force-controlled welding mode. It should be noted that, even if the canis-
ters were perfectly centred, force-controlled mode would have been used since this
study has indicated that the axial force does influence the process window (as dis-
cussed in section 4.2).
1.4 Research Methodology
This thesis contains experiments on a specific application for the FSW process. As
a result, no fundamental research on the FSW process has been pursued. Instead
the thesis is based on applied research, where all results and conclusions are de-
rived using empirical methods.
The experience of the thesis‘ author is that specific FSW applications are difficult
to model and simulate, and thereby derive useful knowledge without actual weld-
ing experiments. For example, the difficulty to model and predict the heat and
material flow during FSW of copper canisters was noted in another study [7],
where the process was modelled both analytically and numerically. In other words,
specific FSW issues are difficult to solve only by modelling and simulation (that
mostly can generate fundamental knowledge of the FSW process), therefore exper-
iments are better suited to gain knowledge. In this thesis, statistical design of ex-
periments (DOE) was used during multiple studies of the welding process. More
information on the DOE‘s and statistical evaluations can be found in [A-B].
1.5 Outline of thesis
This thesis is divided into chapters, whose content is as follows:
Chapter 2 - Friction stir welding. In this chapter background information on the
FSW process is provided, including its use in industry as well as research and de-
velopment. Due to their importance for this study, the input and output parameters
for the FSW process are thoroughly described. The equipment, welding objects

5
and experimental setup used for all the welding trials at SKB‘s Canister laboratory
are also described.
Chapter 3 - Closed loop control. The different control fundamentals used to de-
sign the controller are described in this chapter, together with discussion on closed
loop control applications for FSW.
Chapter 4 - Development of the welding procedure. The chapter starts with a
background on the state of the process at the end of the development at TWI,
where no adjustments of input parameters were done during welding. The chapter
then describes the development of the welding procedure chronologically.
Chapter 5 - Conclusions. The main contributions to the specific application of
sealing 50 mm thick copper canisters as well as generic FSW contributions are
summarised. Additionally, suggestions for future work are listed.
Chapter 6 - Summaries of publications. The main results of the publications are
presented.


7
2 Friction stir welding
Friction stir welding (FSW) is a thermo mechanical solid-state process that was
invented in 1991 at The Welding Institute (TWI) in Cambridge, England [8].
2.1 Principle
A rotating non-consumable tool, consisting of a tapered probe and shoulder, is
plunged into the weld metal, and traversed along the joint line, see Figure 2-1a.
The function of the probe is to heat up the weld metal by means of friction and,
through its shape and rotation, force the metal to move around its form and create
a weld. The function of the shoulder is to heat up the metal through friction and to
prevent it from being forced out of the weld.
Figure 2-1. Schematic of the FSW process on the canister (a) and on plate (b).
2.1.1 FSW terminology
Since FSW is not a symmetric process, the different sides of the tool has been
defined according to Figure 2-1b [9]. For example, the advancing side of the weld
is where the tool rotation direction is the same as the welding direction, and the
retreating side is where the tool rotation direction is opposite the welding direc-
tion. This unsymmetric nature results in different material flow on the different
sides of the tool and has a large effect on many applications, especially lap joints
[10] but also in this application, see sections 2.4 and 2.5.
2.1.2 Input and output parameters
One reason for the fast (and growing) implementation of FSW in industry is that
the method has few input parameters according to Figure 2-1a; 1. the tool rotation
rate, 2. the welding speed along the joint, and 3. the axial force (to control the
depth of the tool into the canister). In addition, the tool is usually tilted at a con-
stant angle relative to the surface of the welding object.

8
The output parameters are the tool temperature (measured using one or more
thermocouples in the tool), the torque required by the spindle to maintain the rota-
tion rate, the depth of the tool into the welded material and the force on the tool in
the traverse direction.
There are some elementary relationships between the parameters; the tool rotation
rate multiplied with the spindle torque divided by the welding speed is equal to the
heat input in units of J/mm. Similarly, if the welding speed is taken out of the heat
input equation, the power input in units of W is the product when multiplying tool
rotation rate and spindle torque. The total power input, P, during welding also
includes the traverse force acting on the tool multiplied by the welding speed ac-
cording to Equation 2-1.
vFPTraverse
(2-1)
where ω, τ, FTraverse and ν are tool rotation rate, spindle torque, traverse force on
tool and welding speed, respectively.
It should be noted that Equation 2-1 is simplified in this thesis to exclude FTraverse·
ν. This is due to the fact that the power input from the tool traversing (6 kN· 86
mm/min ≈ 0.01 kW) is negligible compared with the power input (40-50 kW)
from the tool rotating.
Since not all FSW equipments measure spindle torque and power input, two pa-
rameter indexes, Pseudo Heat Index (PHI) and Advance Per Revolution (APR),
have been developed to correlate with welding results such as peak temperature,
microstructure and mechanical properties. PHI and APR are defined in Equations
2-2 and 2-3.
vPHI
2 (2-2)
vAPR (2-3)
where ω and ν are tool rotation rate and welding speed, respectively.
2.1.3 FSW in industrial applications
FSW was initially applied to aluminum alloys [11], and one of the first commer-
cial applications was employed in 1996 when Marine Aluminum Aanensen & Co.
AS in Norway joined 16 m long ship panels. Other industries with FSW imple-
mentations include, but are not limited to; railway with railcar bodies made out of
extruded aluminum panels, automotive with light alloy wheels and fuel tanks [11]
and aerospace with applications like the aluminum alloy (AA) 2014 propellant
tanks of the Delta II and IV space launch vehicles at Boeing, and the AA 2xxx and
7xxx series fuselage of the Eclipse 500 jet at Eclipse Aviation. The Boeing Com-

9
pany reported that ―the FSW specific design of Delta II and IV achieved 60% cost
saving, and reduced the manufacturing time from 23 to 6 days‖ [11].
When it comes to copper and its alloys, only one industrial FSW application is
documented. Hitachi Cable Ltd and Hitachi Copper Products Ltd applied FSW to
water-cooled copper backing plates in Japan due to the low distortion and excel-
lent mechanical properties from the welding process. Grooves are machined in up
to 70 mm thick copper plates and these water channels are covered with copper
sheet that are friction stir welded to the plate [12].
2.1.4 FSW in research and development
In this section, research on the FSW process related to the findings in this thesis is
discussed.
While this study develops in-process quality control using the tool temperature,
another approach has been to analyze the forces on the welding tool to determine
weld quality [13]. These forces are a signature of the metal flow around the tool
and an asymmetric force pattern indicates that a defect is forming. Similar to the
observations in this thesis, wormhole defects are formed during cold conditions or
insufficient axial force, while the probability of wormhole formation is very low
during hot conditions [14]. However, no suggestion on how to change input pa-
rameters to prevent defects forming is presented. Similarly, Jene et al [15] use
force patterns to detect defect formation, but do not provide procedures to avoid
them. It should also be noted that these approaches require measurement and high
speed data collection of the traverse force and the force acting on the tool towards
the advancing side due to the metal flow around the tool. Russell et al [16] have
developed ARTEMIS, an on-line monitoring, quality assurance and process devel-
opment system, which for example measures the tool bending forces around the
tool circumference. Similar to the other studies measuring and analyzing the forces
on the tool, the process is only monitored and no control of the forces on the tool
is proposed.
As the research and development of the FSW process moves from aluminum al-
loys to metals with higher melting temperatures such as titanium alloys, nickel
alloys and steels, the tool life becomes the focus and examples of possible tool
materials [17] are W-Re (tungsten-rhenium) and PCBN (polycrystalline cubic
boron nitride). An Ir-Re (iridium-rhenium) was also used to FSW stainless steel
without significant wear [18], while W-La (tungsten-lanthanum) was used to FSW
titanium alloys [19]. During a study on the life of PCBN tools [20] it was noted
that the plunge sequence affect the life significantly. As a result, the study investi-
gated the pilot hole size and the power input during the plunge sequence that min-
imized stress on the tool.
While the variable thermal boundary conditions throughout the weld cycle in this
study (see section 2.2) requires thermal management of the process to keep it with-

10
in its process window and not create defects, other work has also used and investi-
gated the effects of different thermal boundary conditions. Upadhyay and Reyn-
olds [21] investigated the effects of FSW in air, under water or in sub-ambient
temperature on the output parameters and weld zone properties (hardness and ten-
sile strength). Results show that under water welding reduces probe temperature
due to more heat transfer from tool and plate, and increases power input due to
lower temperature of the weld metal in contact with the tool, hence lower viscosity
resulting in higher spindle torque at a given tool rotation rate. Similarly, Bernath et
al [19] used thermal management to produce a defect free 19 mm thick Ti-6Al-4V
disk, by spiral pattern friction stir welding several layers of 6 mm thick plate. Due
to the spiral pattern and thickness of the titanium plates, there was a considerable
amount of heat retention and the inability of the plate to adequately conduct heat
caused process instability. This instability lead to defects, while more stable weld-
ing conditions (and the elimination of defects) were achieved by using flood water
cooling on top of the plate.
When it comes to FSW of copper and its alloys, research on sheet and plate in
various thicknesses has been published. Leal et al [22] investigated effects of input
parameters (tool rotation rate and welding speed) and shoulder geometries (flat, 3
and 6º concave) on 1 mm thick phosphorus deoxidized copper sheets (Cu-DHP).
Similarly to this study, it was concluded that root defect formation is influenced
mainly by tool rotation rate (i.e. power input and welding temperature) and, to a
lesser extent, by welding speed and shoulder geometry. Savolainen et al [23] in-
vestigated the weldability of four copper alloys; oxygen-free copper (Cu-OF),
phosphorus-deoxidised copper (Cu-DHP), aluminum bronze (CuAl5Zn5Sn) and
copper-nickel (CuNi25) using double-sided butt welds in 10-11 mm thick plate. It
was concluded that defect free welds were produced using high tool rotation rates
combined with low welding speeds. The weldability of the different alloys was
related to the flow stress at 900ºC and 95% of the melting temperature, similar to
the hypothesis of Mahoney [24] that the flow stress of the metal at the welding
temperature is the single parameter with best correlation to weldability. PCBN was
the only tool material tested able to FSW all alloys, while the Ni-based superalloys
(Inconel 738 and 939) only were suitable for Cu-OF and Cu-DHP. It was also
recommended that machining of joint surfaces prior to welding and the use of
shielding gas may prove to be beneficial in preventing oxide particles in the weld
zone.
Limited research on differences between welding in shielding gas and air is avail-
able, since either the metal requires shielding gas (for example, titanium alloys and
steels) or it does not (for example, aluminum alloys). However, Savolainen et al
[25] investigated the effect of using argon shielding gas and oxide removal prior to
welding in 6 mm oxygen-free copper with 40 ppm phosphorus (Cu-OFEP). It was
found that simultaneous use of argon and oxide removal results in the least amount
of oxide particles, and that welding in argon gas instead of in air decreased the tool
11
temperature. Additionally, Nelson et al [26] noted that the tool temperature be-
came very unstable and difficult to control when welding over surface oxidation of
steel panels.
Several studies have investigated parameter relationships [27-29], and determined
useful correlations between the input parameters and various outputs including
weld zone and mechanical properties such as grain size, hardness and yield
strength. However, only a few studies have examined the correlation between the
input parameters and the temperature during welding [30-32], as well as correla-
tion between output parameters like power and heat input and the temperature
during welding. It is the hypothesis of the thesis‘ author that measurement and
control of the tool temperature could potentially have better correlation with weld
zone and mechanical properties than input parameters. Similar to this study, Reyn-
olds et al [31] observed that the temperature measured in the weld zone (via ther-
mocouples embedded in the tool) is best correlated to the power input. Similarly,
Savolainen et al [23] noticed a clear correlation between power input and tool
temperature, where the power input is ahead of the temperature.
When it comes to tool design, several different probe and shoulder geometries
have been successfully used for various FSW applications, both during research
and production. The most common shoulder geometries are the concave and the
flat scroll shapes. However, recently tapered and convex scroll shoulder geome-
tries have been developed in an attempt to achieve better tolerance to plate thick-
ness variations during the position-controlled welding mode [33-34].
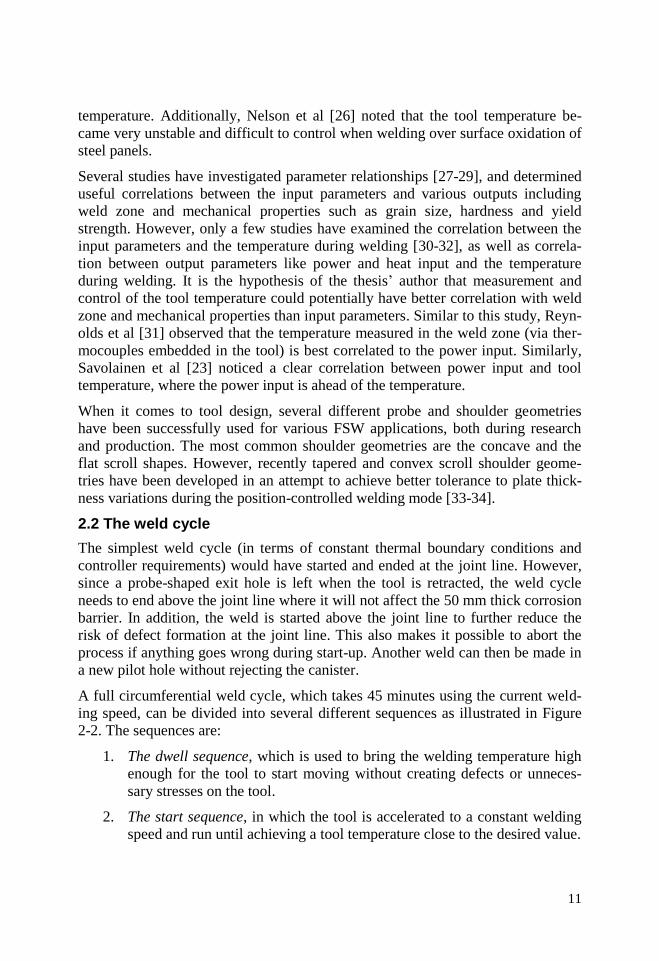
2.2 The weld cycle
The simplest weld cycle (in terms of constant thermal boundary conditions and
controller requirements) would have started and ended at the joint line. However,
since a probe-shaped exit hole is left when the tool is retracted, the weld cycle
needs to end above the joint line where it will not affect the 50 mm thick corrosion
barrier. In addition, the weld is started above the joint line to further reduce the
risk of defect formation at the joint line. This also makes it possible to abort the
process if anything goes wrong during start-up. Another weld can then be made in
a new pilot hole without rejecting the canister.
A full circumferential weld cycle, which takes 45 minutes using the current weld-
ing speed, can be divided into several different sequences as illustrated in Figure
2-2. The sequences are:
1. The dwell sequence, which is used to bring the welding temperature high
enough for the tool to start moving without creating defects or unneces-
sary stresses on the tool.
2. The start sequence, in which the tool is accelerated to a constant welding
speed and run until achieving a tool temperature close to the desired value.
12
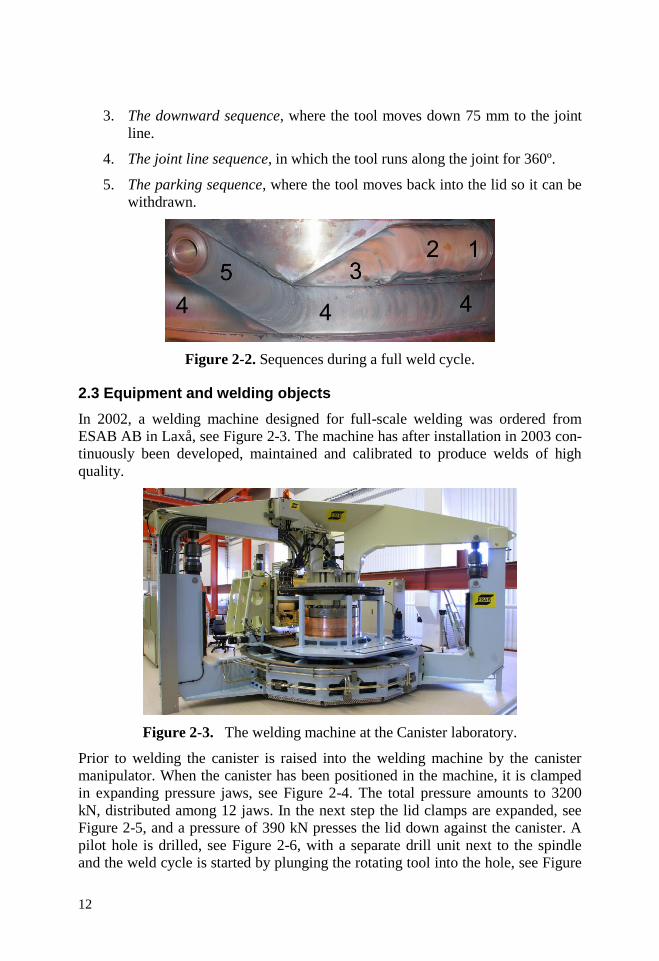
3. The downward sequence, where the tool moves down 75 mm to the joint
line.
4. The joint line sequence, in which the tool runs along the joint for 360º.
5. The parking sequence, where the tool moves back into the lid so it can be
withdrawn.
Figure 2-2. Sequences during a full weld cycle.
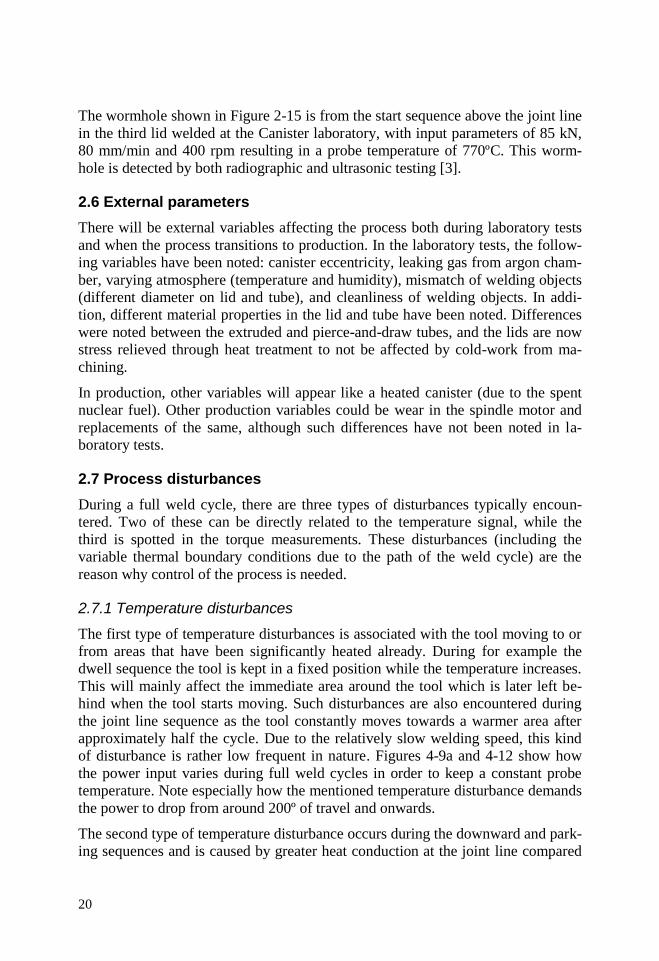
2.3 Equipment and welding objects
In 2002, a welding machine designed for full-scale welding was ordered from
ESAB AB in Laxå, see Figure 2-3. The machine has after installation in 2003 con-
tinuously been developed, maintained and calibrated to produce welds of high
quality.
Figure 2-3. The welding machine at the Canister laboratory.
Prior to welding the canister is raised into the welding machine by the canister
manipulator. When the canister has been positioned in the machine, it is clamped
in expanding pressure jaws, see Figure 2-4. The total pressure amounts to 3200
kN, distributed among 12 jaws. In the next step the lid clamps are expanded, see
Figure 2-5, and a pressure of 390 kN presses the lid down against the canister. A
pilot hole is drilled, see Figure 2-6, with a separate drill unit next to the spindle
and the weld cycle is started by plunging the rotating tool into the hole, see Figure

13
2-7. During the process the welding head rotates around the canister. The maxi-
mum angle of rotation is 425º, which is enough since the downward and parking
sequences are 17º each.
Figure 2-4. Clamping of canister. Figure 2-5. Clamping of lid.
Figure 2-6. Drilling of pilot hole. Figure 2-7. Plunging into pilot hole.
2.3.1 The welding tool
The tool (see Figure 2-8) is an important component in FSW. The tool must with-
stand a high process temperature, as well as the high forces to which it is subjected
during welding. A full weld cycle is 45 minutes and almost four meters long. The
development of the tool geometry from the concave shoulder (Figure 2-8a) to the
convex scroll shoulder (Figure 2-8b) with a surface treated probe with reduced
MX features is presented in sections 4.5 and 4.8.
Seventeen different probe materials were studied during the initial state of the
development [35]. A nickel-based superalloy (Nimonic 105) was chosen as the
material in the tool probe. Nickel-based superalloys have excellent high-
temperature properties with good wear resistance, ductility and sufficient strength.
The tool shoulder is made of a tungsten alloy (Densimet D176) with suitable ther-
mal and mechanical properties for the process. Both the probe and shoulder are

14
changed after each weld. The reason for changing probe is to not risk fracture,
while the shoulder is changed to have repeatable starting conditions for all welds.
Figure 2-8. Past (a) and present (b) welding tool.
2.3.2 Temperature measurements
The probe temperature has always been measured on the welding machine at the
Canister laboratory according to Figure 2-9. Due to a relatively large response
time for the thermocouple measurement in the probe, efforts were made to reduce
it. Two new thermocouples, named shoulder ID and OD (inside and outside diam-
eter), were added at new locations in the shoulder, see Figure 2-9. In addition to
the shoulder material (Densimet D176) having much higher thermal conductivity
than the probe material (Nimonic 105), 74 versus 11 W/m·K at 20°C, the locations
of the new thermocouples are closer to the weld metal. If an argon chamber is not
used, an infra-red camera is recording the maximum temperature on the leading
side of the shoulder, shown in Figure 2-10.
Figure 2-9. Thermocouple placements. Figure 2-10. Infra-red image.
Although the thermocouples are spring-loaded to assure contact with the tool, they
seem to vary relative to each other from cycle to cycle (see section 4.9.2). This is
probably due to the fact that the shoulder temperatures are more sensitive to dif-

15
ferent tool depths and the resulting difference in relative heat generation between
the probe and the shoulder.
2.3.3 Copper components and their properties
Oxygen-free copper has been chosen as the outer canister material due to its corro-
sion-resistance in the environment prevailing in the repository. Also, copper has
high ductility, and the creep ductility can be further increased by addition of 30-
100 ppm of phosphorus [3]. Hydrogen and sulphur have a negative effect, so the
concentrations of these elements must be below 0.6 and 12 ppm, respectively [3].
The lids and bases are produced by forging, and the tubes are produced by extru-
sion. In addition, the pierce and draw technique is developed to be able to produce
tubes with an integrated base. To not risk any cold working effects from the ma-
chining of the lids and bases these components are stress-relieved through heat
treatment before welding.
Table 2-1 displays the melting temperature and thermal conductivity of metals
used in FSW production and research. The melting temperature influences the
requirements on the tool material, and tool steels are often enough for aluminum
alloys, while steels and titanium alloys require other materials according to section
2.1.4. It is the hypothesis of the thesis‘ author that the high thermal conductivity of
copper and aluminum makes it easier to achieve a thermal balance during FSW
(i.e. steady-state welding conditions), while especially titanium is difficult to re-
peatedly FSW with similar results due to the low thermal conductivity. The low
conductivity results in low heat dissipation from the weld zone and the metal
around the tool becomes too hot and the resulting process is tough to control. Low
conductivity can also result in a larger temperature gradient between the top and
bottom of the weld zone.
Table 2-1. Properties of metals that affect ability to FSW.
Metal Tmelting (°C) K (W/m·K)
Cu 1080 400
Al 660 235
Ti 1670 22
Fe 1540 80
It is the hypothesis of the thesis‘ author, deduced from experiments, that the FSW
process is self-limiting to a maximum temperature on the copper canisters due to
the fact that when the copper gets hotter and closer to the melting temperature the
viscosity of the copper decreases and less frictional heat is produced. For the cop-
per canisters, the maximum probe temperature achieved is around 960°C, although

16
the copper close to the tool is most definitely hotter. As a result, if a tool that with-
stands that temperature for 45 minutes was available, the need for controlling the
probe temperature would be limited.
2.4 Experimental setup
Although the welding system is capable of sealing 5 m long canisters, only one
full size canister with a base and lid has been sealed to the tube with a cast iron
insert inside (see section 4.2). Instead, more than 80 lids have been welded to rings
cut from tubes, since no difference compared to full size canisters has been noted
in the process i.e. similar heat transfer from the joint line.
The canisters have an outside diameter of 1050 mm but on the top and bottom of
the tube they are 1060 mm diameter, just like the lids and bases, since 5 mm of the
surface will be machined off after welding. In addition, 55 mm will be machined
off from the top of the lid (and base), according to Figure 2-11. The machined
surfaces are needed for the non-destructive testing equipment that also gets closer
to the weld zone. The 1060 mm diameter means that 1º of travel equals 9.2 mm i.e.
the joint line sequence of 360º and a full cycle of 400º are 3.3 m and 3.7 m long,
respectively.
Figure 2-11. Machining after welding. Figure 2-12. Original and new joint.
The original placement of the joint was positioned so the bottom of the lid would
act as backing support for the tool (and the large axial force) during the joint line
sequence, see dotted line in Figure 2-12. However, it was noted during the first
welds at the Canister laboratory that the 50 mm copper behind the joint was

17
enough support. In addition, it was noted during the first welds that much more
flash was produced on the tube side, than on the lid side, according to Figure 2-
13a. The hypothesis of the thesis‘ author for the formation of the flash on the tube
side was that the tube got hotter than the lid, which has a larger mass around the
joint, and the tube therefore thermally expands more. To solve this issue, the joint
was moved upwards in the lid to a more symmetric location, and a male-female
rabbet was also added, according to the dashed line in Figure 2-12, which also
includes the position of the probe. The first lids welded with the new joint location
showed that the flash on the tube side was much less than with the original joint
location, see Figure 2-13b.
Figure 2-13. Resulting flash formation with original (a) and new (b) joint location.
It can be seen in Figure 2-13b that slightly more flash is produced on the tube (ad-
vancing) side during the joint line sequence. It is the hypothesis of the thesis‘ au-
thor that wormholes are formed on the advancing side due to less material i.e.
metal flow from the advancing side. Therefore, it could be beneficial to have a
little more flash on the advancing side to compensate for the metal flow from the
advancing side. In other words, more flash on the advancing side could lead to a
larger process window, i.e. wormholes not forming until lower temperatures than
if no extra flash is produced on the advancing side.
In fact, a (side) force acts on the tool towards the advancing side due to the metal
flow around the tool. While this force can cause deflection in some equipment (for
example robots), the welding machine in the Canister laboratory is stiff enough to
not deflect due to this force. However, it is the hypothesis of the thesis‘ author that
the risk of wormholes forming can be reduced by tilting the tool so the shoulder
goes deeper on the advancing side than on the retreating side. While this cannot be
done on the welding machine at the Canister laboratory, it is the hypothesis of the
thesis‘ author that use of this strategy can be of great benefit to increase the joint
efficiency during lap joints, where the advancing side always is the weakest if a
side tilt is not used [10].

18
2.4.1 Directions of welding and tool rotation
The welding machine was ordered to weld clockwise around the canister (viewed
from above), and since, as mentioned, it is thought to be beneficial to have the
advancing side of the weld in the tube side, the tool is designed to rotate clockwise
(viewed from tool to canister). The machine has been modified to be able to rotate
counter clockwise and tools have been produced to rotate counter clockwise, but
the standard welding procedure is clockwise welding direction and tool rotation.
2.4.2 Argon
During the first 76 lid welds containing more than 300 separate weld cycles, only
one lid was welded using argon shielding gas. The reason for this weld was mainly
to evaluate the weld zone, but also to evaluate differences in welding parameters,
for example spindle torque, tool rotation rate and power input.
Since it was noted that the argon gas, in addition to a weld zone with less oxides,
also resulted in a more stable process, the last 7 lid welds have all been produced
in argon gas. Figure 2-14a illustrates the argon chamber used locally around the
tool, while Figure 2-14b shows the addition of the full circumferential chamber,
which is used during full circumferential welds.
Figure 2-14. Local chamber around tool (a) and full circumferential chamber (b).
2.5 Discontinuities
There are a few possible discontinuities that can occur during welding. In the
welds produced during this study, two types of discontinuities in particular have
been indicated by non-destructive testing (radiographic and ultrasonic inspection)
and destructive testing. Figure 2-15 illustrates the two discontinuities, that both
reduce the corrosion barrier.
Parallel to the development of the welding procedure described in this study, two
non-destructive testing techniques, radiographic and phased-array ultrasonic test-
ing, have been developed at SKB‘s Canister laboratory [3], see Figure 2-16.

19
Figure 2-15. Location and geometries of discontinuities.
Figure 2-16. Illustrations of ultrasonic (left) and radiographic (right) testing.
2.5.1 Joint line hooking
In all welds there is some extent of joint line hooking (JLH) present due to the
joint design, or remainder of joint line left if a short probe is used. In Table A-3 it
can be seen that the maximum JLH discontinuity varied between 3.0 and 4.5 mm
in 20 full weld cycles. These welds (called the demonstration series) were pro-
duced with a tool probe length of 53 mm. After the demonstration series had been
carried out, the focus of the development were turned to optimization of the tool
probe length in order to minimize JLH. The results of an optimized probe length of
50 mm (Table A-4) show that JLH can be limited to 2 mm in size.
2.5.2 Wormhole
Wormholes can occur on the advancing side if the welding parameters (foremost,
the tool temperature) are below the process window. The size of the wormhole
increases as the tool temperature decreases, and it is proposed in the future work
section to investigate the maximum wormhole size as a function of tool tempera-
ture.
20
The wormhole shown in Figure 2-15 is from the start sequence above the joint line
in the third lid welded at the Canister laboratory, with input parameters of 85 kN,
80 mm/min and 400 rpm resulting in a probe temperature of 770ºC. This worm-
hole is detected by both radiographic and ultrasonic testing [3].
2.6 External parameters
There will be external variables affecting the process both during laboratory tests
and when the process transitions to production. In the laboratory tests, the follow-
ing variables have been noted: canister eccentricity, leaking gas from argon cham-
ber, varying atmosphere (temperature and humidity), mismatch of welding objects
(different diameter on lid and tube), and cleanliness of welding objects. In addi-
tion, different material properties in the lid and tube have been noted. Differences
were noted between the extruded and pierce-and-draw tubes, and the lids are now
stress relieved through heat treatment to not be affected by cold-work from ma-
chining.
In production, other variables will appear like a heated canister (due to the spent
nuclear fuel). Other production variables could be wear in the spindle motor and
replacements of the same, although such differences have not been noted in la-
boratory tests.
2.7 Process disturbances
During a full weld cycle, there are three types of disturbances typically encoun-
tered. Two of these can be directly related to the temperature signal, while the
third is spotted in the torque measurements. These disturbances (including the
variable thermal boundary conditions due to the path of the weld cycle) are the
reason why control of the process is needed.
2.7.1 Temperature disturbances
The first type of temperature disturbances is associated with the tool moving to or
from areas that have been significantly heated already. During for example the
dwell sequence the tool is kept in a fixed position while the temperature increases.
This will mainly affect the immediate area around the tool which is later left be-
hind when the tool starts moving. Such disturbances are also encountered during
the joint line sequence as the tool constantly moves towards a warmer area after
approximately half the cycle. Due to the relatively slow welding speed, this kind
of disturbance is rather low frequent in nature. Figures 4-9a and 4-12 show how
the power input varies during full weld cycles in order to keep a constant probe
temperature. Note especially how the mentioned temperature disturbance demands
the power to drop from around 200º of travel and onwards.
The second type of temperature disturbance occurs during the downward and park-
ing sequences and is caused by greater heat conduction at the joint line compared

21
to the lid. The first consequence of this is that the power input will have to in-
crease by a fair amount after the downward sequence has started. Similarly, during
the parking sequence, the power input will have to drop instead. Add the other
temperature disturbance to this and it explains why the power inputs drop so fast at
the end of the welds in Figure 4-12 from 360º of travel and onwards. Even though
these disturbances are rather slow, they will still have quite an impact on the tem-
perature profile. The reason being that they are relatively large in magnitude and
come at a time when the temperature is close to the desired value. The controller
may, therefore, not have enough information about the disturbance to raise the
power input fast enough. The results of this are described thoroughly in section C
5.3.1.
2.7.2 Torque disturbances
The torque required by the spindle to maintain the rotation rate will vary depend-
ing on the properties of the material. The tool is for example more likely to pene-
trate a bit deeper into the copper in areas that have been significantly preheated,
thus resulting in a higher torque value. The slightly different characteristics of the
tube and lid will also give rise to such torque variations that will primarily affect
the power input, but secondarily also the welding temperature. While these dis-
turbances appear in all five sequences, it is only during the joint line sequence that
they are relatively insignificant. These disturbances are faster compared to their
temperature counterparts and are discussed further in section 4.7.3.

23
3 Closed loop control
In this chapter the control fundamentals used for this application are presented. It
was not obvious at the start of this study that a controller would be needed. How-
ever, it was soon noted that the FSW process, just like other real processes, is not
100% predictable due to for example the process disturbances described in section
2.7. A well-designed controller is able to handle this unpredictable nature as well
as process alterations over time.
To understand the benefits of automatic control, it is important to understand the
differences between open and closed loop control. A system in open loop control
changes the input parameters without any online information (measurements) of
how the process is working. Instead, the process is controlled with preset parame-
ter values based on previous behavior and more or less precise models. This ap-
proach works well if the process model is very accurate and/or if the process is
insensitive to disturbances likely to occur. Another advantage is that it does not
require any sensor equipment to work.
In closed loop control, on the other hand, measurements of the process output pa-
rameters are fed back and used to manipulate the input parameters. This can either
be done through manual control, in which an operator monitors the process values
and changes the input parameters accordingly, or by automatic control. In auto-
matic control, the measurements are fed back to a controller (typically implement-
ed on a computer) which compares the current output parameter values to the de-
sired and make the necessary adjustments to the input parameters. While manual
control may be preferable in some cases (like steering a car), an automatic control-
ler can often be tuned to work just as good, and it also eliminates the human fac-
tor. Closed loop feedback has at least three major advantages to open loop control.
First of all, it handles process disturbances that are part of almost every industrial
process. Secondly, the process model does not have to be 100 percent accurate,
since a well-tuned controller gives a robust closed loop system. The third benefit is
that the control is likely to work even if the process changes over time (likely for
most processes that are active for a longer period of time), also a result of the con-
troller robustness. It is, however, important to tune the controller suitably. Possible
results of a poorly tuned controller are noisy input parameters or even an unstable
process.
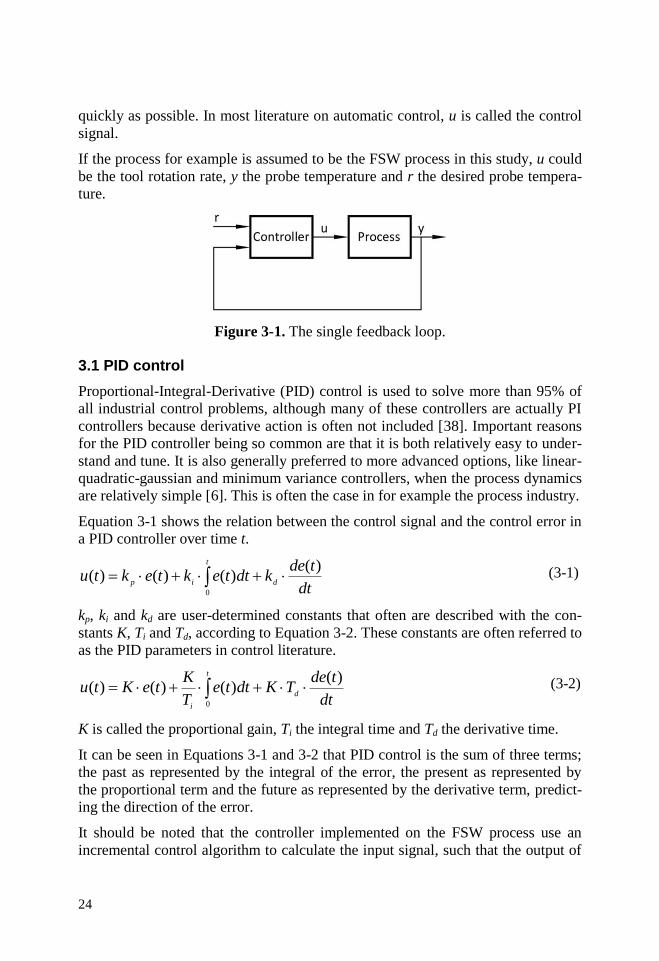
A single feedback loop is illustrated in Figure 3-1. The process output parameter
in need of control is labeled y. This signal is fed back to the controller through
sensor measurements. There, it is compared to its own desired value, r, which is
often called the reference or the set-point. The controller takes the process and set-
point information into consideration and manipulates the input parameter (chosen
to control the process), u, in an effort to minimize the control error, e = r - y, as
24
quickly as possible. In most literature on automatic control, u is called the control
signal.
If the process for example is assumed to be the FSW process in this study, u could
be the tool rotation rate, y the probe temperature and r the desired probe tempera-
ture.
Figure 3-1. The single feedback loop.
3.1 PID control
Proportional-Integral-Derivative (PID) control is used to solve more than 95% of
all industrial control problems, although many of these controllers are actually PI
controllers because derivative action is often not included [38]. Important reasons
for the PID controller being so common are that it is both relatively easy to under-
stand and tune. It is also generally preferred to more advanced options, like linear-
quadratic-gaussian and minimum variance controllers, when the process dynamics
are relatively simple [6]. This is often the case in for example the process industry.
Equation 3-1 shows the relation between the control signal and the control error in
a PID controller over time t.
dt
tdekdttektektu
d
t
ip
)()()()(
0
(3-1)
kp, ki and kd are user-determined constants that often are described with the con-
stants K, Ti and Td, according to Equation 3-2. These constants are often referred to
as the PID parameters in control literature.
dt
tdeTKdtte
T
KteKtu
d
t
i
)()()()(
0
(3-2)
K is called the proportional gain, Ti the integral time and Td the derivative time.
It can be seen in Equations 3-1 and 3-2 that PID control is the sum of three terms;
the past as represented by the integral of the error, the present as represented by
the proportional term and the future as represented by the derivative term, predict-
ing the direction of the error.
It should be noted that the controller implemented on the FSW process use an
incremental control algorithm to calculate the input signal, such that the output of

25
the controller is added every update time step to the previous control signal. This
method is for example commonly used in motor control and has the advantages
that it easily handles control mode changes (e.g. switching between two different
controllers) and integrator wind-up [36]. The alternative is to let the output of the
controller be equivalent to the control signal. This is often a natural choice that
may prevent misunderstandings of the controller, but it is also a bit trickier to han-
dle during mode changes and wind-up [37].
3.1.1 PID tuning methods
The relative simplicity of the PID controller, with only three adjustable constants,
has led to the development of many empirical tuning methods. The first two meth-
ods to emerge were presented by Ziegler and Nichols in the 1940s [38]. Their step
response method is based on an open-loop output parameter response to a step in
the control signal (see section 3.5.1 for more information on step response tests).
The PID constants are then related to the process delay and speed, captured in the
process response, such that the closed loop system can reject disturbances on the
process input quickly. While the step response method uses open loop experiments
on the process, Ziegler and Nichols‘ second method requires a closed loop system
with a proportional controller active. The gain of the controller is increased until
the process starts to oscillate. The controlled process will be on edge of instability
when the amplitude of oscillations remains constant. The frequency and amplitude
of this periodic motion can thereafter be used to determine suitable PID constants.
Although the Ziegler-Nichols methods are simple to use, they have drawbacks that
have minimized their usefulness over the last decades. The two major drawbacks
are that too little process information is used, and that the resulting controllers lack
robustness [38].
There have been many improved tuning methods developed since Ziegler-Nichols,
such as AMIGO (Approximate M-constrained Integral Gain Optimization) that is
a method developed to find more robust controller settings [36]. Another common
method in industry is lambda tuning [36]. In this method, the time constant of the
closed loop system is set to be related to that of the process.
The PID tuning method used in this study was recently developed and is described
in [6]. While many of the most commonly used tuning methods are built on formu-
las, this method instead uses computer software to find the controller constants.
This has the advantage that the controller will be specifically optimized for the
current process, rather than approximately optimal. There are, for example, several
known cases when both AMIGO and lambda tuning need to be modified depend-
ing on the process parameters [36]. Furthermore, the used method takes both
closed loop robustness and noise sensitivity into account to make the controller
tuning even more reliable. The tuning method is even more thoroughly described
in [C].

26
3.2 Cascade control
Efficient temperature control can often be obstructed by dead and lag time in the
temperature measurements, since a (PID) controller can only be tuned as fast as
the process will allow. A solution for such problems can be to add a second PID
controller if there is a secondary process, usually more responsive i.e. less dead
and lag time, that influences the main process. The resulting cascade controller,
illustrated in Figure 3-2, has the advantage that the secondary loop, named the
inner loop, will correct for disturbances that will thus have little effect on the con-
trolled parameter, which is the tool temperature in this study. A single loop con-
troller instead has to wait on the disturbance to show up in the temperature read-
ing, and the effects of this can be found in section C 3.4. A disadvantage with the
cascade controller is that two controllers need to be tuned instead of one.
Figure 3-2. The cascade feedback loops.
3.3 Feed-forward
The quality of the closed loop system can sometimes be improved, through
knowledge about the process, by combining the feedback loop with a feed-forward
part. For example, the path of the weld cycle to seal the canisters is repeatable and
the tool rotation rate changes during the downward and parking sequences can be
fed forward and combined with the PID output to possibly improve the control
performance overall. This type of open loop feed-forward is mainly useful if the
process behaviour is totally predictable. Since the process is likely to change over
time, it is also important to monitor such a control scheme in case it would start to
behave worse. While the feedback loop should also be reevaluated continuously, it
will be much more robust to process alterations. A different type of feed-forward
is possible if a disturbance can be measured and cancelled before it has even had
time to affect any of the output parameters [36].
3.4 Gain scheduling
Gain scheduling is a technique suited for processes with non-linear behaviour,
time variations or different control requirements throughout the process [36]. In
gain scheduling the controller structure and/or constants are changed depending on
the operating conditions of the process. In this specific FSW application, where
the different sequences in the weld cycle results in different process behaviour, the

27
use of gain scheduling has been an integral part of the controller implementation.
The controller is designed differently depending on weld sequence, as described in
[C].
3.5 Controller for the FSW process
During this study, it was noted that the power input influenced the tool tempera-
ture greatly, and that there in fact was a repeatable (linear) correlation between
them. The use of a cascade controller seems ideal to control the process with fast
and non-linear power input disturbances and relatively slow tool temperature
changes, since the tool rotation rate used to control the tool temperature, which has
significant response time, also directly controls the power input without response
time according to Equation 2-1. The inner loop is tuned for fast suppression of
power input disturbances while the outer loop can adapt itself to the slower chang-
es in temperature. More information on the cascade control of the FSW process
can be found in section C 3.5.
The inner and outer loop controllers have been chosen to be PI controllers, be-
cause it is a simpler controller to start out optimizing than a PID. The resulting
probe temperature using the PI controllers, see sections 4.7.6 and 4.9.1, shows that
PI controllers are sufficient for this application.
The outer loop determines the required power input, Pr, to keep the probe tempera-
ture, T, at the desired value, Tr, according to Equation 3-3,
0,
)()( dtTTT
KTTKP
r
outeri
outer
routerr (3-3)
After derivation with regards to time and approximation that dPr≈ΔPr, dt≈Δt,
dTr≈ΔTr and dT≈ΔT and the fact that ΔPr = Pr0-Pr1, ΔTr = Tr0-Tr1, ΔT = T0-T1 and
Δt = h (h is the sampling time) gives the form presented in Equation 3-4. The in-
dex 0 refers to the current values while index 1 stands for the values 1 sample
behind (for example, 1 second ago if the controller is run in 1 Hz i.e sampling time
of 1 second).
)()()(1100
,
10TTKTT
T
hKKPP
routerr
outeri
outer
outerrr
(3-4)
Similarly, the inner loop determines the (necessary) change in the tool rotation
rate, ω, from Equation 3-5,
0,
)()( dtPPT
KPPK
r
inneri
inner
rinner (3-5)
which through derivation, in similar way as Equation 3-4, gives the incremental
form presented in Equation 3-6.

28
)()()(1100
,
10PPKPP
T
hKK
rinnerr
inneri
inner
inner
(3-6)
P is the power input and Pr is given by the calculations in Equation 3-4. The con-
troller constants Kinner, Ti,inner, Kouter and Ti,outer are derived according to the proce-
dure in section 3.5.2.
3.5.1 Step response tests used for process modeling
It is common practise in industry to use step response tests as an easy method for
process modeling. These tests are initiated by taking the process to steady-state
around the operating point, enable manual control and make a step change in the
control signal, see for example the sketched tool rotation rate step response in
Figure C-10. The response of the output parameter, y, will then reveal important
process dynamics, used to model the process. In this thesis, process simulations
and a method called TRA (Transient Response Analysis) [39] have been utilized
to make models out of the step response data.
Step response tests do, however, have the disadvantages that they are both sensi-
tive to disturbances acting on the process (for instance temperature and torque
disturbances in the FSW process) and insufficient for describing higher order pro-
cesses. For the FSW process, disturbances are handled by dividing the process into
two parts. The first part (inner loop) is fast enough to not be affected by disturb-
ances, while step response tests can be carried out on the second part (outer loop)
after closing a control loop around the first, see section 4.7.1 for more information.
By analyzing data it is clear that the FSW process has monotonic step responses,
which can be modeled sufficiently well by lower order models [36]. This makes
the mentioned disadvantages small.
3.5.2 Tuning procedure
The controller tuning procedure for the cascade controller starts out with the com-
pletion of several step response tests between the control parameter (tool rotation
rate) and the output parameter (power input) for the inner loop. The step data is
then processed for modeling and collection of noise data to be used in the PID
tuning method. When the PID tuning has been finished, the inner loop is closed
and new step response tests are made. This time the steps are carried out between
the control signal (power input reference) and the output signal (probe tempera-
ture) of the outer loop. These steps should be decently well-behaving as the inner
loop takes care of torque disturbances. Step data is once again used for modeling
and controller tuning for the outer cascade loop.
An important point in the development of the tuning procedure is to make it as
simple and intuitive as possible. This way, it will enable people without a broad
education in control engineering to carry out the steps necessary.

29
The step response tests and the tuning procedure are more thoroughly explained in
chapters C 4 and C 5.
3.6 Closed loop control of FSW
As of today, most friction stir welds are made on plates, with more uniform ther-
mal boundary conditions than cylinders, and in aluminium, that has a relatively
large process window. For these reasons, there are currently only a small (although
growing) amount of FSW applications using any feedback control at all. The weld-
ing temperature is, for instance, rarely even measured. Instead, a welding operator
might just decrease axial force if the tool depth increases as the tool and plate get
hotter at the end of a long weld cycle.
Robotic FSW applications face several challenges that the welding procedure in
this study does not share; i.e. axial force control can be influenced by limited force
capacity and deflection in linkages and joints of the robot [40]. Longhurst [41] on
the other hand, uses torque control to control tool depth instead of axial force con-
trol. With this method, Longhurst also presents an alternative way of controlling
the power input and thus also the temperature indirectly, although uncontrolled
axial force is achieved.
Fehrenbacher et al have approached closed loop control of the tool-workpiece
interface temperature through non-uniform thermal boundary conditions (varying
plate thickness or different backing plate material) originally by adjusting the
welding speed [42], and more recently by adjusting tool rotation rate [43]. The
thermocouple was placed through the shoulder and is in contact with the alumini-
um workpiece. The process is approximately 100 times faster (100 times lower
time constant) than the process described in this thesis, with a time constant of
0.11 seconds and a time delay of 0.085 seconds. As a result, an I-controller is suf-
ficient to control the process and no cascade controller using power input is need-
ed. Fehrenbacher et al [44] also compared the influence of tool rotation rate and
welding speed adjustments on the tool temperature for four different aluminium
alloys. For the 2-, 6- and 7xxx series alloys the tool rotation rate affected the tem-
perature more, while low and similar effect on the 5xxx series alloy were ob-
served. It was also noted that there was a 20 times longer response time for the
temperature to respond to welding speed adjustments than to tool rotation rate
adjustments.
A study by Mayfield and Sorensen [45] suggests future development of a cascaded
control strategy similar to the one presented in [G]. A thermal balance model
equation for a control volume is presented where the weld zone temperature is
determined by a complex differential equation that depends on the welding speed,
the tool rotation rate, the spindle torque, the effective heat transfer, and the tem-
perature of the surroundings. The fact that the weld zone temperature is stable only
when the net flux is zero highlights, according to Mayfield and Sorensen, the diffi-

30
culty of obtaining successful temperature control in FSW. Similarly, Ross and
Sorensen [46] are implementing a power input controller meant to be part of a
future cascade controller similar to the one presented in [H].
To conclude, the need for reliable control of the welding temperature should in-
crease as FSW is used on metals like titanium and steels that will have much
smaller process windows for the welding temperature. In addition, more complex
geometries of welding objects will result in non-uniform thermal boundary condi-
tions and need of control of welding temperature.
3.6.1 The author’s view on control of FSW
The author‘s initial view on control and controllability for this FSW application
was that the controller should preferably only use one input and one output param-
eter for simplicity. However, since there is significant response time in the probe
temperature and clear relationship between power input and probe temperature, a
second output parameter, the power input, should be added in a cascade loop.
Other studies have shown that an increased welding speed can produce wormhole
defects [47], and adjustments in the tool rotation rate influences the tool tempera-
ture much faster than adjustments in the welding speed [44]. However, it has only
recently been reported that low axial force can produce wormhole defects [14]. In
theory, by using high tool rotation rate it is possible to reach the middle of the tool
temperature process window without the shoulder being in contact i.e. low axial
force, and it can be understood that defects are produced in this case.
It is therefore, in addition to the simplicity aspect, preferred to only use one con-
trol parameter (tool rotation rate), due to the possible influence on the tool temper-
ature process window from welding speed and axial force adjustments.

31
4 Development of the welding procedure
The following sections in this chapter describe chronologically how the welding
procedure was developed from the end of the program at TWI to the current state
as part of this study.
4.1 TWI development program
The development program during 1999-2002 was conducted on an experimental
welding machine at TWI, welding together copper rings. The theory of the TWI
personnel during this time was that the process could be controlled without adjust-
ing input parameters, but instead by changing the water flow rate through the
spindle head, a so-called ―thermal management facility‖[2].
During the only and final lid weld at TWI (consisting of two weld cycles) using
this approach, the first weld cycle had to be aborted after 85º along the joint line
because the probe temperature was 782ºC (although it was 897ºC during the start)
and a visible wormhole was produced, see Figures 4-1 and 4-2. During the second
weld cycle the welding speed was modified from 80 to 70 mm/min and the axial
force from 86 to 89 kN to achieve a warmer process and the result was a maxi-
mum probe temperature of 935ºC, see Figure 4-3.
Figure 4-1. Visible wormhole during lid weld at TWI.
The results during these weld cycles show that the process developed at TWI can
not be used with constant input parameters during a full circumferential weld cy-
cle, and that an adaptive welding procedure is essential. Instead of the water flow
rate affecting the process, it is the power input that affects the probe temperature.
An interesting observation from the tests on the experimental machine at TWI was
that the power capacity of the machine is limited (at approximately 45 kW). This
means that the tool rotation rate is reduced from the set value of 400 rpm when the
spindle torque increases above 1000 Nm according to Figures 4-2 and 4-3. The
effect that the probe temperature is increased although the power input is constant,
due to changing thermal boundary conditions, can be seen in the second weld cy-
cle when the tool moves upward from the joint line (marked with lower welding
speed between an x-axis value of 200 and 210º in Figure 4-3).

32
The irreversible nature of the process discussed in section B 1.1 can also be noted
during the two weld cycles since either the process got colder and colder or warm-
er and warmer, although the limited power capacity probably restricted the tem-
perature increase during the second weld cycle.
Figure 4-2. First weld cycle in the lid weld at TWI. *notes value on right y-axis.
Figure 4-3. Second cycle in the lid weld at TWI. *notes value on right y-axis.

33
4.2 Control method during initial welds
Based on the experience from the lid weld at TWI described in the previous sec-
tion, a method to control the probe temperature needed to be developed and tested.
From the first lid weld in 2003 to the first full size canister weld in 2004, this
method was that the welding operator manually changed the axial force in steps of
0.5 kN. The base and lid welds to the full size canister with a cast iron insert, were
among the most stable full circumferential weld cycles produced with this control
method, see Figure 4-4.
It can be seen how the probe temperature drops to 800ºC during the downward
sequence (around x-axis value of 30º of travel) of the lid weld although the axial
force is increased to 94 kN. Similarly, the probe temperature reaches 910ºC at the
end of the parking sequence although the force is held between 84-86 kN.
Figure 4-4. Weld data during full size canister welds. *notes value on right y-axis.
While the full size canister welds were acceptable, several drawbacks of the con-
trol method were noted during this time period. Most importantly, the control
method only influences the power input secondarily through the change in tool
depth. As a result, increased axial force can lead to excessive tool depth and flash
formation, see Figure 4-5. During the weld in Figure 4-5, the large tool depth
could not be recovered by decreasing the axial force, and the weld had to be abort-
ed before the downward sequence.
In addition, by decreasing the axial force the process window gets smaller as dis-
continuities (wormholes) can be formed at higher probe temperatures. While there
is currently not enough welds made with different axial force values at probe tem-
peratures close to the lower limit of the process window to completely validate,
this hypothesis of the thesis author should be intuitive. For example, if extremely

34
high tool rotation rate is used the probe temperature could be held within its pro-
cess window almost without the shoulder generating heat or being in contact with
the weld metal (i.e. low axial force). It should be intuitive that wormholes are pro-
duced when the shoulder is barely in contact with the weld metal. As a result, the
axial force should be held as constant as possible throughout the weld cycle.
Figure 4-5. Excessive tool depth and flash formation during start sequence.
4.3 Parameter study
After the full size canister welds in 2004, a Box-Behnken response surface exper-
iment was performed on the three input parameters; axial force, tool rotation rate
and welding speed. The procedure and results are documented in sections A 2.3, A
3.1 and in [48], and have one major conclusion affecting the continuation of this
thesis. This is that the tool rotation rate was the input parameter that influences the
probe temperature the most, and is thus best suited for controlling the process.
4.4 Control method after parameter study
During the years after the parameter study, 2004-2008, the tool rotation rate was
used as the main control parameter. The axial force was, however, also used as a
secondary control parameter to control the tool depth. The reason being that the
tool depth often increased as the tool moved towards heated regions after more
than half of the circumference. All changes to the tool rotation rate and the axial
force were made manually by the welding operator.
4.4.1 Demonstration series
The state of the process (and the control method) was demonstrated at the end of
2004, by producing 20 lid welds in a production-like frequency of one lid weld per
working day. The procedure and results are documented in sections A 2.3 and A
3.2, and the resulting probe temperature during the 360º of joint line sequence for
all 20 welds are presented in Figure 4-6 and Table 4-2 in section 4.9.1.

35
Figure 4-6. Probe temperatures during the 360º joint line sequences in the demon-
stration series. Numbers in legend are lidweld ID‘s.
4.5 Shoulder geometry study
In order to optimize the welding procedure with regards to process stability and
repeatability, five promising shoulder geometries, see Figure 4-7, were designed
and compared, and then the input parameters were optimized for the most stable
shoulder geometry. The procedure and results are documented in sections B 1.1,
2.2-2.3 and 3.1-3.3, with the most significant conclusion that the convex scroll
shoulder was the best geometry in all three evaluation criteria; stable probe tem-
perature, minimum flash and no defects formed. This result was in line with the
thesis author‘s hypothesis (presented in section B 1.1) that, in force-controlled
mode, a concave shoulder results in an unstable process, while a convex shoulder
results in a stable process.
Figure 4-7. Shoulder geometries tested: a. ø60mm concave; b. ø70mm concave; c.
ø70mm flat scroll; d. ø70mm convex scroll; e. ø70mm convex-concave scroll.
In addition, it could also be seen from the input parameter study (presented in sec-
tion B 3.2) that the power input had excellent linear correlation with the probe
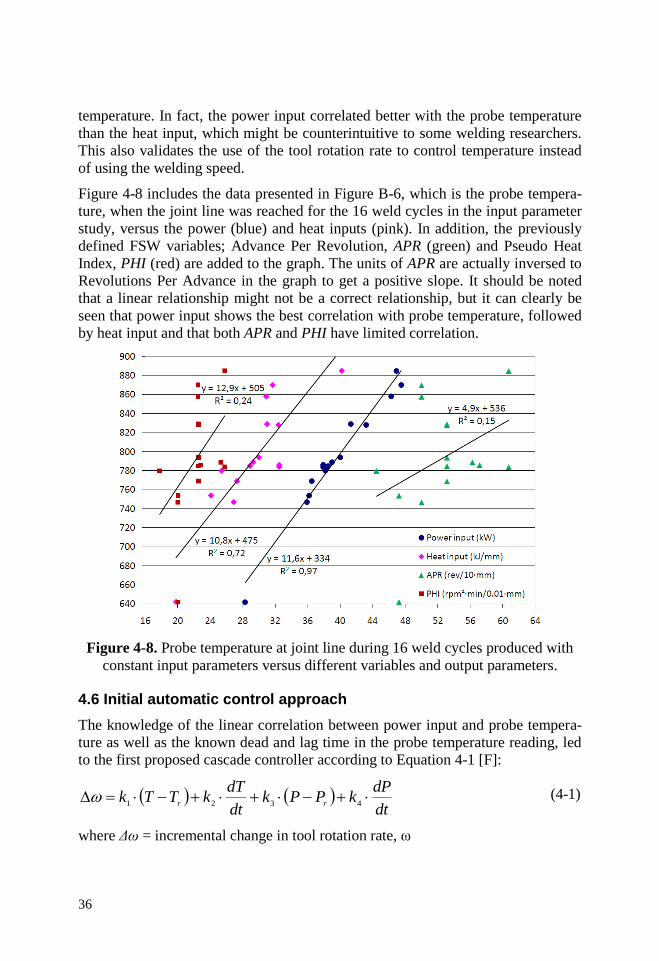
36
temperature. In fact, the power input correlated better with the probe temperature
than the heat input, which might be counterintuitive to some welding researchers.
This also validates the use of the tool rotation rate to control temperature instead
of using the welding speed.
Figure 4-8 includes the data presented in Figure B-6, which is the probe tempera-
ture, when the joint line was reached for the 16 weld cycles in the input parameter
study, versus the power (blue) and heat inputs (pink). In addition, the previously
defined FSW variables; Advance Per Revolution, APR (green) and Pseudo Heat
Index, PHI (red) are added to the graph. The units of APR are actually inversed to
Revolutions Per Advance in the graph to get a positive slope. It should be noted
that a linear relationship might not be a correct relationship, but it can clearly be
seen that power input shows the best correlation with probe temperature, followed
by heat input and that both APR and PHI have limited correlation.
Figure 4-8. Probe temperature at joint line during 16 weld cycles produced with
constant input parameters versus different variables and output parameters.
4.6 Initial automatic control approach
The knowledge of the linear correlation between power input and probe tempera-
ture as well as the known dead and lag time in the probe temperature reading, led
to the first proposed cascade controller according to Equation 4-1 [F]:
dt
dPkPPk
dt
dTkTTk
rr
4321 (4-1)
where Δω = incremental change in tool rotation rate, ω

37
T = probe temperature
Tr = desired probe temperature
Pr = desired power input (a function of location around lid)
Before implementation Equation 4-1 was modified according to Equation 4-2 [G]
since the noisy power input signal is sensitive to derivation and the new thermo-
couples in the shoulder (with less dead and lag time) had been added. In addition,
a feed-forward term was added as the tool rotation rate seemed to increase in a
similar way during the downward sequence of multiple weld cycles.
r
shoulderID
rprobedfeedforwarPPk
dt
dTkTTk
321
(4-2)
At the time it was thought that the required power input was repeatable between
weld cycles. Figure 4-9a shows the power input requirement versus the distance
around the canister (in º) presented in [G]. The fact that there is a linear relation-
ship between the probe temperature and the power input in Figure 4-8 was also
thought to show that the power input requirement is repeatable between weld cy-
cles.
Figure 4-9a. Required power input to Figure 4-9b. Model of Δωfeedforward
achieve a probe temperature of 850ºC. during the downward sequence.
In addition to the mentioned hypothesis regarding the required power input being
repeatable between weld cycles, it appeared that the tool rotation rate adjustments
during the downward sequence have enough repeatability between weld cycles to
aid the controller through feed-forward. The fitted curve in Figure 4-9b shows how
the tool rotation rate (in rpm) was increased during the 119 seconds of downward
sequence to maintain a probe temperature around 850°C.
When the initial controller was to be used, the constants were derived using the
relationships between probe temperature and power input seen in Figure 4-8, ac-
cording to Equation 4-3. In addition, the use of the shoulder ID temperature in the
derivative term according to Equation 4-2 was changed to the probe temperature to
limit the number of signals used by the controller.

38
r
probe
probedfeedforwarPP
dt
dTT 5.225.08501.0
(4-3)
Figure 4-10 shows the results from the most stable weld with the initial controller;
a long weld cycle (124º), which uses an update rate of 0.25 Hz and constants ac-
cording to Equation 4-3. The probe temperature peaks at 864ºC during the begin-
ning of the joint line sequence and after approximately 700 seconds of travel has
its lowest value of 841ºC. It should be noted that the downward sequence starts at
an x-axis value of 0 seconds and ends at 119 seconds.
Figure 4-10. Most stable cycle with initial controller. *notes value on right y-axis.
4.6.1 Full weld cycle
The controller settings were hand-tuned based on experience from more than 10
shorter weld cycles i.e. by trial and error. Figure 4-11 shows the results from the
first and only full weld cycle with the initial controller, using an update rate of 1
Hz and constants according to Equation 4-4:
r
probe
probedfeedforwarPP
dt
dTT 2.032.085005.0
(4-4)
It can be seen that the longer dead time of the probe temperature measurement
together with incorrect preset desired power input values results in a poorly
damped process during the downward and parking sequences (first and last 120
seconds in Figure 4-11 that has same legend as Figure 4-10), as well as during the
first 200 seconds of the joint line sequence (125-325 seconds on the x-axis).

39
Figure 4-11. Full weld cycle with the initial controller.
4.7 Final automatic control approach
The initial controller was difficult to tune in a scientific manner, rather a trial and
error hand-tuning approach was used. In addition, it was concluded that the power
input requirement to reach and keep the probe temperature in the middle of the
process window will in fact vary more or less from weld cycle to weld cycle ac-
cording to Figure 4-12.
Figure 4-12. Power input (filtered) for 5 different weld cycles (in air).

40
Figure 4-12 shows required power input to keep the probe temperature at 850ºC
for 5 different weld cycles. The main reason for this variation is probably different
material properties in the manufactured components (tubes and lids). Figure 4-12
shows that the required power input can differ as much as 3 kW between weld
cycles. As a result, it is not advisable to control towards a preset desired power
input for every weld cycle like the initial controller, but to have an adjustable de-
sired power input value. A previous study, see Figure 4-8, has shown that a 1 kW
change in power input will result in a change of approximately 12ºC in probe tem-
perature.
4.7.1 Step response tests
Step response tests were produced on the process as described in section 3.5. Dis-
turbances in spindle torque and power input influences the probe temperature re-
sponse as can be seen in Figure 4-13, where a step in the tool rotation rate is pro-
duced during the joint line sequence at an x-axis value of 0 seconds. Then at an x-
axis value of 80 seconds the spindle torque drops resulting in a probe temperature
drop, making it difficult to derive an accurate model of the process from tool rota-
tion rate to probe temperature. In addition, the hypothesis of the irreversible nature
of the FSW process described in section C 4.1.1 also validates the use of a closed
inner loop to minimize disturbances. It should be noted that an accurate model of
the faster process from tool rotation rate to power input can be derived because the
disturbances are not as likely to influence this process.
Figure 4-13. Step response test between tool rotation rate and probe temperature.
In Figure 4-14 during the joint line sequence a step response test with a closed
inner loop (Pr = 52 kW) is produced at an x-axis value of 185 seconds. At an x-

41
axis value of 234 seconds the step in Pr is made in the opposite direction. It can be
noted that there is different process dynamics when heating or cooling, the in-
creased power input results in faster probe temperature response than decreased
power input. The reason is that cooling can not be forced in the same manner as
heating can in this process.
Figure 4-14. Step response test between power input and probe temperature.
The reason why the temperatures decrease over the span of the step response test
in Figure 4-14, although the power input at the start and end is similar, is because
the tests were done in the early stage of the joint line sequence when the tool
moves away from the heated start location and an increase in power input is need-
ed to maintain constant probe temperature. This effect should not affect the result-
ing controller settings significantly.
4.7.2 Argon
Figure 4-15 shows that the spindle torque and power input have less variation and
are less noisy when welding in argon compared to in air. The reason for the less
variations and noise are thought to be the lack of copper oxide in contact with the
tool i.e. the tool is in contact with material having more uniform properties. The
argon gas also results in no noticeable shoulder wear and constant (and minimal)
flash throughout the cycle, also resulting in less noisy spindle torque.
It has been observed that the smaller variations in spindle torque during an argon
gas weld will make the process control much easier. This is especially important
during the start-up sequences when the disturbances are rather severe. In addition,
during the early development of the final controller, when welding in air, large
oscillations in several parameters, which are highly unwanted, were maintained by

42
the controller. This behavior was completely gone when argon gas was employed.
It should also be noted that these oscillations have not been noted when welding in
air with the modified controller with a start sequence according to section 4.7.4,
since a more stable start sequence is achieved.
To conclude, the control of the FSW process has been significantly simplified by
the use of argon gas. The spindle torque varies much less and there have not been
any self-induced oscillations.
Figure 4-15. Full weld cycles in argon (Ar) and air. * means value on right y-axis.
4.7.3 Disturbances
An important measure of the controller performance will be how well it suppresses
disturbances. Section 2.7 describes the disturbances typically encountered in the
spindle torque and the probe temperature. As an example, Figure 4-16 illustrates
the second half of the downward sequence (until 120 sec on x-axis) and 60 se-
conds of joint line welding (in air). During the end of the downward sequence the
tool starts moving into the tube and since the tube material in this specific occa-
sion has different material properties (due to pierce and draw manufacturing tech-
nique instead of extrusion process) than the welding operator is used to, the spin-
dle torque drops. Although the welding operator reacts in approximately 5 seconds
and increases the tool rotation rate by 85 rpm in less than 30 seconds, the power
input drops from 45 to 38 kW before increasing again, and as a result the probe
and shoulder ID temperatures drop from 878 and 870ºC to 791 and 748ºC, respec-
tively.

43
Figure 4-16. Disturbance during downward sequence. * value on right y-axis.
While Figure 4-16 shows the shortcomings of manual control, Figure C-17 illus-
trates how the controller handles a rapid spindle torque disturbance after 105 se-
conds of the downward sequence (probably caused by the probe moving into the
tube). Although the spindle power instantaneously drops from 51 to 45.5 kW, the
controller increases the tool rotation rate by 20 rpm in the next 2 seconds and the
power input is back at 50 kW. As a result, no disturbance in the probe temperature
is registered and only minor drops of 5ºC are noted in the shoulder ID and OD
temperatures.
Figure C-8 presents an example of how disturbances could affect the probe tem-
perature if a cascade controller is not used. The single loop controller only using
the probe temperature spots the fast spindle torque disturbances too late, resulting
in a large drop in probe temperature during the downward sequence.
4.7.4 Start sequence developments
During four full weld cycles using the controller (presented in section C 5.3.2) it
was noted that while the joint line sequences repeatedly produced satisfactory
welds, the start and downward sequences were still in need of more research to
reach the desired stability and repeatability. These sequences are also, by far, the
most exposed to disturbances in temperature as well as in spindle torque. Section
C 5.3.1 presents how the controller was modified to use the inner cascade loop
during the dwell and start sequences to make them more stable and repeatable.

44
4.7.5 Parking sequence developments
Similarly to the downward sequence when the power input needs to be increased
to maintain the probe temperature due to travel in a direction with more heat con-
duction, the power input needs to be decreased during the parking sequence due to
travel in a direction with less heat conduction. Section C 5.3.2 presents how the
desired probe temperature was modified from experience (i.e. feed-forward) dur-
ing the parking sequence.
4.7.6 Full weld cycles
Figure 4-17 shows the results at the 360º joint line sequences from 8 full weld
cycles in argon gas using the controller and a desired probe temperature of 840ºC
(KL353-356) or 845ºC (KL404-407). The reason for choosing a temperature be-
low the middle of the process window (850ºC), was because a probe fracture is
much more critical than the wormhole discontinuities that can be produced at
probe temperatures just below 790ºC.
Figure 4-17. Probe temperatures during the 360º joint line sequences in the
full weld cycles using the final controller. * means value on right y-axis.
It can be seen in Figure 4-17 that the last three weld cycles in the first lid, KL354-
356, have a momentarily unstable probe temperature after approximately 315º.
The reason for this is that the last three weld cycles traverse through the previous
weld cycle‘s overlap sequence at this location, hence a spindle torque disturbance
occurs due to the uneven canister surface at the overlap. In the second lid, the can-
ister surface was machined between weld cycles and this disturbance was not pre-
sent during KL405-407. It can also be noted that the first weld cycle in each lid,
KL353 and KL404, had similar disturbances in the probe temperature at the end of

45
the joint line sequence i.e. the overlap.
Although these disturbances occur, the controller keeps the probe temperature
within ±10ºC of the desired value during the joint line sequence, to be compared
with the process window of approximately ±60ºC.
4.7.7 Start in exit hole
A controller approach was also developed to be able to start the process on the
joint line in old exit holes. Such welds could potentially be necessary to handle if a
weld cycle has to be aborted during the joint line sequence. It is, thus, of interest to
see if the controlled process can handle these tests without any defect formation.
Figure 4-18 shows the resulting data of such a weld, where the tool starts moving
along the joint line at an x-axis value of 0 seconds. The temperature increase at the
dwell sequence is much slower than during normal operation. The reason being
that the probe generates less frictional heat in the exit hole than in the smaller pilot
hole. The efficiency will, however, increase drastically when the tool starts mov-
ing. This leads to the fast increase in torque and temperature just after 0 seconds.
To not get a temperature overshoot, the desired probe temperature is slowly in-
creased from 810 to 845ºC.
Figure 4-18. Start in an exit hole. * refers to the values on the right y-axis.
The development of a start in exit hole procedure is, however, still in its infancy.
Improvements could most definitely be made to the procedure by using a slightly
larger probe (increased diameter by approximately 1-2 mm), which should also
reduce the risk of defects forming. The reason why the probe diameter needs to be

46
increased is that the volume of the exit hole is too large and that in fact copper is
missing since the probe usually contains copper when extracted (see Figure 4-19).
4.8 Probe life development
The worst scenario that can happen during welding is most definitely a probe frac-
ture at the joint line, resulting in need to cut up the canister, recover the spent fuel
and scrap the copper components. Therefore, developments to increase the safety
factor against probe fracture, including a larger process window, have been part of
the thesis objective. It should be noted that the probes will only be used for one
cycle each in production.
4.8.1 Pilot hole geometry
The original pilot hole from the TWI development program was a 54 mm deep
cylindrical hole with a diameter of 20 mm, positioned on the joint line. However,
the probe experiences stress as it is plunged into the cylindrical hole, which can
lead to cracks forming during the weld cycle as can be seen on the probe to the
right in Figure 4-19.
Figure 4-19. Probe with 17 mm MX (left) used for one full cycle, and a full MX
probe (right) used for one full cycle plunging into a cylindrical pilot hole.
To minimize the stress on the probe during the plunge sequence, the cylindrical
pilot hole is now formed to conical form using another tool probe (without MX
features, reused for hundreds of holes) before welding. To minimize the risk of
excessive tool depth during the dwell sequence the diameter of the cylindrical pilot
hole has been reduced from 20 to 15 mm resulting in a 44% smaller pilot hole
volume.
The reduced stress on the probe using the probe-formed pilot hole instead of a
cylindrical hole can also be seen when comparing the reduced length of the probes
in Figure 4-19. Both were used for one full weld, but the probe on the right
plunged into the cylindrical pilot hole reduced its length by 1.7 mm while the
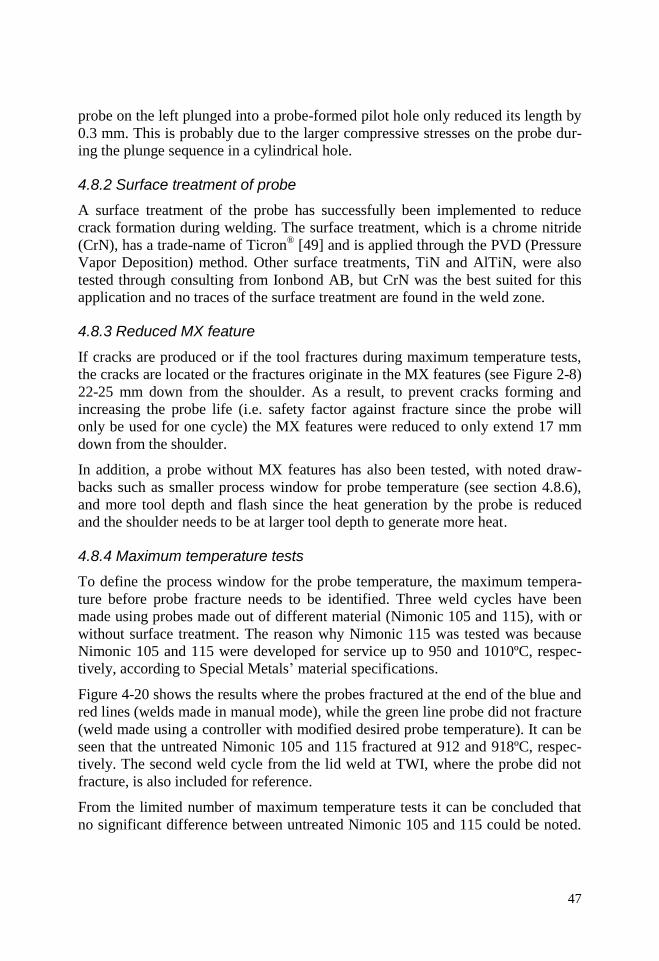
47
probe on the left plunged into a probe-formed pilot hole only reduced its length by
0.3 mm. This is probably due to the larger compressive stresses on the probe dur-
ing the plunge sequence in a cylindrical hole.
4.8.2 Surface treatment of probe
A surface treatment of the probe has successfully been implemented to reduce
crack formation during welding. The surface treatment, which is a chrome nitride
(CrN), has a trade-name of Ticron® [49] and is applied through the PVD (Pressure
Vapor Deposition) method. Other surface treatments, TiN and AlTiN, were also
tested through consulting from Ionbond AB, but CrN was the best suited for this
application and no traces of the surface treatment are found in the weld zone.
4.8.3 Reduced MX feature
If cracks are produced or if the tool fractures during maximum temperature tests,
the cracks are located or the fractures originate in the MX features (see Figure 2-8)
22-25 mm down from the shoulder. As a result, to prevent cracks forming and
increasing the probe life (i.e. safety factor against fracture since the probe will
only be used for one cycle) the MX features were reduced to only extend 17 mm
down from the shoulder.
In addition, a probe without MX features has also been tested, with noted draw-
backs such as smaller process window for probe temperature (see section 4.8.6),
and more tool depth and flash since the heat generation by the probe is reduced
and the shoulder needs to be at larger tool depth to generate more heat.
4.8.4 Maximum temperature tests
To define the process window for the probe temperature, the maximum tempera-
ture before probe fracture needs to be identified. Three weld cycles have been
made using probes made out of different material (Nimonic 105 and 115), with or
without surface treatment. The reason why Nimonic 115 was tested was because
Nimonic 105 and 115 were developed for service up to 950 and 1010ºC, respec-
tively, according to Special Metals‘ material specifications.
Figure 4-20 shows the results where the probes fractured at the end of the blue and
red lines (welds made in manual mode), while the green line probe did not fracture
(weld made using a controller with modified desired probe temperature). It can be
seen that the untreated Nimonic 105 and 115 fractured at 912 and 918ºC, respec-
tively. The second weld cycle from the lid weld at TWI, where the probe did not
fracture, is also included for reference.
From the limited number of maximum temperature tests it can be concluded that
no significant difference between untreated Nimonic 105 and 115 could be noted.
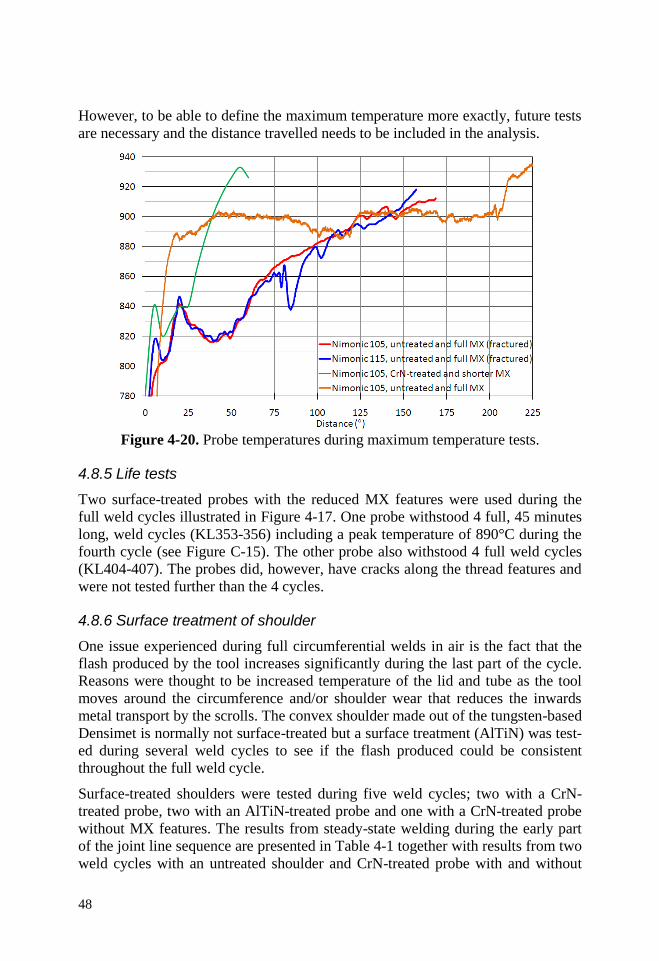
48
However, to be able to define the maximum temperature more exactly, future tests
are necessary and the distance travelled needs to be included in the analysis.
Figure 4-20. Probe temperatures during maximum temperature tests.
4.8.5 Life tests
Two surface-treated probes with the reduced MX features were used during the
full weld cycles illustrated in Figure 4-17. One probe withstood 4 full, 45 minutes
long, weld cycles (KL353-356) including a peak temperature of 890°C during the
fourth cycle (see Figure C-15). The other probe also withstood 4 full weld cycles
(KL404-407). The probes did, however, have cracks along the thread features and
were not tested further than the 4 cycles.
4.8.6 Surface treatment of shoulder
One issue experienced during full circumferential welds in air is the fact that the
flash produced by the tool increases significantly during the last part of the cycle.
Reasons were thought to be increased temperature of the lid and tube as the tool
moves around the circumference and/or shoulder wear that reduces the inwards
metal transport by the scrolls. The convex shoulder made out of the tungsten-based
Densimet is normally not surface-treated but a surface treatment (AlTiN) was test-
ed during several weld cycles to see if the flash produced could be consistent
throughout the full weld cycle.
Surface-treated shoulders were tested during five weld cycles; two with a CrN-
treated probe, two with an AlTiN-treated probe and one with a CrN-treated probe
without MX features. The results from steady-state welding during the early part
of the joint line sequence are presented in Table 4-1 together with results from two
weld cycles with an untreated shoulder and CrN-treated probe with and without
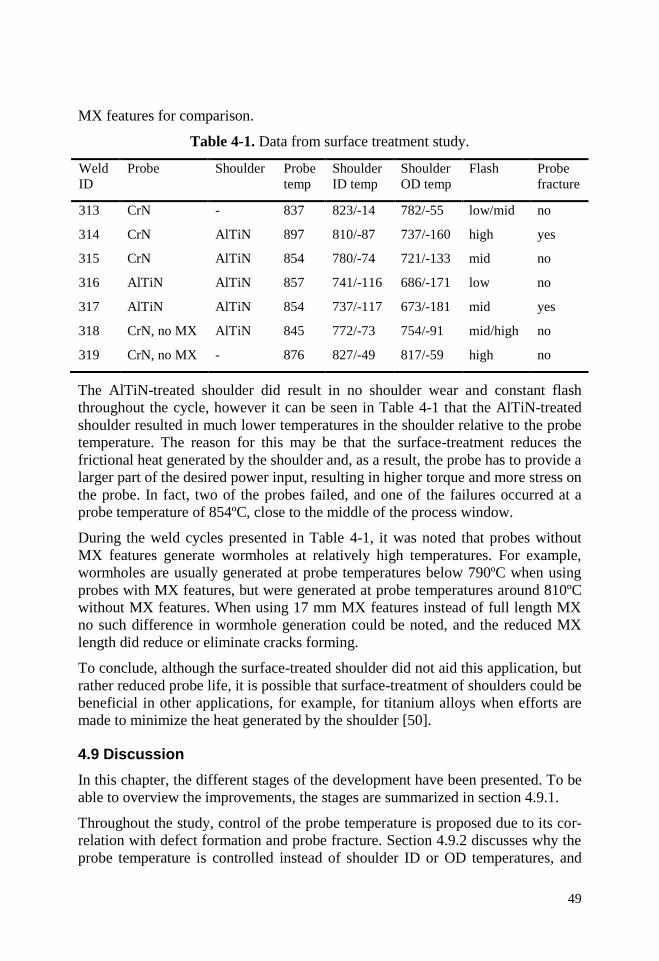
49
MX features for comparison.
Table 4-1. Data from surface treatment study.
Weld
ID
Probe Shoulder Probe
temp
Shoulder
ID temp
Shoulder
OD temp
Flash Probe
fracture
313 CrN - 837 823/-14 782/-55 low/mid no
314 CrN AlTiN 897 810/-87 737/-160 high yes
315 CrN AlTiN 854 780/-74 721/-133 mid no
316 AlTiN AlTiN 857 741/-116 686/-171 low no
317 AlTiN AlTiN 854 737/-117 673/-181 mid yes
318 CrN, no MX AlTiN 845 772/-73 754/-91 mid/high no
319 CrN, no MX - 876 827/-49 817/-59 high no
The AlTiN-treated shoulder did result in no shoulder wear and constant flash
throughout the cycle, however it can be seen in Table 4-1 that the AlTiN-treated
shoulder resulted in much lower temperatures in the shoulder relative to the probe
temperature. The reason for this may be that the surface-treatment reduces the
frictional heat generated by the shoulder and, as a result, the probe has to provide a
larger part of the desired power input, resulting in higher torque and more stress on
the probe. In fact, two of the probes failed, and one of the failures occurred at a
probe temperature of 854ºC, close to the middle of the process window.
During the weld cycles presented in Table 4-1, it was noted that probes without
MX features generate wormholes at relatively high temperatures. For example,
wormholes are usually generated at probe temperatures below 790ºC when using
probes with MX features, but were generated at probe temperatures around 810ºC
without MX features. When using 17 mm MX features instead of full length MX
no such difference in wormhole generation could be noted, and the reduced MX
length did reduce or eliminate cracks forming.
To conclude, although the surface-treated shoulder did not aid this application, but
rather reduced probe life, it is possible that surface-treatment of shoulders could be
beneficial in other applications, for example, for titanium alloys when efforts are
made to minimize the heat generated by the shoulder [50].
4.9 Discussion
In this chapter, the different stages of the development have been presented. To be
able to overview the improvements, the stages are summarized in section 4.9.1.
Throughout the study, control of the probe temperature is proposed due to its cor-
relation with defect formation and probe fracture. Section 4.9.2 discusses why the
probe temperature is controlled instead of shoulder ID or OD temperatures, and

50
parameters that can affect the size of the process window for the probe tempera-
ture.
4.9.1 Summary of development stages
Table 4-2 includes the results from the different stages of the development de-
scribed in this chapter; the TWI lid with constant input parameters, the full size
canister using the initial control method (axial force), the demonstration series,
verification welds with the convex scroll shoulder (see section B 3.3) and opti-
mized input parameters, and the controllers.
It should be noted that the data in Table 4-2 is from the 360º joint line sequence
for all weld cycles, except for the TWI welds that started at the joint line at a probe
temperature of 400ºC. Therefore, the data used is after the welds had reached the
set welding speed, which was achieved after 14º for both weld cycles, which
means that only 71 and 211º of joint line sequence were used for the first and se-
cond weld cycle, respectively.
Table 4-2. Deviation from the desired probe temperature during the development.
Name of series Cycles Tavg-Tr σavg Tmin-Tr Tmax-Tr
TWI lid weld 2 +32 37.9 -68 +85
Full size canister welds 2 +9 11.3 -25 +47
Demonstration series 20 +4 6.4 -52 +49
Convex verification welds 2 +4 4.2 -11 +18
Initial controller 1 +3 4.3 -23 +19
Final controller 8 +0.6 1.4 -7 +8
It can be seen that all development stages has led to lower standard deviation aver-
age (σavg) except the initial controller, and that the largest error has been reduced
from 85ºC for the TWI lid weld to 8ºC during the controller series.
4.9.2 Process window and desired probe temperature
In [G], it was proposed that the controller should use the fastest responding tool
temperature measurement, the shoulder ID. However, since the probe temperature
measurement, to current knowledge, has the best correlation with regards to probe
life, it was decided to let the controller use this signal rather than the less delayed
ones. In addition, the response time is not as critical for this process when using a
cascade controller.
Further studies (in their infancy) also show that the probe temperature might have
better correlation than the shoulder temperatures with wormhole formation, see

51
Figure 4-21. These results are counterintuitive to the thesis‘ author since the
shoulder ID measurement location is closer to where the wormholes are formed. In
Figure 4-21, the minimum temperatures from 28 welds in 3 different lids are pre-
sented, where a data point around the y-axis value of 1 or 0 means that the weld
was defect-free or that a wormhole was found, respectively. It can be seen that the
shoulder ID and OD temperatures have plenty of overlap between defect-free and
defected welds, while for the probe temperature only a defect-free weld produced
at 785ºC is an outlier. Reasons for the probe temperature having better correlation
with wormhole formation could be the fact that the probe temperature reading is
less influenced by tool depth and the amount of heat generated by the shoulder.
Figure 4-21. Defect-free (1) and defected (0) welds versus temperature readings.
In addition to this, it has been found that the repeatability of the three temperature
measurements, between weld cycles, is not adequate, see Figure 4-22. It can be
seen that the difference in shoulder ID and OD temperatures with similar probe
temperature during 3 weld cycles produced in 3 different lids can be as much as
±50ºC. The consequence of using the shoulder ID reading for control could thus be
that the resulting probe temperature may vary by up to 50ºC from weld cycle to
weld cycle. For these two reasons, the shoulder ID and OD measurements will
instead be used as back-up signals only, and a future controller should be able to
switch over to these readings if necessary. The reason for the unrepeatable nature
of the relative tool temperatures is not completely understood, but a possible rea-
son is the fact that the shoulder temperatures are more sensitive to different tool
depths and the resulting difference in relative heat generation between the probe
and the shoulder. The use of the shoulder temperatures as back-up signals for the
controller will therefore not be used with preset desired values, but with a desired

52
value derived from the weld cycle where the probe temperature reading is lost or
malfunctioning.
Another observation regarding relative temperature readings is the fact that the
probe temperature drops by 15-25ºC from its desired value during the downward
sequence, see for example Figure 4-22 where the downward sequence starts and
ends at y-axis values of 0 and 119 seconds, respectively. To minimize this devia-
tion, the desired value could be changed during the downward sequence in a simi-
lar manner to the parking sequence based on experience (i.e. feed-forward). How-
ever, since both the shoulder ID and OD temperatures are closer to their respective
steady-state values achieved during the joint line sequence, the risk of wormhole
forming should be minimal.
Figure 4-22. Difference in shoulder ID and OD temperatures with similar probe
temperature during 3 weld cycles produced in 3 different lids.

53
5 Conclusions
The results presented in this thesis have shown that the main objective, to develop
a welding procedure that repeatedly and reliably produces defect-free canisters,
was achieved. A cascade controller only adjusting one input parameter can control
the probe temperature within approximately ±10ºC to be compared with a process
window of approximately ±60ºC.
5.1 Main contributions
Although the studies have focused on a specific FSW application, most contribu-
tions are generic to other FSW implementations in industry. The contributions
derived in this study include, but are not limited to:
1. Redesign of joint geometry and location to be ―FSW friendly‖. In this ap-
plication, excessive flash on the tube side was reduced by moving the joint
to a more symmetric location. In addition, the new joint location results in
a 35% shorter downward sequence.
2. Relocation of the start position, if possible, to a fail-safe location. If the pi-
lot hole drilling or welding procedures fail above the joint line, the proce-
dures can be aborted without rejecting the canister. Another weld can then
be made in a new pilot hole, or the tube and lid can be separated without
having to cut and scrap the canister. Starting the weld above the joint line
also reduces the risk of defect formation at the joint line.
3. Pilot hole shape and size to minimize stress on the tool during the plunge
sequence. In addition, the volume of the pilot hole was reduced to be able
to dwell for a longer time (to reach temperature suited for FSW) without
risk of excessive tool depth.
4. Argon shielding gas having other benefits than limiting oxide formation.
By using argon, almost no shoulder wear was observed resulting in more
constant tool depth throughout the weld cycle. The use of argon also leads
to less fluctuation in the spindle torque, possibly due to material having
uniform properties in contact with the tool, hence a more stable process to
control.
5. Tool rotation rate was found to be the most important input parameter to
adjust to control probe temperature, while welding speed and axial force
changes can lead to discontinuities forming.
6. Excellent correlation between power input and probe temperature. The re-
lationship makes it possible to use a cascade controller to suppress power
input disturbances that directly will affect the temperature. The lower cor-

54
relation between heat input and probe temperature also validates the
choice to not use welding speed adjustments to control tool temperature.
7. Convex scroll shoulder results in better process stability due to the self-
stabilizing effect when used in force-controlled mode. It can also be used
with less (or zero) tool angle compared to the concave shoulder that needs
a tool angle around 3º, which is an advantage during the downward and
parking sequences when the tool is not moved in a direction along the tool
angle.
8. Excellent correlation between probe temperature and wormhole formation.
By using constant welding speed and axial force, the process window for
the probe temperature can be well-defined, which could reduce the need of
non-destructive testing.
9. Increased safety factor against probe fractures by use of a surface treat-
ment on the probe. As a result of the surface treatment, less cracks were
formed on the probe and there were no probe material containments ob-
served in the weld zone. The risk of cracks forming and probe fractures
were also reduced by eliminating the weakest point on the probe, the MX
features 20-25 mm down from the shoulder. As a result, probes withstood
four full weld cycles without fracture.
10. Surface treatment of the shoulder changed the relative heat generation be-
tween probe and shoulder and therefore the thermal gradients leading to
probe fracture at probe temperature in the middle of the process window.
While detrimental to this application, surface treatment of the shoulder
could be beneficial for other FSW applications such as titanium alloys
where heat generation by the shoulder should be minimized.
11. Redundant tool temperature measurements for production. The two shoul-
der temperature measurements could possibly be used as back-up signals
for the controller if the probe temperature measurement is lost.
12. Implementation of a cascade controller, designed differently depending on
weld sequence, for example only the inner cascade loop active during the
dwell and start sequences. The control strategies take all specific proper-
ties of each weld sequence into consideration. This has, together with a
control design method optimized for disturbance rejection, made the pro-
cess much more repeatable and reliable throughout the weld cycle.
13. Welds starting in an exit hole. The controller has shown promising results
for handling these welds, which could occur if a weld cycle has to be
aborted during the joint line sequence. To further reduce the risk of defect
formation, larger probe diameter should be used.
55
5.2 Suggestions for future work
This thesis presents the current state of the welding procedure to seal 50 mm thick
copper canisters. Although the most important issues for implementation are re-
solved, there are still areas for improvements before production. The improve-
ments are mostly related to the controller since it was recently developed, but also
discusses axial force adjustments, a more well-defined process window, modified
tool rotation direction and the tool depth measurement.
1. The controller could be improved by a linearly increasing desired tem-
perature during the dwell and start sequences, similar to the ―start in an
exit hole‖-approach presented in section 4.7.7. An advantage would be a
process not as dependent on repeatable power input between weld cycles
resulting in an even more repeatable temperature curve.
The functionality of the controller will also be improved by adding the
possibility for the controller to use shoulder ID or OD signals as back-up
for control, if deemed feasible during tests.
Another important development will be to monitor the controller. Since
the controller will be functional for a long time with various process varia-
tions like spindle wear and different material properties of components, it
is necessary to have offline analysis routines for evaluation of the control-
ler performance after each weld. If the controller starts behaving worse, it
should be retuned or examined completely.
2. In this specific application, where repeatable weld cycles are produced and
the circumferential object results in non-uniform thermal boundary condi-
tions, it could be advisable to moderately adjust the axial force using feed-
forward (i.e. open-loop) during the second half of the weld cycle to
achieve as constant tool depth as possible. The axial force is applied to
maintain a specific tool depth, and theoretically when the canister gets
hotter the axial force needs to be reduced to maintain constant tool depth.
3. Define the process window of the probe temperature more exactly. For
example, produce correlation of maximum wormhole size versus probe
temperature, see Figure 5-1, to be more independent on non-destructive
testing. Also the upper limit needs to be tested further and defined more
precisely, for example, the time the probe lasts at different temperatures.
The process window also needs to include the axial force if it will be ad-
justed according to the suggestion above.

56
Figure 5-1. Maximum detected discontinuity versus probe temperature.
4. Although it might be an advantage for the tube side to be the advancing
side to reduce risk of wormholes forming, it could be worth evaluating the
effect on the joint line hooking and root oxide formation when the tube
side is the retreating side.
5. To be able to use the tool depth for analysis, the eccentricity of the canis-
ter needs to be minimized and also repeatable between canisters. In addi-
tion, by comparing tool depth throughout weld cycles with the depth of the
shoulder footprint understanding of the thermal expansion of the canister
throughout the cycle can be derived.

57
6 Summaries of publications
This chapter gives a brief presentation of the publications. There are three append-
ed papers (A, B and C) appearing in chronological order. The appended publica-
tions have been reformatted for uniformity, but the contents are unchanged.
6.1 Paper A
Title: Reliability study of friction stir welded canisters containing Sweden’s nucle-
ar waste
Published in: Reliability Engineering and System Safety 93, 1491-1499, 2007.
Summary: The reliability study was performed in three steps: first an optimization
experiment to identify optimal process settings and establish the process window;
then a demonstration series with welding under production-like conditions; and
finally a post-demonstration series to evaluate an adjustment in the length of the
tool probe.
Three welding factors were selected for optimization by a Box-Behnken response
surface experiment. From initial range-finding experiments, these factors were set
to span an interval of 60-100 mm/min for the welding speed, 360-440 rpm for the
tool rotation rate, and 86-92 kN for the axial force. Sixteen experimental runs were
performed on two lids, with each run covering 45°. The desired values for tool
depth and probe temperature, 0.6 mm and 855°C, were chosen in the middle of the
process windows at that time.
The response surface experiment shows that the tool rotation rate is the most im-
portant factor, suitable for controlling the process. Welding speed was the next
most important welding factor. Its influence on the probe temperature was similar
to that of tool rotation rate. This factor should, however, be kept constant in order
not to increase the risk of defects. The variations in axial force seem to be of no
importance within the studied range, suggesting its use only as a secondary control
factor.
A suitable operating setting entails a compromise between the two optimization
criteria (desired values for tool depth and probe temperature). Considering the
response surface experiment, the optimal values for the welding factors were
found to be a welding speed of 74.3 mm/min, a tool rotation rate of 410 rpm, and
an axial force of 87 kN. According to the response surface models, this process
setting will result in a tool depth of 0.96 (±0.36) mm and a probe temperature of
824 (±45)°C (standard errors within parentheses).
Twenty full weld cycles were performed in the demonstration series. All welds
were carried out at a constant welding speed of 74.3 mm/min, while tool rotation
rate and axial force were adjustable factors kept at fairly constant conditions

58
(400±40 rpm and 89±5 kN, respectively). The maximum joint line hooking (JLH)
in each weld cycle varied between 3.0 and 4.5 mm due to a longer probe than nec-
essary.
A post-demonstration series was therefore performed based on the current status of
the FSW process, using an optimized (shorter) probe length. In this series, 20 addi-
tional runs were performed in shorter segments (30°, but still including the overlap
sequence where JLH often has a maximum) on two lids, and the occurrence of
JLH discontinuities was evaluated by NDT and destructive testing. The destructive
testing showed that these maximum JLH values vary between 0.4 and 1.45 mm.
The actual JLH values from the destructive tests were used for modeling the future
production quality of the sealing welds.
The 95% confidence interval for the maximum discontinuity in a production series
of 4500 canisters was estimated at 4.5-7.7 mm based on the demonstration series.
The best estimate from the post-demonstration series suggests that the maximum
size of a discontinuity will not exceed 2.3 mm.
6.2 Paper B
Title: Improved process stability during friction stir welding of 5 cm thick copper
canisters through shoulder geometry and parameter studies.
Published in: Science and Technology in Welding and Joining 46(2), 178-184,
2009.
Summary: The stability and robustness of the welding procedure was optimized in
three steps: first the shoulder geometry was identified that produced the most sta-
ble weld cycle, then the welding parameters were optimized for that geometry with
regards to stability, and finally the chosen geometry and welding parameters were
verified and evaluated during multiple full weld cycles.
The concave shoulder used at the time results (in force-controlled mode) theoreti-
cally in an unstable process, if an adaptive procedure is not used. In contrast, the
geometry of the convex scroll shoulder works (in force-controlled mode) to pro-
duce a stable process in theory. Five shoulder geometries were tested and the three
criteria for evaluation of the shoulders were; range of probe temperature (hence
process stability), amount of flash produced, and weld quality (i.e. if defects were
produced). The most suitable shoulder geometry, with regards to the evaluation
criteria chosen, of the five tested was clearly the ø70mm convex shoulder since it
was the best shoulder geometry in all three criteria. In addition, the early experi-
ence with the convex scroll shoulder shows no risk of excessive tool depth com-
pared to the concave shoulder which did have excessive tool depth occasionally
during its early use. The reduced risk of excessive tool depth also results in the
benefit of minimal flash generation.
The probe temperature measurements are subject to time lag, due to thermal mass
59
in the system and low thermal conductivity in the tool probe material, making it
difficult to attempt to control the process by using only the probe temperature it-
self. It may be possible to use variations in power input to predict changes in
probe temperature, thereby providing an indirect method of control. Fifteen short
weld cycles were produced in a 3-factor 3-level factorial response surface experi-
ment. The factors were, as commonly used during FSW studies, tool rotation rate,
axial force and welding speed. The results showed that the power input correlate
better with probe temperature than the heat input, which might be counterintuitive
to some welding researchers.
Two full-circumferential verification weld cycles show that the stability has been
improved by using the convex scroll shoulder and the new stable parameter set-
tings. During the joint line sequence the probe temperature only ranged from 842
to 868ºC for the first cycle and from 839 to 861ºC for the second cycle, which is a
narrower range than all 20 cycles in the demonstration series.
6.3 Paper C
Title: Cascade control of the friction stir welding process during sealing of canis-
ters for spent nuclear fuel
Published in: In review for Control Engineering Practice, 2011.
Summary: The paper includes a detailed presentation of the strategies planned for
controlling the FSW process to seal 6,000 copper canisters.
The disturbances acting on the FSW process can be divided into temperature and
torque disturbances. The temperature disturbances originate from preheated areas
and varying heat conduction during the weld cycle, while the torque disturbances
are mainly a result of changing material characteristics around the tool. The tem-
perature disturbances are difficult to control because they are only visible in the
slower reacting temperature signals. The torque variations, on the other hand, can
be efficiently rejected through power input control.
There are three control objectives set on the process. The main goal is to keep the
probe temperature inside the process window of 790-910°C. To accomplish this,
the controllers need to suppress the process disturbances efficiently and be able to
handle changes in the desired probe temperature fast enough.
It is proposed that a cascade controller is well suited for the FSW process with its
fast, multiplicative, torque disturbances and slower temperature counterparts. A
single loop temperature controller and the cascade controller, tuned with equiva-
lent constraints, have been compared on the FSW process. It is clear from these
tests that while the single loop controller struggles to meet the objectives, the cas-
cade controller fulfills them by a broad margin.

60
The two individual controllers in the cascade structure are PI controllers, tuned
with a recently developed method for design of robust PID controllers. The main
idea of the method is to minimize the impact disturbances have on the process
output at the same time as it makes sure that the resulting closed loop system is
both robust and insensitive to measurement noise. The tuning method requires
linear models of the process, which are derived by step response tests. The full
design procedure, which should ideally be easy to carry out, has been thoroughly
described within the paper.
The controller performance has been evaluated through both start-up tests and full
circumferential welds. The start-up tests cover the important first three weld se-
quences which are the most difficult to control.
Results from both the controller tuning procedure and closed loop performance
tests are presented. The models have been updated since previous articles and are
more accurate. Tests have shown that the process dynamics vary slightly depend-
ing on both if the temperature rises or sinks, as well as on the torque level. The PI
controllers derived are, however, robust enough to handle this variation. Further-
more, the controller structure and constants are set differently depending on weld
sequence as the process disturbances vary greatly between these. The performance
tests show that the probe temperature can be reliably and repeatedly kept within
±10°C throughout full (360º) joint line sequences. This is more than enough to
meet the controller objectives, which shows that the given cascade controller, with
two individual PI controllers, is sufficient.
It is the belief of the authors that the cascade controller can be of great use in sev-
eral other FSW applications too. Mainly when there are changing thermal bounda-
ry conditions, relatively long response time in the temperature reading and when
the process window is relatively narrow.
6.4 Paper D
Title: FSW to seal 50 mm thick copper canisters - a weld that lasts for 100,000
years
Published in: Proceedings of 5th International Symposium on Friction Stir Weld-
ing, 2004.
Summary: Excessive flash was formed on the tube side (advancing side) during
initial tests at SKB, probably caused by thermal expansion of a hotter tube than
lid. The reason why the lid is colder than the tube is due to the larger mass of cop-
per in the lid and the cooling effect of the lid clamping unit. The problem was
solved by redesigning the joint; moving it up in the lid to a more symmetric loca-
tion and adding a male-female rabbet. The new joint line location higher up in the
lid is also beneficial for the ultrasonic testing since its sensor gets closer to the
weld zone.

61
The start location was moved 75 mm above the joint line to not have pilot hole or
start defects at the joint line. As a result, only steady-state welding conditions can
be produced at the joint line and the start sequence can also be aborted if it does
not converge towards a stable process. A new weld can be made in a new pilot
hole without rejecting the canister.
A probe-shaped pilot hole was developed instead of the previous cylindrical hole
to avoid unnecessary stress on the probe during the plunge.
The weld cycle can be divided into five distinct regions, with different properties,
when welding full circumferential copper canisters; plunge-and-dwell, start, down-
travel, steady-state and overlap-and-park, which are all described in the paper.
Due to the importance of the welding temperature, an alternative method for
measuring the temperature with an infra-red camera was evaluated. It was only
used to measure the temperature of the tool shoulder, but the camera also has the
facility to measure the temperature of the copper in front of the shoulder.
While the welds were not made in an automated mode, it was shown that defect-
free welds could be produced repeatedly through use of manual changes in the
axial force, with a relatively large tolerance. An important milestone was achieved
in May 2004 when a complete full size canister with a cast iron insert was sealed.
No defects (except up to 3 mm joint line hooking) were found in the bottom nor
inside the 50 mm corrosion barrier in the lid weld.
Early tests on defect repair capability showed that a machined defect (32 x 2 mm)
at the joint line was completely repaired.
6.5 Paper E
Title: FSW to manufacture and seal 5 cm thick copper canisters for Sweden’s nu-
clear waste
Published in: Proceedings of 6th International Symposium on Friction Stir Weld-
ing, 2006.
Summary: In January 2005 a production-like series of 20 lid welds was completed.
No discontinuities were found except joint line hooking, which usually had its
maximum value at the overlap and the maximum value varied from 2-4.5 mm for
the 20 welds. After the series, the development program has focused on these de-
fects and they have been reduced to a maximum size between 1-2 mm by shorten-
ing the tool probe and/or using a mirror-image tool probe.
A screening Design of Experiments was used to determine suitable range settings
for the process parameters and a response surface experiment according to Box-
Behnken was conducted to determine optimal process settings. In addition to this,
a process window was defined. The results from the response surface experiment
showed that the tool rotation rate had the largest effect on both the tool tempera-

62
ture and the tool depth. Control of the process by means of the tool rotation rate
proved to be more effective than when the axial force was used.
Proposed in future work that spindle torque and/or infra-red camera could be ways
to react faster to process changes than by using the probe temperature signal. Also
proposed in future work that the convex scroll shoulder could maintain a more
constant heat input (than the concave shoulder) in force controlled welding mode.
In addition, the convex scroll shoulder could be used with less tool angle possibly
resulting in less flash formation and more stable downward and parking sequences
(since the tool angle is not tilted in the direction of travel in those sequences).
6.6 Paper F
Title: Adaptive control of novel welding process to seal canisters containing Swe-
den’s nuclear waste using PID algorithms
Published in: Proceedings of the 18th International Conference on Flexible Auto-
mation and Intelligent Manufacturing, 2008.
Summary: A skilled welding operator is able to produce defect-free copper canis-
ter welds using manual adjustments in the tool rotation rate. The main objective of
the research program is, however, to maximize the reliability in production by
further development of an automated welding procedure and, hence, eliminate the
human factor. The key parameter to control is the tool temperature. The current
process window is between 790 and 910°C. Below 790°C there is a risk of defects
being generated and above 910°C there is a risk of the tool probe fracturing, re-
sulting in a rejected canister. As a result, the target tool temperature is around
850°C.
Several previous design-of-experiment trials have been made to study the relation-
ships between the welding parameters. Due to the nature of the relationships
found, a cascaded PID-control algorithm (incremental control of probe tempera-
ture and power input) seems to be a possible aid to control the desired welding
parameters. Due to the relatively long lag time for the probe temperature and no
lag between tool rotation rate and power input, the cascade controller should result
in a more stable probe temperature than temperature control alone. The proposed
cascade controller is presented in the equation below.
dt
dPkPPk
dt
dTkTTk
rr
5421
The constants k1 and k2 determine the behaviour of the temperature loop while k4
and k5 set the properties of the power control loop.
To test the potential of the PID control algorithms before modifying the existing
software, data from short weld cycles were modified using the equation above and
a preliminary relationship between the power input and tool temperature found

63
during the design-of-experiment trials.
6.7 Paper G
Title: Faster temperature response and repeatable power input to aid automatic
control of friction stir welded copper canisters
Published in: Proceedings of Friction Stir Welding and Processing V, 2009.
Summary: The thermal boundary conditions change throughout the weld cycle to
seal copper canisters resulting in variable power input requirement to keep the tool
temperature within the process window. The variable power input requirement
together with the lag time of approximately 20 seconds in the probe temperature
reading results in problems when trying to adaptively control the probe tempera-
ture using software. By adding new thermocouples in the shoulder, the lag time in
the temperature responding to power input changes were reduced to approximately
10 seconds. The fastest responding shoulder thermocouple is close to where
wormhole defects are produced at low temperatures, which could make the value
correlate better with weld quality than the probe temperature value currently used
to define the process window.
By using the faster responding thermocouple reading and the known power input
requirement, a more accurate and reliable closed-loop control of the probe temper-
ature using software can be developed. In addition to the required power input
being repeatable between weld cycles, it appears that the tool rotation rate changes
during the downward sequence have enough repeatability between weld cycles to
be able to aid the controller. A linear relationship between the probe temperature
and the power input also indicates that the power input requirement is repeatable
between weld cycles.
The planned controller using both feed-forward and cascade is presented below.
r
shoulderID
rprobedfeedforwarPPk
dt
dTkTTk
321
It is most probable that the constants will be varied depending on sequence, for
example faster update rate during the downward sequence when the process is
more transient.
64
6.8 Paper H
Title: Reliable FSW of copper canisters using improved process and controller
controlling power input and tool temperature
Published in: Proceedings of 8th International Symposium on Friction Stir Weld-
ing, 2010.
Summary: It is shown that the required power input to keep the probe temperature
at 850ºC can vary at least as much as 3 kW between weld cycles. By using a cas-
caded loop that determines the power input requirement, the controller will not be
dependent on repeatability in the required power input between weld cycles, and
the dead time in the probe temperature measurement will not be critical. A cascad-
ed controller with an inner and an outer loop seems ideal to control the process
with fast and non-linear power input disturbances and relatively slow tool tem-
perature changes. The inner loop is tuned for fast suppression of power input dis-
turbances while the outer loop can adapt itself to the slower changes in tempera-
ture. Due to the rather simple dynamics of the process, the inner and outer loop
controllers have been chosen to be PI controllers.
A surface-treatment (CrN) of the probe has successfully been implemented to re-
duce cracks forming during welding. Still, if cracks are produced or if the probe
fractures during maximum temperature tests, the cracks are located or the fractures
orginate in the MX features 22-25 mm down from the shoulder. As a result, to
prevent cracks forming and increasing the probe life (i.e. safety factor against frac-
ture since the probe only will be used for one cycle) the MX features were reduced
to only extend 17 mm down from the shoulder.
One issue during full circumferential welds is the fact that the flash produced by
the tool increases significantly during the last part of the cycle. Reasons are
thought to be increased temperature of the lid and canister as the tool moves
around the circumference and/or shoulder wear that reduces the inwards metal
transport by the scrolls.
To investigate the effects of less shoulder wear, welding trials with surface-treated
shoulders or argon gas were performed. The AlTiN-treated shoulder did result in
no shoulder wear and constant flash throughout the cycle, however the AlTiN-
treated shoulder resulted in much lower temperatures in the shoulder relative to the
probe temperature. The reason for this may be that the surface-treatment reduces
the frictional heat generated by the shoulder and, as a result, the probe has to pro-
vide a larger part of the heat generation, resulting in higher torque and more stress
on the probe. In fact, two of the probes failed, and one of the failures occurred at a
probe temperature of 854ºC, close to the middle of the process window.
Similarly to the surface-treated shoulder, the argon gas results in no shoulder wear
and constant (and minimal) flash throughout the cycle. It could also be noted when
welding in argon that the process was very stable and no tool rotation rate changes

65
were necessary for more than one-third of the joint line sequence. In conclusion,
reasons for using argon gas are both to achieve a weld zone without oxide and that
a more stable process can be achieved, partly thanks to less wear of the shoulder.
6.9 Paper I
Title: Cascaded control of power input and welding temperature during sealing of
spent nuclear fuel canisters
Published in: Proceedings of 3rd annual ASME Dynamic Systems and Control
Conference, 2010.
Summary: It was concluded that the controller should control probe temperature,
instead of Shoulder ID temperature, because it was deemed more closely related to
the important probe fractures. It was also concluded that the deviation between the
different temperature measurement signals vary between welds.
The use of step response tests to derive linear models of the process between con-
trol signal (tool rotation rate) and power input as well as between power input and
probe temperature were presented. The models could then be used for controller
design.
The controller design method developed by Garpinger was used, which provides
controllers having optimal performance with respect to certain stability margins
and limits on the control signal variation due to measurement noise. Thus, giving a
more scientific aspect on controller parameter selection.
A procedure for tuning the controllers is presented. These will most likely need to
be retuned several times during more than 40 years of production.
Initial promising results of the new cascade structure giving a mean value of 0.6ºC
above desired probe temperature and standard deviation of 1.6ºC, during the joint
line sequence.
6.10 Paper J
Title: Reliable sealing of copper canisters through cascaded control of power
input and probe temperature
Published in: Proceedings of Friction Stir Welding and Processing VI, 2011.
Summary: The cascade controller is compared to a pure temperature controller.
Both controllers are tuned to have the same margins to stability. Experiments show
that the temperature controller takes too long to react on power input disturbances
(due to the response time between power and temperature), which makes the cas-
cade controller performance superior.
The controller is able to produce repeatable welds during all 5 weld sequences.
Four circumferential welds show vast improvement in performance compared to

66
the 20 welds in the demonstration series. Improved process knowledge and differ-
ent controller strategies in all 5 sequences, adapting to each sequence's special
properties, is what makes the difference.
Spindle torque disturbances show that the inner controller can handle these fast
enough such that the different temperature measurements are hardly even affected.
The results show that cascaded PI control is enough to keep the process well with-
in the process window.
A probe life test was produced by using the same probe during 4 circumferential
welds. The probe withstood all 4, 45 minutes long, weld cycles including a peak
probe temperature of 890ºC. The probe did, however, have cracks along the MX
features and was not tested further than the 4 cycles.

67
7 Acronyms
AMIGO Approximate M-constrained Integral Gain Optimization
DOE Design of experiment
FSW Friction stir welding
JLH Joint line hooking
NDT Non destructive testing
PID Proportional-Integral-Derivative
SKB Swedish Nuclear Fuel and Waste Management Company
TRA Transient Response Analysis
TWI The Welding Institute


69
8 References
It should be noted that when the publications lettered A-J (see Publications) are
referenced, it is done by [A] etc.
1. SKB. Encapsulation – When, where, how and why? SKB information
book, 2008.
2. Andrews R.E. Friction stir welding - an alternative method for sealing nu-
clear waste storage canisters. SKB technical report TR-04-16, 2004.
3. SKB. Design, production and initial state of the canister. SKB technical
report TR-10-14, 2010.
4. Gubner R, Andersson U, Linder M, Nazarov A, Taxén C. Grain boundary
corrosion of copper canister weld material. SKB technical report TR-06-
01, 2006.
5. Gubner R, Andersson U. Corrosion resistance of copper canister weld ma-
terial. SKB technical report TR-07-07, 2007.
6. Garpinger O. Design of Robust PID Controllers with Constrained Control
Signal Activity. Licentiate Thesis LUTFD2/TFRT--3245--SE, Department
of Automatic Control, Lund University, Sweden, 2009.
7. Källgren T. Investigation and modelling of friction stir welded copper can-
isters. Doctoral Thesis KTH/MSE--10/04-SE, Department of Materials
Science and Engineering, Royal Institute of Technology, Stockholm,
Sweden, 2010.
8. Thomas W M, Nicholas E D, Needham J C, Murch M G, Temple-Smith P,
Dawes C J. Friction stir butt welding. International Patent Application No.
PCT/GB92/02203, 1992.
9. MTS Systems Corporation. Friction stir welding - Process background
(Electronic), 2004. http://www.mts.com/
10. Cederqvist L. Properties of friction stir welded aluminum lap joints. Mas-
ter of Science Thesis, Department of Mechanical Engineering, University
of South Carolina, Columbia, USA, 2001.
11. Lohwasser D, Chen Z. Friction stir welding – From basics to applications.
Woodhead Publishing Limited, United Kingdom, pp. 118-163, 2010.
12. Tonogi T, Tong C, Ono S, Okano M. Application of friction stir welding
to copper backing plate. Journal of Japan Research Institute for Advanced
Copper-Base Materials and Technologies, 41, 310-314, 2002.

70
13. Boldsaikhan E. The use of feedback forces for non-destructive evaluation
of friction stir welding. Doctoral Thesis, Department of Materials Engi-
neering and Science, South Dakota School of Mines and Technology,
Rapid City, USA, 2008.
14. Boldsaikhan E, Bharat J, Logar A, Corwin E, Janes M, Arbegast W. A
phase space approach to detecting volumetric defects in friction stir weld-
ing. Proceedings of 8th International Friction Stir Welding Symposium,
Timmendorfer Strand, Germany, 2010.
15. Jene T, Dobmann G, Wagner G, Eifler D. MonStir – Monitoring of the
friction stir welding process. Proceedings of 7th International Friction Stir
Welding Symposium, Awaji Island, Japan, 2008.
16. Russell M. FSW – Process enhancements. Proceedings of 8th International
Friction Stir Welding Symposium, Timmendorfer Strand, Germany, 2010.
17. Fairchild D, Kumar A, Ford S, Nissley N, Ayer R, Jin H, Ozekcin A. Re-
search concerning the friction stir welding of linepipe steels. Proceedings
of 8th International Conference on Trends in Welding Research, Pine
Mountain, USA, 2009.
18. Miyazawa T, Iwamoto Y, Maruko T, Fujii H. Development of Ir based
tool for friction stir welding of high temperature materials. Science and
Technology in Welding and Joining, 16(2), 188-192, 2011.
19. Bernath J, Thompson B, Stotler T. FSW of titanium and steel structures.
Proceedings of 8th International Friction Stir Welding Symposium, Tim-
mendorfer Strand, Germany, 2010.
20. Ross K, Sorensen C. Reducing tool axial stresses in HSLA-65 during the
plunge. Proceedings of Friction stir welding and processing V, San Fran-
cisco, USA, 2009.
21. Upadhyay P, Reynolds A P. Effects of thermal boundary conditions in
friction stir welded AA7050-T7 sheets. Materials Science and Engineering
A, 527(6), 1537-1543, 2010.
22. Leal R M, Sakharova N, Vilaca P, Rodrigues D M, Loureiro A. Effect of
shoulder cavity and welding parameters on friction stir welding of thin
copper sheets. Science and Technology in Welding and Joining, 16(2),
146-152, 2011.
23. Savolainen K, Mononen J, Saukkonen T, Hänninen H, Koivula J. Friction
stir weldability of copper alloys. Proceedings of 5th International Friction
Stir Welding Symposium, Metz, France, 2004.

71
24. Mahoney M. Flow and temperature response during FSP of high tempera-
ture alloys. Proceedings of MegaStir Friction Stir Welding Workshop,
Provo, USA, 2003.
25. Savolainen K, Saukkonen T, Mononen J, Hänninen H. Entrapped oxide
particles in friction stir welds of copper. Proceedings of 7th International
Friction Stir Welding Symposium, Awaji Island, Japan, 2008.
26. Nelson T W, Sorensen C D, Mayfield D. Friction stir welds of HSLA steel
panels for shipyard applications. Proceedings of 8th International Friction
Stir Welding Symposium, Timmendorfer Strand, Germany, 2010.
27. Hassan K A A, Prangnell P B, Norman A F, Price D A, Williams S W. Ef-
fect of welding parameters on nugget zone microstructure and properties
in high strength aluminium alloy friction stir welds. Science and Technol-
ogy in Welding and Joining, 8(4) 257–268, 2003.
28. Sato YS, Urata M, Kokawa H. Parameters controlling microstructure and
hardness during friction-stir welding of precipitation-hardenable alumi-
num alloy 6063. Metall Mater Trans A – Phys Metall Mater Sci
2002;33(3):625–635.
29. Xie G M, Ma Z Y, Geng L. Development of a fine-grained microstructure
and the properties of a nugget zone in friction stir welded pure copper.
Scripta Materialia, 57(2) 73-76, 2007.
30. Long T, Reynolds AP. Parametric studies of friction stir welding by com-
mercial fluid dynamics simulation. Science and Technology in Welding
and Joining, 11(2) 200–208, 2006.
31. Reynolds A P, Tang W, Khandkar Z, Khan J A, Lindner K. Relationships
between weld parameters, hardness distribution and temperature history in
alloy 7050 friction stir welds. Science and Technology in Welding and
Joining, 10(2) 190–199, 2005.
32. Record J H. Statistical investigation of friction stir processing parameter
relationships. Master of Science Thesis, Brigham Young University, Pro-
vo, USA, 2005.
33. Sorensen C D, Nielsen B. Convex Scrolled Shoulder, Step Spiral Probe
FSW Tools. Proceedings of Friction Stir Welding and Processing V, San
Francisco, USA, 2009.
34. Colligan K J, Pickens J R. Friction Stir Welding of Aluminum Using a
Tapered Shoulder Tool. Proceedings of Friction Stir Welding and Pro-
cessing III, San Francisco, USA, 2005.

72
35. Cederqvist L, Andrews R E. A weld that lasts for 100,000 years: FSW of
Copper Canisters. Proceedings of 4th International Symposium on Friction
Stir Welding, Park City, USA, 2003.
36. Åström K J, Hägglund T. Advanced PID Control. ISA - The Instrumenta-
tion, Systems, and Automation Society, Research Triangle Park, USA,
2005.
37. Årzén, K.-E. Real-Time Control Systems. Department of Automatic Con-
trol, Lund Institute of Technology, Lund, Sweden, 1996.
38. Åström K J, Murray R M. Feedback systems. Princeton University Press,
Princeton, USA, 2008.
39. Wallén, A. Tools for Autonomous Process Control. Doctoral thesis, De-
partment of Automatic Control, Lund Institute of Technology, Sweden,
2000.
40. Soron M. Robot system for flexible 3D friction stir welding. Doctoral
Thesis, Studies in Technology, Örebro University, Örebro, Sweden, 2007.
41. Longhurst W R, Strauss A M, Cook G E, Fleming P A. Torque control of
friction stir welding and manufacturing and automation. International
Journal of Advanced Manufacturing Technology, 51(9) 905-913, 2010.
42. Fehrenbacher A, Pfefferkorn F E, Zinn M R, Ferrier N J, Duffie N A.
Closed-loop Control of Temperature in Friction Stir Welding. Proceedings
of 7th International Friction Stir Welding Symposium. Awaji Island, Japan,
2008.
43. Fehrenbacher A, Duffie N A, Ferrier N J, Zinn M R, Pfefferkorn F E.
Temperature measurement and closed-loop control in friction stir welding.
Proceedings of 8th International Friction Stir Welding Symposium. Tim-
mendorfer Strand, Germany, 2010.
44. Fehrenbacher A, Cole E G, Zinn M R, Ferrier N J, Duffie N A, Pfef-
ferkorn F E. Towards process control of friction stir welding for different
aluminum alloys. Proceedings of Friction Stir Welding and Processing VI,
San Diego, USA, 2011.
45. Mayfield D W, Sorensen, C D. An improved temperature control algo-
rithm for friction stir processing. Proceedings of 8th International Friction
Stir Welding Symposium. Timmendorfer Strand, Germany, 2010.
46. Ross K, Sorensen C. Investigation of methods to control friction stir weld
power with spindle speed changes. Proceedings of Friction Stir Welding
and Processing VI, San Diego, USA, 2011.

73
47. Mishra R S, Mahoney M W. Friction Stir Welding and Processing. ASM
International, Materials Park, USA, 2007.
48. Ronneteg U, Cederqvist L, Rydén H, Öberg T, Müller C. Reliability in
sealing of canisters for spent nuclear fuel. SKB report R-06-26, Sweden,
2006.
49. Ionbond Sweden AB. Ionbond Ticron® product sheet (Electronic).
http://www.ionbond.com/mm/Ionbond_TICRON_V03.pdf
50. Russell M J, Nunn M E, Addison A C. Recent developments in friction
stir welding of titanium alloys. Proceedings of 6th International Friction
Stir Welding Symposium, Saint-Sauveur, Canada, 2006.