Embed Size (px)
Citation preview
DOCTORA L T H E S I S
Department of Engineering Science and Mathematics,Division of Machine Elements Friction in Piston Ring
- Cylinder Liner Contacts
Markus Söderfjäll
ISSN 1402-1544ISBN 978-91-7583-824-3 (print)ISBN 978-91-7583-825-0 (pdf)
Luleå University of Technology
Markus Söderfjäll Friction in Piston R
ing - Cylinder Liner C
ontacts
Machine Elements

Friction in Piston Ring - Cylinder LinerContacts
Markus Söderfjäll
Luleå University of TechnologyDepartment of Engineering Science and Mathematics,
Division of Machine Elements
Cover figure: Piston, piston rings and cylinder liner.
Title page figure: Test equipment.
Friction in Piston Ring - Cylinder Liner Contacts
Copyright © Markus Söderfjäll (2017). This document is freely availableat
www.ltu.se
or by contacting Markus Söderfjäll,
This document may be freely distributed in its original form includingthe current author’s name. None of the content may be changed orexcluded without permissions from the author.
Printed by Luleå University of Technology, Graphic Production 2017
ISSN:ISBN: (print)ISBN: (pdf)
Luleå 2017
www.ltu.se
This document was typeset in LATEX 2ε
Printed by Luleå University of Technology, Graphic Production 2017
ISSN 1402-1544 ISBN 978-91-7583-824-3 (print)ISBN 978-91-7583-825-0 (pdf)
Luleå 2017
www.ltu.se
Acknowledgements
This work has been carried out at the Division of Machine Elements atLuleå University of Technology. I would like to thank my supervisorsAssociate Professor Andreas Almqvist and Professor Roland Larsson forvaluable discussions and guiding during the project.
I would like to thank Scania, AB Volvo, Energimyndigheten, and theEnergy Efficient Vehicle programme for funding this work.
I also want to thank my industry supervisors, Dr. Hubert Herbstand Dr. Andrew Spencer at Scania and also Dr. Robert Ohlsson andBengt Olsson at AB Volvo for their valuable input and discussions.
My former colleagues at Volvo Technology deserves gratitude, espe-cially Dr. Staffan Johansson for introducing me to the subject.
I also want to express my gratitude to my friends and colleagues atthe Division of Machine Elements for providing an enjoyable and verydeveloping work place. Especially Patrik Isaksson for sharing his wisdomand helping me with the modelling. And also Janne Granström for theexcellent work with the test rig software.
Markus Söderfjäll, Luleå, 2017
5

Abstract
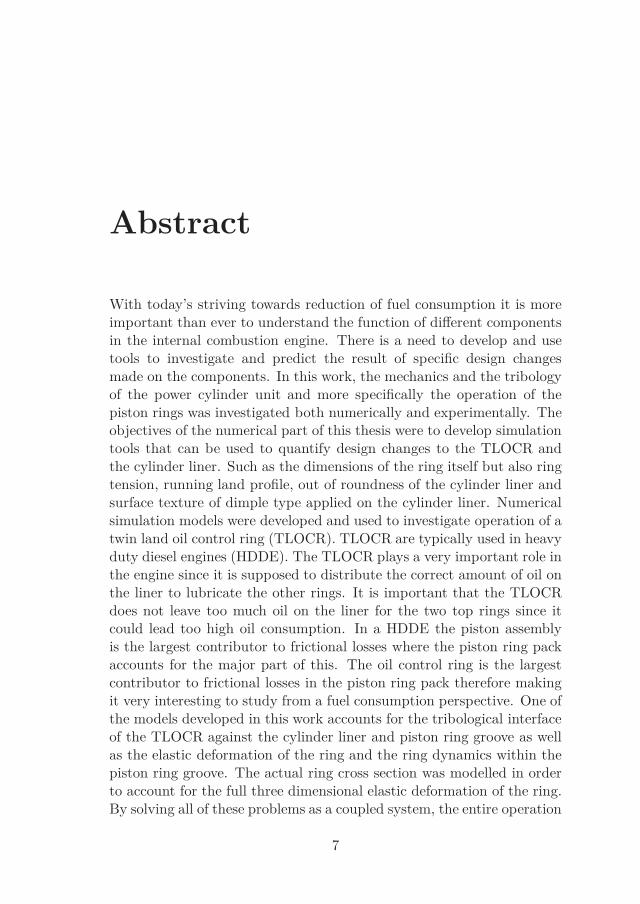
With today’s striving towards reduction of fuel consumption it is moreimportant than ever to understand the function of different componentsin the internal combustion engine. There is a need to develop and usetools to investigate and predict the result of specific design changesmade on the components. In this work, the mechanics and the tribologyof the power cylinder unit and more specifically the operation of thepiston rings was investigated both numerically and experimentally. Theobjectives of the numerical part of this thesis were to develop simulationtools that can be used to quantify design changes to the TLOCR andthe cylinder liner. Such as the dimensions of the ring itself but also ringtension, running land profile, out of roundness of the cylinder liner andsurface texture of dimple type applied on the cylinder liner. Numericalsimulation models were developed and used to investigate operation of atwin land oil control ring (TLOCR). TLOCR are typically used in heavyduty diesel engines (HDDE). The TLOCR plays a very important role inthe engine since it is supposed to distribute the correct amount of oil onthe liner to lubricate the other rings. It is important that the TLOCRdoes not leave too much oil on the liner for the two top rings since itcould lead too high oil consumption. In a HDDE the piston assemblyis the largest contributor to frictional losses where the piston ring packaccounts for the major part of this. The oil control ring is the largestcontributor to frictional losses in the piston ring pack therefore makingit very interesting to study from a fuel consumption perspective. One ofthe models developed in this work accounts for the tribological interfaceof the TLOCR against the cylinder liner and piston ring groove as wellas the elastic deformation of the ring and the ring dynamics within thepiston ring groove. The actual ring cross section was modelled in orderto account for the full three dimensional elastic deformation of the ring.By solving all of these problems as a coupled system, the entire operation
7
of the oil control ring can be understood in a better way than earlierand this opens up new optimisation possibilities for the TLOCR. Sincethe cylinder liner in an engine will always have some deviation fromperfectly round this is important. The full ring is modelled in order toaccount for out of round cylinder liners. The model can therefore beused to investigate the effect on oil distribution by reduced ring tensionwhich will affect the frictional losses of the system. It was found that thereduction in tangential force on the TLOCR with kept sealing capability,enabled by reduced out-of-roundness, could result in friction reductionof 40 % at mid-stroke.
Because of the complexity, a multi-physics model of this type in-troduces difficulties with convergence. Especially when implementinga mass conserving cavitation model and solving for the reversal of thepiston ring. Implementation and numerical verification of a mass con-serving cavitation model was therefore performed. A method for dealingwith the convergence problem close to reversal was implemented and dis-cussed.
A model considering texture, of dimple type, on the cylinder linerwas also developed to find dimple dimensions optimal for reduced fuelconsumption. Since the dimples are modelled in a deterministic manner,only a periodic section of one land of the TLOCR was considered. Themodel takes mixed lubrication and inertia of the ring into considerationand a mass conserving cavitation algorithm were implemented. Theresults from the model predict friction reduction of approximately 40 %at mid-stroke speeds.
The objective of the experimental part of this thesis is to developa novel test method for evaluation of piston ring friction at realisticspeeds. The test-rig was designed and constructed during the first halfof the project. The rig was designed so that standard HDDE productionpiston rings and cylinder liners could be easily mounted, and so thatpiston ring friction could be measured without influence from pistonfriction. Both cylinder liner and oil tank were equipped with heaters,where the oil supply resembles that in an actual engine. Repeatabilityof the results was found to be good. Influence on friction by differentcylinder liner surface roughness and coatings were investigated. Variouspiston ring designs, ring tension and coatings were also investigated. Itwas found that friction of the TLOCR could be reduced with close to50 % with kept sealing capability by reduced ring tension and differentgeometry on the lands in contact with the cylinder liner. The numerical

simulation model governing the full cross section of the TLOCR wasvalidated against measured piston ring friction data at a number ofdifferent speeds and excellent correlation was found.

Contents
I Comprehensive Summary 23
1 Introduction 25
1.1 Components in the PCU of a HDDE . . . . . . . . . . . . 25
1.2 Operation of the PCU . . . . . . . . . . . . . . . . . . . . 27
1.3 Friction losses in the PCU . . . . . . . . . . . . . . . . . . 29
1.4 Possibilities for friction reduction . . . . . . . . . . . . . . 29
1.5 Lubrication regimes . . . . . . . . . . . . . . . . . . . . . 30
1.6 Simulation of the piston ring contact . . . . . . . . . . . . 31
1.7 Simulation of out of round cylinder liners . . . . . . . . . 33
1.8 Textured cylinder liners . . . . . . . . . . . . . . . . . . . 35
1.9 Experimental methods . . . . . . . . . . . . . . . . . . . . 38
1.9.1 Component test-rig . . . . . . . . . . . . . . . . . . 38
1.9.2 Full engine test . . . . . . . . . . . . . . . . . . . . 39
1.10 Objectives . . . . . . . . . . . . . . . . . . . . . . . . . . . 41
1.10.1 Simulation tools . . . . . . . . . . . . . . . . . . . 42
1.10.2 Experimental test equipment . . . . . . . . . . . . 42
2 Method 45
2.1 Numerical simulation . . . . . . . . . . . . . . . . . . . . . 45
2.1.1 Twin land oil control ring geometry . . . . . . . . 45
2.1.2 Hydrodynamic lubrication . . . . . . . . . . . . . . 46
2.1.3 Hydrodynamic cavitation . . . . . . . . . . . . . . 48
2.1.4 Mixed lubrication . . . . . . . . . . . . . . . . . . 53
2.1.5 Friction . . . . . . . . . . . . . . . . . . . . . . . . 53
2.1.6 Forces acting on the ring . . . . . . . . . . . . . . 55
2.1.7 Lubricant properties . . . . . . . . . . . . . . . . . 57
2.1.8 Boundary conditions . . . . . . . . . . . . . . . . . 57
2.1.9 Textured cylinder liners . . . . . . . . . . . . . . . 58
11
2.2 Experimental test development . . . . . . . . . . . . . . . 59
3 Results 63
3.1 Numerical simulation results . . . . . . . . . . . . . . . . . 63
3.1.1 Model inputs for full cross section models . . . . . 63
3.1.2 Stationary results for out of round cylinder liner . 65
3.1.3 Implementation of cavitation and full engine cycles 67
3.1.4 Textured cylinder liners . . . . . . . . . . . . . . . 69
3.2 Experimental results . . . . . . . . . . . . . . . . . . . . . 76
4 Conclusions 83
5 Future work 87
II Appended Papers 89
A The effect of three-dimensional deformations 91
A.1 Introduction . . . . . . . . . . . . . . . . . . . . . . . . . . 94
A.2 The model . . . . . . . . . . . . . . . . . . . . . . . . . . . 95
A.2.1 Model inputs . . . . . . . . . . . . . . . . . . . . . 98
A.2.2 Simulated parameters . . . . . . . . . . . . . . . . 100
A.3 Results and discussion . . . . . . . . . . . . . . . . . . . . 101
A.4 Conclusions . . . . . . . . . . . . . . . . . . . . . . . . . . 106
B A model for twin land oil control rings 107
B.1 Introduction . . . . . . . . . . . . . . . . . . . . . . . . . . 110
B.2 Method . . . . . . . . . . . . . . . . . . . . . . . . . . . . 112
B.2.1 Finite element model . . . . . . . . . . . . . . . . . 113
B.2.2 Boundary conditions . . . . . . . . . . . . . . . . . 113
B.2.3 TLOCR against cylinder liner interface . . . . . . 115
B.2.4 Cavitation . . . . . . . . . . . . . . . . . . . . . . . 116
B.2.5 TLOCR against piston ring groove . . . . . . . . . 117
B.2.6 Friction . . . . . . . . . . . . . . . . . . . . . . . . 118
B.2.7 Scaling of boundary friction . . . . . . . . . . . . . 119
B.3 Results and discussion . . . . . . . . . . . . . . . . . . . . 119
B.3.1 Evaluation of cavitation model parameter effect . . 119
B.3.2 Evaluation of effect from scaling the boundary fric-tion . . . . . . . . . . . . . . . . . . . . . . . . . . 123
B.3.3 Friction prediction of model . . . . . . . . . . . . . 127
B.4 Conclusions . . . . . . . . . . . . . . . . . . . . . . . . . . 127
C Component test 131
C.1 Introduction . . . . . . . . . . . . . . . . . . . . . . . . . . 134C.2 Design of the test rig . . . . . . . . . . . . . . . . . . . . . 135
C.2.1 Base crank device . . . . . . . . . . . . . . . . . . 135C.2.2 HDDE piston ring holder . . . . . . . . . . . . . . 137C.2.3 Cylinder liner assembly . . . . . . . . . . . . . . . 138C.2.4 Measuring system . . . . . . . . . . . . . . . . . . 140
C.3 Experimental parameters . . . . . . . . . . . . . . . . . . 140C.4 Results and discussion . . . . . . . . . . . . . . . . . . . . 142
C.4.1 1200 RPM . . . . . . . . . . . . . . . . . . . . . . 142C.4.2 Varied speed . . . . . . . . . . . . . . . . . . . . . 148
C.5 Conclusions . . . . . . . . . . . . . . . . . . . . . . . . . . 149
D Texture induced effects causing reduction of friction 153
D.1 Introduction . . . . . . . . . . . . . . . . . . . . . . . . . . 156D.2 The model . . . . . . . . . . . . . . . . . . . . . . . . . . . 160
D.2.1 Simulated parameters . . . . . . . . . . . . . . . . 165D.3 Results and discussion . . . . . . . . . . . . . . . . . . . . 166D.4 Conclusions . . . . . . . . . . . . . . . . . . . . . . . . . . 177
E Experimental study on HDDE power cylinder unit 181
E.1 Introduction . . . . . . . . . . . . . . . . . . . . . . . . . . 184E.2 Method . . . . . . . . . . . . . . . . . . . . . . . . . . . . 187
E.2.1 Test equipment . . . . . . . . . . . . . . . . . . . . 187E.2.2 Component variation tests . . . . . . . . . . . . . . 188E.2.3 Stribeck curves . . . . . . . . . . . . . . . . . . . . 189E.2.4 Validation of simulation model . . . . . . . . . . . 194
E.3 Results and discussion . . . . . . . . . . . . . . . . . . . . 195E.3.1 Component variation tests . . . . . . . . . . . . . . 195E.3.2 Stribeck curves . . . . . . . . . . . . . . . . . . . . 198E.3.3 Validation of numerical model . . . . . . . . . . . . 205
E.4 Conclusions . . . . . . . . . . . . . . . . . . . . . . . . . . 208
References 211

Appended Papers
A M. Söderfjäll, P. Isaksson, A. Spencer, A. Almqvist and
R. Larsson.
"The effect of three-dimensional deformations of a cylin-
der liner on the tribological performance of a piston ring-
cylinder liner system."
Proceedings of the Institution of Mechanical Engineers,
Part J: Journal of Engineering Tribology, 2014 October;
vol. 228, Issue 10, p. 1080-1087.
The modelling and analysis was mainly performed by M. Söder-fjäll, the corresponding author, who also wrote the paper. P.Isaksson contributed with his expertise in multi-physics finite el-ement modelling. A. Spencer contributed with his knowledge inpiston ring simulation. A. Almqvist and R. Larsson were involvedin the discussion of the method and results and co-authored themanuscript.
B M. Söderfjäll, A. Almqvist and R. Larsson.
"A model for twin land oil control rings."
Tribology International vol. 95, pp. 475-482, 2016.
The modelling and analysis was mainly performed by M. Söder-fjäll, the corresponding author, who also wrote the paper. A.Almqvist provided the cavitation model which was used as to val-idate the cavitation model used in this work. A. Almqvist and R.Larsson were involved in the discussion of the method and resultsand co-authored the manuscript.
C M. Söderfjäll, A. Almqvist and R. Larsson.
"Component test for simulation of piston ring-Cylinder
liner friction at realistic speeds."
Tribology International vol. 104, pp. 57-63, 2016.
15
The design of the test rig, building it, running the tests and theanalysis of the results were performed by M. Söderfjäll, the corre-sponding author, who also wrote the paper. A. Almqvist and R.Larsson were involved in the discussion of the design during the de-velopment phase. A. Almqvist and R. Larsson were also involvedin the analysis of the results and co-authored the manuscript.
D M. Söderfjäll, R. Larsson and A. Almqvist.
"Texture induced effects causing reduction of friction in
mixed lubrication for twin land oil control rings."
Accepted for publication in: Proceedings of the Institution
of Mechanical Engineers, Part J: Journal of Engineering
Tribology
The modelling and analysis was mainly performed by M. Söder-fjäll, the corresponding author, who also wrote the paper. A.Almqvist and R. Larsson were involved in the discussion of themethod and results and co-authored the manuscript.
E M. Söderfjäll, H. M. Herbst, R. Larsson and A. Almqvist.
"Experimental study on HDDE power cylinder unit - On
the influence of piston rings, cylinder liners and oils on
friction and sealing capability of oil control ring and vali-
dation of numerical model."
To be submitted to journal
The test matrix was set-up mainly by H.M. Herbst with some in-put from M. Söderfjäll. The testing and analysis of results wereperformed by M. Söderfjäll, the corresponding author, who alsowrote the paper with input from the co-authors.
Conference presentations
• M. Söderfjäll, P. Isaksson, A. Spencer, A. Almqvist and
R. Larsson.
"The effect of 3D deformations of a cylinder liner on the
tribological performance of a piston ring-cylinder liner
system."
Presented by: M. SöderfjällWorld Tribology Congress, Torino, Italy, September 8-13, 2013.
• M. Söderfjäll, A. Almqvist and R. Larsson.
"A New Test Rig for Simulation of Piston Ring Friction."
Presented by: M. Söderfjäll71st STLE Annual Meeting, Las Vegas, USA, May 15-19, 2016.
17

Nomenclature
α Cavitation model parameter
β Transition zone cavitation model [Pa]
η Dynamic viscosity [Pa·s]
η00 Oil viscosity parameter [Pa·s]
µ Friction coefficient
µb Boundary friction coefficient
ρ Density [kg/m3]
ϕ Phase shift [rad]
A Area [m2]
A0 Poiseuille correction factor matrix
aij Poiseuille correction factor [m3]
An Fourier coefficient [m]
B0 Couette correction factors matrix
bij Couette correction factors [m]
Bt Oil viscosity parameter [C]
c11/d11 Correction factors for averaged viscous friction
F Friction force [N]
19
f Scaling polynomial for cavitation model
Fc Boundary friction force [N]
Fh Hydrodynamic friction force [N]
g Boundary friction scaling function
N Load [N]
n Order of out-of-roundness
Pc Contact pressure [Pa]
Ps Axial load [N]
R Ring land radius [m]
Rt Ring normal load [N]
T0 Oil viscosity parameter [C]
ulim Boundary friction scaling parameter [m/s]
Ω Integration domain [m2]
h Film thickness [m]
p Pressure [Pa]
T Lubricant temperature [C]
t Time [s]
U Piston sliding speed [m/s]
x Space coordinate [m]
y Space coordinate [m]
Acronyms
BDC Bottom dead centre
COF Coefficient of friction
EHL Elastohydrodynamic lubrication
HDDE Heavy duty diesel engine
JFO Jakobsson-Floberg-Olsson
lw land width
MOFT Minimum oil film thickness
OCR Oil control ring
OoR Out-of-roundness
PCU Power cylinder unit
PRCL Piston ring - cylinder liner
RC Ring configuration
SCR Second compression ring
TCR Top compression ring
TDC Top dead centre
TLOCR Twin land oil control ring

Part I
Comprehensive Summary
23

Chapter 1
Introduction
Reducing fuel consumption and consequently CO2 emissions is of toppriority in automotive industry today. In a UK based trucking operationthe cost for fuel accounts for about 30 % of the operational cost [1].Reducing friction and wear in engine and drive train components arealso highly prioritised and according to [2], it could save the US economyas much as US$120 billion per year. According to Holmberg et al. [3] 180billion litres of fuel are used to overcome friction in heavy duty vehiclesevery year.
This chapter contains information about the power cylinder unit(PCU) in a heavy duty diesel engine (HDDE). It describes the differentcomponents in the PCU and their purpose. It also contains informationon how to reduce the frictional losses and the effects that needs to beconsidered when reducing the losses. It briefly highlights some previouswork done in the field, research gaps are identified and objectives forthis work is defined.
1.1 Components in the PCU of a HDDE
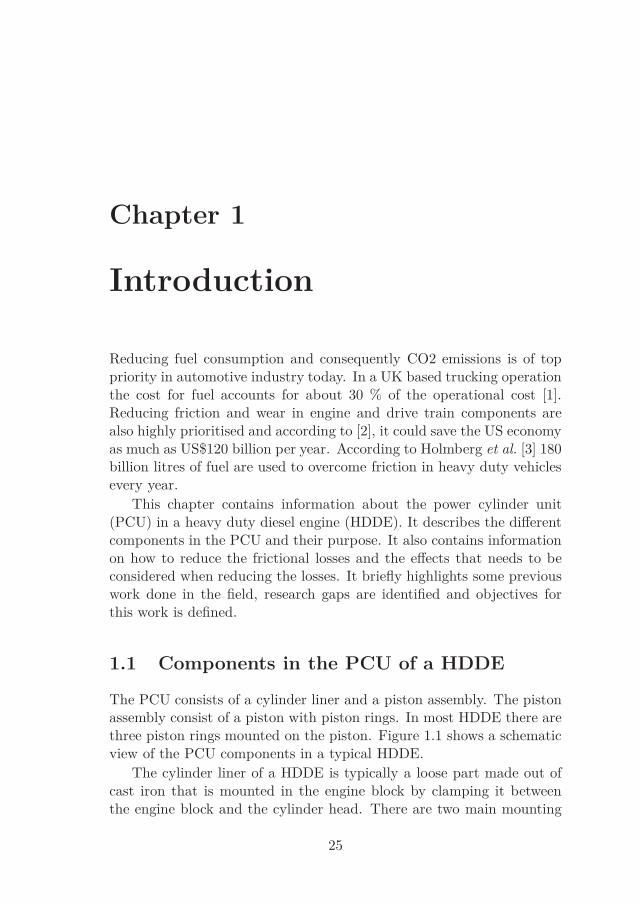
The PCU consists of a cylinder liner and a piston assembly. The pistonassembly consist of a piston with piston rings. In most HDDE there arethree piston rings mounted on the piston. Figure 1.1 shows a schematicview of the PCU components in a typical HDDE.
The cylinder liner of a HDDE is typically a loose part made out ofcast iron that is mounted in the engine block by clamping it betweenthe engine block and the cylinder head. There are two main mounting
25
26 Chapter 1. Introduction
Figure 1.1: Schematic view of the components in the PCU.
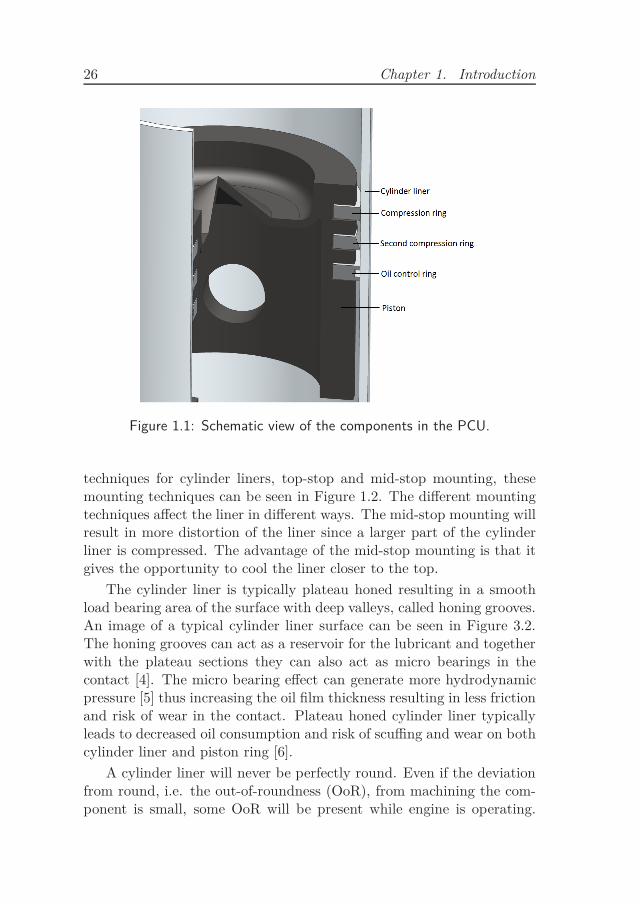
techniques for cylinder liners, top-stop and mid-stop mounting, thesemounting techniques can be seen in Figure 1.2. The different mountingtechniques affect the liner in different ways. The mid-stop mounting willresult in more distortion of the liner since a larger part of the cylinderliner is compressed. The advantage of the mid-stop mounting is that itgives the opportunity to cool the liner closer to the top.
The cylinder liner is typically plateau honed resulting in a smoothload bearing area of the surface with deep valleys, called honing grooves.An image of a typical cylinder liner surface can be seen in Figure 3.2.The honing grooves can act as a reservoir for the lubricant and togetherwith the plateau sections they can also act as micro bearings in thecontact [4]. The micro bearing effect can generate more hydrodynamicpressure [5] thus increasing the oil film thickness resulting in less frictionand risk of wear in the contact. Plateau honed cylinder liner typicallyleads to decreased oil consumption and risk of scuffing and wear on bothcylinder liner and piston ring [6].
A cylinder liner will never be perfectly round. Even if the deviationfrom round, i.e. the out-of-roundness (OoR), from machining the com-ponent is small, some OoR will be present while engine is operating.
1.2. Operation of the PCU 27
Figure 1.2: Schematic view of different cylinder liner mounting techniques.Left: top-stop mounting, right: mid-stop mounting.
Deviations from perfectly round can occur for several reasons, e.g.
• Imperfections in machining,
• Mechanical stresses from clamping the liner in the engine block,
• Thermal deformation,
• Combustion gas forces, and
• Piston slap.
The OoR is typically defined with a Fourier series as:
∆rN (θ) =N∑
n=1
An cos(nθ + ϕ), (1.1)
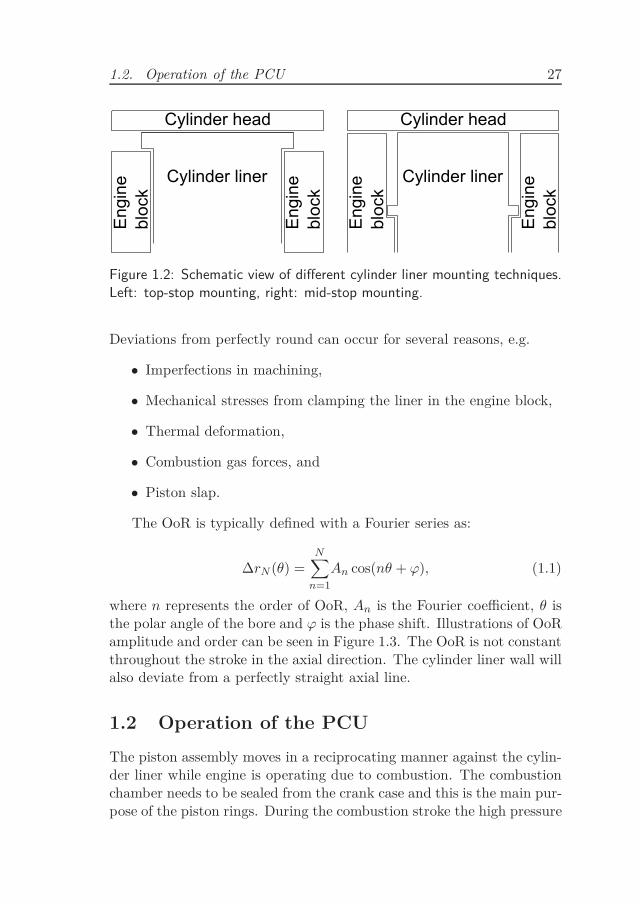
where n represents the order of OoR, An is the Fourier coefficient, θ isthe polar angle of the bore and ϕ is the phase shift. Illustrations of OoRamplitude and order can be seen in Figure 1.3. The OoR is not constantthroughout the stroke in the axial direction. The cylinder liner wall willalso deviate from a perfectly straight axial line.
1.2 Operation of the PCU
The piston assembly moves in a reciprocating manner against the cylin-der liner while engine is operating due to combustion. The combustionchamber needs to be sealed from the crank case and this is the main pur-pose of the piston rings. During the combustion stroke the high pressure
28 Chapter 1. Introduction
Figure 1.3: Illustrations of OoR amplitude and order, in blue.
combustion gases should act on the piston thus generating mechanicalwork. If not adequately sealed, excessive amounts of combustion gaseswill leak through the ring pack resulting in reduced efficiency of the en-gine. During operation the piston ring - cylinder liner (PRCL) contactwill generate friction. In order to reduce friction losses and the wear aswell, an oil needs to be supplied to lubricate the sliding contacts betweenthe rings and the liner. The oil is also acting as a coolant for the PCU.The piston ring pack should therefore keep the combustion gases in thecombustion chamber at the same time as it prevents the lubricant fromentering the combustion chamber. The piston rings can also be designedhelp to remove heat from the piston to the cylinder liner.
The main function of the top compression ring is to seal the com-bustion chamber. The compression ring is loaded against the cylinderliner by internal spring force from fitting in the liner, in addition, com-bustion gases acting on the back of the ring acts to increase the sealingcapability where it is most needed.
The second compression ring, sometimes called scraper ring, shouldboth act as a seal for the combustion pressure but also scrape oil down-wards along the liner thus keeping the oil consumption at a minimum.
The oil control ring (OCR) act as a first barrier for the crank casefrom which the oil is supplied to the PCU. It is constantly supplied withoil from the crank case, which is either sprayed with nozzles or thrownup by the crank shaft. The OCR distributes oil onto the liner to providethe correct amount of lubricant for the other two rings. It is a crucialcomponent for restriction of oil consumption. If the OCR leaves toomuch oil, the oil consumption will be high, especially when the secondcompression ring flutters. In a typical HDDE the OCR has two landsand is therefore referred to as a twin land oil control ring (TLOCR). The
1.3. Friction losses in the PCU 29
TLOCR is loaded against the liner with a loose spring on the back sideof the ring. This means that, the spring tension is constant throughoutthe engine operation, and this usually leads to that the TLOCR, is thering which carries highest average load in the piston ring pack.
1.3 Friction losses in the PCU
The most widely used reference on how friction is partitioned in thePCU is the review by Richardson [7]. In this review, it is suggested thatthe PCU accounts for the largest part of the frictional losses in a HDDEand, in particular, that the piston rings are responsible for the largestpart of the PCU losses. This was also suggested by Hoshi in [8]. In thepiston ring pack the OCR is responsible for approximately 50 % to 75% of the frictional losses [7, 9]. The peak friction force caused by thetop compression ring is by far the largest especially around TDC duringcombustion stroke. However, when this occurs, the piston velocity islow which results in small contribution to friction power loss. Since theTLOCR operates with constant high ring tension the total power lossdue to friction is larger than for the other rings [10]. Wong and Tungrecently wrote a review paper [11] on automotive friction focusing onthe reduction of such. The review by Richardson [7] was still at thisdate used to quantify breakdown of frictional losses in HDDE. Wongand Tung also concluded that in general the relative friction losses ofan engine can be reduced by increasing the engine load. This is sincethe load on the engine has low influence on the friction power losses.Increasing the load often means changing gear ratio such that the engineruns at lower RPM, while still providing the same vehicle speed. Thiscan be beneficial also because the friction power loss is highly dependenton velocity and can be reduced with lower engine speed.
1.4 Possibilities for friction reduction
The friction force is normally defined as:
F = µ · N, (1.2)
where µ is the coefficient of friction (COF) and N is the load. This givestwo possibilities for reduction of friction. Either by lowering the COF orthe load. Friction would be decreased by reducing the force which loads
30 Chapter 1. Introduction
the piston ring against the cylinder liner. This could, however, causeproblems with conformability between the piston ring and the cylinderliner and thus compromise the sealing capability. More precisely, if thepiston rings are unable to conform to the liner, both oil consumptionand blow-by could become unacceptably large. It is therefore importantto characterise the effects of low load on the piston rings in combina-tion with different amount of OoR. If the benefits are large enough,improvements to the entire engine design fulfilling the requirements canbe motivated.
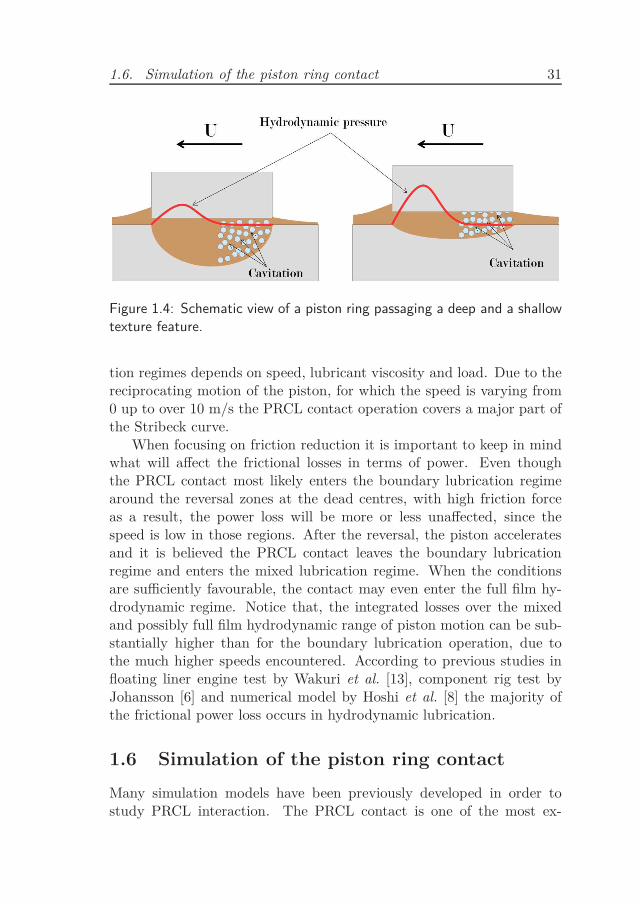
The other way to reduce friction is to lower the COF. This could bedone by applying carefully designed surface texture on the cylinder liner.If, e.g., the surface texture increased the separation between the surfacesit would result in lowered friction losses. The increased separation couldbe achieved in different ways. Figure 1.4 shows a schematic view of apiston ring sliding over texture features with different dimensions. Atexture feature with small depth can contribute to the generation of hy-drodynamic pressure that leads to increased separation between the pis-ton ring and the cylinder liner plateau surface, suggesting lower frictionlosses. A texture with large depth might result in lower film thicknessbetween the piston ring and the cylinder liner plateau surface leading tolarger friction in these sections without texture features. However, theincreased average film thickness, caused by the surface texture itself,could lead to a total reduction of friction. Unfortunately, this wouldlikely lead to a larger wear rate. Cavitation is another factor which in-fluences the friction in the PRCL contact. More precisely, the cavitationoccurring in the dimple will reduce the amount of lubricant shear in thisregion thus reducing friction in the contact.
All in all, this suggests that when applying the surface texture onthe cylinder liner, it should be designed differently over the length ofthe stroke. In this way, the overall performance could be improved withlowered friction in the mid-stroke where the power losses are high andwith preserved sealing capability and low wear around reversal zones.
1.5 Lubrication regimes
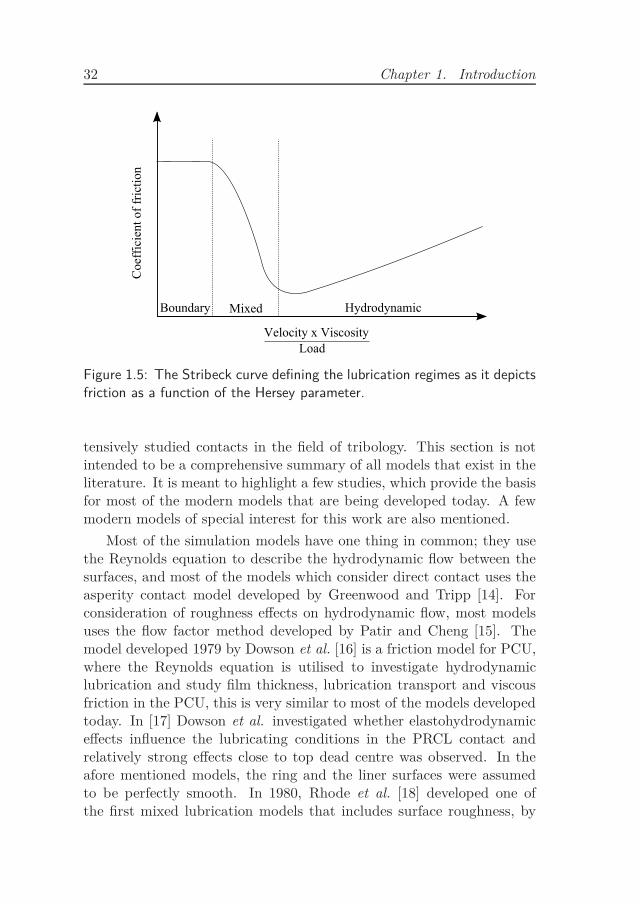
The lubrication regimes are often illustrated by the Stribeck curve, ex-emplified in Figure 1.5. Even though the Stribeck curve was originallydeveloped for journal bearings it is considered applicable to other lubri-cated systems [12], since it is a good representation on how the lubrica-
1.6. Simulation of the piston ring contact 31
Figure 1.4: Schematic view of a piston ring passaging a deep and a shallowtexture feature.
tion regimes depends on speed, lubricant viscosity and load. Due to thereciprocating motion of the piston, for which the speed is varying from0 up to over 10 m/s the PRCL contact operation covers a major part ofthe Stribeck curve.
When focusing on friction reduction it is important to keep in mindwhat will affect the frictional losses in terms of power. Even thoughthe PRCL contact most likely enters the boundary lubrication regimearound the reversal zones at the dead centres, with high friction forceas a result, the power loss will be more or less unaffected, since thespeed is low in those regions. After the reversal, the piston acceleratesand it is believed the PRCL contact leaves the boundary lubricationregime and enters the mixed lubrication regime. When the conditionsare sufficiently favourable, the contact may even enter the full film hy-drodynamic regime. Notice that, the integrated losses over the mixedand possibly full film hydrodynamic range of piston motion can be sub-stantially higher than for the boundary lubrication operation, due tothe much higher speeds encountered. According to previous studies infloating liner engine test by Wakuri et al. [13], component rig test byJohansson [6] and numerical model by Hoshi et al. [8] the majority ofthe frictional power loss occurs in hydrodynamic lubrication.
1.6 Simulation of the piston ring contact
Many simulation models have been previously developed in order tostudy PRCL interaction. The PRCL contact is one of the most ex-
32 Chapter 1. Introduction
Figure 1.5: The Stribeck curve defining the lubrication regimes as it depictsfriction as a function of the Hersey parameter.
tensively studied contacts in the field of tribology. This section is notintended to be a comprehensive summary of all models that exist in theliterature. It is meant to highlight a few studies, which provide the basisfor most of the modern models that are being developed today. A fewmodern models of special interest for this work are also mentioned.
Most of the simulation models have one thing in common; they usethe Reynolds equation to describe the hydrodynamic flow between thesurfaces, and most of the models which consider direct contact uses theasperity contact model developed by Greenwood and Tripp [14]. Forconsideration of roughness effects on hydrodynamic flow, most modelsuses the flow factor method developed by Patir and Cheng [15]. Themodel developed 1979 by Dowson et al. [16] is a friction model for PCU,where the Reynolds equation is utilised to investigate hydrodynamiclubrication and study film thickness, lubrication transport and viscousfriction in the PCU, this is very similar to most of the models developedtoday. In [17] Dowson et al. investigated whether elastohydrodynamiceffects influence the lubricating conditions in the PRCL contact andrelatively strong effects close to top dead centre was observed. In theafore mentioned models, the ring and the liner surfaces were assumedto be perfectly smooth. In 1980, Rhode et al. [18] developed one ofthe first mixed lubrication models that includes surface roughness, by
1.7. Simulation of out of round cylinder liners 33
using the Patir-Cheng flow factor method and Greenwood-Tripp asperitycontact model. They showed that surface roughness significantly affectthe performance of the PRCL contact.
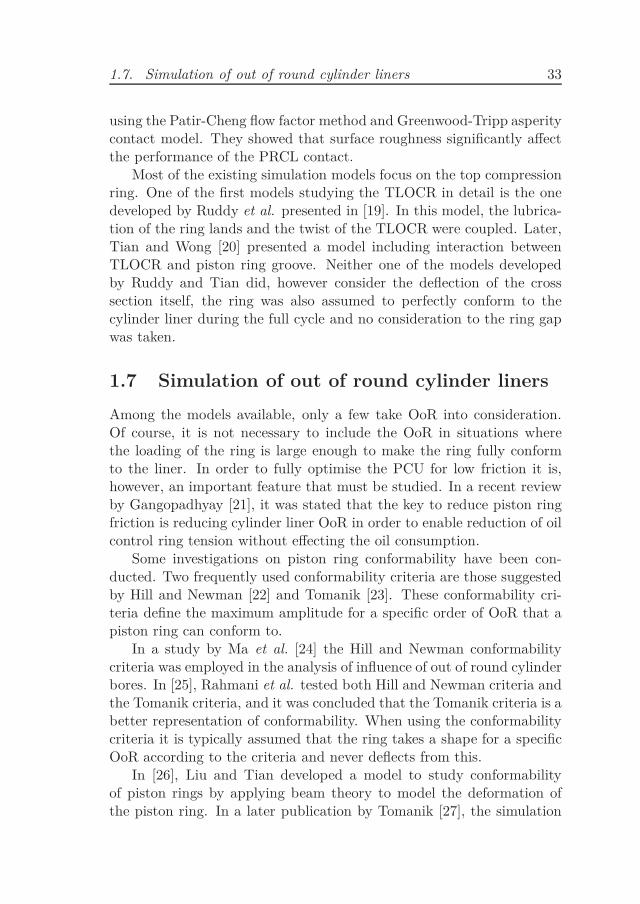
Most of the existing simulation models focus on the top compressionring. One of the first models studying the TLOCR in detail is the onedeveloped by Ruddy et al. presented in [19]. In this model, the lubrica-tion of the ring lands and the twist of the TLOCR were coupled. Later,Tian and Wong [20] presented a model including interaction betweenTLOCR and piston ring groove. Neither one of the models developedby Ruddy and Tian did, however consider the deflection of the crosssection itself, the ring was also assumed to perfectly conform to thecylinder liner during the full cycle and no consideration to the ring gapwas taken.
1.7 Simulation of out of round cylinder liners
Among the models available, only a few take OoR into consideration.Of course, it is not necessary to include the OoR in situations wherethe loading of the ring is large enough to make the ring fully conformto the liner. In order to fully optimise the PCU for low friction it is,however, an important feature that must be studied. In a recent reviewby Gangopadhyay [21], it was stated that the key to reduce piston ringfriction is reducing cylinder liner OoR in order to enable reduction of oilcontrol ring tension without effecting the oil consumption.
Some investigations on piston ring conformability have been con-ducted. Two frequently used conformability criteria are those suggestedby Hill and Newman [22] and Tomanik [23]. These conformability cri-teria define the maximum amplitude for a specific order of OoR that apiston ring can conform to.
In a study by Ma et al. [24] the Hill and Newman conformabilitycriteria was employed in the analysis of influence of out of round cylinderbores. In [25], Rahmani et al. tested both Hill and Newman criteria andthe Tomanik criteria, and it was concluded that the Tomanik criteria is abetter representation of conformability. When using the conformabilitycriteria it is typically assumed that the ring takes a shape for a specificOoR according to the criteria and never deflects from this.
In [26], Liu and Tian developed a model to study conformabilityof piston rings by applying beam theory to model the deformation ofthe piston ring. In a later publication by Tomanik [27], the simulation
34 Chapter 1. Introduction
model developed by Liu was used to develop a formula for conformabilityagainst several orders of OoR at once.
A lot of the existing models that deal with conformability of therings against out of round cylinder liners uses the beam theory for elas-tic deformation of the ring, two examples are the models developedby Ejakov [28] and Liu and Tian [26]. In a study by Dunaevsky andAlexandrov [29] a three-dimensional conformability model for split-lessrings with theory for thin curved rods was developed. A split-less modelmeans that no consideration to the ring gap is taken and the ring isseen as a closed circular component. It was concluded that this type ofmodel does not provide any information about the behaviour of the pis-ton rings, other than the critical amplitude of OoR to which the pistonring can conform. It was also concluded that it should mainly be usedwhen comparing different piston ring design effects on conformability.
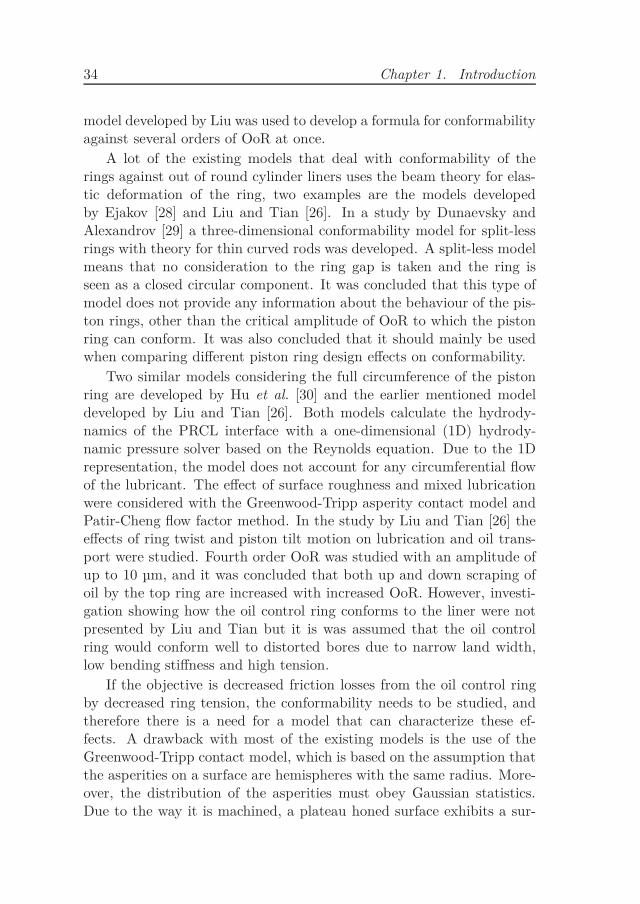
Two similar models considering the full circumference of the pistonring are developed by Hu et al. [30] and the earlier mentioned modeldeveloped by Liu and Tian [26]. Both models calculate the hydrody-namics of the PRCL interface with a one-dimensional (1D) hydrody-namic pressure solver based on the Reynolds equation. Due to the 1Drepresentation, the model does not account for any circumferential flowof the lubricant. The effect of surface roughness and mixed lubricationwere considered with the Greenwood-Tripp asperity contact model andPatir-Cheng flow factor method. In the study by Liu and Tian [26] theeffects of ring twist and piston tilt motion on lubrication and oil trans-port were studied. Fourth order OoR was studied with an amplitude ofup to 10 µm, and it was concluded that both up and down scraping ofoil by the top ring are increased with increased OoR. However, investi-gation showing how the oil control ring conforms to the liner were notpresented by Liu and Tian but it is was assumed that the oil controlring would conform well to distorted bores due to narrow land width,low bending stiffness and high tension.
If the objective is decreased friction losses from the oil control ringby decreased ring tension, the conformability needs to be studied, andtherefore there is a need for a model that can characterize these ef-fects. A drawback with most of the existing models is the use of theGreenwood-Tripp contact model, which is based on the assumption thatthe asperities on a surface are hemispheres with the same radius. More-over, the distribution of the asperities must obey Gaussian statistics.Due to the way it is machined, a plateau honed surface exhibits a sur-
1.8. Textured cylinder liners 35
face height distribution which is negatively skewed with properties thatdiffers from what Gaussian statistics predicts. This means, e.g. that itis difficult to accurately describe the surface in that way and the contactstiffness curve might be incorrect. Another drawback of the Greenwood-Tripp contact model, is that it assumes that each asperity deforms in-dependently and thus neglect the influence from load on neighbouringasperities.
To the author’s knowledge, there exist no model in the research fieldfor prediction of PRCL friction that describes the elasticity of the fullcross section of the TLOCR, including surface roughness. Neither isthere any existing model for TLOCR which couple the dynamic motion(inertia), complete macro scale elastic deformation (conformability) andtribological interfaces of a complete ring.
1.8 Textured cylinder liners
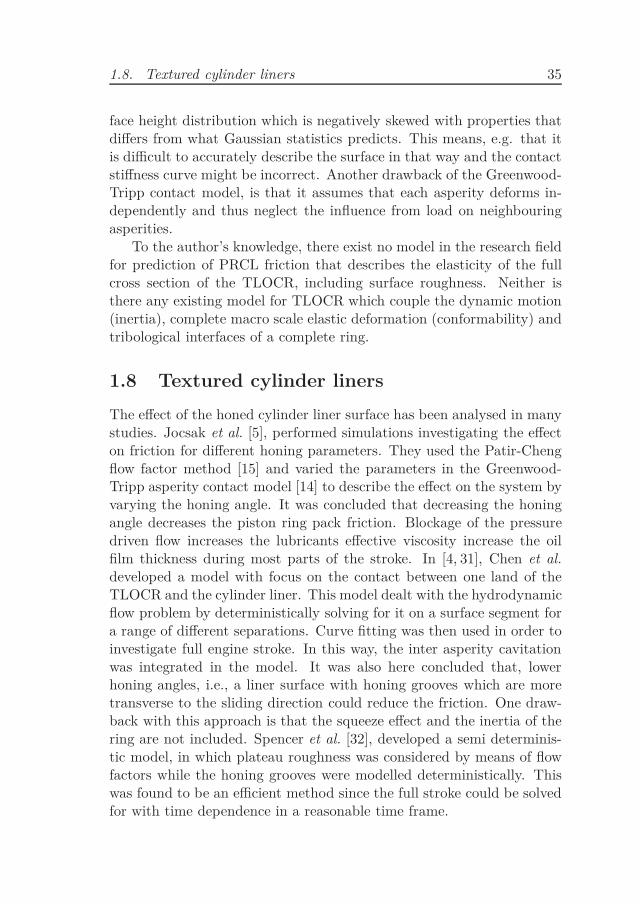
The effect of the honed cylinder liner surface has been analysed in manystudies. Jocsak et al. [5], performed simulations investigating the effecton friction for different honing parameters. They used the Patir-Chengflow factor method [15] and varied the parameters in the Greenwood-Tripp asperity contact model [14] to describe the effect on the system byvarying the honing angle. It was concluded that decreasing the honingangle decreases the piston ring pack friction. Blockage of the pressuredriven flow increases the lubricants effective viscosity increase the oilfilm thickness during most parts of the stroke. In [4, 31], Chen et al.
developed a model with focus on the contact between one land of theTLOCR and the cylinder liner. This model dealt with the hydrodynamicflow problem by deterministically solving for it on a surface segment fora range of different separations. Curve fitting was then used in order toinvestigate full engine stroke. In this way, the inter asperity cavitationwas integrated in the model. It was also here concluded that, lowerhoning angles, i.e., a liner surface with honing grooves which are moretransverse to the sliding direction could reduce the friction. One draw-back with this approach is that the squeeze effect and the inertia of thering are not included. Spencer et al. [32], developed a semi determinis-tic model, in which plateau roughness was considered by means of flowfactors while the honing grooves were modelled deterministically. Thiswas found to be an efficient method since the full stroke could be solvedfor with time dependence in a reasonable time frame.
36 Chapter 1. Introduction
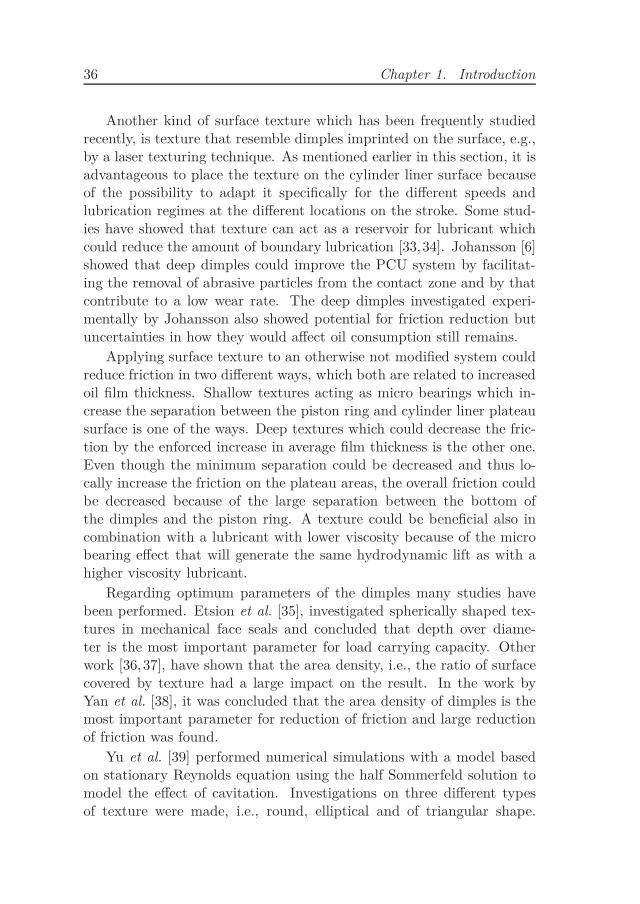
Another kind of surface texture which has been frequently studiedrecently, is texture that resemble dimples imprinted on the surface, e.g.,by a laser texturing technique. As mentioned earlier in this section, it isadvantageous to place the texture on the cylinder liner surface becauseof the possibility to adapt it specifically for the different speeds andlubrication regimes at the different locations on the stroke. Some stud-ies have showed that texture can act as a reservoir for lubricant whichcould reduce the amount of boundary lubrication [33,34]. Johansson [6]showed that deep dimples could improve the PCU system by facilitat-ing the removal of abrasive particles from the contact zone and by thatcontribute to a low wear rate. The deep dimples investigated experi-mentally by Johansson also showed potential for friction reduction butuncertainties in how they would affect oil consumption still remains.
Applying surface texture to an otherwise not modified system couldreduce friction in two different ways, which both are related to increasedoil film thickness. Shallow textures acting as micro bearings which in-crease the separation between the piston ring and cylinder liner plateausurface is one of the ways. Deep textures which could decrease the fric-tion by the enforced increase in average film thickness is the other one.Even though the minimum separation could be decreased and thus lo-cally increase the friction on the plateau areas, the overall friction couldbe decreased because of the large separation between the bottom ofthe dimples and the piston ring. A texture could be beneficial also incombination with a lubricant with lower viscosity because of the microbearing effect that will generate the same hydrodynamic lift as with ahigher viscosity lubricant.
Regarding optimum parameters of the dimples many studies havebeen performed. Etsion et al. [35], investigated spherically shaped tex-tures in mechanical face seals and concluded that depth over diame-ter is the most important parameter for load carrying capacity. Otherwork [36,37], have shown that the area density, i.e., the ratio of surfacecovered by texture had a large impact on the result. In the work byYan et al. [38], it was concluded that the area density of dimples is themost important parameter for reduction of friction and large reductionof friction was found.
Yu et al. [39] performed numerical simulations with a model basedon stationary Reynolds equation using the half Sommerfeld solution tomodel the effect of cavitation. Investigations on three different typesof texture were made, i.e., round, elliptical and of triangular shape.
1.8. Textured cylinder liners 37
It was found that the triangularly shaped dimples should be placedwith one of the sides perpendicular to the sliding direction. It was alsofound that the longest dimension of the elliptically shaped dimple shouldbe placed perpendicular to the sliding direction. All the calculationwere performed for a single dimple only and it was stated that furtherstudies considering more than one single dimple needs to be carried outto be able to draw reliable conclusions on the effects caused by dimplesin real applications. Yu et al. [40], found that the dimple generatedhydrodynamic effect is the largest contributor to the load capacity atlow loads and high speeds.
Checo et al. [41], simulated texture placed on the cylinder liner incontact with a slider thought of as a piston ring with a mass conservingcavitation model. The model by Checo et al. did, however, not considerthe mechanical contact between the surfaces. They found that the tex-ture will only provide for friction reduction when the piston ring radiusis large. Biboulet and Lubrecht [42], did also simulate a textured liner -piston ring contact by means of a 1D model. Their results also showedthat large radius of the piston ring land is necessary to be able to detecttexture induced friction reduction. In other words, the more parallelthe contacting surfaces are the higher the contribution to hydrodynamiclift caused by the dimple in relation to the lift caused by the curvatureof the piston ring will be. In a recent review by Gropper et al. [43], itwas stated that there are no general guidelines on how to design sur-face texture. This means that the texture design has to be optimisedspecifically for each and every tribological system and for its operatingconditions. Hua et al. [44], investigated the effect of laser imprinteddimples on cylinder liners in a fired single cylinder engine. The dimpleswere approximately 40 µm in diameter, depth was varied between 6 and8 µm and between 8 and 12 % of the surface was covered with dimples.Lower fuel consumption was noted when compared to a standard liner,however some uncertainty remains regarding whether the effect camefrom the texture itself or from the polishing of the liner after applyingthe texture. Howell-Smith et al. [45], investigated laser textured andcoated cylinder liners in a fired single cylinder engine. It was statedthat texture could be beneficial for fuel consumption and also that theoptimisation of geometry, distribution and shape of dimples should beperformed with numerical analysis.
A number of studies have been performed where the textures wereplaced on the moving part. Ronen et al. [46], simulated dimples in a pis-
38 Chapter 1. Introduction
ton ring like contact and found that 30 % friction reduction was possiblewith texture on the moving part, with an optimum area density between5 and 20 %. Gadeschi [47], performed similar numerical simulations oftexture on the piston ring using half Sommerfeld to model cavitationand found that optimum area density was 60 %. In [48], Etsion andSher showed potential of reducing fuel consumption with 4 % in a 2.5 ldiesel engine when the original piston rings were replaced with partiallytextured piston rings. However, the textured and original rings did nothave the same ring land curvature, therefore, it is uncertain if the benefitin friction was because of the texture.
1.9 Experimental methods
Many different test methods have been developed and used for mea-surement of piston ring friction. The types of experimental equipmenttypically used can be divided into two different categories.
• Component test-rig
• Full engine test
In the following subsections, these two main types of experimental equip-ment will be discussed.
1.9.1 Component test-rig
The component test-rigs are designed to investigate performance of sin-gle components with as little influence from other things as possible.Usually, a segment cut out of a cylinder liner in contact with a sectionof a piston ring is used. One of the most frequently used componenttype of test-rig is the commercial Cameron-Plint TE 77. See [49] fora description of this test-rig. The TE 77 and other similar equipmentwith various features but the same basic design has been employed tostudy friction in reciprocating contacts, see e.g. [50–57]. Advantageswith using segments of cylinder liner in the test set-up, are fast replace-ment of specimens and easily variable load. Typically, component typeof test-rigs can only be used to simulate reciprocating motion at ratherlow sliding speeds, often merely at a few m/s. The low sliding speedsin combination with the often relatively high loading capacity makesthe tests suitable for simulation of reversal zone effects. However, these
1.9. Experimental methods 39
test methods are far from optimal, for evaluation of friction reducingconcepts and validation of numerical engine simulation models. This isbecause the low sliding speed is too low to be in parity with the oper-ating speed at mid-stroke of an actual engine, where most of the powerloss occur. There are also often problems with instabilities when simu-lating low load situation associated with the contact pressure typical forthe compression rings at mid-stroke, and the oil control ring during theentire stroke. When using only a segment of the cylinder liner the align-ment of the components become critical, time consuming and arduous atthe same time. The reason for the low test speed restriction, is usuallyrelated to imbalance caused by the reciprocating motion. With increasedspeed, inertia from the reciprocating assembly generate noise, which atsome speed will be large enough to completely obscure the friction sig-nal. Other problems with using sections of cylinder liner are that theactual way of loading the piston ring will differ from the real application.Moreover when cutting out the section it will to some amount becomedistorted and this will have a direct impact on the friction performanceof the simulated contact.
1.9.2 Full engine test
A typical way of measuring friction in the full engine test is to use thefloating liner method. This can be done in a modified engine and it isoften implemented in a single cylinder representation of a multi cylinderproduction engine. The floating liner technique means that the cylinderliner is suspended with force transducers in the axial direction. Theforce transducers are thereby measuring the friction in between the pis-ton assembly and cylinder liner. The floating liner technique has beenused by the authors in [10, 58–65]. This is an excellent way of measur-ing friction since it is direct measurement with the actual components.However there are some drawbacks, the testing becomes time consumingand also expensive. The largest challenge with the floating liner methodis, according to Furuhama [58], to seal the combustion chamber. Theseals will always have some leaks which will influence the friction signal.Friction measurements can be done in a motored configuration withoutcombustion and by that remove the problems with leaking combustiongases. In a motored test when using a typical piston assembly it is hardto measure friction from one or more piston rings individually, since thepiston itself will influence the result in this case. This particular prob-
40 Chapter 1. Introduction
lem is discussed in the paper by Liao et al. [66]. In that work, Liao et
al. measured friction from the piston without rings and subtracted itfrom the piston assembly friction in order to obtain an estimate of thepiston ring friction. This is one way of handling it, but some uncertaintyin how the piston rings affect the friction of the piston itself remains.Kunkel et al. [67], ran motored tests with a passenger car engine modi-fied for floating liner measurement to investigate the running-in of twinland oil control rings. It was shown that the combustion, in general, hasa secondary role for the friction losses for the oil control ring and thatits friction power loss is mainly dependent on temperature, tangentialload and speed. Kunkel et al. stated that when studying oil controlring friction, tests are usually made motored in pressure less conditionto maintain acceptable repeatability.
Another way to measure friction from single components is to usea so called strip down method. This means that one component atthe time is removed and the difference in friction from each removal isregistered. The strip down method can be used with a floating linerengine but also with an unmodified engine equipped with some kind oftorque measurement.
One way to measure friction in a fired engine is to use an indirectmeasurement technique. More precisely, flywheel torque is measured andrecalculated to a pressure, i.e., brake mean effective pressure (BMEP).The combustion chamber pressure is measured simultaneously. This isreferred to as indicated mean effective pressure (IMEP). The differencebetween IMEP and BMEP results in what is referred to as the frictionmean effective pressure (FMEP). The indirect measurement of frictiondoes have a large error margin, which makes it time consuming and ex-pensive to use for evaluating improvements for the power cylinder unit.Deuss et al. [68], used the FMEP method for comparison of fired oper-ation and externally pressurised combustion chamber tests. As Kunkelet al. did, Deuss et al. also concluded that the top compression ring issubjected to the vast majority of effect from combustion pressure. Theexternally injected compressed air for simulation of combustion pressureshowed the same difference in friction as in fired operation when varyingthe height of the top compression ring. Effectively, this means that ringload is well represented by external pressure. However, when evaluatingthe engine in fully this was said to be the only type of test where ex-ternal pressure testing is applicable since heat from the combustion willinfluence the result. It was shown that FMEP was mostly dependent
1.10. Objectives 41
on speed and almost no dependence on load was found when runningthe engine with combustion. In the tests with external pressure a highdependence of FMEP on both load and speed was found. The samerelation was found in the work by Allmaier et al. [69], who also usedthe FMEP method to measure piston ring friction in a 13 litre heavyduty diesel engine and compare fired operation to motored operationwith externally pressurised combustion chamber. When running firedtests and varying the load from approximately 30 % to 80 % almostno influence on FMEP was found. Interestingly, in general FMEP asa function of load was found to be close to symmetric at around 50 %load. This means that similar FMEP was found at low load (<30 %)increasing with decreased load and high load (>80 %) increasing withincreased load. This can be explained by increased temperature the oilin the contact due to combustion. Also Allmaier et al. showed thatwhen running with externally pressurised combustion chamber FMEPwas significantly affected by the load which again suggests that exter-nal pressure is good for isolating the effect from top compression ringloading but not for representation of combustion effects.
1.10 Objectives
As it was detailed in the preceding sections, particularly in Section 1.3and 1.4, the PCU accounts for the largest part of the frictional lossesin a HDDE and it is in the PRCL contact where most of those lossesoccur. Investigating the mechanisms related to friction losses in thePRCL contact, focusing on the reduction of such was, therefore, definedto be the main objective of this work. Is is believed that this can enablereduction of fuel consumption and consequently CO2 emissions by a fewpercent. From the main objective the following research questions weredefined:
• How much is cylinder liner OoR affecting the frictional losses inthe engine?
• What is the influence on the friction losses from surface texture?
• How can piston ring friction be measured at engine like conditionsin a simpler way than in an actual engine?
To acquire the understanding required to answer the above mentionedresearch questions, both numerical and experimental tools, for simula-
42 Chapter 1. Introduction
tion of piston ring friction will be developed and utilised for frictionestimation.
1.10.1 Simulation tools
The TLOCR is responsible for the majority of the piston ring frictionallosses and is, therefore, the main focus in the numerical simulation partof this thesis. Simulation models enabling investigation of the effect onfriction from:
• Out of round cylinder liners,
• Full engine cycle operation, and
• Textured cylinder liners
will be developed, implemented and used to increase the understandingabout the associated effects and possibly also provide for design changesthat ultimately can lead to reduction of friction power losses.
There was no model available in the literature where the TLOCRis modelled fully in 3D and with consideration to elastic deformation ofthe ring, motion inside the ring groove, and the tribological interfacesagainst both the cylinder liner and the piston ring groove. Therefore,this was specified as the objectives for investigating the effect from cylin-der liner OoR.
To achieve accuracy in predicting friction losses of the TLOCR con-sideration to mass conserving cavitation will be implemented. Moreover,in order to predict the friction power loss from the TLOCR the entireengine cycle needs to be simulated.
For investigating effects caused by textured cylinder liners, there wasno previous model available where mass conserving cavitation, inertia ofthe TLOCR and mixed lubrication were considered. For the numericalinvestigation of the effects of cylinder liner texture, an objective is set todevelop a simulation model considering all these factors simultaneously.
1.10.2 Experimental test equipment
There was no equipment available exhibiting the features required to findthe answers to the research questions of this thesis work. Therefore, anovel test method which fits in the gap between a typical component
1.10. Objectives 43
test-rigs and full engine tests will be designed and built with the follow-ing specifications:
• Operation at realistic engine speeds,
• Mounting of piston rings similar to real engine,
• Direct measurement of friction from one or more piston ring with-out influence of piston,
• Fast replacements of specimens in the form of standard piston ringsand cylinder liners without modification,
• Heated cylinder liner and oil, and
• Oil supply similar to real engine.
The objective of the test-rig is two-fold, i.e, it should be used for valida-tion of numerical simulation models and to investigate the influence onthe tribological system from:
• Different piston ring design, coating and tangential load, and
• Cylinder liner roughness and coating.

Chapter 2
Method
In this chapter the methods used for developing the simulation tools andthe experimental method are presented.
2.1 Numerical simulation
Throughout this work the commercially available multiphysics softwareCOMSOL has been used for the development of the numerical models.This is a finite element software and the reason for choosing such a toolis the relatively straight forward implementation of complex geometries.It also provides a sophisticated and efficient, yet simple way of couplingdifferent physics, which has been of outermost importance for the de-velopment of these models. Flow factors, used to model the micro scaleeffects related to the cylinder liner plateau roughness, computed withavailable MATLAB routines has also been utilized to implement theeffect of roughness in the multiphysics models.
2.1.1 Twin land oil control ring geometry
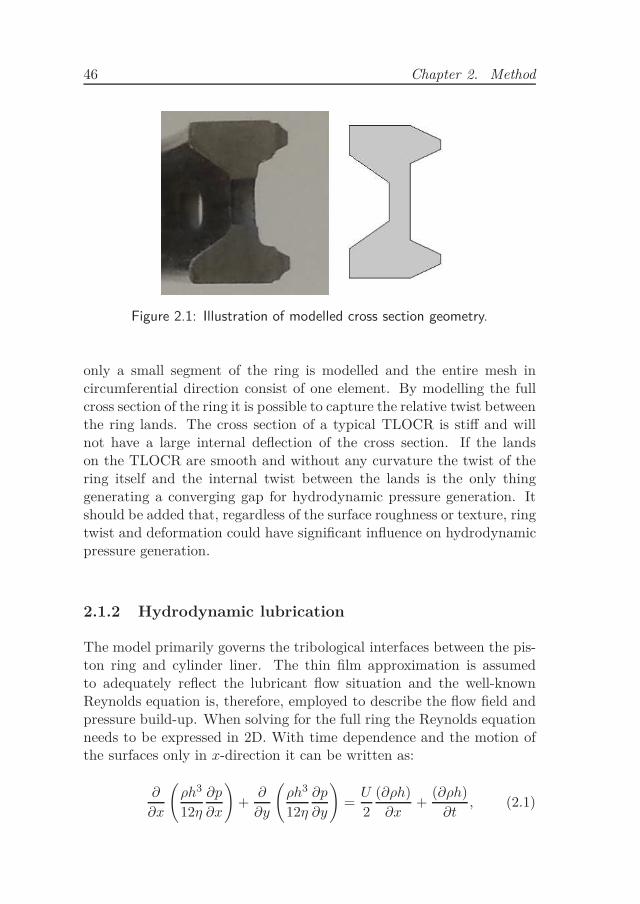
The TLOCR is modelled fully in 3D, however, all design features of areal ring cross section are not included in the geometry because of thegeneration and density of the mesh required. An image of the modelledcross section compared to the one of a real ring can be seen in Figure2.1. In Paper A the cross section is revolved 359 degrees leaving agap in the ring. It is meshed around the whole circumference, to beable to implement effects of out of round liners in the model. In PaperB, the model constructed relies on axially symmetry and, therefore,
45
46 Chapter 2. Method
Figure 2.1: Illustration of modelled cross section geometry.
only a small segment of the ring is modelled and the entire mesh incircumferential direction consist of one element. By modelling the fullcross section of the ring it is possible to capture the relative twist betweenthe ring lands. The cross section of a typical TLOCR is stiff and willnot have a large internal deflection of the cross section. If the landson the TLOCR are smooth and without any curvature the twist of thering itself and the internal twist between the lands is the only thinggenerating a converging gap for hydrodynamic pressure generation. Itshould be added that, regardless of the surface roughness or texture, ringtwist and deformation could have significant influence on hydrodynamicpressure generation.
2.1.2 Hydrodynamic lubrication
The model primarily governs the tribological interfaces between the pis-ton ring and cylinder liner. The thin film approximation is assumedto adequately reflect the lubricant flow situation and the well-knownReynolds equation is, therefore, employed to describe the flow field andpressure build-up. When solving for the full ring the Reynolds equationneeds to be expressed in 2D. With time dependence and the motion ofthe surfaces only in x-direction it can be written as:
∂
∂x
(
ρh3
12η
∂p
∂x
)
+∂
∂y
(
ρh3
12η
∂p
∂y
)
=U
2
(∂ρh)
∂x+
(∂ρh)
∂t, (2.1)
2.1. Numerical simulation 47
where x and y are the space coordinates, t is the time, ρ is the density,η is the dynamic viscosity, p is the pressure, U is the piston speed and his the separation of the two surfaces. The left hand side of the equationdescribes the Poiseuille terms which represent the pressure driven flow.The first term on the right hand side is the Couette term, describingthe shear driven flow. The second term on the right hand side is calledthe squeeze term and it balances the mass-flow continuity for a timedependent flow situation. For the interface between the TLOCR andthe piston ring groove, the Reynolds equation is also solved. Noticethat the velocity of the ring in radial direction is assumed to have anegligible influence and the Couette term representing shear flow in they-direction of the TLOCR and piston ring groove interfaces is, therefore,omitted. The squeeze term and thus the pressure dependence on thetime variation of the separation, which models the damping effect of theoil in the interface when the ring moves axially within the groove, ishowever, included.
To account for surface roughness the Luleå Mixed Lubrication Model(LMLM) is implemented. The LMLM calculates correction factors witha homogenization method applied on the Reynolds equation. This isdone in order to solve for the fluid flow through the rough aperture be-tween the contacting surfaces, without adding the complex local scaleroughness directly in the global model. If the local scale roughness wouldbe applied to the global scale model the mesh would have to be muchfiner than what is practically possible to solve for in an acceptable timeframe. The LMLM is a result from previous work coordinated fromthe Division of Machine Elements at Luleå University of Technology.The development of the LMLM is documented in a number of papers,including [32,70–91], co-authored by Almqvist, Dasht, Essel, Fabricius,Furustig (f.d. Andersson), Isaksson, Jonsén, Larsson, Lundström, Mark-lund, Persson, Sahlin, Shirzadegan, Spencer and Wall, from Luleå Uni-versity of technology. A comprehensive description of the LMLM is givenin the PhD thesis [92] by Almqvist and in the two part paper [89,90] bySahlin et al.. In the LMLM local scale cell problems for a real surfacemeasurement are solved for and the outputs are the correction factors:
A0 =
(
a11 a12
a21 a22
)
, B0 =
(
b12
b22
)
, c11 and d11. (2.2)
The coefficients a12 and a21 are the cross flow terms describing the pres-
48 Chapter 2. Method
sure induced flow perpendicular to the piston sliding direction. For atexture that is perfectly symmetric in both the x- and y-direction, theseare, as shown in [78], identical to zero. For the plateau honed roughnessof the surfaces of investigation in this work, the cross flow terms are notidentical to zero, but several orders of magnitude smaller compared tothe diagonal terms a11 and a22. Similarly b22 is much smaller than b12.Therefore a12, a21 and b22 are omitted in the simulations performed inthis work. This is, actually the same strategy as Spencer used in [93],since the cross flow terms do not affect the solution by any significancebut cause convergence problems for the model due to the increased com-plexity. The coefficients c11 and d11 are the friction correction factors,which are described in detail by Almqvist [70]. With the correctionfactors implemented, the equation used for solving the hydrodynamicpressure in the piston ring - cylinder liner interface takes the followingform:
∂
∂x
(
ρa11
12η
∂p
∂x
)
+∂
∂y
(
ρa22
12η
∂p
∂y
)
=U
2
∂(ρb12)
∂x+
∂(ρh)
∂t, (2.3)
where h is the average separation with consideration to surface rough-ness.
2.1.3 Hydrodynamic cavitation
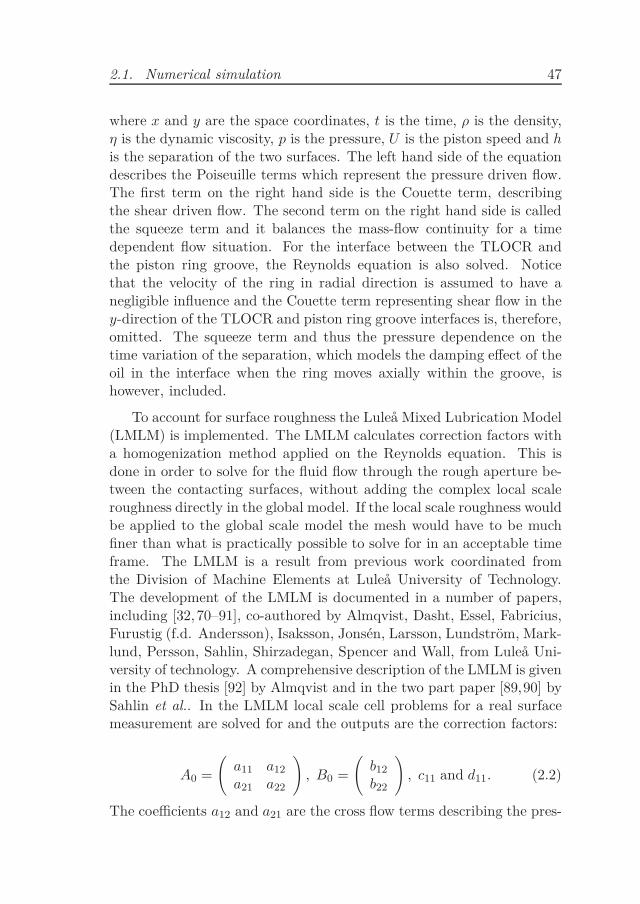
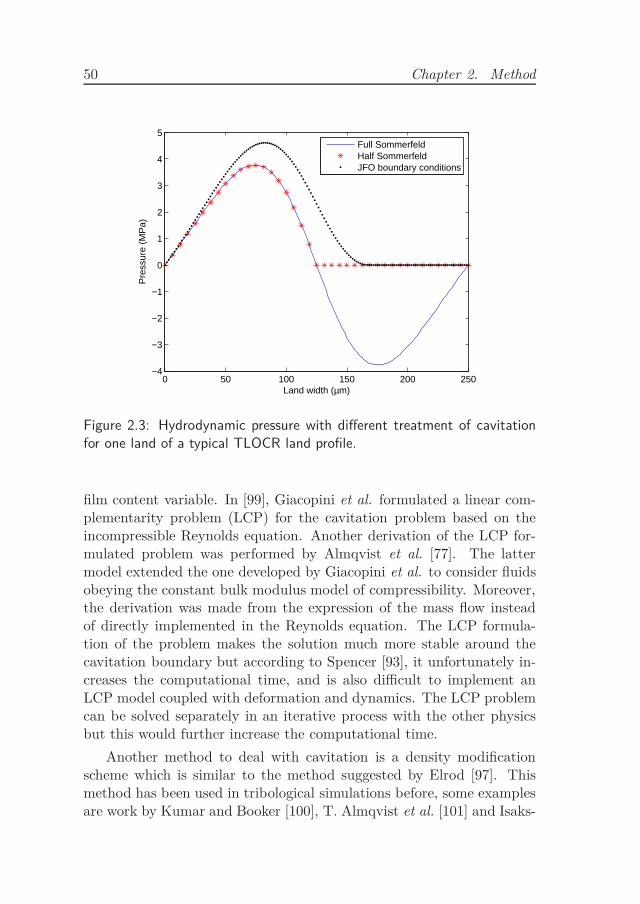
Hydrodynamic cavitation is a complex phenomenon occurring when thelubricant pressure falls below the cavitation pressure. In general, thecavitation pressure is different than zero. However it is typical, in pistonring simulation, to assume the cavitation pressure to be the same as theambient pressure at the boundary of the solution domain [94], taken aszero in the following. The low pressure of the lubricant typically occurswhen the lubricant is flowing through a gap which increases in size, i.e. adiverging gap. The low pressure act as a tensile pressure on the lubricantwhich it cannot sustain, and therefore cavitation occurs. If the Reynoldsequation, without any modification for consideration of cavitation issolved for the parabolic shaped TLOCR land profile depicted in Figure2.2, the pressure solution would be anti-symmetrical with equally largepositive and negative parts, for which the load carrying capacity wouldbe zero. This is referred to as the full Sommerfeld solution, depicted inFigure 2.3 and this clearly shows the need for treatment of cavitation.
2.1. Numerical simulation 49
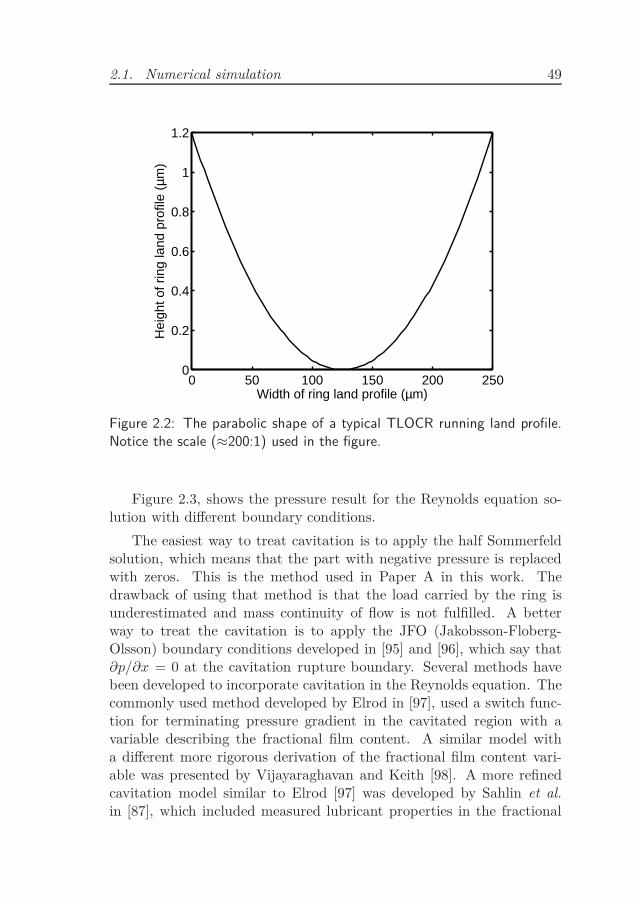
0 50 100 150 200 2500
0.2
0.4
0.6
0.8
1
1.2
Width of ring land profile (µm)
Hei
ght o
f rin
g la
nd p
rofil
e (µ
m)
Figure 2.2: The parabolic shape of a typical TLOCR running land profile.Notice the scale (≈200:1) used in the figure.
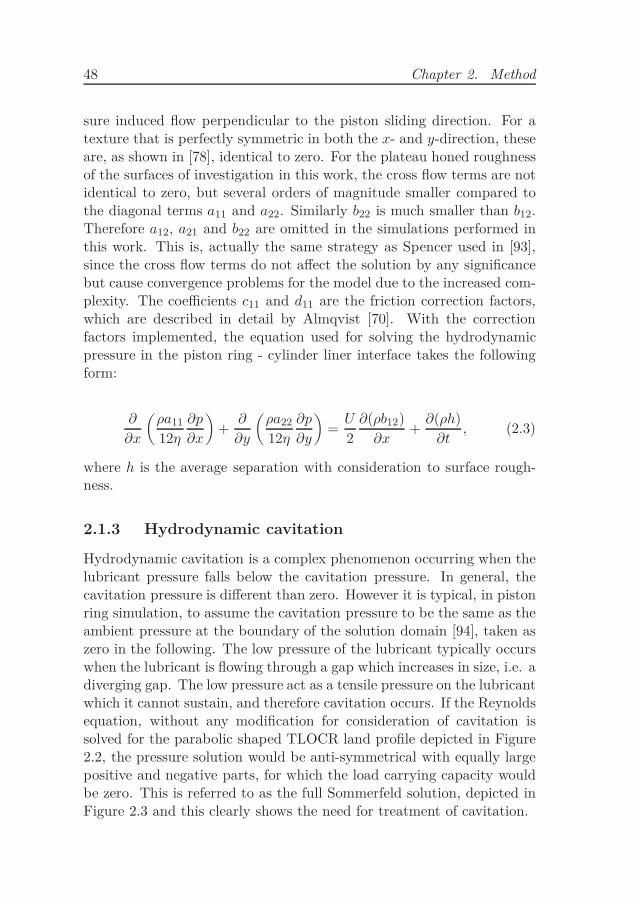
Figure 2.3, shows the pressure result for the Reynolds equation so-lution with different boundary conditions.
The easiest way to treat cavitation is to apply the half Sommerfeldsolution, which means that the part with negative pressure is replacedwith zeros. This is the method used in Paper A in this work. Thedrawback of using that method is that the load carried by the ring isunderestimated and mass continuity of flow is not fulfilled. A betterway to treat the cavitation is to apply the JFO (Jakobsson-Floberg-Olsson) boundary conditions developed in [95] and [96], which say that∂p/∂x = 0 at the cavitation rupture boundary. Several methods havebeen developed to incorporate cavitation in the Reynolds equation. Thecommonly used method developed by Elrod in [97], used a switch func-tion for terminating pressure gradient in the cavitated region with avariable describing the fractional film content. A similar model witha different more rigorous derivation of the fractional film content vari-able was presented by Vijayaraghavan and Keith [98]. A more refinedcavitation model similar to Elrod [97] was developed by Sahlin et al.
in [87], which included measured lubricant properties in the fractional
50 Chapter 2. Method
0 50 100 150 200 250−4
−3
−2
−1
0
1
2
3
4
5
Land width (µm)
Pre
ssur
e (M
Pa)
Full SommerfeldHalf SommerfeldJFO boundary conditions
Figure 2.3: Hydrodynamic pressure with different treatment of cavitationfor one land of a typical TLOCR land profile.
film content variable. In [99], Giacopini et al. formulated a linear com-plementarity problem (LCP) for the cavitation problem based on theincompressible Reynolds equation. Another derivation of the LCP for-mulated problem was performed by Almqvist et al. [77]. The lattermodel extended the one developed by Giacopini et al. to consider fluidsobeying the constant bulk modulus model of compressibility. Moreover,the derivation was made from the expression of the mass flow insteadof directly implemented in the Reynolds equation. The LCP formula-tion of the problem makes the solution much more stable around thecavitation boundary but according to Spencer [93], it unfortunately in-creases the computational time, and is also difficult to implement anLCP model coupled with deformation and dynamics. The LCP problemcan be solved separately in an iterative process with the other physicsbut this would further increase the computational time.
Another method to deal with cavitation is a density modificationscheme which is similar to the method suggested by Elrod [97]. Thismethod has been used in tribological simulations before, some examplesare work by Kumar and Booker [100], T. Almqvist et al. [101] and Isaks-
2.1. Numerical simulation 51
son et al. [102]. As the method in [97], it is assumed that the densityof the lubricant is reduced in the cavitation zone, which is also physi-cally reasonable. In [101] and [102] the density of the lubricant in thecavitated zone is described with a polynomial in terms of the lubricantpressure.
In [103], Häggström introduced an extension of the density modi-fication model. More precisely, in that work it was assumed that theviscosity of the lubricant reduces at the same rate as the viscosity inthe cavitated region. This turned out to be a very effective way of mod-elling cavitation in a multi physics model. The strategy developed byHäggström [103] is therefore used in Paper B and Paper D in this work.This cavitation model is based on the assumption that when the solutionfor lubricant pressure becomes negative the density and viscosity will bereduced and therefore the negative pressure will be avoided. This is agood way to deal with cavitation since this somewhat physically correctassumption means that the model will be mass conserving and fulfil theJFO rupture and reformation boundary conditions. To apply this to themodel, a scaling polynomial for density and viscosity is formulated as:
f(p) =
1 p > 0
3(
p+ββ
)2
− 2(
p+ββ
)3
0 p ≤ −β
−β < p ≤ 0 (2.4)
where β is the factor for the transition zone of the scaling function.By means of (2.4) the pressure dependence of the density and viscositybecomes:
ρ =f(p) + α
1 + αρ0 (2.5)
η =f(p) + α
1 + αη0 (2.6)
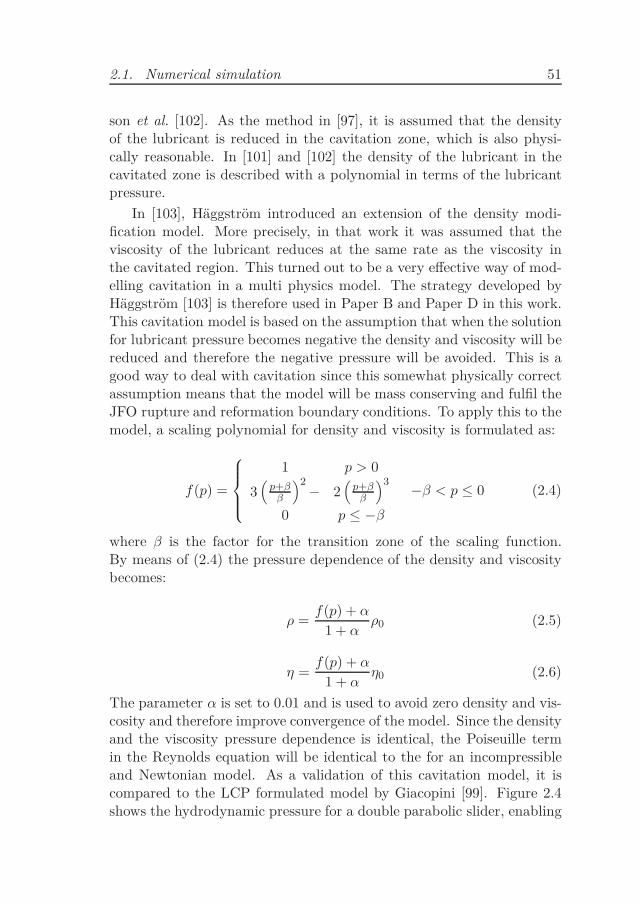
The parameter α is set to 0.01 and is used to avoid zero density and vis-cosity and therefore improve convergence of the model. Since the densityand the viscosity pressure dependence is identical, the Poiseuille termin the Reynolds equation will be identical to the for an incompressibleand Newtonian model. As a validation of this cavitation model, it iscompared to the LCP formulated model by Giacopini [99]. Figure 2.4shows the hydrodynamic pressure for a double parabolic slider, enabling
52 Chapter 2. Method
0 50 100 150 200 250
0
0.5
1
1.5
2
2.5
Slider width (µm)
Pre
ssur
e (M
Pa)
/ F
ilm th
ickn
ess
(µm
)
Häggström model pressureLCP model pressureSlider geometry
Figure 2.4: Comparison of the pressure solutions obtained with the LCPformulated model and the Häggström model, for a double parabolic sliderbearing.
comparison between the two models. The sliding velocity was set to 10m/s, the dynamic viscosity was set to 0.01 Pa·s and the β-parameter wasset to 2 · 105. It can be seen that the Häggström model gives the samesolution as the LCP model in the region where no cavitation occurs.The Häggström model allows for small negative pressure to occur in thecavitated zone but it still fulfils mass continuity, as it produce the samepressure increase under the second parabola as under the first one. Ifthese negative pressures are discarded when equating the load balance,the model provides a highly accurate solution to the cavitation problem.It should be noted, that if the β-parameter is set to a lower value, thenthe magnitude of the negative pressures will be reduced, but this willalso compromise the convergence of the numerical solution procedure.The influence of the β-parameter on the pressure solution is discussedin detail in Paper B.
2.1. Numerical simulation 53
2.1.4 Mixed lubrication
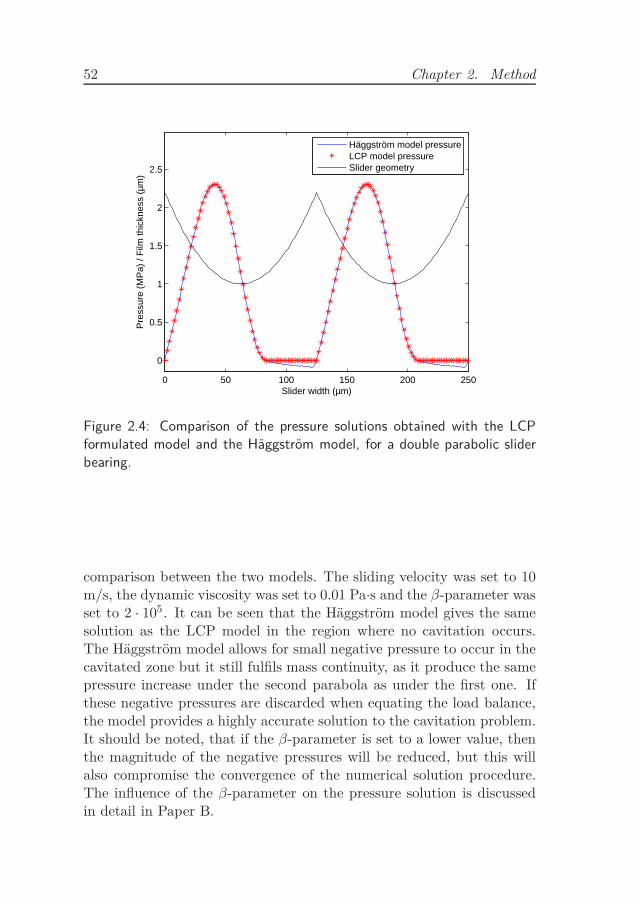
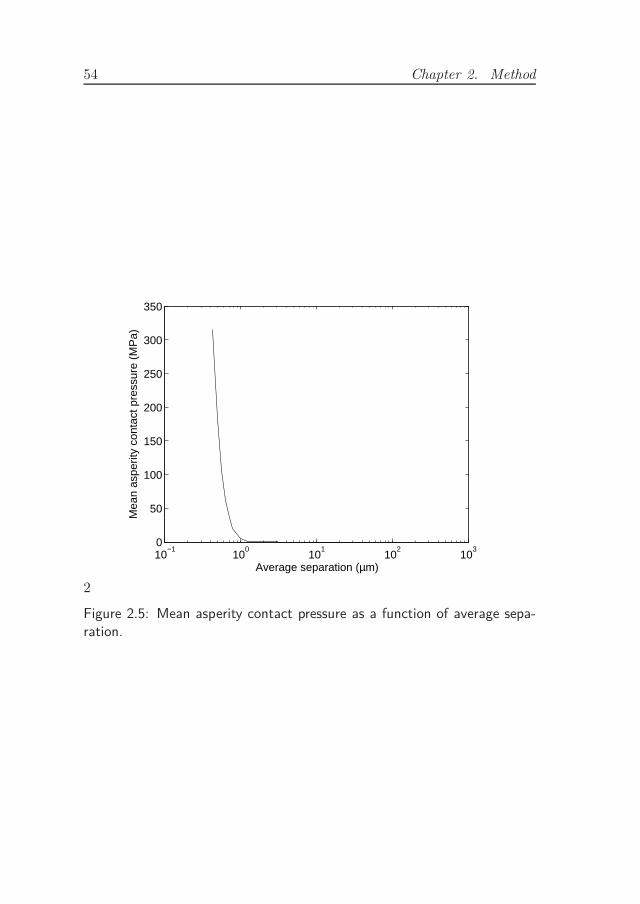
Since mechanical contact caused by direct asperity interaction betweenthe surfaces will occur during piston ring - cylinder liner lubricationthere is a need to include a load sharing model for the load carried bythe hydrodynamic- and the asperity contact pressure. The Luleå MixedLubrication Model employed in this work includes a Boundary Elementcontact Model (BEM) for calculating the asperity contact pressure. Thismodel is based on Boussinesq-Cerruti elastic half-space theory and in-clude an linear elastic-perfectly plastic material model. The input tothis model is the same surface topography measurement as for the cor-rection factors in the modified Reynolds equation. Since the contactmodel takes real surface topography into consideration, there is no needto characterise the surface with average asperity parameters, which isthe way it is done in piston ring simulation models, implementing loadsharing by means of a Greenwood-Trip type of asperity model. The out-put of the model is a contact stiffness curve as a function of the averageinterfacial separation, h. A typical contact stiffness curve for a cylinderliner surface against a perfectly flat surface can be seen in Figure 2.5. Inreality, the piston ring surface is much smoother than the liner and thissingle sided roughness type of configuration is therefore used throughoutthis work.
2.1.5 Friction
Assuming the thin film approximation to be valid, the total amount ofhydrodynamic friction can be calculated as:
F =
ˆ
Ω
h
2
∂p
∂x+
ηU
hdA, (2.7)
where Ω is the integration domain and A is the area of the domain.
The LMLM model builds on the assumption that the componentgeometry scale and the surface topography scale are separable. In otherwords, it is a so-called two-scale model where the global scale representsthe component geometry and the local scale the surface topography. Inthis case the hydrodynamic friction is modelled by:
Fh =
ˆ
Ω
(
h
2− d11
)
∂p
∂x+ ηU
(
1
h+ 6c11
)
dA, (2.8)
54 Chapter 2. Method
10−1
100
101
102
103
0
50
100
150
200
250
300
350
Average separation (µm)
Mea
n as
perit
y co
ntac
t pre
ssur
e (M
Pa)
2
Figure 2.5: Mean asperity contact pressure as a function of average sepa-ration.
2.1. Numerical simulation 55
where c11 and d11 are two (of the earlier mentioned) correction factorsfor hydrodynamic friction calculated with the LMLM.
The boundary friction component is for most of the stroke, as will bedetailed below, calculated by multiplying a boundary friction coefficientµb with the integrated contact pressure, Pc. Since the ring is free tomove axially in the ring groove the reversal zone makes it difficult to findconvergence for the load balance. If the half Sommerfeld assumption isapplied instead of the Häggström model, the complexity of the modelis still low enough to achieve a converged load balance. But in order toinclude the more physically correct JFO boundary condition a relaxationof the friction force around the reversal zone turned out to be necessary.More precisely it was found that by introducing a scaling of the boundaryfriction force close to the reversal zone, convergence could be achievedwith the JFO rupture and reformation boundary conditions. A similartechnique is used in the EXCITE Power Unit software developed byAVL [104]. In the present model a parameter ulim is introduced tospecify in which piston speed interval the boundary friction componentshould be scaled. In terms of the ulim parameter the scaling functionfor the boundary friction is formulated as:
g(U) =
1U
ulim
|U | > ulim
|U | 6 ulim
. (2.9)
By means of g(U) the boundary friction can be calculated as:
Fc = g(U) · µb
ˆ
Ω
PcdA, (2.10)
where the boundary coefficient of friction µb is set to 0.1 in this study.The scaling function g will affect the dynamics of the ring close to re-versal since it affects the forces on the ring there. The motion patternof the ring is however not lost and the friction estimation is not affectedother than by the scaling itself. Fortunately, this has a negligible effecton the frictional power loss. The effect of the scaling g is discussed indetail in Paper B.
2.1.6 Forces acting on the ring
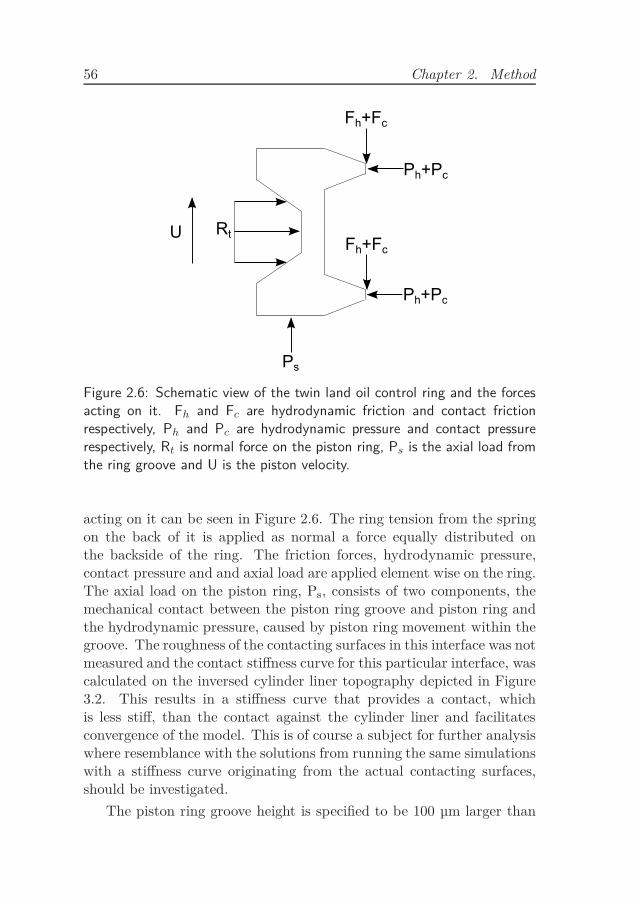
In Paper A and Paper B in this work the full cross section of the TLOCRis modelled. A schematic view of the ring cross section and the forces
56 Chapter 2. Method
U Rt
Fh+Fc
Fh+Fc
Ph+Pc
Ph+Pc
Ps
Figure 2.6: Schematic view of the twin land oil control ring and the forcesacting on it. Fh and Fc are hydrodynamic friction and contact frictionrespectively, Ph and Pc are hydrodynamic pressure and contact pressurerespectively, Rt is normal force on the piston ring, Ps is the axial load fromthe ring groove and U is the piston velocity.
acting on it can be seen in Figure 2.6. The ring tension from the springon the back of it is applied as normal a force equally distributed onthe backside of the ring. The friction forces, hydrodynamic pressure,contact pressure and and axial load are applied element wise on the ring.The axial load on the piston ring, Ps, consists of two components, themechanical contact between the piston ring groove and piston ring andthe hydrodynamic pressure, caused by piston ring movement within thegroove. The roughness of the contacting surfaces in this interface was notmeasured and the contact stiffness curve for this particular interface, wascalculated on the inversed cylinder liner topography depicted in Figure3.2. This results in a stiffness curve that provides a contact, whichis less stiff, than the contact against the cylinder liner and facilitatesconvergence of the model. This is of course a subject for further analysiswhere resemblance with the solutions from running the same simulationswith a stiffness curve originating from the actual contacting surfaces,should be investigated.
The piston ring groove height is specified to be 100 µm larger than
2.1. Numerical simulation 57
the piston ring, meaning that the piston ring will be free to move insidethe groove only restricted in axial direction by the ring groove contact.The axial gap between the piston and piston ring is assumed to befilled with oil and by solving the Reynolds equation for the squeeze inthis interface the viscous damping in the contact is accounted for. Thenegative pressures encountered when the ring is moving away from thegroove are neglected and only the pressures from compression of the oilare considered. This damping is required to achieve a converged solutionof the model close to reversal zone. Including the viscous damping inthe axial contact between the piston ring and the piston groove alsomakes the model more physically correct. Since the oil control ring ina HDDE is typically supplied with a constant oil spray from the crankcase, the assumption that the gap is fully filled, is assumed to be correctfor the reversal of the ring at BDC. At TDC this assumption might notbe completely valid but it is believed that there is a substantial amountof oil in the contact to make the assumption reasonable. Friction in theaxial interface with respect to radial motion of the ring is not consideredin the model.
2.1.7 Lubricant properties
The lubricant viscosity is an important parameter for the hydrodynamicpressure generation. The temperature of the cylinder liner is varyingthroughout the stroke and will therefore affect the viscosity of the lubri-cant. The temperature of the lubricant in the contact is assumed to bethe same as the liner temperature at the specific stroke position. Theviscosity is modelled with the well-known Vogel equation which describesthe temperature viscosity dependence as:
η0 = η00 · exp
(
Bt
T0 + T
)
, (2.11)
where η00, Bt and T0 are oil specific parameters and T is the lubricanttemperature.
2.1.8 Boundary conditions
The boundary conditions for the pressure are constant, zero, throughoutthe stroke on all of the TLOCR boundaries.
The ring lands are assumed to be fully flooded at all time due to theconstant supply of oil from the crank case.
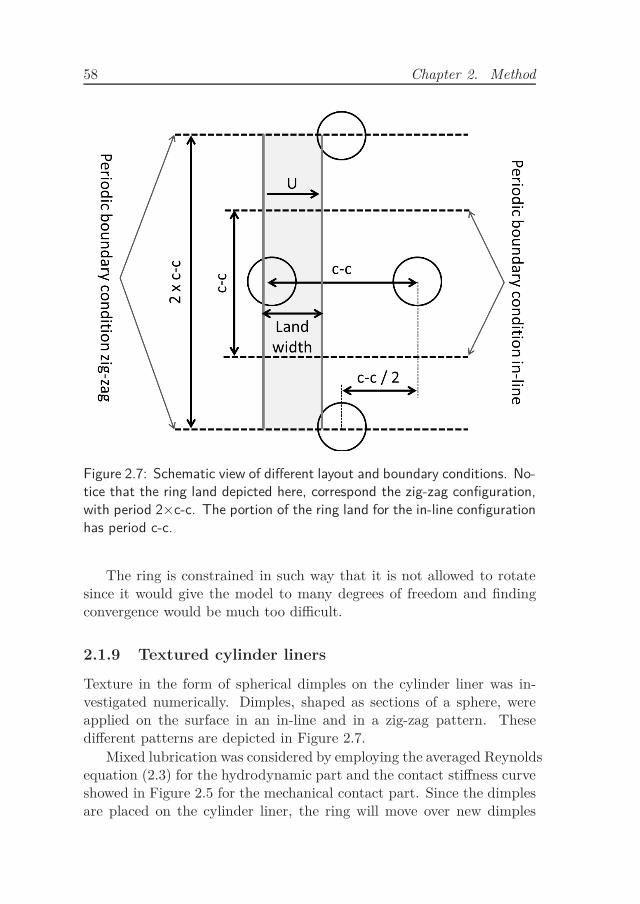
58 Chapter 2. Method
Figure 2.7: Schematic view of different layout and boundary conditions. No-tice that the ring land depicted here, correspond the zig-zag configuration,with period 2×c-c. The portion of the ring land for the in-line configurationhas period c-c.
The ring is constrained in such way that it is not allowed to rotatesince it would give the model to many degrees of freedom and findingconvergence would be much too difficult.
2.1.9 Textured cylinder liners
Texture in the form of spherical dimples on the cylinder liner was in-vestigated numerically. Dimples, shaped as sections of a sphere, wereapplied on the surface in an in-line and in a zig-zag pattern. Thesedifferent patterns are depicted in Figure 2.7.
Mixed lubrication was considered by employing the averaged Reynoldsequation (2.3) for the hydrodynamic part and the contact stiffness curveshowed in Figure 2.5 for the mechanical contact part. Since the dimplesare placed on the cylinder liner, the ring will move over new dimples
2.2. Experimental test development 59
continuously and this will cause dynamical effects to be generated. Afully time dependent analysis considering the dynamic effects generatedby the texture, is therefore, required. Mass conserving cavitation wasimplemented by using the Häggström model described earlier. Motionin radial direction of the ring section was also considered. Inertia inradial direction was implemented by expressing the load balance as:
W = m · z +
¨
Ω
(p + Pc) dA, (2.12)
where W is the applied load, m is the ring section mass and z is the ringacceleration in radial direction. In (2.12) Pc = Pc(x, y) is the asperitycontact pressure and p = p(x, y) is the oil film pressure. These quan-tities are integrated over the computational domain, for the ring landsection, Ω. If the ring speed is constant, the transients caused as thering passes the dimple pattern will, dependent on the inertia, after sometime turn into a periodic time variation reflected in pressure, film thick-ness, friction and other dependent variables of the model. To this end,the simulations were run until the ring had passed enough of dimples forthe pressure solution to exhibit repetitive behaviour, up to a specifiedtolerance. Since the focus in this work is effect on friction losses, close totypical mid-stroke speeds were investigated. Dimples imprinted near tothe reversal zones could be interesting for effects associated with wear,but it will introduce risk of increased oil consumption and because ofthe low impact it would have on friction power loss, it is also outsidethe scope of this work.
2.2 Experimental test development
In order to run experiments at realistic engine speed with standardproduction components and for validation of simulation models, an ex-perimental test was developed. The test method was designed fromscratch, meaning that the equipment first had to be designed and built.It was known that the typical component test-rigs operate at a ratherlow speed. Because of the vibration from inertia causing noise in thesignal at high speed, much of the design focuses on low vibration crankdevice. An inline six cylinder engine from a passenger car was selectedbecause of this. A schematic view of the test-rig can be seen in Figure2.8. On one of the pistons of the base crank device a rod was fitted
60 Chapter 2. Method
where the holder for the piston rings subjected to testing can be fitted.A linear bearing was implemented as a guide for the rod ensuring thatonly the piston rings will be in contact with the cylinder liner. On theother five pistons, balancing masses were placed to compensate for themass of the piston ring holder and it’s connecting rod. The cylinderliner was mounted on and supported by piezo electric load cells, thusmimicking the floating liner technique for measuring friction. The otherend of the load cell was connected to a foundation built around the basecrank device. Two heating elements clamped around the circumferencewas mounted to be able to heat the cylinder liner. Thermocouples wasmounted on three, equally spaced, circumferential positions of the cylin-der liner so that temperature could be monitored and regulated. On eachof the three circumferential positions three thermocouples were mountedat different axial positions, close to TDC, mid-stroke and BDC, makingit a total of nine thermocouples on the liner. The oil was supplied tothe test PRCL via a separate oil pump from underneath the piston ringsthrough oil nozzles mimicking the supply in an actual engine. This oilwas heated in a separate tank regulated by measuring temperature justbefore it exits the afore mentioned oil nozzles. The oil is then gravity fedback to the heated oil tank and recirculated in the system. The crankshaft is driven by an electric motor via a tire coupling and the crankangle was monitored with an angular position sensor. The software fortemperature control and data sampling was written in LabView. Animage of the actual test-rig can be seen in Figure 2.9.
Since the test-rig is motored and the cylinder liner is open to theatmosphere there are no gases loading on any of the piston rings. All ofthe force which loads the piston rings against the cylinder liner comesfrom the internal spring force from clamping the rings. For the oil controlring this is close to the real operating condition since it sees low amountor no gas loading in operation. For the two compression rings this is farfrom the real operating condition close to TDC during the compressionstroke leading to the expansion stroke. However, since the large amountsof gas loading occur close to TDC, at low speed and only during part ofthe compression and expansion stroke an indication of effect on powerloss for these components could still be found to some extent. Thelow influence on friction power by load on the engine was stated byHoshi et al. [8], who used a numerical tool and found small differences infriction power loss when comparing motored pressure less conditions tofired conditions. The same conclusion regarding similar friction power
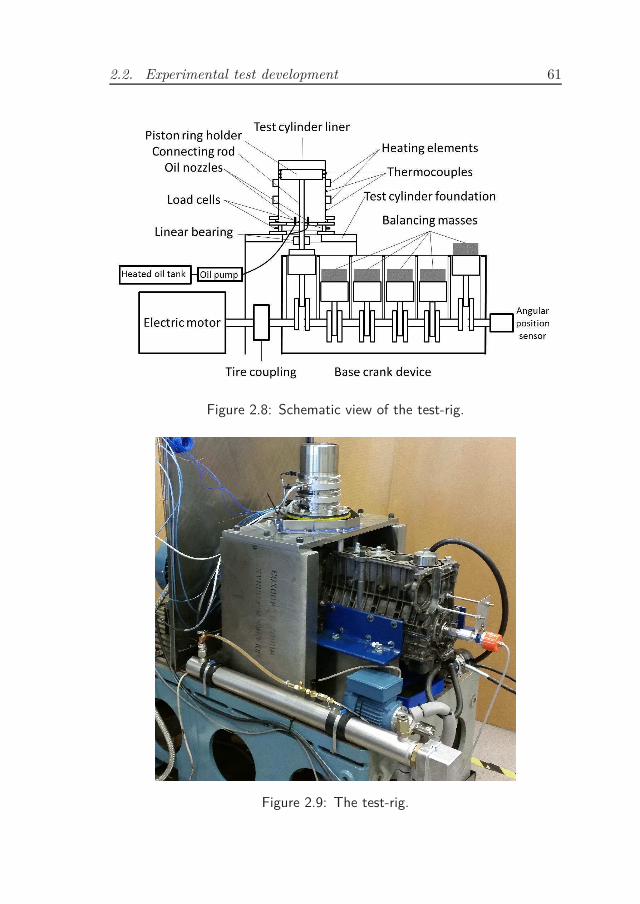
2.2. Experimental test development 61
Figure 2.8: Schematic view of the test-rig.
Figure 2.9: The test-rig.
62 Chapter 2. Method
loss in motored pressure less condition and fired condition was foundexperimentally with motored and fired engine tests by both Deuss et
al. [68] and Allmaier et al. [69]. It should however be noted that heatfrom the combustion contributed to reduction of hydrodynamic lossesin the fired tests which was part of the similarity when comparing theresults to the motored tests.
Chapter 3
Results
This chapter presents a short summary of selected results which arepresented fully in the appended papers. In order to make it easier todistinguish between them, the numerical simulation results and experi-mental results has been separated into different sections.
3.1 Numerical simulation results
This section describes the results found from the numerical simulationpart of this work. First, the inputs and results for the full cross sec-tion models are described. Then the results found with the model fortextured cylinder liner surfaces are shown.
3.1.1 Model inputs for full cross section models
For all of the results presented in Paper A and B where the full crosssection of the TLOCR was investigated, the same cylinder liner temper-ature variation was used. Figure 3.1 shows the temperature as functionof stroke position. The lowest temperature is located around mid-stroke,this is because of the water cooling jacket being located in this region.The ring lands are 250 µm wide with a parabolic profile and has a changein height of 1.2 µm, this profile was showed earlier in Figure 2.2.
The engine parameters used for all simulations presented here canbe seen in Table 3.1.
The correction factors and the stiffness curve for contact pressureare calculated on the plateau for a surface measurement from an actualcylinder liner surface, seen in Figure 3.2.
63
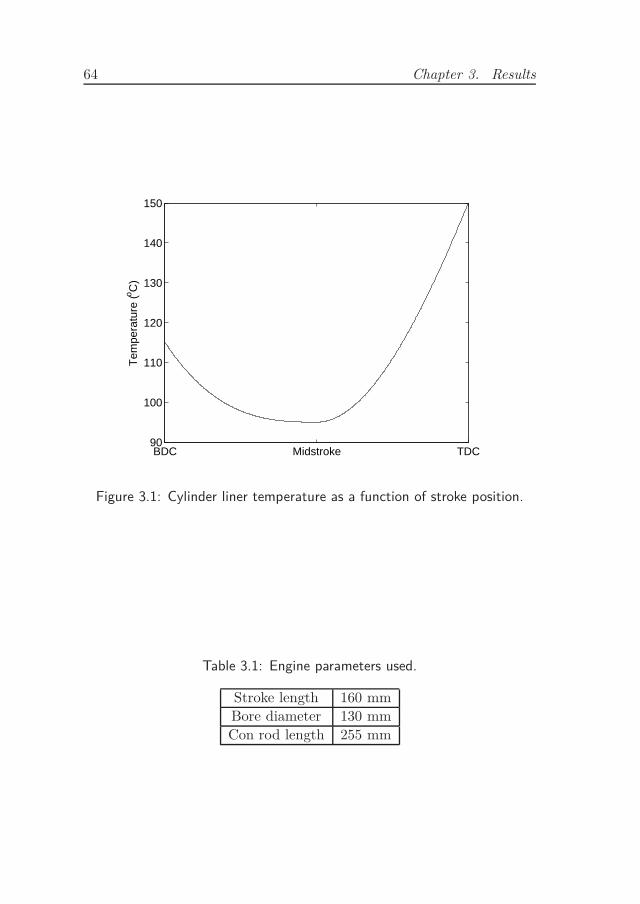
64 Chapter 3. Results
BDC Midstroke TDC90
100
110
120
130
140
150
Tem
pera
ture
(o C)
Figure 3.1: Cylinder liner temperature as a function of stroke position.
Table 3.1: Engine parameters used.
Stroke length 160 mm
Bore diameter 130 mm
Con rod length 255 mm
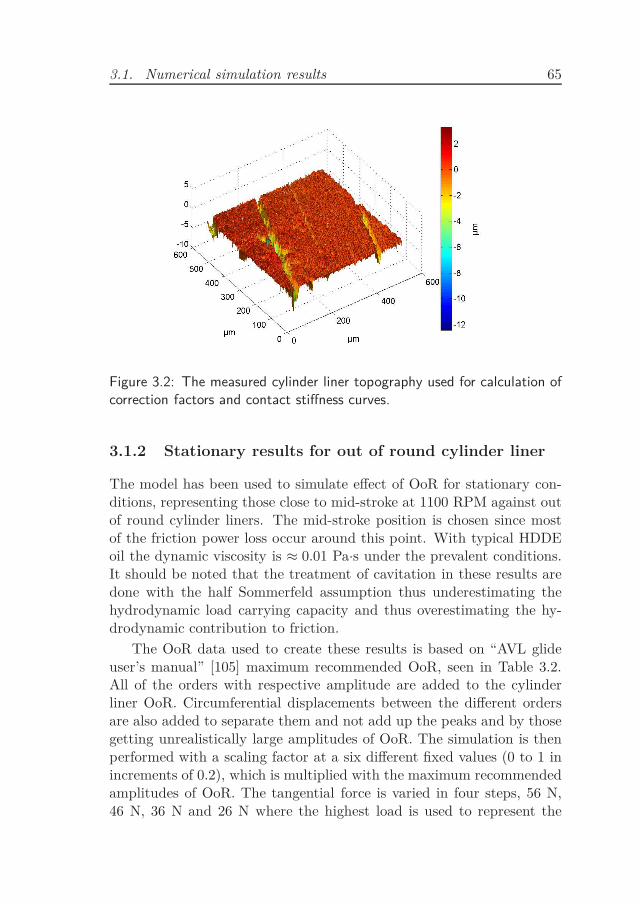
3.1. Numerical simulation results 65
Figure 3.2: The measured cylinder liner topography used for calculation ofcorrection factors and contact stiffness curves.
3.1.2 Stationary results for out of round cylinder liner
The model has been used to simulate effect of OoR for stationary con-ditions, representing those close to mid-stroke at 1100 RPM against outof round cylinder liners. The mid-stroke position is chosen since mostof the friction power loss occur around this point. With typical HDDEoil the dynamic viscosity is ≈ 0.01 Pa·s under the prevalent conditions.It should be noted that the treatment of cavitation in these results aredone with the half Sommerfeld assumption thus underestimating thehydrodynamic load carrying capacity and thus overestimating the hy-drodynamic contribution to friction.
The OoR data used to create these results is based on “AVL glideuser’s manual” [105] maximum recommended OoR, seen in Table 3.2.All of the orders with respective amplitude are added to the cylinderliner OoR. Circumferential displacements between the different ordersare also added to separate them and not add up the peaks and by thosegetting unrealistically large amplitudes of OoR. The simulation is thenperformed with a scaling factor at a six different fixed values (0 to 1 inincrements of 0.2), which is multiplied with the maximum recommendedamplitudes of OoR. The tangential force is varied in four steps, 56 N,46 N, 36 N and 26 N where the highest load is used to represent the
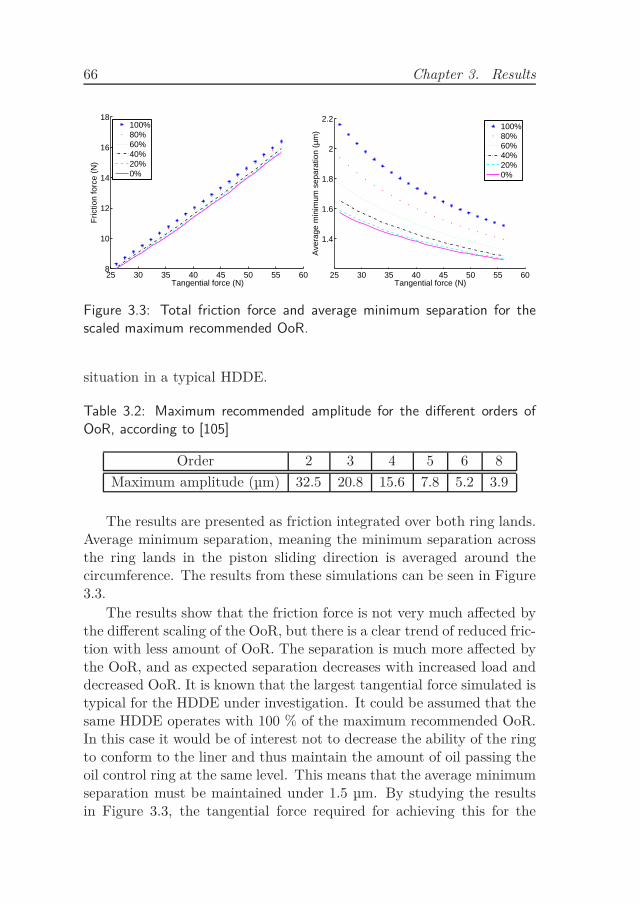
66 Chapter 3. Results
25 30 35 40 45 50 55 608
10
12
14
16
18
Tangential force (N)
Fric
tion
forc
e (N
)
100%80%60%40%20%0%
25 30 35 40 45 50 55 60
1.4
1.6
1.8
2
2.2
Tangential force (N)
Ave
rage
min
imum
sep
arat
ion
(µm
)
100%80%60%40%20%0%
Figure 3.3: Total friction force and average minimum separation for thescaled maximum recommended OoR.
situation in a typical HDDE.
Table 3.2: Maximum recommended amplitude for the different orders ofOoR, according to [105]
Order 2 3 4 5 6 8
Maximum amplitude (µm) 32.5 20.8 15.6 7.8 5.2 3.9
The results are presented as friction integrated over both ring lands.Average minimum separation, meaning the minimum separation acrossthe ring lands in the piston sliding direction is averaged around thecircumference. The results from these simulations can be seen in Figure3.3.
The results show that the friction force is not very much affected bythe different scaling of the OoR, but there is a clear trend of reduced fric-tion with less amount of OoR. The separation is much more affected bythe OoR, and as expected separation decreases with increased load anddecreased OoR. It is known that the largest tangential force simulated istypical for the HDDE under investigation. It could be assumed that thesame HDDE operates with 100 % of the maximum recommended OoR.In this case it would be of interest not to decrease the ability of the ringto conform to the liner and thus maintain the amount of oil passing theoil control ring at the same level. This means that the average minimumseparation must be maintained under 1.5 µm. By studying the resultsin Figure 3.3, the tangential force required for achieving this for the
3.1. Numerical simulation results 67
Table 3.3: The tangential force required to maintain an average separationof 1.5 µm and the corresponding friction force with the different scaling ofthe maximum recommended OoR.
Scaling 100% 80% 60% 40% 20% 0%
Required tangential force (N) 56 47.7 40.7 35.3 32 31
Total friction force (N) 16.4 13.9 11.9 10.4 9.4 9.2
different scaling of the maximum recommended OoR can be extracted.By studying the results for friction force it can be seen how much thisreduction of tangential force could decrease friction. In Table 3.3 a com-pilation of the possible friction reduction by OoR reduction is shown.Even though the numbers predicted with the model might not be exactit shows that the model captures the expected trend and also that it canbe beneficial to have low amount of OoR.
3.1.3 Implementation of cavitation and full engine cycles
The cavitation model employed for the simulation of full engine cyclesis, described in Section 2.1.3. It include the factor for the transition zoneβ, which needs to be decided since it will affect the results. Accordingto the definition in (2.4), an as low value on the β-parameter is wantedas this will lead to the most accurate solution. However, a low valueon the β-parameter will make it harder for the model to converge andtherefore a trade-off between accuracy and stability has to be made.To illustrate the influence of the β-parameter, two stationary conditionswere investigated, i.e., one at mid-stroke and one close to the reversalzone.
For a reduction of the computational time the ring geometry is re-duced to only a small segment of the ring with periodic boundary condi-tions thus reducing the problem from 3D to 2D, allowing for applicationof the 1D Reynolds equation. The results from this parameter study,where β was varied over four orders of magnitude, from 103 to 107, canbe seen in Figure 3.4. The accuracy in the predicted load was mea-sured as the percentual difference between the load predicted for a givenβ-value and the load predicted for the lowest β-value that rendered aconverged solution. It can be seen that a low value of the β-parameteris more important close to reversal zone than at the mid-stroke posi-tion. This is because the total load carrying capacity is lower around
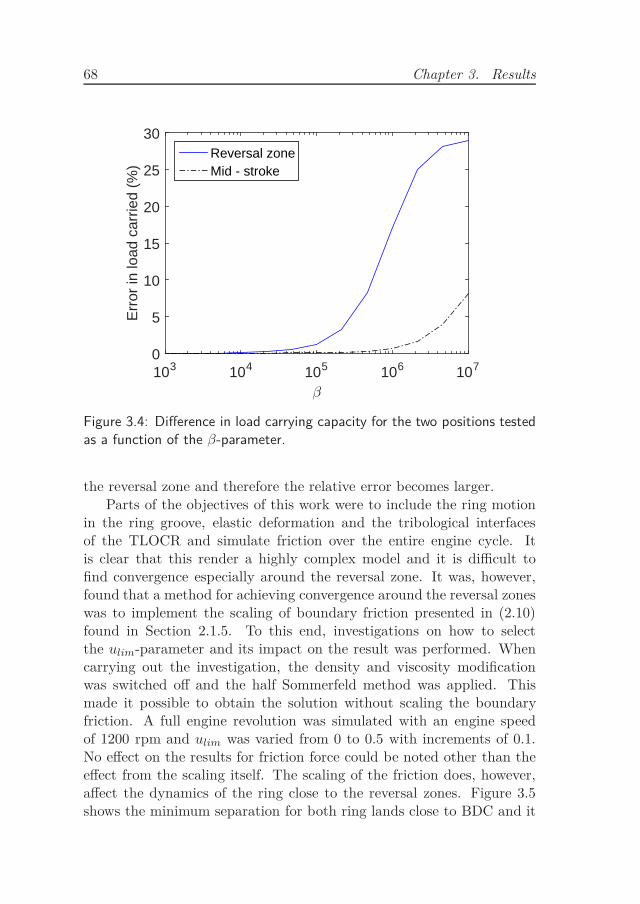
68 Chapter 3. Results
β
103 104 105 106 107
Err
or in
load
car
ried
(%)
0
5
10
15
20
25
30Reversal zoneMid - stroke
Figure 3.4: Difference in load carrying capacity for the two positions testedas a function of the β-parameter.
the reversal zone and therefore the relative error becomes larger.
Parts of the objectives of this work were to include the ring motionin the ring groove, elastic deformation and the tribological interfacesof the TLOCR and simulate friction over the entire engine cycle. Itis clear that this render a highly complex model and it is difficult tofind convergence especially around the reversal zone. It was, however,found that a method for achieving convergence around the reversal zoneswas to implement the scaling of boundary friction presented in (2.10)found in Section 2.1.5. To this end, investigations on how to selectthe ulim-parameter and its impact on the result was performed. Whencarrying out the investigation, the density and viscosity modificationwas switched off and the half Sommerfeld method was applied. Thismade it possible to obtain the solution without scaling the boundaryfriction. A full engine revolution was simulated with an engine speedof 1200 rpm and ulim was varied from 0 to 0.5 with increments of 0.1.No effect on the results for friction force could be noted other than theeffect from the scaling itself. The scaling of the friction does, however,affect the dynamics of the ring close to the reversal zones. Figure 3.5shows the minimum separation for both ring lands close to BDC and it
3.1. Numerical simulation results 69
can be seen that there is a big spike for the case where ulim = 0. This isbecause of the sudden change in force direction at reversal. This spikeis not seen for the cases where the boundary friction is scaled and is notsomething that would occur in a real engine during operation. Actually,in a real engine, the speed of the ring during reversal is lower than thespeed of the piston itself, since the ring moves within the clearance inthe piston ring groove. This suggests that a value for ulim > 0 is abetter physical representation of real engine conditions than ulim = 0.A schematic illustration of ring twist, at four intermediate time-stepsduring ring reversal, can be seen in Figure 3.6. The reason for thatthe film thickness drastically changes around the reversal point is thatthe twist of the ring forced by the moment caused by the friction forceand the axial force from the piston ring groove changes direction. Thisis illustrated by boxes 1-2 in 3.6. Since the scaling of the boundaryfriction makes the force direction switch occur over a larger interval thetwist change will start earlier and end later. The bump occurring afterthe reversal of the ring is caused by the sudden moment change on thepiston ring. It is not damped enough due to the low viscosity of theoil in this region, approximately 0.0067 Pa·s at BDC and 0.0036 Pa·sat TDC. The ring is over twisted a small amount (box 3 in Figure 3.6)before it sets against the liner (box 4 in Figure 3.6). It can in Figure3.5 also be noticed that the bump in the film thickness which is positivefor the land that becomes trailing has almost the exact same shape innegative direction for the land that becomes leading after the reversal.This suggests that this is mainly due to twist of the entire ring. Theinternal elastic deformation of the ring is very small for this set up. Thevalue on the ulim-parameter affect this bounce of the piston ring whichneeds to be taken into consideration when studying the reversal zonein detail. However when studying effects on friction loss and oil left onthe liner for the entire cycle this will have an insignificant effect on theresults.
3.1.4 Textured cylinder liners
Dimensions of the land of TLOCR investigated were measured on aproduction component to a width of 150 µm with a curvature of 70 mm.The curvature in the axial direction was symmetric and the radius resultsin an inlet and exit height of 40 nm. Three different sliding speeds wereinvestigated; 5, 7.5 and 10 m/s. The load applied to the ring was kept
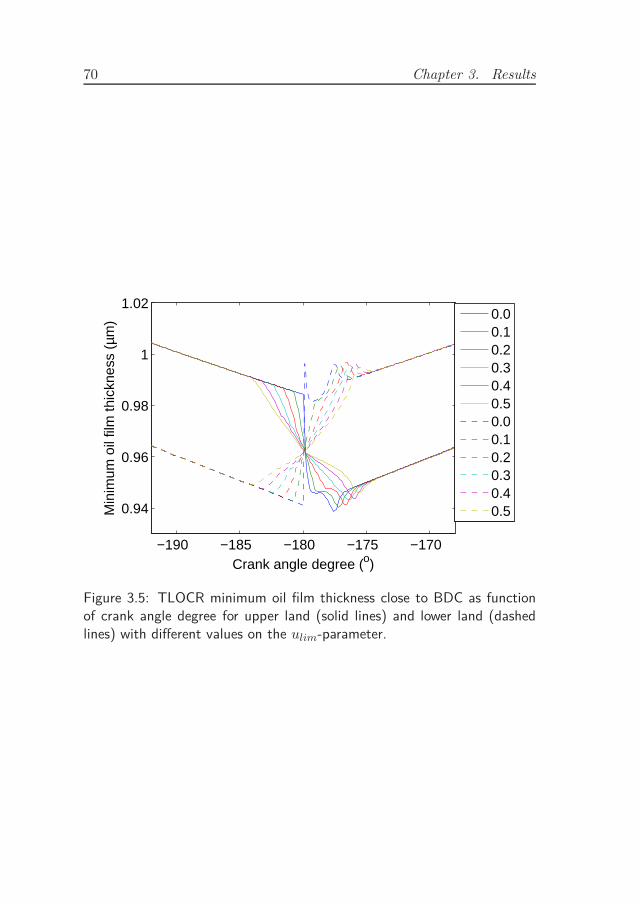
70 Chapter 3. Results
−190 −185 −180 −175 −170
0.94
0.96
0.98
1
1.02
Crank angle degree (o)
Min
imum
oil
film
thic
knes
s (µ
m)
0.00.10.20.30.40.50.00.10.20.30.40.5
Figure 3.5: TLOCR minimum oil film thickness close to BDC as functionof crank angle degree for upper land (solid lines) and lower land (dashedlines) with different values on the ulim-parameter.
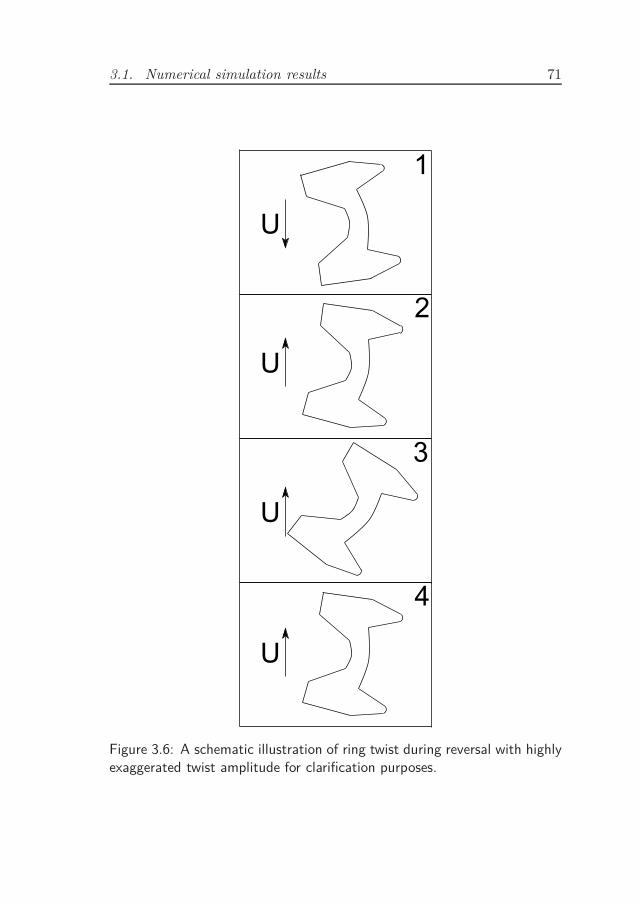
3.1. Numerical simulation results 71
Figure 3.6: A schematic illustration of ring twist during reversal with highlyexaggerated twist amplitude for clarification purposes.
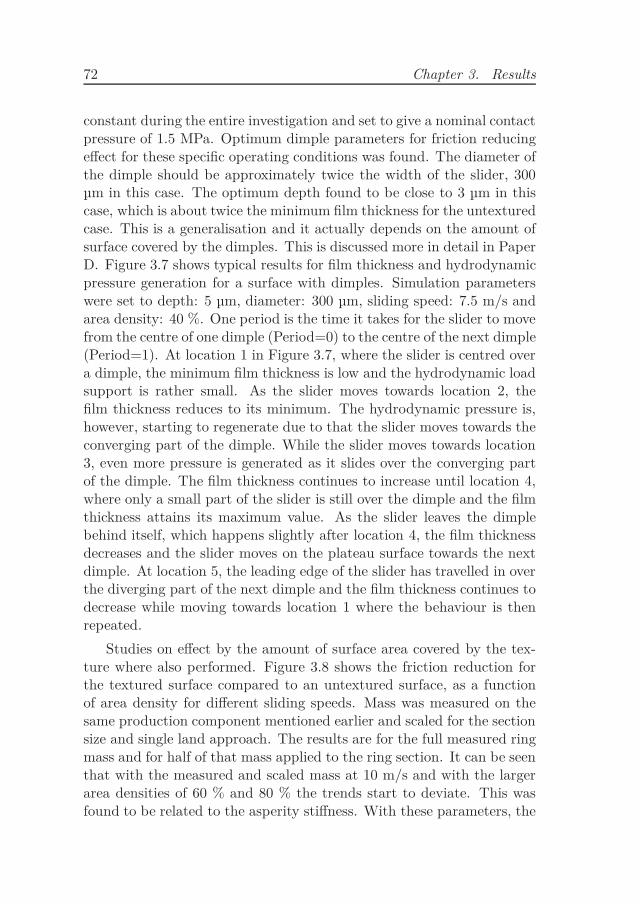
72 Chapter 3. Results
constant during the entire investigation and set to give a nominal contactpressure of 1.5 MPa. Optimum dimple parameters for friction reducingeffect for these specific operating conditions was found. The diameter ofthe dimple should be approximately twice the width of the slider, 300µm in this case. The optimum depth found to be close to 3 µm in thiscase, which is about twice the minimum film thickness for the untexturedcase. This is a generalisation and it actually depends on the amount ofsurface covered by the dimples. This is discussed more in detail in PaperD. Figure 3.7 shows typical results for film thickness and hydrodynamicpressure generation for a surface with dimples. Simulation parameterswere set to depth: 5 µm, diameter: 300 µm, sliding speed: 7.5 m/s andarea density: 40 %. One period is the time it takes for the slider to movefrom the centre of one dimple (Period=0) to the centre of the next dimple(Period=1). At location 1 in Figure 3.7, where the slider is centred overa dimple, the minimum film thickness is low and the hydrodynamic loadsupport is rather small. As the slider moves towards location 2, thefilm thickness reduces to its minimum. The hydrodynamic pressure is,however, starting to regenerate due to that the slider moves towards theconverging part of the dimple. While the slider moves towards location3, even more pressure is generated as it slides over the converging partof the dimple. The film thickness continues to increase until location 4,where only a small part of the slider is still over the dimple and the filmthickness attains its maximum value. As the slider leaves the dimplebehind itself, which happens slightly after location 4, the film thicknessdecreases and the slider moves on the plateau surface towards the nextdimple. At location 5, the leading edge of the slider has travelled in overthe diverging part of the next dimple and the film thickness continues todecrease while moving towards location 1 where the behaviour is thenrepeated.
Studies on effect by the amount of surface area covered by the tex-ture where also performed. Figure 3.8 shows the friction reduction forthe textured surface compared to an untextured surface, as a functionof area density for different sliding speeds. Mass was measured on thesame production component mentioned earlier and scaled for the sectionsize and single land approach. The results are for the full measured ringmass and for half of that mass applied to the ring section. It can be seenthat with the measured and scaled mass at 10 m/s and with the largerarea densities of 60 % and 80 % the trends start to deviate. This wasfound to be related to the asperity stiffness. With these parameters, the
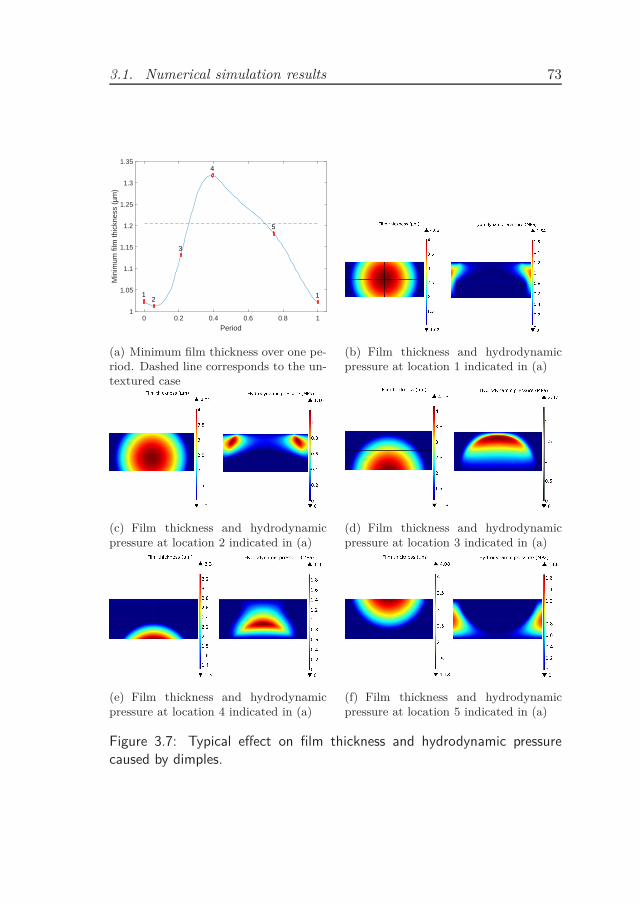
3.1. Numerical simulation results 73
Period0 0.2 0.4 0.6 0.8 1
Min
imum
film
thic
knes
s (µ
m)
1
1.05
1.1
1.15
1.2
1.25
1.3
1.35
12
3
4
5
1
(a) Minimum film thickness over one pe-riod. Dashed line corresponds to the un-textured case
(b) Film thickness and hydrodynamicpressure at location 1 indicated in (a)
(c) Film thickness and hydrodynamicpressure at location 2 indicated in (a)
(d) Film thickness and hydrodynamicpressure at location 3 indicated in (a)
(e) Film thickness and hydrodynamicpressure at location 4 indicated in (a)
(f) Film thickness and hydrodynamicpressure at location 5 indicated in (a)
Figure 3.7: Typical effect on film thickness and hydrodynamic pressurecaused by dimples.
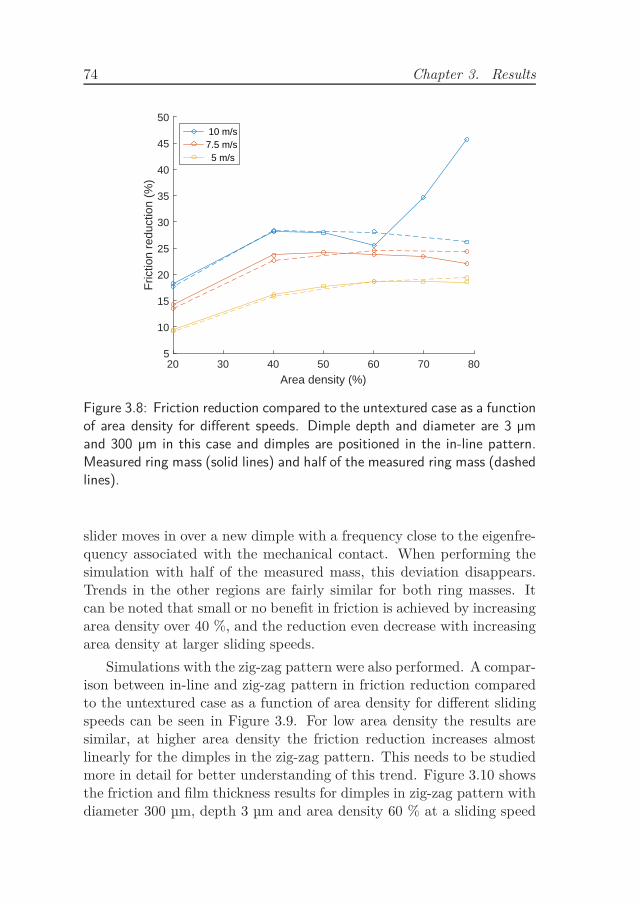
74 Chapter 3. Results
Area density (%)20 30 40 50 60 70 80
Fric
tion
redu
ctio
n (%
)
5
10
15
20
25
30
35
40
45
50 10 m/s7.5 m/s 5 m/s
Figure 3.8: Friction reduction compared to the untextured case as a functionof area density for different speeds. Dimple depth and diameter are 3 µmand 300 µm in this case and dimples are positioned in the in-line pattern.Measured ring mass (solid lines) and half of the measured ring mass (dashedlines).
slider moves in over a new dimple with a frequency close to the eigenfre-quency associated with the mechanical contact. When performing thesimulation with half of the measured mass, this deviation disappears.Trends in the other regions are fairly similar for both ring masses. Itcan be noted that small or no benefit in friction is achieved by increasingarea density over 40 %, and the reduction even decrease with increasingarea density at larger sliding speeds.
Simulations with the zig-zag pattern were also performed. A compar-ison between in-line and zig-zag pattern in friction reduction comparedto the untextured case as a function of area density for different slidingspeeds can be seen in Figure 3.9. For low area density the results aresimilar, at higher area density the friction reduction increases almostlinearly for the dimples in the zig-zag pattern. This needs to be studiedmore in detail for better understanding of this trend. Figure 3.10 showsthe friction and film thickness results for dimples in zig-zag pattern withdiameter 300 µm, depth 3 µm and area density 60 % at a sliding speed
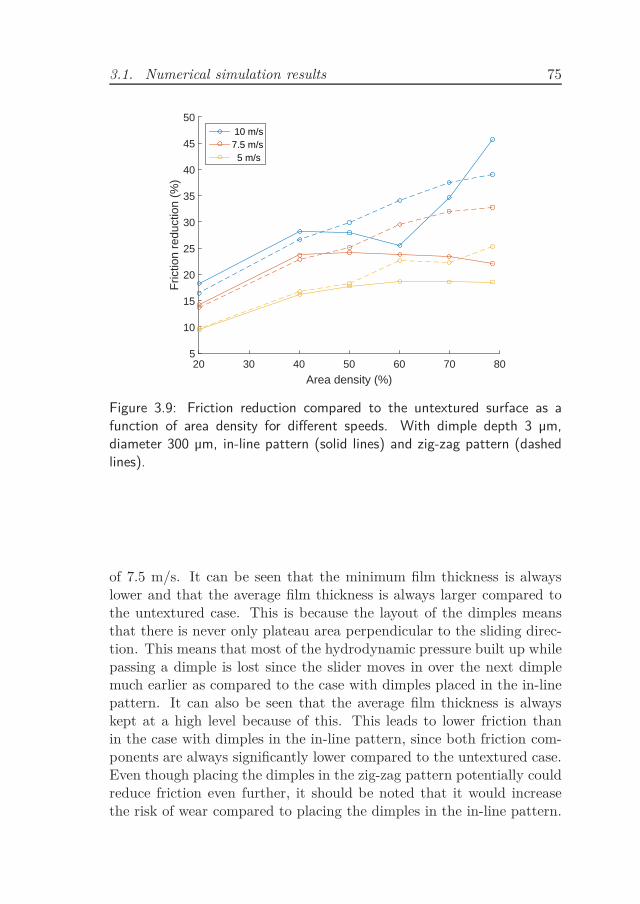
3.1. Numerical simulation results 75
Area density (%)20 30 40 50 60 70 80
Fric
tion
redu
ctio
n (%
)
5
10
15
20
25
30
35
40
45
50 10 m/s7.5 m/s 5 m/s
Figure 3.9: Friction reduction compared to the untextured surface as afunction of area density for different speeds. With dimple depth 3 µm,diameter 300 µm, in-line pattern (solid lines) and zig-zag pattern (dashedlines).
of 7.5 m/s. It can be seen that the minimum film thickness is alwayslower and that the average film thickness is always larger compared tothe untextured case. This is because the layout of the dimples meansthat there is never only plateau area perpendicular to the sliding direc-tion. This means that most of the hydrodynamic pressure built up whilepassing a dimple is lost since the slider moves in over the next dimplemuch earlier as compared to the case with dimples placed in the in-linepattern. It can also be seen that the average film thickness is alwayskept at a high level because of this. This leads to lower friction thanin the case with dimples in the in-line pattern, since both friction com-ponents are always significantly lower compared to the untextured case.Even though placing the dimples in the zig-zag pattern potentially couldreduce friction even further, it should be noted that it would increasethe risk of wear compared to placing the dimples in the in-line pattern.
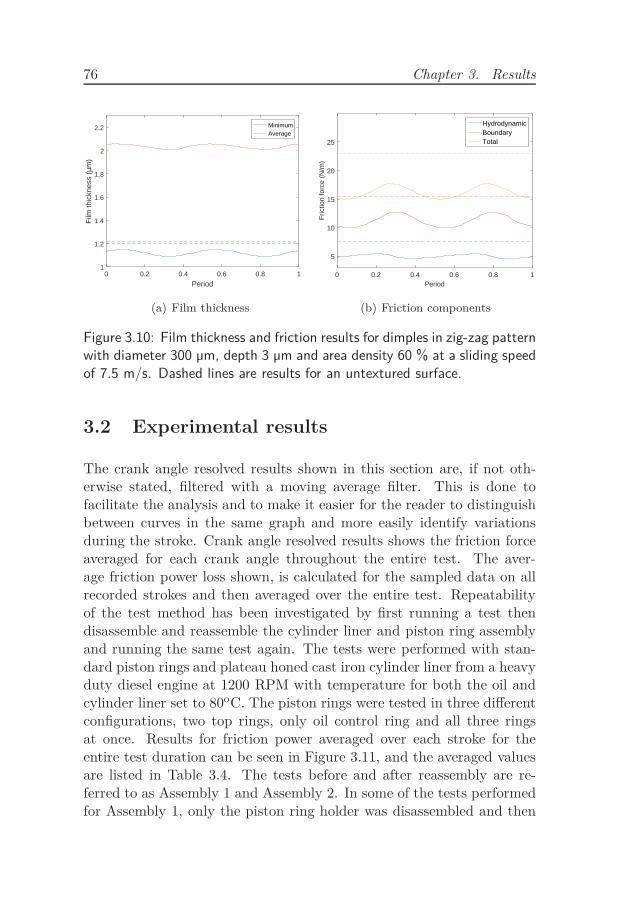
76 Chapter 3. Results
Period0 0.2 0.4 0.6 0.8 1
Film
thic
knes
s (µ
m)
1
1.2
1.4
1.6
1.8
2
2.2 MinimumAverage
(a) Film thickness
Period0 0.2 0.4 0.6 0.8 1
Fric
tion
forc
e (N
/m)
5
10
15
20
25
HydrodynamicBoundaryTotal
(b) Friction components
Figure 3.10: Film thickness and friction results for dimples in zig-zag patternwith diameter 300 µm, depth 3 µm and area density 60 % at a sliding speedof 7.5 m/s. Dashed lines are results for an untextured surface.
3.2 Experimental results
The crank angle resolved results shown in this section are, if not oth-erwise stated, filtered with a moving average filter. This is done tofacilitate the analysis and to make it easier for the reader to distinguishbetween curves in the same graph and more easily identify variationsduring the stroke. Crank angle resolved results shows the friction forceaveraged for each crank angle throughout the entire test. The aver-age friction power loss shown, is calculated for the sampled data on allrecorded strokes and then averaged over the entire test. Repeatabilityof the test method has been investigated by first running a test thendisassemble and reassemble the cylinder liner and piston ring assemblyand running the same test again. The tests were performed with stan-dard piston rings and plateau honed cast iron cylinder liner from a heavyduty diesel engine at 1200 RPM with temperature for both the oil andcylinder liner set to 80oC. The piston rings were tested in three differentconfigurations, two top rings, only oil control ring and all three ringsat once. Results for friction power averaged over each stroke for theentire test duration can be seen in Figure 3.11, and the averaged valuesare listed in Table 3.4. The tests before and after reassembly are re-ferred to as Assembly 1 and Assembly 2. In some of the tests performedfor Assembly 1, only the piston ring holder was disassembled and then
3.2. Experimental results 77
reassembled without removing the cylinder liner from the rig. Thesedifferent set-ups are referred to with an additional index as Assembly1.i, where i describes how many times the piston ring holder has beenreassembled. For the test with only the two top rings the repeatabil-ity was excellent. Actually, it was less than 0.3 % difference in frictionpower in this case. For the tests with only a TLOCR, it can be observedthat two distinct levels of friction power were recorded. While runningassembly 1.2, the friction level switched from low in the beginning tohigh at the end. This most likely has to do with the spring which loadsthe TLOCR against the cylinder liner. It is believed that the springgets stuck in one or several of the lubrication holes or in the ring gapof the TLOCR and therefore does not distribute the load evenly aroundthe circumference. Since the friction increased during the test for As-sembly 1.2 it seems reasonable to assume that the spring was initiallystuck in the TLOCR and then broke free resulting in a more evenly dis-tributed load. If the load is not evenly distributed it could potentiallycause the friction to be high at some sections of the ring contact andvery low in other sections resulting in a total reduction of friction. Withthis assumption the low level friction condition would also let more oilpass the TLOCR since it must have a greater mean separation aroundthe circumference compared to the high friction level. The assumptionis further strengthened when comparing difference in the levels for thetests with all of the rings tested at once. The difference is smaller for thetest with only TLOCR which means that during the low friction levelmore oil is distributed to the two top rings resulting in lower frictionfor those as well. This also indicates that the TLOCR starves the lubri-cation of the two top rings. This is further strengthened by comparingfriction power for tests with all rings at once to summing up the frictionfrom tests in which the rings are tested separately. That is, the frictionfor all rings at once, is actually larger than the sum of the friction foreach ring separately. With the knowledge of the different friction levels,the repeatability of the test-rig itself should be made within the samefriction level. Expected error margin in friction power for tests with onlyTLOCR is therefore 1.3 % and 0.6 % when testing all rings at once.
A number of different components have been tested at various op-erating conditions. Reducing ring tension on the oil control ring couldsignificantly affect the fuel consumption for the engine. A standard pro-duction TLOCR, called Eu6, was compared to another TLOCR withlower ring tension and different land profile, called stepped land. Inter-
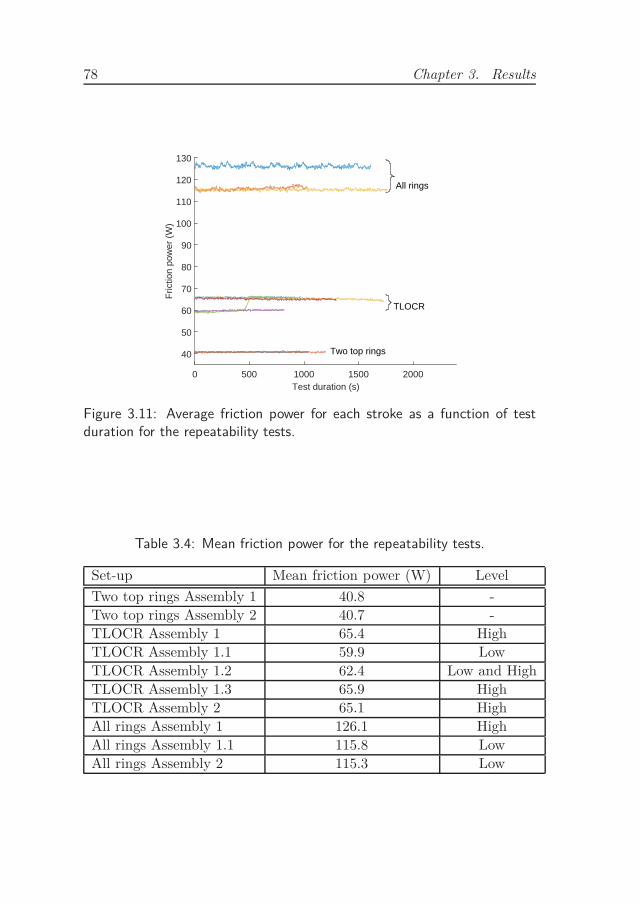
78 Chapter 3. Results
Test duration (s)0 500 1000 1500 2000
Fric
tion
pow
er (
W)
40
50
60
70
80
90
100
110
120
130
All rings
TLOCR
Two top rings
Figure 3.11: Average friction power for each stroke as a function of testduration for the repeatability tests.
Table 3.4: Mean friction power for the repeatability tests.
Set-up Mean friction power (W) Level
Two top rings Assembly 1 40.8 -
Two top rings Assembly 2 40.7 -
TLOCR Assembly 1 65.4 High
TLOCR Assembly 1.1 59.9 Low
TLOCR Assembly 1.2 62.4 Low and High
TLOCR Assembly 1.3 65.9 High
TLOCR Assembly 2 65.1 High
All rings Assembly 1 126.1 High
All rings Assembly 1.1 115.8 Low
All rings Assembly 2 115.3 Low
3.2. Experimental results 79
esting observations were made when running tests with the piston ringsin different configurations. The two compression rings used in thesetests were standard production components for a Eu6 engine. Table 3.5specifies the piston ring types used and ring tension of those. All ofthe piston rings used had been subjected to fired operation in an engineprevious to this testing in order to run them in. The configurationsin which the piston rings were tested together with the measured fric-tion power averaged over the entire test are listed in Table 3.6. Thesetests were run at 80oC with standard 10W30 oil at 900 and 1200 RPMagainst a standard production plasma coated cylinder liner. The cylin-der liner was unused before this test and was run in at low speed, in therig used in this work, until stable friction reading was observed. Figure3.12 shows results for the crank angle resolved friction force averagedover the entire test. Also here the friction power with all of the ringsmounted on the piston ring holder was compared to the sum of the com-ponents from running the two compression rings and the oil control ringindividually. With both oil control rings and at both speeds the sum ofthe components showed less friction than when testing all of the ringsat once. This indicates that the amount of oil supplied to the two com-pression rings is significantly reduced by the oil control ring. When theoil control ring is mounted the compression rings have less oil availableresulting in less hydrodynamic lubrication and therefore larger frictionlosses. The oil retaining ability or amount of starvation provided bydifferent oil control rings can therefore be indicated in this way. Byhaving a good reference like the standard production Eu6 ring pack inthis study, the effect on oil consumption in an actual engine can be indi-cated. As can be noted in the results, the stepped land oil control ringreduced the frictional power loss with close to 50 % at 1200 RPM, likelybecause of the lower ring tension. Comparison and difference betweensum of the components and all of the rings mounted at once can beseen in Table 3.7. The difference for the ring pack with stepped landshows similar values as the ring pack with all Eu6 rings. It should benoted that with larger speed the difference is a bit less for the ring packwith the stepped land. This seems reasonable since the percental reduc-tion in friction was greater at the larger speed. This also indicates thatthe rate of increase in film thickness is larger for the stepped land ring.Nevertheless, the differences are fairly similar at both tested speeds forthe two ring pack and its components. This means that friction lossesfrom the OCR could be reduced significantly, close to halved, with kept
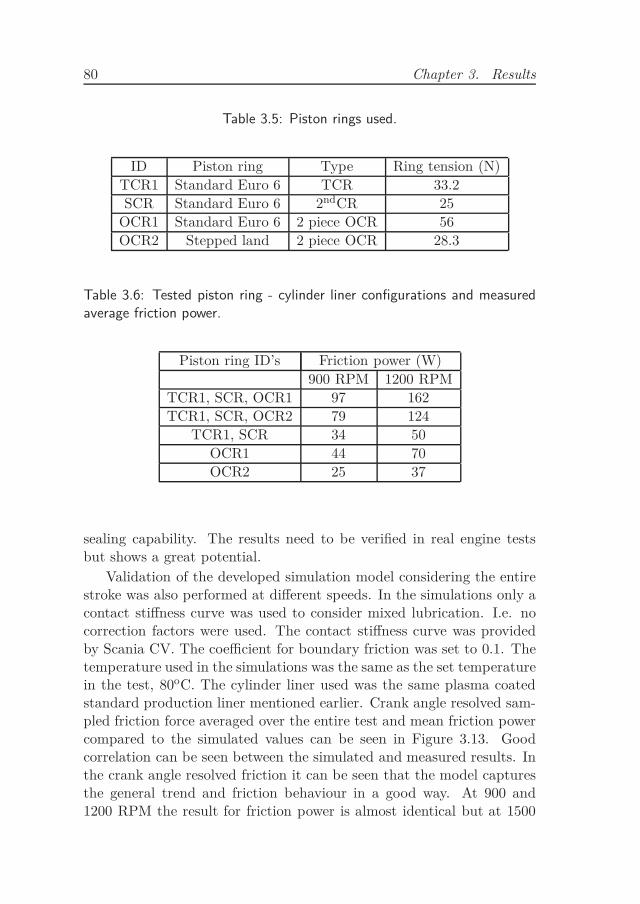
80 Chapter 3. Results
Table 3.5: Piston rings used.
ID Piston ring Type Ring tension (N)
TCR1 Standard Euro 6 TCR 33.2
SCR Standard Euro 6 2ndCR 25
OCR1 Standard Euro 6 2 piece OCR 56
OCR2 Stepped land 2 piece OCR 28.3
Table 3.6: Tested piston ring - cylinder liner configurations and measuredaverage friction power.
Piston ring ID’s Friction power (W)
900 RPM 1200 RPM
TCR1, SCR, OCR1 97 162
TCR1, SCR, OCR2 79 124
TCR1, SCR 34 50
OCR1 44 70
OCR2 25 37
sealing capability. The results need to be verified in real engine testsbut shows a great potential.
Validation of the developed simulation model considering the entirestroke was also performed at different speeds. In the simulations only acontact stiffness curve was used to consider mixed lubrication. I.e. nocorrection factors were used. The contact stiffness curve was providedby Scania CV. The coefficient for boundary friction was set to 0.1. Thetemperature used in the simulations was the same as the set temperaturein the test, 80oC. The cylinder liner used was the same plasma coatedstandard production liner mentioned earlier. Crank angle resolved sam-pled friction force averaged over the entire test and mean friction powercompared to the simulated values can be seen in Figure 3.13. Goodcorrelation can be seen between the simulated and measured results. Inthe crank angle resolved friction it can be seen that the model capturesthe general trend and friction behaviour in a good way. At 900 and1200 RPM the result for friction power is almost identical but at 1500
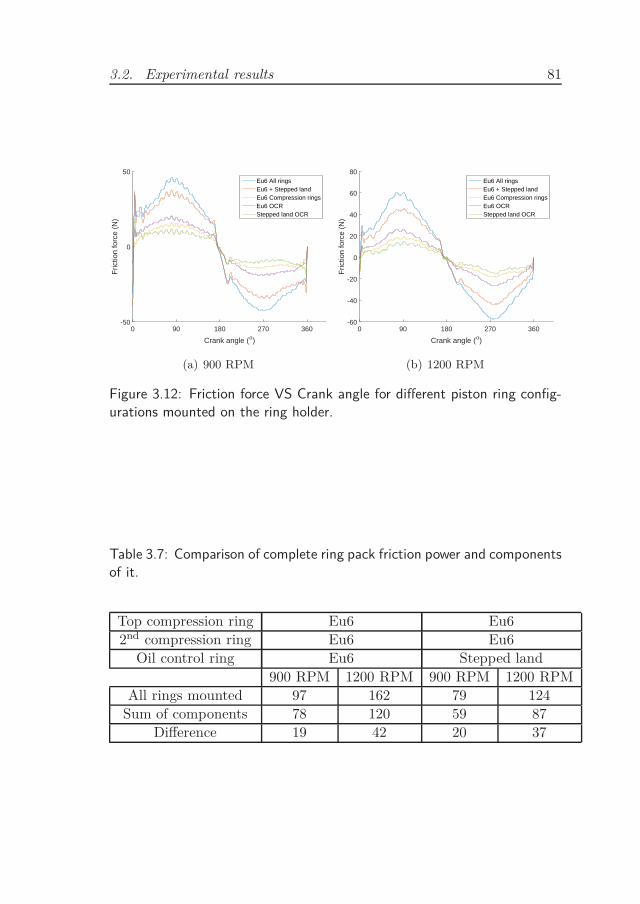
3.2. Experimental results 81
Crank angle (o)
0 90 180 270 360
Fric
tion
forc
e (N
)
-50
0
50Eu6 All ringsEu6 + Stepped landEu6 Compression ringsEu6 OCRStepped land OCR
(a) 900 RPM
Crank angle (o)
0 90 180 270 360
Fric
tion
forc
e (N
)
-60
-40
-20
0
20
40
60
80Eu6 All ringsEu6 + Stepped landEu6 Compression ringsEu6 OCRStepped land OCR
(b) 1200 RPM
Figure 3.12: Friction force VS Crank angle for different piston ring config-urations mounted on the ring holder.
Table 3.7: Comparison of complete ring pack friction power and componentsof it.
Top compression ring Eu6 Eu6
2nd compression ring Eu6 Eu6
Oil control ring Eu6 Stepped land
900 RPM 1200 RPM 900 RPM 1200 RPM
All rings mounted 97 162 79 124
Sum of components 78 120 59 87
Difference 19 42 20 37
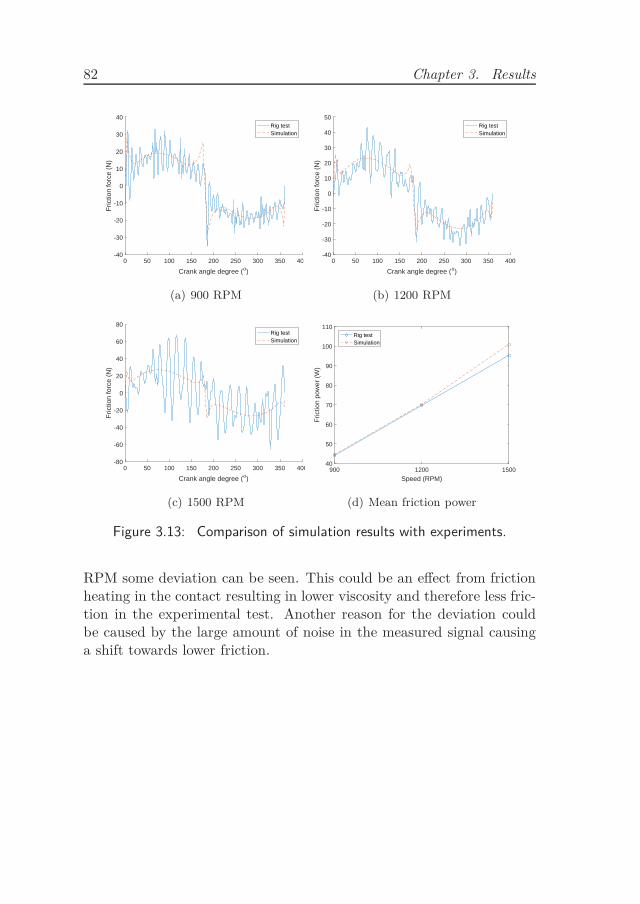
82 Chapter 3. Results
Crank angle degree (o)
0 50 100 150 200 250 300 350 400
Fric
tion
forc
e (N
)
-40
-30
-20
-10
0
10
20
30
40Rig testSimulation
(a) 900 RPM
Crank angle degree (o)
0 50 100 150 200 250 300 350 400
Fric
tion
forc
e (N
)
-40
-30
-20
-10
0
10
20
30
40
50Rig testSimulation
(b) 1200 RPM
Crank angle degree (o)
0 50 100 150 200 250 300 350 400
Fric
tion
forc
e (N
)
-80
-60
-40
-20
0
20
40
60
80Rig testSimulation
(c) 1500 RPM
Speed (RPM)900 1200 1500
Fric
tion
pow
er (
W)
40
50
60
70
80
90
100
110Rig testSimulation
(d) Mean friction power
Figure 3.13: Comparison of simulation results with experiments.
RPM some deviation can be seen. This could be an effect from frictionheating in the contact resulting in lower viscosity and therefore less fric-tion in the experimental test. Another reason for the deviation couldbe caused by the large amount of noise in the measured signal causinga shift towards lower friction.
Chapter 4
Conclusions
The work done in this doctoral thesis includes development and usageof both numerical simulation tools and experimental test equipment.A numerical simulation model for investigation of the effect on frictionlosses associated with out of round cylinder liners was developed. First,a simplified model was developed fully in 3D for stationary conditions.It was found that friction around mid-stroke could be reduced with ap-proximately 40 % by reducing the tangential force of the TLOCR, stillwith kept sealing capability, enabled by reduced OoR.
The complexity of modelling the ring fully in 3D with considerationto elastic deformation, motion inside the ring groove and inertia causedproblems for implementing consideration to mass conserving cavitationand simulation of the full engine cycle. Cavitation was therefore imple-mented with a model not seen in piston ring simulation before. Thismodel showed to be a very effective way of implementing cavitation byfulfilling the JFO boundary conditions as well as mass continuity. Thetrade-off that has to be made in load carrying accuracy and convergencestability of the model has been discussed in the thesis. Simulation ofthe full engine cycle was achieved by implementing a relaxation of theboundary friction forces. The largest influence is close to reversal andmainly moves the locations at which the change in ring twist occur whichis an obvious effect from scaling the forces with different intervals. It canalso be concluded that a small relaxation of boundary friction aroundreversal is more physically correct than not having a scaling at all. Thisis because the ring moves within the clearance of the piston ring grooveduring the reversal of the piston. The scaling was also showed to notaffect the results for friction or separation for most part of the stroke
83
84 Chapter 4. Conclusions
meaning that it is an applicable method to use for studying the effect onfuel consumption. Caution must however be taken when analysing theresults close to reversal zone. Overall this was found as an acceptablemethod for dealing with the convergence issues.
A model investigating cylinder liner with dimple type textures ap-plied to it was also developed and used. Two mechanisms for reductionof friction with textured surfaces were found. Firstly, increased mini-mum separation between the surfaces caused by hydrodynamic pressureincrease which results in reduction of both boundary and hydrodynamicfriction. Secondly, enforced average separation by the removal of plateauarea, which is an effect from a dimpled surface. This can lead to locallyincrease in friction on the small amount of plateau area left, however, itcan result in total reduction of friction because of the absence of plateauarea where the friction is generated. Optimum texture parameters forfriction reduction were found for typical TLOCR situated in a HDDE.Optimum diameter for friction was found to be close to twice the widthof the slider. The optimum depth of the dimples was found to be ap-proximately twice the minimum separation to achieve friction reductionby increased minimum separation. In some cases friction can be reducedeven further by deeper dimples, which increases the average separation.Optimum area density for friction is dependent on sliding speed. In gen-eral high area density is favourable at low sliding speeds (5 m/s). Asthe speed increases optimum area density is reduced and was found tobe 40 % for sliding speeds between 7.5 and 10 m/s. This suggests that iftexture would be applied on a cylinder liner, the area around mid-strokeshould have lower area density than the surface in between mid-strokeand reversal zones. Different layouts of dimples were investigated. Thelayout was showed to have small effect on the friction results when thearea density is kept low. When area density is increased the layout ofthe dimples can have significant effect on the result, both in friction andseparation between the surfaces. It was found that placing the dimplesin the zig-zag pattern will increase the risk of wear more than placingthem in the in-line pattern. Up to 40 % reduction in mid-stroke friction,caused by adding the surface texture, was predicted with the model.
A novel component test with operating speeds close to those of areal engine was developed. Repeatability when replacing components inthe test was showed to be good. It was proven that with typical HDDEcomponents the oil control ring significantly starves the two compres-sion rings. It can therefore be concluded that a starvation model is
85
necessary when studying compression rings with numerical simulationmodels. A method for comparing sealing capability of oil control ringswas presented. Increased viscosity in the experiment was shown to bean acceptable method for simulation of higher operating speeds, how-ever, influence from squeeze effects must be considered when analysingthe data. Surface roughness of the cylinder liner influenced the fric-tion force. With standard type piston rings, friction was reduced withsmoother cylinder liner surfaces. However, with DLC coated rings andTLOCR with low tangential load and thin lands, the standard honedcylinder liner showed slightly less friction than the smoother liner whichshowed lower friction with the standard type piston rings. It was alsoshown that the ring tangential force has a direct impact on the fric-tion losses for an oil control ring. Friction of the oil control ring couldbe reduced with almost 50 % while still indicating small difference inoil supplied to the top compression rings, enabled by reduced tangen-tial force in combination with different ring land profile. The numericalmodel simulating the full engine cycle of a TLOCR was validated andshowed good correlation with the measured data.

Chapter 5
Future work
Some of the research issues that need further attention are described inthis section.
Various TLOCR designs needs to be investigated, such as, other ringland profiles and cross section geometries in combination with varyingtangential load. This would preferably be performed in a combinednumerical and experimental study. In order to fully understand thepossibilities to reduce fuel consumption, all of the three rings needs tobe modelled. It is important to get an idea of the sealing capability ofthe two top rings since that will affect oil consumption and blow by.Even though the oil left by the TLOCR affects the oil consumption,the oil has to pass the top rings to be consumed. In order to simulatethe two top rings some oil availability model needs to be implementedand there is a definitive need to consider the high pressure in the ringlands. The simulation results obtained for textured surfaces needs tobe validated experimentally. Other types and shapes of dimples needsto be investigated. Also, the influence from different plateau surfaceroughness in combination with texture should be the studied in detail.The method for investigation of oil control ring sealing capability in thecomponent test needs to be validated in full engine tests. Moreover, amethod for measuring OoR of cylinder liners and the influence of suchin the developed test equipment needs to be implemented.
87

88 Chapter 5. Future work

Part II
Appended Papers
89

Paper A
The effect of
three-dimensional
deformations of a cylinder
liner on the tribological
performance of a piston
ring-cylinder liner system
91

93
Proceedings of the Institution of Mechanical Engineers, Part J:
Journal of Engineering Tribology, 2014 October; vol. 228, Issue 10,
p. 1080-1087.
With kind permission of SAGE Publications Ltd
The effect of three-dimensional deformations of a
cylinder liner on the tribological performance of a
piston ring-cylinder liner system
M. Söderfjäll1, P. Isaksson1, A. Spencer2, A. Almqvist1 andR. Larsson1
1 Luleå University of Technology, Division of Machine Elements,
Luleå, SE-971 87 Sweden2 Scania CV AB, Södertälje, Sweden
Abstract
This paper describes a numerical simulation model for prediction of thetribological effects of an oil control ring running against an out-of-roundcylinder liner in a heavy duty diesel engine. The model considers thefull 3D geometry of the oil control ring and includes the effect of bothsurface roughness and global deformation. Results that test the modelsability to do this under stationary conditions are presented. Further-more, stationary results for prediction of the friction reduction possibleby reduced ring tension in combination with reduced out-of-roundnessare given. The model predicts the friction for the oil control ring at midstroke to be 78% larger in an out-of-round cylinder liner compared to aperfectly cylindrical one.
Keywords
Piston ring, Cylinder liner, Bore distortion, Out of roundness, Heavyduty diesel engine
94 Paper A. The effect of three-dimensional deformations
A.1 Introduction
Reduction of fuel consumption is of top priority in the automotive in-dustry today. The power cylinder unit is responsible for 1-6% of thetotal losses in a heavy duty diesel engine [7]. The oil control ring is re-sponsible for 50-75% of the total ring pack friction under some operatingconditions [7]. It is therefore of interest to study the operation of the oilcontrol ring. The cylinder liner in an operating heavy duty diesel engineis not perfectly cylindrical. This will affect the rings ability to conformto the liner and by that the performance of the system will be differentfrom a system where the liner is perfectly cylindrical. One of the mostfundamental ways to reduce friction in the power cylinder unit is to de-crease the ring tension. However, if the liner is not sufficiently circularthe rings will then not be able to conform and this could result in un-wanted effects such as increased oil consumption and blow-by. This willalso affect the generation of hydrodynamic pressure in the lubricated in-terface between the ring and the liner. Compared to a perfectly circularliner the separation between piston ring and cylinder liner, in an out-of-round liner, will vary around the circumference and this will influencethe lubrication regime that the system operates in. In this work theseeffects are investigated by means of numerical simulations. A model hasbeen developed that considers the effects of an out-of-round cylinderliner. The model considers not only hydrodynamic and contact pressurein the interface between piston ring and cylinder liner but also pistonring deformation to investigate the conformability to the cylinder liner.Similar models have been developed before but have typically been usedto study the top compression ring and these use a conformability factorfor ring deformation [24, 25]. Investigations made in [106] showed thatthe shape of the cylinder liner will affect the lubrication and friction ofthe system even at very small amplitudes of out-of-roundness. In [29], a3D conformability model for split-less rings with theory for thin curvedrods was developed. It was concluded that this type of model does notprovide any information about the behaviour of the piston rings otherthan critical amplitude of out-of-roundness to which the piston ring canconform and should mainly be used when comparing different pistonring design effects on conformability. Another example of a model in-vestigating the entire piston ring is an FEM model describing the ringdeformation with beam elements, coupled with a 1D hydrodynamic pres-sure solver [26]. Due to the 1D hydrodynamic solver the model does not
A.2. The model 95
account for any circumferential flow of the lubricant. The investigationsin [26] were made on the two top piston rings and to model the effectof surface roughness and mixed lubrication the Greenwood and Trippcontact model was used. The model was tested with parameters for alight duty diesel engine and effects of ring twist, bore distortion and pis-ton tilt motion on lubrication and oil transport were studied. 4th orderout-of-roundness was studied with an amplitude of up to 10 μm and itwas concluded that both up and down scraping of oil by the top ringare increased with increased out-of-roundness. No investigations on howthe oil control ring conforms to the liner was performed in [26] but it isclaimed that the oil control ring will conform well to distorted bores dueto narrow land width, low bending stiffness and high tension. However,if the goal is to decrease the friction losses from the oil control ring bydecreased ring tension the conformability needs to be investigated andthere is a need for a model that can characterise these effects. In thisstudy, investigations are performed on how different orders and ampli-tudes of out-of-roundness on the cylinder liner in the heavy duty dieselengine affects friction and sealing capability of the twin land oil con-trol ring. Furthermore, investigations are made with consideration toby industry acceptable out-of-roundness. Possible friction reduction byreduced ring tension are investigated. To maintain the sealing capabil-ity this is investigated in combination with reduction of the acceptableout-of-roundness.
A.2 The model
The model in this work is designed to enable investigations of the con-formability and frictional losses between the oil control ring and cylinderliner in a heavy duty diesel engine. The model is built in the commercialfinite element tool COMSOL Multiphysics. The entire ring is modelledand studied since it gives the opportunity to include real measurementsof cylinder liner distortion in the simulation. It also makes it possible tostudy the effect of the ring gap. Also, since the entire ring is modelledin 3D instead of using beam elements it is possible to investigate twistand deformation of each land separately. The deformation is modelledby linear elasticity theory. Influence of cylinder liner surface roughnessis included. The surface of a piston ring is typically much smootherthan the cylinder liner surface [56]. In [64] it is claimed that the frictionbetween the oil control ring and the liner are affected mainly by the liner
96 Paper A. The effect of three-dimensional deformations
micro geometry and the ring face macro geometry. However, the macrogeometry of the cylinder liner, i.e., out of roundness, also affects fric-tion, since it determines the piston ring’s ability to conform to the liner.This is the aim of this study and, therefore, the piston ring is assumedto be perfectly smooth during the simulations. Both the generationof hydrodynamic pressure in the oil film and asperity contact pressureare included. In order to do this, the Luleå Mixed Lubrication Model(LMLM) is implemented in the model. With the LMLM the local effectsdue to surface roughness, may be incorporated in the global model with-out adding complexity. So called flow factors are calculated, hereaftercalled correction factors. These are used to calibrate the Reynolds equa-tion for accurate hydrodynamic pressure according to asperity effects.The correction factors originates from a homogenization method appliedto the Reynolds equation. The LMLM also includes an asperity contactpressure model which is based on a boussinesq-type elasto-plastic contactmechanic model. This is used to generate a stiffness curve for averageasperity contact pressure as a function of average interfacial separationbetween the mating surfaces [71]. This model takes into account thereal surface topography instead of statistical properties of the asperitieswhich is typically used in these types of simulation models.
The LMLM is described in detail in [89]. The homogenized, iso-viscous, Reynolds equation can be written as
∇A0∇p0 = 6ηU∇B0, (A.1)
where p0 is the homogenized film pressure, η is the dynamic viscosity,U is the speed and A0 and B0 are the correction factors.
A0 =
(
a11 a12
a21 a22
)
and B0 =
(
b12
b22
)
(A.2)
The correction factors a12 and a21 are the cross flow terms describingthe pressure induced flow perpendicular to the piston sliding direction.For a texture that is perfectly symmetric in both the x- and y-direction,these are identical to zero [78]. For the investigated surface, the crossflow terms are not identical to zero but much smaller compared to thediagonal terms a11 and a22. Similarly b22 is much smaller than b12.
The friction consists of two different components, boundary contactfriction and hydrodynamic friction. The contact friction is calculatedwith
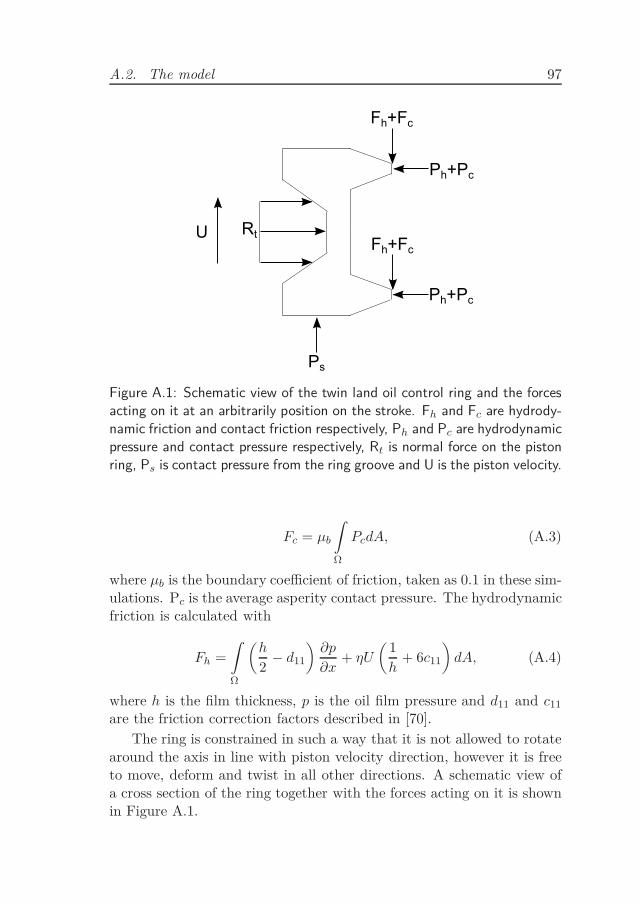
A.2. The model 97
U Rt
Fh+Fc
Fh+Fc
Ph+Pc
Ph+Pc
Ps
Figure A.1: Schematic view of the twin land oil control ring and the forcesacting on it at an arbitrarily position on the stroke. Fh and Fc are hydrody-namic friction and contact friction respectively, Ph and Pc are hydrodynamicpressure and contact pressure respectively, Rt is normal force on the pistonring, Ps is contact pressure from the ring groove and U is the piston velocity.
Fc = µb
ˆ
Ω
PcdA, (A.3)
where µb is the boundary coefficient of friction, taken as 0.1 in these sim-ulations. Pc is the average asperity contact pressure. The hydrodynamicfriction is calculated with
Fh =
ˆ
Ω
(
h
2− d11
)
∂p
∂x+ ηU
(
1
h+ 6c11
)
dA, (A.4)
where h is the film thickness, p is the oil film pressure and d11 and c11
are the friction correction factors described in [70].
The ring is constrained in such a way that it is not allowed to rotatearound the axis in line with piston velocity direction, however it is freeto move, deform and twist in all other directions. A schematic view ofa cross section of the ring together with the forces acting on it is shownin Figure A.1.
98 Paper A. The effect of three-dimensional deformations
It is assumed in the model that both lands on the oil control ringare fully flooded at all times due to the large amount of oil continuouslysupplied at the bottom of the cylinder liner.
The pressure on the ring lands boundaries are assumed to be atmo-spheric.
Cavitation is dealt with by the half-Sommerfeld condition meaningthat all pressures in the oil film lower than saturation pressure are dis-carded. Compared to a more physically correct assumption such asthe JFO boundary conditions this simplifies the model and reduces thecomputational time. The absolute value of the hydrodynamic pressureis affected but not the relative comparison of different out-of-roundness.The general assumption [94] that the cavitation pressure equals the at-mospheric pressure is adopted here.
A.2.1 Model inputs
The engine simulated is a typical heavy duty diesel engine with a boreof 130 mm and a stroke of 160 mm.
The ring lands modelled are 250 μm wide with a parabolic profileand a change in height of 1.2 μm as shown in Figure A.2. In this studya static calculation for one single operating point is performed withvarying cylinder liner out-of-roundness and ring tension. The operatingpoint chosen is at mid-stroke with an engine speed of 1100 RPM, typicalfor a truck at cruising speed. This gives a piston speed of 9.6 m/s. Themid-stroke position is chosen for the analysis. It is around this point thatmost of the frictional power losses occur. The Vogel equation is adoptedto model the dynamic viscosity of the 10W30 oil typically used in heavyduty diesel engines. The temperature is typically 95oC at mid-strokewhich gives the oil a dynamic viscosity of 0.0104 Pa·s. The density ofthe oil used in the study is 888 kg/m3
By studying the effects of different orders and amplitudes of out-of-roundness and ring tension on friction and ring-liner separation at thisoperating point, conclusions on the effect on fuel consumption and oilpassage can be made. Even though separation does not fully describeoil passage, it will give a good idea of how it is affected.
The correction factors and the contact pressure are calculated for asurface measurement from an actual cylinder liner surface, seen in FigureA.3.
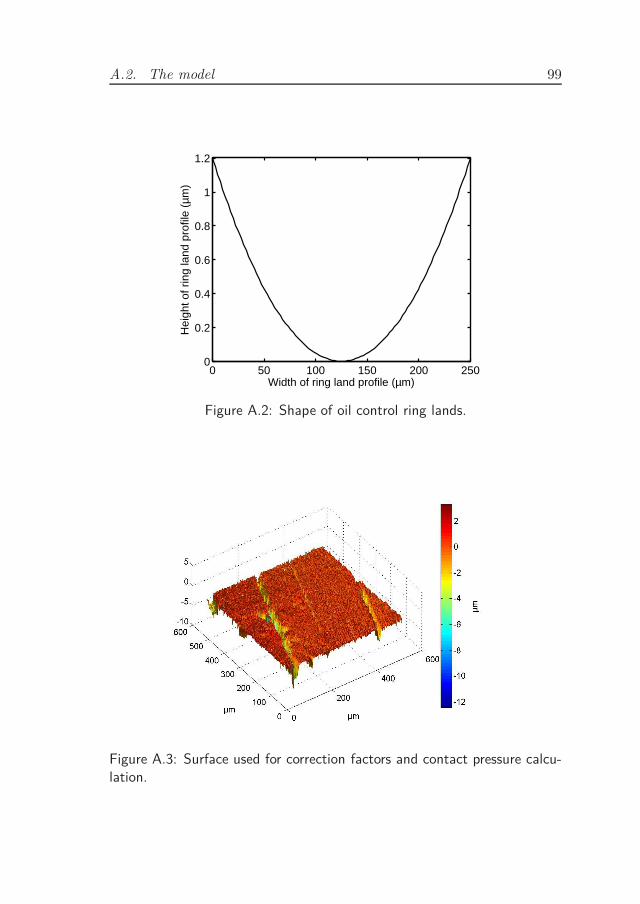
A.2. The model 99
0 50 100 150 200 2500
0.2
0.4
0.6
0.8
1
1.2
Width of ring land profile (µm)
Hei
ght o
f rin
g la
nd p
rofil
e (µ
m)
Figure A.2: Shape of oil control ring lands.
Figure A.3: Surface used for correction factors and contact pressure calcu-lation.
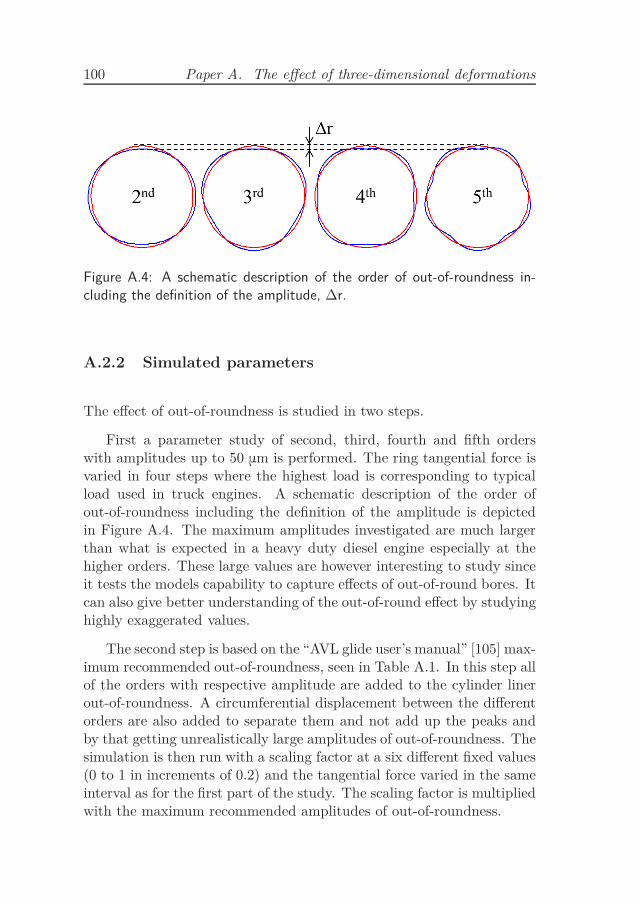
100 Paper A. The effect of three-dimensional deformations
Figure A.4: A schematic description of the order of out-of-roundness in-cluding the definition of the amplitude, ∆r.
A.2.2 Simulated parameters
The effect of out-of-roundness is studied in two steps.
First a parameter study of second, third, fourth and fifth orderswith amplitudes up to 50 μm is performed. The ring tangential force isvaried in four steps where the highest load is corresponding to typicalload used in truck engines. A schematic description of the order ofout-of-roundness including the definition of the amplitude is depictedin Figure A.4. The maximum amplitudes investigated are much largerthan what is expected in a heavy duty diesel engine especially at thehigher orders. These large values are however interesting to study sinceit tests the models capability to capture effects of out-of-round bores. Itcan also give better understanding of the out-of-round effect by studyinghighly exaggerated values.
The second step is based on the “AVL glide user’s manual” [105] max-imum recommended out-of-roundness, seen in Table A.1. In this step allof the orders with respective amplitude are added to the cylinder linerout-of-roundness. A circumferential displacement between the differentorders are also added to separate them and not add up the peaks andby that getting unrealistically large amplitudes of out-of-roundness. Thesimulation is then run with a scaling factor at a six different fixed values(0 to 1 in increments of 0.2) and the tangential force varied in the sameinterval as for the first part of the study. The scaling factor is multipliedwith the maximum recommended amplitudes of out-of-roundness.
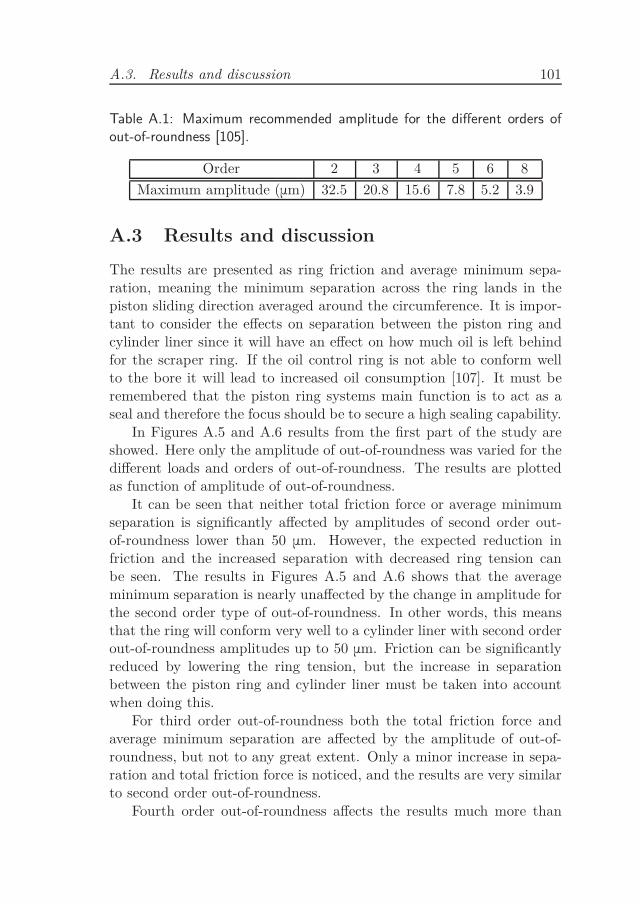
A.3. Results and discussion 101
Table A.1: Maximum recommended amplitude for the different orders ofout-of-roundness [105].
Order 2 3 4 5 6 8
Maximum amplitude (μm) 32.5 20.8 15.6 7.8 5.2 3.9
A.3 Results and discussion
The results are presented as ring friction and average minimum sepa-ration, meaning the minimum separation across the ring lands in thepiston sliding direction averaged around the circumference. It is impor-tant to consider the effects on separation between the piston ring andcylinder liner since it will have an effect on how much oil is left behindfor the scraper ring. If the oil control ring is not able to conform wellto the bore it will lead to increased oil consumption [107]. It must beremembered that the piston ring systems main function is to act as aseal and therefore the focus should be to secure a high sealing capability.
In Figures A.5 and A.6 results from the first part of the study areshowed. Here only the amplitude of out-of-roundness was varied for thedifferent loads and orders of out-of-roundness. The results are plottedas function of amplitude of out-of-roundness.
It can be seen that neither total friction force or average minimumseparation is significantly affected by amplitudes of second order out-of-roundness lower than 50 μm. However, the expected reduction infriction and the increased separation with decreased ring tension canbe seen. The results in Figures A.5 and A.6 shows that the averageminimum separation is nearly unaffected by the change in amplitude forthe second order type of out-of-roundness. In other words, this meansthat the ring will conform very well to a cylinder liner with second orderout-of-roundness amplitudes up to 50 μm. Friction can be significantlyreduced by lowering the ring tension, but the increase in separationbetween the piston ring and cylinder liner must be taken into accountwhen doing this.
For third order out-of-roundness both the total friction force andaverage minimum separation are affected by the amplitude of out-of-roundness, but not to any great extent. Only a minor increase in sepa-ration and total friction force is noticed, and the results are very similarto second order out-of-roundness.
Fourth order out-of-roundness affects the results much more than
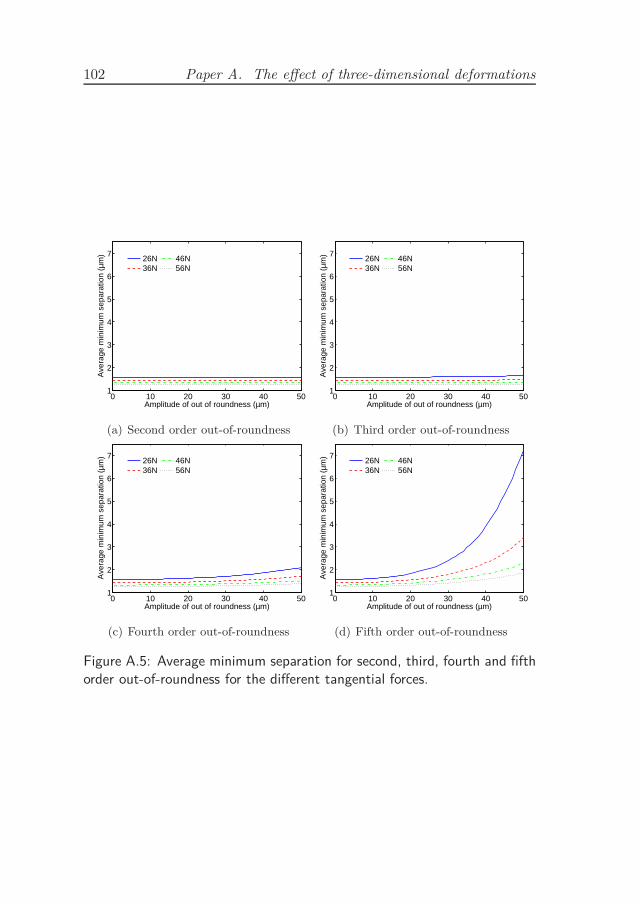
102 Paper A. The effect of three-dimensional deformations
0 10 20 30 40 501
2
3
4
5
6
7
Amplitude of out of roundness (µm)
Ave
rage
min
imum
sep
arat
ion
(µm
)
26N36N
46N56N
(a) Second order out-of-roundness
0 10 20 30 40 501
2
3
4
5
6
7
Amplitude of out of roundness (µm)
Ave
rage
min
imum
sep
arat
ion
(µm
)
26N36N
46N56N
(b) Third order out-of-roundness
0 10 20 30 40 501
2
3
4
5
6
7
Amplitude of out of roundness (µm)
Ave
rage
min
imum
sep
arat
ion
(µm
)
26N36N
46N56N
(c) Fourth order out-of-roundness
0 10 20 30 40 501
2
3
4
5
6
7
Amplitude of out of roundness (µm)
Ave
rage
min
imum
sep
arat
ion
(µm
)
26N36N
46N56N
(d) Fifth order out-of-roundness
Figure A.5: Average minimum separation for second, third, fourth and fifthorder out-of-roundness for the different tangential forces.
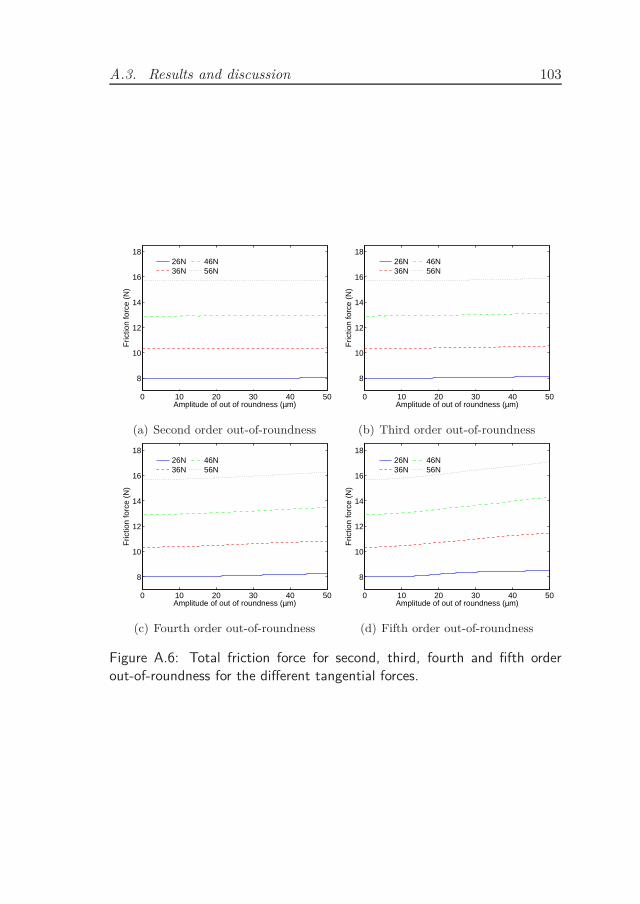
A.3. Results and discussion 103
0 10 20 30 40 50
8
10
12
14
16
18
Amplitude of out of roundness (µm)
Fric
tion
forc
e (N
)
26N36N
46N56N
(a) Second order out-of-roundness
0 10 20 30 40 50
8
10
12
14
16
18
Amplitude of out of roundness (µm)
Fric
tion
forc
e (N
)
26N36N
46N56N
(b) Third order out-of-roundness
0 10 20 30 40 50
8
10
12
14
16
18
Amplitude of out of roundness (µm)
Fric
tion
forc
e (N
)
26N36N
46N56N
(c) Fourth order out-of-roundness
0 10 20 30 40 50
8
10
12
14
16
18
Amplitude of out of roundness (µm)
Fric
tion
forc
e (N
)
26N36N
46N56N
(d) Fifth order out-of-roundness
Figure A.6: Total friction force for second, third, fourth and fifth orderout-of-roundness for the different tangential forces.
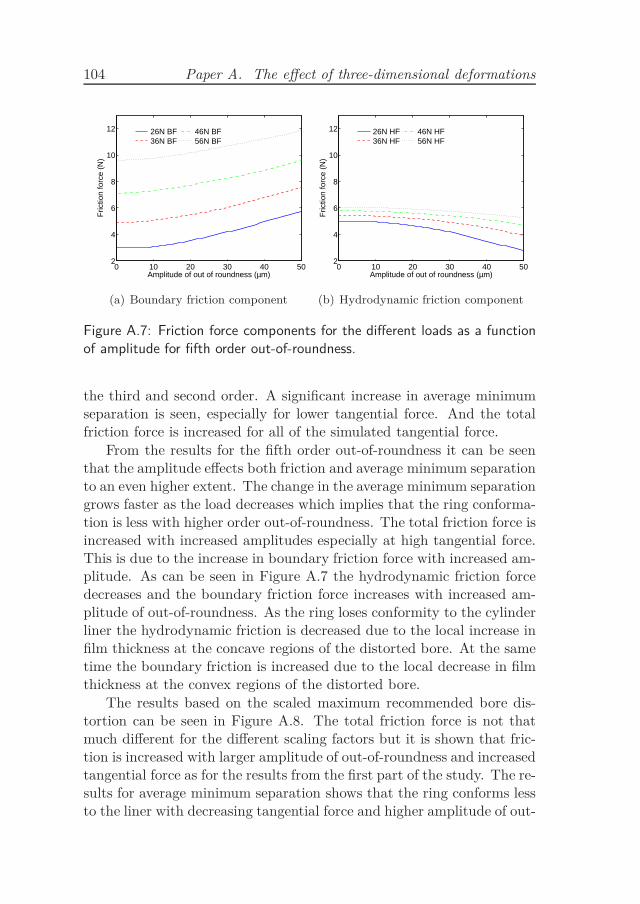
104 Paper A. The effect of three-dimensional deformations
0 10 20 30 40 502
4
6
8
10
12
Amplitude of out of roundness (µm)
Fric
tion
forc
e (N
)
26N BF36N BF
46N BF56N BF
(a) Boundary friction component
0 10 20 30 40 502
4
6
8
10
12
Amplitude of out of roundness (µm)
Fric
tion
forc
e (N
)
26N HF36N HF
46N HF56N HF
(b) Hydrodynamic friction component
Figure A.7: Friction force components for the different loads as a functionof amplitude for fifth order out-of-roundness.
the third and second order. A significant increase in average minimumseparation is seen, especially for lower tangential force. And the totalfriction force is increased for all of the simulated tangential force.
From the results for the fifth order out-of-roundness it can be seenthat the amplitude effects both friction and average minimum separationto an even higher extent. The change in the average minimum separationgrows faster as the load decreases which implies that the ring conforma-tion is less with higher order out-of-roundness. The total friction force isincreased with increased amplitudes especially at high tangential force.This is due to the increase in boundary friction force with increased am-plitude. As can be seen in Figure A.7 the hydrodynamic friction forcedecreases and the boundary friction force increases with increased am-plitude of out-of-roundness. As the ring loses conformity to the cylinderliner the hydrodynamic friction is decreased due to the local increase infilm thickness at the concave regions of the distorted bore. At the sametime the boundary friction is increased due to the local decrease in filmthickness at the convex regions of the distorted bore.
The results based on the scaled maximum recommended bore dis-tortion can be seen in Figure A.8. The total friction force is not thatmuch different for the different scaling factors but it is shown that fric-tion is increased with larger amplitude of out-of-roundness and increasedtangential force as for the results from the first part of the study. The re-sults for average minimum separation shows that the ring conforms lessto the liner with decreasing tangential force and higher amplitude of out-
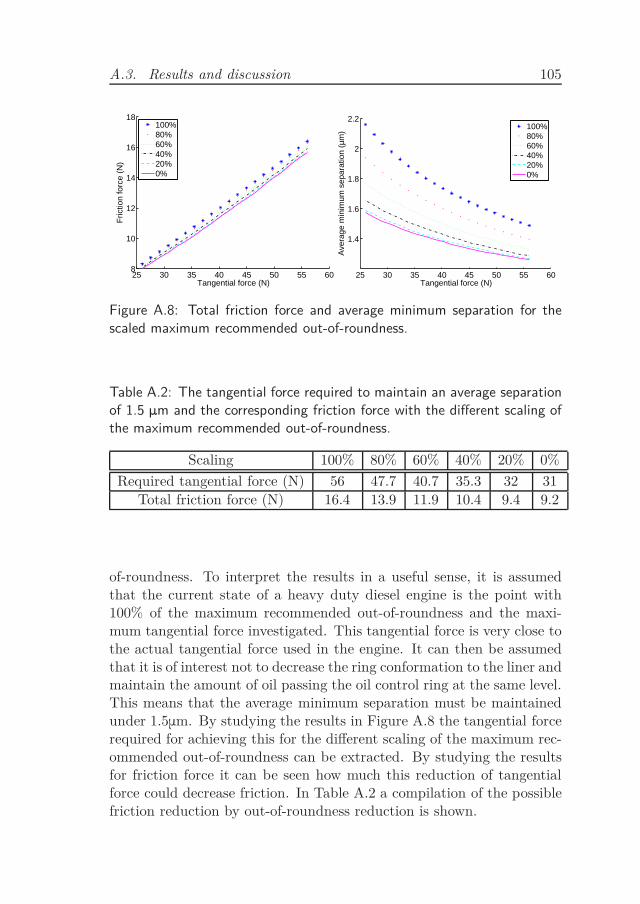
A.3. Results and discussion 105
25 30 35 40 45 50 55 608
10
12
14
16
18
Tangential force (N)
Fric
tion
forc
e (N
)
100%80%60%40%20%0%
25 30 35 40 45 50 55 60
1.4
1.6
1.8
2
2.2
Tangential force (N)
Ave
rage
min
imum
sep
arat
ion
(µm
)
100%80%60%40%20%0%
Figure A.8: Total friction force and average minimum separation for thescaled maximum recommended out-of-roundness.
Table A.2: The tangential force required to maintain an average separationof 1.5 μm and the corresponding friction force with the different scaling ofthe maximum recommended out-of-roundness.
Scaling 100% 80% 60% 40% 20% 0%
Required tangential force (N) 56 47.7 40.7 35.3 32 31
Total friction force (N) 16.4 13.9 11.9 10.4 9.4 9.2
of-roundness. To interpret the results in a useful sense, it is assumedthat the current state of a heavy duty diesel engine is the point with100% of the maximum recommended out-of-roundness and the maxi-mum tangential force investigated. This tangential force is very close tothe actual tangential force used in the engine. It can then be assumedthat it is of interest not to decrease the ring conformation to the liner andmaintain the amount of oil passing the oil control ring at the same level.This means that the average minimum separation must be maintainedunder 1.5μm. By studying the results in Figure A.8 the tangential forcerequired for achieving this for the different scaling of the maximum rec-ommended out-of-roundness can be extracted. By studying the resultsfor friction force it can be seen how much this reduction of tangentialforce could decrease friction. In Table A.2 a compilation of the possiblefriction reduction by out-of-roundness reduction is shown.
106 Paper A. The effect of three-dimensional deformations
A.4 Conclusions
A model that considers the effects of oil control rings against out-of-round cylinder liners has been developed. The model takes into accountthe effects of surface roughness and ring deformation. The model seemsable to capture the expected trends caused by out-of-round cylinder lin-ers. Friction reduction can be achieved by reducing the tangential forceon the oil control ring. The results have shown that the ring will conformwell to a cylinder liner with lower order out-of-roundness. When the or-der of out-of-roundness is increased the conformability of the piston ringdecrease, especially at low loads. This means that if the tangential forceon the ring is lowered, then the amplitude of out-of-roundness must alsobe lowered in order to achieve an equal degree of confirmation. Moreboundary friction will occur locally with larger amplitudes and higherorder out-of-roundness and this probably increase the wear. At the sametime the maximum separation will increase locally, reducing the hydro-dynamic friction but also the sealing capability.
The model predicts that the friction is 78% (16.4 N against 9.2 N)higher for the oil control ring at midstroke with today’s standard accept-able out-of-round bore compared to a perfectly round one. This increasein friction is a result of the increase in the tangential force required toachieve a 1.5 μm average separation between the ring and the liner, i.e,to maintain the assumed wanted conformability of the ring.
Acknowledgement
The author would like to thank Scania, AB Volvo, Energimyndigheten,and the Energy Efficient Vehicle programme for funding this work.
Paper B
A model for twin land oil
control rings
107

109
Tribology International vol. 95, pp. 475-482, 2016.
A model for twin land oil control rings
M. Söderfjäll, A. Almqvist and R. Larsson
Luleå University of Technology, Division of Machine Elements,
Luleå, SE-971 87 Sweden
Abstract
A simulation model for predicting performance of a twin land oil con-trol ring (TLOCR) in a heavy duty diesel engine (HDDE) has beendeveloped. The simulation model takes into account the tribological in-terfaces of the TLOCR both against the cylinder liner and the pistonring groove. It also accounts for the elastic deformation of the ring crosssection as well as the dynamics of the TLOCR. This work describesthe model and discusses the challenges and compromises that had to bemade. Included are also examples of the models capability to quantifydesign changes of the TLOCR.
110 Paper B. A model for twin land oil control rings
B.1 Introduction
With today’s striving towards reduction of fuel consumption it becomesmore important to understand how components function in the internalcombustion engine. There is a need for tools that can investigate andpredict the outcome of specific design changes on the components. Inheavy duty diesel engines (HDDE) twin land oil control rings (TLOCR)are typically used. The TLOCR plays a very important role in the en-gine since it is supposed to distribute the correct amount of oil on theliner to lubricate the other rings. It is important that the TLOCR doesnot leave too much oil on the liner for the two top rings since it couldlead too high oil consumption. In a HDDE, the piston assembly is thelargest contributor to frictional losses where the piston ring pack ac-counts for the major part of this. The oil control ring has the largestcontribution to frictional losses in the piston ring pack [7, 9] making itvery interesting when focusing on reduction of fuel consumption. Muchwork has previously been made on trying to understand the piston ringoperation. Much of the focus has, however, been on the sealing capa-bility which is the main function of the piston ring pack and thereforemost of the earlier models are focusing on the top rings. One of thefirst models of the TLOCR is the one developed by Ruddy et al. [19]which includes twist and radial force equilibrium coupled with a hydro-dynamic model. Later a more extensive model including dynamics andinteraction between TLOCR and the piston ring groove was developedby Tian and Wong [20]. The model developed by Tian and Wong in-cluded torsional stiffness of the ring by estimating the torsional stiffnessof the cross section to be the same as for a rectangular ring but witha scaling parameter for correction of the assumption of a solid rectan-gular. Tian and Wong concluded that the torsional stiffness of the ringmight be as critical as the ring tension for bore sealing which meansthat there is a need of including the elastic deformation of the ring asaccurately as possible. There are many other simulation models consid-ering piston ring lubrication available in the literature, some examplesare [4, 26, 56, 108, 109]. However, none of the models mentioned earlierin this section have fully considered the deformation of the ring crosssection coupled with all in this section previously mentioned reactionforces and effects. The model developed in this paper accounts for thetribological interface of the TLOCR against the cylinder liner and pistonring groove as well as the elastic deformation of the ring and the ring
B.1. Introduction 111
dynamics within the piston ring groove. The actual ring cross sectionis modelled in order to account for the elastic deformation of the ringcross section and is therefore capable of capturing the relative twist dif-ference of the two running lands. By solving all of these problems as acoupled system it is believed that the entire operation of the oil controlring could be understood in a better way than earlier and open up newoptimisation possibilities for the TLOCR.
There are many types of axial ring land geometries for the TLOCR.On some TLOCR the geometry of the ring lands are curved, when new,but as the lands wear the curvature can be reduced and the lands becomemore flat. In some engines the ring land is close to perfectly flat. Onthe global scale a flat running land would not be able to generate anyhydrodynamic pressure. The twist of the ring and the individual twistof the ring lands are therefore important to study since it will affectthe hydrodynamic pressure generation between the land and cylinderliner. By modelling the full ring cross section the model will also takeconsideration of the global scale EHL effects which were proven to beimportant close to the reversal zone by Dowson [17].
Consideration to lubricant cavitation in the piston ring contact isalso important [94]. The JFO (Jakobsson-Floberg-Olsson) boundarycondition should be fulfilled in order to predict the correct pressure gen-erated in the oil film and ensure mass conservation. Several methods hasbeen developed to incorporate cavitation in the Reynolds equation. Thecommonly used method developed by Elrod [97] used a switch functionfor terminating pressure gradient in the cavitated region with a variabledescribing the fractional film content. A similar model with a differentmore rigorous derivation of the fractional film content variable was pre-sented by Vijayaraghavan et al. [98]. A more refined cavitation modelsimilar to Elrod [97] was developed by Sahlin et al. [87] which includedmeasured lubricant properties in the fractional film content variable.In [99], Giacopini et al. formulated a linear complementarity problem(LCP) for the cavitation problem based on the incompressible Reynoldsequation. Another derivation of the LCP formulated problem was per-formed by A. Almqvist et al. [77]. Their model extended the previouslydeveloped one in [99] to encompass fluids obeying the constant bulkmodulus model of compressibility. Moreover, the derivation was madefrom the expression of the mass flow instead of directly implemented inthe Reynolds equation. The LCP formulation of the problem makes thesolution much more stable around the cavitation boundary but accord-
112 Paper B. A model for twin land oil control rings
ing to Spencer [93] it increases the computational time. Unfortunately,it is difficult to implement an LCP model coupled with deformation anddynamics. The LCP problem can be solved separately in an iterativeprocess with the other physics but this would further increase the com-putational time.
Another method to deal with cavitation is a density modificationscheme which is similar to the method suggested by Elrod [97]. Thismethod has been used in tribological simulations before, two examplesare work by T. Almqvist et al. [101] and Isaksson et al. [102]. As themethod in [97], it is assumed that the density of the lubricant is reducedin the cavitation zone, which is also physically reasonable. In [101]and [102] the density of the lubricant in the cavitated zone is describedwith a polynomial in terms of the lubricant pressure.
In [103], Häggström introduced an extension of the density modi-fication model. More precisely, in that work it was assumed that theviscosity of the lubricant reduces at the same rate as the density inthe cavitated region. This turned out to be a very effective way ofmodelling cavitation in a multi physics model. The strategy used byHäggström [103] is therefore used in the model presented in this paper.
B.2 Method
In this paper a model of the TLOCR is developed by taking the followinginto account:
• Full engine cycle
• Elastic deformation of the full cross section
• Dynamic motion of the TLOCR within the piston ring groove
• Tribological interfaces considering the surface topography
– TLOCR against cylinder liner with mass conserving cavita-tion model
– TLOCR against piston ring groove
The model developed in this paper is meant to show ways of over-coming convergence problems that occur when considering all of this inthe same model.
B.2. Method 113
B.2.1 Finite element model
A small segment of the TLOCR is modelled in the multiphysics finiteelement software COMSOL 4.4 [110]. Since only a segment of the ringis modelled the ring is assumed to be axisymmetric. Therefore periodicboundary conditions are used which means that the ring gap is not con-sidered. The reason for only modelling a small section is that it reducesthe computational time of the model drastically. Also, only a smallsection is modelled since the aim of this paper is to present methodsthat can be used in order to model the full TLOCR cross section whichconsideration to all earlier mentioned physics. The deformation of thering segment is assumed to be linear elastically deformed and the ma-terial of the TLOCR is assumed to be isotropic. The dynamic motionof the TLOCR inside the ring groove is considered by employing New-ton’s second law: F = m ·a together with moment and force equilibriumequations in the model. The ring segment is constrained so that it isfree to move and tilt within the piston ring groove only restricted by thecylinder liner and piston ring groove interfaces. The model is fully cou-pled meaning that all equations are solved simultaneously. The solutionis found by using a solver based on non-linear damped Newton methodimplemented in the finite element software Comsol. A schematic viewof the ring cross section used in this study and the external forces fromthe different interfaces acting on it can be seen in Figure B.1.
B.2.2 Boundary conditions
In this study the ring lands are assumed to always be fully flooded withoil. The pressure on the ring land boundaries in the axial directionare assumed to be atmospheric. The viscosity η0 is modelled with theVogel equation, the oil parameters used are for a 10W30 oil typicallyused in HDDE. The temperature of the liner is assumed to be 150C attop dead centre (TDC), 95C at mid-stroke and 115C at bottom deadcentre (BDC), the temperature distribution in the liner axial directionis interpolated through these points with a piecewise cubic spline. Thetemperature data was provided by Scania. The normal force acting onthe backside of the piston ring Rt is the representation of the spring thatis mounted on the backside of the ring in the real engine.
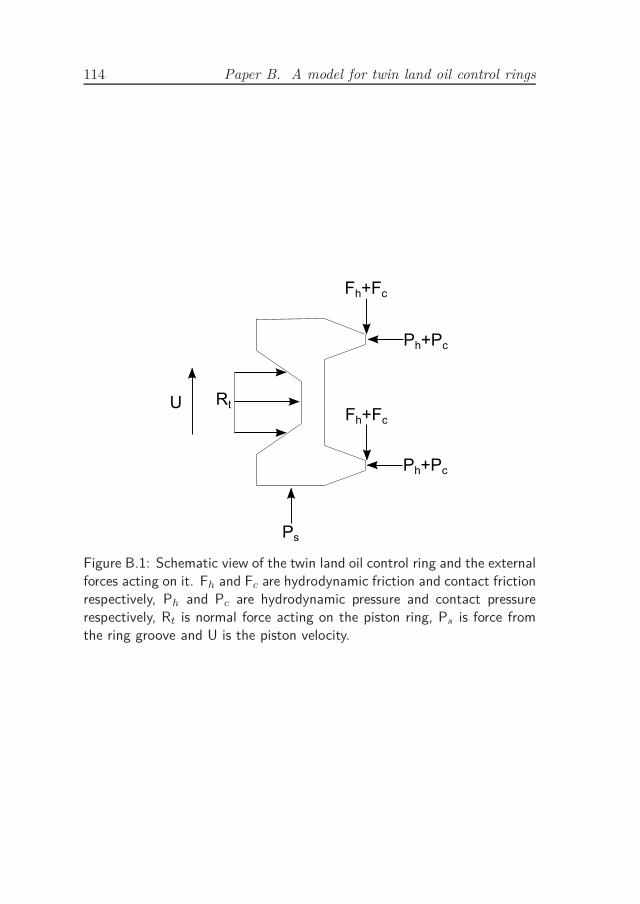
114 Paper B. A model for twin land oil control rings
U Rt
Fh+Fc
Fh+Fc
Ph+Pc
Ph+Pc
Ps
Figure B.1: Schematic view of the twin land oil control ring and the externalforces acting on it. Fh and Fc are hydrodynamic friction and contact frictionrespectively, Ph and Pc are hydrodynamic pressure and contact pressurerespectively, Rt is normal force acting on the piston ring, Ps is force fromthe ring groove and U is the piston velocity.
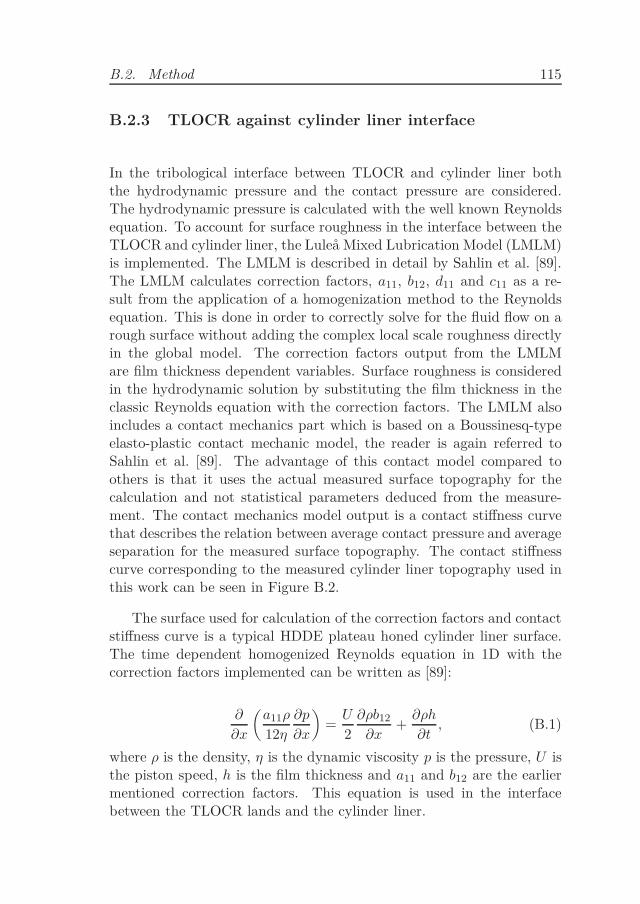
B.2. Method 115
B.2.3 TLOCR against cylinder liner interface
In the tribological interface between TLOCR and cylinder liner boththe hydrodynamic pressure and the contact pressure are considered.The hydrodynamic pressure is calculated with the well known Reynoldsequation. To account for surface roughness in the interface between theTLOCR and cylinder liner, the Luleå Mixed Lubrication Model (LMLM)is implemented. The LMLM is described in detail by Sahlin et al. [89].The LMLM calculates correction factors, a11, b12, d11 and c11 as a re-sult from the application of a homogenization method to the Reynoldsequation. This is done in order to correctly solve for the fluid flow on arough surface without adding the complex local scale roughness directlyin the global model. The correction factors output from the LMLMare film thickness dependent variables. Surface roughness is consideredin the hydrodynamic solution by substituting the film thickness in theclassic Reynolds equation with the correction factors. The LMLM alsoincludes a contact mechanics part which is based on a Boussinesq-typeelasto-plastic contact mechanic model, the reader is again referred toSahlin et al. [89]. The advantage of this contact model compared toothers is that it uses the actual measured surface topography for thecalculation and not statistical parameters deduced from the measure-ment. The contact mechanics model output is a contact stiffness curvethat describes the relation between average contact pressure and averageseparation for the measured surface topography. The contact stiffnesscurve corresponding to the measured cylinder liner topography used inthis work can be seen in Figure B.2.
The surface used for calculation of the correction factors and contactstiffness curve is a typical HDDE plateau honed cylinder liner surface.The time dependent homogenized Reynolds equation in 1D with thecorrection factors implemented can be written as [89]:
∂
∂x
(
a11ρ
12η
∂p
∂x
)
=U
2
∂ρb12
∂x+
∂ρh
∂t, (B.1)
where ρ is the density, η is the dynamic viscosity p is the pressure, U isthe piston speed, h is the film thickness and a11 and b12 are the earliermentioned correction factors. This equation is used in the interfacebetween the TLOCR lands and the cylinder liner.
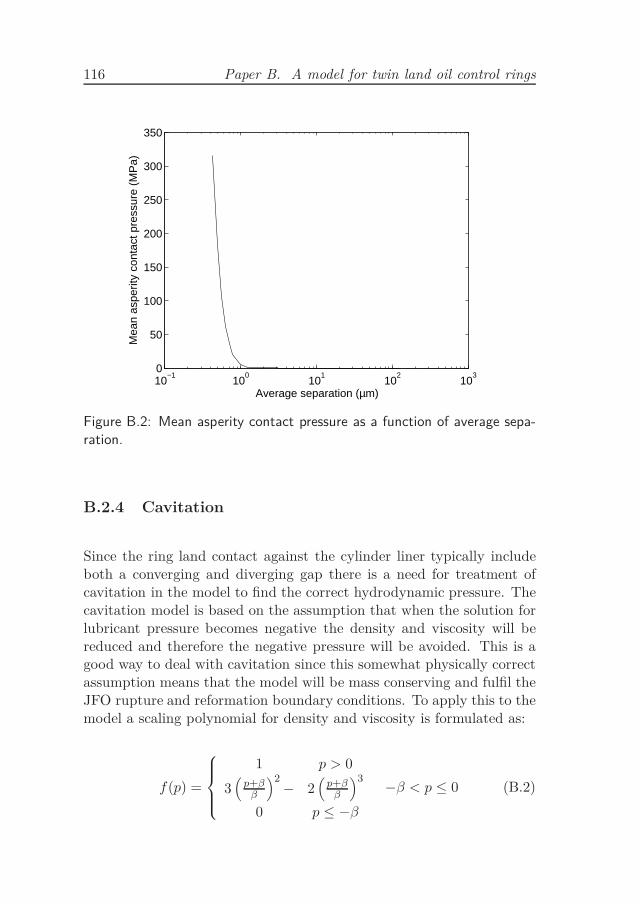
116 Paper B. A model for twin land oil control rings
10−1
100
101
102
103
0
50
100
150
200
250
300
350
Average separation (µm)
Mea
n as
perit
y co
ntac
t pre
ssur
e (M
Pa)
Figure B.2: Mean asperity contact pressure as a function of average sepa-ration.
B.2.4 Cavitation
Since the ring land contact against the cylinder liner typically includeboth a converging and diverging gap there is a need for treatment ofcavitation in the model to find the correct hydrodynamic pressure. Thecavitation model is based on the assumption that when the solution forlubricant pressure becomes negative the density and viscosity will bereduced and therefore the negative pressure will be avoided. This is agood way to deal with cavitation since this somewhat physically correctassumption means that the model will be mass conserving and fulfil theJFO rupture and reformation boundary conditions. To apply this to themodel a scaling polynomial for density and viscosity is formulated as:
f(p) =
1 p > 0
3(
p+ββ
)2
− 2(
p+ββ
)3
0 p ≤ −β
−β < p ≤ 0 (B.2)
B.2. Method 117
where β is the factor for the transition zone of the scaling parameterwhich is then implemented as:
ρ = (f(p) + α) ·ρ0
1 + α(B.3)
η = (f(p) + α) ·η0
1 + α(B.4)
The parameter α is arbitrarily set to 0.01 to avoid zero density andviscosity which improve convergence of the model. As long as α is keptwell below unity it has a negligible effect on the result. This is the samecavitation model as the one used by Häggström [103].
B.2.5 TLOCR against piston ring groove
The axial force on the piston ring Ps consists of two components, themechanical contact between the piston ring groove and piston ring andthe hydrodynamic pressure, caused by piston ring movement within thegroove. The roughness of this interface was not measured and the con-tact stiffness curve for this particular interface was calculated on anupside down cylinder liner surface. The reason for this was to obtain acontact which is less stiff than the contact against the cylinder liner sincethis facilitates convergence of the model. The contact becomes less stiffsince the honing groove bottom will then act as the top of the surface.The honing grooves cover only a small part of the total surface area andwill come in contact with the counter surface first when turned upsidedown. The piston ring groove height is specified to be 100 μm largerthan the piston ring, meaning that the piston ring will be free to moveinside the groove, only restricted in axial direction by the ring groovecontact. The axial gap between the piston and piston ring is assumedto be filled with oil, schematically showed in Figure B.3, by solving theReynolds equation for the squeeze in this interface the viscous dampingin the contact is accounted for. The mass conserving cavitation model isnot employed here since the flow through this contact is not investigatedin this study. The radial velocity is not considered in the axial gap sinceit very small and has a negligible effect on the solution and therefore theReynolds equation for this interface can be written as:
∂
∂y
(
ρh3
12η
∂p
∂y
)
=(∂ρh)
∂t, (B.5)
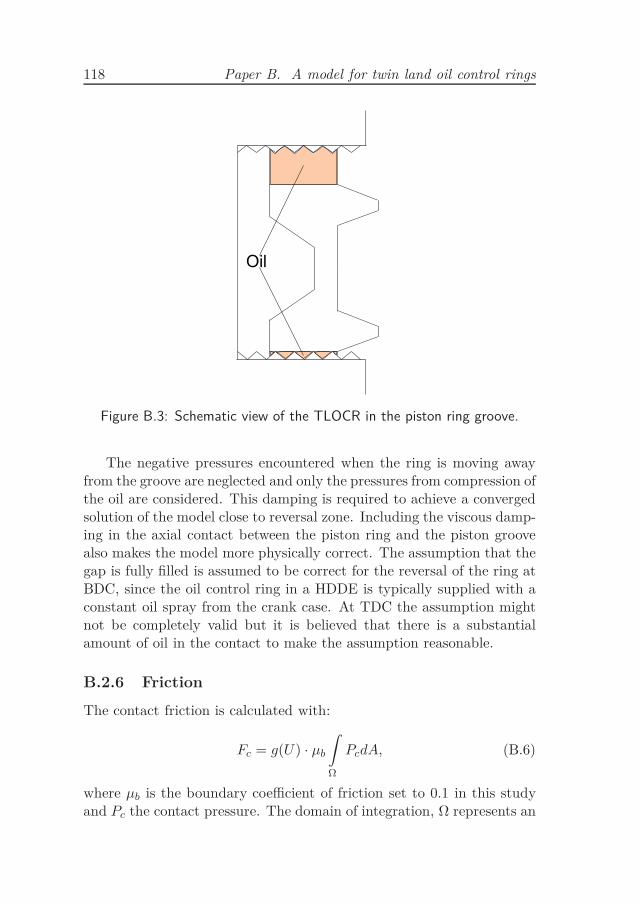
118 Paper B. A model for twin land oil control rings
Figure B.3: Schematic view of the TLOCR in the piston ring groove.
The negative pressures encountered when the ring is moving awayfrom the groove are neglected and only the pressures from compression ofthe oil are considered. This damping is required to achieve a convergedsolution of the model close to reversal zone. Including the viscous damp-ing in the axial contact between the piston ring and the piston groovealso makes the model more physically correct. The assumption that thegap is fully filled is assumed to be correct for the reversal of the ring atBDC, since the oil control ring in a HDDE is typically supplied with aconstant oil spray from the crank case. At TDC the assumption mightnot be completely valid but it is believed that there is a substantialamount of oil in the contact to make the assumption reasonable.
B.2.6 Friction
The contact friction is calculated with:
Fc = g(U) · µb
ˆ
Ω
PcdA, (B.6)
where µb is the boundary coefficient of friction set to 0.1 in this studyand Pc the contact pressure. The domain of integration, Ω represents an
B.3. Results and discussion 119
element and A is the area of this element. The hydrodynamic frictioncomponent is calculated with:
Fh =
ˆ
Ω
(
h
2− d11
)
∂p
∂x+ ηU
(
1
h+ 6c11
)
dA, (B.7)
where d11 and c11 are the friction correction factors calculated with theLMLM which are described in [70].
B.2.7 Scaling of boundary friction
Since the ring is free to move axially in the ring groove the reversalzone makes it difficult to find convergence for the load balance. If thehalf Sommerfeld assumption is applied instead of the Häggström model,the complexity of the model is still low enough to achieve a convergedload balance. But in order to include the more physically correct JFOboundary condition a relaxation of the friction force around the reversalzone turned out to be necessary. More precisely it was found that byintroducing a scaling of the boundary friction force close to the reversalzone, convergence could be achieved with the JFO rupture and reforma-tion boundary conditions. A similar technique is used in the EXCITEPower unit software developed by AVL [104]. In the present model aparameter ulim is introduced to specify in which piston speed intervalthe boundary friction component should be scaled. In terms of the ulim
parameter the scaling function for the boundary friction is formulatedas:
g(U) =
1U
ulim
|U | > ulim
|U | 6 ulim
(B.8)
B.3 Results and discussion
The general parameters of the engine simulated in this study are; strokelength: 160 mm, bore diameter: 130 mm and con rod length: 255 mm.
B.3.1 Evaluation of cavitation model parameter effect
As a validation of the cavitation model used, it is compared to the LCPformulated model by Giacopini [99]. Figure B.4 shows the hydrodynamicpressure for a double parabolic slider, enabling comparison between the
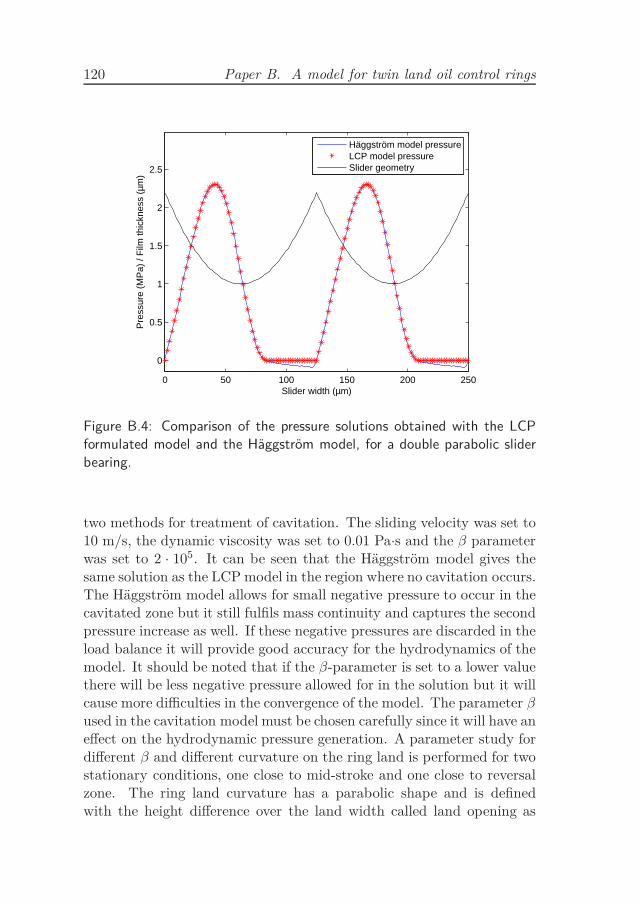
120 Paper B. A model for twin land oil control rings
0 50 100 150 200 250
0
0.5
1
1.5
2
2.5
Slider width (µm)
Pre
ssur
e (M
Pa)
/ F
ilm th
ickn
ess
(µm
)
Häggström model pressureLCP model pressureSlider geometry
Figure B.4: Comparison of the pressure solutions obtained with the LCPformulated model and the Häggström model, for a double parabolic sliderbearing.
two methods for treatment of cavitation. The sliding velocity was set to10 m/s, the dynamic viscosity was set to 0.01 Pa·s and the β parameterwas set to 2 · 105. It can be seen that the Häggström model gives thesame solution as the LCP model in the region where no cavitation occurs.The Häggström model allows for small negative pressure to occur in thecavitated zone but it still fulfils mass continuity and captures the secondpressure increase as well. If these negative pressures are discarded in theload balance it will provide good accuracy for the hydrodynamics of themodel. It should be noted that if the β-parameter is set to a lower valuethere will be less negative pressure allowed for in the solution but it willcause more difficulties in the convergence of the model. The parameter βused in the cavitation model must be chosen carefully since it will have aneffect on the hydrodynamic pressure generation. A parameter study fordifferent β and different curvature on the ring land is performed for twostationary conditions, one close to mid-stroke and one close to reversalzone. The ring land curvature has a parabolic shape and is definedwith the height difference over the land width called land opening as
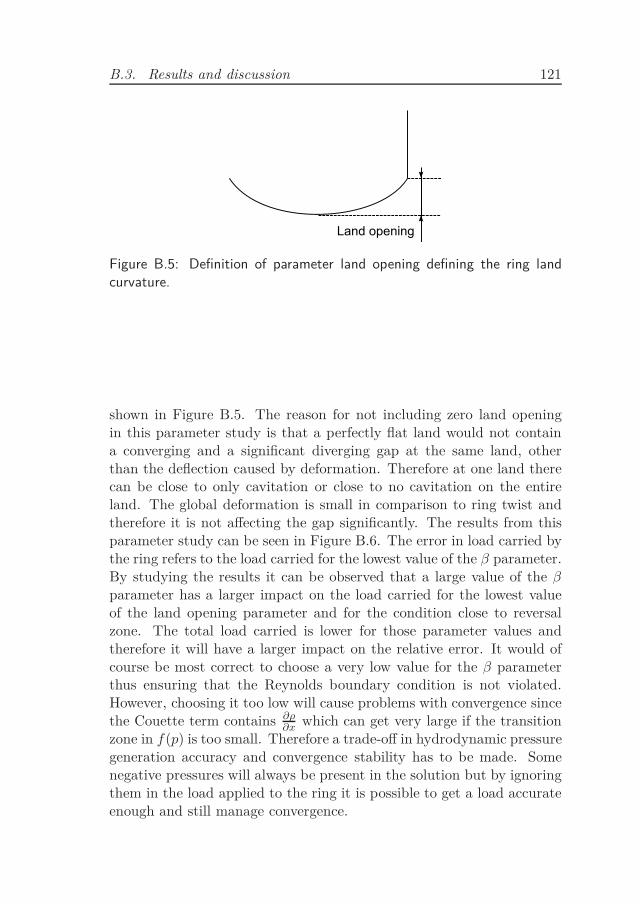
B.3. Results and discussion 121
Figure B.5: Definition of parameter land opening defining the ring landcurvature.
shown in Figure B.5. The reason for not including zero land openingin this parameter study is that a perfectly flat land would not containa converging and a significant diverging gap at the same land, otherthan the deflection caused by deformation. Therefore at one land therecan be close to only cavitation or close to no cavitation on the entireland. The global deformation is small in comparison to ring twist andtherefore it is not affecting the gap significantly. The results from thisparameter study can be seen in Figure B.6. The error in load carried bythe ring refers to the load carried for the lowest value of the β parameter.By studying the results it can be observed that a large value of the βparameter has a larger impact on the load carried for the lowest valueof the land opening parameter and for the condition close to reversalzone. The total load carried is lower for those parameter values andtherefore it will have a larger impact on the relative error. It would ofcourse be most correct to choose a very low value for the β parameterthus ensuring that the Reynolds boundary condition is not violated.However, choosing it too low will cause problems with convergence sincethe Couette term contains ∂ρ
∂xwhich can get very large if the transition
zone in f(p) is too small. Therefore a trade-off in hydrodynamic pressuregeneration accuracy and convergence stability has to be made. Somenegative pressures will always be present in the solution but by ignoringthem in the load applied to the ring it is possible to get a load accurateenough and still manage convergence.
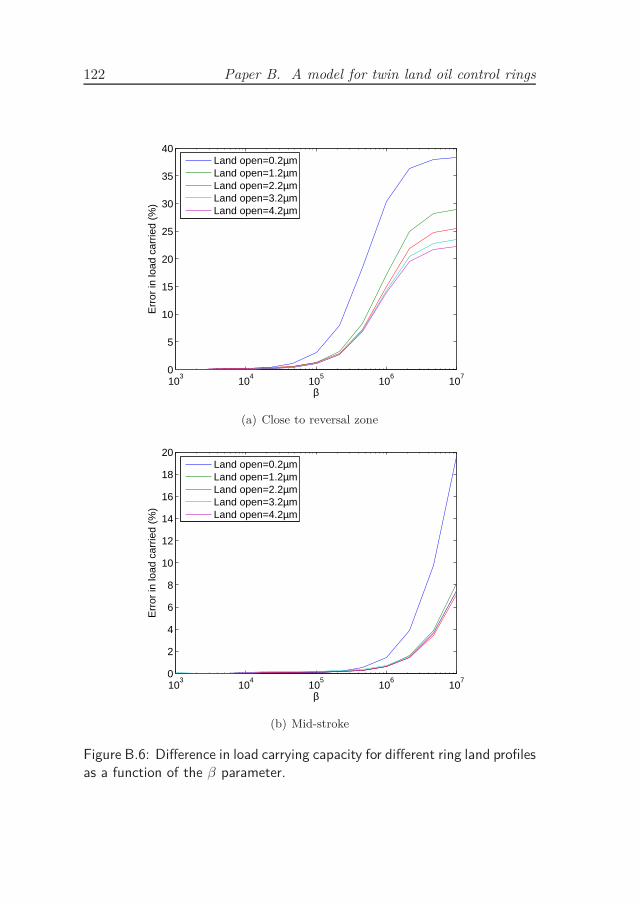
122 Paper B. A model for twin land oil control rings
103
104
105
106
107
0
5
10
15
20
25
30
35
40
β
Err
or in
load
car
ried
(%)
Land open=0.2µmLand open=1.2µmLand open=2.2µmLand open=3.2µmLand open=4.2µm
(a) Close to reversal zone
103
104
105
106
107
0
2
4
6
8
10
12
14
16
18
20
β
Err
or in
load
car
ried
(%)
Land open=0.2µmLand open=1.2µmLand open=2.2µmLand open=3.2µmLand open=4.2µm
(b) Mid-stroke
Figure B.6: Difference in load carrying capacity for different ring land profilesas a function of the β parameter.
B.3. Results and discussion 123
B.3.2 Evaluation of effect from scaling the boundary fric-
tion
Investigations of how to select the ulim parameter and it’s impact onthe result was also performed. In order to vary this parameter the den-sity and viscosity modification was switched off and the half Sommerfeldboundary conditions was applied, making it possible to solve the casewithout any scaling of the boundary friction. This means that mass con-servation is not fulfilled but it should still be good enough for evaluationof the effect from varying the parameter. ulim was varied from 0 to 0.5m/s with increments of 0.1. A full engine revolution was simulated withan engine speed of 1200 rpm and the land opening parameter set to 1.2μm. When studying the total friction on both lands it was found thatthe effect on hydrodynamic friction result is negligible by these valuesof the ulim parameter. The boundary friction is neither affected by theulim other than the scaling effect itself around the reversal zone. If thescaling function g(U) is excluded in a post processing calculation of theboundary friction the result is negligibly affected by the ulim parameter.There must however be an effect on the ring dynamics around reversalzone since the forces acting on it are modified. To investigate this thelands are studied individually. For illustration of the effect of the ulim
parameter the minimum oil film thickness (MOFT) for both runninglands are shown in Figure B.7. It can be seen that there is a bump afterthe reversal of the ring for all tested values. Similar results have beenreported for three piece oil control rings in [109], where it was concludedthat the ring will have this behaviour due to the dynamics around re-versal zone for low engine speeds around 1000 RPM. The major partof the stroke is not affected by the boundary friction scaling. Typicallyfor engine development, friction and oil left on the liner is what is mostinteresting to optimise the TLOCR for and if this is significantly unaf-fected as these results show the method is acceptable. The bump in theMOFT results can be studied further, Figure B.7 also shows results closeto reversal zones both at BDC and TDC. It can be noticed that thereis a big spike for the case where ulim = 0 this is because of the suddenchange in force direction at reversal. This spike is not seen for the caseswhere the boundary friction is scaled. The spike is not something thatwould occur in an actual engine during operation. The reversal of thering is slower than the reversal of the piston since the piston ring canmove axially in the groove. In the real application the ring is forced
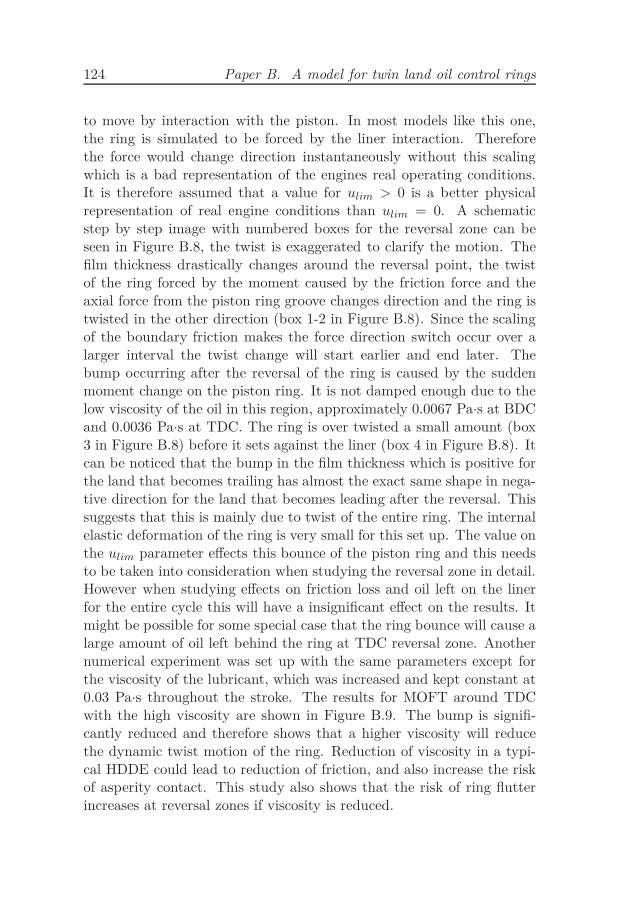
124 Paper B. A model for twin land oil control rings
to move by interaction with the piston. In most models like this one,the ring is simulated to be forced by the liner interaction. Thereforethe force would change direction instantaneously without this scalingwhich is a bad representation of the engines real operating conditions.It is therefore assumed that a value for ulim > 0 is a better physicalrepresentation of real engine conditions than ulim = 0. A schematicstep by step image with numbered boxes for the reversal zone can beseen in Figure B.8, the twist is exaggerated to clarify the motion. Thefilm thickness drastically changes around the reversal point, the twistof the ring forced by the moment caused by the friction force and theaxial force from the piston ring groove changes direction and the ring istwisted in the other direction (box 1-2 in Figure B.8). Since the scalingof the boundary friction makes the force direction switch occur over alarger interval the twist change will start earlier and end later. Thebump occurring after the reversal of the ring is caused by the suddenmoment change on the piston ring. It is not damped enough due to thelow viscosity of the oil in this region, approximately 0.0067 Pa·s at BDCand 0.0036 Pa·s at TDC. The ring is over twisted a small amount (box3 in Figure B.8) before it sets against the liner (box 4 in Figure B.8). Itcan be noticed that the bump in the film thickness which is positive forthe land that becomes trailing has almost the exact same shape in nega-tive direction for the land that becomes leading after the reversal. Thissuggests that this is mainly due to twist of the entire ring. The internalelastic deformation of the ring is very small for this set up. The value onthe ulim parameter effects this bounce of the piston ring and this needsto be taken into consideration when studying the reversal zone in detail.However when studying effects on friction loss and oil left on the linerfor the entire cycle this will have a insignificant effect on the results. Itmight be possible for some special case that the ring bounce will cause alarge amount of oil left behind the ring at TDC reversal zone. Anothernumerical experiment was set up with the same parameters except forthe viscosity of the lubricant, which was increased and kept constant at0.03 Pa·s throughout the stroke. The results for MOFT around TDCwith the high viscosity are shown in Figure B.9. The bump is signifi-cantly reduced and therefore shows that a higher viscosity will reducethe dynamic twist motion of the ring. Reduction of viscosity in a typi-cal HDDE could lead to reduction of friction, and also increase the riskof asperity contact. This study also shows that the risk of ring flutterincreases at reversal zones if viscosity is reduced.
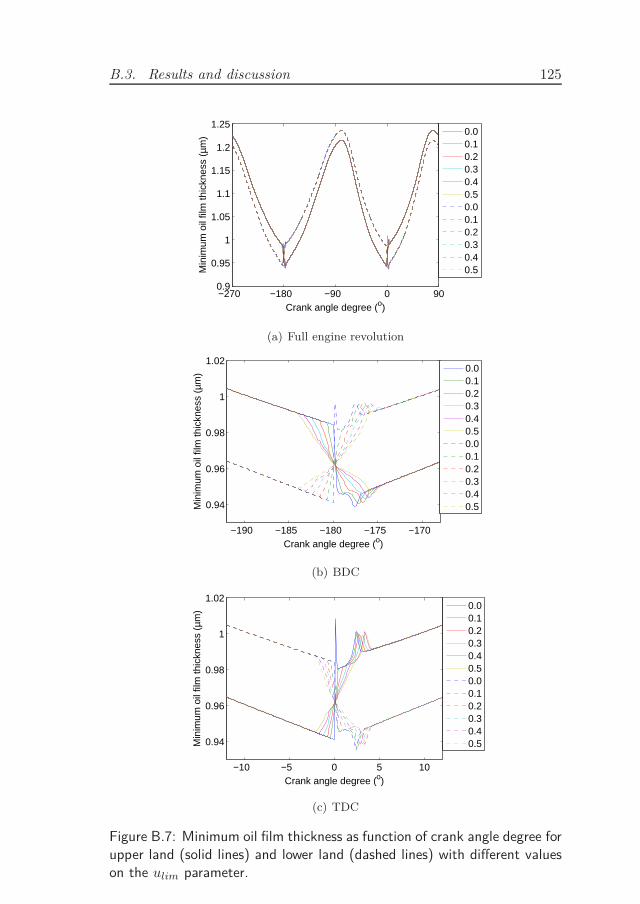
B.3. Results and discussion 125
−270 −180 −90 0 900.9
0.95
1
1.05
1.1
1.15
1.2
1.25
Crank angle degree (o)
Min
imum
oil
film
thic
knes
s (µ
m)
0.00.10.20.30.40.50.00.10.20.30.40.5
(a) Full engine revolution
−190 −185 −180 −175 −170
0.94
0.96
0.98
1
1.02
Crank angle degree (o)
Min
imum
oil
film
thic
knes
s (µ
m)
0.00.10.20.30.40.50.00.10.20.30.40.5
(b) BDC
−10 −5 0 5 10
0.94
0.96
0.98
1
1.02
Crank angle degree (o)
Min
imum
oil
film
thic
knes
s (µ
m)
0.00.10.20.30.40.50.00.10.20.30.40.5
(c) TDC
Figure B.7: Minimum oil film thickness as function of crank angle degree forupper land (solid lines) and lower land (dashed lines) with different valueson the ulim parameter.
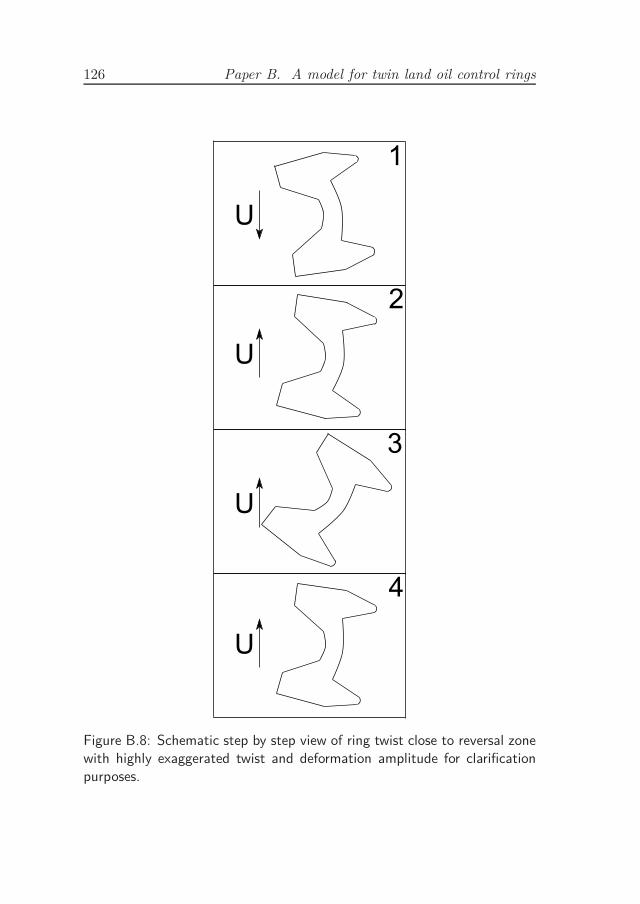
126 Paper B. A model for twin land oil control rings
Figure B.8: Schematic step by step view of ring twist close to reversal zonewith highly exaggerated twist and deformation amplitude for clarificationpurposes.
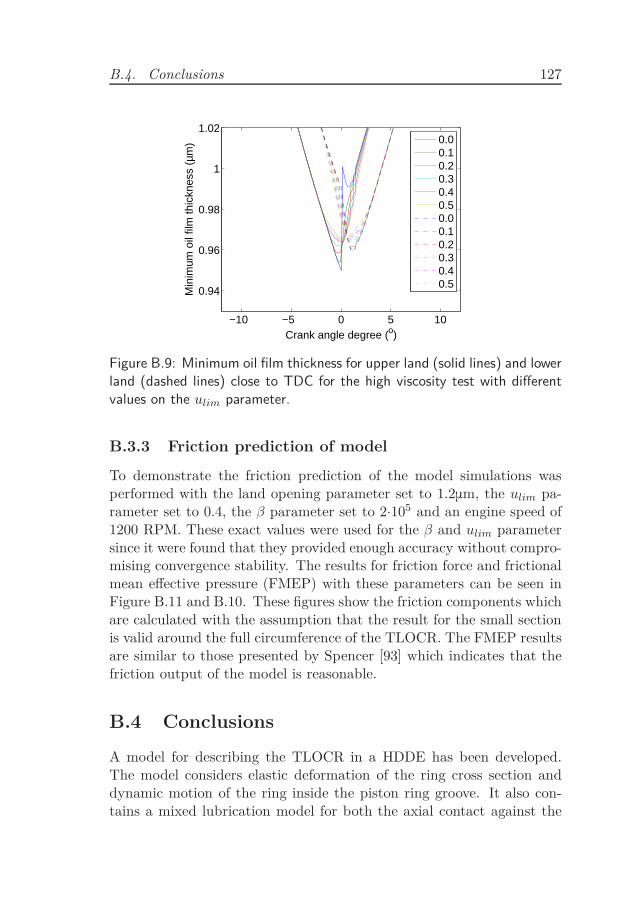
B.4. Conclusions 127
−10 −5 0 5 10
0.94
0.96
0.98
1
1.02
Crank angle degree (o)
Min
imum
oil
film
thic
knes
s (µ
m)
0.00.10.20.30.40.50.00.10.20.30.40.5
Figure B.9: Minimum oil film thickness for upper land (solid lines) and lowerland (dashed lines) close to TDC for the high viscosity test with differentvalues on the ulim parameter.
B.3.3 Friction prediction of model
To demonstrate the friction prediction of the model simulations wasperformed with the land opening parameter set to 1.2μm, the ulim pa-rameter set to 0.4, the β parameter set to 2·105 and an engine speed of1200 RPM. These exact values were used for the β and ulim parametersince it were found that they provided enough accuracy without compro-mising convergence stability. The results for friction force and frictionalmean effective pressure (FMEP) with these parameters can be seen inFigure B.11 and B.10. These figures show the friction components whichare calculated with the assumption that the result for the small sectionis valid around the full circumference of the TLOCR. The FMEP resultsare similar to those presented by Spencer [93] which indicates that thefriction output of the model is reasonable.
B.4 Conclusions
A model for describing the TLOCR in a HDDE has been developed.The model considers elastic deformation of the ring cross section anddynamic motion of the ring inside the piston ring groove. It also con-tains a mixed lubrication model for both the axial contact against the
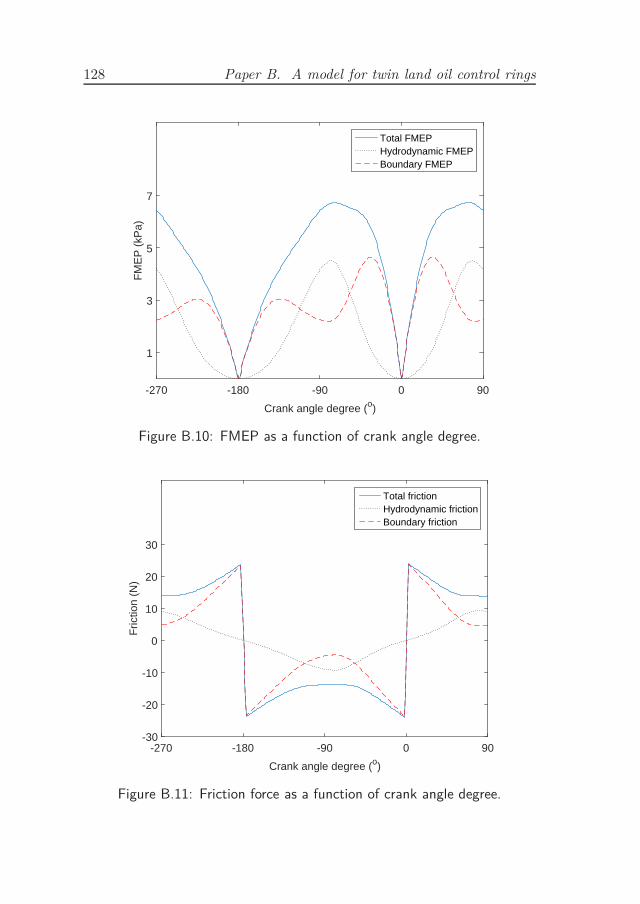
128 Paper B. A model for twin land oil control rings
Crank angle degree (o)
-270 -180 -90 0 90
FM
EP
(kP
a)
1
3
5
7
Total FMEPHydrodynamic FMEPBoundary FMEP
Figure B.10: FMEP as a function of crank angle degree.
Crank angle degree (o)
-270 -180 -90 0 90
Fric
tion
(N)
-30
-20
-10
0
10
20
30
Total frictionHydrodynamic frictionBoundary friction
Figure B.11: Friction force as a function of crank angle degree.
B.4. Conclusions 129
piston ring groove and the radial contact against the cylinder liner. Amass conserving cavitation model in the piston ring to cylinder liner in-terface is implemented. The compromise that has to be made betweenload carrying accuracy and convergence of the model are showed anddiscussed. To achieve convergence close to reversal zone a relaxation ofthe boundary friction force applied to the ring was implemented. Theeffect of this relaxation method on the result are showed and discussed.The relaxation of the force showed no effect on friction or film thick-ness result for the major part of the stroke. But it has an effect on thedynamics around reversal zone since the forces applied to the ring isaltered. This effect is discussed in the paper and it can be concludedthat one must be careful with this scaling when studying the motion ofthe ring around reversal zone. However the motion pattern for the twistof the ring is still captured by the model but the amplitudes and exactlocation on the stroke will be slightly affected.
Acknowledgement
The author would like to thank Scania, AB Volvo, Energimyndigheten,and the Energy Efficient Vehicle programme for funding this work.

Paper C
Component test for
simulation of piston
ring-Cylinder liner friction
at realistic speeds
131

133
Tribology International vol. 104, pp. 57-63, 2016.
Component test for simulation of piston ring-Cylinder
liner friction at realistic speeds
M. Söderfjäll, A. Almqvist and R. Larsson
Luleå University of Technology, Division of Machine Elements,
Luleå, SE-971 87 Sweden
Abstract
The piston ring cylinder liner contact is a large contributor to mechanicalfriction losses in internal combustion engines. It is therefore importantto have methods and tools available for investigations of these frictionallosses. This paper describes the design of a novel component test rigwhich is developed to be run at high speeds with unmodified productionpiston rings and cylinder liners from heavy duty diesel engines. A sim-plified floating liner method is used and the test equipment is developedto fill the gap in between a full floating liner engine and typical compo-nent bench test equipment. The functionality and repeatability of thetest are investigated and an unexpected behaviour of the twin land oilcontrol ring is found.
134 Paper C. Component test
C.1 Introduction
Fuel consumption is of high priority for today’s engine manufacturer.The frictional losses in a Heavy Duty Diesel Engine (HDDE) are re-sponsible for between two and five percent of the fuel consumption innormal driving cycles. For these frictional losses, the piston and pistonrings are responsible for approximately half [7]. Therefore it is of greatimportance to have tools available for evaluation of friction in the inter-face between piston ring and cylinder liner. In this paper such a tool,a new test rig, is described. The test rig can be used for investigationof effects from different components and running conditions but alsofor validation of numerical simulation models. In [94], Priest suggestedthat future progress in simulation of the piston ring contact, specificallywith consideration to the complex modelling of the cavitation problem,must be based on combined theoretical and experimental approaches.Many different component test rigs has been previously developed andused [50–57]. These types of test rigs usually operate at low speedswhich is not optimal for evaluation of friction benefits that can affectfuel consumption. Low speed test rigs are best used for investigatingoperation close to reversal zones. Examples of this are [111, 112] wheredifferent low speed reciprocating rigs were used to simulate wear andscuffing behaviour of piston rings at TDC. According to the author’sknowledge, today’s fastest operating component test rig is the one de-veloped by Akalin and Newaz [54] which has a stroke of 84 mm andmaximum rotational speed of 750 RPM. These component test rigs usessections of cylinder liners and piston rings, this makes the changing ofcomponents very fast and also makes it convenient to vary the load fromthe piston ring on the cylinder liner. However there are a few drawbackswith these types of set-ups. The alignment between the mating compo-nents is crucial and time consuming. Also the loading of the piston ringagainst the cylinder liner will differ from the real engine and the realring gap effect will not be represented. There are, however many testrigs that can be used to investigate the friction of the complete pistonrings. Among these we find the so called floating liner engines, often ina single cylinder configuration. Some example of studies where floatingliner test rigs has been used are [10, 58–65]. These test rigs representsthe engine very well and advanced systems for measuring oil film thick-ness and piston ring dynamics in realistic conditions can be added suchas in the work by Kirner et al. [113]. However the full scale engines re-
C.2. Design of the test rig 135
sults in rather expensive testing and investigating a variety of differentcomponents can be much more time consuming than in a componenttest rigs. According to Furuhama et al. [58] the main challenges of thefloating liner is the to prevent the gas pressure from leaking out fromthe combustion chamber. Another difficulty with the floating liner en-gine is that the gas pressure and dynamic forces will disturb the frictionmeasurement to some extent. The component test rig described in thispaper is developed as something in between the commonly used cylinderliner segment type component test rigs and the floating liner test rig.This gives the possibility to quickly investigate friction between differentsets of piston rings and cylinder liners with standard HDDE componentsat engine like operating conditions.
C.2 Design of the test rig
This section describes the fundamental design of the test rig and showsthe implemented features. The test rig is designed with the requirementto operate with piston speeds close to those of a typical HDDE, alsostandard production parts should be mounted without extensive modi-fication or machining. A picture of and a schematic view of the entiretest rig can be seen in Figure C.1 and C.2 respectively.
C.2.1 Base crank device
The high speed required will generate large dynamic forces compared tothe relatively small friction forces that are measured and therefore it isimportant to have as little vibrations as possible. The test rig uses aninline six cylinder engine as a crank device due to the low vibrations ofsuch. In theory, an inline six perfectly balances the first two orders ofvibrations which is approximately 98% of the vibrations for most enginedesigns. The engine selected to act as the base for the test rig is a VolvoB6304 [114]. This engine has a bore of 83 mm, a stroke of 90 mm and aneffective con rod length of 139.5 mm. The cylinder head was removedfrom the engine block and the oil supply that would lubricate the cammechanism was closed since the rig should be rotated with an electricmotor instead of combustion. A shaft with a flange was machined andbolted to the engine crankshaft together with the flywheel.
The crank shaft assembly was dynamically balanced to an unbal-ance of 0.13 g at 1300 RPM. The engine block was then connected via
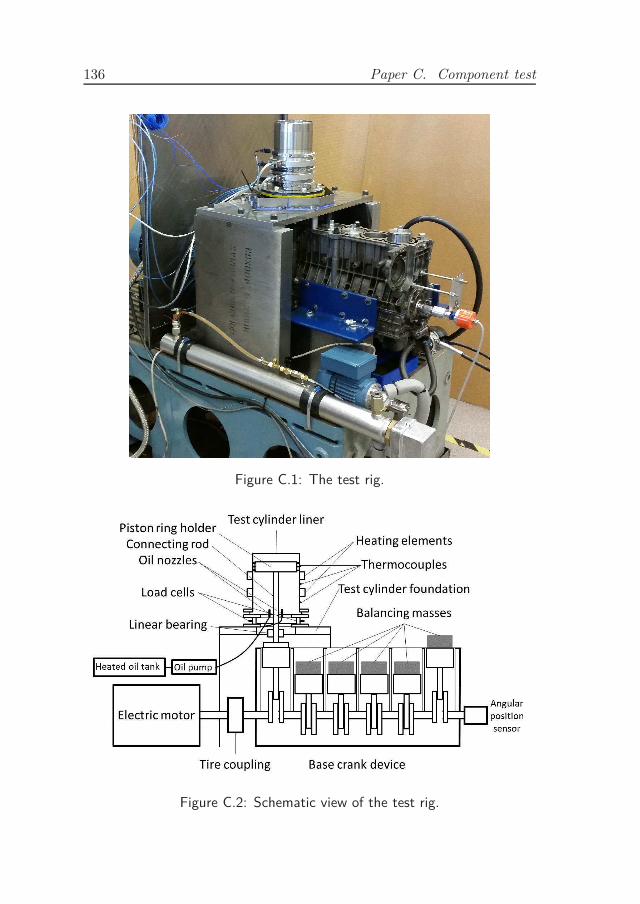
136 Paper C. Component test
Figure C.1: The test rig.
Figure C.2: Schematic view of the test rig.
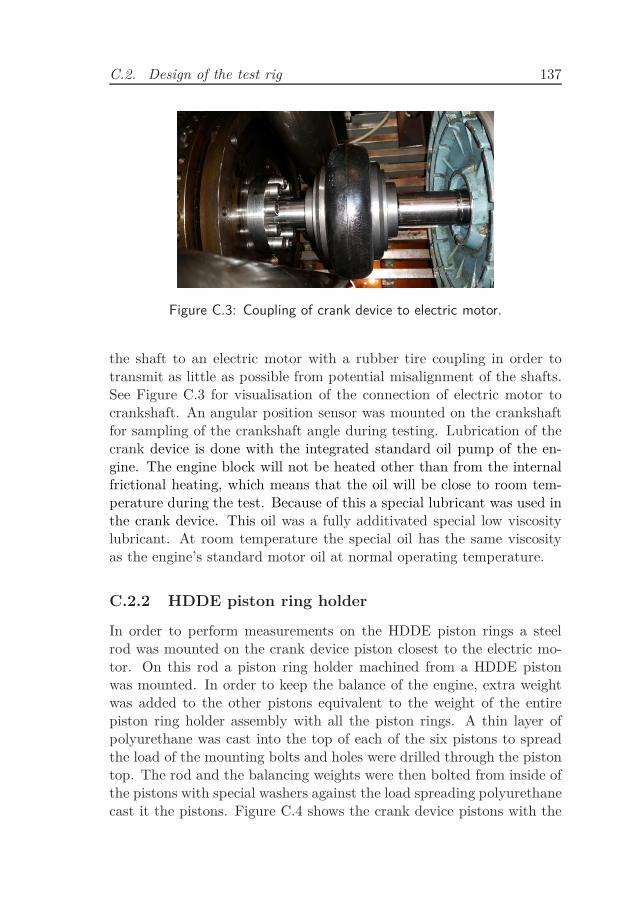
C.2. Design of the test rig 137
Figure C.3: Coupling of crank device to electric motor.
the shaft to an electric motor with a rubber tire coupling in order totransmit as little as possible from potential misalignment of the shafts.See Figure C.3 for visualisation of the connection of electric motor tocrankshaft. An angular position sensor was mounted on the crankshaftfor sampling of the crankshaft angle during testing. Lubrication of thecrank device is done with the integrated standard oil pump of the en-gine. The engine block will not be heated other than from the internalfrictional heating, which means that the oil will be close to room tem-perature during the test. Because of this a special lubricant was used inthe crank device. This oil was a fully additivated special low viscositylubricant. At room temperature the special oil has the same viscosityas the engine’s standard motor oil at normal operating temperature.
C.2.2 HDDE piston ring holder
In order to perform measurements on the HDDE piston rings a steelrod was mounted on the crank device piston closest to the electric mo-tor. On this rod a piston ring holder machined from a HDDE pistonwas mounted. In order to keep the balance of the engine, extra weightwas added to the other pistons equivalent to the weight of the entirepiston ring holder assembly with all the piston rings. A thin layer ofpolyurethane was cast into the top of each of the six pistons to spreadthe load of the mounting bolts and holes were drilled through the pistontop. The rod and the balancing weights were then bolted from inside ofthe pistons with special washers against the load spreading polyurethanecast it the pistons. Figure C.4 shows the crank device pistons with the
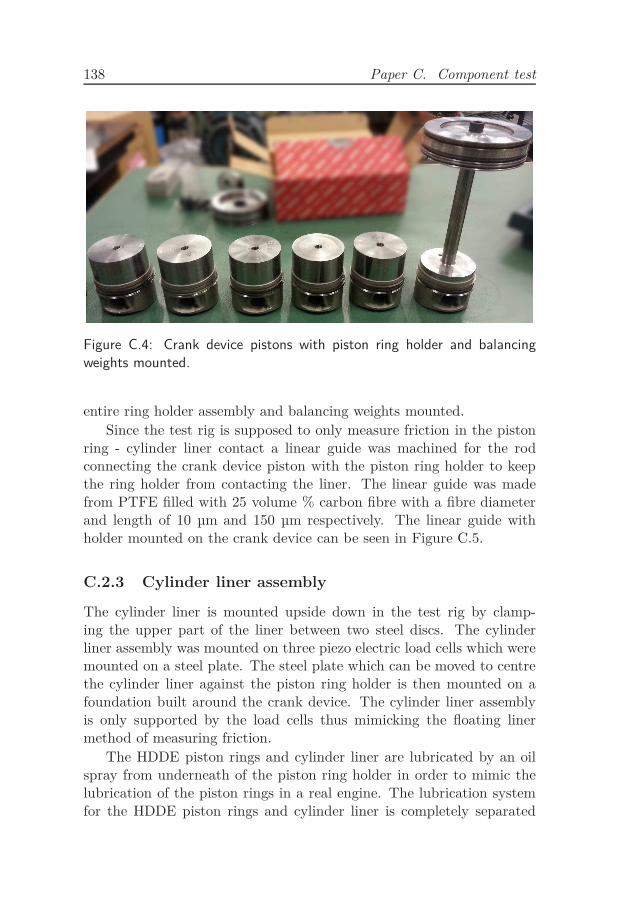
138 Paper C. Component test
Figure C.4: Crank device pistons with piston ring holder and balancingweights mounted.
entire ring holder assembly and balancing weights mounted.
Since the test rig is supposed to only measure friction in the pistonring - cylinder liner contact a linear guide was machined for the rodconnecting the crank device piston with the piston ring holder to keepthe ring holder from contacting the liner. The linear guide was madefrom PTFE filled with 25 volume % carbon fibre with a fibre diameterand length of 10 µm and 150 µm respectively. The linear guide withholder mounted on the crank device can be seen in Figure C.5.
C.2.3 Cylinder liner assembly
The cylinder liner is mounted upside down in the test rig by clamp-ing the upper part of the liner between two steel discs. The cylinderliner assembly was mounted on three piezo electric load cells which weremounted on a steel plate. The steel plate which can be moved to centrethe cylinder liner against the piston ring holder is then mounted on afoundation built around the crank device. The cylinder liner assemblyis only supported by the load cells thus mimicking the floating linermethod of measuring friction.
The HDDE piston rings and cylinder liner are lubricated by an oilspray from underneath of the piston ring holder in order to mimic thelubrication of the piston rings in a real engine. The lubrication systemfor the HDDE piston rings and cylinder liner is completely separated
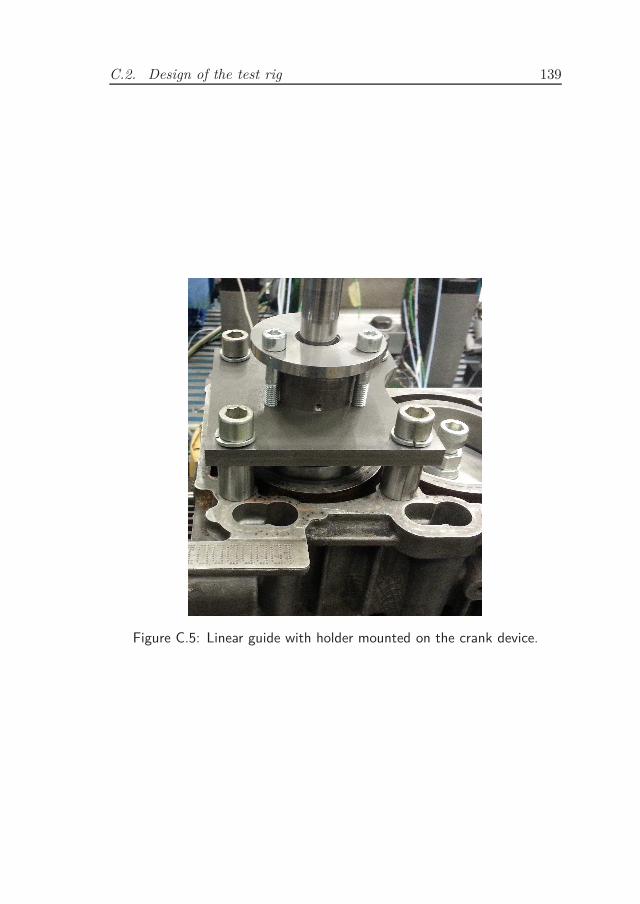
C.2. Design of the test rig 139
Figure C.5: Linear guide with holder mounted on the crank device.
140 Paper C. Component test
Table C.1: Components in measuring system.
Component Type
Thermocouples Type K
Load cells PCB 208C02
Signal conditioner PCB 442B104
Angular position sensor Fritz Kübler 8.58
Controller NI cRIO-9068
from the lubrication of the crank device. It consists of a heated oil tankwith a pump that distributes oil to the test cylinder which are then leadback to the heated oil tank. The temperature of the oil is regulatedby measuring the temperature of the oil close to the exit inside of thespraying nozzle.
The cylinder liner is heated by two ceramic heating elements clampedaround the circumference. In total, nine thermocouples are fitted on theoutside perimeter of the cylinder liner on three different locations, top-, mid- and bottom- part of the stroke, three on each stroke locationevenly distributed around the circumference. The average temperaturearound the circumference at the top- and bottom- part of the stroke isthen used for regulation of the heating elements. The thermocoupleson the mid- part of the stroke is only used for measurement of thetemperature. A cylinder liner assembly mounted on the foundation withheating elements and thermocouples mounted can be seen in Figure C.6.
C.2.4 Measuring system
Table C.1 shows a specification of the components used in the measuringsystem. The software for temperature control and sampling of data waswritten in LabView.
C.3 Experimental parameters
In order to test the the capability of the test rig a number of differentexperiments were performed. In a typical HDDE three piston rings aremounted on each piston, two compression rings at the top and one twinland oil control ring (TLOCR) at the bottom. In one of the test ofthe test rig capability the amount of piston rings was varied. Tests
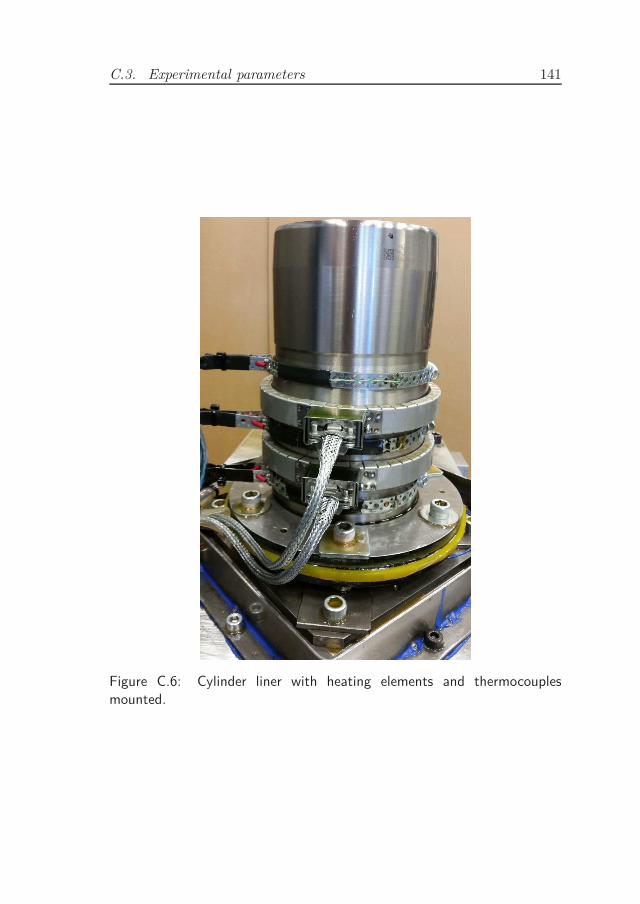
C.3. Experimental parameters 141
Figure C.6: Cylinder liner with heating elements and thermocouplesmounted.
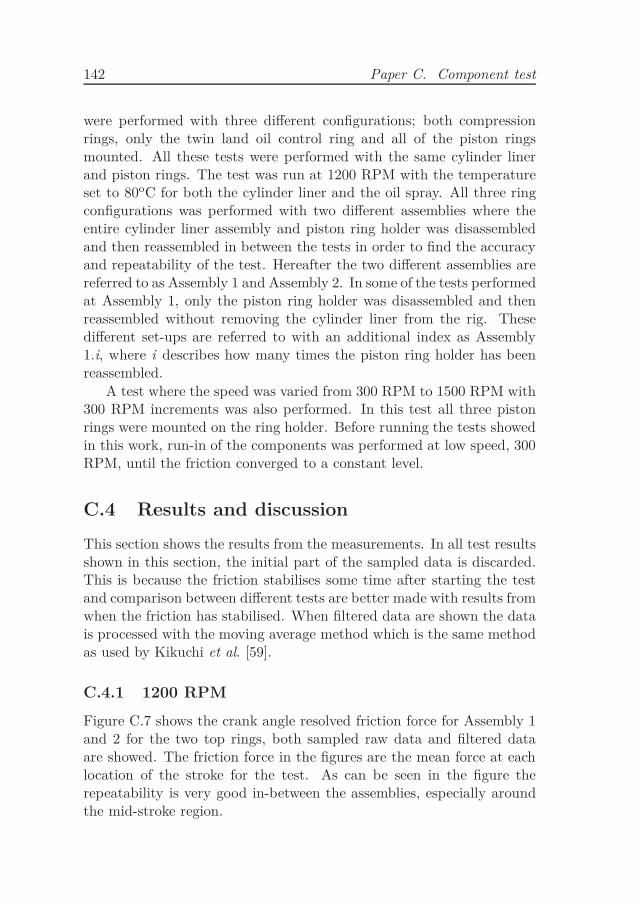
142 Paper C. Component test
were performed with three different configurations; both compressionrings, only the twin land oil control ring and all of the piston ringsmounted. All these tests were performed with the same cylinder linerand piston rings. The test was run at 1200 RPM with the temperatureset to 80oC for both the cylinder liner and the oil spray. All three ringconfigurations was performed with two different assemblies where theentire cylinder liner assembly and piston ring holder was disassembledand then reassembled in between the tests in order to find the accuracyand repeatability of the test. Hereafter the two different assemblies arereferred to as Assembly 1 and Assembly 2. In some of the tests performedat Assembly 1, only the piston ring holder was disassembled and thenreassembled without removing the cylinder liner from the rig. Thesedifferent set-ups are referred to with an additional index as Assembly1.i, where i describes how many times the piston ring holder has beenreassembled.
A test where the speed was varied from 300 RPM to 1500 RPM with300 RPM increments was also performed. In this test all three pistonrings were mounted on the ring holder. Before running the tests showedin this work, run-in of the components was performed at low speed, 300RPM, until the friction converged to a constant level.
C.4 Results and discussion
This section shows the results from the measurements. In all test resultsshown in this section, the initial part of the sampled data is discarded.This is because the friction stabilises some time after starting the testand comparison between different tests are better made with results fromwhen the friction has stabilised. When filtered data are shown the datais processed with the moving average method which is the same methodas used by Kikuchi et al. [59].
C.4.1 1200 RPM
Figure C.7 shows the crank angle resolved friction force for Assembly 1and 2 for the two top rings, both sampled raw data and filtered dataare showed. The friction force in the figures are the mean force at eachlocation of the stroke for the test. As can be seen in the figure therepeatability is very good in-between the assemblies, especially aroundthe mid-stroke region.
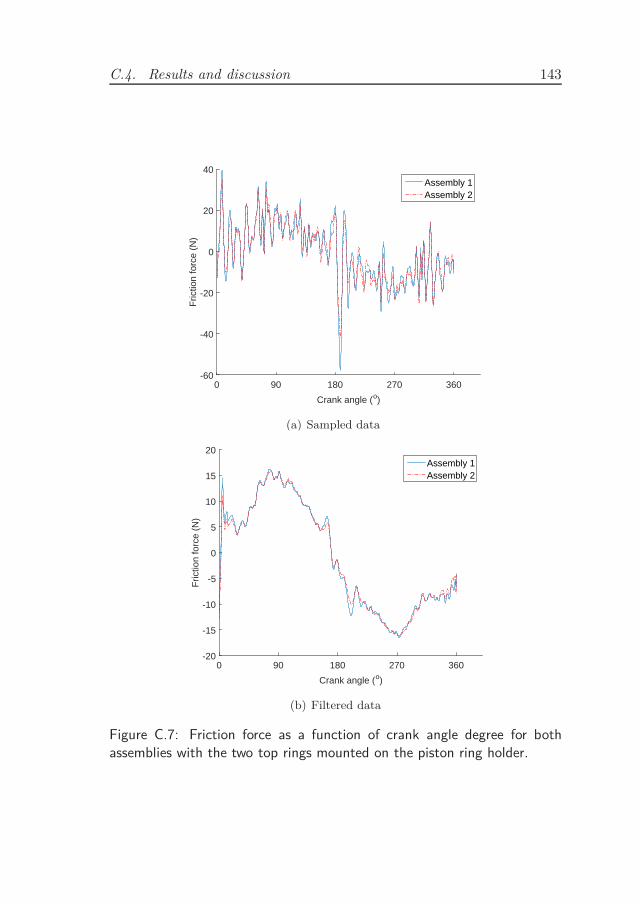
C.4. Results and discussion 143
Crank angle (o)
0 90 180 270 360
Fric
tion
forc
e (N
)
-60
-40
-20
0
20
40Assembly 1Assembly 2
(a) Sampled data
Crank angle (o)
0 90 180 270 360
Fric
tion
forc
e (N
)
-20
-15
-10
-5
0
5
10
15
20Assembly 1Assembly 2
(b) Filtered data
Figure C.7: Friction force as a function of crank angle degree for bothassemblies with the two top rings mounted on the piston ring holder.
144 Paper C. Component test
For the test with only TLOCR two different friction levels was ob-served. Because of this several tests were performed with different set-ups at Assembly 1 with reassembly of only the piston ring holder. FigureC.8 shows the average friction power at each stroke as a function of testduration for four different set-ups at Assembly 1 and one at Assembly2. The two different levels of friction for the TLOCR are very distinctand in Assembly 1.2 both levels were observed in the same test. Thereason for the different friction levels is believed to be caused by thespring which is forcing the ring against the cylinder liner. The springcan get stuck at one or several of the lubrication holes or ring gap ofthe TLOCR and therefore not distribute the load evenly around the cir-cumference. Since the friction increased during the test for Assembly1.2 it seems reasonable to assume that the spring was initially stuck inthe TLOCR and then broke free resulting in a more evenly distributedload. If the load is not evenly distributed it could potentially cause thefriction to be high at some sections of the ring contact and very lowin other sections resulting in a total reduction of friction. With thisassumption the low level friction condition would also let more oil passthe TLOCR since it must have a greater mean separation around thecircumference compared to the high friction level. Figure C.9 shows thecrank angle resolved mean friction force for the TLOCR tests. It canbe seen that the friction around midstroke is lower and friction aroundbottom reversal zone (180oCrank angle) are higher for the low frictionlevel test which would strengthen the theory of the load being unevenlyspread around the circumference.
The crank angle resolved mean friction force result for the test withall of the rings mounted on the ring holder are showed in Figure C.10.These results are of course affected by the different friction levels ofthe TLOCR. Also here the piston ring holder was disassembled andreassembled in-between Assembly 1 and Assembly 1.1. It can be noticedthat the result for Assembly 1.1 and Assembly 2 are very similar to eachother while the result from Assembly 1 shows higher frictional losses.This is believed to be an effect from the different friction levels foundfor the TLOCR.
In order to compare the difference in friction power from the differentring set-ups, all of the earlier showed results are compiled into FigureC.11. This figure shows the mean value for the average friction powerat each stroke as a function of test duration. The mean values for thefriction power results showed in this section can be seen in Table C.2.
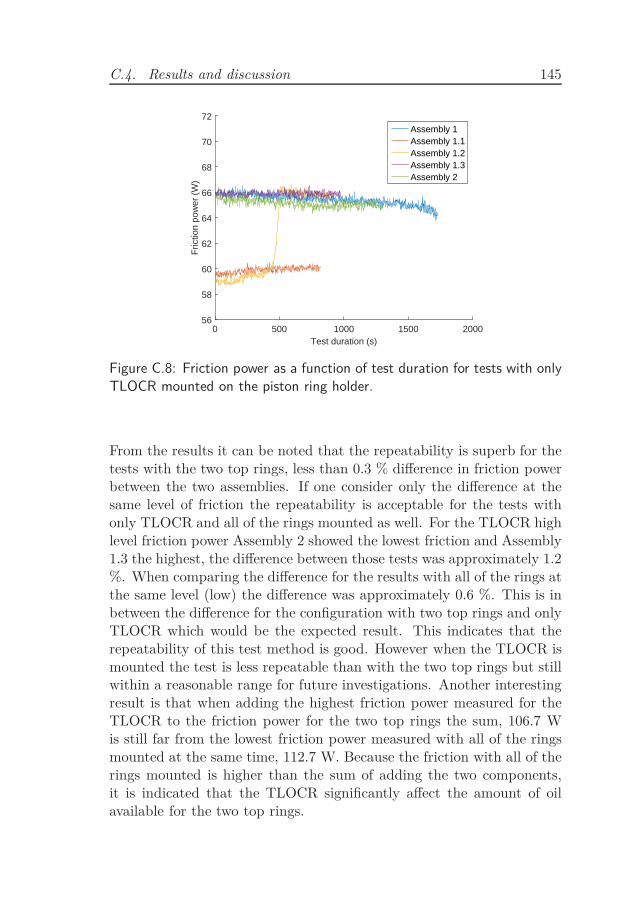
C.4. Results and discussion 145
Test duration (s)0 500 1000 1500 2000
Fric
tion
pow
er (
W)
56
58
60
62
64
66
68
70
72Assembly 1Assembly 1.1Assembly 1.2Assembly 1.3Assembly 2
Figure C.8: Friction power as a function of test duration for tests with onlyTLOCR mounted on the piston ring holder.
From the results it can be noted that the repeatability is superb for thetests with the two top rings, less than 0.3 % difference in friction powerbetween the two assemblies. If one consider only the difference at thesame level of friction the repeatability is acceptable for the tests withonly TLOCR and all of the rings mounted as well. For the TLOCR highlevel friction power Assembly 2 showed the lowest friction and Assembly1.3 the highest, the difference between those tests was approximately 1.2%. When comparing the difference for the results with all of the rings atthe same level (low) the difference was approximately 0.6 %. This is inbetween the difference for the configuration with two top rings and onlyTLOCR which would be the expected result. This indicates that therepeatability of this test method is good. However when the TLOCR ismounted the test is less repeatable than with the two top rings but stillwithin a reasonable range for future investigations. Another interestingresult is that when adding the highest friction power measured for theTLOCR to the friction power for the two top rings the sum, 106.7 Wis still far from the lowest friction power measured with all of the ringsmounted at the same time, 112.7 W. Because the friction with all of therings mounted is higher than the sum of adding the two components,it is indicated that the TLOCR significantly affect the amount of oilavailable for the two top rings.
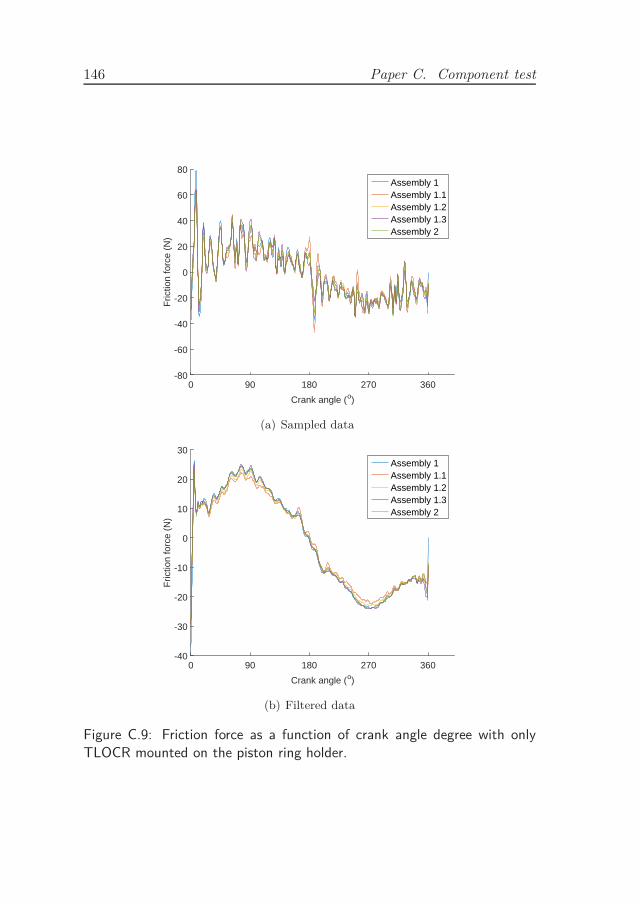
146 Paper C. Component test
Crank angle (o)
0 90 180 270 360
Fric
tion
forc
e (N
)
-80
-60
-40
-20
0
20
40
60
80Assembly 1Assembly 1.1Assembly 1.2Assembly 1.3Assembly 2
(a) Sampled data
Crank angle (o)
0 90 180 270 360
Fric
tion
forc
e (N
)
-40
-30
-20
-10
0
10
20
30Assembly 1Assembly 1.1Assembly 1.2Assembly 1.3Assembly 2
(b) Filtered data
Figure C.9: Friction force as a function of crank angle degree with onlyTLOCR mounted on the piston ring holder.
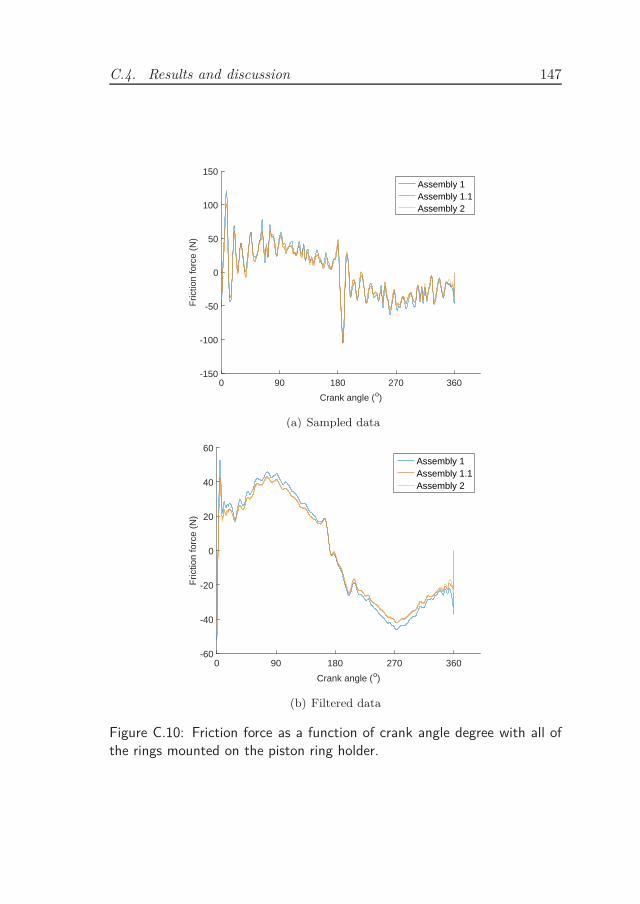
C.4. Results and discussion 147
Crank angle (o)
0 90 180 270 360
Fric
tion
forc
e (N
)
-150
-100
-50
0
50
100
150Assembly 1Assembly 1.1Assembly 2
(a) Sampled data
Crank angle (o)
0 90 180 270 360
Fric
tion
forc
e (N
)
-60
-40
-20
0
20
40
60Assembly 1Assembly 1.1Assembly 2
(b) Filtered data
Figure C.10: Friction force as a function of crank angle degree with all ofthe rings mounted on the piston ring holder.
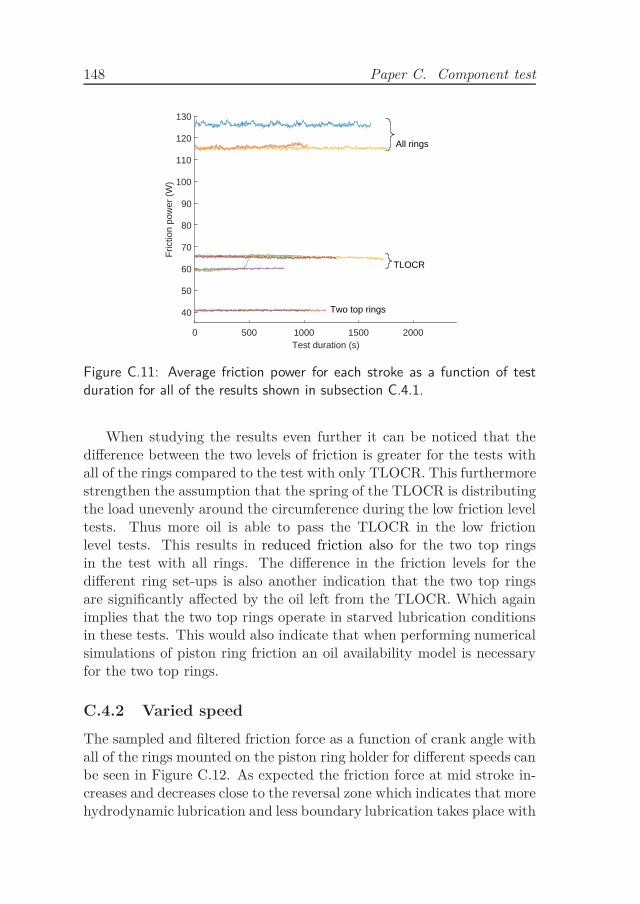
148 Paper C. Component test
Test duration (s)0 500 1000 1500 2000
Fric
tion
pow
er (
W)
40
50
60
70
80
90
100
110
120
130
All rings
TLOCR
Two top rings
Figure C.11: Average friction power for each stroke as a function of testduration for all of the results shown in subsection C.4.1.
When studying the results even further it can be noticed that thedifference between the two levels of friction is greater for the tests withall of the rings compared to the test with only TLOCR. This furthermorestrengthen the assumption that the spring of the TLOCR is distributingthe load unevenly around the circumference during the low friction leveltests. Thus more oil is able to pass the TLOCR in the low frictionlevel tests. This results in reduced friction also for the two top ringsin the test with all rings. The difference in the friction levels for thedifferent ring set-ups is also another indication that the two top ringsare significantly affected by the oil left from the TLOCR. Which againimplies that the two top rings operate in starved lubrication conditionsin these tests. This would also indicate that when performing numericalsimulations of piston ring friction an oil availability model is necessaryfor the two top rings.
C.4.2 Varied speed
The sampled and filtered friction force as a function of crank angle withall of the rings mounted on the piston ring holder for different speeds canbe seen in Figure C.12. As expected the friction force at mid stroke in-creases and decreases close to the reversal zone which indicates that morehydrodynamic lubrication and less boundary lubrication takes place with
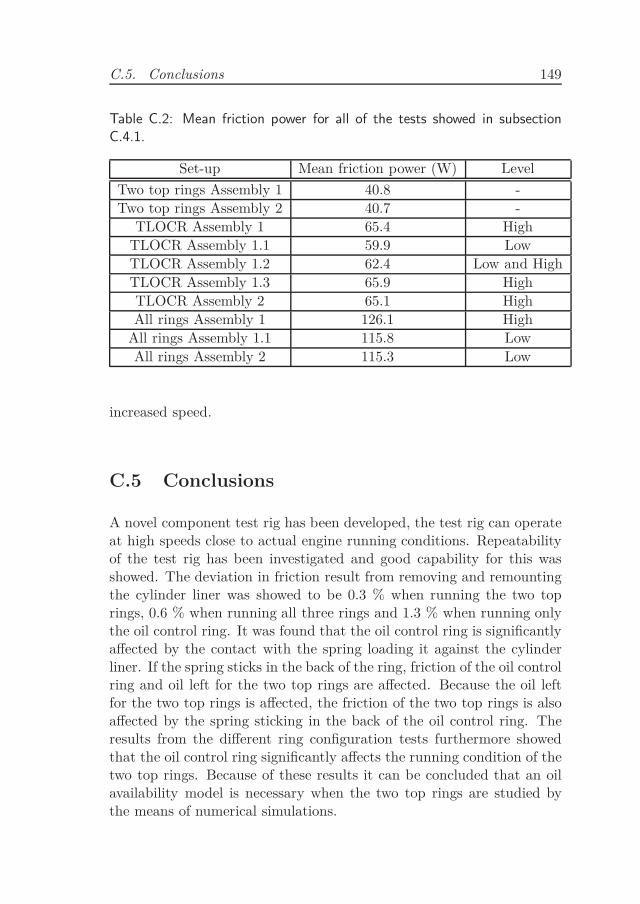
C.5. Conclusions 149
Table C.2: Mean friction power for all of the tests showed in subsectionC.4.1.
Set-up Mean friction power (W) Level
Two top rings Assembly 1 40.8 -
Two top rings Assembly 2 40.7 -
TLOCR Assembly 1 65.4 High
TLOCR Assembly 1.1 59.9 Low
TLOCR Assembly 1.2 62.4 Low and High
TLOCR Assembly 1.3 65.9 High
TLOCR Assembly 2 65.1 High
All rings Assembly 1 126.1 High
All rings Assembly 1.1 115.8 Low
All rings Assembly 2 115.3 Low
increased speed.
C.5 Conclusions
A novel component test rig has been developed, the test rig can operateat high speeds close to actual engine running conditions. Repeatabilityof the test rig has been investigated and good capability for this wasshowed. The deviation in friction result from removing and remountingthe cylinder liner was showed to be 0.3 % when running the two toprings, 0.6 % when running all three rings and 1.3 % when running onlythe oil control ring. It was found that the oil control ring is significantlyaffected by the contact with the spring loading it against the cylinderliner. If the spring sticks in the back of the ring, friction of the oil controlring and oil left for the two top rings are affected. Because the oil leftfor the two top rings is affected, the friction of the two top rings is alsoaffected by the spring sticking in the back of the oil control ring. Theresults from the different ring configuration tests furthermore showedthat the oil control ring significantly affects the running condition of thetwo top rings. Because of these results it can be concluded that an oilavailability model is necessary when the two top rings are studied bythe means of numerical simulations.
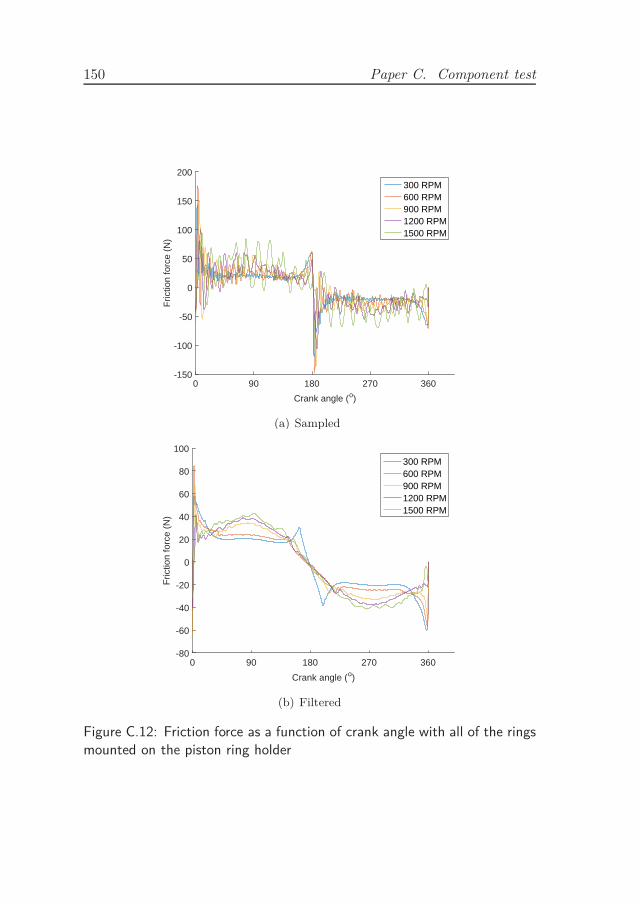
150 Paper C. Component test
Crank angle (o)
0 90 180 270 360
Fric
tion
forc
e (N
)
-150
-100
-50
0
50
100
150
200300 RPM600 RPM900 RPM1200 RPM1500 RPM
(a) Sampled
Crank angle (o)
0 90 180 270 360
Fric
tion
forc
e (N
)
-80
-60
-40
-20
0
20
40
60
80
100300 RPM600 RPM900 RPM1200 RPM1500 RPM
(b) Filtered
Figure C.12: Friction force as a function of crank angle with all of the ringsmounted on the piston ring holder
C.5. Conclusions 151
Acknowledgement
The authors would like to thank Scania, AB Volvo and Energimyn-digheten and the Energy Efficient Vehicle programme for founding thiswork. The authors would also like to thank Statoil Fuel & Retail Swe-den AB for providing lubricant for the crank device and Key Laboratoryof Materials-oriented Chemical Engineering at Nanjing Tech University,China for providing the material for the linear bearing. Finally theauthors would like to thank The Swedish research council.

Paper D
Texture induced effects
causing reduction of
friction in mixed
lubrication for twin land oil
control rings
153

155
Accepted for publication in: Proceedings of the Institution of
Mechanical Engineers, Part J: Journal of Engineering Tribology
Texture induced effects causing reduction of friction in
mixed lubrication for twin land oil control rings
M. Söderfjäll, R. Larsson and A. Almqvist
Luleå University of Technology, Division of Machine Elements,
Luleå, SE-971 87 Sweden
Abstract
The piston rings are responsible for a major part of the frictional lossesin a heavy duty diesel engine. Applying texture such as dimples on thecylinder liner surface could reduce these losses. This paper investigatesthe effect on friction between a land of the oil control ring and a tex-tured cylinder liner by the means of numerical simulation. A simulationmodel considering inertia and mixed lubrication together with a massconserving cavitation model is developed. The model is used to find thedimple parameters which result in the lowest friction for a specific heavyduty diesel engine oil control ring.
156 Paper D. Texture induced effects causing reduction of friction
D.1 Introduction
Reduced fuel consumption is of high priority in the automotive industrytoday. Mechanical friction is a large contributor to fuel consumption in aheavy duty diesel engine (HDDE). The piston and piston ring pack is re-sponsible for about half of these frictional losses [7]. The largest amountof frictional losses from a single component is the twin land oil controlring (TLOCR) [7,9]. The TLOCR is a two piece piston ring where onepiece is the spring, situated on the backside of the ring, forcing it againstthe cylinder liner. The other piece is the ring itself which has two landsthat are in contact with the cylinder liner. In order to investigate thepotential for friction reduction, this study is focusing on contact betweena single land of the TLOCR and cylinder liner. Applying surface textureon the cylinder liner surface could reduce these losses. The textures inthis investigation are of dimple type. Yu et al. [40] stated that microhydrodynamic effects are the most dominant load carrying effect fromsurface texture at low loads and high speeds. This is the conditions thata TLOCR typically operates in especially around mid-stroke where alsothe frictional power losses are the greatest. The TLOCR land which isin contact with the cylinder liner surface is in many cases almost parallelto the cylinder liner surface with a tiny wedge, this gives good possibil-ity for increasing the hydrodynamic lift by surface texture. The moreparallel the contacting surfaces are the more hydrodynamic lift can begenerated by implementing surface texture [42]. If the wanted outcomefrom a textured surface is lower friction, the aim should be either toincrease the average film thickness between the ring and liner which re-duce shearing of the oil and amount of mixed lubrication or reductionof viscous shear by the cavitation taking place in the diverging part ofthe dimple. This could be done by designing the dimples to affect thesystem in two different ways. One way to achieve this is to increase thegeneration of hydrodynamic lift by having low depth texture which insome cases can act as micro bearings on the surface and thus increasethe film thickness. Another way of achieving this is to have deep tex-ture without lifting force that decreases the separation between plateauof cylinder liner surface and piston ring but increases the average globalfilm thickness due to the deep valleys. The texture with low depth thatcontributes to the hydrodynamic pressure build up could also improvethe system ability to go from boundary lubrication into mixed and hy-drodynamic closer to the reversal zones. The friction of the TLOCR
D.1. Introduction 157
could be affected in the same way without adding texture to the cylin-der liner, instead making the ring land radius smaller thus increasingthe hydrodynamic pressure generation. This would however affect theoperation of the TLOCR around the reversal zones as well, leading to arisk of increased oil consumption. There are also studies showing thattexture can act as a reservoir for lubricant and by that decrease theamount of starved lubrication [33, 34]. Johansson [6] showed that deeptextures could improve the power cylinder unit operation by acting asa pick up for abrasive particles and by that contribute to a low wearrate. The deep textures investigated experimentally by Johansson alsoshowed potential for friction reduction but uncertainties in how theywould affect oil consumption still remains. Etsion et al. [35] investi-gated spherical shape textures in mechanical face seals and concludedthat depth over diameter is the most important parameter for load car-rying capacity. Other work [36,37] showed that the area density, ratio ofsurface covered by texture had a large impact on the result. In the workby Yan et al. [38] it was concluded that the area density of dimples is themost important parameter for reduction of friction and large reductionof friction was found. The conclusion to draw from earlier studies isthat depending on the operating conditions different types of texturesare optimal.
A number of studies have been performed where the textures wereplaced on the moving part. Ronen et al. [46] simulated dimples in a pis-ton ring like contact and found that 30 % friction reduction was possiblewith texture on the moving part, with an optimum area density between5 and 20 % . Gadeschi [47] performed similar numerical simulations oftexture on the piston ring using half Sommerfeld boundary conditionfor cavitation and found that optimum area density was 60 %. In [48]Etsion and Sher showed potential of reducing fuel consumption with 4 %in a 2.5 l diesel engine when the original piston rings were replaced withpartially textured piston rings. However, the textured piston rings hada different profile than the original ring which makes it uncertain if thetexture was the cause of the benefit. Placing the texture on the movingpart also means that operation on the entire stroke is influenced, withno possibility to tailor the texture geometry for different parts of thestroke. Having one texture design for the entire stroke means that thebenefits for friction might not be fully employed. Also, since the textureis present in the contact close to the reversal zones it could have negativeeffect on sealing capability thus influencing oil consumption and blow
158 Paper D. Texture induced effects causing reduction of friction
by.
Yu et al. [39] performed numerical simulations with a model basedon stationary Reynolds equation with half Sommerfeld boundary con-dition. Investigations were made for three different types of texture:round, elliptical and triangular shape. It was found that the triangulardimples should be placed with one of the sides perpendicular to the slid-ing direction. Also the longest dimension of the elliptical dimple shouldbe placed perpendicular to the sliding direction. All performed calcula-tions were on a single dimple and it is stated that further studies needsto be done considering more than one single dimple in each calculation.
Jocsak et al. [5] performed simulations investigating the effect onfriction for different honing parameters and came to the conclusion thatdecreasing the honing angle decreases the piston ring pack friction. Thiswas explained to be a function of blockage of the pressure driven flowwhich increases the lubricants effective viscosity and delays the transi-tion from hydrodynamic to mixed lubrication. Jocsak et al. also statedthat the oil film thickness is increased during most of the stroke with alower honing angle. Checo et al. [41] simulated texture placed on thecylinder liner in contact with a slider thought of as a piston ring with amass conserving cavitation model. All simulations were performed withthe same Stribeck parameter, S = ηU
W= 10−3, i.e only one speed, viscos-
ity and load combination was used. This corresponds to an unreasonablehigh speed to load relation in any typical engine. The investigation wasperformed with different texture geometries and radius on the slider.The textures of investigation had ellipsoid and spherical shapes and itwas found that there are no drawbacks with spherical shape comparedto the ellipsoid shape. It was shown that the more flat a piston ring isthe more friction reduction possibility exists from applying surface tex-ture on the cylinder liner. With radii close to those of a top compressionring a very small benefit in friction was observed. With an almost flatslider such as the land of a TLOCR the friction reduction was simu-lated to be 73 % in the best case. The largest friction reduction wasfound with dimples stacked as close as possible together, diameter equalto slider width and depth of 10 µm. The model used by Checo et al.
utilised the 2D Reynolds equation and simulated a section of a cylinderliner - piston ring pair with periodic boundary conditions in circumfer-ential direction. All the dimples were placed in-line with each other inthe sliding direction. The model by Checo did however not considerany mechanical contact. Typical surface roughness of a cylinder liner
D.1. Introduction 159
will influence the interface significantly on most part of the stroke for aTLOCR. It is necessary to include consideration to mechanical contactin a model investigating cylinder liner - piston ring contact. Bibouletand Lubrecht [42] also simulated a textured liner in contact with pis-ton rings with a 1D model. They also found that large radius of thepiston ring land is necessary for any significant friction benefit from tex-ture. The TLOCR is typically designed with almost flat lands to keepthe oil distribution at an appropriate level. Conclusions from earlierwork [41, 42] on the importance of large slider radius means that thereare great potential for reducing TLOCR friction with texture. Becauseof the earlier mentioned large portion of friction power loss from thiscomponent it could provide significantly decreased fuel consumption.
In a recent review by Gropper et al. [43] it was stated that previouswork in the the area shows that it is impossible to give a universalguideline on how to design texture. This means that the texture designhas to be individually optimised for every specific tribological systemand operating conditions.
Most models presented in literature which are investigating the effectof texture either considered the dimples to be placed on the movingpart or other types of texture such as honing parameters or geometriesother than piston ring against cylinder liner. The reason for focusing ontextured piston rings is believed to be because of its simplicity comparedto applying texture on the inside of a cylinder liner. The honing ofthe cylinder liner has to be performed and therefore most studies hasbeen focusing on optimisation of this procedure. Because it is an easiersolution than implementing another manufacturing process that appliesother types of texture on the surface.
The few studies available on textured cylinder liners has some short-comings and there are therefore room to further investigate this effect.Some of the simulation models present in literature does not include amass conserving cavitation model. This is necessary when studying theeffect from dimples. Some models does not consider inertia or mechan-ical contact, also this is important when studying these effects. Someinvestigations are performed in 1D thus neglecting side leakage which ineffect means that infinite long honing grooves transversal to the slidingdirection are simulated and not dimples. No model available in literatureincludes consideration to all of the following:
• 2D fluid flow with influence from surface roughness
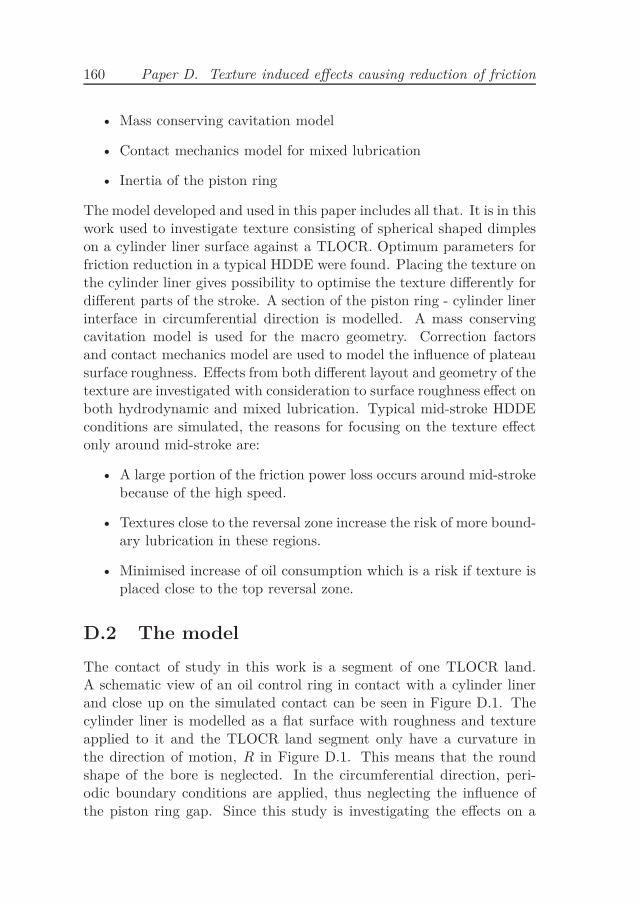
160 Paper D. Texture induced effects causing reduction of friction
• Mass conserving cavitation model
• Contact mechanics model for mixed lubrication
• Inertia of the piston ring
The model developed and used in this paper includes all that. It is in thiswork used to investigate texture consisting of spherical shaped dimpleson a cylinder liner surface against a TLOCR. Optimum parameters forfriction reduction in a typical HDDE were found. Placing the texture onthe cylinder liner gives possibility to optimise the texture differently fordifferent parts of the stroke. A section of the piston ring - cylinder linerinterface in circumferential direction is modelled. A mass conservingcavitation model is used for the macro geometry. Correction factorsand contact mechanics model are used to model the influence of plateausurface roughness. Effects from both different layout and geometry of thetexture are investigated with consideration to surface roughness effect onboth hydrodynamic and mixed lubrication. Typical mid-stroke HDDEconditions are simulated, the reasons for focusing on the texture effectonly around mid-stroke are:
• A large portion of the friction power loss occurs around mid-strokebecause of the high speed.
• Textures close to the reversal zone increase the risk of more bound-ary lubrication in these regions.
• Minimised increase of oil consumption which is a risk if texture isplaced close to the top reversal zone.
D.2 The model
The contact of study in this work is a segment of one TLOCR land.A schematic view of an oil control ring in contact with a cylinder linerand close up on the simulated contact can be seen in Figure D.1. Thecylinder liner is modelled as a flat surface with roughness and textureapplied to it and the TLOCR land segment only have a curvature inthe direction of motion, R in Figure D.1. This means that the roundshape of the bore is neglected. In the circumferential direction, peri-odic boundary conditions are applied, thus neglecting the influence ofthe piston ring gap. Since this study is investigating the effects on a
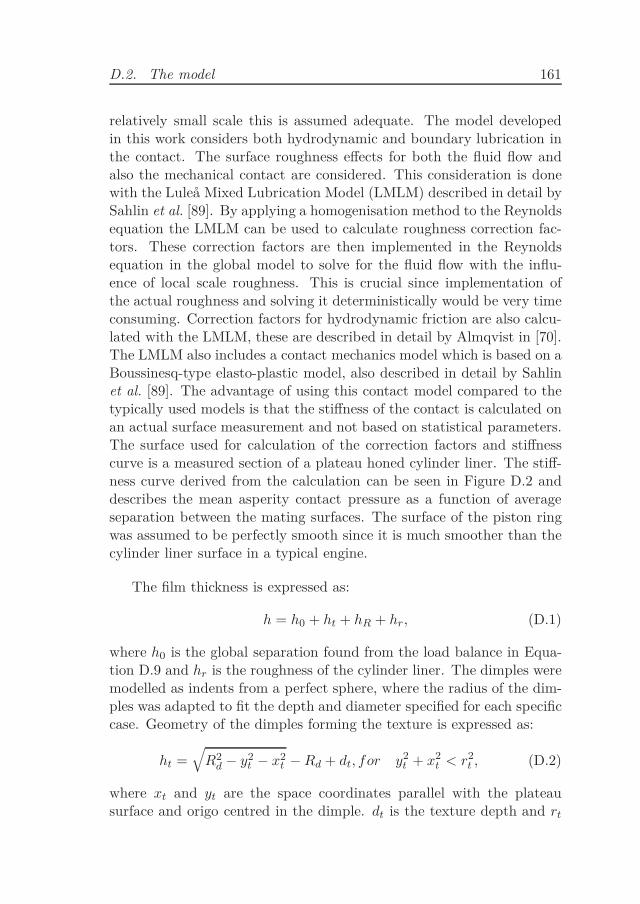
D.2. The model 161
relatively small scale this is assumed adequate. The model developedin this work considers both hydrodynamic and boundary lubrication inthe contact. The surface roughness effects for both the fluid flow andalso the mechanical contact are considered. This consideration is donewith the Luleå Mixed Lubrication Model (LMLM) described in detail bySahlin et al. [89]. By applying a homogenisation method to the Reynoldsequation the LMLM can be used to calculate roughness correction fac-tors. These correction factors are then implemented in the Reynoldsequation in the global model to solve for the fluid flow with the influ-ence of local scale roughness. This is crucial since implementation ofthe actual roughness and solving it deterministically would be very timeconsuming. Correction factors for hydrodynamic friction are also calcu-lated with the LMLM, these are described in detail by Almqvist in [70].The LMLM also includes a contact mechanics model which is based on aBoussinesq-type elasto-plastic model, also described in detail by Sahlinet al. [89]. The advantage of using this contact model compared to thetypically used models is that the stiffness of the contact is calculated onan actual surface measurement and not based on statistical parameters.The surface used for calculation of the correction factors and stiffnesscurve is a measured section of a plateau honed cylinder liner. The stiff-ness curve derived from the calculation can be seen in Figure D.2 anddescribes the mean asperity contact pressure as a function of averageseparation between the mating surfaces. The surface of the piston ringwas assumed to be perfectly smooth since it is much smoother than thecylinder liner surface in a typical engine.
The film thickness is expressed as:
h = h0 + ht + hR + hr, (D.1)
where h0 is the global separation found from the load balance in Equa-tion D.9 and hr is the roughness of the cylinder liner. The dimples weremodelled as indents from a perfect sphere, where the radius of the dim-ples was adapted to fit the depth and diameter specified for each specificcase. Geometry of the dimples forming the texture is expressed as:
ht =√
R2d − y2
t − x2t − Rd + dt, for y2
t + x2t < r2
t , (D.2)
where xt and yt are the space coordinates parallel with the plateausurface and origo centred in the dimple. dt is the texture depth and rt
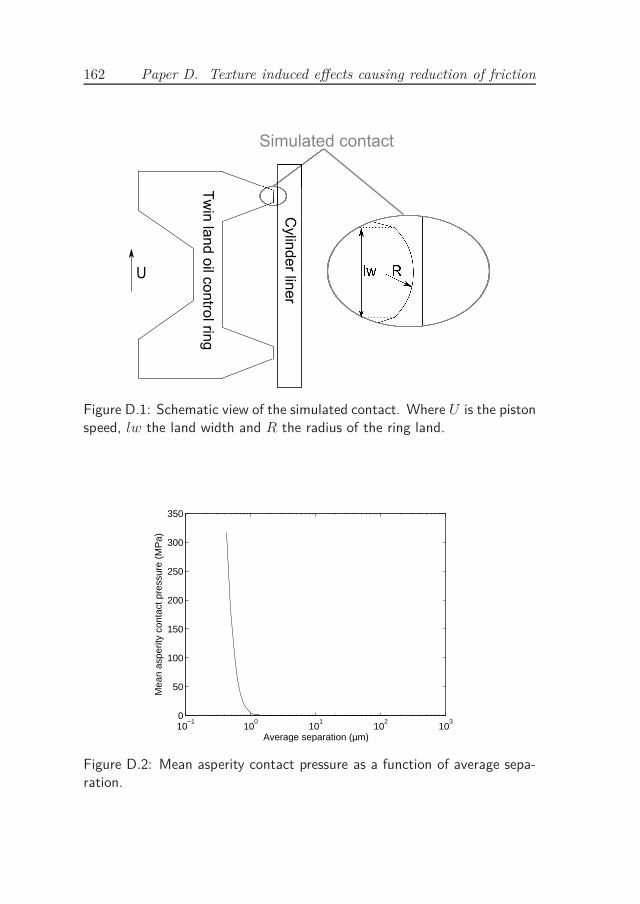
162 Paper D. Texture induced effects causing reduction of friction
Figure D.1: Schematic view of the simulated contact. Where U is the pistonspeed, lw the land width and R the radius of the ring land.
10−1
100
101
102
103
0
50
100
150
200
250
300
350
Average separation (µm)
Mea
n as
perit
y co
ntac
t pre
ssur
e (M
Pa)
Figure D.2: Mean asperity contact pressure as a function of average sepa-ration.
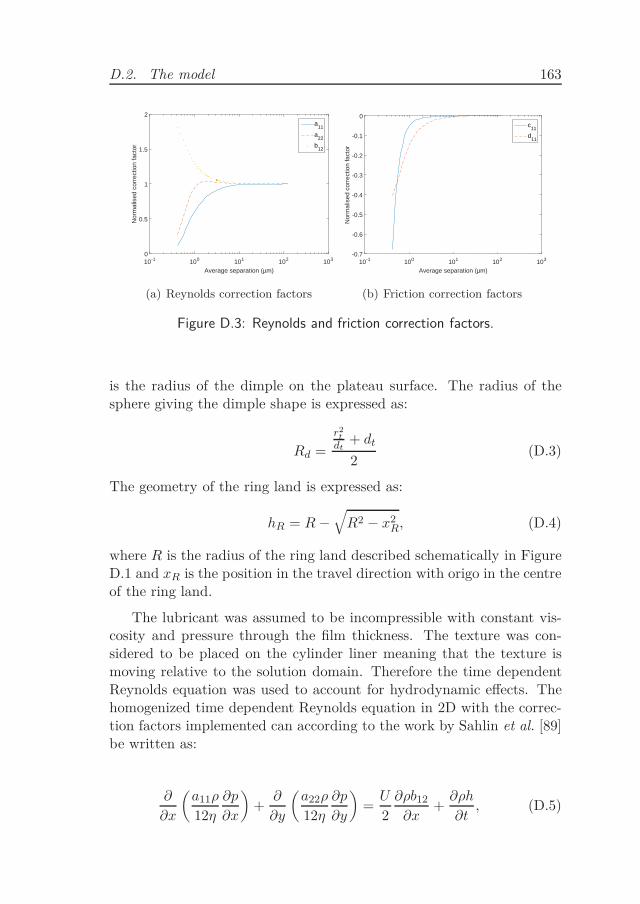
D.2. The model 163
Average separation (µm)10-1 100 101 102 103
Nor
mal
ised
cor
rect
ion
fact
or
0
0.5
1
1.5
2a
11
a22
b12
(a) Reynolds correction factors
Average separation (µm)10-1 100 101 102 103
Nor
mal
ised
cor
rect
ion
fact
or
-0.7
-0.6
-0.5
-0.4
-0.3
-0.2
-0.1
0c
11
d11
(b) Friction correction factors
Figure D.3: Reynolds and friction correction factors.
is the radius of the dimple on the plateau surface. The radius of thesphere giving the dimple shape is expressed as:
Rd =
r2
t
dt+ dt
2(D.3)
The geometry of the ring land is expressed as:
hR = R −√
R2 − x2R, (D.4)
where R is the radius of the ring land described schematically in FigureD.1 and xR is the position in the travel direction with origo in the centreof the ring land.
The lubricant was assumed to be incompressible with constant vis-cosity and pressure through the film thickness. The texture was con-sidered to be placed on the cylinder liner meaning that the texture ismoving relative to the solution domain. Therefore the time dependentReynolds equation was used to account for hydrodynamic effects. Thehomogenized time dependent Reynolds equation in 2D with the correc-tion factors implemented can according to the work by Sahlin et al. [89]be written as:
∂
∂x
(
a11ρ
12η
∂p
∂x
)
+∂
∂y
(
a22ρ
12η
∂p
∂y
)
=U
2
∂ρb12
∂x+
∂ρh
∂t, (D.5)
164 Paper D. Texture induced effects causing reduction of friction
where ρ is the density, η is the dynamic viscosity, p is the pressure,U is the piston speed, h is the film thickness and a11, a22 and b12 are theearlier mentioned Reynolds correction factors. As stated by Checo [41]a mass conserving model for consideration of cavitation is necessary.Therefore the Häggström [103] cavitation model is applied, its validityhas been showed by the authors [115]. The cavitation model is based onthe assumption that if the lubricant pressure falls below zero both thedensity and viscosity is reduced. A scaling polynomial for both densityand viscosity is defined as:
f(p) =
1 p > 0
3(
p+ββ
)2
− 2(
p+ββ
)3
0 p ≤ −β
−β < p ≤ 0 (D.6)
where β is the factor for the transition zone of the scaling parameterwhich is then implemented as:
ρ = (f(p) + α) ·ρ0
1 + α(D.7)
η = (f(p) + α) ·η0
1 + α(D.8)
The parameter α is arbitrarily set to 0.01 to avoid zero density andviscosity which improve convergence of the model. This cavitation modelallows for some negative oil film pressure but as showed [115], by select-ing the value for β correctly and ignoring the negative pressures themodel provides mass conserving, accurate results with negligible differ-ence compared to the LCP method used by Giacopini et al. [99] andAlmqvist et al. [77].
Load balance includes inertia of the ring section in radial directionand is defined as:
W = m · z +
¨
Ω
(p + Pc) dA, (D.9)
where W is the applied load, m is the ring section mass and z isthe ring acceleration in radial direction. Pc is the asperity contact pres-sure found from the result presented in Figure D.2 and p is the oil filmpressure found from Equation D.5. Ω and A are the ring land sectiondomain and area respectively.
D.2. The model 165
Friction from mechanical contact is calculated with:
Fc = µb · Pc, (D.10)
where µb is the boundary coefficient of friction set to 0.1 in this study,this is the same as used by Spencer et al. in [32] who simulated the sametype of liner surface. The authors have also performed measurementswith test equipment described in [116] and found this to be a good rep-resentation of boundary friction coefficient for the type of surface underinvestigation here. The hydrodynamic friction component is calculatedas [70]:
Fh =
(
h
2− d11
)
∂p
∂x+ ηU
(
1
h+ 6c11
)
, (D.11)
where d11 and c11 are the friction correction factors mentioned ear-lier. The correction factors used in this work, derived from calculation onthe earlier mentioned plateau honed cylinder liner surface, as a functionof average separation can be seen in Figure D.3(b).
D.2.1 Simulated parameters
The TLOCR land studied is 150 µm wide with a curvature radius, R, of70 mm which results in an inlet height of around 40 nm at the edge ofthe ring land. The radius of 70 mm was derived from measurement ona slightly run-in standard production TLOCR land. The load appliedto the ring corresponds to a nominal contact pressure of 1.5 MPa. Thearea density of the dimples were varied by changing the distance betweenthe dimples, c-c, explained schematically in Figure D.4. Also differentlayout of the dimples were investigated, called in-line and zig-zag, thesepatterns and the boundary conditions are schematically described inFigure D.4. The mass assigned to the ring is the actual mass, 15 g, of astandard production TLOCR with spring, with a diameter of 131 mm.The mass for the ring section in the simulations is scaled for the lengthof the simulated section and divided by 2 in order to compensate foronly simulating one of the two lands.
The viscosity of the oil, ρ0, used in the simulation was set to 0.01Pas.
The equations were solved fully coupled with a commercially avail-able finite element software [117]. The speed was kept constant through-
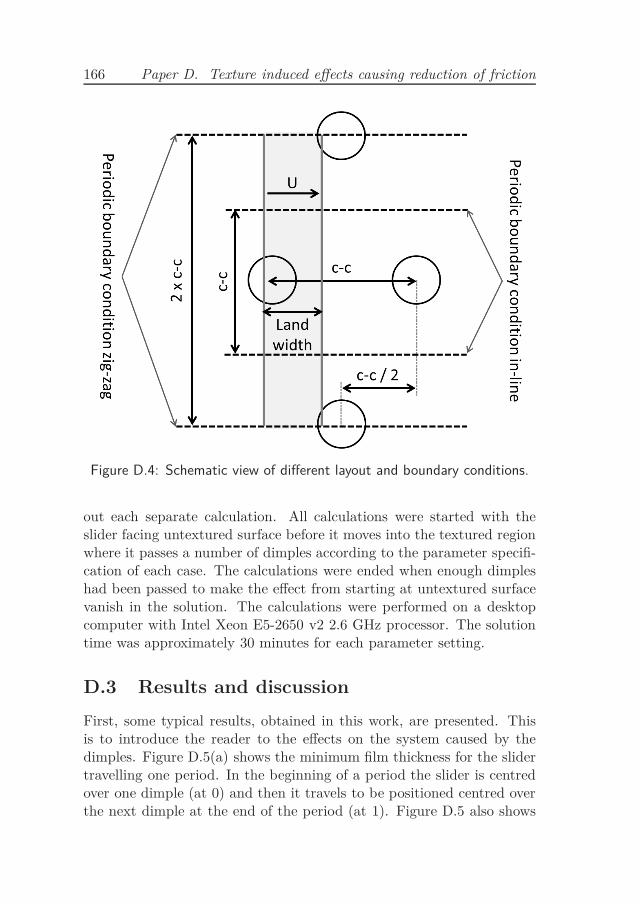
166 Paper D. Texture induced effects causing reduction of friction
Figure D.4: Schematic view of different layout and boundary conditions.
out each separate calculation. All calculations were started with theslider facing untextured surface before it moves into the textured regionwhere it passes a number of dimples according to the parameter specifi-cation of each case. The calculations were ended when enough dimpleshad been passed to make the effect from starting at untextured surfacevanish in the solution. The calculations were performed on a desktopcomputer with Intel Xeon E5-2650 v2 2.6 GHz processor. The solutiontime was approximately 30 minutes for each parameter setting.
D.3 Results and discussion
First, some typical results, obtained in this work, are presented. Thisis to introduce the reader to the effects on the system caused by thedimples. Figure D.5(a) shows the minimum film thickness for the slidertravelling one period. In the beginning of a period the slider is centredover one dimple (at 0) and then it travels to be positioned centred overthe next dimple at the end of the period (at 1). Figure D.5 also shows
D.3. Results and discussion 167
snap shots of the oil film thickness and hydrodynamic pressure obtainedby the model at the five different marked locations. The simulation pa-rameters used in Figure D.5 are; 7.5 m/s sliding speed, dimple diameterof 300 µm, dimple depth of 3 µm and area density of 40 %. At location1 in Figure D.5(b) the slider is centred over the dimple, here the mini-mum film thickness is low and there is small amount of hydrodynamicsupport. As the slider moves to location 2 D.5(c) the film thicknesshas dropped to the lowest point but as can be noticed hydrodynamicpressure is starting to generate in the converging gap of the dimple.Moving towards location 3 D.5(d) more pressure is generated because ofthe converging gap in the dimple. The separation continues to increaseuntil location 4 D.5(e), where only a small part of the dimple is left inthe contact and the film thickness peaks. As the dimple exits the con-tact, after location 4, the film thickness decreases and the next dimple isbeginning to enter the contact. At location 5 D.5(f) only the divergingpart of the next dimple has entered the contact and the film thicknesscontinues to decrease while moving towards location 1 again where thebehaviour is then repeated.
It was also investigated if the ring mass had any significant influenceon the results. A large influence on results caused by the mass assignedto the ring section was observed. As expected the response of the ringis slower with a larger mass because of the greater inertia. However,when performing simulations with high area density and high speed,the results given by the model are unexpected. Figure D.6 shows theminimum film thickness for the slider travelling one period. The resultsshown in Figure D.6 are for dimples in the in-line pattern, with a slidingspeed of 10 m/s, area density of 79 %, 60 %, 40 % and 20 %, and thedimple depth and diameter set to 3 µm and 300 µm respectively. Thefigure shows results for different masses where full mass represents themeasured mass and half mass is half that mass. The film thickness forthe untextured case is also shown for comparison. For the case with the79 % area density it can be seen that the results are very different whena different mass is assigned to the ring section. With the larger massthe film thickness grows significantly more from passing the converginggap of the dimple. The cases with smaller area density do not show thesame large difference in the results. These results are more expected asthe ring shows a slight delay in the response with the larger mass. Thereason for the different behaviour for different mass at 79 % area densityis thought to be caused by the stiffness of the mechanical contact. The
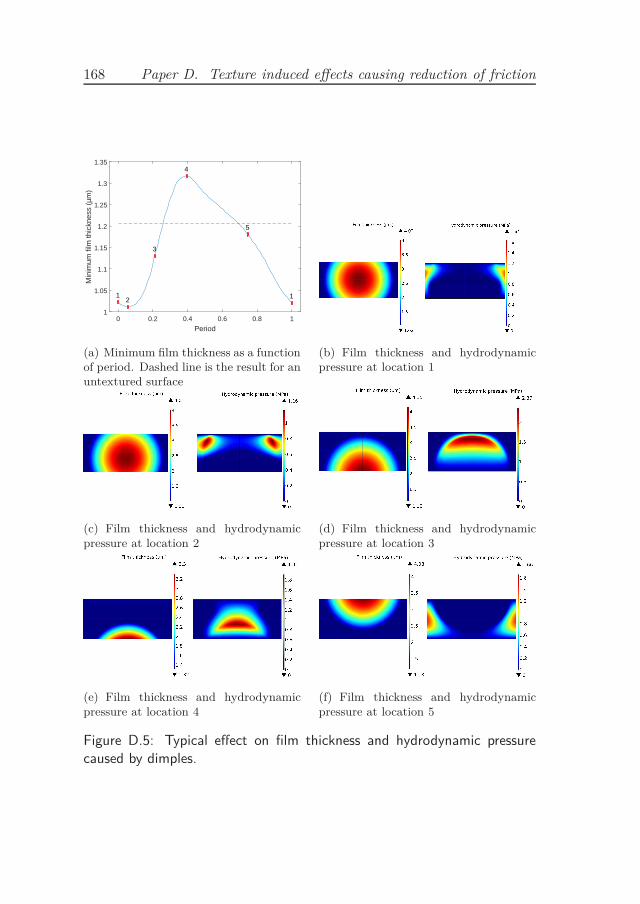
168 Paper D. Texture induced effects causing reduction of friction
Period0 0.2 0.4 0.6 0.8 1
Min
imum
film
thic
knes
s (µ
m)
1
1.05
1.1
1.15
1.2
1.25
1.3
1.35
12
3
4
5
1
(a) Minimum film thickness as a functionof period. Dashed line is the result for anuntextured surface
(b) Film thickness and hydrodynamicpressure at location 1
(c) Film thickness and hydrodynamicpressure at location 2
(d) Film thickness and hydrodynamicpressure at location 3
(e) Film thickness and hydrodynamicpressure at location 4
(f) Film thickness and hydrodynamicpressure at location 5
Figure D.5: Typical effect on film thickness and hydrodynamic pressurecaused by dimples.
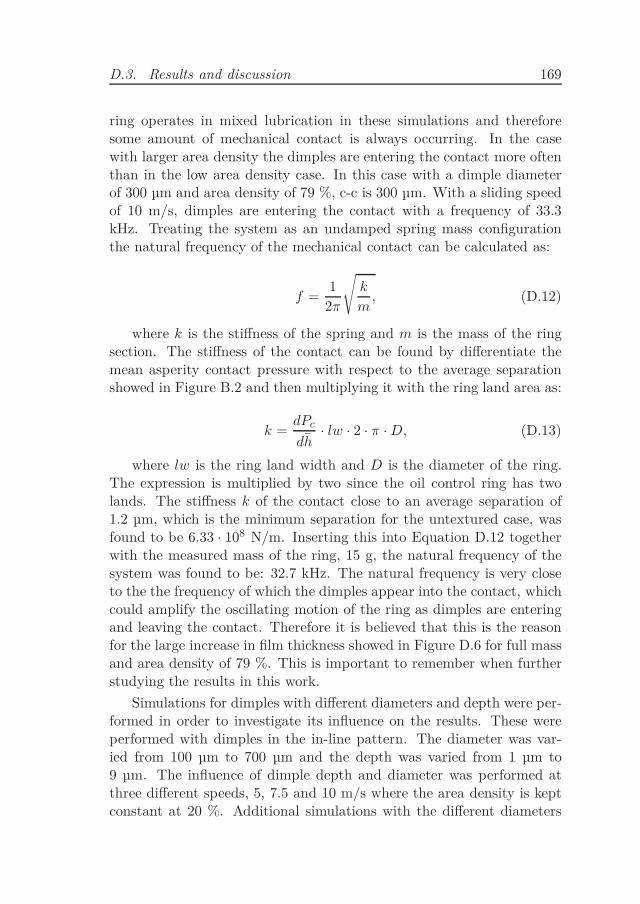
D.3. Results and discussion 169
ring operates in mixed lubrication in these simulations and thereforesome amount of mechanical contact is always occurring. In the casewith larger area density the dimples are entering the contact more oftenthan in the low area density case. In this case with a dimple diameterof 300 µm and area density of 79 %, c-c is 300 µm. With a sliding speedof 10 m/s, dimples are entering the contact with a frequency of 33.3kHz. Treating the system as an undamped spring mass configurationthe natural frequency of the mechanical contact can be calculated as:
f =1
2π
√
k
m, (D.12)
where k is the stiffness of the spring and m is the mass of the ringsection. The stiffness of the contact can be found by differentiate themean asperity contact pressure with respect to the average separationshowed in Figure B.2 and then multiplying it with the ring land area as:
k =dPc
dh· lw · 2 · π · D, (D.13)
where lw is the ring land width and D is the diameter of the ring.The expression is multiplied by two since the oil control ring has twolands. The stiffness k of the contact close to an average separation of1.2 µm, which is the minimum separation for the untextured case, wasfound to be 6.33 · 108 N/m. Inserting this into Equation D.12 togetherwith the measured mass of the ring, 15 g, the natural frequency of thesystem was found to be: 32.7 kHz. The natural frequency is very closeto the the frequency of which the dimples appear into the contact, whichcould amplify the oscillating motion of the ring as dimples are enteringand leaving the contact. Therefore it is believed that this is the reasonfor the large increase in film thickness showed in Figure D.6 for full massand area density of 79 %. This is important to remember when furtherstudying the results in this work.
Simulations for dimples with different diameters and depth were per-formed in order to investigate its influence on the results. These wereperformed with dimples in the in-line pattern. The diameter was var-ied from 100 µm to 700 µm and the depth was varied from 1 µm to9 µm. The influence of dimple depth and diameter was performed atthree different speeds, 5, 7.5 and 10 m/s where the area density is keptconstant at 20 %. Additional simulations with the different diameters
170 Paper D. Texture induced effects causing reduction of friction
Period0 0.2 0.4 0.6 0.8 1
hmin
(µm
)
0.6
0.8
1
1.2
1.4
1.6
1.8Full massNo textureHalf mass
(a) Speed: 10 m/s, Area density 79 %
Period0 0.2 0.4 0.6 0.8 1
hmin
(µm
)
0.8
0.9
1
1.1
1.2
1.3
1.4
1.5Full massNo textureHalf mass
(b) Speed: 10 m/s, Area density 60 %
Period0 0.2 0.4 0.6 0.8 1
hmin
(µm
)
1
1.05
1.1
1.15
1.2
1.25
1.3
1.35
1.4Full massNo textureHalf mass
(c) Speed: 10 m/s, Area density 40 %
Period0 0.2 0.4 0.6 0.8 1
hmin
(µm
)
1.1
1.15
1.2
1.25
1.3
1.35Full massNo textureHalf mass
(d) Speed: 10 m/s, Area density 20 %
Figure D.6: Minimum film thickness with different mass assigned to the ringsection compared to the untextured case as a function of period. Dashedlines are results for an untextured surface.
D.3. Results and discussion 171
and depths were also performed for area densities of 40 and 60 % withthe speed kept at 7.5 m/s. Figure D.7 shows friction reduction for thedifferent simulated dimples compared to the untextured case. It can beseen that for most of the operating conditions a depth around 3 µm anda diameter between 200 µm and 300 µm performs best in terms of fric-tion reduction. For the case with a speed of 7.5 m/s and area density of60 % the results look a bit different. In this case the optimum depth forfriction reduction is larger than for the other operating conditions, apartfor a dimple diameter of 150 µm. With those parameters the dimplesare appearing in the contact with a frequency of 43 kHz which is fairlyclose to the natural frequency discussed earlier. It is therefore assumedthat this outlier in the results is because of that. It should be notedthat the optimum depth is not directly related to the diameter of thedimple. The optimum depth seems to be related to the minimum sep-aration between the surfaces. As displayed in Figure D.8 the minimumseparation is approximately 1.2 µm and the optimum depth on the dim-ples are found at around twice this value in most of the results presentedin Figure D.7. The optimum depth for friction with 60 % area densitywas different, this is discussed later in the paper when those results areanalysed more in detail.
To further study these results and understand the phenomena caus-ing the friction reduction a more detailed study of a single dimple con-figuration at one operating condition were studied. Figure D.8 showsminimum and average film thickness and also the contribution to hydro-dynamic and boundary friction for dimple diameter and depth of 300 µmand 3 µm respectively with a sliding speed of 7.5 m/s and area densityof 20 %. It can be noticed that the minimum film thickness is lower forthe textured surface compared to the untextured case when the dimpleenters the contact, creating a diverging geometry. The minimum filmthickness continues to decrease and is kept lower than the untexturedcase until it enough lift from the converging geometry is generated asthe dimple is passing through the contact, which lifts the ring section.The minimum film thickness increases until the dimple exits the contact,then the film thickness starts to decrease again when only plateau areaenters the contact. When the next dimple enters the contact the rate offilm thickness reduction becomes larger and the behaviour is repeated.Important to notice is that even though the minimum film thickness islower at some instances for the textured surfaces compared to the un-textured surface, the average film thickness for the entire contact has a
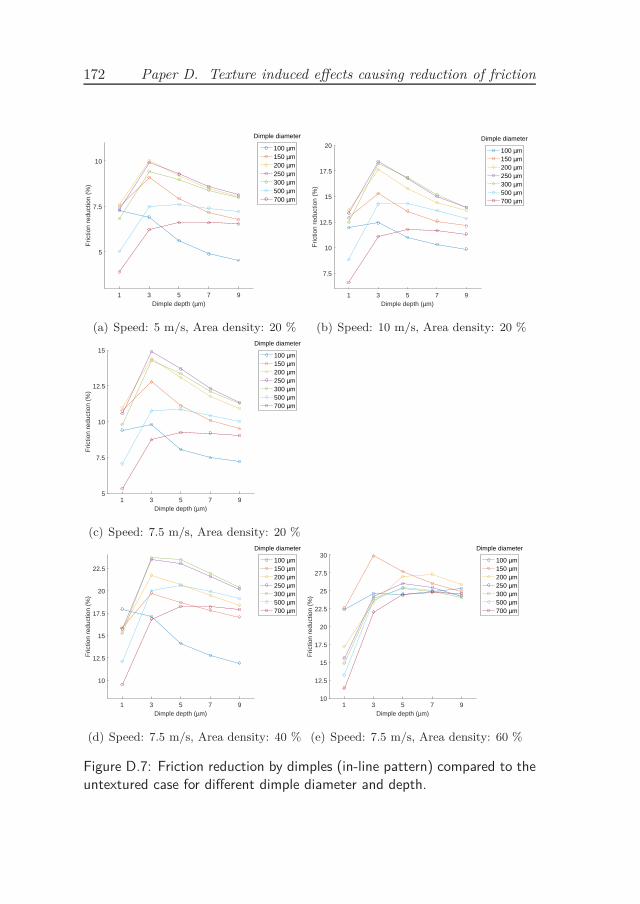
172 Paper D. Texture induced effects causing reduction of friction
Dimple depth (µm)1 3 5 7 9
Fric
tion
redu
ctio
n (%
)
5
7.5
10
100 µm150 µm200 µm250 µm300 µm500 µm700 µm
Dimple diameter
(a) Speed: 5 m/s, Area density: 20 %
Dimple depth (µm)1 3 5 7 9
Fric
tion
redu
ctio
n (%
)
7.5
10
12.5
15
17.5
20100 µm150 µm200 µm250 µm300 µm500 µm700 µm
Dimple diameter
(b) Speed: 10 m/s, Area density: 20 %
Dimple depth (µm)1 3 5 7 9
Fric
tion
redu
ctio
n (%
)
5
7.5
10
12.5
15100 µm150 µm200 µm250 µm300 µm500 µm700 µm
Dimple diameter
(c) Speed: 7.5 m/s, Area density: 20 %
Dimple depth (µm)1 3 5 7 9
Fric
tion
redu
ctio
n (%
)
10
12.5
15
17.5
20
22.5100 µm150 µm200 µm250 µm300 µm500 µm700 µm
Dimple diameter
(d) Speed: 7.5 m/s, Area density: 40 %
Dimple depth (µm)1 3 5 7 9
Fric
tion
redu
ctio
n (%
)
10
12.5
15
17.5
20
22.5
25
27.5
30100 µm150 µm200 µm250 µm300 µm500 µm700 µm
Dimple diameter
(e) Speed: 7.5 m/s, Area density: 60 %
Figure D.7: Friction reduction by dimples (in-line pattern) compared to theuntextured case for different dimple diameter and depth.
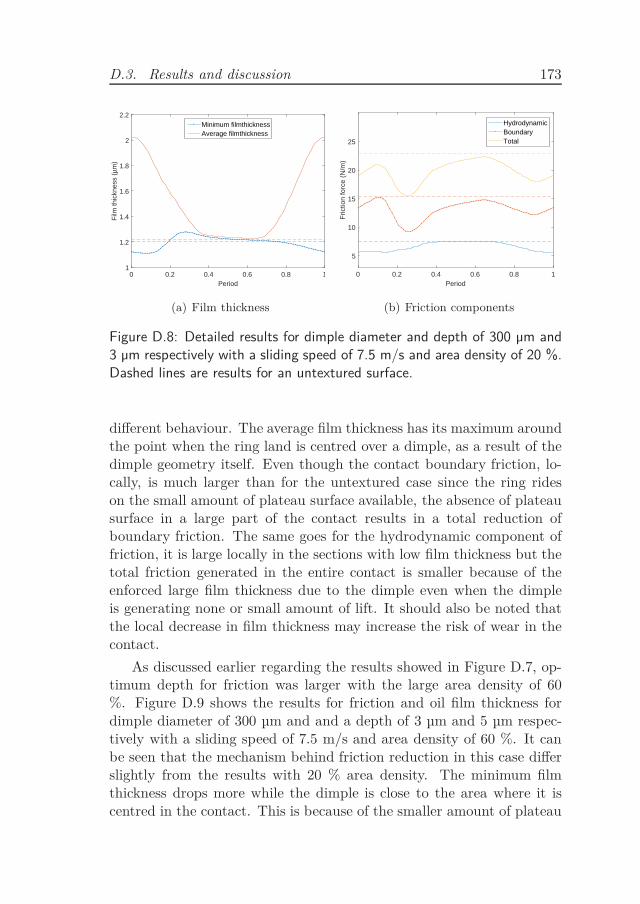
D.3. Results and discussion 173
Period0 0.2 0.4 0.6 0.8 1
Film
thic
knes
s (µ
m)
1
1.2
1.4
1.6
1.8
2
2.2Minimum filmthicknessAverage filmthickness
(a) Film thickness
Period0 0.2 0.4 0.6 0.8 1
Fric
tion
forc
e (N
/m)
5
10
15
20
25
HydrodynamicBoundaryTotal
(b) Friction components
Figure D.8: Detailed results for dimple diameter and depth of 300 µm and3 µm respectively with a sliding speed of 7.5 m/s and area density of 20 %.Dashed lines are results for an untextured surface.
different behaviour. The average film thickness has its maximum aroundthe point when the ring land is centred over a dimple, as a result of thedimple geometry itself. Even though the contact boundary friction, lo-cally, is much larger than for the untextured case since the ring rideson the small amount of plateau surface available, the absence of plateausurface in a large part of the contact results in a total reduction ofboundary friction. The same goes for the hydrodynamic component offriction, it is large locally in the sections with low film thickness but thetotal friction generated in the entire contact is smaller because of theenforced large film thickness due to the dimple even when the dimpleis generating none or small amount of lift. It should also be noted thatthe local decrease in film thickness may increase the risk of wear in thecontact.
As discussed earlier regarding the results showed in Figure D.7, op-timum depth for friction was larger with the large area density of 60%. Figure D.9 shows the results for friction and oil film thickness fordimple diameter of 300 µm and and a depth of 3 µm and 5 µm respec-tively with a sliding speed of 7.5 m/s and area density of 60 %. It canbe seen that the mechanism behind friction reduction in this case differslightly from the results with 20 % area density. The minimum filmthickness drops more while the dimple is close to the area where it iscentred in the contact. This is because of the smaller amount of plateau
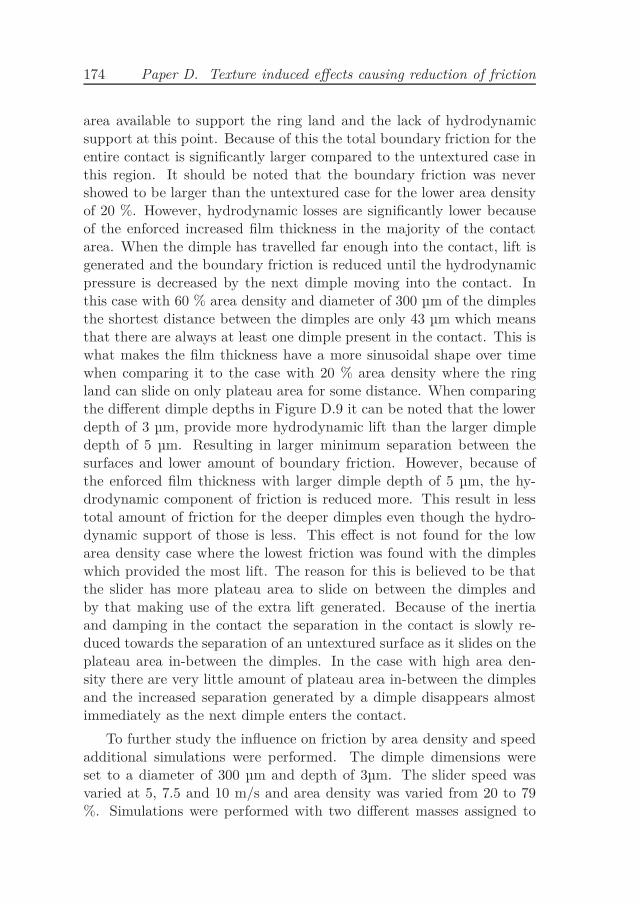
174 Paper D. Texture induced effects causing reduction of friction
area available to support the ring land and the lack of hydrodynamicsupport at this point. Because of this the total boundary friction for theentire contact is significantly larger compared to the untextured case inthis region. It should be noted that the boundary friction was nevershowed to be larger than the untextured case for the lower area densityof 20 %. However, hydrodynamic losses are significantly lower becauseof the enforced increased film thickness in the majority of the contactarea. When the dimple has travelled far enough into the contact, lift isgenerated and the boundary friction is reduced until the hydrodynamicpressure is decreased by the next dimple moving into the contact. Inthis case with 60 % area density and diameter of 300 µm of the dimplesthe shortest distance between the dimples are only 43 µm which meansthat there are always at least one dimple present in the contact. This iswhat makes the film thickness have a more sinusoidal shape over timewhen comparing it to the case with 20 % area density where the ringland can slide on only plateau area for some distance. When comparingthe different dimple depths in Figure D.9 it can be noted that the lowerdepth of 3 µm, provide more hydrodynamic lift than the larger dimpledepth of 5 µm. Resulting in larger minimum separation between thesurfaces and lower amount of boundary friction. However, because ofthe enforced film thickness with larger dimple depth of 5 µm, the hy-drodynamic component of friction is reduced more. This result in lesstotal amount of friction for the deeper dimples even though the hydro-dynamic support of those is less. This effect is not found for the lowarea density case where the lowest friction was found with the dimpleswhich provided the most lift. The reason for this is believed to be thatthe slider has more plateau area to slide on between the dimples andby that making use of the extra lift generated. Because of the inertiaand damping in the contact the separation in the contact is slowly re-duced towards the separation of an untextured surface as it slides on theplateau area in-between the dimples. In the case with high area den-sity there are very little amount of plateau area in-between the dimplesand the increased separation generated by a dimple disappears almostimmediately as the next dimple enters the contact.
To further study the influence on friction by area density and speedadditional simulations were performed. The dimple dimensions wereset to a diameter of 300 µm and depth of 3µm. The slider speed wasvaried at 5, 7.5 and 10 m/s and area density was varied from 20 to 79%. Simulations were performed with two different masses assigned to
D.3. Results and discussion 175
Period0 0.2 0.4 0.6 0.8 1
Film
thic
knes
s (µ
m)
0.5
1
1.5
2
2.5
3
3.5Minimum, depth 3 µmAverage, depth 3 µmMinimum, depth 5 µmAverage, depth 5 µm
(a) Film thickness
Period0 0.2 0.4 0.6 0.8 1
Fric
tion
forc
e (N
/m)
5
10
15
20
25
Hydrodynamic, depth 3 µmBoundary, depth 3 µmTotal, depth 3 µm
depth 5 µmdepth 5 µmdepth 5 µm
(b) Friction components
Figure D.9: Detailed results for dimple diameter of 300 µm, comparingdepth of 3 µm and 5 µm, with a sliding speed of 7.5 m/s and area densityof 60 %. Dashed lines are results for an untextured surface.
the ring, the measured mass of the ring and half of the measured mass.The results from this investigation can be seen in Figure D.10. Whenstudying the results for full mass, effect from the natural frequency canbe noticed at high speed and high area density. If these results aredisregarded a trend for optimal area density at different speeds can befound. The benefits in friction for the higher speed drops off whenincreasing the area density over 40 %. For the medium sliding speedthe optimum for friction is found to be around 40 % but the benefit infriction does not drop as much with increased area density as it does withthe high sliding speed. At the low sliding speed the, optimum is foundat higher area density. This trend is because of the effect of inertia anddamping in the contact discussed earlier. Since these are time dependenteffects they will be affected by sliding speed. In order to make use of theextra lift generated by a dimple there must be enough time for the slideron plateau area in-between the dimples. This means that at high slidingspeed this distance between the dimples needs to be larger (lower areadensity) than at low sliding speeds in order to achieve the lowest possiblefriction. If texture is applied to the cylinder liner it would be beneficialfor friction reduction to use lower area density around mid-stroke thanin the area between mid-stroke and reversal zone. These conclusions onsliding speed influence on optimum area density are further strengthenby the results where half of the measured mass is assigned to the ring
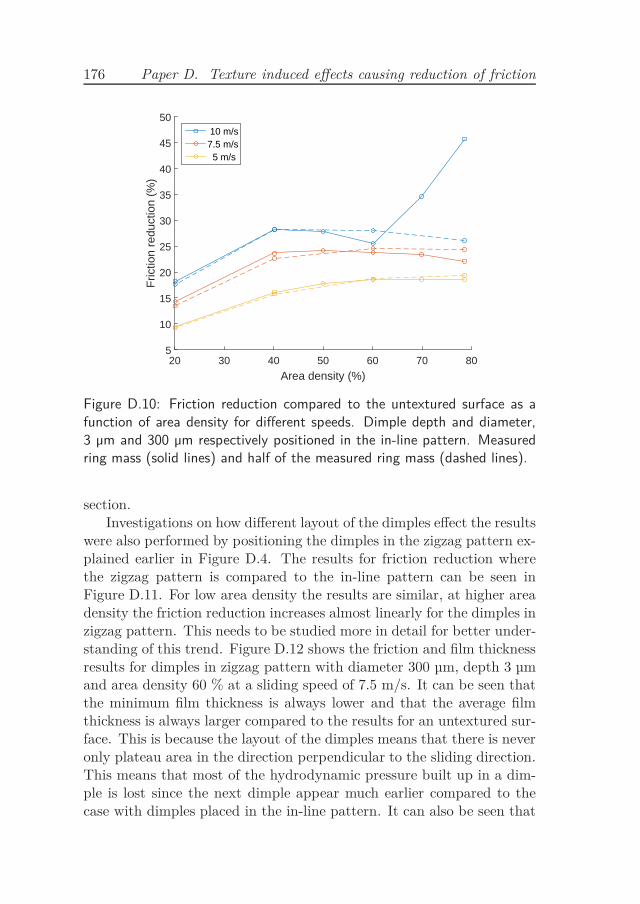
176 Paper D. Texture induced effects causing reduction of friction
Area density (%)20 30 40 50 60 70 80
Fric
tion
redu
ctio
n (%
)
5
10
15
20
25
30
35
40
45
50 10 m/s7.5 m/s 5 m/s
Figure D.10: Friction reduction compared to the untextured surface as afunction of area density for different speeds. Dimple depth and diameter,3 µm and 300 µm respectively positioned in the in-line pattern. Measuredring mass (solid lines) and half of the measured ring mass (dashed lines).
section.Investigations on how different layout of the dimples effect the results
were also performed by positioning the dimples in the zigzag pattern ex-plained earlier in Figure D.4. The results for friction reduction wherethe zigzag pattern is compared to the in-line pattern can be seen inFigure D.11. For low area density the results are similar, at higher areadensity the friction reduction increases almost linearly for the dimples inzigzag pattern. This needs to be studied more in detail for better under-standing of this trend. Figure D.12 shows the friction and film thicknessresults for dimples in zigzag pattern with diameter 300 µm, depth 3 µmand area density 60 % at a sliding speed of 7.5 m/s. It can be seen thatthe minimum film thickness is always lower and that the average filmthickness is always larger compared to the results for an untextured sur-face. This is because the layout of the dimples means that there is neveronly plateau area in the direction perpendicular to the sliding direction.This means that most of the hydrodynamic pressure built up in a dim-ple is lost since the next dimple appear much earlier compared to thecase with dimples placed in the in-line pattern. It can also be seen that
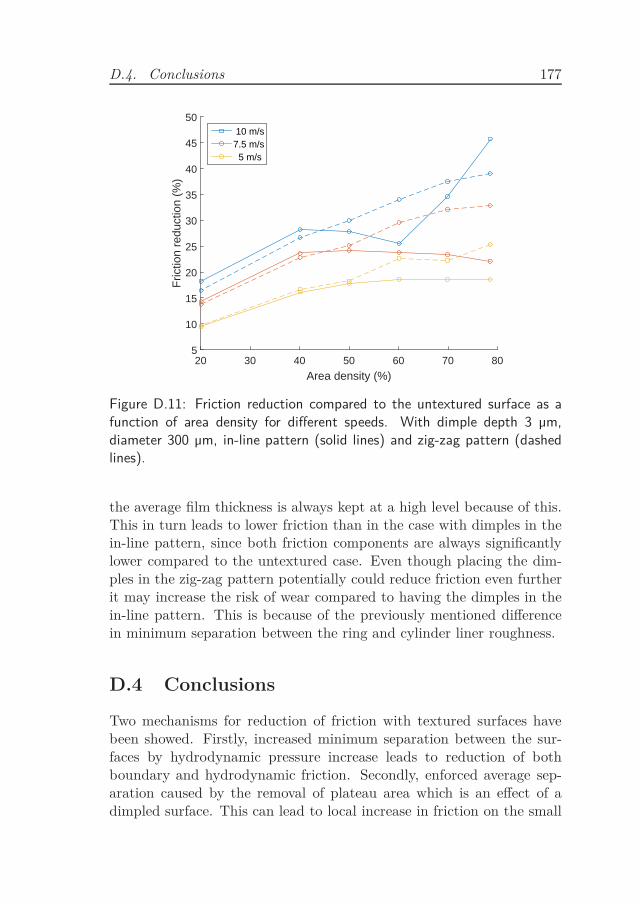
D.4. Conclusions 177
Area density (%)20 30 40 50 60 70 80
Fric
tion
redu
ctio
n (%
)
5
10
15
20
25
30
35
40
45
50 10 m/s7.5 m/s 5 m/s
Figure D.11: Friction reduction compared to the untextured surface as afunction of area density for different speeds. With dimple depth 3 µm,diameter 300 µm, in-line pattern (solid lines) and zig-zag pattern (dashedlines).
the average film thickness is always kept at a high level because of this.This in turn leads to lower friction than in the case with dimples in thein-line pattern, since both friction components are always significantlylower compared to the untextured case. Even though placing the dim-ples in the zig-zag pattern potentially could reduce friction even furtherit may increase the risk of wear compared to having the dimples in thein-line pattern. This is because of the previously mentioned differencein minimum separation between the ring and cylinder liner roughness.
D.4 Conclusions
Two mechanisms for reduction of friction with textured surfaces havebeen showed. Firstly, increased minimum separation between the sur-faces by hydrodynamic pressure increase leads to reduction of bothboundary and hydrodynamic friction. Secondly, enforced average sep-aration caused by the removal of plateau area which is an effect of adimpled surface. This can lead to local increase in friction on the small
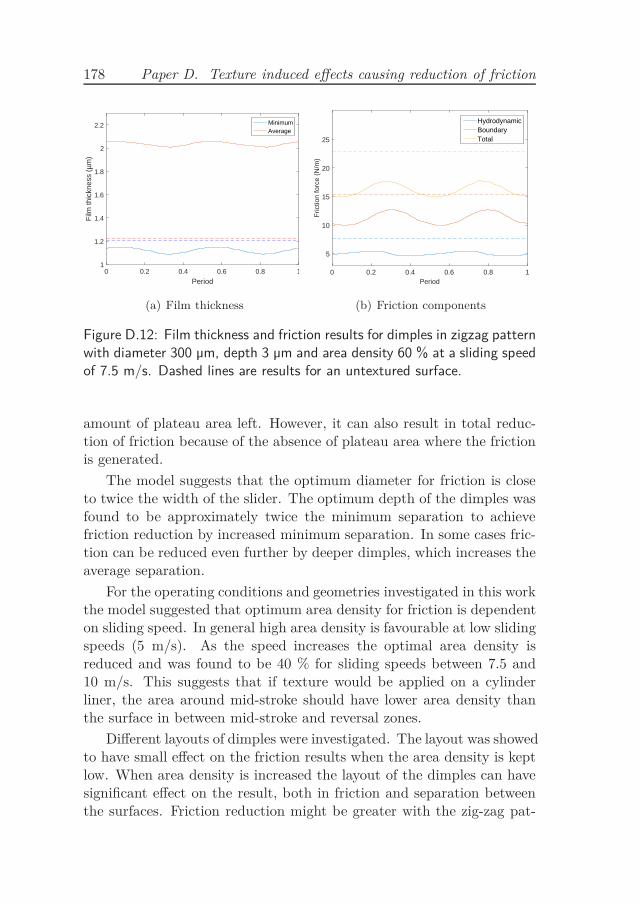
178 Paper D. Texture induced effects causing reduction of friction
Period0 0.2 0.4 0.6 0.8 1
Film
thic
knes
s (µ
m)
1
1.2
1.4
1.6
1.8
2
2.2 MinimumAverage
(a) Film thickness
Period0 0.2 0.4 0.6 0.8 1
Fric
tion
forc
e (N
/m)
5
10
15
20
25
HydrodynamicBoundaryTotal
(b) Friction components
Figure D.12: Film thickness and friction results for dimples in zigzag patternwith diameter 300 µm, depth 3 µm and area density 60 % at a sliding speedof 7.5 m/s. Dashed lines are results for an untextured surface.
amount of plateau area left. However, it can also result in total reduc-tion of friction because of the absence of plateau area where the frictionis generated.
The model suggests that the optimum diameter for friction is closeto twice the width of the slider. The optimum depth of the dimples wasfound to be approximately twice the minimum separation to achievefriction reduction by increased minimum separation. In some cases fric-tion can be reduced even further by deeper dimples, which increases theaverage separation.
For the operating conditions and geometries investigated in this workthe model suggested that optimum area density for friction is dependenton sliding speed. In general high area density is favourable at low slidingspeeds (5 m/s). As the speed increases the optimal area density isreduced and was found to be 40 % for sliding speeds between 7.5 and10 m/s. This suggests that if texture would be applied on a cylinderliner, the area around mid-stroke should have lower area density thanthe surface in between mid-stroke and reversal zones.
Different layouts of dimples were investigated. The layout was showedto have small effect on the friction results when the area density is keptlow. When area density is increased the layout of the dimples can havesignificant effect on the result, both in friction and separation betweenthe surfaces. Friction reduction might be greater with the zig-zag pat-
D.4. Conclusions 179
tern, but it was also found that placing dimples in the zig-zag patternwill increase the risk of wear more than placing them in the in-line pat-tern.
Acknowledgement
The authors would like to thank Scania, AB Volvo and Energimyn-digheten and the Energy Efficient Vehicle programme for their fundingof this work. Thanks also to the Swedish Research Council (VR) fortheir support to authors Almqvist and Larsson.

Paper E
Experimental study on
HDDE power cylinder unit
On the influence of piston
rings, cylinder liners and
oils on friction and sealing
capability of oil control
ring and validation of
numerical model
181

183
To be submitted to journal
Experimental study on HDDE power cylinder unit
On the influence of piston rings, cylinder liners and
oils on friction and sealing capability of oil control ring
and validation of numerical model
M. Söderfjäll1, H. M. Herbst2, R. Larsson1 and A. Almqvist1
1 Luleå University of Technology, Division of Machine Elements,
Luleå, SE-971 87 Sweden2 Scania CV AB, Södertälje, Sweden
Abstract
Reduction of fuel consumption in heavy duty diesel engine is of highimportance. The piston rings are responsible for a large part of themechanical losses influencing the fuel consumption. In order to reducethese losses the friction mechanisms need to be fully understood andtools for evaluating friction reducing concepts need to be developed andused accurately. In this work a high speed component test rig for eval-uation of piston ring friction is used. A number of different piston ringsand cylinder liners are evaluated based on their friction performance.Also shear thinning of a typical multi grade oil is investigated by com-paring it to a single grade oil. Experimental simulation of high speeds bydecreased viscosity is also evaluated. A method for indication of effectson oil consumption, without combustion, for different oil control rings ispresented. Finally, a numerical simulation model for the oil control ringis validated by comparing with experimental results.

184 Paper E. Experimental study on HDDE power cylinder unit
E.1 Introduction
Increasing demands for reduced fuel consumption is driving the vehi-cle manufacturers towards more optimisation of their components andsystems. Frictional losses in a heavy duty diesel engine (HDDE) sig-nificantly contribute to the fuel consumption of a truck. According toHolmberg et al. [3] 180 billion litres of fuel are used to overcome fric-tion in heavy duty vehicles every year. Friction losses in the engine areresponsible for 4 to 15 % of the fuel consumption [7]. The losses fromthe power cylinder unit (PCU) are responsible for approximately half ofthose frictional losses. Included in the PCU are the piston with rings incontact with the cylinder liner and also the connecting rod. The pistonwith rings is responsible for approximately 75 % of the losses, where thepiston rings are responsible for more than half of those losses. Thereforethere is great potential for reduction of fuel consumption by improve-ment in the piston ring to cylinder liner interface. In order to reducethese losses the interaction between piston ring and cylinder liner needsto be well understood. Tools for evaluating different friction reductionconcepts need to be developed and used properly in order to achieveunderstanding of the system. Simulation models can be a fast and in-expensive way to do the investigations but accuracy of such need to beexperimentally evaluated [94]. A great number of experimental stud-ies on friction reduction possibilities have been made. Rejowski [118]showed that by replacing the conventional cast iron liner with a DLCcoated cylinder liner, one can reduce friction by 2.5% at low enginespeeds. This claimed to be because of reduced amount of mechanical,metal - metal, friction. Sato [65] also showed friction reduction by DLCcoated cylinder liners. It was claimed to be because of less axial scratchescreated in the harder DLC compared to a cast iron liner thus providingbetter state of lubrication. Sato also showed that a rough surfaces can bebeneficial for friction in the mid stroke region under some specific condi-tions. Spencer et al. [56] investigated a top compression ring in contactwith different liner variants in a Plint reciprocating tribometer. Theyfound that smoother cylinder liner surface could provide lower friction.The test conditions were numerically simulated and good correlationwas found at some operating conditions. Liao et al. [10] investigated thefriction of a twin land oil control ring (TLOCR) with various tangen-tial loads at different temperatures in a floating liner test engine. In [64]and [66] the same floating liner test engine was used and the results were
E.1. Introduction 185
compared with a simulation model. It was found that by selecting thesurfaces used in the simulation model carefully, decent correlation couldbe found. Difficulties regarding measurement of piston ring friction inthe floating liner engine were discussed. The lateral stops and frictionfrom the piston makes it difficult to extract friction from the piston ringonly. This is not an issue with the test rig used in this work since thepiston ring holder is linearly guided and thus only the piston ring iscontacting the cylinder liner. In the work by Akalin and Newaz [119] amodel for top compression ring friction developed in [120] was validated.The correlation between simulation and experiments showed the sametrends for roughness and load variation. However, the predicted fric-tion force differed some from the measured value. Gore et al. [121] alsovalidated a simulation model of top ring friction with a floating linermotorcycle engine. The results showed that the model needed furtherdevelopment. The simulation model used by Gore et al., Akalin andNewaz and Liao and Chen uses the same contact model, the well-knownGreenwood - Tripp model, which uses statistical parameters of a surfaceto estimate asperity contact pressure as a function of separation, calledstiffness curve. The contact model used in this work calculates the stiff-ness curve for the actual surface measurement. In addition it includeselastic deformation of the ring cross section and motion of the ring in-side the piston ring groove caused by inertia and friction forces. In thework by Hoshi et al. [8] a numerical tool was used, small differences infriction power loss were found when comparing motored pressure lessconditions to fired conditions. Deuss et al. [68] used the FMEP methodfor comparison of fired operation and externally pressurised combustionchamber tests. It was concluded that the top compression ring is sub-jected to the vast majority of effects by combustion pressure. They alsoshowed that external combustion pressure in the form of compressed airshows the same difference in friction when varying the height of the topcompression ring. Effectively this means varying ring load which is wellrepresented by external pressure. However, when evaluating the enginein fully this was said to be the only type of test where external pres-sure testing is applicable since heat from the combustion will influencethe result. It was showed that FMEP was mostly dependent on speedand almost no dependence on load was found when running the enginewith combustion. In the tests with external pressure a high dependencefor FMEP on load and speed was found. The same relation was foundin the work by Allmaier et al. [69] who also used the FMEP method
186 Paper E. Experimental study on HDDE power cylinder unit
to measure friction on a 13 litre heavy duty diesel engine and comparefired operation to motored operation with externally pressurised com-bustion chamber. When running fired tests and varying the load fromapproximately 30% to 80% almost no influence on FMEP was found.Interestingly, in general FMEP is a function of load and was found tobe close to symmetric at around 50 % load. This means that similarFMEP was found at low load (<30%) increasing with decreased loadand at high load (>80%) increasing with increased load. This was con-cluded to be an effect of increases oil temperature in the contact dueto combustion. Also Allmaier et al. showed that when running withexternally pressurised combustion chamber FMEP was significantly af-fected by the load which again suggests that external pressure is goodfor isolating the effect from top compression ring loading but not forrepresentation of combustion effects. Kunkel et al. [67] run motoredtests with a passenger car engine modified for floating liner measure-ments to investigate run in of twin land oil control rings. It was alsohere shown that in general, combustion has a secondary role in frictionlosses for the oil control ring; its friction power loss is mainly dependenton oil viscosity, tangential load and speed. Kunkel stated that whenfocusing on oil control ring friction tests are usually made in motoredcondition because of the difficulty in repeatability otherwise. This is theapproach used in this work, the test equipment does not include anycombustion or other external pressures for loading of the compressionrings. Because of conclusions from previous work mentioned earlier inthis section the method used in this work could be seen as an appro-priate way of evaluating friction for the entire ring pack. However caremust be taken when analysing the friction force of the compression rings.Even though previously mentioned work has showed that operation atlow pressure without combustion result in similar friction power to firedhighly loaded conditions, the lack of heat and pressure from combustionwill result in different conditions. For evaluation of oil control ring fric-tion the pressure less condition is as earlier mentioned an appropriateapproach.
There are few previous studies where effect on TLOCR friction bydifferent ring geometry and tangential load were investigated. To theauthors knowledge no studies exists where the friction of piston ringswere measured without influence from the piston at engine like speeds.In this paper, this is investigated by utilising experimental equipmentdeveloped by the authors in [116]. An extensive primarily experimental
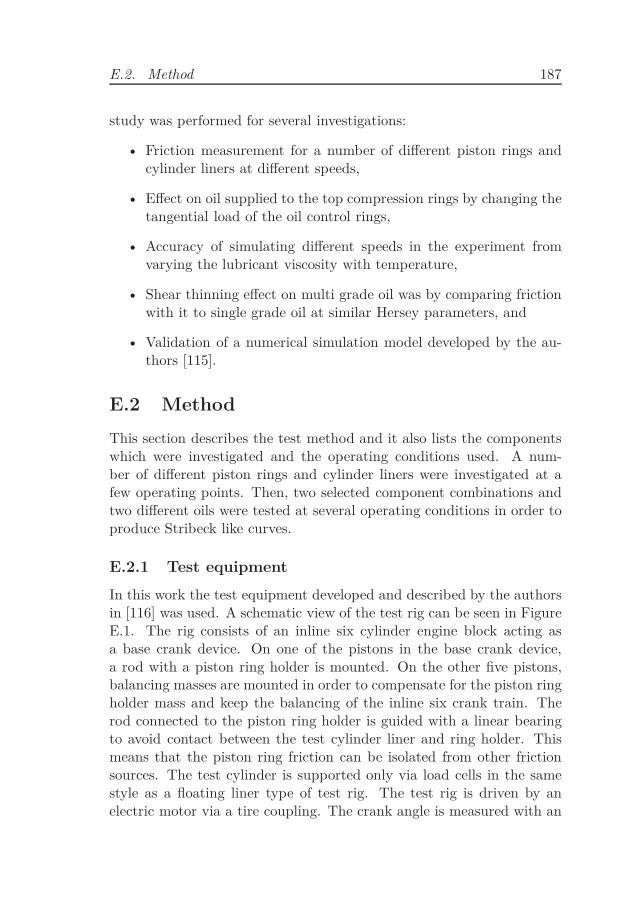
E.2. Method 187
study was performed for several investigations:
• Friction measurement for a number of different piston rings andcylinder liners at different speeds,
• Effect on oil supplied to the top compression rings by changing thetangential load of the oil control rings,
• Accuracy of simulating different speeds in the experiment fromvarying the lubricant viscosity with temperature,
• Shear thinning effect on multi grade oil was by comparing frictionwith it to single grade oil at similar Hersey parameters, and
• Validation of a numerical simulation model developed by the au-thors [115].
E.2 Method
This section describes the test method and it also lists the componentswhich were investigated and the operating conditions used. A num-ber of different piston rings and cylinder liners were investigated at afew operating points. Then, two selected component combinations andtwo different oils were tested at several operating conditions in order toproduce Stribeck like curves.
E.2.1 Test equipment
In this work the test equipment developed and described by the authorsin [116] was used. A schematic view of the test rig can be seen in FigureE.1. The rig consists of an inline six cylinder engine block acting asa base crank device. On one of the pistons in the base crank device,a rod with a piston ring holder is mounted. On the other five pistons,balancing masses are mounted in order to compensate for the piston ringholder mass and keep the balancing of the inline six crank train. Therod connected to the piston ring holder is guided with a linear bearingto avoid contact between the test cylinder liner and ring holder. Thismeans that the piston ring friction can be isolated from other frictionsources. The test cylinder is supported only via load cells in the samestyle as a floating liner type of test rig. The test rig is driven by anelectric motor via a tire coupling. The crank angle is measured with an
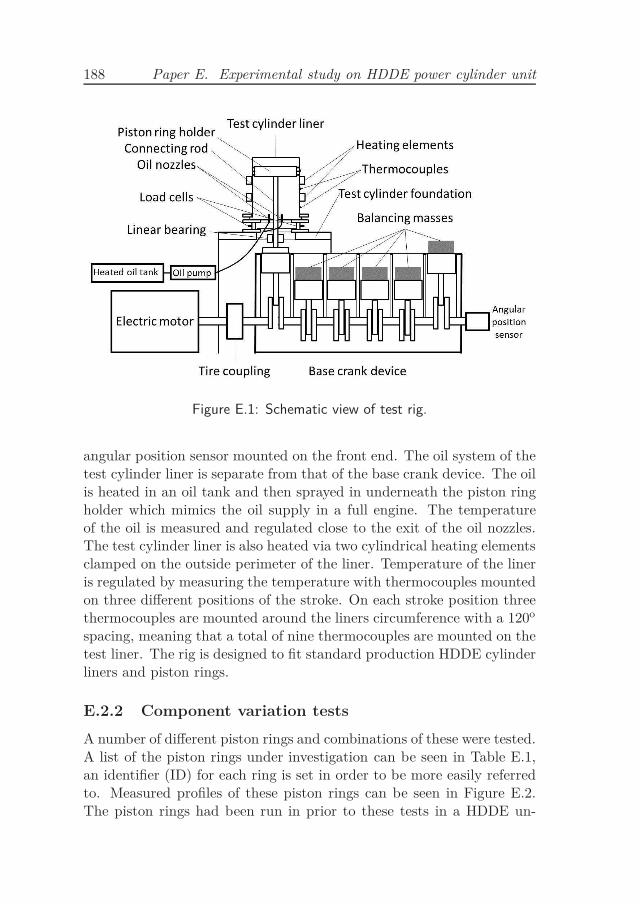
188 Paper E. Experimental study on HDDE power cylinder unit
Figure E.1: Schematic view of test rig.
angular position sensor mounted on the front end. The oil system of thetest cylinder liner is separate from that of the base crank device. The oilis heated in an oil tank and then sprayed in underneath the piston ringholder which mimics the oil supply in a full engine. The temperatureof the oil is measured and regulated close to the exit of the oil nozzles.The test cylinder liner is also heated via two cylindrical heating elementsclamped on the outside perimeter of the liner. Temperature of the lineris regulated by measuring the temperature with thermocouples mountedon three different positions of the stroke. On each stroke position threethermocouples are mounted around the liners circumference with a 120o
spacing, meaning that a total of nine thermocouples are mounted on thetest liner. The rig is designed to fit standard production HDDE cylinderliners and piston rings.
E.2.2 Component variation tests
A number of different piston rings and combinations of these were tested.A list of the piston rings under investigation can be seen in Table E.1,an identifier (ID) for each ring is set in order to be more easily referredto. Measured profiles of these piston rings can be seen in Figure E.2.The piston rings had been run in prior to these tests in a HDDE un-
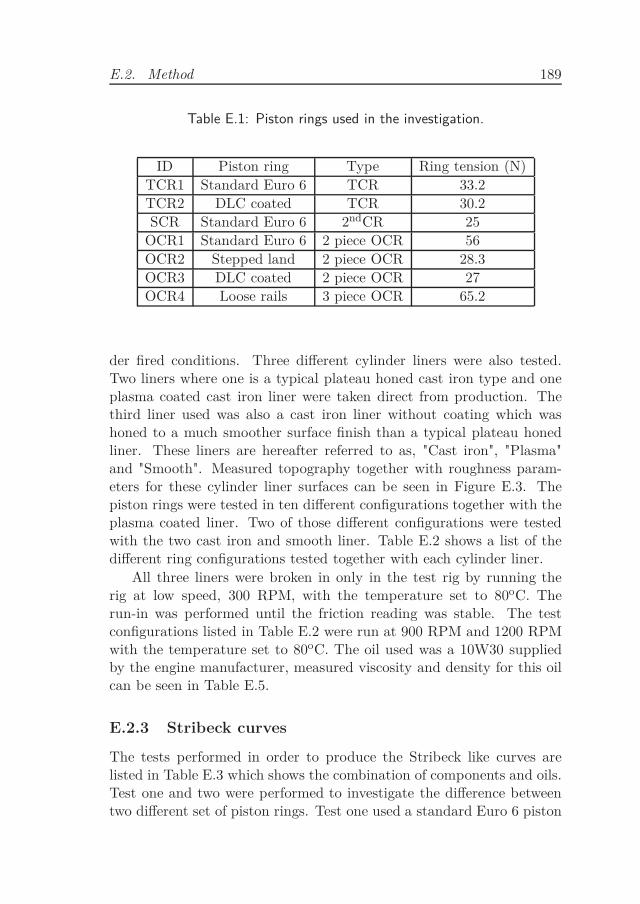
E.2. Method 189
Table E.1: Piston rings used in the investigation.
ID Piston ring Type Ring tension (N)
TCR1 Standard Euro 6 TCR 33.2
TCR2 DLC coated TCR 30.2
SCR Standard Euro 6 2ndCR 25
OCR1 Standard Euro 6 2 piece OCR 56
OCR2 Stepped land 2 piece OCR 28.3
OCR3 DLC coated 2 piece OCR 27
OCR4 Loose rails 3 piece OCR 65.2
der fired conditions. Three different cylinder liners were also tested.Two liners where one is a typical plateau honed cast iron type and oneplasma coated cast iron liner were taken direct from production. Thethird liner used was also a cast iron liner without coating which washoned to a much smoother surface finish than a typical plateau honedliner. These liners are hereafter referred to as, "Cast iron", "Plasma"and "Smooth". Measured topography together with roughness param-eters for these cylinder liner surfaces can be seen in Figure E.3. Thepiston rings were tested in ten different configurations together with theplasma coated liner. Two of those different configurations were testedwith the two cast iron and smooth liner. Table E.2 shows a list of thedifferent ring configurations tested together with each cylinder liner.
All three liners were broken in only in the test rig by running therig at low speed, 300 RPM, with the temperature set to 80oC. Therun-in was performed until the friction reading was stable. The testconfigurations listed in Table E.2 were run at 900 RPM and 1200 RPMwith the temperature set to 80oC. The oil used was a 10W30 suppliedby the engine manufacturer, measured viscosity and density for this oilcan be seen in Table E.5.
E.2.3 Stribeck curves
The tests performed in order to produce the Stribeck like curves arelisted in Table E.3 which shows the combination of components and oils.Test one and two were performed to investigate the difference betweentwo different set of piston rings. Test one used a standard Euro 6 piston
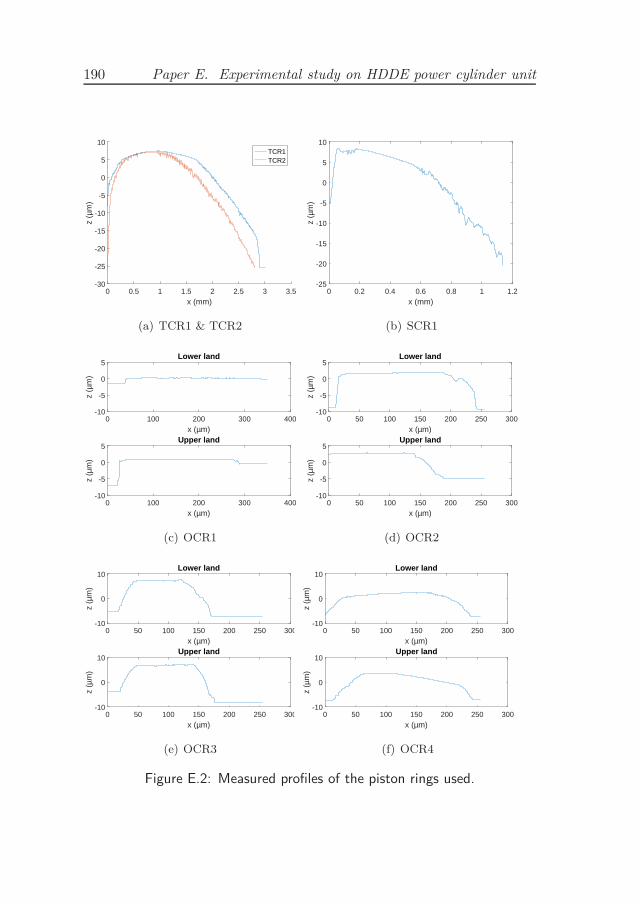
190 Paper E. Experimental study on HDDE power cylinder unit
x (mm)0 0.5 1 1.5 2 2.5 3 3.5
z (µ
m)
-30
-25
-20
-15
-10
-5
0
5
10TCR1TCR2
(a) TCR1 & TCR2
x (mm)0 0.2 0.4 0.6 0.8 1 1.2
z (µ
m)
-25
-20
-15
-10
-5
0
5
10
(b) SCR1
x (µm)0 100 200 300 400
z (µ
m)
-10
-5
0
5Lower land
x (µm)0 100 200 300 400
z (µ
m)
-10
-5
0
5Upper land
(c) OCR1
x (µm)0 50 100 150 200 250 300
z (µ
m)
-10
-5
0
5Lower land
x (µm)0 50 100 150 200 250 300
z (µ
m)
-10
-5
0
5Upper land
(d) OCR2
x (µm)0 50 100 150 200 250 300
z (µ
m)
-10
0
10Lower land
x (µm)0 50 100 150 200 250 300
z (µ
m)
-10
0
10Upper land
(e) OCR3
x (µm)0 50 100 150 200 250 300
z (µ
m)
-10
0
10Lower land
x (µm)0 50 100 150 200 250 300
z (µ
m)
-10
0
10Upper land
(f) OCR4
Figure E.2: Measured profiles of the piston rings used.
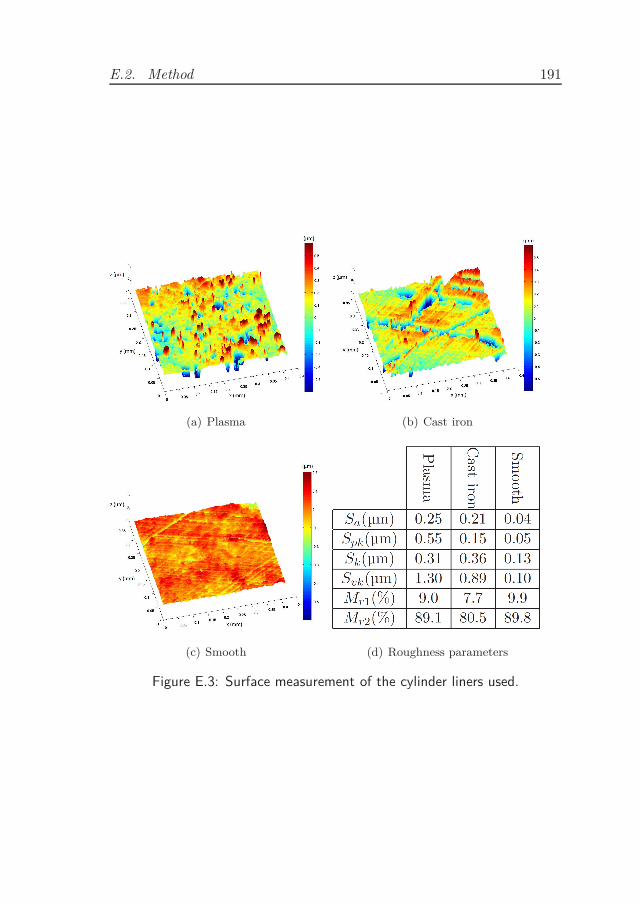
E.2. Method 191
(a) Plasma (b) Cast iron
(c) Smooth (d) Roughness parameters
Figure E.3: Surface measurement of the cylinder liners used.
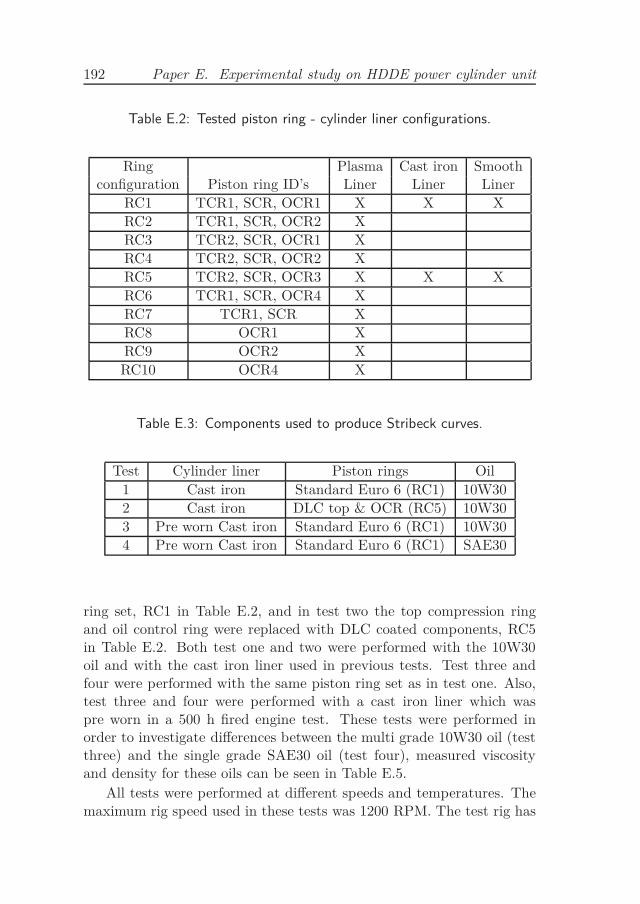
192 Paper E. Experimental study on HDDE power cylinder unit
Table E.2: Tested piston ring - cylinder liner configurations.
Ring Plasma Cast iron Smoothconfiguration Piston ring ID’s Liner Liner Liner
RC1 TCR1, SCR, OCR1 X X X
RC2 TCR1, SCR, OCR2 X
RC3 TCR2, SCR, OCR1 X
RC4 TCR2, SCR, OCR2 X
RC5 TCR2, SCR, OCR3 X X X
RC6 TCR1, SCR, OCR4 X
RC7 TCR1, SCR X
RC8 OCR1 X
RC9 OCR2 X
RC10 OCR4 X
Table E.3: Components used to produce Stribeck curves.
Test Cylinder liner Piston rings Oil
1 Cast iron Standard Euro 6 (RC1) 10W30
2 Cast iron DLC top & OCR (RC5) 10W30
3 Pre worn Cast iron Standard Euro 6 (RC1) 10W30
4 Pre worn Cast iron Standard Euro 6 (RC1) SAE30
ring set, RC1 in Table E.2, and in test two the top compression ringand oil control ring were replaced with DLC coated components, RC5in Table E.2. Both test one and two were performed with the 10W30oil and with the cast iron liner used in previous tests. Test three andfour were performed with the same piston ring set as in test one. Also,test three and four were performed with a cast iron liner which waspre worn in a 500 h fired engine test. These tests were performed inorder to investigate differences between the multi grade 10W30 oil (testthree) and the single grade SAE30 oil (test four), measured viscosityand density for these oils can be seen in Table E.5.
All tests were performed at different speeds and temperatures. Themaximum rig speed used in these tests was 1200 RPM. The test rig has
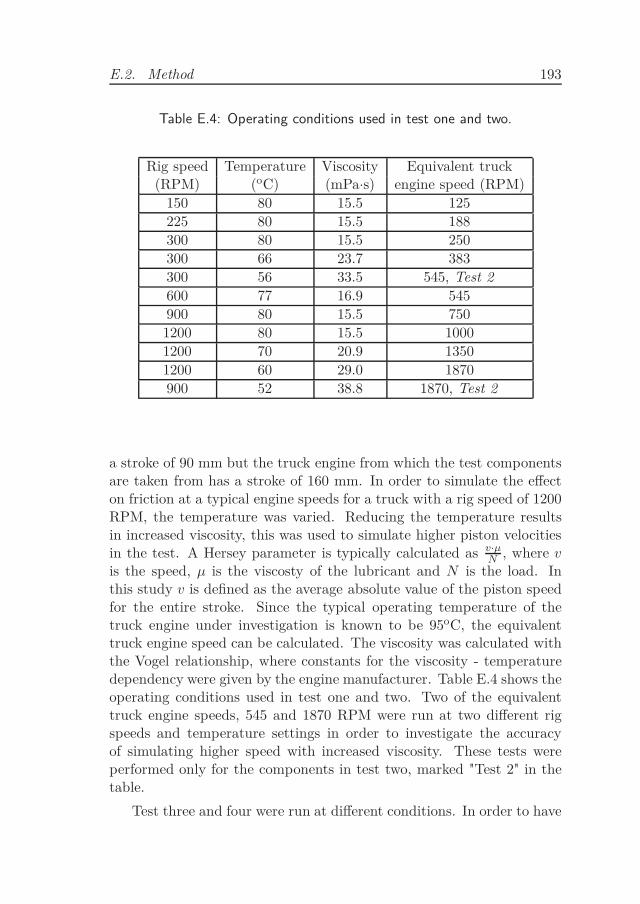
E.2. Method 193
Table E.4: Operating conditions used in test one and two.
Rig speed Temperature Viscosity Equivalent truck(RPM) (oC) (mPa·s) engine speed (RPM)
150 80 15.5 125
225 80 15.5 188
300 80 15.5 250
300 66 23.7 383
300 56 33.5 545, Test 2
600 77 16.9 545
900 80 15.5 750
1200 80 15.5 1000
1200 70 20.9 1350
1200 60 29.0 1870
900 52 38.8 1870, Test 2
a stroke of 90 mm but the truck engine from which the test componentsare taken from has a stroke of 160 mm. In order to simulate the effecton friction at a typical engine speeds for a truck with a rig speed of 1200RPM, the temperature was varied. Reducing the temperature resultsin increased viscosity, this was used to simulate higher piston velocitiesin the test. A Hersey parameter is typically calculated as v·µ
N, where v
is the speed, µ is the viscosty of the lubricant and N is the load. Inthis study v is defined as the average absolute value of the piston speedfor the entire stroke. Since the typical operating temperature of thetruck engine under investigation is known to be 95oC, the equivalenttruck engine speed can be calculated. The viscosity was calculated withthe Vogel relationship, where constants for the viscosity - temperaturedependency were given by the engine manufacturer. Table E.4 shows theoperating conditions used in test one and two. Two of the equivalenttruck engine speeds, 545 and 1870 RPM were run at two different rigspeeds and temperature settings in order to investigate the accuracyof simulating higher speed with increased viscosity. These tests wereperformed only for the components in test two, marked "Test 2" in thetable.
Test three and four were run at different conditions. In order to have
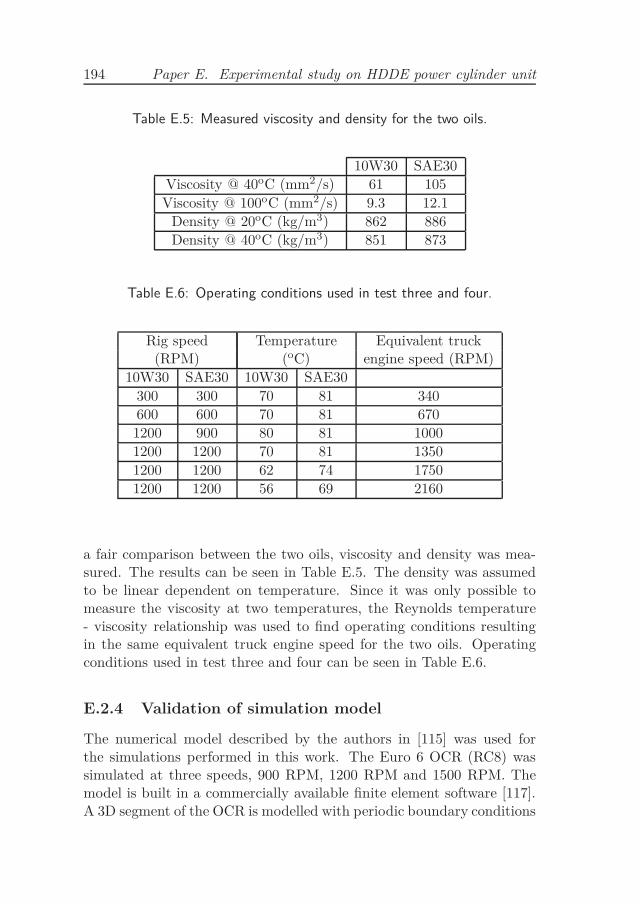
194 Paper E. Experimental study on HDDE power cylinder unit
Table E.5: Measured viscosity and density for the two oils.
10W30 SAE30
Viscosity @ 40oC (mm2/s) 61 105
Viscosity @ 100oC (mm2/s) 9.3 12.1
Density @ 20oC (kg/m3) 862 886
Density @ 40oC (kg/m3) 851 873
Table E.6: Operating conditions used in test three and four.
Rig speed Temperature Equivalent truck(RPM) (oC) engine speed (RPM)
10W30 SAE30 10W30 SAE30
300 300 70 81 340
600 600 70 81 670
1200 900 80 81 1000
1200 1200 70 81 1350
1200 1200 62 74 1750
1200 1200 56 69 2160
a fair comparison between the two oils, viscosity and density was mea-sured. The results can be seen in Table E.5. The density was assumedto be linear dependent on temperature. Since it was only possible tomeasure the viscosity at two temperatures, the Reynolds temperature- viscosity relationship was used to find operating conditions resultingin the same equivalent truck engine speed for the two oils. Operatingconditions used in test three and four can be seen in Table E.6.
E.2.4 Validation of simulation model
The numerical model described by the authors in [115] was used forthe simulations performed in this work. The Euro 6 OCR (RC8) wassimulated at three speeds, 900 RPM, 1200 RPM and 1500 RPM. Themodel is built in a commercially available finite element software [117].A 3D segment of the OCR is modelled with periodic boundary conditions
E.3. Results and discussion 195
in tangential direction. This means that the ring gap is not consideredand the cylinder liner and piston ring is assumed to be perfectly circular.The Reynolds equation with a mass conserving cavitation model is solvedon the ring lands in contact with the cylinder liner and also on bothsurfaces in contact with the piston ring holder. The ring segment isfree to move, tilt and elastically deform within the ring holder groove.Inertia of the ring segment is taken into account. A contact modelis also included in order to take the effects of mixed lubrication intoconsideration. The contact model is a stiffness curve calculated on ameasured section of a cylinder liner surface. The stiffness curve usedwas provided by Scania CV. There are some differences compared tothe model described in [115]. In the simulations performed in this workno correction factors were used either for the Reynolds equation or inthe calculation of hydrodynamic friction. The coefficient for boundaryfriction was set to 0.1. The temperature used in the simulations was thesame as the set temperature in the test, 80oC.
E.3 Results and discussion
This section shows the results obtained in this work. If not otherwisestated the results showing crank angle resolved friction are filtered witha moving average filter. The crank angle resolved friction force is alwaysdisplayed as the mean friction force at each crank angle for the entiretest.
E.3.1 Component variation tests
For an easier overview of component variation test listed in Table E.2the results for friction are divided into Figure E.4, E.5 and E.6. In thesefigures the filtered data for friction force as a function of crank angle de-gree is shown together with the result for average friction power duringthe entire test. The result for average friction power is also summarisedin Table E.7. Figure E.4 shows the result for friction with the threedifferent liners. It can be noted that with all three liners, friction islower with ring configuration 5 (DLC) compared to ring configuration 1(Eu 6). This is expected since the ring tangential force is significantlylower for the OCR3 in RC5 compared to OCR1 in RC1. It can alsobe noted that with ring configuration 1 (Eu 6 rings) the smooth linershows the lowest friction, the plasma liner showed highest friction and
196 Paper E. Experimental study on HDDE power cylinder unit
the friction reading for the cast iron liner was in between those two.This was true for both 900 RPM and 1200 RPM. The trends were dif-ferent with ring configuration 5 (DLC rings). The plasma liner did stillshow the highest friction losses at both speeds. However, the resultsfor cast iron liner showed lower friction than the smooth liner at bothspeeds. Even though the difference in friction is small when comparingthe cast iron liner to the smooth liner with RC5 thus making it hard tomake definitive conclusions, the trend is completely different comparedto the results with RC1. The difference in friction for cast iron linerand smooth liner with RC1 was expected. Typically a smoother plateausurface will result in lower friction, which was clearly found in these testswith RC1, since the degree of full film lubrication increases. There areseveral differences between ring configurations 1 and 5. One difference isthe DLC coating on the top compression ring and the slightly lower ringtension compared to the Eu6 compression ring. In the results showed inFigure E.5 and summarised in Table E.7 it can be noted that replacingonly the top compression ring in RC1 to the DLC top compression ring(RC3) the friction was reduced by 10 W with the plasma liner at both900 and 1200 RPM. The other difference between RC1 and RC5 is thelower tangential load, DLC coating and thinner lands on OCR3 in RC5.When comparing friction for the plasma liner with RC3 and RC5 wherethe Eu6 OCR has been replaced with the DLC OCR a reduction in fric-tion power of 5 W and and 29 W can be noted at 900 RPM and 1200RPM respectively. The lower ring tension and DLC coating on the OCRhad much larger impact at higher speed. This will be studied furtherlater in this paper when the Stribeck curves are shown. Further obser-vations can be made when studying the results in Figure E.5. OCR2(stepped land) significantly reduces friction in configuration 2 and 4 forboth tested speeds. Interesting observations can be made when compar-ing results for RC1, RC2, RC3 and RC4. Adding up the reduction infriction from replacing individual components in RC1 (Eu6) to steppedland OCR (RC2) and DLC TCR (RC3) is almost the same as the reduc-tion in friction when replacing both components. This shows that theEu6 and DLC top compression ring has the same response to the OCRreplacement. The results for RC6 (Eu6 TCR and SCR with loose lands3 piece OCR) showed the significantly largest friction among the testedconfigurations. More mixed or even boundary lubrication close to rever-sal zones was introduced, as can be seen in Figure E.5. At 900 RPM thistrend is much larger than at 1200 RPM which further strengthen the
E.3. Results and discussion 197
assumption of transition into mixed lubrication towards the boundaryregime. This is because of the larger ring tension in combination withthe more narrow lands. The results in Figure E.6 shows friction fromindividual components. By first comparing friction from RC7 and RC8which are the two top rings and OCR respectively from RC1 it can benoted that the OCR is contributing more to friction losses than the twotop rings. Also when comparing the sum of friction from the individualcomponent test RC7 and RC8 to RC1 it can be noted that the friction issignificantly larger with all rings mounted on the ring holder. This indi-cates that the OCR significantly reduces the amount of oil that reachesthe two top rings, introduces starved lubrication and is the cause of theincreased friction. This means that an indication of the sealing capa-bility of an OCR, restriction of oil left for the compression rings, canbe evaluated in this way. This trend has been found previous by theauthors in [116] and is an additional reason why it can be beneficial touse a complete cylinder liner instead of segments with a part of the cir-cumference. By making the same comparison with the other two OCR’stested individually an estimate of the sealing capability can be madefor these as well. A summary of this comparison can be seen in TableE.8. The difference column shows the increase in friction power with allrings mounted on the ring holder compared to the sum of the two com-ponents (both top compression rings and oil control ring respectively).The difference for RC1 can be seen as a baseline for acceptable amountof difference. These are standard production components providing anacceptable amount of oil consumption in an engine. A large differencein this comparison means larger sealing capability of the OCR. At 900RPM the difference is almost the same for the Eu6 and stepped land oilcontrol ring while the loose rails OCR shows a larger difference. This isbecause of the previously mentioned larger ring tension in combinationwith the more narrow lands for the loose rails OCR. Even though thestepped land OCR has half the ring tension compared to the Eu6 OCR itstill shows close to the same amount of sealing capability. At 1200 RPMit can be noticed that the difference for the loose rails OCR and steppedland OCR is reduced compared to the Eu6 OCR. The loose rails OCRshow almost the same difference as the Eu6 OCR. The stepped landOCR shows a little bit less difference than the Eu6 OCR indicating thatthe sealing capability reduces somewhat with increased speed. Howeverthe differences are still quite similar and further studies preferably inreal engine tests are needed to evaluate the real effect on oil consump-
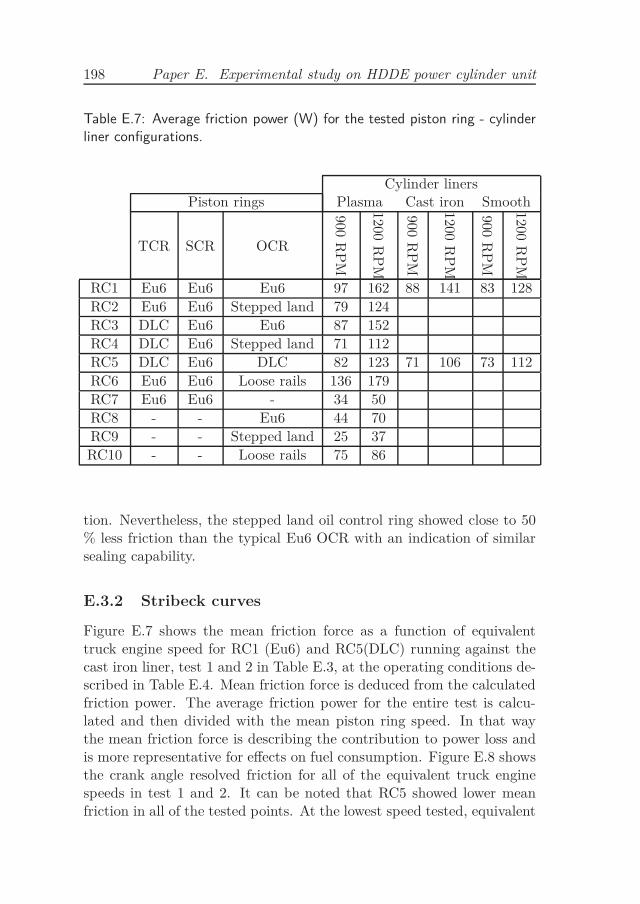
198 Paper E. Experimental study on HDDE power cylinder unit
Table E.7: Average friction power (W) for the tested piston ring - cylinderliner configurations.
Cylinder linersPiston rings Plasma Cast iron Smooth
TCR SCR OCR
900R
PM
1200R
PM
900R
PM
1200R
PM
900R
PM
1200R
PM
RC1 Eu6 Eu6 Eu6 97 162 88 141 83 128
RC2 Eu6 Eu6 Stepped land 79 124
RC3 DLC Eu6 Eu6 87 152
RC4 DLC Eu6 Stepped land 71 112
RC5 DLC Eu6 DLC 82 123 71 106 73 112
RC6 Eu6 Eu6 Loose rails 136 179
RC7 Eu6 Eu6 - 34 50
RC8 - - Eu6 44 70
RC9 - - Stepped land 25 37
RC10 - - Loose rails 75 86
tion. Nevertheless, the stepped land oil control ring showed close to 50% less friction than the typical Eu6 OCR with an indication of similarsealing capability.
E.3.2 Stribeck curves
Figure E.7 shows the mean friction force as a function of equivalenttruck engine speed for RC1 (Eu6) and RC5(DLC) running against thecast iron liner, test 1 and 2 in Table E.3, at the operating conditions de-scribed in Table E.4. Mean friction force is deduced from the calculatedfriction power. The average friction power for the entire test is calcu-lated and then divided with the mean piston ring speed. In that waythe mean friction force is describing the contribution to power loss andis more representative for effects on fuel consumption. Figure E.8 showsthe crank angle resolved friction for all of the equivalent truck enginespeeds in test 1 and 2. It can be noted that RC5 showed lower meanfriction in all of the tested points. At the lowest speed tested, equivalent
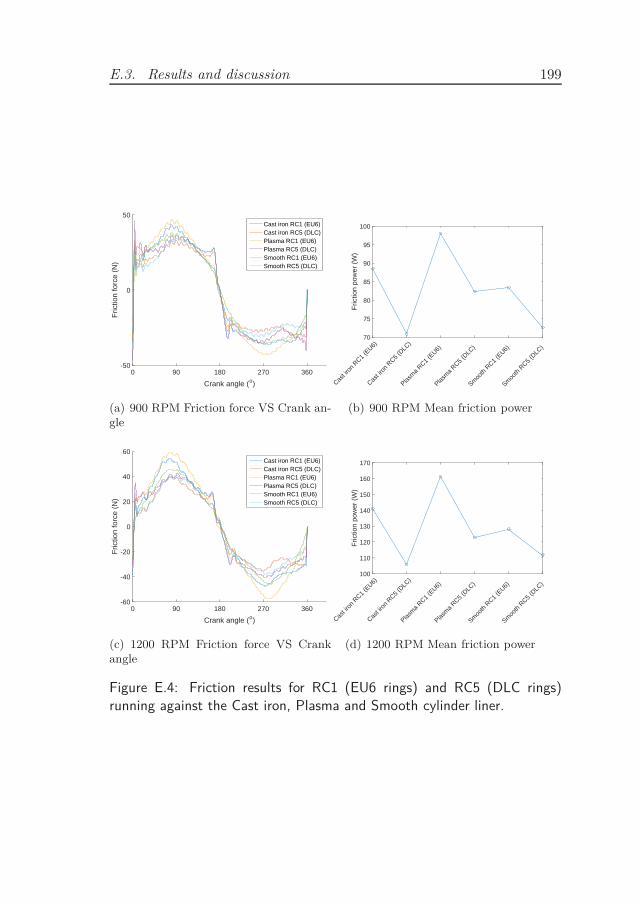
E.3. Results and discussion 199
Crank angle (o)
0 90 180 270 360
Fric
tion
forc
e (N
)
-50
0
50Cast iron RC1 (EU6)Cast iron RC5 (DLC)Plasma RC1 (EU6)Plasma RC5 (DLC)Smooth RC1 (EU6)Smooth RC5 (DLC)
(a) 900 RPM Friction force VS Crank an-gle
Cast ir
on R
C1 (E
U6)
Cast ir
on R
C5 (D
LC)
Plasm
a RC1
(EU6)
Plasm
a RC5
(DLC
)
Smoo
th R
C1 (E
U6)
Smoo
th R
C5 (D
LC)
Fric
tion
pow
er (
W)
70
75
80
85
90
95
100
(b) 900 RPM Mean friction power
Crank angle (o)
0 90 180 270 360
Fric
tion
forc
e (N
)
-60
-40
-20
0
20
40
60Cast iron RC1 (EU6)Cast iron RC5 (DLC)Plasma RC1 (EU6)Plasma RC5 (DLC)Smooth RC1 (EU6)Smooth RC5 (DLC)
(c) 1200 RPM Friction force VS Crankangle
Cast ir
on R
C1 (E
U6)
Cast ir
on R
C5 (D
LC)
Plasm
a RC1
(EU6)
Plasm
a RC5
(DLC
)
Smoo
th R
C1 (E
U6)
Smoo
th R
C5 (D
LC)
Fric
tion
pow
er (
W)
100
110
120
130
140
150
160
170
(d) 1200 RPM Mean friction power
Figure E.4: Friction results for RC1 (EU6 rings) and RC5 (DLC rings)running against the Cast iron, Plasma and Smooth cylinder liner.
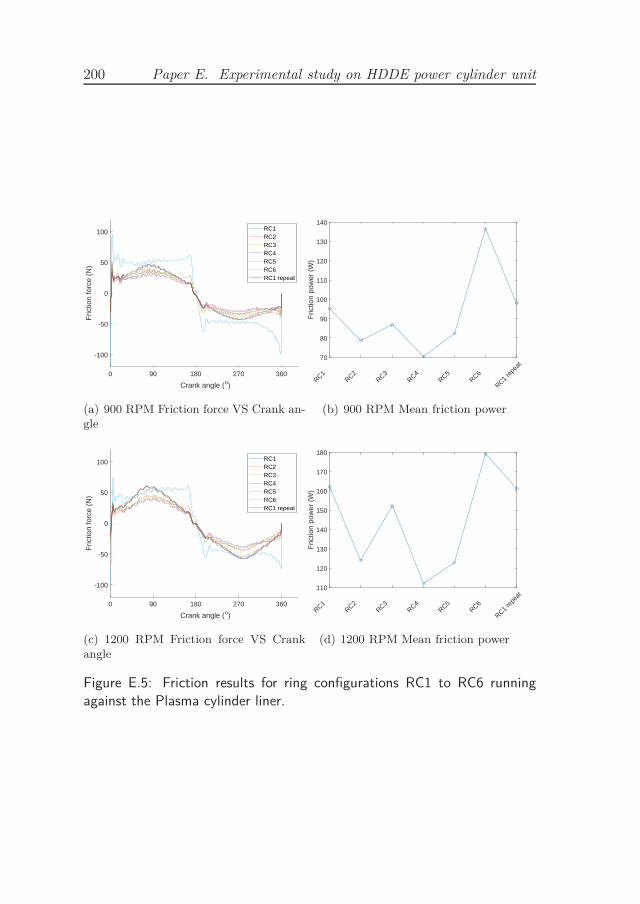
200 Paper E. Experimental study on HDDE power cylinder unit
Crank angle (o)
0 90 180 270 360
Fric
tion
forc
e (N
)
-100
-50
0
50
100 RC1RC2RC3RC4RC5RC6RC1 repeat
(a) 900 RPM Friction force VS Crank an-gle
RC1
RC2
RC3
RC4
RC5
RC6
RC1 re
peat
Fric
tion
pow
er (
W)
70
80
90
100
110
120
130
140
(b) 900 RPM Mean friction power
Crank angle (o)
0 90 180 270 360
Fric
tion
forc
e (N
)
-100
-50
0
50
100 RC1RC2RC3RC4RC5RC6RC1 repeat
(c) 1200 RPM Friction force VS Crankangle
RC1
RC2
RC3
RC4
RC5
RC6
RC1 re
peat
Fric
tion
pow
er (
W)
110
120
130
140
150
160
170
180
(d) 1200 RPM Mean friction power
Figure E.5: Friction results for ring configurations RC1 to RC6 runningagainst the Plasma cylinder liner.
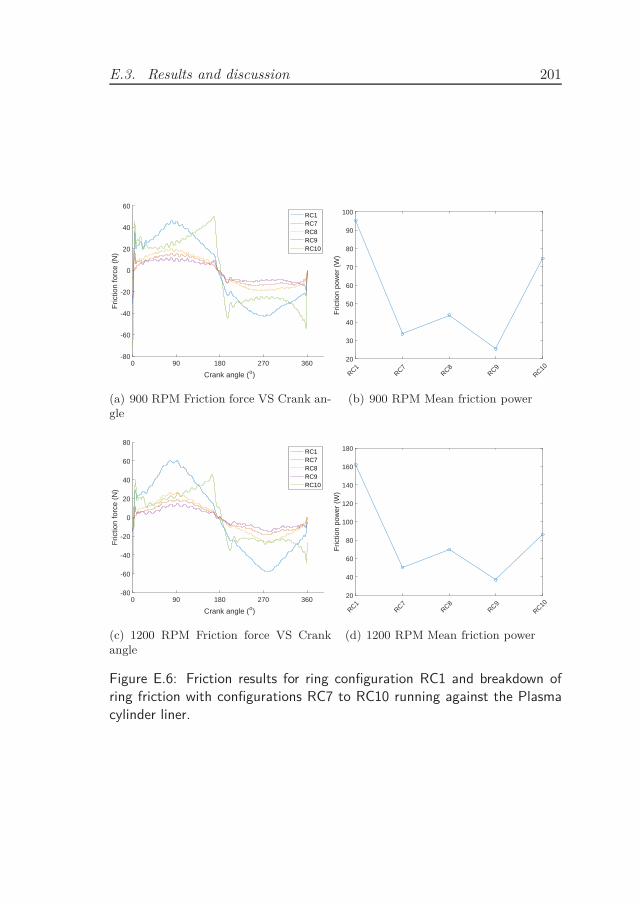
E.3. Results and discussion 201
Crank angle (o)
0 90 180 270 360
Fric
tion
forc
e (N
)
-80
-60
-40
-20
0
20
40
60RC1RC7RC8RC9RC10
(a) 900 RPM Friction force VS Crank an-gle
RC1 RC7
RC8 RC9
RC10
Fric
tion
pow
er (
W)
20
30
40
50
60
70
80
90
100
(b) 900 RPM Mean friction power
Crank angle (o)
0 90 180 270 360
Fric
tion
forc
e (N
)
-80
-60
-40
-20
0
20
40
60
80RC1RC7RC8RC9RC10
(c) 1200 RPM Friction force VS Crankangle
RC1 RC7
RC8 RC9
RC10
Fric
tion
pow
er (
W)
20
40
60
80
100
120
140
160
180
(d) 1200 RPM Mean friction power
Figure E.6: Friction results for ring configuration RC1 and breakdown ofring friction with configurations RC7 to RC10 running against the Plasmacylinder liner.
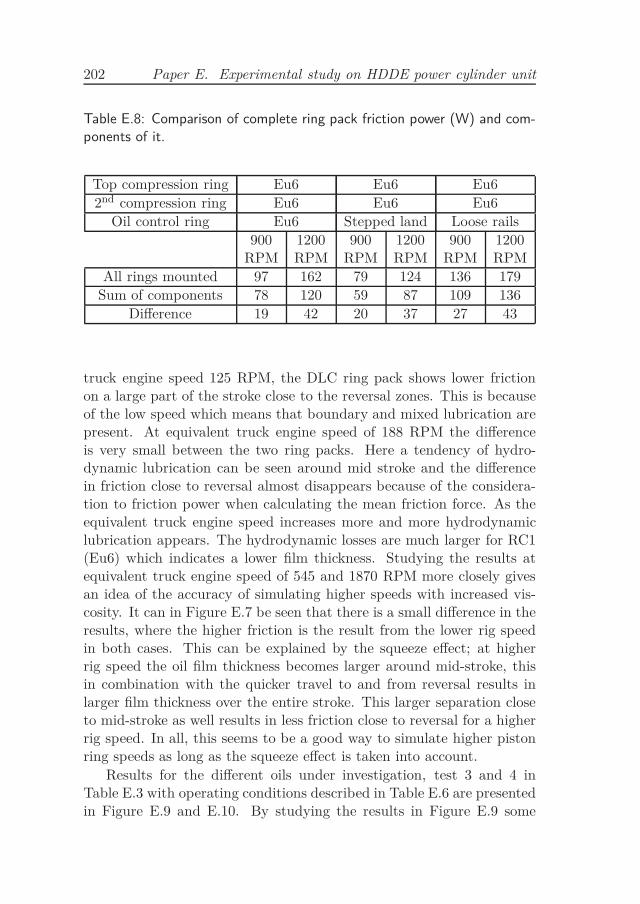
202 Paper E. Experimental study on HDDE power cylinder unit
Table E.8: Comparison of complete ring pack friction power (W) and com-ponents of it.
Top compression ring Eu6 Eu6 Eu6
2nd compression ring Eu6 Eu6 Eu6
Oil control ring Eu6 Stepped land Loose rails
900 1200 900 1200 900 1200RPM RPM RPM RPM RPM RPM
All rings mounted 97 162 79 124 136 179
Sum of components 78 120 59 87 109 136
Difference 19 42 20 37 27 43
truck engine speed 125 RPM, the DLC ring pack shows lower frictionon a large part of the stroke close to the reversal zones. This is becauseof the low speed which means that boundary and mixed lubrication arepresent. At equivalent truck engine speed of 188 RPM the differenceis very small between the two ring packs. Here a tendency of hydro-dynamic lubrication can be seen around mid stroke and the differencein friction close to reversal almost disappears because of the considera-tion to friction power when calculating the mean friction force. As theequivalent truck engine speed increases more and more hydrodynamiclubrication appears. The hydrodynamic losses are much larger for RC1(Eu6) which indicates a lower film thickness. Studying the results atequivalent truck engine speed of 545 and 1870 RPM more closely givesan idea of the accuracy of simulating higher speeds with increased vis-cosity. It can in Figure E.7 be seen that there is a small difference in theresults, where the higher friction is the result from the lower rig speedin both cases. This can be explained by the squeeze effect; at higherrig speed the oil film thickness becomes larger around mid-stroke, thisin combination with the quicker travel to and from reversal results inlarger film thickness over the entire stroke. This larger separation closeto mid-stroke as well results in less friction close to reversal for a higherrig speed. In all, this seems to be a good way to simulate higher pistonring speeds as long as the squeeze effect is taken into account.
Results for the different oils under investigation, test 3 and 4 inTable E.3 with operating conditions described in Table E.6 are presentedin Figure E.9 and E.10. By studying the results in Figure E.9 some
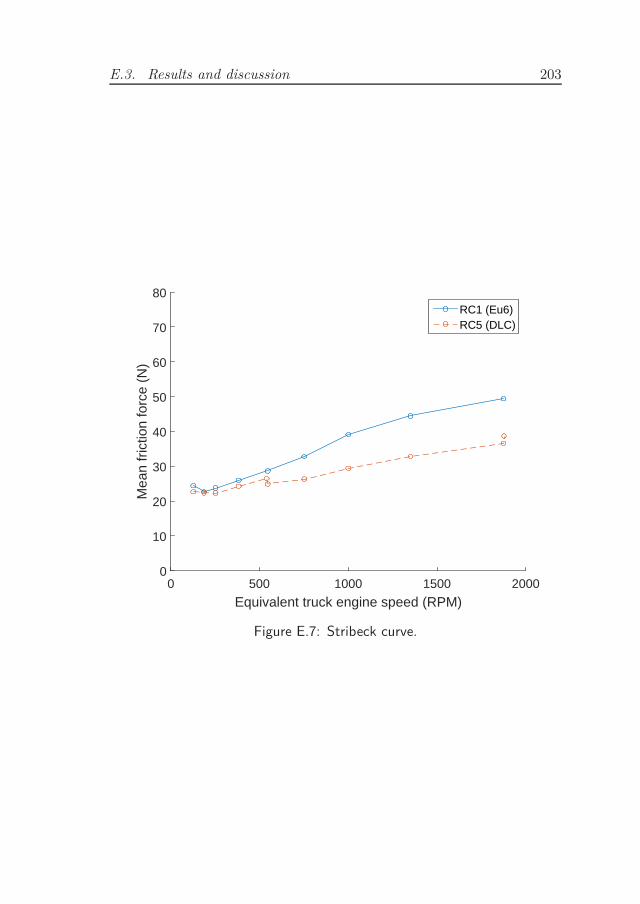
E.3. Results and discussion 203
Equivalent truck engine speed (RPM)0 500 1000 1500 2000
Mea
n fr
ictio
n fo
rce
(N)
0
10
20
30
40
50
60
70
80RC1 (Eu6)RC5 (DLC)
Figure E.7: Stribeck curve.
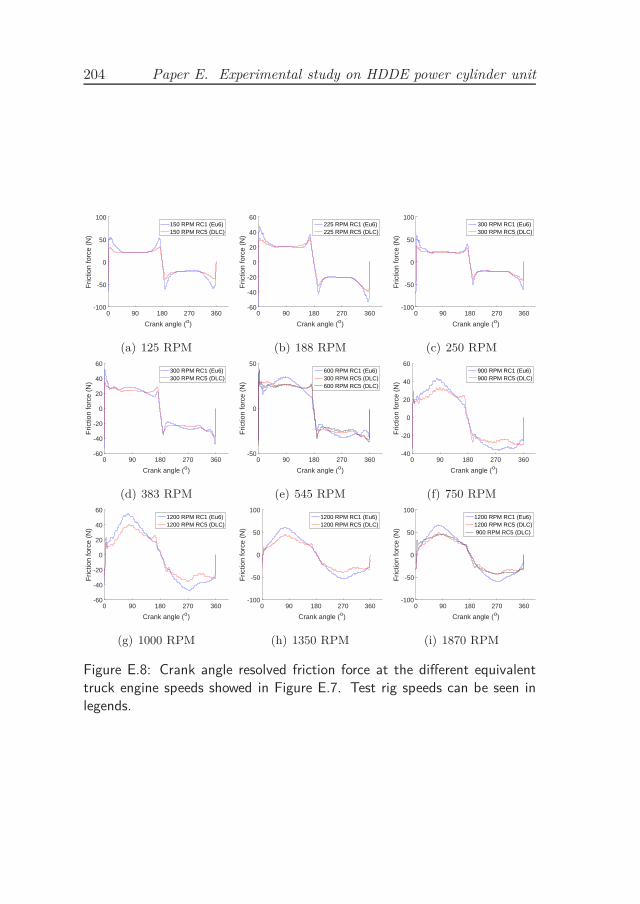
204 Paper E. Experimental study on HDDE power cylinder unit
Crank angle (o)
0 90 180 270 360
Fric
tion
forc
e (N
)
-100
-50
0
50
100150 RPM RC1 (Eu6)150 RPM RC5 (DLC)
(a) 125 RPM
Crank angle (o)
0 90 180 270 360
Fric
tion
forc
e (N
)
-60
-40
-20
0
20
40
60225 RPM RC1 (Eu6)225 RPM RC5 (DLC)
(b) 188 RPM
Crank angle (o)
0 90 180 270 360
Fric
tion
forc
e (N
)
-100
-50
0
50
100300 RPM RC1 (Eu6)300 RPM RC5 (DLC)
(c) 250 RPM
Crank angle (o)
0 90 180 270 360
Fric
tion
forc
e (N
)
-60
-40
-20
0
20
40
60300 RPM RC1 (Eu6)300 RPM RC5 (DLC)
(d) 383 RPM
Crank angle (o)
0 90 180 270 360
Fric
tion
forc
e (N
)
-50
0
50600 RPM RC1 (Eu6)300 RPM RC5 (DLC)600 RPM RC5 (DLC)
(e) 545 RPM
Crank angle (o)
0 90 180 270 360
Fric
tion
forc
e (N
)
-40
-20
0
20
40
60900 RPM RC1 (Eu6)900 RPM RC5 (DLC)
(f) 750 RPM
Crank angle (o)
0 90 180 270 360
Fric
tion
forc
e (N
)
-60
-40
-20
0
20
40
601200 RPM RC1 (Eu6)1200 RPM RC5 (DLC)
(g) 1000 RPM
Crank angle (o)
0 90 180 270 360
Fric
tion
forc
e (N
)
-100
-50
0
50
1001200 RPM RC1 (Eu6)1200 RPM RC5 (DLC)
(h) 1350 RPM
Crank angle (o)
0 90 180 270 360
Fric
tion
forc
e (N
)
-100
-50
0
50
1001200 RPM RC1 (Eu6)1200 RPM RC5 (DLC) 900 RPM RC5 (DLC)
(i) 1870 RPM
Figure E.8: Crank angle resolved friction force at the different equivalenttruck engine speeds showed in Figure E.7. Test rig speeds can be seen inlegends.
E.3. Results and discussion 205
observations can be made. At equivalent truck engine speed 1350 and2160 the results have some deviation but overall the results for meanfriction force are almost identical for the two oils. When studying thecrank angle resolved friction results in Figure E.10 it can be seen thatthe difference between the two oils are very small in most of the testedoperating conditions. The largest difference is at equivalent truck enginespeed 1000 RPM, this is the point where the smallest difference in meanfriction force was found. This is because the test point was run withdifferent rig speeds. The test with lower speed shows higher frictionaround the reversal zones and less friction around mid stroke comparedto the test at higher speed. Nevertheless, this point showed an excellentcorrelation in mean friction power even though friction during the strokediffered. The small difference between the multi grade 10W30 and singlegrade SAE30 indicates none or small amount of shear thinning. Thisis probably because of the low viscosity of the 10W30. At 100oC theviscosity was measured to be 9.3 mm2/s which is on the lower boundaryfor a 10W30 oil. This indicates that a low amount of polymers, viscosityimprover, are present in the oil which would result in none or smallamounts of shear thinning in the contact.
E.3.3 Validation of numerical model
The sampled friction force measured in the test rig compared to thesimulation results can be seen in Figure E.11. The simulated resultsshow good correlation with the measured data. At 900 RPM and 1200RPM the mean friction power is almost identical for the test rig andsimulation. At 1500 RPM some deviation can be seen. Because of theresults showed earlier comparing single grade with multi grade oil thisis probably not because of shear thinning effects. The difference at 1500RPM could be caused by heating of the oil in the contact leading toslightly lower viscosity and therefore lower friction in the test rig. An-other reason for the difference could be caused by the large amount ofnoise in the signal. Nevertheless, a good match in the crank angle re-solved friction force for all speeds, excellent correlation in friction powerat 900 RPM and 1200 RPM suggests that the method of simulation isacceptable.
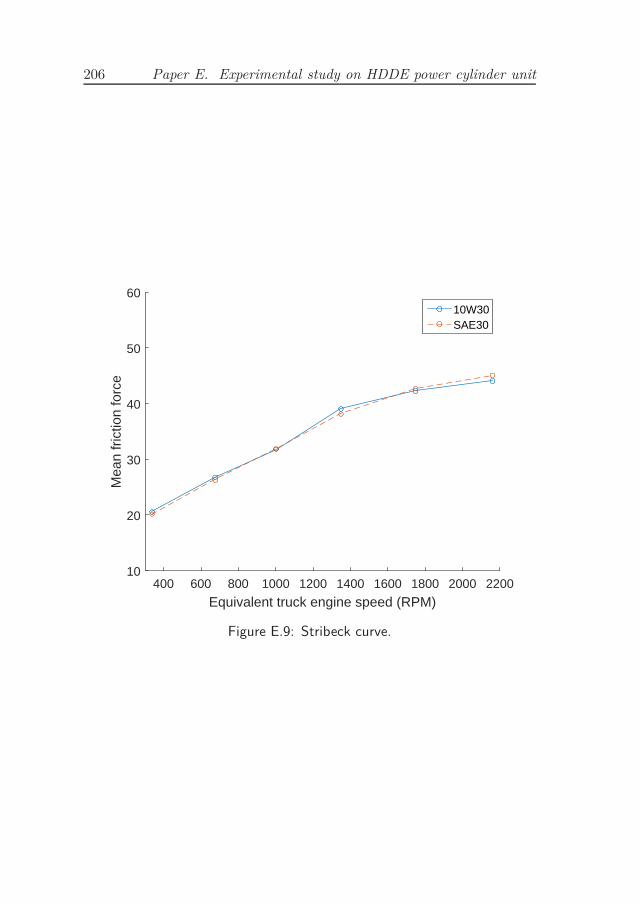
206 Paper E. Experimental study on HDDE power cylinder unit
Equivalent truck engine speed (RPM)400 600 800 1000 1200 1400 1600 1800 2000 2200
Mea
n fr
ictio
n fo
rce
10
20
30
40
50
6010W30SAE30
Figure E.9: Stribeck curve.
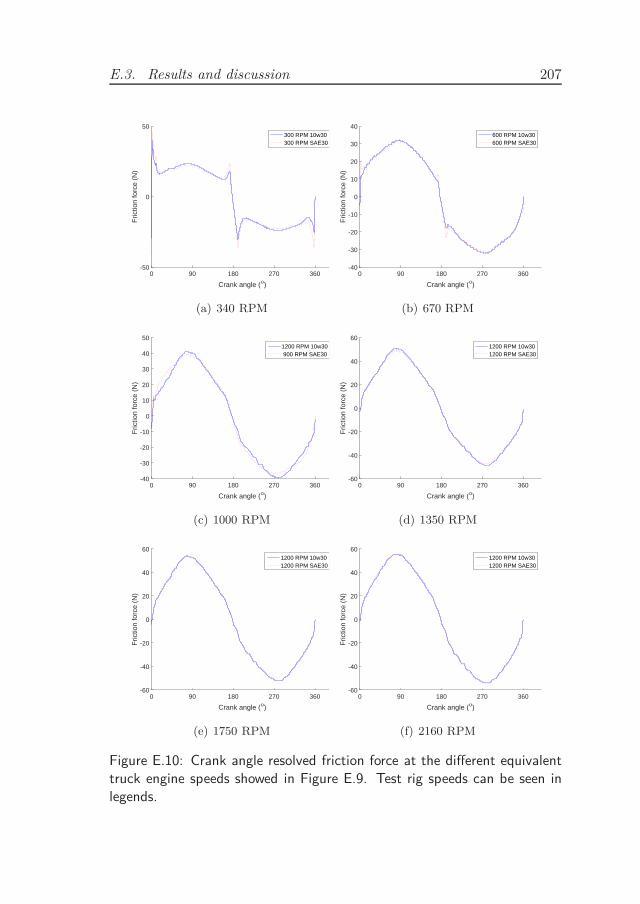
E.3. Results and discussion 207
Crank angle (o)
0 90 180 270 360
Fric
tion
forc
e (N
)
-50
0
50300 RPM 10w30300 RPM SAE30
(a) 340 RPM
Crank angle (o)
0 90 180 270 360
Fric
tion
forc
e (N
)
-40
-30
-20
-10
0
10
20
30
40600 RPM 10w30600 RPM SAE30
(b) 670 RPM
Crank angle (o)
0 90 180 270 360
Fric
tion
forc
e (N
)
-40
-30
-20
-10
0
10
20
30
40
501200 RPM 10w30 900 RPM SAE30
(c) 1000 RPM
Crank angle (o)
0 90 180 270 360
Fric
tion
forc
e (N
)
-60
-40
-20
0
20
40
601200 RPM 10w301200 RPM SAE30
(d) 1350 RPM
Crank angle (o)
0 90 180 270 360
Fric
tion
forc
e (N
)
-60
-40
-20
0
20
40
601200 RPM 10w301200 RPM SAE30
(e) 1750 RPM
Crank angle (o)
0 90 180 270 360
Fric
tion
forc
e (N
)
-60
-40
-20
0
20
40
601200 RPM 10w301200 RPM SAE30
(f) 2160 RPM
Figure E.10: Crank angle resolved friction force at the different equivalenttruck engine speeds showed in Figure E.9. Test rig speeds can be seen inlegends.
208 Paper E. Experimental study on HDDE power cylinder unit
E.4 Conclusions
An extensive experimental investigation with different piston rings, cylin-der liners and two oils has been performed. Smoother plateau surfacecylinder liner surfaces was proven beneficial for friction compared to atypical standard honed cylinder liner with a typical HDDE ring pack.With DLC coated rings and TLOCR with low tangential load and thinlands, the standard honed cylinder liner showed slightly less frictionthan the smoother liner. It was also shown that the ring tangential loadhas a direct impact on the friction losses for a oil control ring. For oneof the tested components, friction for the oil control ring was reducedby almost 50 % while still indicating small difference in oil supplied tothe top compression rings. Stribeck like curves has been produced inorder to simulate higher speeds with increased viscosity. The methodwas proven to be acceptable, but squeeze effects must be taken into ac-count. Two different oils were compared, a single grade SAE30 and amultigrade 10W30. Small amount or no shear thinning effect was found.A numerical model developed previously by the authors has also beenvalidated. The model showed good correlation with the measured data.
Acknowledgement
The authors would like to thank Scania, AB Volvo and Energimyn-digheten and the Energy Efficient Vehicle programme for their fundingof this work. Thanks also to the Swedish research council.
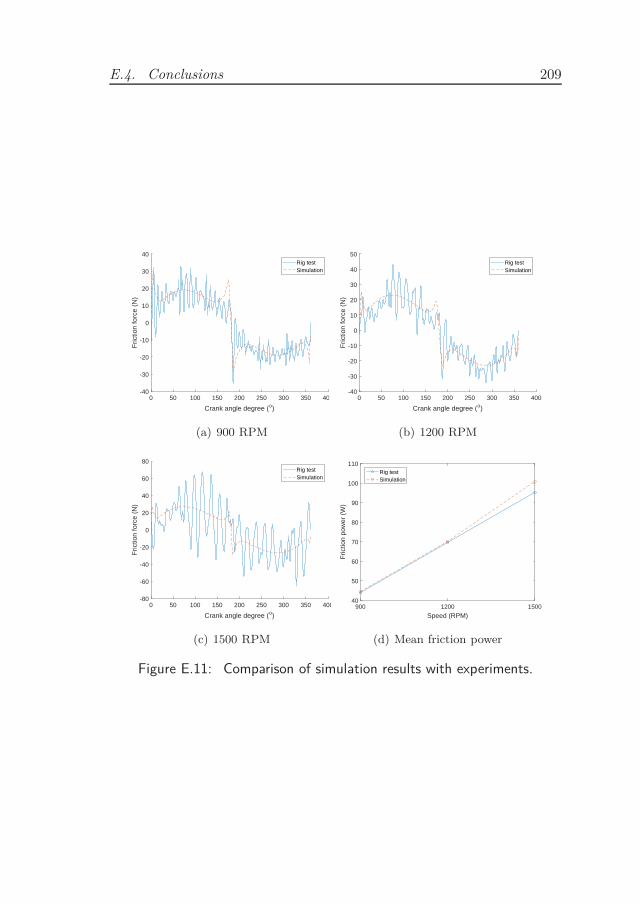
E.4. Conclusions 209
Crank angle degree (o)
0 50 100 150 200 250 300 350 400
Fric
tion
forc
e (N
)
-40
-30
-20
-10
0
10
20
30
40Rig testSimulation
(a) 900 RPM
Crank angle degree (o)
0 50 100 150 200 250 300 350 400
Fric
tion
forc
e (N
)
-40
-30
-20
-10
0
10
20
30
40
50Rig testSimulation
(b) 1200 RPM
Crank angle degree (o)
0 50 100 150 200 250 300 350 400
Fric
tion
forc
e (N
)
-80
-60
-40
-20
0
20
40
60
80Rig testSimulation
(c) 1500 RPM
Speed (RPM)900 1200 1500
Fric
tion
pow
er (
W)
40
50
60
70
80
90
100
110Rig testSimulation
(d) Mean friction power
Figure E.11: Comparison of simulation results with experiments.

References
[1] R. Taylor, “Heavy duty diesel engine fuel economy: Lubricantsensitivities,” SAE Technical Papers, 2000.
[2] S. Tung and M. McMillan, “Automotive tribology overview of cur-rent advances and challenges for the future,” Tribology Interna-
tional, vol. 37, no. 7, pp. 517–536, 2004.
[3] K. Holmberg, P. Andersson, N.-O. Nylund, K. Mäkelä, andA. Erdemir, “Global energy consumption due to friction in trucksand buses,” Tribology International, vol. 78, pp. 94–114, 2014.
[4] H. Chen, Y. Li, and T. Tian, “A novel approach to model thelubrication and friction between the twin-land oil control ring andliner with consideration of micro structure of the liner surface finishin internal combustion engines,” 06 2008.
[5] J. Jocsak, Y. Li, T. Tian, and V. W. Wong, “Modeling and opti-mizing honing texture for reduced friction in internal combustionengines,” tech. rep., SAE Technical Paper, 2006.
[6] S. Johansson, A Surface Engineering Approach to Reduction of
Frictional Losses of Heavy Duty Diesel Engines. PhD thesis,Chalmers University of Technology, 2012.
[7] D. E. Richardson, “Review of power cylinder friction for dieselengines,” Journal of Engineering for Gas Turbines and Power,vol. 122, no. 4, pp. 506–519, 2000.
[8] M. Hoshi, “Reducing friction losses in automobile engines,” Tri-
bology international, vol. 17, no. 4, pp. 185–189, 1984.
211
212 References
[9] E. Nocera, R. A. Bruno, D. Silva, and J. Bieneman, “High dura-bility and low fuel consumption ring pack for hdd engines,” SAE
Technical Paper, 04 2013.
[10] K. Liao, H. Chen, and T. Tian, “The study of friction betweenpiston ring and different cylinder liners using floating liner engine- part 1,” SAE Technical Paper, 04 2012.
[11] V. W. Wong and S. C. Tung, “Overview of automotive enginefriction and reduction trends–effects of surface, material, andlubricant-additive technologies,” Friction, vol. 4, no. 1, pp. 1–28,2016.
[12] A. Comfort, “An introduction to heavy-duty diesel engine fric-tional losses and lubricant properties affecting fuel economy - parti,” SAE Technical Papers, 2003.
[13] Y. Wakuri, T. Hamatake, M. Soejima, and T. Kitahara, “Pistonring friction in internal combustion engines,” Tribology Interna-
tional, vol. 25, no. 5, pp. 299 – 308, 1992.
[14] J. Greenwood and J. Tripp, “The contact of two nominally flatrough surfaces,” Proceedings of the institution of mechanical engi-
neers, vol. 185, no. 1, pp. 625–633, 1970.
[15] N. Patir and H. Cheng, “An average flow model for determiningeffects of three-dimensional roughness on partial hydrodynamiclubrication.,” TRANS. ASME SER. F, J. LUBR. TECHNOL.,vol. 100, no. 1 , Jan. 1978, pp. 12–17, 1978.
[16] D. Dowson, P. Economou, B. Ruddy, P. Strachan, and A. Baker,“Piston ring lubrication-part ii. theoretical analysis of a single ringand a complete ring pack,” Energy conservation through fluid film
lubrication technology: frontiers in research and design, pp. 23–52,1979.
[17] D. Dowson, B. Ruddy, and P. Economou, “The elastohydrody-namic lubrication of piston rings,” Proceedings of the Royal Soci-
ety of London. A. Mathematical and Physical Sciences, vol. 386,no. 1791, pp. 409–430, 1983.
[18] S. M. Rohde, K. W. Whitaker, and G. T. McAllister, “A mixedfriction model for dynamically loaded contacts with application to

References 213
piston ring lubrication,” in Surface Roughness Effects in Hydrody-
namic and Mixed Lubrication, Proceedings of the ASME Winter
Annual Meeting, pp. 19–50, 1980.
[19] B. Ruddy, D. Dowson, and P. Economou, “A theoretical analysisof the twin-land type of oil-control piston ring,” Journal of Me-
chanical Engineering Science, vol. 23, no. 2, pp. 51–62, 1981.
[20] T. Tian and V. Wong, “Modeling the lubrication, dynamics, andeffects of piston dynamic tilt of twin-land oil control rings in inter-nal combustion engines,” Journal of engineering for gas turbines
and power, vol. 122, no. 1, pp. 119–129, 2000.
[21] A. Gangopadhyay, “A review of automotive engine friction re-duction opportunities through technologies related to tribology,”Transactions of the Indian Institute of Metals, pp. 1–9.
[22] S. H. Hill and B. A. Newman, “Piston ring designs for reducefriction,” SAE Technical Paper, 09 1984.
[23] E. Tomanik, “Piston ring conformability in a distorted bore,” SAE
Technical Paper, 02 1996.
[24] M.-T. Ma, E. Smith, and I. Shcrrington, “Analysis of lubricationand friction for a complete piston-ring pack with an improved oilavailability model part 2: Circumferentially variable film,” Pro-
ceedings of the Institution of Mechanical Engineers, Part J: Jour-
nal of Engineering Tribology, vol. 211, no. 1, pp. 17–27, 1997.
[25] R. Rahmani, S. Theodossiades, H. Rahnejat, and B. Fitzsimons,“Transient elastohydrodynamic lubrication of rough new or wornpiston compression ring conjunction with an out-of-round cylinderbore,” Proceedings of the Institution of Mechanical Engineers, Part
J: Journal of Engineering Tribology, vol. 226, no. 4, pp. 284–305,2012.
[26] L. Liu and T. Tian, “Modeling piston ring-pack lubrication withconsideration of ring structural response,” SAE Technical Papers
2005-01-1641, 2005.
[27] E. Tomanik, “Improved criterion for ring conformability under re-alistic bore deformation,” SAE Technical Paper, 04 2009.
214 References
[28] M. Ejakov, “Modeling of axial and circumferential ring pack lubri-cation,” in Proceedings of the 2001 Spring Technical Conference of
the ASME Internal Combustion Engine Division, vol. 37, pp. 77–88, 2001.
[29] V. Dunaevsky and S. Alexandrov, “Three-dimensional engineer-ing approach to conformability analysis of piston rings,” Tribology
Transactions, vol. 48, no. 1, pp. 108–118, 2005.
[30] Y. Hu, H. S. Cheng, T. Arai, Y. Kobayashi, and S. Aoyama, “Nu-merical simulation of piston ring in mixed lubrication - a non-axisymmetrical analysis,” Journal of Tribology, vol. 116, no. 3,pp. 470–478, 1994.
[31] H. Chen and T. Tian, “The influences of cylinder liner honingpatterns and oil control ring design parameters on the interactionbetween the twinland oil control ring and the cylinder liner ininternal combustion engines,” 06 2008.
[32] A. Spencer, A. Almqvist, and R. Larsson, “A semi-deterministictexture-roughness model of the piston ring–cylinder liner contact,”Proceedings of the Institution of Mechanical Engineers, Part J:
Journal of Engineering Tribology, vol. 225, no. 6, pp. 325–333,2011.
[33] I. Etsion, “State of the art in laser surface texturing,” Journal of
tribology, vol. 127, no. 1, pp. 248–253, 2005.
[34] L. Mourier, D. Mazuyer, A. Lubrecht, and C. Donnet, “Transientincrease of film thickness in micro-textured ehl contacts,” Tribology
International, vol. 39, no. 12, pp. 1745–1756, 2006.
[35] I. Etsion, Y. Kligerman, and G. Halperin, “Analytical and ex-perimental investigation of laser-textured mechanical seal faces,”Tribology Transactions, vol. 42, no. 3, pp. 511–516, 1999.
[36] V. Brizmer, Y. Kligerman, and I. Etsion, “A laser surface texturedparallel thrust bearing,” Tribology Transactions, vol. 46, no. 3,pp. 397–403, 2003.
[37] A. Shinkarenko, Y. Kligerman, and I. Etsion, “The effect of sur-face texturing in soft elasto-hydrodynamic lubrication,” Tribology
International, vol. 42, no. 2, pp. 284–292, 2009.
References 215
[38] D. Yan, N. Qu, H. Li, and X. Wang, “Significance of dimple param-eters on the friction of sliding surfaces investigated by orthogonalexperiments,” Tribology Transactions, vol. 53, no. 5, pp. 703–712,2010.
[39] H. Yu, X. Wang, and F. Zhou, “Geometric shape effects of sur-face texture on the generation of hydrodynamic pressure betweenconformal contacting surfaces,” Tribology Letters, vol. 37, no. 2,pp. 123–130, 2010.
[40] H. Yu, W. Huang, and X. Wang, “Dimple patterns design for dif-ferent circumstances,” Lubrication Science, vol. 25, no. 2, pp. 67–78, 2013.
[41] H. M. Checo, R. F. Ausas, M. Jai, J.-P. Cadalen, F. Choukroun,and G. C. Buscaglia, “Moving textures: Simulation of a ring slidingon a textured liner,” Tribology International, vol. 72, pp. 131–142,2014.
[42] N. Biboulet and A. Lubrecht, “Analytical solution for texturedpiston ring–cylinder liner contacts (1d analysis),” Tribology Inter-
national, vol. 96, pp. 269–278, 2016.
[43] D. Gropper, L. Wang, and T. J. Harvey, “Hydrodynamic lubri-cation of textured surfaces: A review of modeling techniques andkey findings,” Tribology International, vol. 94, pp. 509–529, 2016.
[44] X. Hua, J. Sun, P. Zhang, H. Ge, F. Yonghong, J. Jinghu, andB. Yin, “Research on discriminating partition laser surface micro-texturing technology of engine cylinder,” Tribology International,vol. 98, pp. 190–196, 2016.
[45] S. Howell-Smith, H. Rahnejat, P. D. King, and D. Dowson, “Re-ducing in-cylinder parasitic losses through surface modificationand coating,” Proceedings of the Institution of Mechanical Engi-
neers, Part D: Journal of Automobile Engineering, vol. 228, no. 4,pp. 391–402, 2014.
[46] A. Ronen, I. Etsion, and Y. Kligerman, “Friction-reducing surface-texturing in reciprocating automotive components,” Tribology
Transactions, vol. 44, no. 3, pp. 359–366, 2001.
216 References
[47] G. B. Gadeschi, K. Backhaus, and G. Knoll, “Numerical analy-sis of laser-textured piston-rings in the hydrodynamic lubricationregime,” Journal of Tribology, vol. 134, no. 4, p. 041702, 2012.
[48] I. Etsion and E. Sher, “Improving fuel efficiency with laser sur-face textured piston rings,” Tribology International, vol. 42, no. 4,pp. 542–547, 2009.
[49] F. F. M. TE77, “More from cameron-plint,” Industrial Lubrication
and Tribology, p. 131, 1982.
[50] L. Ting, “Development of a reciprocating test rig for tribologicalstudies of piston engine moving components-part i: rig design andpiston ring friction coefficients measuring method,” tech. rep., SAETechnical Paper, 1993.
[51] S. H. Hill, S. E. Hartfield-Wünsch, and S. C. Tung, “Bench weartesting of common gasoline engine cylinder bore surface/pistonring combinations,” Tribology transactions, vol. 39, no. 4, pp. 929–935, 1996.
[52] P. Dellis, “Effect of friction force between piston rings and liner: aparametric study of speed, load, temperature, piston-ring curva-ture, and high-temperature, high-shear viscosity,” Proceedings of
the Institution of Mechanical Engineers, Part J: Journal of Engi-
neering Tribology, vol. 224, no. 5, pp. 411–426, 2010.
[53] J. Dearlove and W. K. Cheng, “Simultaneous piston ring frictionand oil film thickness measurements in a reciprocating test rig,”tech. rep., SAE Technical Paper, 1995.
[54] O. Akalin and G. M. Newaz, “A new experimental technique forfriction simulation in automotive piston ring and cylinder liners,”tech. rep., SAE Technical Paper, 1998.
[55] N. Bolander, B. Steenwyk, F. Sadeghi, and G. Gerber, “Lubrica-tion regime transitions at the piston ring-cylinder liner interface,”Proceedings of the Institution of Mechanical Engineers, Part J:
Journal of Engineering Tribology, vol. 219, no. 1, pp. 19–31, 2005.
[56] A. Spencer, E. Y. Avan, A. Almqvist, R. S. Dwyer-Joyce, andR. Larsson, “An experimental and numerical investigation of fric-tional losses and film thickness for four cylinder liner variants
References 217
for a heavy duty diesel engine,” Proceedings of the Institution of
Mechanical Engineers, Part J: Journal of Engineering Tribology,vol. 227 no.12, pp. 1319–1333, 2013.
[57] S. Johansson, P. H. Nilsson, R. Ohlsson, and B.-G. Rosen, “Exper-imental friction evaluation of cylinder liner/piston ring contact,”Wear, vol. 271, no. 34, pp. 625 – 633, 2011. The 12th InternationalConference on Metrology and Properties of Engineering Surfaces.
[58] S. Furuhama and S. Sasaki, “New device for the measurement ofpiston frictional forces in small engines,” tech. rep., SAE technicalpaper, 1983.
[59] T. Kikuchi, S. Ito, and Y. Nakayama, “Piston friction analysisusing a direct-injection single-cylinder gasoline engine,” JSAE re-
view, vol. 24, no. 1, pp. 53–58, 2003.
[60] K.-i. Kohashi, Y. Kimura, M. Murakami, and Y. Drouvin, “Anal-ysis of piston friction in internal combustion engine,” tech. rep.,SAE Technical Paper, 2013.
[61] S. Kunkel, M. Werner, and G. Wachtmeister, “Setting up a mea-suring device to determine the friction of the piston assembly,”SAE International Journal of Materials and Manufacturing, vol. 4,no. 2011-01-0227, pp. 340–351, 2011.
[62] M. Gore, M. Theaker, S. Howell-Smith, H. Rahnejat, andP. D. King, “Direct measurement of piston friction of internal-combustion engines using the floating-liner principle,” Proceedings
of the Institution of Mechanical Engineers, Part D: Journal of Au-
tomobile Engineering, vol. 228, no. 3, pp. 344–354, 2014.
[63] T. Law, D. MacMillan, P. J. Shayler, G. Kirk, I. Pegg, andR. Stark, “A new floating-liner test rig design to investigate factorsinfluencing piston-liner friction,” tech. rep., SAE Technical Paper,2012.
[64] H. Chen, K. Liao, and T. Tian, “A numerical and experimentalstudy of twin-land oil control ring friction in internal combustionengines part 2,” SAE Technical Paper, 04 2012.
[65] O. Sato, M. Takiguchi, A. Takayuki, Y. Seki, K. Fujimura, andY. Tateishi, “Improvement of piston lubrication in a diesel engine
218 References
by means of cylinder surface roughness,” tech. rep., SAE technicalpaper, 2004.
[66] K. Liao, Y. Liu, D. Kim, P. Urzua, and T. Tian, “Practical chal-lenges in determining piston ring friction,” Proceedings of the In-
stitution of Mechanical Engineers, Part J: Journal of Engineering
Tribology, vol. 227, no. 2, pp. 112–125, 2013.
[67] S. Kunkel, T. Zimmer, and G. Wachtmeister, “Friction analysis ofoil control rings during running-in,” SAE International Journal of
Engines, vol. 5, no. 2011-01-2428, pp. 747–758, 2012.
[68] T. Deuss, H. Ehnis, R. Freier, and R. Künzel, “Friction powermeasurements of a fired diesel engine piston group potentials,”MTZ worldwide, vol. 71, no. 5, pp. 20–24, 2010.
[69] H. Allmaier, C. Knauder, S. Salhofer, F. Reich, E. Schalk,H. Ofner, and A. Wagner, “An experimental study of the loadand heat influence from combustion on engine friction,” Interna-
tional Journal of Engine Research, vol. 17, no. 3, pp. 347–353,2016.
[70] A. Almqvist, “Homogenization of the reynolds equation governinghydrodynamic flow in a rotating device,” Journal of Tribology,vol. 133, p. p. 021705, 2011.
[71] A. Almqvist, C. Campañá, N. Prodanov, and B. Persson, “In-terfacial separation between elastic solids with randomly roughsurfaces: Comparison between theory and numerical techniques,”Journal of the Mechanics and Physics of Solids, vol. 59, no. 11,pp. 2355–2369, 2011.
[72] A. Almqvist and J. Dasht, “The homogenization process of thereynolds equation describing compressible liquid flow,” Tribology
International, vol. 39, no. 9, pp. 994–1002, 2006.
[73] A. Almqvist, E. K. Essel, J. Fabricius, and P. Wall, “Reiteratedhomogenization applied in hydrodynamic lubrication,” Proceed-
ings of the Institution of Mechanical Engineers, Part J: Journal
of Engineering Tribology, vol. 222, no. 7, pp. 827–841, 2008.
References 219
[74] A. Almqvist, E. K. Essel, J. Fabricius, and P. Wall, “Variationalbounds applied to unstationary hydrodynamic lubrication,” Inter-
national Journal of Engineering Science, vol. 46, no. 9, pp. 891–906, 2008.
[75] A. Almqvist, E. K. Essel, J. Fabricius, and P. Wall, “Multiscale ho-mogenization of a class of nonlinear equations with applications inlubrication theory and applications,” Journal of Function Spaces,vol. 9, no. 1, pp. 17–40, 2011.
[76] A. Almqvist, E. K. Essel, L.-E. Persson, and P. Wall, “Homog-enization of the unstationary incompressible reynolds equation,”Tribology International, vol. 40, no. 9, pp. 1344–1350, 2007.
[77] A. Almqvist, J. Fabricius, R. Larsson, and P. Wall, “A new ap-proach for studying cavitation in lubrication,” Journal of Tribol-
ogy, vol. 136, no. 1, p. 011706, 2014.
[78] A. Almqvist, J. Fabricius, A. Spencer, and P. Wall, “Similaritiesand differences between the flow factor method by patir and chengand homogenization,” Journal of Tribology, vol. 133, no. 3, p. p.031702, 2011.
[79] A. Almqvist, R. Larsson, and P. Wall, “The homogenization pro-cess of the time dependent reynolds equation describing compress-ible liquid flow,” Tribologia: Finnish Journal of Tribology, vol. 26,no. 4, pp. 30–44, 2007.
[80] A. Almqvist, D. Lukkassen, A. Meidell, and P. Wall, “New con-cepts of homogenization applied in rough surface hydrodynamiclubrication,” International Journal of Engineering Science, vol. 45,no. 1, pp. 139–154, 2007.
[81] A. Almqvist, F. Sahlin, R. Larsson, and S. Glavatskih, “On thedry elasto-plastic contact of nominally flat surfaces,” Tribology in-
ternational, vol. 40, no. 4, pp. 574–579, 2007.
[82] J. Andersson, A. Almqvist, and R. Larsson, “Numerical simulationof a wear experiment,” Wear, vol. 271, no. 11, pp. 2947–2952, 2011.
[83] J. Furustig, A. Almqvist, C. Bates, P. Ennemark, and R. Lars-son, “A two scale mixed lubrication wearing-in model, applied to
220 References
hydraulic motors,” Tribology International, vol. 90, pp. 248–256,2015.
[84] P. Isaksson, D. Nilsson, R. Larsson, and A. Almqvist, “The influ-ence of surface roughness on friction in a flexible hybrid bearing,”Proceedings of the Institution of Mechanical Engineers, Part J:
Journal of Engineering Tribology, vol. 225, no. 10, pp. 975–985,2011.
[85] S. Kang, A. Almqvist, P. Jonsén, and R. Larsson, “Modelling andsimulation of colliding asperities,” International Journal of Solids
and Structures, 2016.
[86] F. Perez-Rafols, R. Larsson, S. Lundstrom, P. Wall, andA. Almqvist, “A stochastic two-scale model for pressure-drivenflow between rough surfaces,” in Proc. R. Soc. A, vol. 472,p. 20160069, The Royal Society, 2016.
[87] F. Sahlin, A. Almqvist, R. Larsson, and S. Glavatskih, “A cavita-tion algorithm for arbitrary lubricant compressibility,” Tribology
International, vol. 40, no. 8, pp. 1294–1300, 2007.
[88] F. Sahlin, A. Almqvist, R. Larsson, and S. Glavatskih, “Rough sur-face flow factors in full film lubrication based on a homogenizationtechnique,” Tribology International, vol. 40, no. 7, pp. 1025–1034,2007.
[89] F. Sahlin, R. Larsson, A. Almqvist, P. Lugt, and P. Marklund, “Amixed lubrication model incorporating measured surface topogra-phy. part 1: Theory of flow factors,” Proceedings of the Institution
of Mechanical Engineers, Part J: Journal of Engineering Tribol-
ogy, vol. 224, no. 4, pp. 335–351, 2010.
[90] F. Sahlin, R. Larsson, P. Marklund, A. Almqvist, and P. Lugt, “Amixed lubrication model incorporating measured surface topogra-phy. part 2: roughness treatment, model validation, and simula-tion,” Proceedings of the Institution of Mechanical Engineers, Part
J: Journal of Engineering Tribology, vol. 224, no. 4, pp. 353–365,2010.
[91] M. Shirzadegan, A. Almqvist, and R. Larsson, “Fully coupled ehlmodel for simulation of finite length line cam-roller follower con-tacts,” Tribology International, vol. 103, pp. 584–598, 2016.
References 221
[92] A. Almqvist, On the effects of surface roughness in lubrication.PhD thesis, Luleå University of Technology, 2006.
[93] A. Spencer, A simulation tool for optimising combustion engine
cylinder liner surface texture. PhD thesis, Luleå University ofTechnology, 2013.
[94] M. Priest, D. Dowson, and C. Taylor, “Theoretical modelling ofcavitation in piston ring lubrication,” Proceedings of the Institu-
tion of Mechanical Engineers, Part C: Journal of Mechanical En-
gineering Science, vol. 214, no. 3, pp. 435–446, 2000.
[95] B. Jakobsson and L. Floberg, The finite journal bearing, con-
sidering vaporization. Chalmers Tekniska Högskolas Handlingar,Chalmers University of Technology, 1957.
[96] K. Olsson, Cavitation in Dynamically Loaded Bearings. Avd.maskinteknik, Chalmers University of Technology, Technical re-port 308, 1965.
[97] H. Elrod, “A cavitation algorithm,” Journal of Tribology, vol. 103,no. 3, pp. 350–354, 1981.
[98] D. Vijayaraghavan and T. Keith Jr, “Development and evaluationof a cavitation algorithm,” Tribology Transactions, vol. 32, no. 2,pp. 225–233, 1989.
[99] M. Giacopini, M. T. Fowell, D. Dini, and A. Strozzi, “A mass-conserving complementarity formulation to study lubricant filmsin the presence of cavitation,” Journal of Tribology, vol. 132, no. 4,p. 041702, 2010.
[100] A. Kumar and J. Booker, “Finite element cavitation algorithm,”Journal of Tribology, vol. 113, no. 2, pp. 276–286, 1991.
[101] T. Almqvist, A. Almqvist, and R. Larsson, “A comparison betweencomputational fluid dynamic and reynolds approaches for sim-ulating transient EHL line contacts,” Tribology International,vol. 37, no. 1, pp. 61 – 69, 2004.
[102] P. Isaksson, D. Nilsson, and R. Larsson, “Elasto-hydrodynamicsimulation of complex geometries in hydraulic motors,” Tribology
International, vol. 42, no. 10, pp. 1418 – 1423, 2009.
222 References
[103] D. Häggström, “Robust pre-synchronization in heavy truck trans-missions,” in International Gear Conference 2014 Conference Pro-
ceedings, pp. 914–923, Woodhead Publishing, August 2014.
[104] N.N., Excite Powerunit Theory Manual V2013.2, 2013.
[105] N.N., AVL Glide User’s Manual, 2000.
[106] X. Ye, G. Chen, M. Luo, and Y. Jiang, “Three-dimensional anal-ysis of tribological performance and heat transfer in piston andcylinder liner system,” in Proceedings of the 2003 Fall Technical
Conference of the ASME Internal Combustion Engine Division,vol. 40, pp. 351–361, 2003.
[107] T. Tian, “Dynamic behaviours of piston rings and their practicalimpact. part 1: Ring flutter and ring collapse and their effectson gas flow and oil transport,” Proceedings of the Institution of
Mechanical Engineers, Part J: Journal of Engineering Tribology,vol. 216, no. 4, pp. 209–228, 2002.
[108] M. Ma, I. Sherrington, and E. Smith, “Analysis of lubrication andfriction for a complete piston-ring pack with an improved oil avail-ability model: Part 1: Circumferentially uniform film,” Proceed-
ings of the Institution of Mechanical Engineers, Part J: Journal
of Engineering Tribology, vol. 211, no. 1, pp. 1–15, 1997.
[109] T. Tian, V. W. Wong, and J. B. Heywood, “Modeling the dy-namics and lubrication of three piece oil control rings in internalcombustion engines,” SAE Technical Paper, 10 1998.
[110] N.N., Comsol Multiphysics 4.4 Reference Manual, 2013.
[111] P. Obert, T. Müller, H.-J. Füßer, and D. Bartel, “The influenceof oil supply and cylinder liner temperature on friction, wear andscuffing behavior of piston ring cylinder liner contacts–a new modeltest,” Tribology International, vol. 94, pp. 306–314, 2016.
[112] P. Olander and S. Jacobson, “Scuffing resistance testing of pistonring materials for marine two-stroke diesel engines and mappingof the operating mechanisms,” Wear, vol. 330, pp. 42–48, 2015.
[113] C. Kirner, J. Halbhuber, B. Uhlig, A. Oliva, S. Graf, andG. Wachtmeister, “Experimental and simulative research advances
References 223
in the piston assembly of an internal combustion engine,” Tribology
International, vol. 99, pp. 159–168, 2016.
[114] T. Larsson, K. ac Bergstrom, T. Hinderman, L.-G. Hauptmann,L. Wennstrom, I. Denbratt, and N. Higgins, “The volvo 3-litre 6-cylinder engine with 4-valve technology,” tech. rep., SAE TechnicalPaper, 1990.
[115] M. Söderfjäll, A. Almqvist, and R. Larsson, “A model for twinland oil control rings,” Tribology International, vol. 95, pp. 475–482, 2016.
[116] M. Söderfjäll, A. Almqvist, and R. Larsson, “Component test forsimulation of piston ring–cylinder liner friction at realistic speeds,”Tribology International, vol. 104, pp. 57–63, 2016.
[117] COMSOL Multiphysics Reference Manual, November 2013.
[118] E. D. Rejowski, P. Mordente Sr, M. F. Pillis, and T. Casserly, “Ap-plication of dlc coating in cylinder liners for friction reduction,”tech. rep., SAE Technical Paper, 2012.
[119] O. Akalin and G. Newaz, “Piston ring-cylinder bore friction model-ing in mixed lubrication regime: part i—analytical results,” Jour-
nal of Tribology, vol. 123, no. 1, pp. 211–218, 1999.
[120] O. Akalin and G. Newaz, “Piston ring-cylinder bore friction mod-eling in mixed lubrication regime: Part ii—correlation with benchtest data,” Journal of Tribology, vol. 123, no. 1, pp. 219–223, 1999.
[121] M. Gore, R. Rahmani, H. Rahnejat, and P. King, “Assess-ment of friction from compression ring conjunction of a high-performance internal combustion engine: A combined numericaland experimental study,” Proceedings of the Institution of Me-
chanical Engineers, Part C: Journal of Mechanical Engineering
Science, vol. 230, no. 12, pp. 2073–2085, 2016.


![IMPROVING THERMAL EFFICIENCY OF DIESEL ENGINE BY USING ... · work [3].The energy lost can be recovered by ceramic coating (Crown of the piston, side of the cylinder liner, cylinder](https://img.pdfslide.us/doc/110x75/5f6529b9a39b2c4f4c385d71/improving-thermal-efficiency-of-diesel-engine-by-using-work-3the-energy-lost.jpg)