Embed Size (px)
Citation preview

ARL-TR-8491 ● SEP 2018
US Army Research Laboratory
Friction Characterization of Ultra-High-Molecular-Weight Polyethylene (UHMWPE) Composite Materials under Ambient Conditions by Steven E Boyd
Approved for public release; distribution is unlimited.

NOTICES
Disclaimers
The findings in this report are not to be construed as an official Department of the Army position unless so designated by other authorized documents.
Citation of manufacturer’s or trade names does not constitute an official endorsement or approval of the use thereof.
Destroy this report when it is no longer needed. Do not return it to the originator.
ARL-TR-8491 ● SEP 2018
US Army Research Laboratory
Friction Characterization of Ultra-High-Molecular-Weight Polyethylene (UHMWPE) Composite Materials under Ambient Conditions by Steven E Boyd Weapons and Materials Research Directorate, ARL
Approved for public release; distribution is unlimited.
ii
REPORT DOCUMENTATION PAGE Form Approved OMB No. 0704-0188
Public reporting burden for this collection of information is estimated to average 1 hour per response, including the time for reviewing instructions, searching existing data sources, gathering and maintaining the data needed, and completing and reviewing the collection information. Send comments regarding this burden estimate or any other aspect of this collection of information, including suggestions for reducing the burden, to Department of Defense, Washington Headquarters Services, Directorate for Information Operations and Reports (0704-0188), 1215 Jefferson Davis Highway, Suite 1204, Arlington, VA 22202-4302. Respondents should be aware that notwithstanding any other provision of law, no person shall be subject to any penalty for failing to comply with a collection of information if it does not display a currently valid OMB control number. PLEASE DO NOT RETURN YOUR FORM TO THE ABOVE ADDRESS.
1. REPORT DATE (DD-MM-YYYY)
September 2018 2. REPORT TYPE
Technical Report 3. DATES COVERED (From - To)
1 October 2017–1 August 2018 4. TITLE AND SUBTITLE
Friction Characterization of Ultra-High-Molecular-Weight Polyethylene (UHMWPE) Composite Materials under Ambient Conditions
5a. CONTRACT NUMBER
5b. GRANT NUMBER
5c. PROGRAM ELEMENT NUMBER
6. AUTHOR(S)
Steven E Boyd 5d. PROJECT NUMBER
5e. TASK NUMBER
5f. WORK UNIT NUMBER
7. PERFORMING ORGANIZATION NAME(S) AND ADDRESS(ES)
US Army Research Laboratory ATTN: RDRL-WMM-A Aberdeen Proving Ground, MD 21005-5066
8. PERFORMING ORGANIZATION REPORT NUMBER
ARL-TR-8491
9. SPONSORING/MONITORING AGENCY NAME(S) AND ADDRESS(ES)
10. SPONSOR/MONITOR'S ACRONYM(S)
11. SPONSOR/MONITOR'S REPORT NUMBER(S)
12. DISTRIBUTION/AVAILABILITY STATEMENT
Approved for public release; distribution is unlimited.
13. SUPPLEMENTARY NOTES
14. ABSTRACT
The friction properties for ultra-high-molecular-weight polyethylene (UHMWPE) composite materials are determined under ambient laboratory conditions. Two UHMWPE materials are selected, including solid-state extruded film DuPont Tensylon 30A and fiber system Dyneema HB 210, and one tooling material, Stretchlon 800 vacuum bagging film. The fabric–fabric interply friction and fabric–tooling friction is evaluated over a range of contact pressures, material orientations, and sliding velocities and then summarized. Static and dynamic coefficient of friction values were largely independent of both pressure and sliding velocity over the values tested. However, the friction response did depend on the material orientation angles of the reinforcement and the presence of a coating or matrix.
15. SUBJECT TERMS
ambient temperature testing, ultra-high-molecular-weight polyethylene, UHMWPE, composite materials, friction characterization, thermoforming
16. SECURITY CLASSIFICATION OF: 17. LIMITATION OF ABSTRACT
UU
18. NUMBER OF PAGES
49
19a. NAME OF RESPONSIBLE PERSON
Steven E Boyd a. REPORT
Unclassified b. ABSTRACT
Unclassified
c. THIS PAGE
Unclassified
19b. TELEPHONE NUMBER (Include area code)
410-306-1927 Standard Form 298 (Rev. 8/98)
Prescribed by ANSI Std. Z39.18
Approved for public release; distribution is unlimited. iii
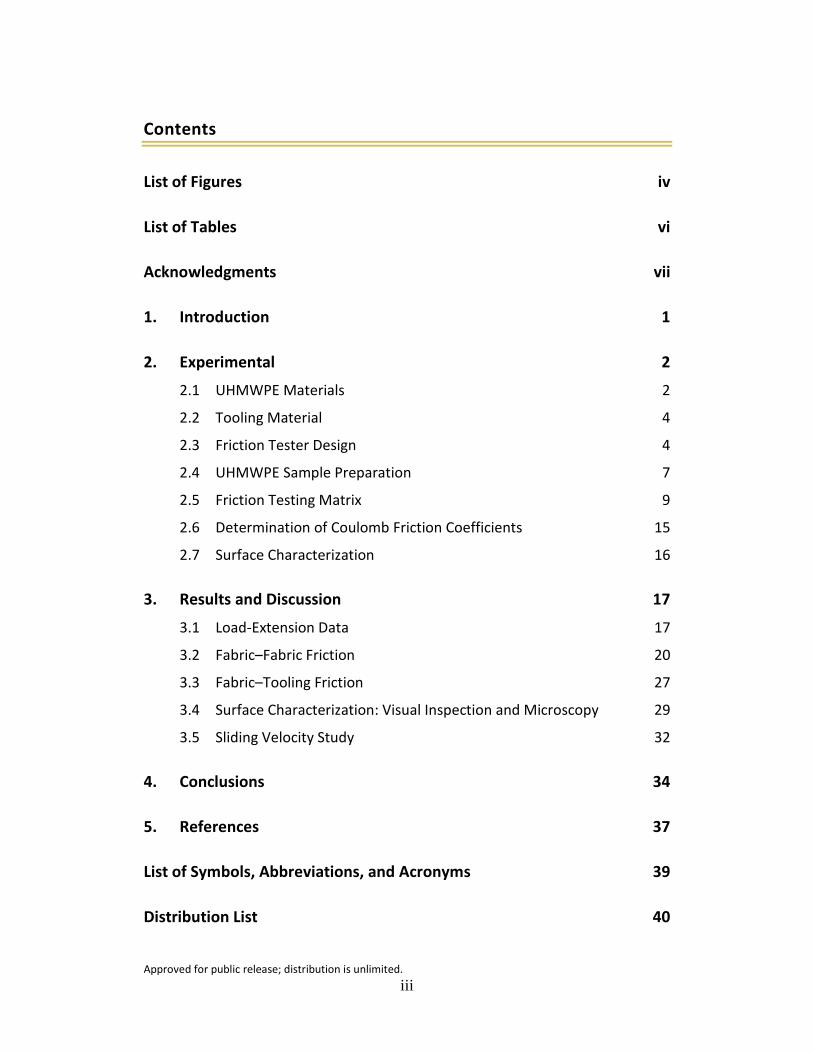
Contents
List of Figures iv
List of Tables vi
Acknowledgments vii
1. Introduction 1
2. Experimental 2
2.1 UHMWPE Materials 2
2.2 Tooling Material 4
2.3 Friction Tester Design 4
2.4 UHMWPE Sample Preparation 7
2.5 Friction Testing Matrix 9
2.6 Determination of Coulomb Friction Coefficients 15
2.7 Surface Characterization 16
3. Results and Discussion 17
3.1 Load-Extension Data 17
3.2 Fabric–Fabric Friction 20
3.3 Fabric–Tooling Friction 27
3.4 Surface Characterization: Visual Inspection and Microscopy 29
3.5 Sliding Velocity Study 32
4. Conclusions 34
5. References 37
List of Symbols, Abbreviations, and Acronyms 39
Distribution List 40
Approved for public release; distribution is unlimited. iv
List of Figures
Fig. 1 Detailed lay-up of sublayers and orientations composing UHMWPE composite materials. Note correct placement of stamp lettering. ......... 3
Fig. 2 Front (top) and back (bottom) surfaces of both UHMWPE composite materials ................................................................................................ 3
Fig. 3 Schematic of the simple gravity-assisted friction tester used in this study, with labeled isometric view and cross-section. The inset photo is of the carriage assembly. ................................................................... 6
Fig. 4 Experimental setup illustrating fabric–fabric (left) and fabric–tooling (right) friction testing within an Instron environmental chamber ......... 7
Fig. 5 Top (“long”) and bottom (“short”) strip nomenclature and placement within the friction tester. Note how the short or bottom strip is firmly installed on the carriage holder for testing. ........................................... 8
Fig. 6 Illustration of sample strip cuts with respect to lengthwise and crosswise roll axes defining the material orientations used .................. 9
Fig. 7 Material orientation cases for UHMWPE fiber system Dyneema HB 210. Each case is identified by an encircled number. ......................... 11
Fig. 8 Material orientation cases for UHMWPE SSE-film system Tensylon 30A. Each case is identified by an encircled number. ........................ 12
Fig. 9 Ideal representation of the friction response of two solid surfaces showing the static peak, transition, and steady-state region. The regions are defined as well as the calculations for the Coulomb friction coefficients. ......................................................................................... 16
Fig. 10 Unique and representative load-extension plots for corresponding material orientation cases. Tensylon 30A is represented by (a) and (b) and Dyneema HB 210 by (c) and (d). The material orientation case is stated within the plot. .......................................................................... 19
Fig. 11 A simplified representation of a UHMWPE surface sublayer detailing the orientations of the unidirectional reinforcement. U is the sliding velocity, f is the frictional force, and θ is the top surface sublayer orientation (the base is held at 0° aligning with the direction of the sliding motion). ................................................................................... 20
Fig. 12 Static and dynamic coefficients of friction vs. normal contact pressure for Tensylon 30A ................................................................................ 21
Fig. 13 Static and dynamic coefficients of friction vs. normal contact pressure for Dyneema HB 210 .......................................................................... 21

Approved for public release; distribution is unlimited. v
Fig. 14 Static and dynamic coefficients of friction categorized with respect to material orientations of the carriage strip versus platform strip at a contact pressure of 18.2 kPa. The columns of the horizontal axis represent the UHMWPE composite materials and the rows the material orientation of the platform strip. Each inner bar chart gives the coefficient of friction for the carriage strip orientation versus a single platform orientation. ........................................................................... 22
Fig. 15 Static and dynamic coefficients of friction categorized with respect to material orientations of the carriage strip versus platform strip at a contact pressure of 25.4 kPa. The columns of the horizontal axis represent the UHMWPE composite materials and the rows the material orientation of the platform strip. Each inner bar chart gives the coefficient of friction for the carriage strip orientation versus a single platform orientation. ........................................................................... 23
Fig. 16 Changes to the surface of a fiber system under increasing normal contact pressure ................................................................................... 26
Fig. 17 Static and dynamic coefficients of friction vs. normal contact pressure for Tensylon 30A on Stretchlon 800 bagging film ............................. 27
Fig. 18 Static and dynamic coefficients of friction vs. normal contact pressure for Dyneema HB 210 on Stretchlon 800 bagging film ....................... 29
Fig. 19 Microscopy of virgin, untested strips of UHMWPE composite materials used in this friction study. The top row is the top surface or stamp side of each material, and the bottom row is the bottom surface. The columns are represented by the two UHMWPE composite materials. The dimensional scale is provided in each of the four inset images. ................................................................................................ 30
Fig. 20 Images of representative damage incurred in off-axis sample strips of Tensylon 30A (left) and Dyneema HB 210 (right) due to sliding friction ................................................................................................. 31
Fig. 21 Microscopy of damaged sample strips of Tensylon 30A (left) and Dyneema HB 210 (right) .................................................................... 32
Fig. 22 Effect of sliding velocity on the friction coefficients of Tensylon 30A............................................................................................................. 33
Fig. 23 Effect of sliding velocity on the friction coefficients of Dyneema HB 210 ................................................................................................ 34
Fig. 24 Brief summary of main conclusions and observations from this friction characterization of selected UHMWPE composite materials ............. 35

Approved for public release; distribution is unlimited. vi
List of Tables
Table 1 UHMWPE composite materials used in this friction characterization study ...................................................................................................... 3
Table 2 Material strip geometries and orientations for the UHMWPE materials ................................................................................................ 8
Table 3 Succinct summary of material orientation cases encountered in the fabric–fabric and fabric–tooling friction testing of UHMWPE composite materials. The Tensylon 30A has a slightly different representation due to the unique reversed [90°/0°] lay-up. ................ 13
Table 4 Normal contact pressures applied to the material orientation cases during sliding friction testing .............................................................. 14
Table 5 Sliding velocities tested on UHMWPE composite materials. All sliding velocity tests were conducted at P = 18.2 kPa on a common 0°-bottom on 90°-top material orientation case .................................. 15
Approved for public release; distribution is unlimited. vii
Acknowledgments
I would like to thank Mr Jim Wolbert, Mr Mike Neblett, and Mr Mike Thompson for their input and experience regarding processing for the ultra-high-molecular-weight polyethylene (UHMWPE) composite materials covered in the study and for sample preparation. I would like to thank Dr Jason Cain for his expertise in processing and characterization of these UHMWPE composite materials, especially details regarding their material constituents. I also thank Mr Rob Miller for the precise machining work required to make the simple gravity-assisted friction tester used in this study. Finally, I would like to thank Mr David Gray for his assistance with the Instron frame and environmental chamber.

Approved for public release; distribution is unlimited. 1
1. Introduction
Currently, the US Army is investigating ultra-high-molecular-weight polyethylene (UHMWPE) composite materials for personnel protection. These lightweight composite materials have demonstrated ballistic protection due to their high tenacity and are typically processed through industry-established thermoforming and thermostamping techniques. The process of thermoforming these material composites into complex parts is a subject of ongoing research, given that the resultant material properties are very dependent on temperature and pressure histories during processing.
These materials are usually available from the manufacturer (Koninklijke DSM NV, DuPont, Teijin, or Honeywell) as thin sheets that must be stacked and then consolidated under time, temperature, and pressure to form a part. In addition to the time–temperature–pressure profile during processing, special attention must be paid to the individual ply orientations in the stacking sequence and the insertion of filler plies and/or cut-outs, known as darts, to reduce wrinkle formation and preserve uniform thickness in complex part geometries. Trial and error processing of stacks of these sheets has demonstrated that a prior step to final consolidation known as preforming at temperature and pressure is useful in mitigating wrinkle formation and maintaining uniform thickness for the final consolidated part.
During the preforming step for processing complex shape UHMWPE composite parts, the individual plies shift about under the action of the plunger or punch within the parts mold. This shifting is resisted by in-plane interply shear forces and may manifest as ply shearing, possible anisotropic material deformation and damage, and ply wrinkling. The static and dynamic friction properties of the UHMWPE composite materials are postulated to determine the extent of these deformation mechanisms and must be characterized under similar temperature, pressure, and sliding velocity profiles. Once characterized, the frictional properties can be used to validate a thermoforming process model that will predict the extent of ply shearing, orientation shifting, and wrinkling in the precursor part before final consolidation. This technical research focuses on the characterization of friction properties of Army-relevant UHMWPE composite materials.
Much work has been performed to assess the fabric–fabric interply friction and fabric–tooling friction1–7 of fabrics meant for thermoforming (or thermostamping), most notably by researchers at the University of Massachusetts at Lowell (UML). Sophisticated friction testers have been developed to ensure a uniform normal contact pressure and measurement at high pressures, temperatures, and sliding velocities (see benchmark friction exercise8,9). Of particular importance is the
Approved for public release; distribution is unlimited. 2
design of a friction tester that allows accurate determination of the peak static load (static coefficient of friction) and measurement of a demonstrable steady-state dynamic response (dynamic coefficient of friction).
This report presents a friction characterization of Army-relevant UHMWPE composite materials under ambient conditions and at lower pressures and sliding velocities. The UHMWPE materials tested consist of solid-state extruded unidirectional film DuPont Tensylon HSBD 30A and unidirectional fiber system Dyneema HB 210. A simple friction tester based on examples provided in ASTM standard D1894-1410 was used to determine the friction properties with respect to material orientation of the ply, contact pressure, and sliding velocity. The friction properties are determined for fabric–fabric interply and fabric–tooling (bagging film) friction for each material.
2. Experimental
2.1 UHMWPE Materials
Two UHMWPE composite materials were investigated in this research and are detailed in Table 1. Tensylon HSBD 30A is a commercially available solid-state extruded (SSE)-film system manufactured by DuPont.11 It consists of two unidirectional SSE-films in a crossply lay-up ([90°/0°]), as illustrated in Fig. 1, and is coated on one side with a thermoplastic material. The coated side is coincident with the material roll stamp (reads “DuPont Tensylon HSBD 30A …”) and is easily distinguished from the uncoated side (see Fig. 2; left). Dyneema HB 210 is a fiber-matrix system composed of unidirectional sheets of UHMWPE fibers with a polyurethane resin (PUR). It is manufactured by and commercially available from DSM.12 Four unidirectional sheets of UHMWPE fibers form a four-layer crossply lay-up ([0°/90°/0°/90°]), as illustrated in Fig. 1. The final product has a resin-poor upper surface and a resin-rich bottom surface. The resin-poor top surface coincides with the material roll stamp (reads “Dyneema HB 210 …”), as shown in Fig. 2 (right).

Approved for public release; distribution is unlimited. 3
Table 1 UHMWPE composite materials used in this friction characterization study
Material Reinforcement Matrix Manufacturer
Tensylon HSBD 30A SSE – UHMWPE film Thermoplastic
coating DuPont
Dyneema HB 210 UHMWPE fiber PUR DSM
Fig. 1 Detailed lay-up of sublayers and orientations composing UHMWPE composite materials. Note correct placement of stamp lettering.
Fig. 2 Front (top) and back (bottom) surfaces of both UHMWPE composite materials
Approved for public release; distribution is unlimited. 4
2.2 Tooling Material
Interactions with the US Army Natick Soldier Research, Development and Engineering Center (NSRDEC) and our academic and industry partners, and UHMWPE composite material manufacturer recommendations, suggested that a number of tooling materials may be used during preforming and final consolidation of complex geometry UHMWPE parts. These include tooling steel, elastomer press pads, and high-elongation polymer bagging film. For this friction study, we selected a single tooling material most relevant to our unique thermoforming application: a high-elongation bagging film. The friction properties of UHMWPE materials on Stretchlon Vacuum 800 bagging film (Airtech International13) were determined. Stretchlon 800 is a nylon high-elongation bagging film (thickness ~50 µm, or 0.002 inch) commonly used in the lay-up and processing of composite materials especially in vacuum-assisted processing techniques.
2.3 Friction Tester Design
A good friction tester must accurately measure the pull-along load of one surface sliding with respect to another under a controlled velocity and constant normal contact pressure. There are many different designs that will accomplish this and some are listed in ASTM D1894-1410 (see Fig. 1). More-sophisticated friction testers built to exacting specifications for higher-temperature testing, high sliding velocity capability, and measurement of uniform, constant contact pressure have been designed by academic researchers1–9 for use with woven glass fabrics.
For this research, a simple friction tester design was selected so data collection and analysis could commence quickly for each of the UHMWPE composite materials. The friction tester is constructed entirely of metal, giving it the ability to test at temperature. An Instron environmental chamber was used to conduct elevated temperature testing, requiring the friction tester to be small enough to fit within (no longer than 38 cm, the depth of the chamber). Therefore, the friction tester has an extension of 22.9 cm or 9 inches, which is sufficient to measure the dynamic steady-state response. The friction tester is gravity-assisted in that normal contact pressure is applied by incrementally stacking slotted weights.
The final design of the simple gravity-assisted friction tester used in this study is presented in Fig. 3. The friction tester consists of a platform for the top strip, a carriage that holds the bottom strip and slotted weights to apply the normal contact force, and a pulley to redirect a steel cord (not pictured) connected to the carriage and the loading frame. Six leveling screws supported the platform for placement on the loading frame and within an environmental chamber. The experimental setup used a 1000-N Instron load cell mounted to a screw-operated Instron 4505 loading
Approved for public release; distribution is unlimited. 5
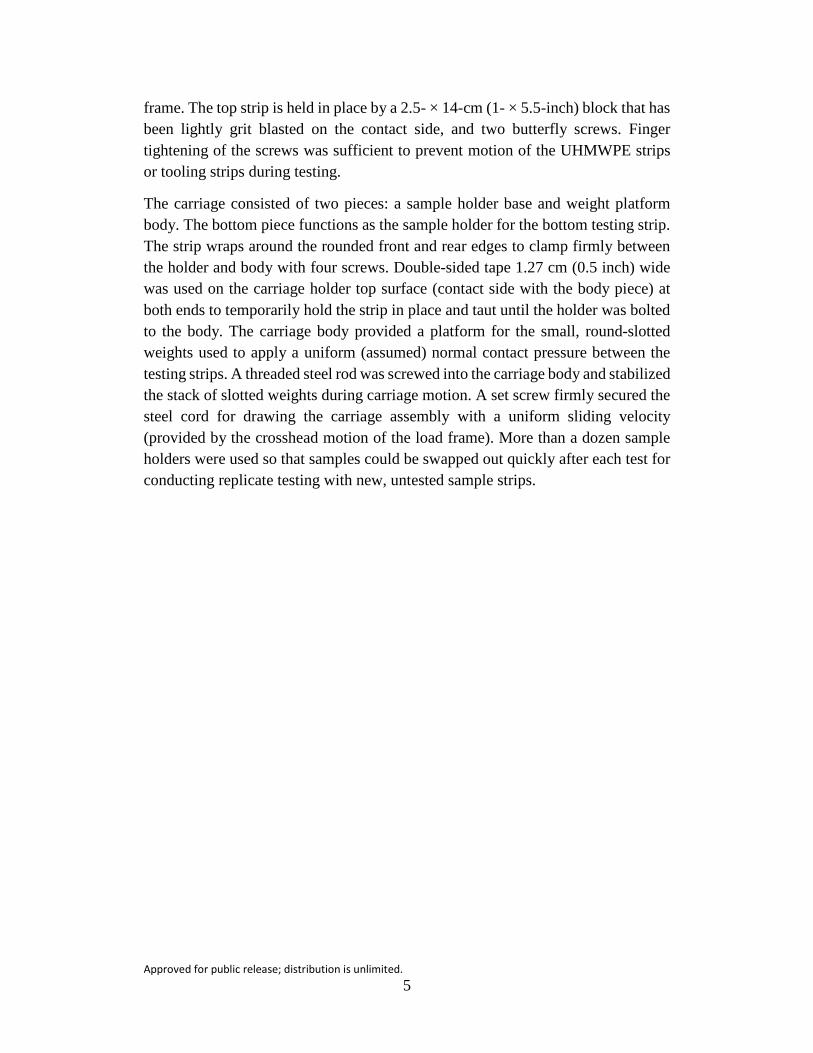
frame. The top strip is held in place by a 2.5- × 14-cm (1- × 5.5-inch) block that has been lightly grit blasted on the contact side, and two butterfly screws. Finger tightening of the screws was sufficient to prevent motion of the UHMWPE strips or tooling strips during testing.
The carriage consisted of two pieces: a sample holder base and weight platform body. The bottom piece functions as the sample holder for the bottom testing strip. The strip wraps around the rounded front and rear edges to clamp firmly between the holder and body with four screws. Double-sided tape 1.27 cm (0.5 inch) wide was used on the carriage holder top surface (contact side with the body piece) at both ends to temporarily hold the strip in place and taut until the holder was bolted to the body. The carriage body provided a platform for the small, round-slotted weights used to apply a uniform (assumed) normal contact pressure between the testing strips. A threaded steel rod was screwed into the carriage body and stabilized the stack of slotted weights during carriage motion. A set screw firmly secured the steel cord for drawing the carriage assembly with a uniform sliding velocity (provided by the crosshead motion of the load frame). More than a dozen sample holders were used so that samples could be swapped out quickly after each test for conducting replicate testing with new, untested sample strips.
Approved for public release; distribution is unlimited. 6
Fig. 3 Schematic of the simple gravity-assisted friction tester used in this study, with labeled isometric view and cross-section. The inset photo is of the carriage assembly.
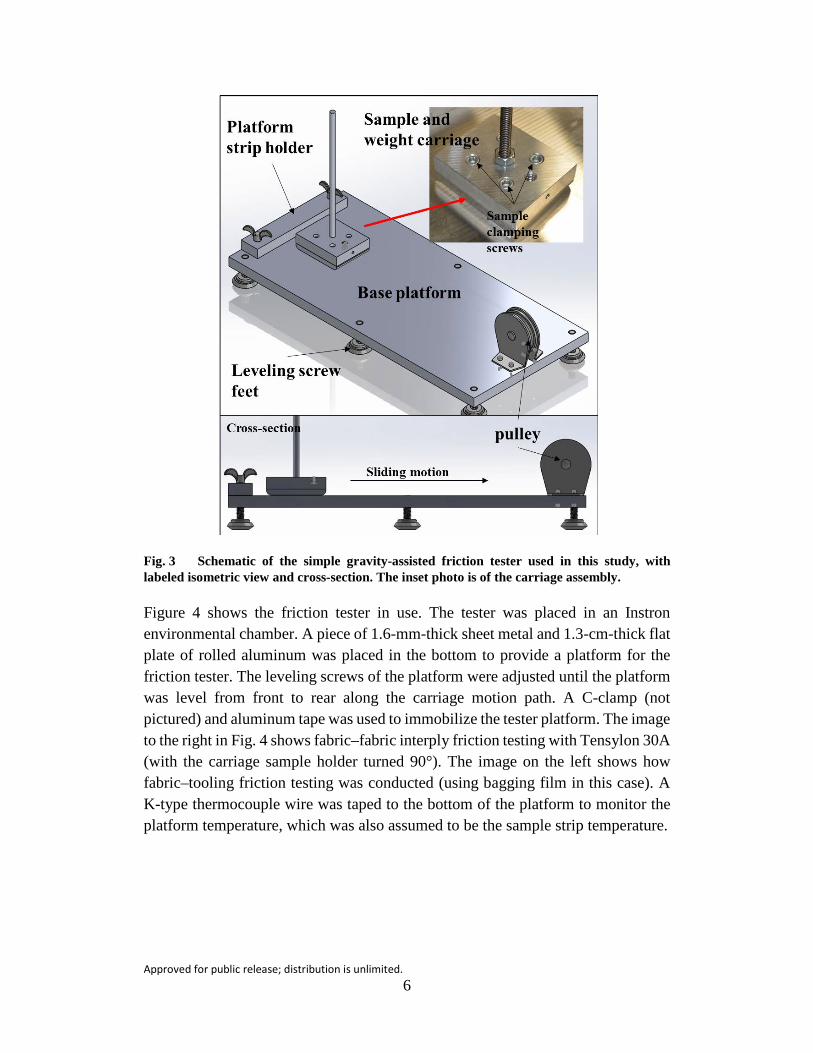
Figure 4 shows the friction tester in use. The tester was placed in an Instron environmental chamber. A piece of 1.6-mm-thick sheet metal and 1.3-cm-thick flat plate of rolled aluminum was placed in the bottom to provide a platform for the friction tester. The leveling screws of the platform were adjusted until the platform was level from front to rear along the carriage motion path. A C-clamp (not pictured) and aluminum tape was used to immobilize the tester platform. The image to the right in Fig. 4 shows fabric–fabric interply friction testing with Tensylon 30A (with the carriage sample holder turned 90°). The image on the left shows how fabric–tooling friction testing was conducted (using bagging film in this case). A K-type thermocouple wire was taped to the bottom of the platform to monitor the platform temperature, which was also assumed to be the sample strip temperature.
Approved for public release; distribution is unlimited. 7
Fig. 4 Experimental setup illustrating fabric–fabric (left) and fabric–tooling (right) friction testing within an Instron environmental chamber
The carriage sample holder bottom had contact dimensions of 50.8 mm (width) × 53.5 mm (length), giving a contact area of 2717.8 mm2. The slotted weights pictured in Fig. 4 were stacked onto the carriage body incrementally to provide a constant normal force during testing. All carriage components and the platform were machined to within a tight tolerance of approximately ±50 µm (0.002 inch). It is assumed the normal contact pressure is simply the weight bearing down on the contact area during sliding motion; however, this friction tester design precludes independent load cell measurement(s) of the applied normal load during testing.
2.4 UHMWPE Sample Preparation
Both UHMWPE composite materials were received from the manufacturers on 1.6-m (63-inch)-wide rolls. The Stretchlon 800 was received as a single sheet on a 1.8-m (72-inch)-wide roll. Strips were cut out of each material using an automated cutting table. Cutting “clean” (undamaged) sample strips from the UHMWPE materials proved challenging due to the cutting resistance of polyethylene. Also, special care was taken to cut sample strips away from material inconsistencies (see Fig. 2); however, it was not possible to completely eliminate material inconsistencies and sample preparation damage within the friction samples.
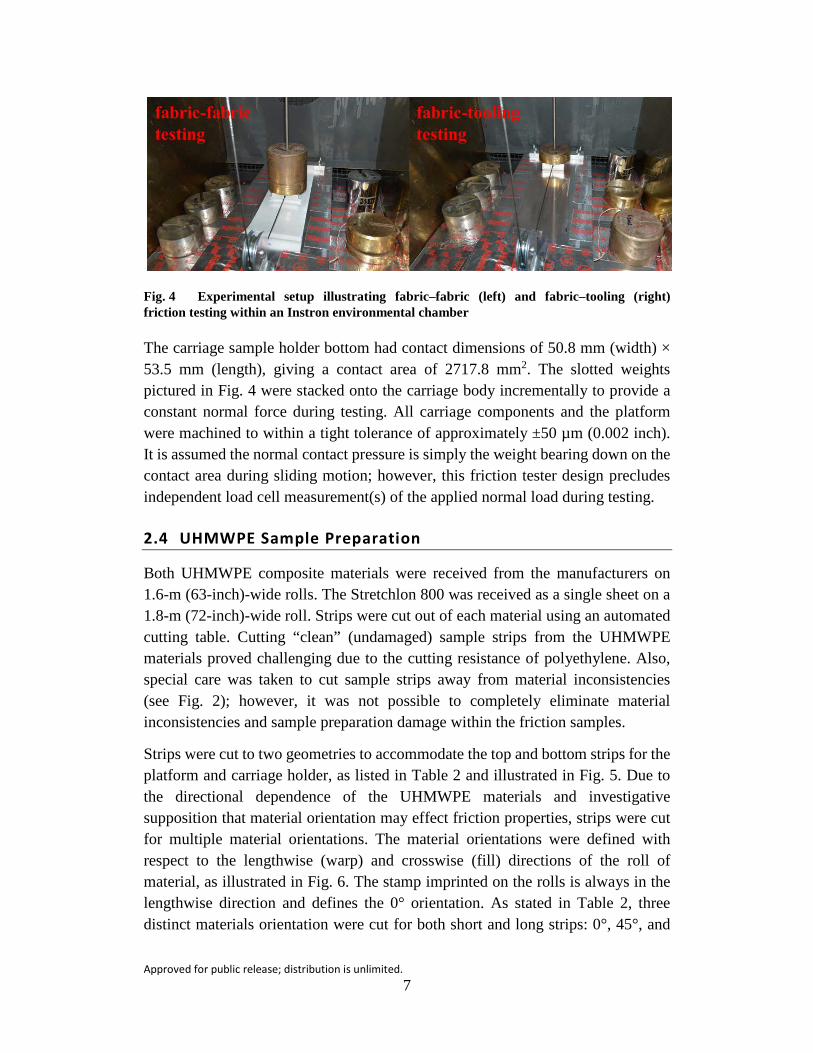
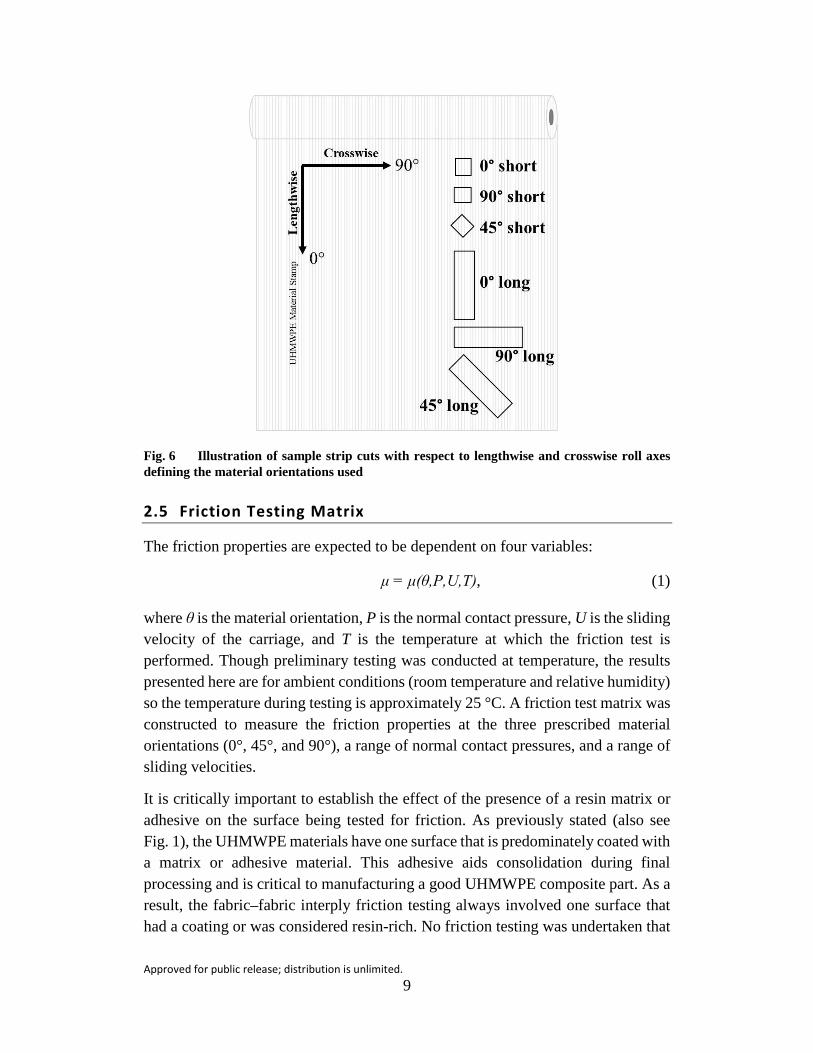
Strips were cut to two geometries to accommodate the top and bottom strips for the platform and carriage holder, as listed in Table 2 and illustrated in Fig. 5. Due to the directional dependence of the UHMWPE materials and investigative supposition that material orientation may effect friction properties, strips were cut for multiple material orientations. The material orientations were defined with respect to the lengthwise (warp) and crosswise (fill) directions of the roll of material, as illustrated in Fig. 6. The stamp imprinted on the rolls is always in the lengthwise direction and defines the 0° orientation. As stated in Table 2, three distinct materials orientation were cut for both short and long strips: 0°, 45°, and
Approved for public release; distribution is unlimited. 8
90°. These three orientations represent common ply angles occurring in most composite material lay-ups. A new strip pair was used for each test. The Stretchlon 800 material is assumed isotropic, so short and long strips were cut lengthwise.
Table 2 Material strip geometries and orientations for the UHMWPE materials
Sample Geometry (cm)
Geometry (inches)
Material orientations
(°)
Short 5 × 10.2 2 × 4 0, 45, 90
Long 8.9 × 30.5 3.5 × 12 0, 45, 90
Fig. 5 Top (“long”) and bottom (“short”) strip nomenclature and placement within the friction tester. Note how the short or bottom strip is firmly installed on the carriage holder for testing.
Approved for public release; distribution is unlimited. 9
Fig. 6 Illustration of sample strip cuts with respect to lengthwise and crosswise roll axes defining the material orientations used
2.5 Friction Testing Matrix
The friction properties are expected to be dependent on four variables:
μ = μ(θ,P,U,T), (1)
where θ is the material orientation, P is the normal contact pressure, U is the sliding velocity of the carriage, and T is the temperature at which the friction test is performed. Though preliminary testing was conducted at temperature, the results presented here are for ambient conditions (room temperature and relative humidity) so the temperature during testing is approximately 25 °C. A friction test matrix was constructed to measure the friction properties at the three prescribed material orientations (0°, 45°, and 90°), a range of normal contact pressures, and a range of sliding velocities.
It is critically important to establish the effect of the presence of a resin matrix or adhesive on the surface being tested for friction. As previously stated (also see Fig. 1), the UHMWPE materials have one surface that is predominately coated with a matrix or adhesive material. This adhesive aids consolidation during final processing and is critical to manufacturing a good UHMWPE composite part. As a result, the fabric–fabric interply friction testing always involved one surface that had a coating or was considered resin-rich. No friction testing was undertaken that
Approved for public release; distribution is unlimited. 10
purposefully matched up two uncoated or resin-poor UHMWPE surfaces, as such a scenario was unrealistic. As a direct result, sample strips were always laid down or affixed to the carriage with the stamp side directed “up”. This means that the stamp side is visible on the “top” or platform strip and not visible, facing in, on the “bottom” or short strip (see Fig. 5). However, fabric–tooling friction testing did involve matching a tooling surface (bagging film) with an uncoated or resin-poor surface.
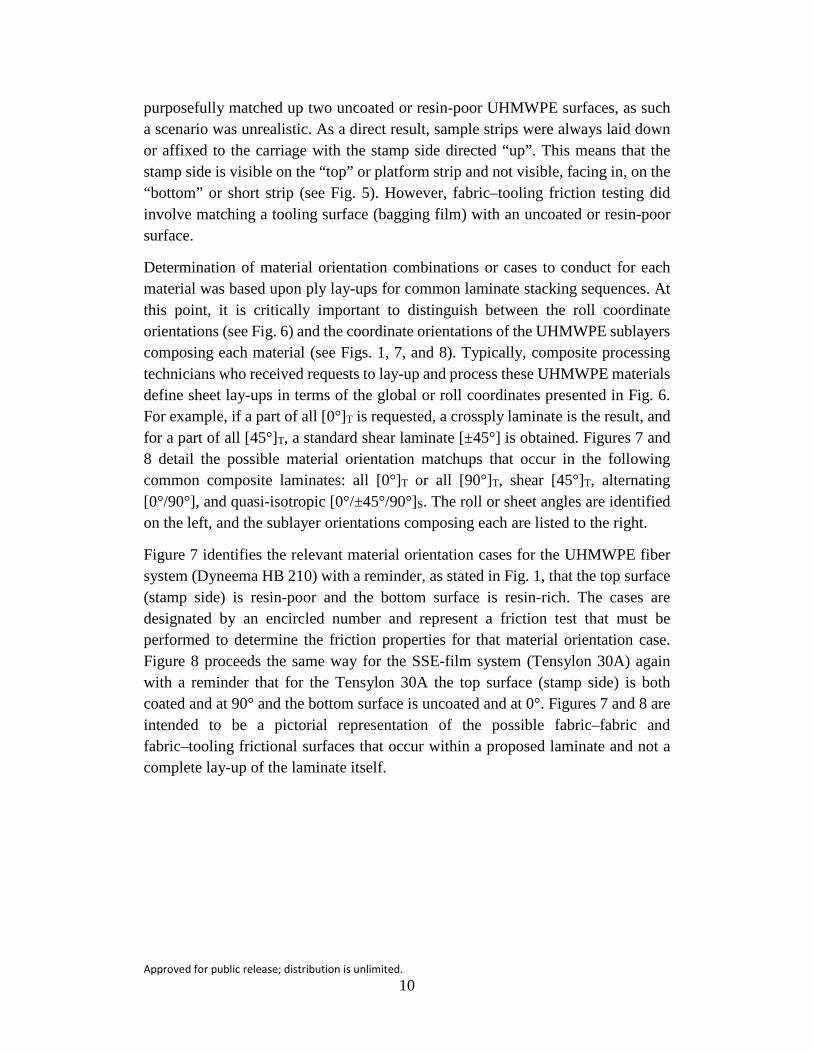
Determination of material orientation combinations or cases to conduct for each material was based upon ply lay-ups for common laminate stacking sequences. At this point, it is critically important to distinguish between the roll coordinate orientations (see Fig. 6) and the coordinate orientations of the UHMWPE sublayers composing each material (see Figs. 1, 7, and 8). Typically, composite processing technicians who received requests to lay-up and process these UHMWPE materials define sheet lay-ups in terms of the global or roll coordinates presented in Fig. 6. For example, if a part of all [0°]T is requested, a crossply laminate is the result, and for a part of all [45°]T, a standard shear laminate [±45°] is obtained. Figures 7 and 8 detail the possible material orientation matchups that occur in the following common composite laminates: all [0°]T or all [90°]T, shear [45°]T, alternating [0°/90°], and quasi-isotropic [0°/±45°/90°]S. The roll or sheet angles are identified on the left, and the sublayer orientations composing each are listed to the right.
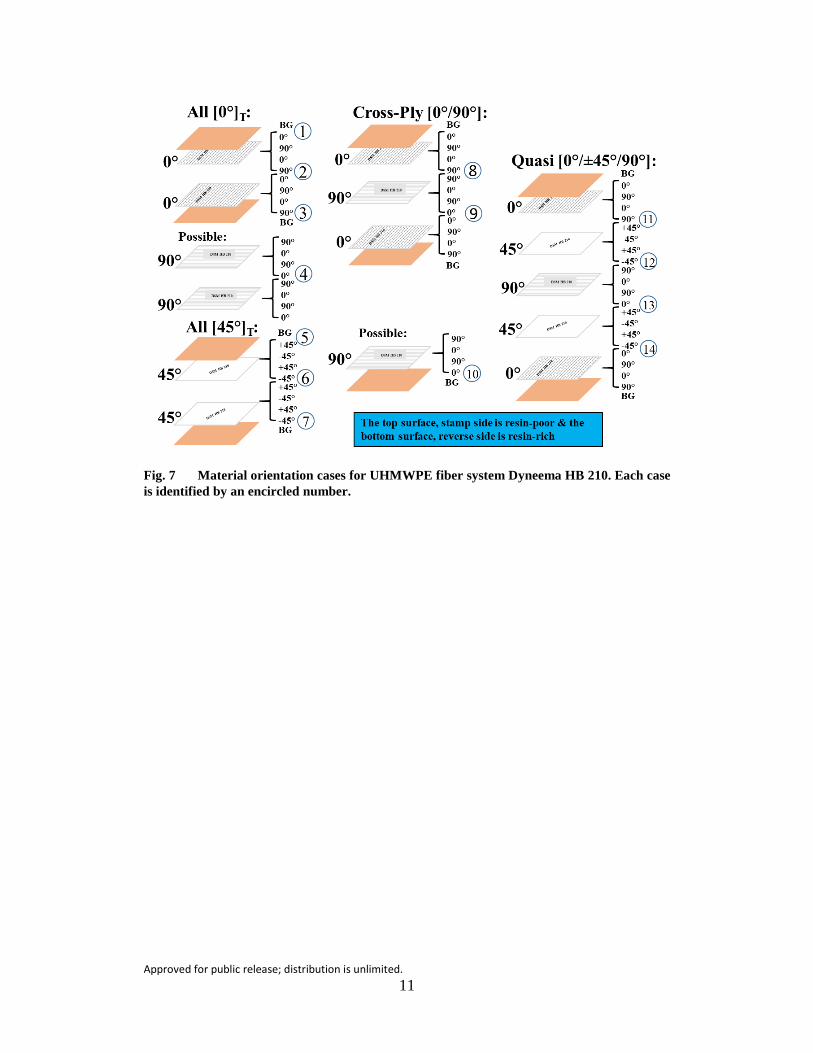
Figure 7 identifies the relevant material orientation cases for the UHMWPE fiber system (Dyneema HB 210) with a reminder, as stated in Fig. 1, that the top surface (stamp side) is resin-poor and the bottom surface is resin-rich. The cases are designated by an encircled number and represent a friction test that must be performed to determine the friction properties for that material orientation case. Figure 8 proceeds the same way for the SSE-film system (Tensylon 30A) again with a reminder that for the Tensylon 30A the top surface (stamp side) is both coated and at 90° and the bottom surface is uncoated and at 0°. Figures 7 and 8 are intended to be a pictorial representation of the possible fabric–fabric and fabric–tooling frictional surfaces that occur within a proposed laminate and not a complete lay-up of the laminate itself.
Approved for public release; distribution is unlimited. 11
Fig. 7 Material orientation cases for UHMWPE fiber system Dyneema HB 210. Each case is identified by an encircled number.
Approved for public release; distribution is unlimited. 12
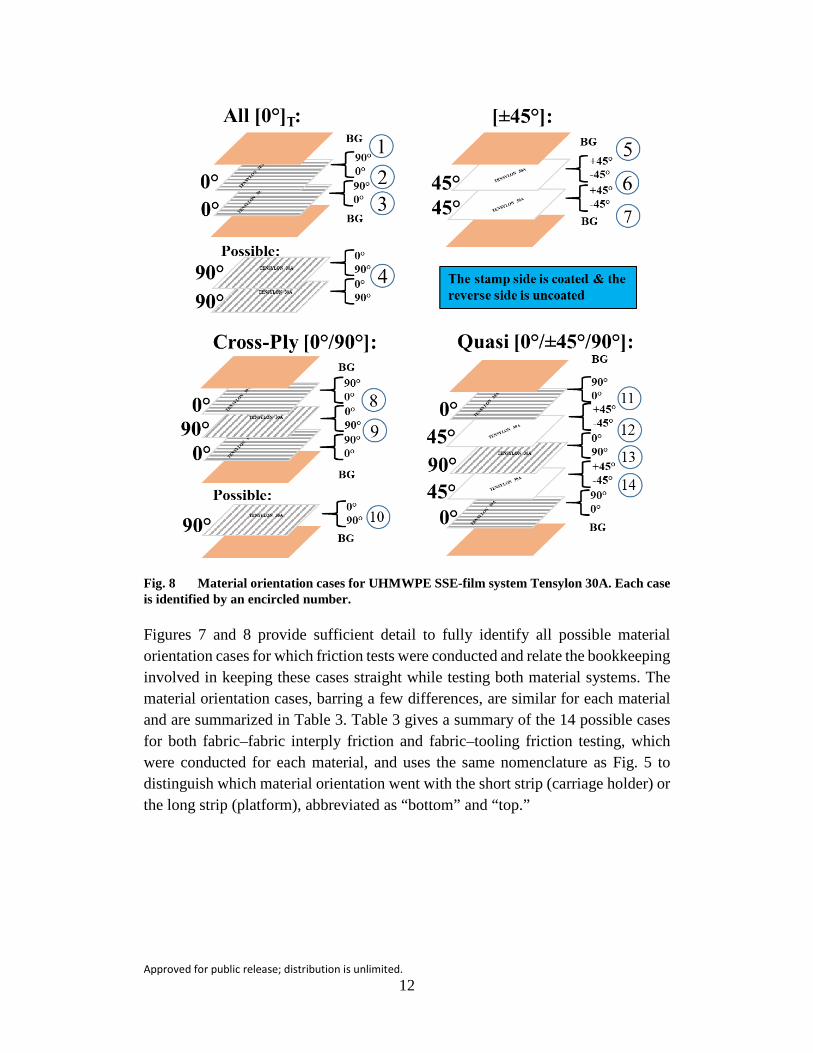
Fig. 8 Material orientation cases for UHMWPE SSE-film system Tensylon 30A. Each case is identified by an encircled number.
Figures 7 and 8 provide sufficient detail to fully identify all possible material orientation cases for which friction tests were conducted and relate the bookkeeping involved in keeping these cases straight while testing both material systems. The material orientation cases, barring a few differences, are similar for each material and are summarized in Table 3. Table 3 gives a summary of the 14 possible cases for both fabric–fabric interply friction and fabric–tooling friction testing, which were conducted for each material, and uses the same nomenclature as Fig. 5 to distinguish which material orientation went with the short strip (carriage holder) or the long strip (platform), abbreviated as “bottom” and “top.”
Approved for public release; distribution is unlimited. 13
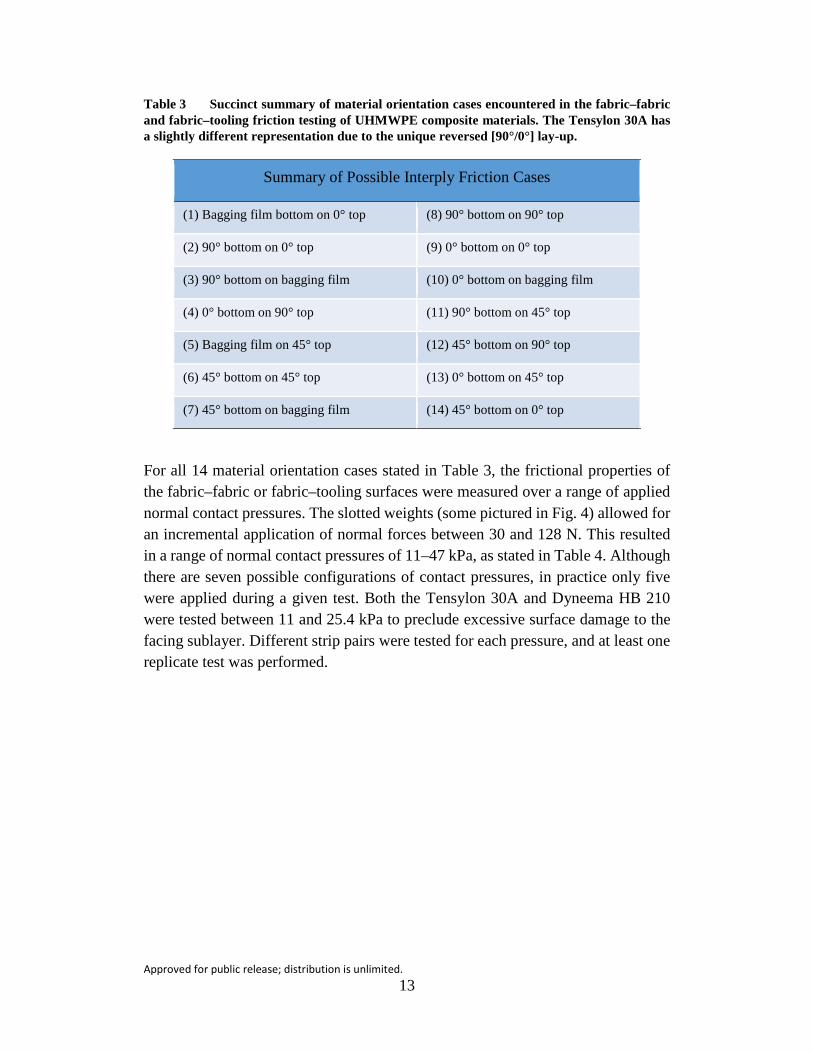
Table 3 Succinct summary of material orientation cases encountered in the fabric–fabric and fabric–tooling friction testing of UHMWPE composite materials. The Tensylon 30A has a slightly different representation due to the unique reversed [90°/0°] lay-up.
Summary of Possible Interply Friction Cases
(1) Bagging film bottom on 0° top (8) 90° bottom on 90° top
(2) 90° bottom on 0° top (9) 0° bottom on 0° top
(3) 90° bottom on bagging film (10) 0° bottom on bagging film
(4) 0° bottom on 90° top (11) 90° bottom on 45° top
(5) Bagging film on 45° top (12) 45° bottom on 90° top
(6) 45° bottom on 45° top (13) 0° bottom on 45° top
(7) 45° bottom on bagging film (14) 45° bottom on 0° top
For all 14 material orientation cases stated in Table 3, the frictional properties of the fabric–fabric or fabric–tooling surfaces were measured over a range of applied normal contact pressures. The slotted weights (some pictured in Fig. 4) allowed for an incremental application of normal forces between 30 and 128 N. This resulted in a range of normal contact pressures of 11–47 kPa, as stated in Table 4. Although there are seven possible configurations of contact pressures, in practice only five were applied during a given test. Both the Tensylon 30A and Dyneema HB 210 were tested between 11 and 25.4 kPa to preclude excessive surface damage to the facing sublayer. Different strip pairs were tested for each pressure, and at least one replicate test was performed.
Approved for public release; distribution is unlimited. 14
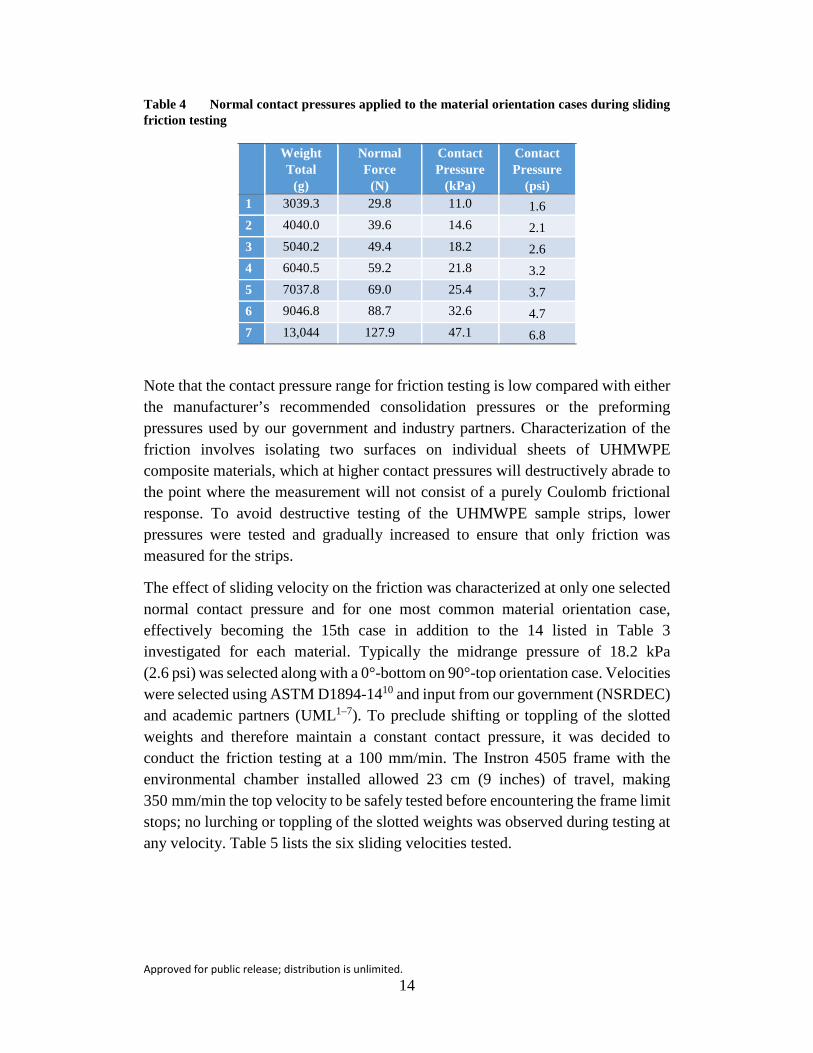
Table 4 Normal contact pressures applied to the material orientation cases during sliding friction testing
Weight Total
(g)
Normal Force
(N)
Contact Pressure
(kPa)
Contact Pressure
(psi) 1 3039.3 29.8 11.0 1.6 2 4040.0 39.6 14.6 2.1 3 5040.2 49.4 18.2 2.6 4 6040.5 59.2 21.8 3.2 5 7037.8 69.0 25.4 3.7 6 9046.8 88.7 32.6 4.7 7 13,044 127.9 47.1 6.8
Note that the contact pressure range for friction testing is low compared with either the manufacturer’s recommended consolidation pressures or the preforming pressures used by our government and industry partners. Characterization of the friction involves isolating two surfaces on individual sheets of UHMWPE composite materials, which at higher contact pressures will destructively abrade to the point where the measurement will not consist of a purely Coulomb frictional response. To avoid destructive testing of the UHMWPE sample strips, lower pressures were tested and gradually increased to ensure that only friction was measured for the strips.
The effect of sliding velocity on the friction was characterized at only one selected normal contact pressure and for one most common material orientation case, effectively becoming the 15th case in addition to the 14 listed in Table 3 investigated for each material. Typically the midrange pressure of 18.2 kPa (2.6 psi) was selected along with a 0°-bottom on 90°-top orientation case. Velocities were selected using ASTM D1894-1410 and input from our government (NSRDEC) and academic partners (UML1–7). To preclude shifting or toppling of the slotted weights and therefore maintain a constant contact pressure, it was decided to conduct the friction testing at a 100 mm/min. The Instron 4505 frame with the environmental chamber installed allowed 23 cm (9 inches) of travel, making 350 mm/min the top velocity to be safely tested before encountering the frame limit stops; no lurching or toppling of the slotted weights was observed during testing at any velocity. Table 5 lists the six sliding velocities tested.

Approved for public release; distribution is unlimited. 15
Table 5 Sliding velocities tested on UHMWPE composite materials. All sliding velocity tests were conducted at P = 18.2 kPa on a common 0°-bottom on 90°-top material orientation case
2.6 Determination of Coulomb Friction Coefficients
All friction testing was conducted under ambient laboratory conditions (approximately 25 °C and 50% humidity), pressures up to 25.4 kPa, and at a sliding velocity of 100 mm/min. This combination of test parameters was expected to produce a purely Coulomb frictional response for each UHMWPE material. The goal was to determine both the static and dynamic coefficients of friction with respect to material orientation θ, pressure P, and sliding velocity U. The load required to overcome the static force and slide the weight carriage along the platform strip was measured and plotted versus the extension up to 100 mm (4 inches).
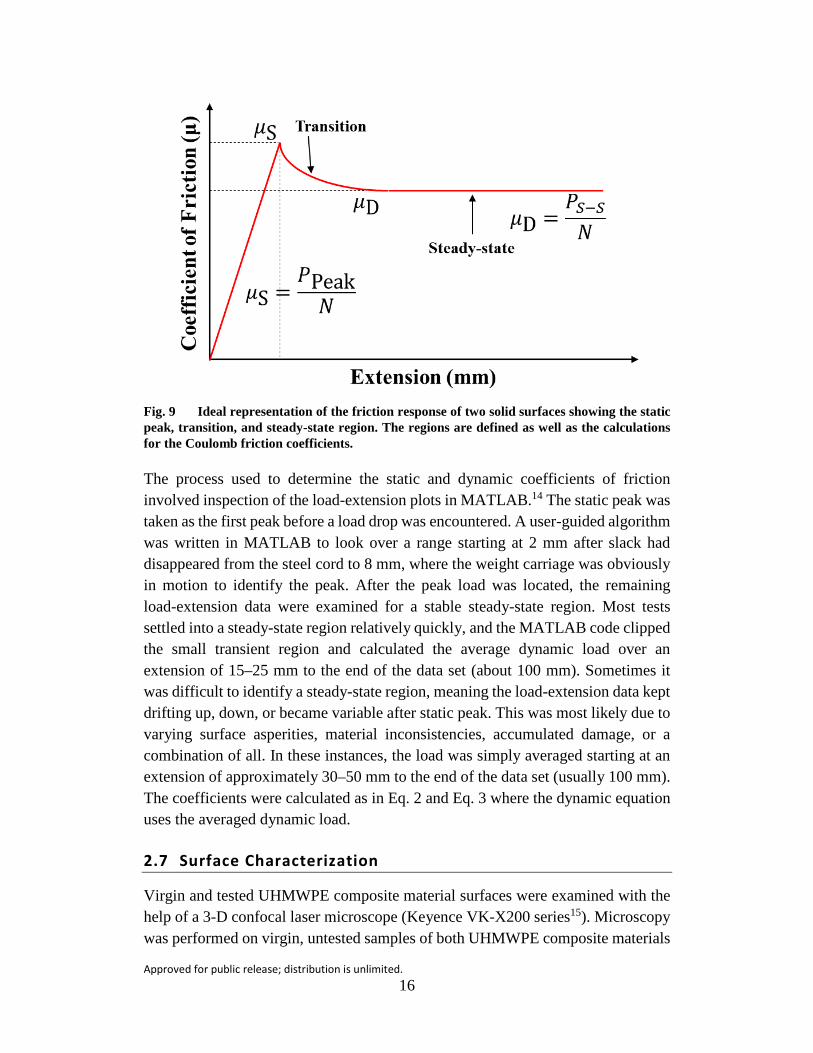
Ideally, the typical friction response is represented in Fig. 9. The load increases up to the static load peak and the weight carriage begins to slide and a load drop is observed. A period of transition leads to a steady-state sliding and roughly constant pull along load. The coefficients are then calculated using the static peak load and an average of the approximately constant load in the steady-state region. The calculations may be represented in equation form as
𝜇𝜇S = 𝑃𝑃Peak𝑁𝑁
(2)
and
𝜇𝜇D = 𝑃𝑃S-S𝑁𝑁
, (3)
where μS and μD are the static and dynamic coefficients of friction, PPeak is the first peak load encountered, PS-S is the load during steady-state, and N is the normal force applied.
Approved for public release; distribution is unlimited. 16
Fig. 9 Ideal representation of the friction response of two solid surfaces showing the static peak, transition, and steady-state region. The regions are defined as well as the calculations for the Coulomb friction coefficients.
The process used to determine the static and dynamic coefficients of friction involved inspection of the load-extension plots in MATLAB.14 The static peak was taken as the first peak before a load drop was encountered. A user-guided algorithm was written in MATLAB to look over a range starting at 2 mm after slack had disappeared from the steel cord to 8 mm, where the weight carriage was obviously in motion to identify the peak. After the peak load was located, the remaining load-extension data were examined for a stable steady-state region. Most tests settled into a steady-state region relatively quickly, and the MATLAB code clipped the small transient region and calculated the average dynamic load over an extension of 15–25 mm to the end of the data set (about 100 mm). Sometimes it was difficult to identify a steady-state region, meaning the load-extension data kept drifting up, down, or became variable after static peak. This was most likely due to varying surface asperities, material inconsistencies, accumulated damage, or a combination of all. In these instances, the load was simply averaged starting at an extension of approximately 30–50 mm to the end of the data set (usually 100 mm). The coefficients were calculated as in Eq. 2 and Eq. 3 where the dynamic equation uses the averaged dynamic load.
2.7 Surface Characterization
Virgin and tested UHMWPE composite material surfaces were examined with the help of a 3-D confocal laser microscope (Keyence VK-X200 series15). Microscopy was performed on virgin, untested samples of both UHMWPE composite materials

Approved for public release; distribution is unlimited. 17
to establish the presence of a resin or adhesive on the surface, visualize the surface topology (establish unidirectional reinforcement direction), and understand the extent of material inconsistencies present. The same technique was then used to quantify the accumulated damaged on tested sample strips, especially the more heavily damaged resin or adhesive-free surfaces. Microscopy was not performed on every sample tested; only on samples that already appeared damaged from visual inspection.
3. Results and Discussion
3.1 Load-Extension Data
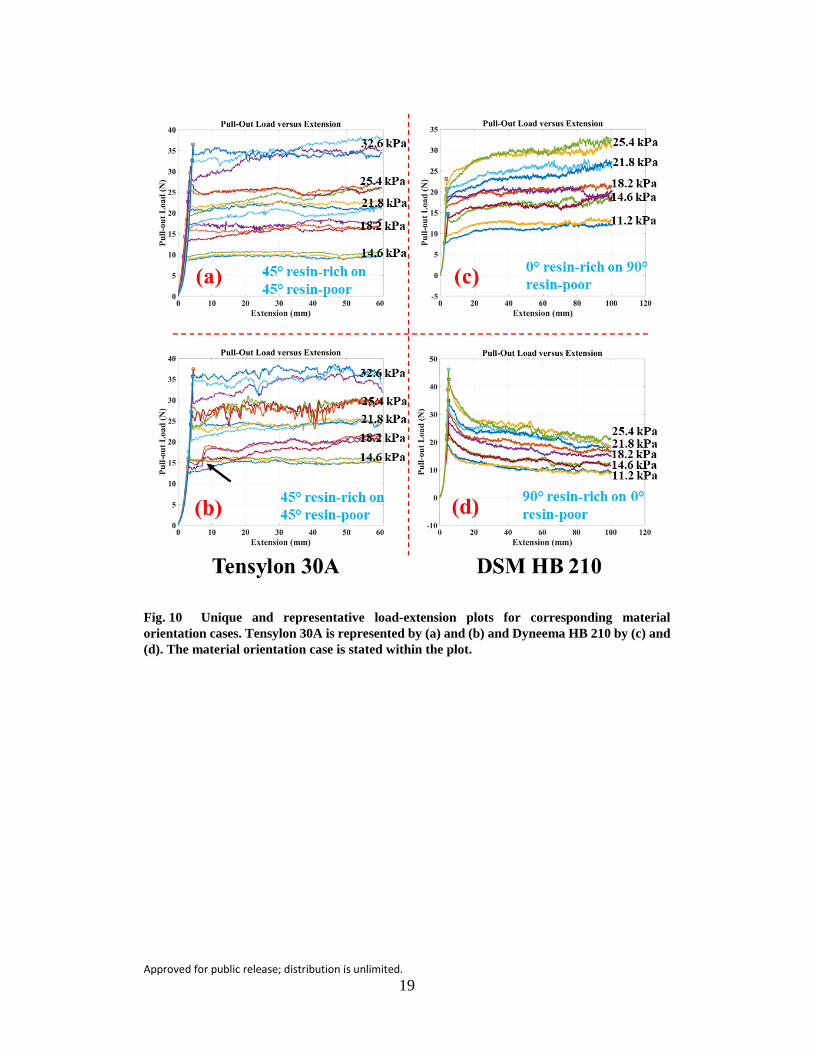
Figure 10 (a–d) contains representative load-extension data presented as two sets of corresponding material orientation cases for both UHMWPE materials. It is suspected that these orientation pairs would yield similar friction properties since the only thing different is which surface has the coating or resin. However, the load-extension data demonstrated the additional importance of the individual material orientations, especially when uncoated, and illustrated some issues involved in the friction testing (and ultimately why so many variations were conducted to fully evaluate the friction response of the material).
Load-extension data for Tensylon 30A is represented in Fig. 10a and 10b for the 45°-bottom on 45°-top case. All tests were terminated early at about 60 mm (versus 100 mm for other tests) due to the weight carriage immediately veering in the direction of the short strip orientation of 45° and ending up on the edge of the long strip and partially onto the aluminum platform (see Figs. 4 and 5). This veering motion to one side was most pronounced when the long strip was also a 45° and occurred to some extent for both UHMWPE composite materials (but especially distinct for the Tensylon 30A). This veering was mitigated for the 0°- and 90°-top (long or platform) strips but still evident and was even observed for a short 45°-bottom strips of UHMWPE material on the tooling material Stretchlon 800.
Another key finding for the two Tensylon 30A plots from Fig. 10a and 10b is that at lower pressures (15 and 18 kPa) the replicate data are consistent (with similar static peaks and uniform dynamic loads), but at higher pressures (>22 kPa) more variation (noisy dynamic loads) is observed, which causes crossing of dynamic friction responses with different pressures. In the lower chart for the Tensylon 30A, a sudden jump in the dynamic loading is labeled with an arrow; this is due to a material inconsistency such as a gap or overlap of the SSE-film. Overall, the two friction tests for Tensylon 30A illustrated in Fig. 10a and 10b had a similar static

Approved for public release; distribution is unlimited. 18
peak response (note the load range of 10–36 N is the same for both) and roughly equivalent dynamic response.
The Dyneema HB 210 is represented in Fig. 10c and 10d for the 0°-bottom on 90°-top case (Fig. 10c) and the corresponding 90°-bottom on 0°-top case (Fig. 10d). For the HB 210, the load-extension responses are significantly different. The 0°-bottom on 90°-top case (Fig. 10c) has a lower static peak range (8–22 N) and an increasing dynamic transition (due to the formation of accumulated damage on the surface). The corresponding orientation, 90°-bottom on 0°-top (Fig. 10d), displays a high static peak range (20–46 N) and a decreasing dynamic transition. The explanation for the disparity in the static responses is in the material orientations (0° vs. 90°) of the fibers and the resin-poor surface on the bottom strip. A simplified schematic of the surface topologies with respect to the orientation of the unidirectional reinforcing phases is presented in Fig. 11. For the short 0°-bottom strips, the fiber/fiber bundle axes are aligned with the motion and do not resist the initial sliding motion as they start to translate. For the short 90°-bottom strips, their fiber bundle axes are perpendicular to the motion, which causes both translation and axial rotation of the fibers (Fig. 11) and a higher resistance to sliding motion. Note that the dynamic response (once motion initiates and continues) of both cases settles to similar values for the pressures tested (11–25 kPa), indicating that the key distinction is in a significantly different static friction response due to the orientation angles and resin-poor character of the surfaces.
Approved for public release; distribution is unlimited. 19
Fig. 10 Unique and representative load-extension plots for corresponding material orientation cases. Tensylon 30A is represented by (a) and (b) and Dyneema HB 210 by (c) and (d). The material orientation case is stated within the plot.

Approved for public release; distribution is unlimited. 20
Fig. 11 A simplified representation of a UHMWPE surface sublayer detailing the orientations of the unidirectional reinforcement. U is the sliding velocity, f is the frictional force, and θ is the top surface sublayer orientation (the base is held at 0° aligning with the direction of the sliding motion).
3.2 Fabric–Fabric Friction
The friction test matrix summarized in Tables 3 and 4 generated coefficients of friction data that were plotted versus pressure for each material orientation case. The plots of static and dynamic coefficients of friction versus pressure for fabric–fabric interply friction are presented in Fig. 12 for Tensylon 30A and Fig. 13 for Dyneema HB 210. At least one replicate test (sometimes three) was performed for each pressure and material orientation case and are represented in the figures by vertical error bars on each data point that represent the average coefficient for identical tests. To more fully visualize any possible trends in the relationship between material orientation and surface friction, the static and dynamic coefficients of friction were plotted for the long (top or platform) strip versus the short (bottom carriage) strip orientation in Fig. 14 for P = 18.2 kPa and Fig. 15 for P = 25.4 kPa.

Approved for public release; distribution is unlimited. 21
Fig. 12 Static and dynamic coefficients of friction vs. normal contact pressure for Tensylon 30A
Fig. 13 Static and dynamic coefficients of friction vs. normal contact pressure for Dyneema HB 210

Approved for public release; distribution is unlimited. 22
Fig. 14 Static and dynamic coefficients of friction categorized with respect to material orientations of the carriage strip vs. platform strip at a contact pressure of 18.2 kPa. The columns of the horizontal axis represent the UHMWPE composite materials and the rows the material orientation of the platform strip. Each inner bar chart gives the coefficient of friction for the carriage strip orientation vs. a single platform orientation.

Approved for public release; distribution is unlimited. 23
Fig. 15 Static and dynamic coefficients of friction categorized with respect to material orientations of the carriage strip vs. platform strip at a contact pressure of 25.4 kPa. The columns of the horizontal axis represent the UHMWPE composite materials and the rows the material orientation of the platform strip. Each inner bar chart gives the coefficient of friction for the carriage strip orientation vs. a single platform orientation.
The coefficients of friction versus pressure for Tensylon 30A are given Fig. 12. The main conclusion for the static and dynamic coefficients is that they do not depend on contact pressure for pressures under 30 kPa. There are a few standout tests that have lower friction coefficients and seem to increase with pressure (the off-axis cases involving a short 45°-bottom uncoated strip on a 45° or 90° long strip). Most material orientation cases have a static coefficient range of 0.4–0.6 and a dynamic coefficient range of 0.4–0.55. Every interply friction case involves one surface with

Approved for public release; distribution is unlimited. 24
a coating (by design), so the effect of the coating is already accounted for in the results. Therefore, given the low experimental error measured, the coefficient value range of 0.4–0.6 must be due to differences in material orientation. Detailing these differences, however, may not be desired (or worth the effort) since a friction coefficient range of 0.4–0.6 may be an acceptable range of values to input to a preforming model for prediction (more on this later with the discussion of Figs. 14 and 15).
The coefficients of friction versus pressure for Dyneema HB 210 are given in Fig. 13. The static coefficients of friction display no dependence on pressure. The dynamic coefficients, however, seem to increase with pressure until the highest pressure (25 kPa) where they drop off slightly. The static friction response has a larger spread of values from 0.2 to 0.62, whereas the dynamic friction response has a smaller spread from 0.2 to 0.42. The wide spread of values in the static coefficient of friction indicates that the UHMWPE fiber system is more dependent on material orientation than the SSE-film system (Tensylon 30A). This hypothesis was presented in discussions of the load-extension response of Fig. 10c and 10d and supported here. The static friction response can be divided into three regions depending on the orientation of the resin-poor surface. The 90°-resin-poor surfaces have the highest static friction coefficients of 0.45–0.62, the 45°-resin-poor surfaces are midrange at 0.3–0.42, and the 0°-resin-poor surfaces have the lowest static friction coefficient range of 0.2–0.4 (similar to Tensylon 30A).
The dynamic friction response displays more experimental error overall and it is unknown why the highest pressure level friction coefficients decrease. The HB 210 was tested up to 25 kPa to avoid influence of unwanted in-plane warpage on the friction response (a 45° case at 33 kPa was tested on this material and discarded). The data might suggest that the 25-kPa pressure is still too high for the HB 210 to obtain a pure measure of the Coulomb friction.
The effect of the material orientations on the friction properties for the two test strips has been detailed in Figs. 14 and 15. Figures 12 and 13 present the friction response versus pressure. To better isolate the effect of material orientation, the friction coefficients were plotted per orientation case at a midlevel pressure and the highest tested pressure. Figure 14 gives the coefficients of friction for both UHMWPE materials at a pressure of 18.2 kPa and Fig. 15 at 25.4 kPa. The figures are organized as two columns corresponding to the different materials. The vertical axis is organized into three rows each representing one of the three discrete angles 0°, 45°, and 90° for the long platform strip. The inner horizontal axes within the columns represents the discrete angles for the short strip carriage material. There are a total of nine cases for each UHMWPE material.

Approved for public release; distribution is unlimited. 25
The key finding for the Tensylon 30A is that the 45° uncoated short strips exhibit the lowest static and dynamic friction coefficients, especially for the case of a 45°-bottom and 45°-top friction tests (Fig. 14 and 15; second row, first column). It was previously mentioned that testing involving a 45° strip veered off the long (platform) strip during testing, causing the test to be terminated early. The design of the friction tester used in this study does not restrict side-to-side or twisting motion of the carriage as it is pulled along the platform (see Figs. 3–5). This particular test was repeated numerous times, but the results were consistent. The 45° uncoated strip will veer or drift in the direction of its unidirectional reinforcement during a sliding friction test until it reaches and hugs the edge of the long coated strip. The effect is more pronounced if the long, coated strip is also a 45° (but will also occur on a 0° and 90° long, coated strip) and the contact pressure increases (see Fig.12). As depicted in Fig. 11 (middle), as the 45° strip translates during a friction test, the uncoated SSE-film develops two components of force to resist the motion: one lengthwise in the direction of the reinforcement (45° with respect to the sliding velocity) and one crosswise (rotational). The surface of Tensylon 30A SSE-film is very resistant to abrasion and in-plane shearing (warpage) and accumulates less damage than a typical UHMWPE fiber system during such translation. It is possible that due to the combination of the coating and the uniform surface topology of the SSE-film, the lengthwise component of force has a path of least resistance. This will cause the noticeable veering to one side and help explain why this particular motion results in lower static and dynamic coefficients of friction for each long (platform) strip orientation given in Figs. 14 and 15 (column one).
The static and dynamic coefficients of friction for Dyneema HB 210 exhibit a stronger dependence on the material orientations of the two sliding surfaces. This is evidenced by the spread in values for the coefficients indicated in Fig. 13. Both Figs. 14 and 15 (second column) reveal more about what is happening at the interface of the sliding surfaces. For the Dyneema HB 210, the long (platform) strip represented by the horizontal axis is the resin-poor one. The 90° long strip has much higher static coefficients than dynamic coefficients (Figs. 14 and 15, top row, second column). This trend is also observed for the 45° long strip (though not for the 90°-bottom on 45°-top). The 0° long strip tests exhibit a reversal in this trend giving low static coefficients and much higher dynamic coefficients (though not for the 0°-bottom on 0°-top test).
The higher static coefficient of friction for the off-axis 45°- and 90°-resin-poor orientations may be explained with the use of Fig. 11. During sliding motion, the

Approved for public release; distribution is unlimited. 26
90° fibers are perpendicular to the direction of sliding and develop forces that develop a rotational force within the individual fibers/fiber bundles (Fig. 11, bottom schematic). This tendency to want to rotate the fibers develops higher forces to resist the motion and yields the highest static peaks (observed in Figs. 14 and 15, first row, second column). The 45° orientation (Figs. 14 and 15, second row, second column), whose fibers are partially in the direction of sliding, develop both translational and rotational forces (Fig. 11, middle schematic) to resist the sliding motion. The net effect for the 45° orientation is slightly lower static friction and similar dynamic friction especially for the 45°-bottom and 45°-top case.
Interestingly, the coefficients of static and dynamic friction for the 90°-resin-poor cases slightly decrease with the highest pressure of 25.4 kPa (Fig. 15; top row, second column). This was noted previously and in the discussion of Fig. 13. It was suspected that the surface of the HB 210 was accumulating damage and obscuring the evaluation of a purely Coulomb friction response. Figure 16 provides a schematic detailing that surface asperities in the fiber bundles tend to flatten out with increasing contact pressure. The net effect reduces the surface friction through creating a flattened more uniform interface for the surfaces to slide with respect to each other. Alternatively, accumulated damage may develop a boundary layer of loose peeling and piling fibers on which the surfaces slide (there is some support for this from posttest surface microscopy). Note that the 90°-bottom on 90°-top test for 25.4 kPa was excluded from Fig. 15 due to excessive tearing of the top sublayer producing erratic load-extension data and spurious friction coefficients.
Fig. 16 Changes to the surface of a fiber system under increasing normal contact pressure
For the 0°-resin-poor surface represented in Figs. 14 and 15 (first row, second column), some of the off-axis (45° and 90°) tests have a low static friction and higher dynamic friction coefficient. This observation is more prevalent at the lower pressure of 18.2 kPa (Fig. 14) with only the 90° test displaying this characteristic at 25.4 kPa (Fig. 15). This interesting result obtained for the HB 210 was presented

Approved for public release; distribution is unlimited. 27
in Fig. 10c and 10d for the 0°-bottom on 90°-top case and the corresponding 90°-bottom on 0°-top case. The dynamic response of the 45° and 90° strips increases after initiation of motion, likely due to the accumulation of damage in the off-axis strips, which were found to build up upraised fibers, peeling, and piling increasing the sliding resistance. Why this effect is observed in the 45°-bottom on 0°-top case at 18.2 kPa and not in the 25.4 kPa test is not known. Again, Fig. 15 shows the values of the static and dynamic friction decreasing slightly between the midlevel pressure 18.2 kPa and the highest tested pressure 25.4 kPa.
3.3 Fabric–Tooling Friction
The static and dynamic friction coefficients for Tensyslon 30A on Stretchlon 800 bagging film are given in Fig. 17. The Stretchlon 800 bagging film is an isotropic thin polymer film that is smooth to the touch and not expected to exhibit high friction in sliding. Both static and dynamic coefficients are either weakly dependent on pressure or independent. Most notable is the difference between coated and uncoated surface friction on the bagging film. The uncoated surface, regardless of material orientation, has a low static and dynamic friction response—perhaps even negligible. This is a strong indication that the presence of a coating (resin or adhesive) constituted a larger portion of the friction response for Tensylon 30A.
Fig. 17 Static and dynamic coefficients of friction vs. normal contact pressure for Tensylon 30A on Stretchlon 800 bagging film
Approved for public release; distribution is unlimited. 28
The coated surfaces tested on bagging film for the Tensylon 30A display a significant difference when it comes to material orientation. The 0° orientation (long strip, coated) has the lowest frictional response at 0.2–0.3 for both static and dynamic coefficients. The 90° orientation is in the middle and shows the strongest linear dependence on pressure; the static coefficient has a wider range from 0.3 to 0.5, but the dynamic coefficient has a tighter range from 0.4 to 0.5. The 45° orientation has the highest friction on bagging film with a static coefficient of approximately 0.6 and a dynamic coefficient in the range of 0.5–0.6. The fabric–fabric interply friction results for Tensylon 30A discussed in Figs. 12, 14, and 15 do indicate a mild dependence on material orientation, but this result for the fabric–tooling friction was unexpected.
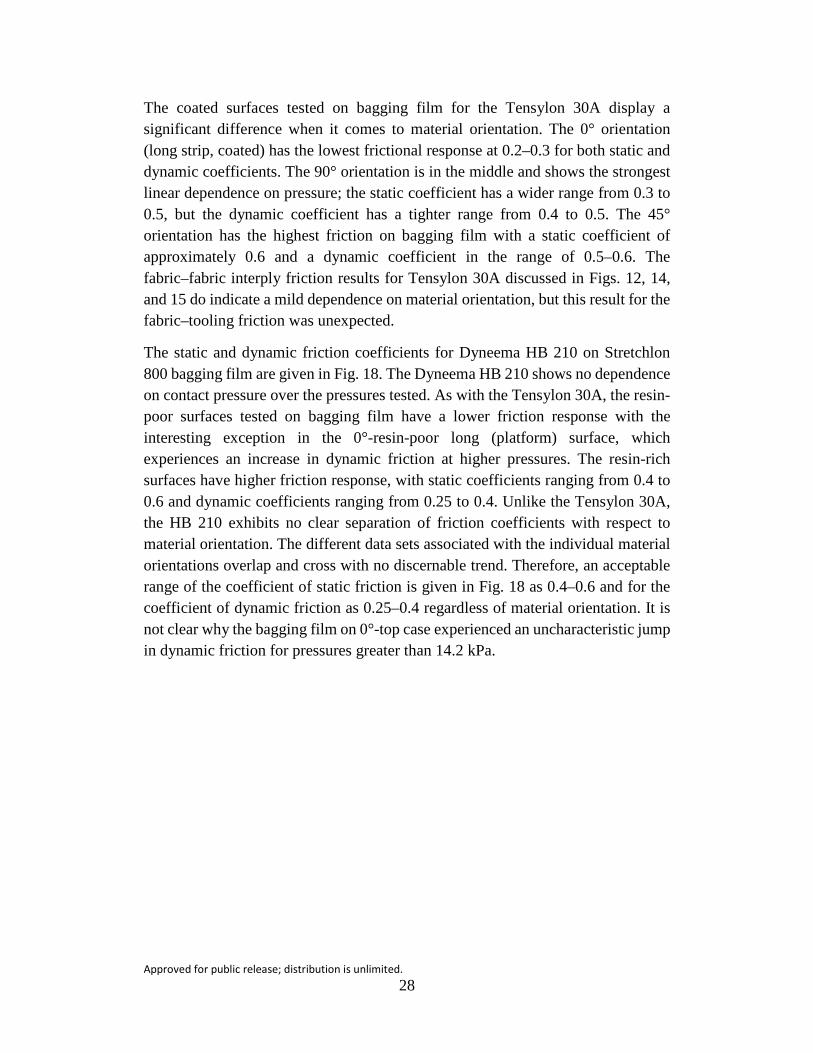
The static and dynamic friction coefficients for Dyneema HB 210 on Stretchlon 800 bagging film are given in Fig. 18. The Dyneema HB 210 shows no dependence on contact pressure over the pressures tested. As with the Tensylon 30A, the resin-poor surfaces tested on bagging film have a lower friction response with the interesting exception in the 0°-resin-poor long (platform) surface, which experiences an increase in dynamic friction at higher pressures. The resin-rich surfaces have higher friction response, with static coefficients ranging from 0.4 to 0.6 and dynamic coefficients ranging from 0.25 to 0.4. Unlike the Tensylon 30A, the HB 210 exhibits no clear separation of friction coefficients with respect to material orientation. The different data sets associated with the individual material orientations overlap and cross with no discernable trend. Therefore, an acceptable range of the coefficient of static friction is given in Fig. 18 as 0.4–0.6 and for the coefficient of dynamic friction as 0.25–0.4 regardless of material orientation. It is not clear why the bagging film on 0°-top case experienced an uncharacteristic jump in dynamic friction for pressures greater than 14.2 kPa.
Approved for public release; distribution is unlimited. 29
Fig. 18 Static and dynamic coefficients of friction vs. normal contact pressure for Dyneema HB 210 on Stretchlon 800 bagging film
3.4 Surface Characterization: Visual Inspection and Microscopy
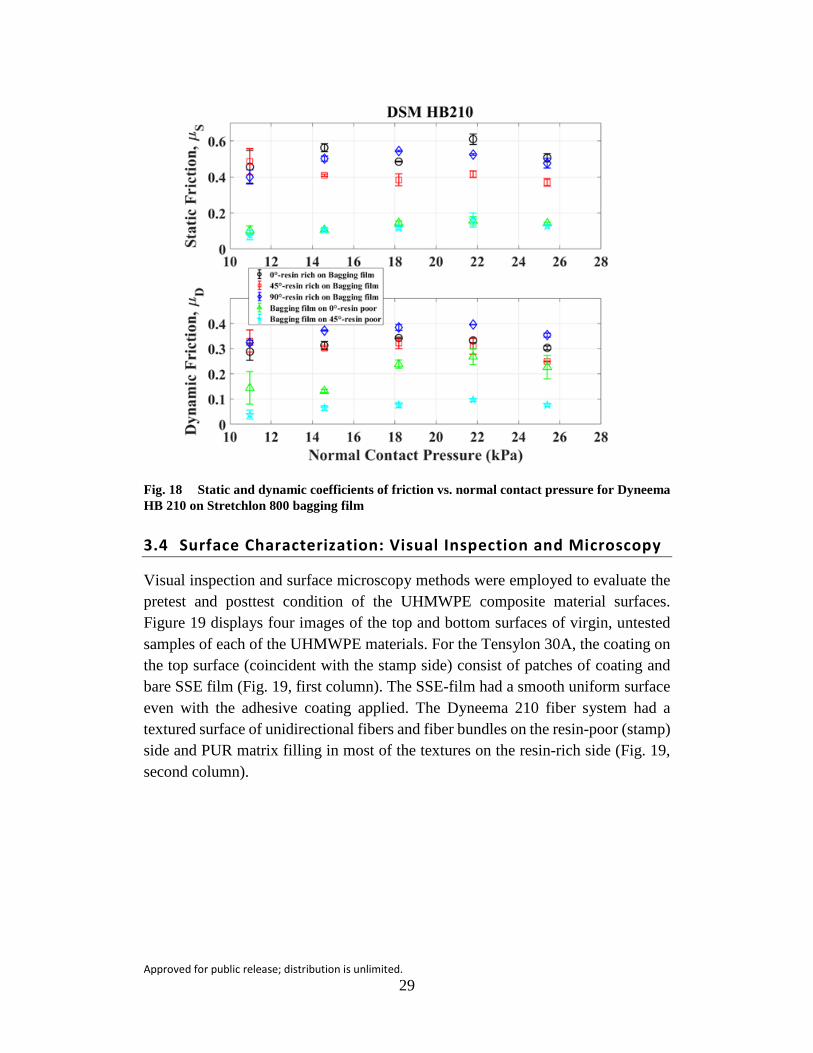
Visual inspection and surface microscopy methods were employed to evaluate the pretest and posttest condition of the UHMWPE composite material surfaces. Figure 19 displays four images of the top and bottom surfaces of virgin, untested samples of each of the UHMWPE materials. For the Tensylon 30A, the coating on the top surface (coincident with the stamp side) consist of patches of coating and bare SSE film (Fig. 19, first column). The SSE-film had a smooth uniform surface even with the adhesive coating applied. The Dyneema 210 fiber system had a textured surface of unidirectional fibers and fiber bundles on the resin-poor (stamp) side and PUR matrix filling in most of the textures on the resin-rich side (Fig. 19, second column).
Approved for public release; distribution is unlimited. 30
Fig. 19 Microscopy of virgin, untested strips of UHMWPE composite materials used in this friction study. The top row is the top surface or stamp side of each material, and the bottom row is the bottom surface. The columns are represented by the two UHMWPE composite materials. The dimensional scale is provided in each of the four inset images.
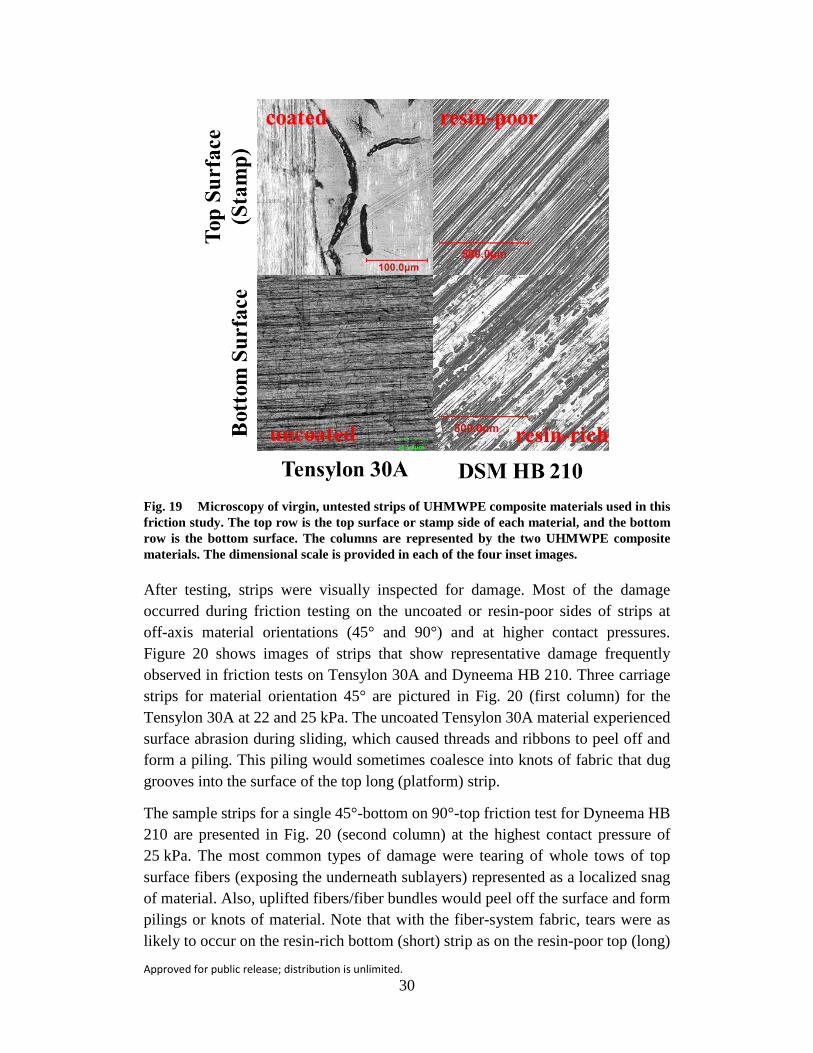
After testing, strips were visually inspected for damage. Most of the damage occurred during friction testing on the uncoated or resin-poor sides of strips at off-axis material orientations (45° and 90°) and at higher contact pressures. Figure 20 shows images of strips that show representative damage frequently observed in friction tests on Tensylon 30A and Dyneema HB 210. Three carriage strips for material orientation 45° are pictured in Fig. 20 (first column) for the Tensylon 30A at 22 and 25 kPa. The uncoated Tensylon 30A material experienced surface abrasion during sliding, which caused threads and ribbons to peel off and form a piling. This piling would sometimes coalesce into knots of fabric that dug grooves into the surface of the top long (platform) strip.
The sample strips for a single 45°-bottom on 90°-top friction test for Dyneema HB 210 are presented in Fig. 20 (second column) at the highest contact pressure of 25 kPa. The most common types of damage were tearing of whole tows of top surface fibers (exposing the underneath sublayers) represented as a localized snag of material. Also, uplifted fibers/fiber bundles would peel off the surface and form pilings or knots of material. Note that with the fiber-system fabric, tears were as likely to occur on the resin-rich bottom (short) strip as on the resin-poor top (long)
Approved for public release; distribution is unlimited. 31
strip due to many factors including the textured surface and the susceptibility of the unidirectional fibers to in-plane shearing.
Fig. 20 Images of representative damage incurred in off-axis sample strips of Tensylon 30A (left) and Dyneema HB 210 (right) due to sliding friction
Once visual inspection identified the most damaged surfaces, microscopy was performed to quantify the surface wear and damage. Figure 21a–d shows raw images taken with the 3-D confocal laser microscope paired with a height map analysis (performed using Keyence software, VK Analyzer15) of the same image for both the Tensylon 30A and Dyneema HB 210. The Tensylon 30A surface is an uncoated 90° strip tested at a pressure of 25 kPa. The image taken in Fig. 21a reveals a number of upraised fiber ribbons and threads that were sheared off the surface and formed a piling on top. The height map analysis (Fig. 21b) reveals the deep groove left after a ribbon of material sheared off. It is not clear whether the groove left extends to the underneath SSE-film layer (on the reverse side). The upraised “ridges” are simply threads of material laying over the surface to a height of approximately 115 μm. As is expected in a 90° material orientation, the damage occurs perpendicular to the sliding motion. The Dyneema HB 210 surface in Fig. 21c is a much damaged 45°-resin-poor strip tested at a pressure of 25 kPa. The image clearly shows that the 45° surface has experienced warpage that has torn apart the top surface to reveal the inner fiber sublayers (at perpendicular directions).

Approved for public release; distribution is unlimited. 32
The surface height map analysis (Fig. 21d) demonstrates that the damaged, mangled surface consists of ridges and valleys at a depth of approximately 230 µm. The 45° material orientation was the most prone of the Tensylon 30A and HB 210 to exhibit damage.
Fig. 21 Microscopy of damaged sample strips of Tensylon 30A (left) and Dyneema HB 210 (right)
3.5 Sliding Velocity Study
Each UHMWPE composite material was friction tested at a fixed contact pressure over a range of sliding velocities to determine if the friction properties were dependent on sliding velocity. A common material orientation case was chosen (0°-bottom on 90°-top) and the contact pressure was selected as 18.2 kPa, a midlevel pressure for this study. Figure 22 gives the static and dynamic coefficients of friction versus sliding velocity of Tensylon 30A and Fig. 23 that of Dyneema HB 210.
The Tensylon 30A data appear to suggest a dependence at sliding velocities over 3 mm/s; however, there is much experimental error in the data. Given that the upper velocity data point has no replicate, an argument may be made that the static coefficient is not dependent on the velocity with a value of 0.28. There is, though, a stronger indication that the dynamic coefficient for the Tensylon 30A may be

Approved for public release; distribution is unlimited. 33
dependent at velocities greater than 4 mm/s as demonstrated by the decreasing trend of Fig. 22. Given the experimental error in the data, replicating tests at velocities above 3 mm/s and exceeding the current max velocity of 6 mm/s is recommended before drawing any solid conclusions. The Dyneema HB 210 (Fig. 23) is conclusively independent of sliding velocity with a constant static coefficient of 0.6 and a dynamic coefficient of 0.32.
Fig. 22 Effect of sliding velocity on the friction coefficients of Tensylon 30A

Approved for public release; distribution is unlimited. 34
Fig. 23 Effect of sliding velocity on the friction coefficients of Dyneema HB 210
4. Conclusions
A survey of friction properties was conducted on UHMWPE composite materials with respect to contact pressure, material orientation of the unidirectional reinforcement, and sliding velocity. Two UHMWPE materials were selected for this study: Tensylon 30A and Dyneema HB 210. One tooling material (Stretchlon 800) was also evaluated for its friction properties on the UHMWPE material composites. Fabric–fabric interply and fabric–tooling friction testing was conducted to determine the static and coefficient of friction and identify any trends and unique observations per material.
A summary of key conclusions is presented in Fig. 24. Other important observations include the unexpected veering to one side of the tests involving the 45° material orientation. This veering off the platform was most pronounced by the Tensylon 30A but observed by the HB 210 as well. Understanding why this is happening, including the physics producing this effect, will be important to any model attempting to predict final material ply orientations during the intermediate preforming step and final part consolidation. Another important observation involves the effort to determine the effect of a UHMWPE composite material’s orientation on friction properties. When constructing a large test matrix to account

Approved for public release; distribution is unlimited. 35
for many combinations of ply orientation, contact pressure, and sliding velocity, it is hoped that a clear trend will emerge once the data are plotted. Dependence on the contact pressure and sliding velocity, for the most part, was not observed when analyzing the friction data. A complicated and non-negligible dependence, however weak, was observed for material orientation, but was difficult to conclusively quantify given all the cases tested for. Another very important conclusion to this study is that the presence of a coating or resin constitutes a significant portion of the frictional response of these UHMWPE composite materials. This was clearly deduced from the fabric–tooling friction testing, where the friction properties of uncoated or resin-poor surfaces are all much lower (possibly an order of magnitude) than for the coated or resin-rich surfaces.
Fig. 24 Brief summary of main conclusions and observations from this friction characterization of selected UHMWPE composite materials
Future work will require testing at higher pressures, higher velocities, and, especially, higher temperatures. New UHMWPE materials will be received by the US Army Research Laboratory and characterized. Higher temperature characterization in the range of the softening temperature of polyethylene may necessitate a more sophisticated friction tester design based on that of our academic
Approved for public release; distribution is unlimited. 36
partners at UML. New analysis techniques (beyond Coulomb friction) for the friction coefficient calculation will also be explored for testing at higher pressures and temperatures which may involve hydrodynamic friction and necessitate the use of the Stribeck theory.

Approved for public release; distribution is unlimited. 37
5. References
1. Chow S. Frictional interaction between holder and fabric in stamping of woven thermoplastic composites [master’s thesis]. [Lowell (MA)]: University of Massachusetts; 2002.
2. Gorcyzyca J. A study of the frictional behavior of a plain-weave fabric during the thermostamping process [dissertation]. [Lowell (MA)]: University of Massachusetts; 2004.
3. Gorcyzca JL, Sherwood JA, Liu L, Chen J. Modeling of friction and shear in thermostamping of composites – part I. J Comp Mat. 2004;38(21):1911–1929.
4. Gamache L. The design and implementation of a friction test apparatus based on the thermostamping process of woven-fabric composites [master’s thesis]. [Lowell (MA)]: University of Massachusetts; 2007.
5. Fetfatsidis K. Characterization of the tool/fabric and fabric/fabric friction for woven fabrics: static and dynamic [master’s thesis]. [Lowell (MA)]: University of Massachusetts; 2009.
6. Fetfatsidis KA, Gamache LM, Gorczyca JL, Sherwood JA, Jauffres D, Chen J. Design of an apparatus for measuring tool/fabric and fabric/fabric friction of woven-fabric composites during the thermostamping process. Int J Mater Form. 2013;6(1):1–11.
7. Fetfatsidis KA, Jauffres D, Sherwood JA, Chen J. Characterization of the tool/fabric and fabric/fabric friction for woven-fabric composites during the thermostamping process. Int J Mater Form. 2013;6(2):209–221.
8. Sachs U, Haanappel S, Rietman B, Akkerman R. Friction testing of thermoplastic composites. In: Erath MA, editor. Proceedings of the 32nd SAMPE Europe International Technical Conference & Forum (SEICO 11); 2011 Mar 28–29; Paris, France. Red Hook (NY): Curran Associates; c2011. p. 181–191.
9. Sachs U, Akkerman R, Fetfatsidis K, Vidal-Salle E, Schumacher J, Ziegmann G, Allaoui S, Hivet G, Maron B, Vanclooster K, Lomov SV. Characterization of the dynamic friction of woven fabrics. Experimental Methods and Benchmark Results Comp: Part A. 2014;67:289–298.
10. ASTM D1894-14. Standard test method for static and kinetic coefficients of friction of plastic film and sheeting. West Conshohocken (PA): ASTM International; 2014.

Approved for public release; distribution is unlimited. 38
11. Tensylon HSBD 30A. Midlands (MI): Dow Chemical Company; 2018 [accessed 2018 July 24]. http://www.dupont.com/content/dam/dupont /products-and-services/personal-protective-equipment/vehicle-armor/documents/DPP_Tensylon30A_datasheet_K25929_2.pdf.
12. Dyneema HB 210. Heerlen (Netherlands): DSM; 2018 [accessed 2018 July 24]. https://www.dsm.com/content/dam/dsm/dyneema/en_GB/Downloads/LP%20Product%20Grades/DSM_Hard_Ballistic_solutions.pdf.
13. Stretchlon 800 Vacuum Bagging Film. Huntington Beach (CA): Airtech International, Inc.; 2018 [accessed 2018 July 24]. https://www.fibreglast.com/product/Stretchlon_800_Bagging_Film_1688/Va.cuum_Bagging_Films_Peel_Ply_Tapes.
14. MATLAB. Version 2017b. Natick (MA): The Mathworks; 2017.
15. Keyence VK-X200 Series Microscope. Osaka (Japan): Keyence; 2018 [accessed 2018 July 24]. https://www.keyence.com/keyence-tv/VK -X200_3D_Laser_Scanning_Microscope.jsp.
Approved for public release; distribution is unlimited. 39
List of Symbols, Abbreviations, and Acronyms
3-D 3-dimensional
ASTM American Society for Testing and Materials
DSM Koninklijke DSM NV
NSRDEC US Army Soldier Research, Development and Engineering Center
PUR polyurethane resin
SSE solid-state extruded
UHMWPE ultra-high-molecular-weight polyethylene
UML University of Massachusetts at Lowell
Approved for public release; distribution is unlimited. 40
1 DEFENSE TECHNICAL (PDF) INFORMATION CTR DTIC OCA 2 DIR ARL (PDF) IMAL HRA RECORDS MGMT RDRL DCL TECH LIB 1 GOVT PRINTG OFC (PDF) A MALHOTRA 13 ARL (PDF) RDRL WMM A T A BOGETTI D O’BRIEN J CAIN M YEAGER B PARQUETTE A QUABILI M WALTER J STANISZEWSKI J TZENG S BOYD RDRL WMM B J CLINE 2 RDECOM NSREDC (PDF) T KAYHART D KUBIAK