Embed Size (px)
Citation preview

26/09/2017
1
Fretting wear of low current (DC)
electrical contacts: quantification
of electrical endurance
S. Fouvry1, J. Laporte1, O. Perrinet1, P. Jedrzejczyk1,
O. Graton1, R. Enquebecq1,3, O. Alquier2, J. Sautel3
1 Laboratoire de Tribologie et Dynamique des Systèmes, Ecole Centrale de Lyon, France 2 PSA, Vélizy - France 3 Radiall,Voreppe, France
1
(contact : [email protected])
2
Fretting Group @ LTDS
Fretting Wear, Fretting Fatigue
Fretting & Electrical Contacts
Plateforme 2DFDurabilité, Fretting & Fatigue
Plateforme numériqueBureaux des chercheur de la thématiquefretting
Lyon
Ecole Centrale de Lyon

26/09/2017
2
Industrial context
Micro-displacements
Fretting Wear
3/19
• Fretting solicitations
• Contact wear
• Loss of electrical conduction
0,0001
0,001
0,01
0,1
1
10
0 5000000 10000000 15000000 20000000 25000000
NUMBER OF CYCLES N
ELE
CTR
ICA
L R
ESIS
TA
NC
E R
[
] Electrical Failure
Threshold resistance
Nc: ECR (electrical contact resistance endurance)
Nc
B. H. Chudnovsky, Proc. 48th IEEE Holm, (2002), 140–150.
R. S. Timsit, IEICE Transactions on Electronics 88 (8), (2005)
Electrical Contact Resistance : ECR
N. Ben Jemaa, 23th ICEC, 2006, 215-219
M. Antler, IEEE Transactions 7, 1984, 363-369
S. Noël et al. Wear 301, 2013, 551-561
J. W. McBride, proc. 52th IEEE conf., 2006, 170-180.
1. Experimental Simulation
2. ECR endurance versus sliding amplitude
3. Fretting surface damages & ECR behaviour
4. ECR & Friction energy density concept
5. Complex Fretting-Reciprocating slidings
6. ECR versus Coatings properties
7. Conclusions
TOPICS
26/09/2017
3
Experimental setup
Crossed cylinders (90°)
r = 2.35 mm
2.aHertz
Cross Cylinder configuration
Q(N)
(µm)
displacementTan
gentialfo
rce
*Q : tangential
force
amplitude
)J(Ed
: dissipated
energy: displacement amplitude*
02
2 S
Fretting Loop
*( )Q N
( )µm
Fretting Log
Q(N)
(µm) displacement
Tangential force
*Q
Fretting cycle
δ*
δ0
displacement amplitude (test compliance dependent)
δ0 : Sliding amplitude (=> δ when Q=0)
Ed (J) friction energy
5
6
Fretting Connector 1
Fretting : δ* : 1 – 30 µm
Temperature : 20 -200°C
Frequency: 30 – 500 hz
Humidity (salt) : 10 – 90% RH
Fretting Connector 2
Fretting : δ* : 1 – 30 µm
Temperature : 20 -200°C
Frequency: 30 – 500 hz
Humidity (salt) : 10 – 90% RH
Gazes (doping) : H2S & S02
Fretting Connector 3
Fretting : δ* : 1 – 30 µm
Reciprocating : D : 0.1 to 10 mm
Temperature : 20 -200°C
Frequency: 30 – 500 hz
Humidity (salt) : 10 – 90% RH
DC micro fretting test platform @ LTDS (Ecole Centrale de Lyon)

26/09/2017
4
elec
tric
al r
esis
tan
ce R
(
)
Rmin
Nc (electrical
endurance)
fretting cycles
DRc=0.004 Electrical failure when:
DR> DRc=0.004
Definition of the electrical failure criterion
Four point method Stabilized current : I = 0.005 A
Normal force P=3N
Displacement *
7/19
S. Hannel et al, Wear 249, 2001, 761-770 W. Ren, et al. Tribology International 83,(2015), 1-11
Flowers G.T et al. Proc. of the 51st IEEE Holm Conf., 2005, 82-88
Malucci, R.D., Proc. of the 49th IEEE Holm Conf., 2003, 1-15
Studied materials and test conditions
Noble
CuSn4 (substrate)
Ni 2 µm
CuSn4 (substrate)
Ni 2 µm
e (µm) Au coatings
CuSn4 (substrate)
Ni
CuSn4 (substrate)
Ni
Ag coatings
CuSn4 (substrate)
Ni
CuSn4 (substrate)
Ni
Sn coatings
Gold Silver Tin Semi-Noble Non Noble
Sn coatings Ag coatings Au coatings
Applied test conditions: Temperature: 25°C Relative humidity: 10% Frequency: 30Hz Normal force & δ : varying
crossed cylinders
90°
r = 2.35 mm
2.aHertz
Sphere/Plane If P= 3N
aHertz=43µm & pH, max=772MPa
Electrodeposition process
e (µm)
8
26/09/2017
5
Reciprocating 1
*
a
e
Q
2δ*
a
reciprocating
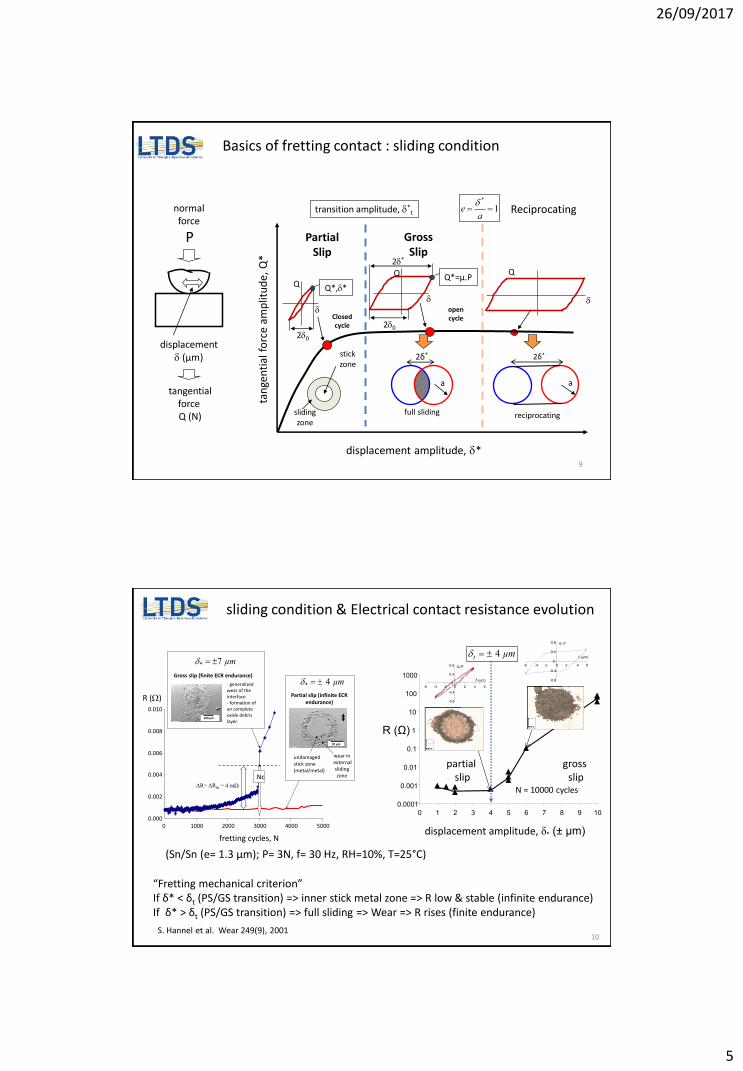
Basics of fretting contact : sliding condition
tan
gen
tial
fo
rce
amp
litu
de,
Q*
displacement amplitude, *
Closed cycle
stick zone
sliding zone
Partial Slip
Q
20
Q*,*
P
normal force
displacement (µm)
tangential force Q (N)
transition amplitude, *t
full sliding
2*
Q
20
Q*=µ.P
2δ*
a
Gross Slip
open cycle
9
10
Partial slip (infinite ECR endurance)
undamagedstick zone(metal/metal)
wear in externalsliding zone
70 µm
Gross slip (finite ECR endurance)
- generalizedwear of the interface.- formation of an completeoxide debris layer.
0.000
0.002
0.004
0.006
0.008
0.010
0 1000 2000 3000 4000 5000
Nc
fretting cycles, N
* 7 µm
R ()
100 µm
* 4 µm
ΔR=ΔRth = 4 mΩ
sliding condition & Electrical contact resistance evolution
(Sn/Sn (e= 1.3 µm); P= 3N, f= 30 Hz, RH=10%, T=25°C)
“Fretting mechanical criterion” If δ* < δt (PS/GS transition) => inner stick metal zone => R low & stable (infinite endurance) If δ* > δt (PS/GS transition) => full sliding => Wear => R rises (finite endurance)
0.0001
0.001
0.01
0.1
1
10
100
1000
0 1 2 3 4 5 6 7 8 9 10
R (Ω)
partial slip
gross slip
displacement amplitude, δ* ( µm)
4 t µm
-0.8
-0.4
0
0.4
0.8
-6 -4 -2 0 2 4 6
δ (µm)
Q*/P
-0.8
-0.4
0
0.4
0.8
-6 -4 -2 0 2 4 6
δ (µm)
Q*/P
N = 10000 cycles
S. Hannel et al. Wear 249(9), 2001
26/09/2017
6
11
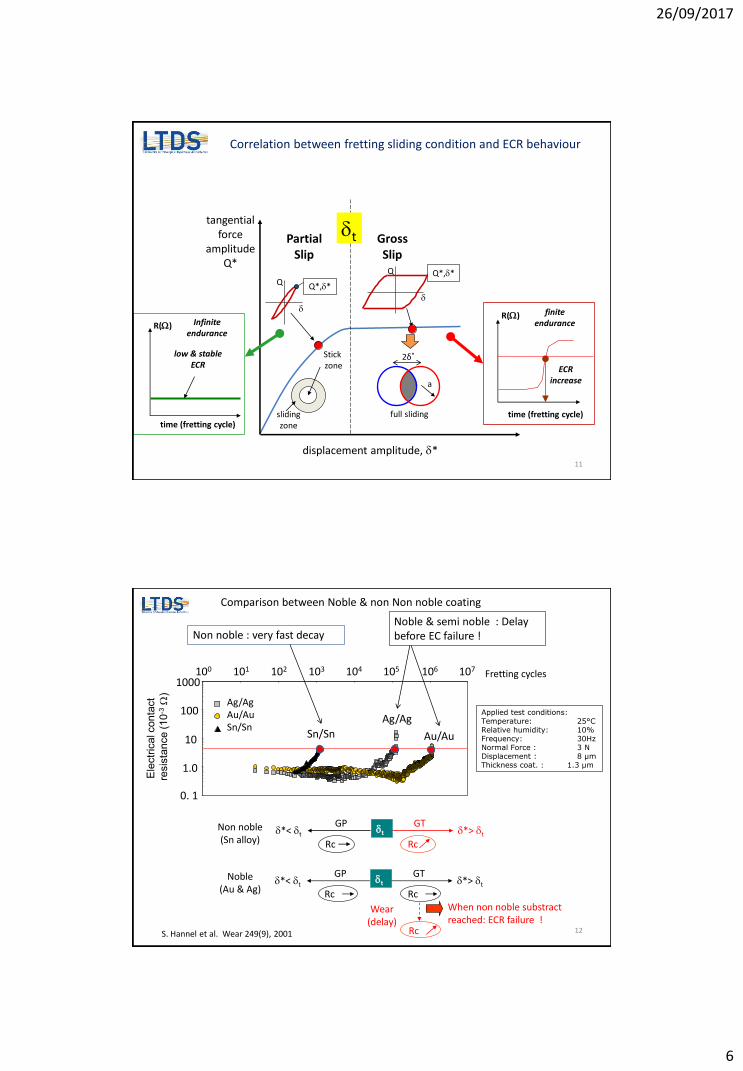
Correlation between fretting sliding condition and ECR behaviour
displacement amplitude, *
Stick zone
sliding zone
Partial Slip
Q Q*,*
R()
time (fretting cycle)
low & stable ECR
Infinite endurance
full sliding
Q
2δ*
a
Gross Slip
t
Q*,*
R()
time (fretting cycle)
finite endurance
ECR increase
tangential force
amplitude Q*
1.0
10
100
1000
Ag/Ag Au/Au Sn/Sn
Fretting cycles
Ele
ctr
ical c
onta
ct
resis
tance (
10
-3
)
0. 1
101 102 103 104 105 106 107 100
Sn/Sn
Ag/Ag
Au/Au
Comparison between Noble & non Non noble coating
Non noble : very fast decay
Applied test conditions: Temperature: 25°C Relative humidity: 10% Frequency: 30Hz Normal Force : 3 N Displacement : 8 µm Thickness coat. : 1.3 µm
Noble & semi noble : Delay before EC failure !
GT GP
Rc Rc
*< t *> t t
GT GP
Rc
Rc
*< t *> t t
Rc When non noble substract reached: ECR failure !
Wear (delay)
Non noble (Sn alloy)
Noble (Au & Ag)
12 S. Hannel et al. Wear 249(9), 2001

26/09/2017
7
2. Quantification of Nc (Electrical Contact Endurance) versus displacement & sliding amplitude ?
13
0
5
10
15
20
25
30
1 100 10000 1000000 1E+08
t_Au= 5µm
Finite endurance Domain (GS)
Infinite endurance Domain (PS)
Ap
plie
d d
isp
lace
men
t am
plit
ud
e
(µ
m)
fretting cycles, Nc (ΔR>4mΩ)
Au/Au interface
Electrical Endurances a function of the applied displacement amplitude
Asymptotic decreasing of NC (DRc=0.004 threshold): the larger the displacement the smaller the ECR endurance Nc
Applied test conditions: Temperature: 25°C Relative humidity: 10% Frequency: 30Hz Normal Force : 3 N Thickness coat. : 1.3 µm
14

26/09/2017
8
Quantification of the electrical endurance Curve : ”Fatigue like” approach :
perfect correlation between experiments and the exponential formulation (only 3 variables : δt , n, Ncδ
0
5
10
15
20
25
30
1 100 10000 1000000 1E+08 1E+10
fretting cycles, Nc (ΔR>4mΩ)
app
lied
dis
pla
cem
ent
amp
litu
de:
*
(µm
) n
t
NcNc
)(
*
y = -3.1898x + 16.748
R²= 0.9904
0
2
4
6
8
10
12
14
16
18
0 0.5 1 1.5 2 2.5 3
ln(N
c)
application to Au/Au interface
)ln( *
t
B
-n
BnNc t )ln()ln( *
With n = 3.18, B = 16.8 and µmt 5
Power law n
t
NcNc
)(
*
exp(B)
1µm) ( *
twhenNcNc
15 S. Fouvry et al. Wear 271 (9–10), (2011)
Comparison between coatings
- Small difference between δt transitions - Large difference between non noble Sn and noble Au&Ag ECR endurances - All the ECR endurance can be formalised using a simple power law function
Applied test conditions: Temperature: 25°C Relative humidity: 10% Frequency: 30Hz Normal Force : 3 N Thickness coat. : 1.3 µm
16 S. Fouvry et al. Wear 271 (9–10), (2011)
26/09/2017
9
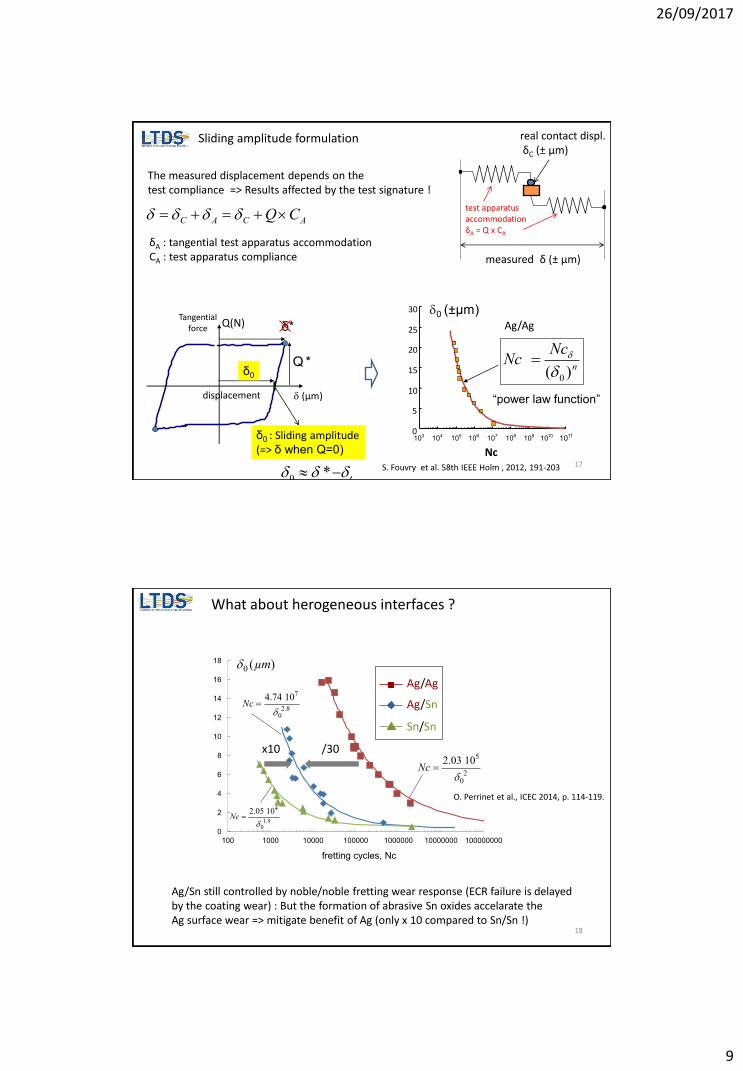
Sliding amplitude formulation
The measured displacement depends on the test compliance => Results affected by the test signature !
measured δ (± µm)
real contact displ. δC (± µm)
test apparatus accommodation δA = Q x CA
ACAC CQ
δA : tangential test apparatus accommodation CA : test apparatus compliance
310 410 510 610 710 810 910 1010
Nc
0
5
10
15
20
25
30
1110
n
NcNc
)( 0
0 (±µm)
“power law function”
Ag/Ag Q(N)
(µm) displacement
Tangential force
*Q
δ*
δ0
δ0 : Sliding amplitude (=> δ when Q=0)
t *0
17 S. Fouvry et al. 58th IEEE Holm , 2012, 191-203
18
What about herogeneous interfaces ?
0
2
4
6
8
10
12
14
16
18
100 1000 10000 100000 1000000 10000000 100000000
fretting cycles, Nc
x10 /30
0 ( )µm
4
1.90
2.05 10Nc
5
20
2.03 10Nc
Ag/Ag
Sn/Sn
Ag/Sn7
2.80
4.74 10Nc
Ag/Sn still controlled by noble/noble fretting wear response (ECR failure is delayed by the coating wear) : But the formation of abrasive Sn oxides accelarate the Ag surface wear => mitigate benefit of Ag (only x 10 compared to Sn/Sn !)
O. Perrinet et al., ICEC 2014, p. 114-119.
26/09/2017
10
3. Correlation between fretting damage (surface wear & oxide debris)
& Electrical behavior
19
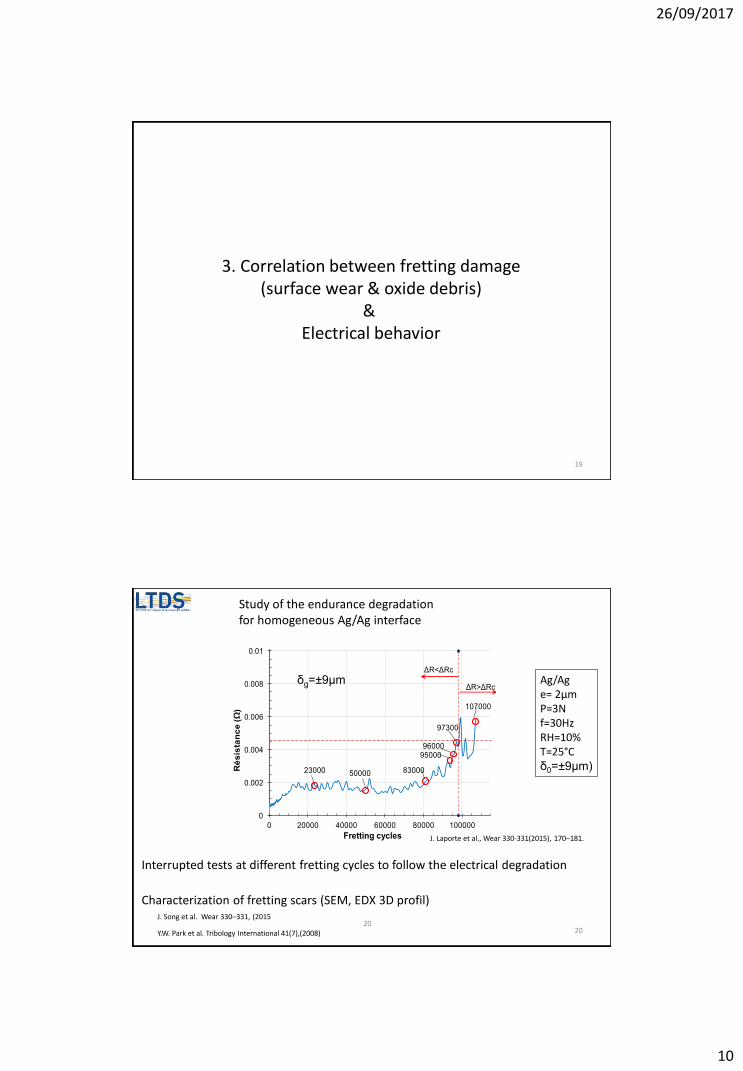
Study of the endurance degradation for homogeneous Ag/Ag interface
0
0.002
0.004
0.006
0.008
0.01
0 20000 40000 60000 80000 100000
Ré
sis
tan
ce
(Ω
)
Fretting cycles
23000 50000 83000
9500096000
107000
97300
ΔR<ΔRc
ΔR>ΔRc
Interrupted tests at different fretting cycles to follow the electrical degradation
Characterization of fretting scars (SEM, EDX 3D profil)
δg= 9µm Ag/Ag e= 2µm P=3N f=30Hz RH=10% T=25°C δ0= 9µm)
20 20
J. Song et al. Wear 330–331, (2015
Y.W. Park et al. Tribology International 41(7),(2008)
J. Laporte et al., Wear 330-331(2015), 170–181.

26/09/2017
11
ΔR>ΔRc=4mΩΔR<ΔRc=4mΩ
N=40000 cycles
R=0,48mΩ
Nc=87000 cycles
R=5,04mΩ
N=10000 cycles
R=0,58mΩ
N=1025 cycles
R=0,13mΩ
Inférieur
Supérieur
δ*g
δ*g
upper specimen
lower specimen
Investigation of fretting wear damages
0
1
2
3
4
5
6
7
8
9
10
0 20 000 40 000 60 000 80 000 100 000
ΔR<ΔRc
ΔR>ΔRc
Nc
20000
1000
5000
10000
40000 60000
80000
87000
R(mΩ)
fretting cycles
Electrical failure Nc: ΔR>ΔRc=4mΩ related to a
threshold chemical composition of debris layer :
when [Ag]0.2<[Ag]th≈5%at & [0]>[0]th > 45%
then ECR failure.
fretting cycles
ECR failure
0
10
20
30
40
50
60
70
80
90
100
0 20000 40000 60000 80000
concentr
atio
n a
t%
O Ag
[O]th= 45at%
100000
[Ag]th= 5at%
EDX analysis in the central zone (20% of fretting scar)
Øa
Øc Øa=0,2.Øc
21 S. Fouvry et al. Wear, 271 (9-10), 2011, 1524-1534.
J. Laporte et al., Wear 330-331 (2015), 170–181.
0
10
20
30
40
50
60
0 200000 400000 600000 800000 1000000
co
nc
en
tra
tio
n (
At.
%)
ECR endurance, Nc (cycles)
[O]%
[Ag]%
[O]th=45At.% 5At.%
[Ag]th=5At.% 3.5At.%
Øf
averaged
EDX analysis
d = 0.2 Øf
Stable if similar area is analyzed (inner 20% of the fretting scar radius observed At the Nc ECR failure)
Ag/Ag, e=2µm, P=3N, f=30Hz, T=25°C, RH=10%, δ0=±4µm to ±16.75µm
Stability of the proposal ?
22
[Ag]
[Ni]
[0]
[Cu]
EDX mapping
upper
lower
upper
lower
upper
lower
upper
lower
ΔR< ΔRc ΔR>ΔRc

26/09/2017
12
Investigation of fretting wear damages EDX Analysis at the Nc failure
Fretting scar at Nc (ECR failure)
The most stable criterion [O]th = 45 At.%
23/19
The ECR failure is reached when the fretting scar is fully covered by an oxide debris layer
0.00
5.00
10.00
15.00
20.00
25.00
30.00
35.00
40.00
45.00
50.00
0 0.2 0.4 0.6 0.8 1
d/Øf
[O]
[Ag]
At. %
Øf
d diameter of EDX spot
J. Laporte et al., Wear 330-331 (2015), 170–181.
Investigation of fretting wear damages EDX Analysis at the Nc failure
Chemical concentration profiles at the ECR failure (Nc)
Ag
Ni
Cu
0
10
20
30
40
50
60
70
80
90
100
0 200 400 600 800
Co
ncen
trati
on
(A
t.%
)
Position in the fretting track (µm)
NiOAgCu
Fretting track
Analysis zone e=1µm
24/19
The Nc failure (ΔR>ΔRc=4mΩ) is reached when Ag is remove from the center of the fretting scar (still present in the lateral sides)
Test conditions: P=3N δ0= 9µm
RH=10%
f=30Hz
T=25°C
e=2µm
EDX scan
A. Kassmann Rudolphi et al. Wear 201, (1996)
S. Noël et al. Proc. 52nd IEEE Holm, (2006)
J. Laporte et al., Wear 330-331 (2015), 170–181.
26/09/2017
13
4. Quantification using a friction energy wear approach
25
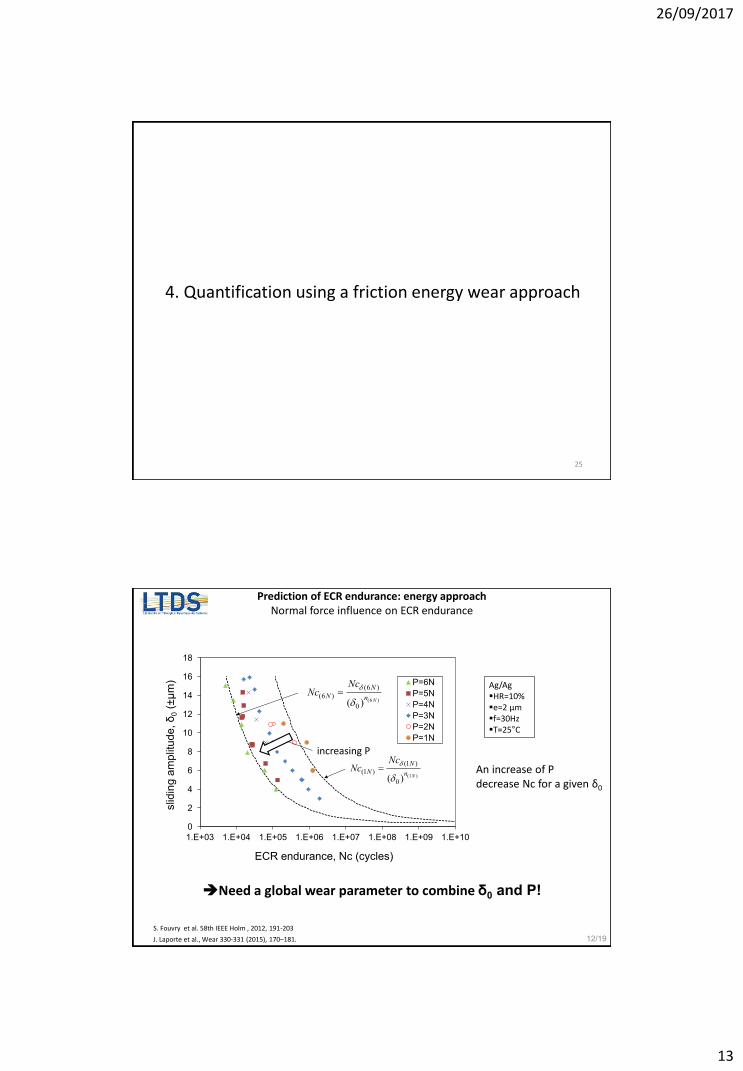
Prediction of ECR endurance: energy approach Normal force influence on ECR endurance
12/19
Need a global wear parameter to combine δ0 and P!
Ag/Ag HR=10% e=2 µm f=30Hz T=25°C
0
2
4
6
8
10
12
14
16
18
1.E+03 1.E+04 1.E+05 1.E+06 1.E+07 1.E+08 1.E+09 1.E+10
slid
ing
am
plit
ude
, δ
0(
µm
)
ECR endurance, Nc (cycles)
P=6N
P=5N
P=4N
P=3N
P=2N
P=1N
(6 )
(6 )
(6 )
0( )
N
N
N n
NcNc
(1 )
(1 )
(1 )
0( )
N
N
N n
NcNc
increasing P
An increase of P decrease Nc for a given δ0
S. Fouvry et al. 58th IEEE Holm , 2012, 191-203
J. Laporte et al., Wear 330-331 (2015), 170–181.
26/09/2017
14
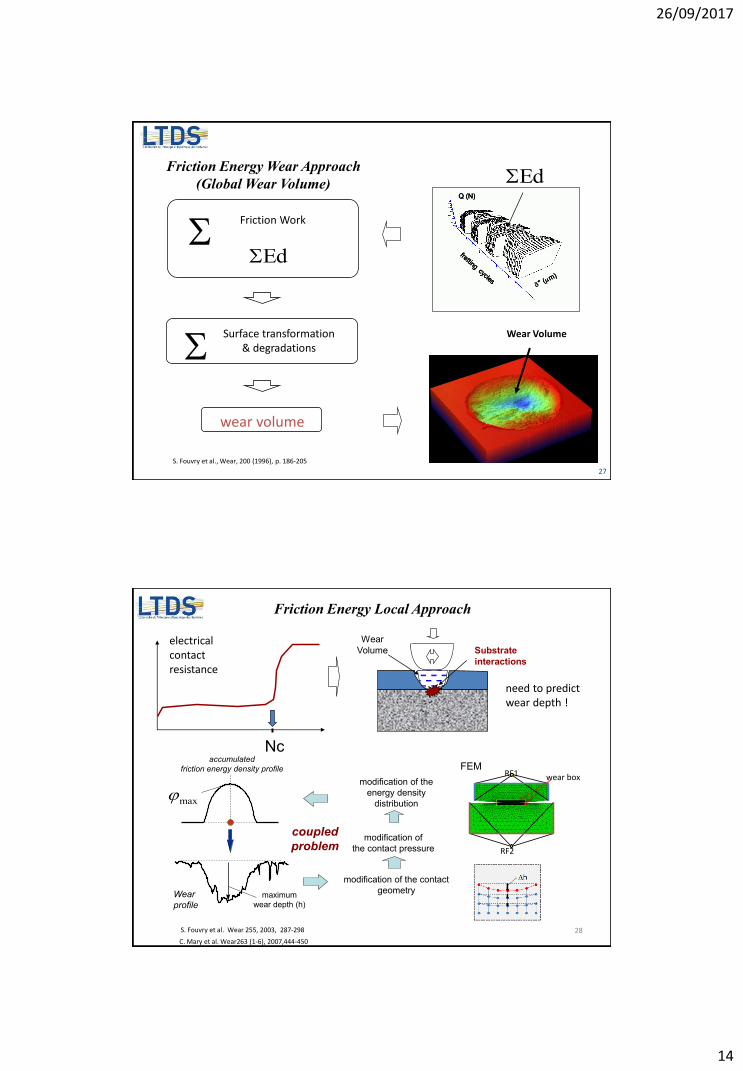
Friction Energy Wear Approach
(Global Wear Volume)
Friction Work
S
Surface transformation & degradations S
wear volume
EdS
EdS
Wear Volume
Q (N)
* (m)
frettingcycles
Q (N)
* (m)
frettingcycles
Q (N)
* (m)
frettingcycles
Q (N)
* (m)
frettingcycles
Q (N)
* (m)
frettingcycles
Q (N)
* (m)
frettingcycles
27
S. Fouvry et al., Wear, 200 (1996), p. 186-205
maximum
wear depth (h)
accumulated
friction energy density profile
modification of the contact
geometry
modification of
the contact pressure
modification of the
energy density
distribution
coupled
problem
max
Wear
profile
FEMRF1
RF2
wear box
Nc
electrical contact resistance
Wear
Volume Substrate
interactions
need to predict wear depth !
Friction Energy Local Approach
28 S. Fouvry et al. Wear 255, 2003, 287-298
C. Mary et al. Wear263 (1-6), 2007,444-450

26/09/2017
15
Prediction of ECR endurance: energy approach Application of friction energy approach
Nc prediction requires a local wear approach
z (µm)
)(xmax
maxh
Wear Profile
energy density
with wear ϕ(x) converge to a flat profile
Very nice prediction
(low dispersion)
0
200000
400000
600000
800000
1000000
1200000
1400000
1600000
1800000
2000000
0 1000 2000 3000
φf = Ed/Af (J/m²/cycle)
P=6NP=5NP=4NP=3NP=2NP=1N
𝑁𝑐 = 𝑁𝑐0.𝜑𝑓𝛽
Nc0=6.1012cycles
and β=-2.58
Nc (cycles)
Ag/Ag HR=10% e=2 µm f=30Hz T=25°C
)( f
NcNc
Ncϕ= 6 1012 cycles β=2.58
Af=A final
fretting loop
contact area
ff
Ed
A
29 C. Mary et al. Wear 263 J. Laporte et al., Wear 330-331 (2015), 170–181.
Prediction of ECR endurance: energy approach Simplified approximation
Possibility to approximate Af using a single power law function of normal force: with A0=72,600 µm² and m=0.256
Previous analysis requires the measurement of Af (long & fastidious)
0
20000
40000
60000
80000
100000
120000
140000
160000
0 2 4 6 8
P(N)
A (µm²)
𝐴𝑓 = 𝐴0 .𝑃𝑚
The analysis requires the computation of Ed! (integrale of the frettting loop) Considering a quadratic shape:
04Ed P
µ.P
02
30 Ed
26/09/2017
16
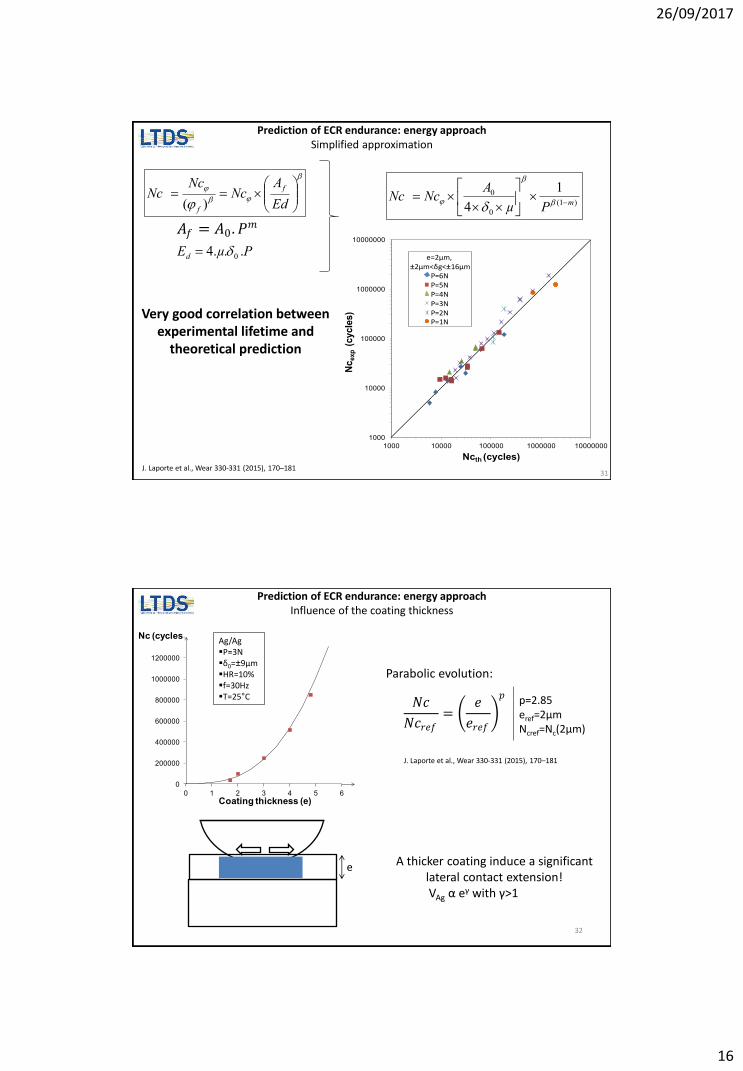
Prediction of ECR endurance: energy approach Simplified approximation
1000
10000
100000
1000000
10000000
1000 10000 100000 1000000 10000000
Nc
exp
(cycle
s)
Ncth (cycles)
e=2µm, 2µm<δg< 16µm
P=6NP=5NP=4NP=3NP=2NP=1N
Very good correlation between experimental lifetime and
theoretical prediction
𝐴𝑓 = 𝐴0 .𝑃𝑚
Ed
ANc
NcNc
f
f )( )1(
0
0 1
4 mPµ
ANcNc
31 J. Laporte et al., Wear 330-331 (2015), 170–181
PµEd ...4 0
Prediction of ECR endurance: energy approach Influence of the coating thickness
32
A thicker coating induce a significant lateral contact extension!
VAg α eγ with γ>1
e
Parabolic evolution:
𝑁𝑐
𝑁𝑐𝑟𝑒𝑓=
𝑒
𝑒𝑟𝑒𝑓
𝑝
p=2.85 eref=2µm Ncref=Nc(2µm)
0
200000
400000
600000
800000
1000000
1200000
1400000
0 1 2 3 4 5 6
Coating thickness (e)
Nc (cyclesAg/Ag P=3N δ0= 9µm HR=10% f=30Hz T=25°C
J. Laporte et al., Wear 330-331 (2015), 170–181
26/09/2017
17
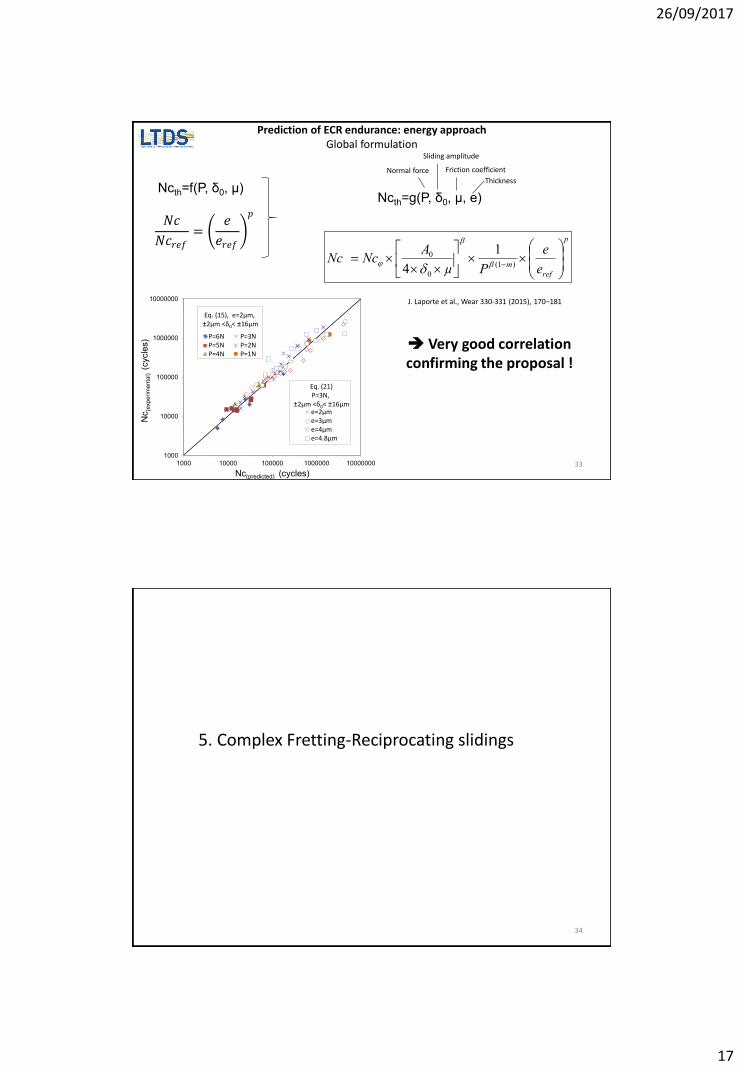
Prediction of ECR endurance: energy approach Global formulation
Very good correlation confirming the proposal !
Ncth=f(P, δ0, µ)
𝑁𝑐
𝑁𝑐𝑟𝑒𝑓=
𝑒
𝑒𝑟𝑒𝑓
𝑝
Ncth=g(P, δ0, µ, e)
Normal force
Sliding amplitude
Friction coefficient
Thickness
1000
10000
100000
1000000
10000000
1000 10000 100000 1000000 10000000
Nc
(experi
me
nta
l) (c
ycle
s)
Nc(predicted) (cycles)
e=2µme=3µme=4µme=4.8µm
Eq. (21)P=3N,
2µm <δ0< 16µm
Eq. (15), e=2µm, 2µm <δ0< 16µm
P=6NP=5NP=4N
P=3NP=2NP=1N
p
ref
m e
e
Pµ
ANcNc
)1(
0
0 1
4
33
J. Laporte et al., Wear 330-331 (2015), 170–181
5. Complex Fretting-Reciprocating slidings
34

26/09/2017
18
before insertion after insertion
repetitive insertions
Surface degradations
Influence of repetitive clipping & uncliping slidings
pin
clip flexible
?
0.0001
0.001
0.01
0.1
1
0 100000 200000
R [Ω
]
Nombre de cycles N
electrical failure
Nc Nc
pin
clip flexible
35
tangentiel forcesensor
flexiblestrips
samples
upper sampleholderflexible
strips weight
electromagneticlinear motor
(reciprocating)
electromagneticshaker
(fretting)
laser sensor
9 µm
ΔR >ΔRc
δ0= 9 µm (30 Hz)
Test stopped when
D
D= 250µm to 1 500µm vGC,ref= 8,3µm.s-1 to 124,5µm.s-1
fretting Nf 5 000 à 60 000cycles
Ag/Ag HR=10% e=2 µm f=30Hz T=25°C
Experimental strategy
Real clip assembly
fretting track
reciprocating track
J. Laporte et al., Wear 376-377 (2017) 656–669.
26/09/2017
19
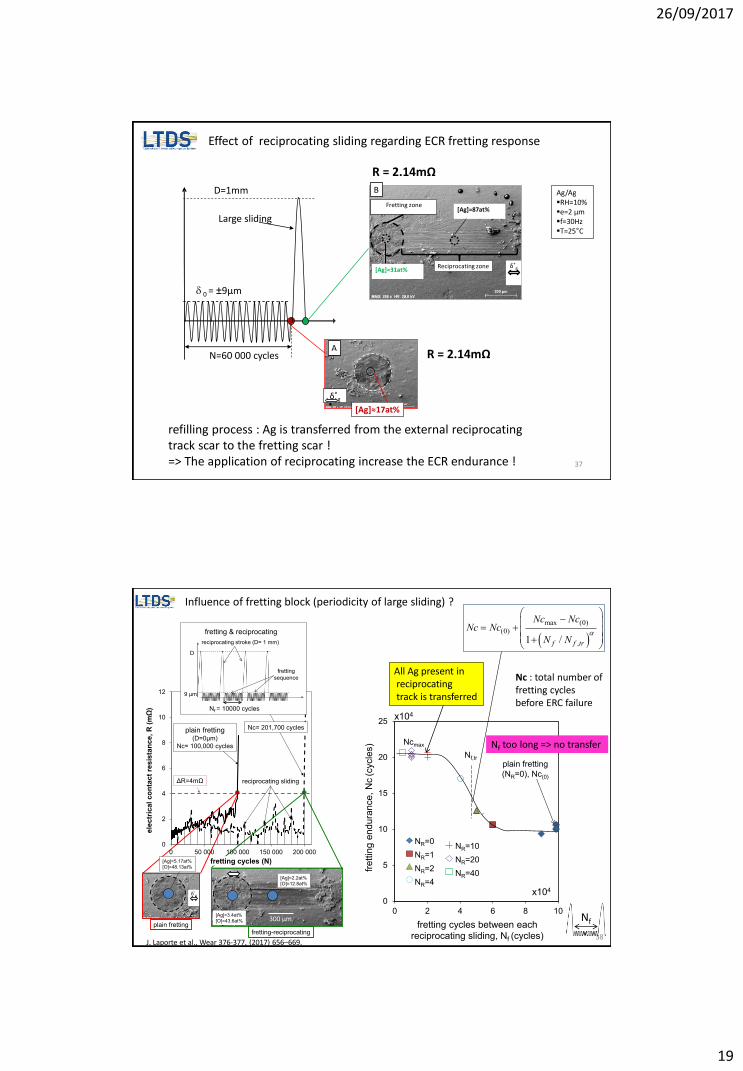
N=60 000 cycles
0 = 9µm
Large sliding
D=1mm
R = 2.14mΩ A
δ*g
[Ag]≈17at%
δ*g
Fretting zone
Reciprocating zone [Ag]≈31at%
[Ag]≈87at%
refilling process : Ag is transferred from the external reciprocating track scar to the fretting scar ! => The application of reciprocating increase the ECR endurance !
Ag/Ag RH=10% e=2 µm f=30Hz T=25°C
Effect of reciprocating sliding regarding ECR fretting response
37
R = 2.14mΩ
B
plain frettingfretting-reciprocating
δ*g
δ0
0
2
4
6
8
10
12
0 50 000 100 000 150 000 200 000
fretting cycles (N)
ΔR=4mΩ
plain fretting(D=0µm)
Nc= 100,000 cycles
reciprocating sliding
ele
ctr
ical
co
nta
ct
res
ista
nc
e,
R (
mΩ
) Nf = 10000 cycles
Fretting
N cycles
D
9 µm
reciprocating stroke (D= 1 mm)
fretting
sequence
fretting & reciprocating
Nc= 201,700 cycles
300 µm
[Ag]=2.2at%
[O]=12.8at%
[Ag]=3.4at%
[O]=43.6at%
[Ag]=5.17at%
[O]=48.13at%
All Ag present in reciprocating track is transferred
max (0)
(0)
,1 /f f tr
Nc NcNc Nc
N N
0
5
10
15
20
25
0 2 4 6 8 10
x 1
00
00
Nf,tr
plain fretting
(NR=0), Nc(0)
Ncmax
x104
x104
NR=0
NR=1
NR=2
NR=4
NR=10
NR=20
NR=40
fre
ttin
ge
nd
ura
nce
, N
c(c
ycle
s)
(Eq.23)
fretting cycles between eachreciprocating sliding, Nf (cycles)
Nf too long => no transfer
Influence of fretting block (periodicity of large sliding) ?
38 J. Laporte et al., Wear 376-377, (2017) 656–669.
Nf
Nc : total number of fretting cycles before ERC failure

26/09/2017
20
39
Influence of reciprocating stroke ?
0
5
10
15
20
25
30
35
40
0 250 500 750 1,000 1,250 1,500 1,750
x 10
000
reciprocating stroke, D (µm)
Dc
Dth
plain fretting,
NcPF
x104
fre
ttin
g e
nd
ura
nce
, Nc
(cyc
les)
Non monotonic evolution
Nc prediction (global formulation)
40
Vc : total Ag volume involved in fretting wear process
0
1
2
3
4
5
6
7
8
9
10
0 500 1,000 1,500 2,000
reciprocating stroke, D (µm)Dth
Steady-state
PFfV ,
ccf
NVV
we
ar
rate
,
(µ
m3/
cycl
e)
Nf=Nf,ref =10,000cycles250µm D 1,500µmplain fretting
PFfreff VhV ,,
determined for Dref=1mm
with h=1.66
v
tr
PFf
D
D
hhVV
1
1,
VcV
Nc
(µm3/cy.)
[ ]2
f
Ag fVc k V k e D
wear rate
1
,
*
,1
1
124
v
tr
w
trf
f
f
gPFf
fcc
D
D
hh
N
N
D
PK
ek
V
VN
0
5
10
15
20
25
30
35
40
0 10 20 30 40
Nc e
xp
(cyc
les)
Ncpred (cycles)
x104
x104
D=Dref=1mm5,000cycles Nf 60,000cyclesNf=Nf,ref=10,000cycles250µm D 1,500µmplain fretting
V
VcNc
total Ag volume involved in fretting wear process @ Nc
V : wear rate per fretting cycle
J. Laporte et al., Wear 376-377, (2017) 656–669.
k = 0.94 (proportion of volumetric Ag volume involved)

26/09/2017
21
41
6. Simplified strategy to compare coatings : ECR versus Coatings properties ?
Ncref : Reference ECR endurance defined for a reference sliding amplitude δ0=± 9µm
ECR endurance, Nc
δ*0 =±9µm
310 410 510 610 710 810 910 10100
5
10
15
20
25
30
1110
0 (±µm)
“power law function”
δ0=9µm
Ncref
the larger Ncref and _ref , the better the electrical performance !
cold welding index _ref=1/µmax (δ0=9µm)
0.0
0.5
1.0
1.5
2.0
2.5
0 5000 10000 15000
µmax
µ=Q*/P
fretting cycle
Definition of two driving parameters to describe GS ECR endurance & Cold welding
26/09/2017
22
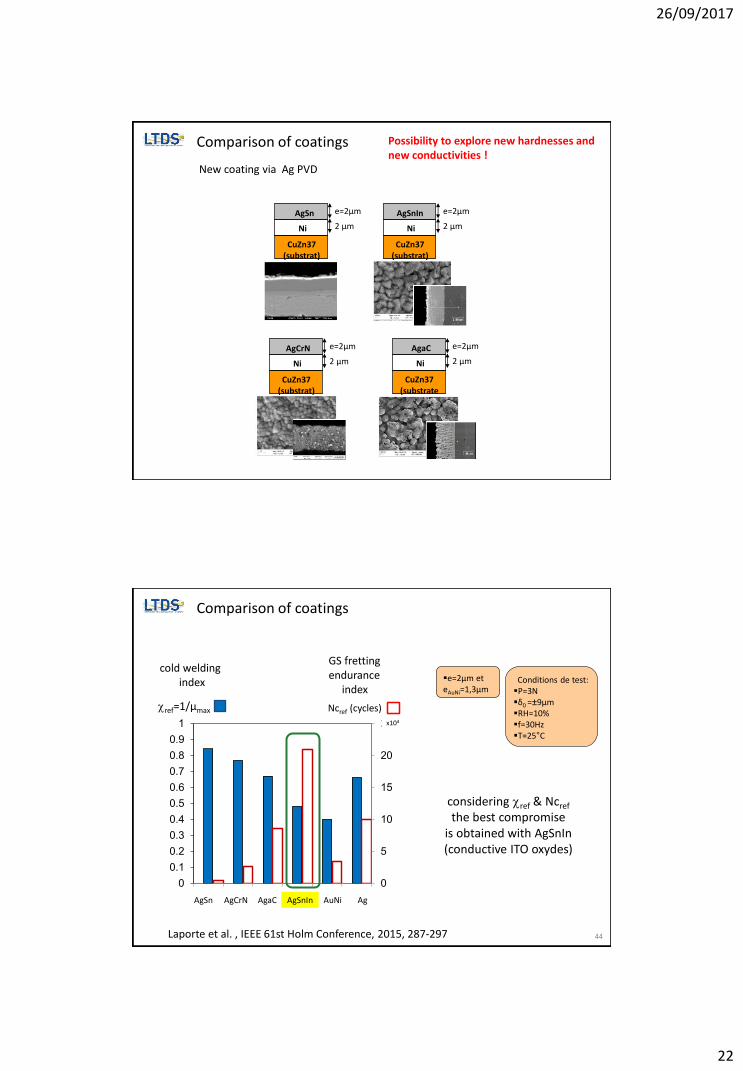
Ni
AgSn
CuZn37 (substrat)
e=2µm
2 µm
Ni
AgCrN
CuZn37 (substrat)
e=2µm
2 µm
Ni
AgSnIn
CuZn37 (substrat)
e=2µm
2 µm
Ni
AgaC
CuZn37 (substrate
e=2µm
2 µm
New coating via Ag PVD
Possibility to explore new hardnesses and new conductivities !
Comparison of coatings
0
5
10
15
20
25
0
0.1
0.2
0.3
0.4
0.5
0.6
0.7
0.8
0.9
1 x10⁴
AuNi AgaC AgCrN AgSn AgSnIn Ag
ref=1/µmax Ncref (cycles)
considering ref & Ncref
the best compromise is obtained with AgSnIn (conductive ITO oxydes)
Conditions de test: P=3N δ0 = 9µm RH=10% f=30Hz T=25°C
e=2µm et eAuNi=1,3µm
44
Comparison of coatings
cold welding index
GS fretting endurance
index
Laporte et al. , IEEE 61st Holm Conference, 2015, 287-297

26/09/2017
23
Correlation of Nc_ref versus Hardness & conductivity
0
5
10
15
20
25
0 100 200 300 400 500
AgSnIn
conductive oxydes (ITO)
Hardness, H (hv)
Nc (x 10000)
Ag
AgaC
AuNi AgCrN
AgSn
High scattering : Hardness is not a relevent parameter
0
5
10
15
20
25
0.00 0.20 0.40 0.60 0.80
electrical conductivity , σ (µS.cm-1)
Nc (x 10000)
AgCrN
AgSn AuNi
AgSnIn
AgaC
conductive oxydes
Ag
Removing (AgSnIn) => Linear increase
)(NcNc VVCNc
CVNc c ≈ Cst (base Argent)
CVNc
NcV
45 Ncref is proportional to the coating conductivity
46
Tribological interpretation :
0
5
10
15
20
25
30
35
40
0 0.2 0.4 0.6 0.8
σ (µS.cm-1)
x104
AgSnIn
AgSn
AgCrN
Ag
AgaC
AuNi
0,NcV
NcVC
VNc (µm3)
the wear volume at the ECR failure is proportional to the coating conductivity
VNc ( x 104 µm3)
The higher the coating electrical conductivity , the larger the wear volume required to reach ECR failure → Nc is proportional to the coating conductivity
0
5
10
15
20
25
30
35
40
45
50
0 50000 100000 150000 200000 250000
KNc=1,82µm3/cycle
AgSnIn
AgSn AgCrN
Ag
AgaC
AuNi
Nc (cycles)
wear volume measured at Nc is proportional to the Nc
VNc ( x 104 µm3)
26/09/2017
24
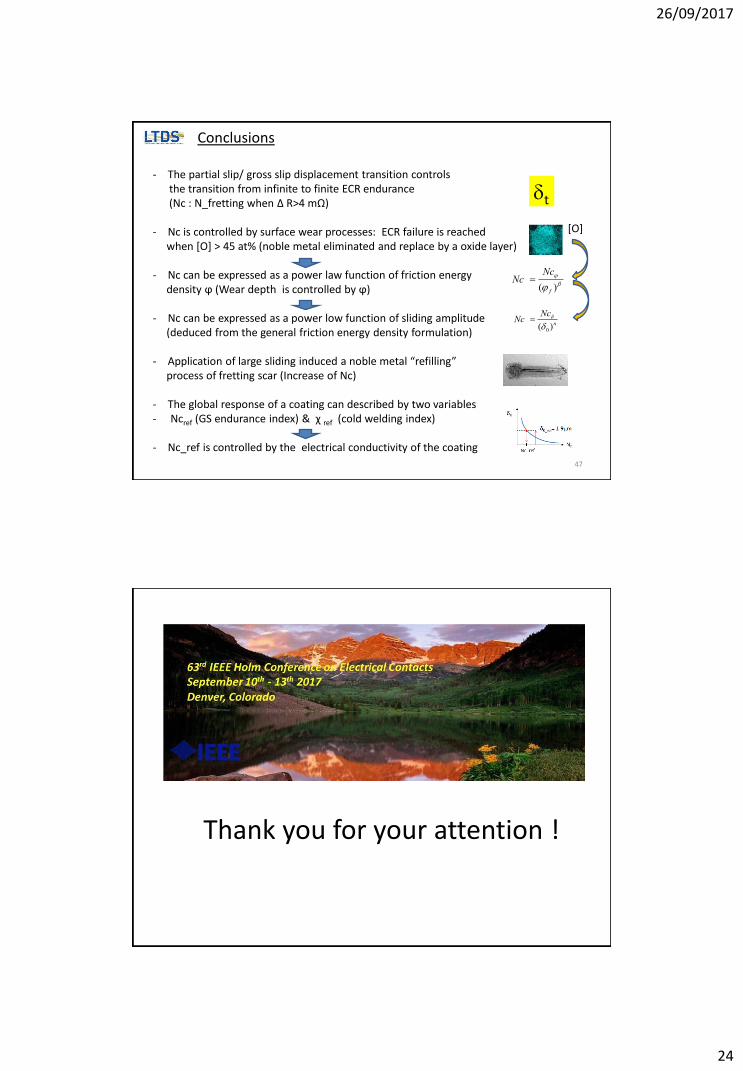
47
Conclusions
- The partial slip/ gross slip displacement transition controls the transition from infinite to finite ECR endurance (Nc : N_fretting when Δ R>4 mΩ) - Nc is controlled by surface wear processes: ECR failure is reached when [O] > 45 at% (noble metal eliminated and replace by a oxide layer) - Nc can be expressed as a power law function of friction energy density ϕ (Wear depth is controlled by ϕ) - Nc can be expressed as a power low function of sliding amplitude (deduced from the general friction energy density formulation)
- Application of large sliding induced a noble metal “refilling” process of fretting scar (Increase of Nc) - The global response of a coating can described by two variables - Ncref (GS endurance index) & χ ref (cold welding index)
- Nc_ref is controlled by the electrical conductivity of the coating
t
[O]
)( f
NcNc
n
NcNc
)( 0
Thank you for your attention !