Embed Size (px)
Citation preview
8/6/2019 Freshwater Use in Wetlands
http://slidepdf.com/reader/full/freshwater-use-in-wetlands 1/11
Selection of (bio) indicators
to assess effects of freshwater
use in wetlands: a case study
of s’Albufera de Mallorca, SpainJ. A. Veraart Æ R. S. de Groot Æ G. Perello Æ N. J. Riddiford Æ R. Roijackers
Abstract Parc Natural s’Albufera de Mallorca is aninternationally recognised resting area for a widearray of migratory birds, and like most wetlands ithas many other ecological functions and socio-economic values. In the catchment, in which thewetland is situated, expanding tourism and
intensification of agriculture place much pressure ona limited amount of freshwater. The freshwatersupply to the wetland decreased due to water-extraction mainly driven by intensification of agriculture in the catchment. As a result saltwaterintrusion increased since 1983–1985. This hadconsiderable impacts on the ecological integrity of the wetland as reflected by changes in the state of theaquatic ecosystem. The distribution of submergedplants, less tolerant of salinity, declined ordisappeared, while the distribution of species,known to prefer high salinity increased. As acontribution to the development of monitoring
programs and management strategies that addressboth socio-economic and natural water demand, thisarticle will formulate ecological criteria to assess thenatural water demand by selection of (bio)indicatorswithin the aquatic ecosystem.
Keywords Freshwater availability Æ Biodiversity ÆWater quality Æ Indicators Æ Submergedmacrophytes Æ s’Albufera de Mallorca
Introduction
In the Mediterranean region expanding tourism and theintensification of agriculture place considerable pressureon freshwater resources and coastal wetland ecosystems.These accumulating pressures may induce changes inecological processes and biodiversity in coastal wetlandsdespite measures of protection and conservation (San-tamaria and Amezaga 1999). These changes, in turn,threaten the continued availability of many ecological
functions and associated socio-economic values to thelocal community and regional economy (de Groot 1992;IUCN 2000).Here we present a case study of Parc Natural s’Albufera, acoastal wetland of 1,700 ha in the northeast of Mallorca,Spain (Fig. 1). The study is used to exemplify the impact of increasing pressures from agriculture and tourism onfreshwater resources and biodiversity in Mallorca. InMallorca 98% of the yearly available freshwater supply (infiltration of precipitation, 241 Hm3yr)1 )was used in1998 (Salamanca and Rodrıguez-Perea 1999). The Balearicgovernment envisages that the current total water demandon Mallorca will increase to 255 Hm3 yr)1 in 2002 and to262 Hm3 yr)1 in 2012 (Salamanca and Rodrıguez-Perea1999). It is clear that the average yearly groundwater re-charge in Mallorca is lower than the anticipated futureyearly freshwater demand.The current Balearic policies try to satisfy the increasingwater demand in two ways (DOT 1997):
– Increase water availability and develop new freshwaterresources. For example, by increasing the capacity of desalinisation factories and import of freshwater fromthe Iberian Peninsula by boats (operacion Barca; GOB1998).
– Optimise the recharge capacity of natural systems
IS48 (all variables in Hm3 yr )1 ):
Received: 13 October 2003 / Accepted: 5 April 2004Published online: 13 May 2004ª Springer-Verlag 2004
J. A. Veraart (&)Climate Change and Biosphere Research Centre,Wageningen UR, p.o Alterra b.v.,P.O. Box 47, 6700 AA Wageningen, the NetherlandsE-mail: [email protected]
R. S. de GrootEnvironmental Systems Analysis Group,Wageningen University
G. Perello Æ N. J. RiddifordThe Albufera International Biodiversity Group (TAIB),Parc Natural s’Albufera de Mallorca
R. RoijackersAquatic Ecology and Water Quality Management Group,Wageningen University
DOI 10.1007/s10113-004-0070-2 Reg Environ Change (2004) 4:107–117 107
Original article
8/6/2019 Freshwater Use in Wetlands
http://slidepdf.com/reader/full/freshwater-use-in-wetlands 2/11
Average groundwater recharge=Average waterexploitation > 1
ð1Þ
In the current sustainability indicator for water use [for-
mula (1)] the effectiveness of the used policy strategy cannot be measured. Further, the indicator does not takeinto account that water is needed to maintain the ecolog-ical integrity of present ecosystems in the Balearic Islands:Coastal wetlands, like s’Albufera de Mallorca need water if they are to maintain all the ecological functions they provide. Ecosystem functions are defined as the capacity of natural processes and components to provide goods andservices that satisfy human needs (directly and/or indi-rectly). Four types of ecological functions can be distin-guished and are often classified (de Groot 1992; de Grootet al. 2000):
– Wetlands regulate water quantity and quality throughstoring water, reducing sediment loads and filteringchemicals out of the water (regulation functions);
– They provide refugia to many species of fish, birds andamphibians and their nursery grounds are essential tomaintain food webs that form the basis of all produc-tivity (habitat functions);
–
They provide natural resources used in regional econ-omy, eg. eel fishery in s’Albufera (production func-tions);
– They provide opportunities for (eco-)tourism, scienceand conservation-education (information functions).
Below a few of the ecological functions of s’AlbuferaNatural Park that are of particular relevance to this study are briefly described:
(a) Water regulations’Albufera is an important recharge area for the aquifer,which in turn is important to irrigation and drinking waterproduction. A healthy (freshwater) wetland ecosystem
reduces salt or brackish water intrusion into the ground-water.
(b) Refugium and nursery functionss’Albufera has many ecological values, both at theregional/national level and internationally. The park is arefuge for several endemic species (eg. the fungus Psa-thyrella halophila) and nationally rare plant and animalspecies (eg. the orchid Orchis laxiflora palustris and the batBarbabastellus barbabastellus). s’Albufera has interna-tionally important breeding populations of several rarebirds (eg. Ardea purpurea, Botaurus stellaris, Acrocephalusmelanopogon) and recent studies have demonstrated that
it has important populations of invertebrate speciesknown from just a few specimens elsewhere (eg. Thefootman moth Pelosia plumosa) or not previously recorded in Europe (the tropical ephydrid Zeros invena-tus), plus a raft of plant and animal species consideredthreatened or endangered at the European or World levelby various conventions or Red Data lists (Riddiford 2004).The wetland together with the coastal dunes represent twoof the most endangered and declining ecosystems in theMediterranean Basin (Vives 1996).At a regional level s’Albufera enhances the biologicaldiversity of Mallorca by providing a gradient of oligoha-line to mixohaline aquatic habitats, which is hardly found
elsewhere on the island.
(c) Water purification and sediment controls’Albufera acts as a sink for agricultural runoff enrichedwith nitrogen and pesticides and runoff from sewagepurification systems enriched with phosphates. Thenutrients and pesticides are absorbed by aquatic vege-tation or removed from the water column by sedimen-tation. This function is important for the marineecosystem of Alcudia Bay and for drinking water quality.High nutrient loads from coastal waters are suspected tohave a negative impact on the seagrass bed ecosystem in
108 Reg Environ Change (2004) 4:107–117
Fig. 1Location of the s’Albufera natural park within its catchment area(640 km2), source: Martınez-Taberner et al. (1990)
Original article
8/6/2019 Freshwater Use in Wetlands
http://slidepdf.com/reader/full/freshwater-use-in-wetlands 3/11
Alcudia Bay (Whittingham 1999). The expansive Posi-donia oceanica seagrass meadow found in the AlcudiaBay is well recognised for its role in sedimentary pro-cesses (Whittingham 1999); the species is endemic to theMediterranean and the meadows support a high primary production (Marba and Duarte 1997). As a result of therole of the Posidonia oceanica seagrass meadow in
sedimentary processes, the biotope provides an impor-tant hydrodynamic barrier, thus protecting the beachesand coastal dunes against erosion.
Approach
As a contribution to the development of monitoring pro-grams and management strategies for sustainable wateruse, we will provide a method for the selection of (bio)indicators within the aquatic ecosystem to assess thenatural water demand in future. We will demonstrate how
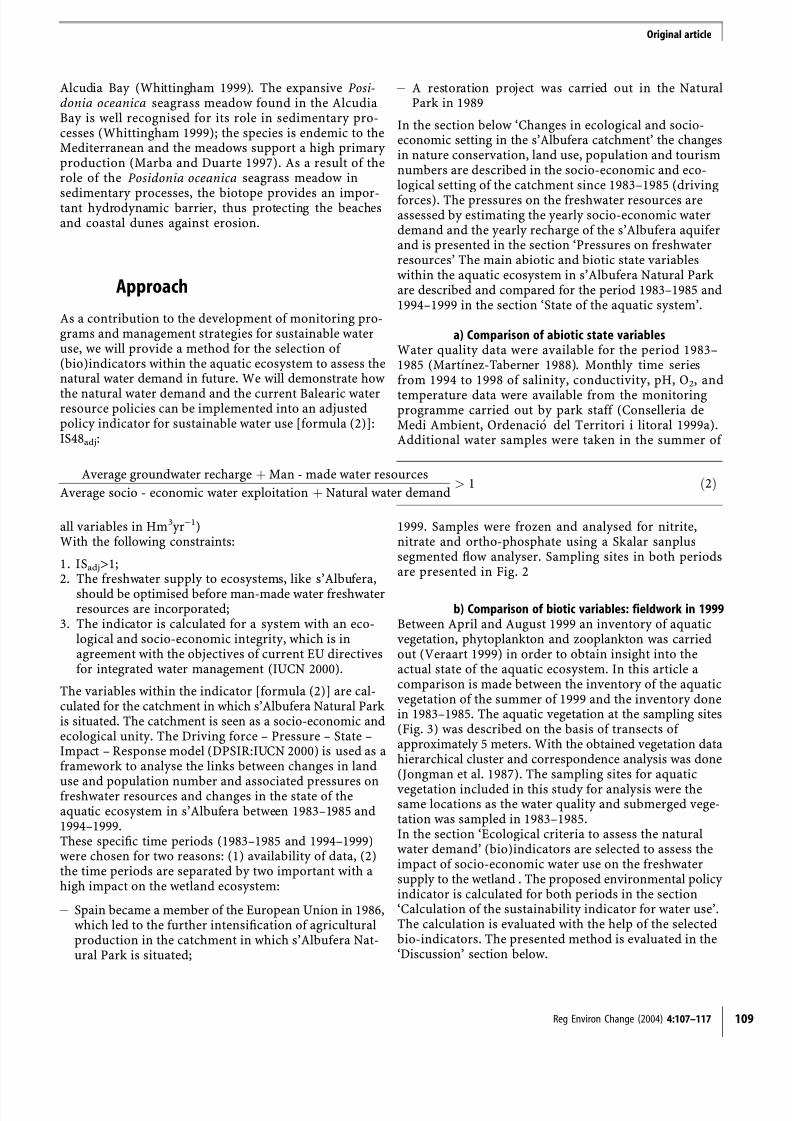
the natural water demand and the current Balearic waterresource policies can be implemented into an adjustedpolicy indicator for sustainable water use [formula (2)]:IS48adj:
all variables in Hm3yr)1)With the following constraints:
1. ISadj>1;2. The freshwater supply to ecosystems, like s’Albufera,
should be optimised before man-made water freshwaterresources are incorporated;
3. The indicator is calculated for a system with an eco-logical and socio-economic integrity, which is inagreement with the objectives of current EU directivesfor integrated water management (IUCN 2000).
The variables within the indicator [formula (2)] are cal-culated for the catchment in which s’Albufera Natural Parkis situated. The catchment is seen as a socio-economic andecological unity. The Driving force – Pressure – State –Impact – Response model (DPSIR:IUCN 2000) is used as aframework to analyse the links between changes in land
use and population number and associated pressures onfreshwater resources and changes in the state of theaquatic ecosystem in s’Albufera between 1983–1985 and1994–1999.These specific time periods (1983–1985 and 1994–1999)were chosen for two reasons: (1) availability of data, (2)the time periods are separated by two important with ahigh impact on the wetland ecosystem:
– Spain became a member of the European Union in 1986,which led to the further intensification of agriculturalproduction in the catchment in which s’Albufera Nat-ural Park is situated;
– A restoration project was carried out in the NaturalPark in 1989
In the section below ‘Changes in ecological and socio-economic setting in the s’Albufera catchment’ the changesin nature conservation, land use, population and tourismnumbers are described in the socio-economic and eco-logical setting of the catchment since 1983–1985 (driving
forces). The pressures on the freshwater resources areassessed by estimating the yearly socio-economic waterdemand and the yearly recharge of the s’Albufera aquiferand is presented in the section ‘Pressures on freshwaterresources’ The main abiotic and biotic state variableswithin the aquatic ecosystem in s’Albufera Natural Parkare described and compared for the period 1983–1985 and1994–1999 in the section ‘State of the aquatic system’.
a) Comparison of abiotic state variablesWater quality data were available for the period 1983–1985 (Martınez-Taberner 1988). Monthly time seriesfrom 1994 to 1998 of salinity, conductivity, pH, O2, and
temperature data were available from the monitoringprogramme carried out by park staff (Conselleria deMedi Ambient, Ordenacio del Territori i litoral 1999a).Additional water samples were taken in the summer of
1999. Samples were frozen and analysed for nitrite,nitrate and ortho-phosphate using a Skalar sanplussegmented flow analyser. Sampling sites in both periodsare presented in Fig. 2
b) Comparison of biotic variables: fieldwork in 1999Between April and August 1999 an inventory of aquaticvegetation, phytoplankton and zooplankton was carriedout (Veraart 1999) in order to obtain insight into theactual state of the aquatic ecosystem. In this article acomparison is made between the inventory of the aquaticvegetation of the summer of 1999 and the inventory donein 1983–1985. The aquatic vegetation at the sampling sites(Fig. 3) was described on the basis of transects of approximately 5 meters. With the obtained vegetation datahierarchical cluster and correspondence analysis was done(Jongman et al. 1987). The sampling sites for aquatic
vegetation included in this study for analysis were thesame locations as the water quality and submerged vege-tation was sampled in 1983–1985.In the section ‘Ecological criteria to assess the naturalwater demand’ (bio)indicators are selected to assess theimpact of socio-economic water use on the freshwatersupply to the wetland . The proposed environmental policy indicator is calculated for both periods in the section‘Calculation of the sustainability indicator for water use’.The calculation is evaluated with the help of the selectedbio-indicators. The presented method is evaluated in the‘Discussion’ section below.
Reg Environ Change (2004) 4:107–117 109
Average groundwater recharge þ Man - made water resources
Average socio - economic water exploitation þ Natural water demand> 1 ð2Þ
Original article
8/6/2019 Freshwater Use in Wetlands
http://slidepdf.com/reader/full/freshwater-use-in-wetlands 4/11110 Reg Environ Change (2004) 4:107–117
Original article
8/6/2019 Freshwater Use in Wetlands
http://slidepdf.com/reader/full/freshwater-use-in-wetlands 5/11
Results
Changes in ecological and socio-economic settingin the s’Albufera catchment
ManagementThe rehabilitation project carried out in1989 was intendedto modify the physical, chemical and ecological charac-teristics of the wetland in such a way that the ecosystemwould revert to into natural succession (Martinez-Taberner et al. 1990). The hydrological (a lotic habitat)and vegetation situation before restoration were a result of
the drainage and agriculture during the past two centuries.The morphology and hydrology of the park prior to thedrainage project of the 19th century served as a guide forrestoration (a lentic habitat with many open water areas).After the restoration the open water area increased to350 ha (20%) thus expanding the range of feeding habitatsfor waterbirds (Conselleria d’Agricultura Pesca 1989;Conselleria de Medi Ambient, Ordenacio del Territori iLitoral 1999a). In the canal system a stagnant habitat wascreated by building dams, sluices and by restoring somecanals to a more natural morphological state.
InhabitantsThe population living in the catchment and the coastalzone are categorised as: (1) permanent (local) inhabitants,(2) seasonal foreign inhabitants and (3) tourists. Foreigninhabitants own houses at Mallorca and stay there oftenthe whole spring and summer. Demographic statistics(Ministerio de Agricultura Pesca y Alimentacion 1988; INE1996) did not distinguish seasonal nor permanent inhab-
itants. The presented numbers in Table 1 were derived by extrapolation of available data (Veraart 1999).It can be derived from Table 1 that the number of per-manent inhabitants grew from 26 to 35% between 1986and 1996. Tourist and seasonal inhabitant numbers grew from 21 to 38% (Table 1).
Land useThe wetland is bordered by agricultural fields on its westand southwest flanks, while in the north, urban and touristdevelopments extend to the border of the park (Fig. 1).The lowland catchment is the most intensively farmed on
Mallorca because of the year-round access to groundwaterclose to the surface, the organically rich soils and thegeneral absence of winter frosts (Earthwatch 1991). Cere-als, potatoes, artichokes, onions and tomatoes are cur-rently the principal cultivated crops. The crops areproduced at small farms with a low input of machinery.The land use in the upland catchment (between Inca andSanta Maria) consists mostly of almond, olive and citrusorchards.
Reg Environ Change (2004) 4:107–117 111
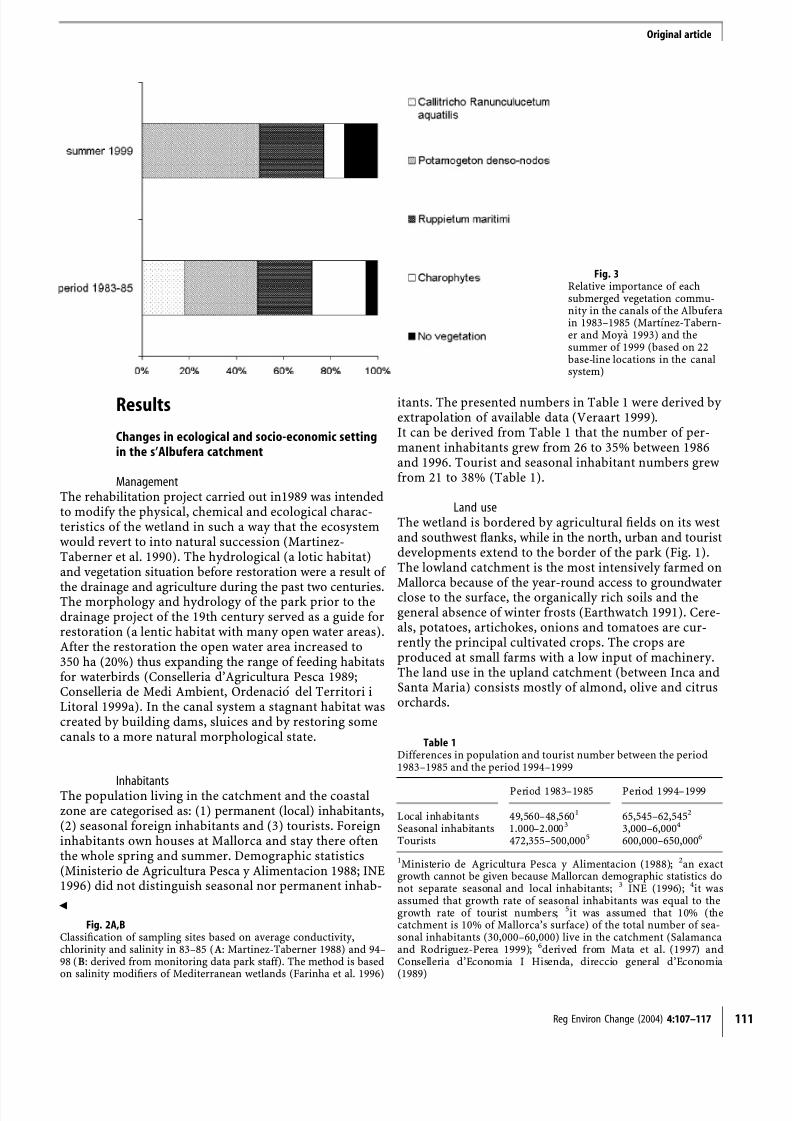
Fig. 3Relative importance of eachsubmerged vegetation commu-nity in the canals of the Albuferain 1983–1985 (Martınez-Tabern-er and Moya 1993) and thesummer of 1999 (based on 22base-line locations in the canalsystem)
Table 1Differences in population and tourist number between the period1983–1985 and the period 1994–1999
Period 1983–1985 Period 1994–1999
Local inhabitants 49,560–48,5601 65,545–62,5452
Seasonal inhabitants 1.000–2.0003 3,000–6,0004
Tourists 472,355–500,0005 600,000–650,0006
1Ministerio de Agricultura Pesca y Alimentacion (1988); 2an exactgrowth cannot be given because Mallorcan demographic statistics donot separate seasonal and local inhabitants; 3 INE (1996); 4it wasassumed that growth rate of seasonal inhabitants was equal to thegrowth rate of tourist numbers; 5it was assumed that 10% (thecatchment is 10% of Mallorca’s surface) of the total number of sea-sonal inhabitants (30,000–60,000) live in the catchment (Salamancaand Rodriguez-Perea 1999); 6derived from Mata et al. (1997) andConselleria d’Economia I Hisenda, direccio general d’Economia(1989)
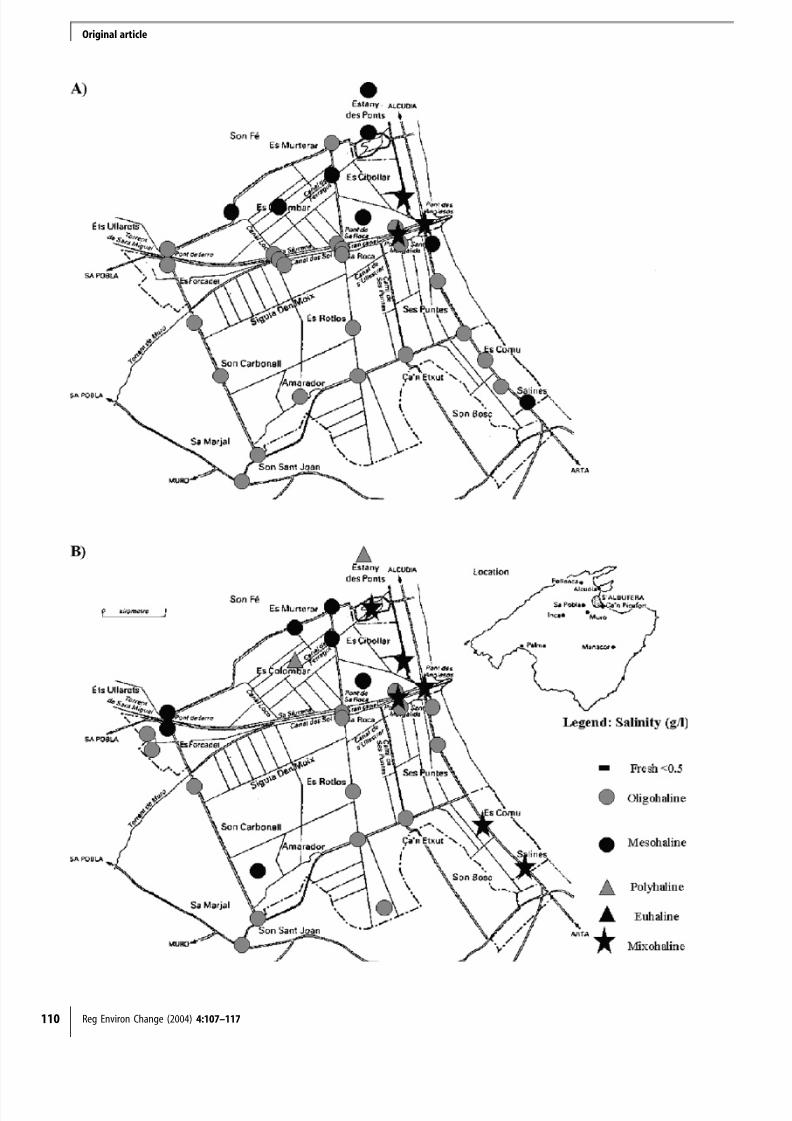
Fig. 2A,BClassification of sampling sites based on average conductivity,chlorinity and salinity in 83–85 (A: Martinez-Taberner 1988) and 94–98 (B: derived from monitoring data park staff). The method is basedon salinity modifiers of Mediterranean wetlands (Farinha et al. 1996)
b
Original article
8/6/2019 Freshwater Use in Wetlands
http://slidepdf.com/reader/full/freshwater-use-in-wetlands 6/11
Land use changes in the period 1983–1985 and 1994–1999are presented in Table 2. From Table 2 it is clear thatintensive agriculture expanded at the expense of fruitcultivation.
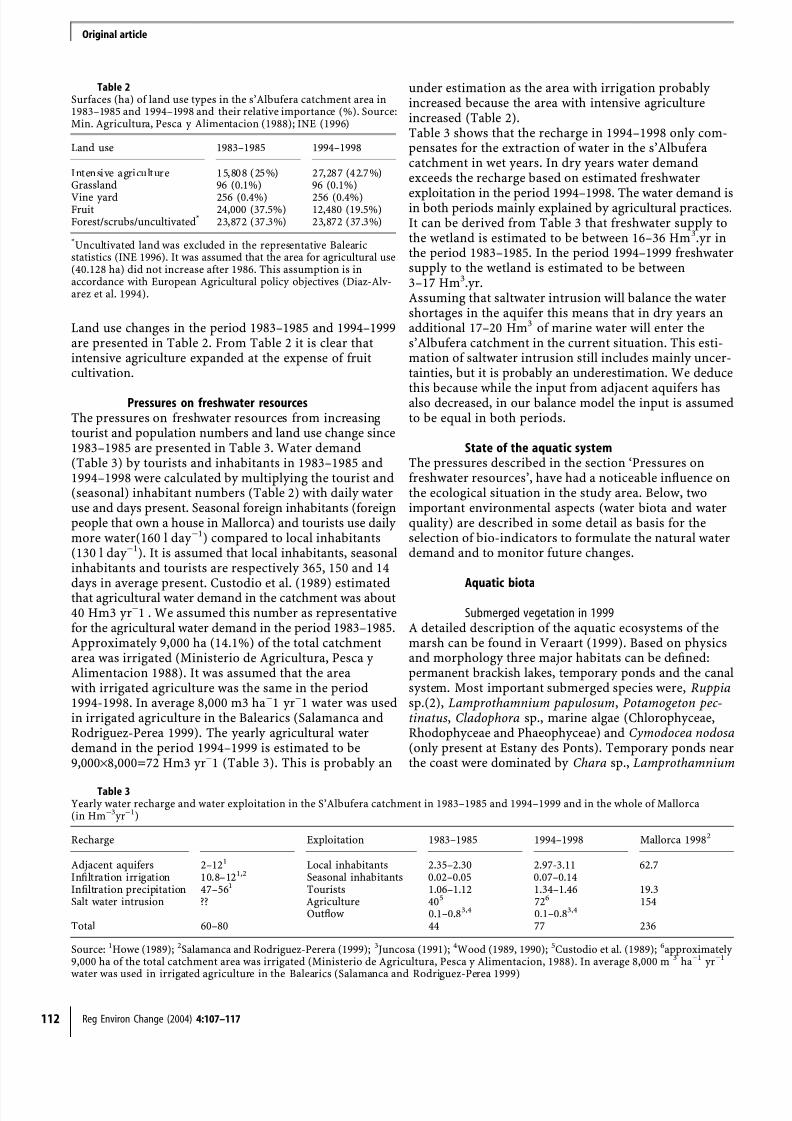
Pressures on freshwater resourcesThe pressures on freshwater resources from increasingtourist and population numbers and land use change since1983–1985 are presented in Table 3. Water demand(Table 3) by tourists and inhabitants in 1983–1985 and1994–1998 were calculated by multiplying the tourist and(seasonal) inhabitant numbers (Table 2) with daily wateruse and days present. Seasonal foreign inhabitants (foreignpeople that own a house in Mallorca) and tourists use daily more water(160 l day )1) compared to local inhabitants(130 l day )1). It is assumed that local inhabitants, seasonalinhabitants and tourists are respectively 365, 150 and 14
days in average present. Custodio et al. (1989) estimatedthat agricultural water demand in the catchment was about40 Hm3 yr)1 . We assumed this number as representativefor the agricultural water demand in the period 1983–1985.Approximately 9,000 ha (14.1%) of the total catchmentarea was irrigated (Ministerio de Agricultura, Pesca y Alimentacion 1988). It was assumed that the areawith irrigated agriculture was the same in the period1994-1998. In average 8,000 m3 ha)1 yr)1 water was usedin irrigated agriculture in the Balearics (Salamanca andRodriguez-Perea 1999). The yearly agricultural waterdemand in the period 1994–1999 is estimated to be9,000·8,000=72 Hm3 yr)1 (Table 3). This is probably an
under estimation as the area with irrigation probably increased because the area with intensive agricultureincreased (Table 2).Table 3 shows that the recharge in 1994–1998 only com-pensates for the extraction of water in the s’Albuferacatchment in wet years. In dry years water demandexceeds the recharge based on estimated freshwater
exploitation in the period 1994–1998. The water demand isin both periods mainly explained by agricultural practices.It can be derived from Table 3 that freshwater supply tothe wetland is estimated to be between 16–36 Hm3.yr inthe period 1983–1985. In the period 1994–1999 freshwatersupply to the wetland is estimated to be between3–17 Hm3.yr.Assuming that saltwater intrusion will balance the watershortages in the aquifer this means that in dry years anadditional 17–20 Hm3 of marine water will enter thes’Albufera catchment in the current situation. This esti-mation of saltwater intrusion still includes mainly uncer-tainties, but it is probably an underestimation. We deduce
this because while the input from adjacent aquifers hasalso decreased, in our balance model the input is assumedto be equal in both periods.
State of the aquatic systemThe pressures described in the section ‘Pressures onfreshwater resources’, have had a noticeable influence onthe ecological situation in the study area. Below, twoimportant environmental aspects (water biota and waterquality) are described in some detail as basis for theselection of bio-indicators to formulate the natural waterdemand and to monitor future changes.
Aquatic biota
Submerged vegetation in 1999A detailed description of the aquatic ecosystems of themarsh can be found in Veraart (1999). Based on physicsand morphology three major habitats can be defined:permanent brackish lakes, temporary ponds and the canalsystem. Most important submerged species were, Ruppiasp.(2), Lamprothamnium papulosum, Potamogeton pec-tinatus, Cladophora sp., marine algae (Chlorophyceae,Rhodophyceae and Phaeophyceae) and Cymodocea nodosa(only present at Estany des Ponts). Temporary ponds nearthe coast were dominated by Chara sp., Lamprothamnium
112 Reg Environ Change (2004) 4:107–117
Table 2Surfaces (ha) of land use types in the s’Albufera catchment area in1983–1985 and 1994–1998 and their relative importance (%). Source:Min. Agricultura, Pesca y Alimentacion (1988); INE (1996)
Land use 1983–1985 1994–1998
Intensive agriculture 15,808 (25%) 27,287 (42.7%)Grassland 96 (0.1%) 96 (0.1%)
Vine yard 256 (0.4%) 256 (0.4%)Fruit 24,000 (37.5%) 12,480 (19.5%)Forest/scrubs/uncultivated* 23,872 (37.3%) 23,872 (37.3%)
*Uncultivated land was excluded in the representative Balearicstatistics (INE 1996). It was assumed that the area for agricultural use(40.128 ha) did not increase after 1986. This assumption is inaccordance with European Agricultural policy objectives (Diaz-Alv-arez et al. 1994).
Table 3Yearly water recharge and water exploitation in the S’Albufera catchment in 1983–1985 and 1994–1999 and in the whole of Mallorca(in Hm)3yr)1)
Recharge Exploitation 1983–1985 1994–1998 Mallorca 19982
Adjacent aquifers 2–121 Local inhabitants 2.35–2.30 2.97-3.11 62.7Infiltration irrigation 10.8–121,2 Seasonal inhabitants 0.02–0.05 0.07–0.14Infiltration precipitation 47–561 Tourists 1.06–1.12 1.34–1.46 19.3Salt water intrusion ?? Agriculture 405 726 154
Outflow 0.1–0.83,4 0.1–0.83,4
Total 60–80 44 77 236
Source: 1Howe (1989); 2Salamanca and Rodriguez-Perera (1999); 3Juncosa (1991); 4Wood (1989, 1990); 5Custodio et al. (1989); 6approximately 9,000 ha of the total catchment area was irrigated (Ministerio de Agricultura, Pesca y Alimentacion, 1988). In average 8,000 m 3 ha)1 yr)1
water was used in irrigated agriculture in the Balearics (Salamanca and Rodriguez-Perea 1999)
Original article
8/6/2019 Freshwater Use in Wetlands
http://slidepdf.com/reader/full/freshwater-use-in-wetlands 7/11
papulosum and Ruppia maritima. The in 1989 created(temporary ) open water areas in Sa Roca, Es Ras and SesPuntes (Fig. 2) were dominated by Zannichellia peduncu-lata and chara sp. in 1999. Potamogeton pectinatus, Myr-iophyllum spicatum, Chaetomorpha sp., Enteromorpha sp.and Najas marina mainly dominated the aquatic vegeta-tion within the canal system.
Differences between 1983–1985and the summer of 1999
The submerged vegetation had a lower diversity at most of the sampling sites compared to 1983–1985. Ceratophyllumsubmersum, Callitriche stagnalis, Ricciella fluitans, Lemnaminor , Lemna gibba and Myriophyllum verticillatum dis-appeared since the period 1983–1985, while these specieswere widely distributed in 1983–1985 (except Myriophyl-lum verticilatum). The average environmental tolerance(upper limit) for conductivity was estimated to be3.8 mScm)1 (Callitriche stagnalis) and 2.5 mScm)1 (Cer-atophyllum submersum) (derived from Martinez-Taberner
and Moya 1991a, b; Martinez-Taberner and Moya 1993).Average conductivity was higher than these derived envi-ronmental tolerances in the period 1994–1999 at thesampling locations where these species disappeared. Thedistribution of Ceratophyllum demersum was decreased inthe summer of 1999 compared to 1983–1985. At the loca-tions where Ceratophyllum demersum was no longerpresent in 1999 average conductivity exceeded its derivedenvironmental tolerance (5.9 mScm)1) (Martinez-Tabern-er and Moya 1991a; Martinez-Taberner and Moya 1993).Chaetomorpha sp. was in the summer of 1999 widely dis-tributed in the whole of s’Albufera, while in 1983–1985 itwas only found in the seaward part of s’Albufera.
Cymodocea nodosa was present in Estany des Ponts in thesummer of 1999, while this species was not found in theperiod 1983–1985. Marine algae (Rhodophyceae andPhaeophyceae) were found at more sites near the coast.Principal component analysis and hierarchical clusteranalysis showed that in 1983–1985 salinity was the mostimportant factor that explained the distribution of aquatic
vegetation (Martinez-Taberner 1988). Correspondenceanalysis with the field data of 1999 also pointed out thatmost of the variance was explained by salinity (Veraart1999). Total variance explained was 41%, the first principalaxis (13% explained variance) was assumed to beexplained by salinity (Veraart 1999).Martınez-Taberner (1988) identified four different aquaticvegetation communities for s’Albufera based on hierar-chical cluster analysis. Three identified aquatic commu-nities replaced each other with increasing salinity levels,i.e. Callitricho Ranunculucetum aquatilis (indicative spe-cies: Callitriche stagnalis), Potamogetonetum denso-nodosi(indicative species: Potamogeton pectinatus) and Ruppie-
tum maritimi (indicative taxa Ruppia sp.). The fourthidentified community was distinguished because of aclearly dominated and diverse charophyte community (indicative taxa: Chara sp.).In 1999 the Callitricho Ranunculucetum aquatilis com-munity was totally absent resulting in an increase of thePotamogetonetum denso-nodosi community (indication of salinization; Table 3). The number of locations withoutvegetation (turbid state) increased (Gran canal, coastalzone), while the number of locations dominated by charophytes was reduced (indication of eutrophication)(Veraart 1999).The tolerance of the submerged aquatic vegetation for
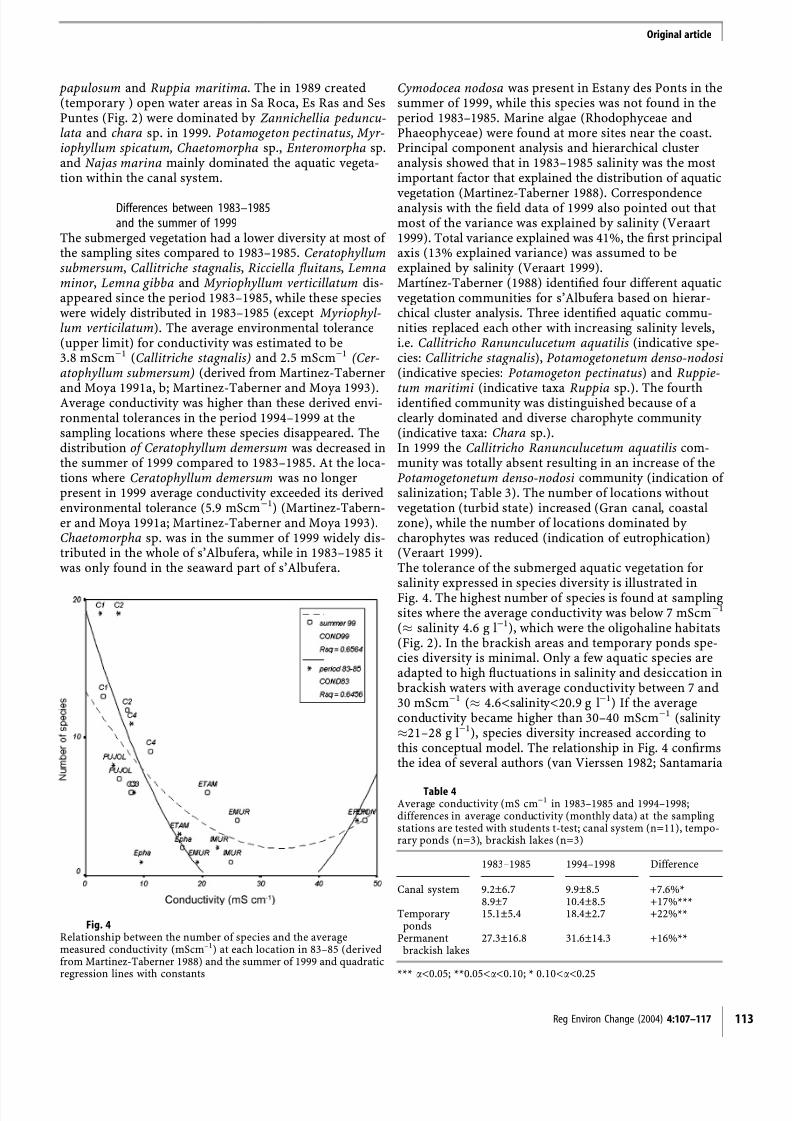
salinity expressed in species diversity is illustrated inFig. 4. The highest number of species is found at samplingsites where the average conductivity was below 7 mScm)1
(% salinity 4.6 g l)1), which were the oligohaline habitats(Fig. 2). In the brackish areas and temporary ponds spe-cies diversity is minimal. Only a few aquatic species areadapted to high fluctuations in salinity and desiccation inbrackish waters with average conductivity between 7 and30 mScm)1 (% 4.6<salinity<20.9 g l)1) If the averageconductivity became higher than 30–40 mScm)1 (salinity %21–28 g l)1), species diversity increased according tothis conceptual model. The relationship in Fig. 4 confirmsthe idea of several authors (van Vierssen 1982; Santamaria
Reg Environ Change (2004) 4:107–117 113
Fig. 4Relationship between the number of species and the averagemeasured conductivity (mScm–1) at each location in 83–85 (derivedfrom Martinez-Taberner 1988) and the summer of 1999 and quadraticregression lines with constants
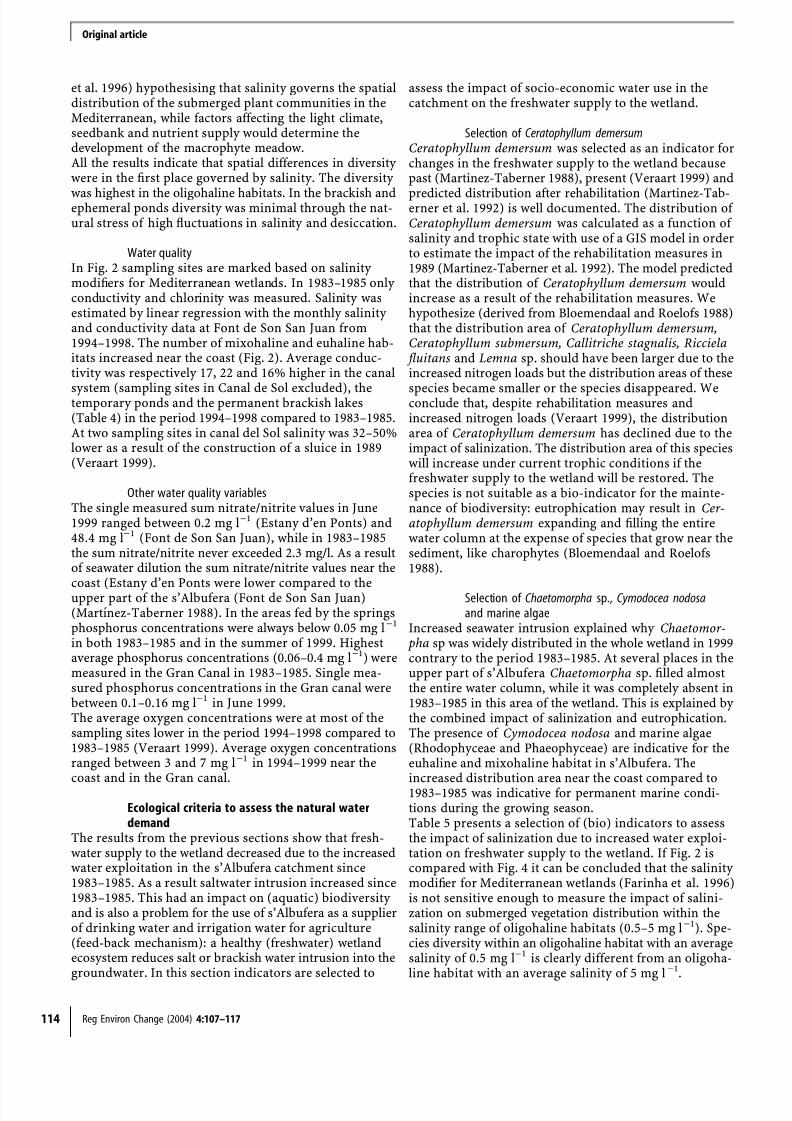
Table 4Average conductivity (mS cm)1 in 1983–1985 and 1994–1998;differences in average conductivity (monthly data) at the samplingstations are tested with students t-test; canal system (n=11), tempo-rary ponds (n=3), brackish lakes (n=3)
1983–1985 1994–1998 Difference
Canal system 9.2±6.7 9.9±8.5 +7.6%*8.9±7 10.4±8.5 +17%***
Temporary ponds
15.1±5.4 18.4±2.7 +22%**
Permanentbrackish lakes
27.3±16.8 31.6±14.3 +16%**
*** a<0.05; **0.05<a<0.10; * 0.10<a<0.25
Original article
8/6/2019 Freshwater Use in Wetlands
http://slidepdf.com/reader/full/freshwater-use-in-wetlands 8/11
et al. 1996) hypothesising that salinity governs the spatialdistribution of the submerged plant communities in theMediterranean, while factors affecting the light climate,seedbank and nutrient supply would determine thedevelopment of the macrophyte meadow.All the results indicate that spatial differences in diversity were in the first place governed by salinity. The diversity
was highest in the oligohaline habitats. In the brackish andephemeral ponds diversity was minimal through the nat-ural stress of high fluctuations in salinity and desiccation.
Water qualityIn Fig. 2 sampling sites are marked based on salinity modifiers for Mediterranean wetlands. In 1983–1985 only conductivity and chlorinity was measured. Salinity wasestimated by linear regression with the monthly salinity and conductivity data at Font de Son San Juan from1994–1998. The number of mixohaline and euhaline hab-itats increased near the coast (Fig. 2). Average conduc-tivity was respectively 17, 22 and 16% higher in the canal
system (sampling sites in Canal de Sol excluded), thetemporary ponds and the permanent brackish lakes(Table 4) in the period 1994–1998 compared to 1983–1985.At two sampling sites in canal del Sol salinity was 32–50%lower as a result of the construction of a sluice in 1989(Veraart 1999).
Other water quality variablesThe single measured sum nitrate/nitrite values in June1999 ranged between 0.2 mg l)1 (Estany d’en Ponts) and48.4 mg l)1 (Font de Son San Juan), while in 1983–1985the sum nitrate/nitrite never exceeded 2.3 mg/l. As a resultof seawater dilution the sum nitrate/nitrite values near the
coast (Estany d’en Ponts were lower compared to theupper part of the s’Albufera (Font de Son San Juan)(Martınez-Taberner 1988). In the areas fed by the springsphosphorus concentrations were always below 0.05 mg l)1
in both 1983–1985 and in the summer of 1999. Highestaverage phosphorus concentrations (0.06–0.4 mg l)1) weremeasured in the Gran Canal in 1983–1985. Single mea-sured phosphorus concentrations in the Gran canal werebetween 0.1–0.16 mg l)1 in June 1999.The average oxygen concentrations were at most of thesampling sites lower in the period 1994–1998 compared to1983–1985 (Veraart 1999). Average oxygen concentrationsranged between 3 and 7 mg l)1 in 1994–1999 near thecoast and in the Gran canal.
Ecological criteria to assess the natural waterdemand
The results from the previous sections show that fresh-water supply to the wetland decreased due to the increasedwater exploitation in the s’Albufera catchment since1983–1985. As a result saltwater intrusion increased since1983–1985. This had an impact on (aquatic) biodiversity and is also a problem for the use of s’Albufera as a supplierof drinking water and irrigation water for agriculture(feed-back mechanism): a healthy (freshwater) wetlandecosystem reduces salt or brackish water intrusion into thegroundwater. In this section indicators are selected to
assess the impact of socio-economic water use in thecatchment on the freshwater supply to the wetland.
Selection of Ceratophyllum demersumCeratophyllum demersum was selected as an indicator forchanges in the freshwater supply to the wetland becausepast (Martinez-Taberner 1988), present (Veraart 1999) and
predicted distribution after rehabilitation (Martinez-Tab-erner et al. 1992) is well documented. The distribution of Ceratophyllum demersum was calculated as a function of salinity and trophic state with use of a GIS model in orderto estimate the impact of the rehabilitation measures in1989 (Martinez-Taberner et al. 1992). The model predictedthat the distribution of Ceratophyllum demersum wouldincrease as a result of the rehabilitation measures. Wehypothesize (derived from Bloemendaal and Roelofs 1988)that the distribution area of Ceratophyllum demersum,Ceratophyllum submersum, Callitriche stagnalis, Ricciela fluitans and Lemna sp. should have been larger due to theincreased nitrogen loads but the distribution areas of these
species became smaller or the species disappeared. Weconclude that, despite rehabilitation measures andincreased nitrogen loads (Veraart 1999), the distributionarea of Ceratophyllum demersum has declined due to theimpact of salinization. The distribution area of this specieswill increase under current trophic conditions if thefreshwater supply to the wetland will be restored. Thespecies is not suitable as a bio-indicator for the mainte-nance of biodiversity: eutrophication may result in Cer-atophyllum demersum expanding and filling the entirewater column at the expense of species that grow near thesediment, like charophytes (Bloemendaal and Roelofs1988).
Selection of Chaetomorpha sp., Cymodocea nodosaand marine algae
Increased seawater intrusion explained why Chaetomor- pha sp was widely distributed in the whole wetland in 1999contrary to the period 1983–1985. At several places in theupper part of s’Albufera Chaetomorpha sp. filled almostthe entire water column, while it was completely absent in1983–1985 in this area of the wetland. This is explained by the combined impact of salinization and eutrophication.The presence of Cymodocea nodosa and marine algae(Rhodophyceae and Phaeophyceae) are indicative for theeuhaline and mixohaline habitat in s’Albufera. Theincreased distribution area near the coast compared to1983–1985 was indicative for permanent marine condi-tions during the growing season.Table 5 presents a selection of (bio) indicators to assessthe impact of salinization due to increased water exploi-tation on freshwater supply to the wetland. If Fig. 2 iscompared with Fig. 4 it can be concluded that the salinity modifier for Mediterranean wetlands (Farinha et al. 1996)is not sensitive enough to measure the impact of salini-zation on submerged vegetation distribution within thesalinity range of oligohaline habitats (0.5–5 mg l)1). Spe-cies diversity within an oligohaline habitat with an averagesalinity of 0.5 mg l)1 is clearly different from an oligoha-line habitat with an average salinity of 5 mg l)1.
114 Reg Environ Change (2004) 4:107–117
Original article
8/6/2019 Freshwater Use in Wetlands
http://slidepdf.com/reader/full/freshwater-use-in-wetlands 9/11
Calculation of the sustainability indicatorfor water use
We are able to calculate the ISadj [formula (2)] if we as-
sume that:A) it is a Balearic environmental policy objective to re-
store the freshwater supply to the wetland to the samerange of supply as in the period 1983–1985.
B) that the average freshwater supply to the wetland in1983–1985 is equal to the natural water demand.
C) In the s’Albufera catchment no man-made water re-sources (desalinisation plants) are present.
>The average freshwater supply in the period 1983–1985 isestimated to be (16+36)/2=26 Hm3 yr)1 (derived fromminimal and maximal estimated freshwater supply in thesection ‘Pressures on freshwater resources’). Table 6
shows the calculation of IS [formula (1)] and ISadj [for-mula (2)] based on the hydrological balance (Table 3) andabove made assumptions.Assumptions A and B on which basis ISadj is calculated,can be argued:It was an objective of the rehabilitation plan in 1989 toprotect and to increase the ‘‘freshwater’’ habitat. If fresh-water supply to the wetland did meet to the natural waterdemand in 1983–1985, such a rehabilitation objective wasnot formulated.By using the average freshwater supply in 1983–1985 we donot take into account the large variability in meteorolog-ical conditions in the Mediterranean (wet and dry years),which is a natural characteristic. Mediterranean ecosys-tems should be able to deal with yearly variations infreshwater supply (robustness).However, we think that it is valid to conclude that thenatural water demand (or critical freshwater supply to the
wetland) of s’Albufera is somewhere between the averagefreshwater supply (26 Hm3 yr)1) and the maximum supply in wet years (36 Hm3 yr)1) (Table 3). In future research
uncertainties within the definition of the natural waterdemand could be reduced with the help of the presentedecological criteria in the section ‘Ecological criteria toassess the natural water demand’ in combination with aquantitative and qualitative hydrological study.
Discussion
The study concentrated on the role of the wetland as afreshwater supplier for human society in the catchment(agriculture, drinking water) and the necessary amount of
freshwater in order to maintain ecological integrity andconservation values of s’Albufera.The periods 1983–1985 and 1994–1999 were analysed andcompared, this division was made because of data avail-ability. Ideally a continuous time series would be pre-ferred. However, despite the absence of a continuous timeseries, it is still interesting to compare these two timeperiods, because they are separated by two events, whichhave had a major influence on land use and nature con-servation. In 1986 Spain became a member of the Euro-pean Union, which led to the further intensification of agricultural production in the areas around s’AlbuferaNatural Park. In 1989, a rehabilitation project was carriedout in the Natural ParkThe changes within land use were of more importance inrelation to the freshwater supply function of the wetlandthan the changes in population and tourist numbers andthe restoration project. The potential positive impact of the construction of sluices and dams in the wetland inorder to maintain freshwater were overshadowed by theincreased freshwater demand by agriculture.The increased freshwater exploitation in combination withincreased fertiliser use may also explain the highly increased nitrogen concentrations within the wetland.Other rehabilitation measures (eg. grazing management)resulted in an increase of biological diversity within thearea. The creation of open water areas has resulted in an
Reg Environ Change (2004) 4:107–117 115
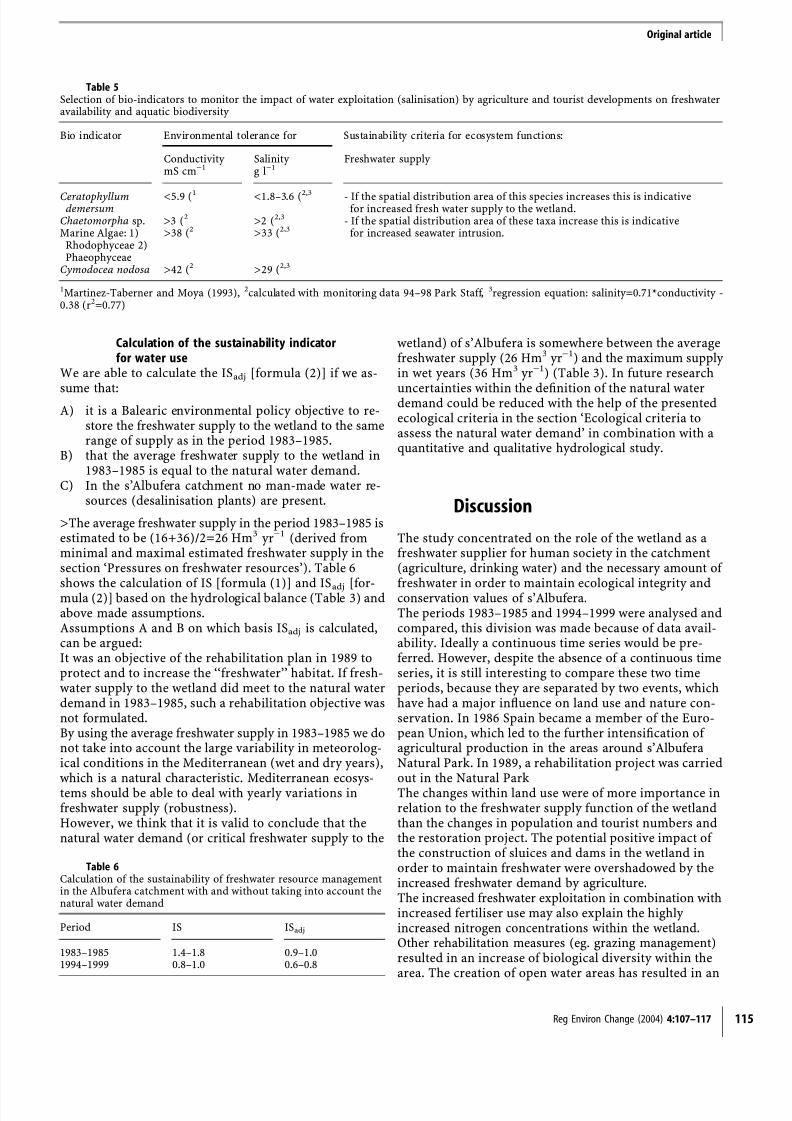
Table 5Selection of bio-indicators to monitor the impact of water exploitation (salinisation) by agriculture and tourist developments on freshwateravailability and aquatic biodiversity
Bio indicator Environmental tolerance for Sustainability criteria for ecosystem functions:
Conductivity Salinity Freshwater supply mS cm)1 g l)1
Ceratophyllumdemersum
<5.9 (1 <1.8–3.6 (2,3 - If the spatial distribution area of this species increases this is indicativefor increased fresh water supply to the wetland.
Chaetomorpha sp. >3 (2 >2 (2,3 - If the spatial distribution area of these taxa increase this is indicativefor increased seawater intrusion.Marine Algae: 1)
Rhodophyceae 2)Phaeophyceae
>38 (2 >33 (2,3
Cymodocea nodosa >42 (2 >29 (2,3
1Martinez-Taberner and Moya (1993), 2calculated with monitoring data 94–98 Park Staff, 3regression equation: salinity=0.71*conductivity -0.38 (r2=0.77)
Table 6Calculation of the sustainability of freshwater resource managementin the Albufera catchment with and without taking into account thenatural water demand
Period IS ISadj
1983–1985 1.4–1.8 0.9–1.01994–1999 0.8–1.0 0.6–0.8
Original article
8/6/2019 Freshwater Use in Wetlands
http://slidepdf.com/reader/full/freshwater-use-in-wetlands 10/11
increased number of breeding and feeding possibilities forwaterfowl. These newly created temporal ponds, with low submerged species diversity (Chara sp. and Zannichellia pedunculata), represent a temporary nutrient rich oligo/mesohaline habitat (Veraart 2000) with a high ornitho-logical value (Conselleria de Medi Ambient, Ordenacio delterritori I Litoral 1999a). The newly created ponds are fed
by water originating from the wells, and the influence fromthe sea (nutrient dilution, high salinity) is lower comparedto the already present ponds in 1983–1985. However,overgrazing may have negative impacts on the functionalrole of submerged vegetation for birds and on the distri-bution of rare terrestrial species (i.e. Orchis palustris).Cattle trampling may result into reduced light conditions,which has a negative impact on the development of thesubmerged vegetation. Ideally, grazing managementshould be based on ornithological, aquatic ecological,botanical and economical criteria in order to optimisebiodiversity conservation.We focussed on the impact of salinization on the fresh-
water supply function of the wetland and did not discussother impacts on the state of the aquatic system relatedwith land use change (eutrophication, pesticide use) andincreasing population and tourist numbers (eg. changes indischarges of sewage). This focus was selected because thedifferences in species diversity within the submergedvegetation community were mainly explained by salini-zation. Differences in abundance of submerged species atseveral sampling sites, compared with 1983–1985, werealso often explained by the combined impact of saliniza-tion and eutrophication. Species that grow near the sedi-ment, like charophytes, have become less abundant at theexpense of species that concentrate their biomass in the
upper part of the water column (Potamogeton pectinatus,Enteromorpha sp.) or fill the entire water column(Ceratophyllum demersum). Long-term monitoring of abundance and diversity of the submerged vegetationcommunity provide thus information of several impactsrelated with land use change and urbanisation.In analysing the land use changes and the change in thewater balance, some scaling problems occurred andassumptions had to be made caused by restrictions in dataavailability. For example, the data of 1983–1985 werederived from a regional source (Ministerio de Agricultura,Pesca y Alimentacion 1988), while the data representativefor the period 1994–1998 had to be extrapolated from theSpanish national statistics office (INE 1996). It wasassumed that within intensive agriculture, yearly waterdemand is the same of each type of cultivation, while inreality there might be some differences.The presented changes in both human water use andfreshwater supply to the wetland should therefore be seenas a ‘best-case’ scenario, rather than an exact prediction.Within this context the presented effects of these changesprovide useful information to evaluate the sustainability of current tourist developments and land use in the s’Al-bufera catchment.The above described constraints of data availability andscaling problems encountered by our study are, unfortu-nately, very common. Data collection and monitoring
networks are often embedded in a fragmented institutionalframework. In order to assess the impact of human society on freshwater resources we have to see a catchment as asocio-economic and ecological unity. Also from a scientificpoint of view integration of data collection is necessary.Only if chemical, hydrological and ecological monitoringprogrammes are integrated will it become possible to
assess the vulnerability of ecological functions of wetlandsto changes in pressures like, tourist numbers and land usechange. It is also important that management objectiveswithin the Park and policy objectives outside the park arelinked with the monitoring programmes. The presentedsustainability indicator for freshwater resource manage-ment in s’Albufera [formula (2)] offers a commonframework to assess opportunities and constraints forlinking socio-economic and conservation interests.
Acknowledgements The data in this article are largely based onfieldwork carried out by Veraart (1999) in spring/summer 1999.The authors would like to thank the staff of s’Albufera Parc Nat-ural, The Albufera International Biodiversity Group, the Geogra-
phy Department (Dr. M. Blazquez) and Limnology Department(Prof. Dr. Antoni Martinez and Prof. Dr. G. Moya) and theDepartment of Marine Sciences and Coastal Management of theUniversity of Newcastle-Upon-Tyne (Miss E. Whittingham).
References
Bloemendaal FHJL, Roelofs JGM (1988) Waterplanten en water-kwaliteit. Koninklijke Nederlandse Nattuurhistorische Vereni-ging, Vakgroep Aquatische Oecologie en Biogeologie KatholiekeUniversiteit Nijmegen, Utrecht
Conselleria d’Agricultura I Pesca (1989) Pla d’us I gestio del parc
natural de s’Albufera de Mallorca 1990–1994. Documents Tec-nics de Conservacio, Govern Balear, Direccio Generald’Estructures Agraries I Medi Natural Servei de Conservacio dela Naturalesea, Mallorca, Spain
Conselleria d’ Economia I Hisenda, direccio General d’Economia(1989) Dades Balear 1989. Govern Balear, Palma de Malllorca
Conselleria de Medi Ambient, Ordenacio del territori I Litoral(1999a) Pla d’us I gestio del Parc Natural de s’Albufera1998–2002, de la restauracio a la conservacio. Documents tec-nics de conservacio, IIa epoca, num. 3, Govern Balear, Spain
Custodio E, Baron F, Morillo HR, Poncela R (1989) Saline water ins’Albufera Natural Park aquifer system, Mallorca island (Spain).A preliminary study
Diaz-Alvarez MC (1989) Contaminacıon agraria difusa. Ministe-rio de obras publicas y urbanismo, centro de publicaciones,
MadridDiaz-Alvarez MC, Valero SG, de Antonio-Garicıa R (1994) Con-
taminacion agraria difusa, El campo, servicio de estudios BBV,nmr 131
DOT (1997) Directrius d’ordenacio territorial, cap a un desen-volupament sostenible del territori, govern Balear, conselleria demedi ambient, ordenacio del territori I litoral, Palma de Mall-orca
Earthwatch (1991) Project s’Albufera. A new model for environ-mental research. Earthwatch Europ, Oxford, United Kingdom
Farinha JC, Costa L, Zalidis G, Mantazavelas A, Fitoka E, HeckerN, Vives PT (1996) Mediterranean Wetland Inventory: HabitatDescription System, Vol.3. MEDWET/Instituto da Conservacaoda Natureza (ICN)/ Wetlands International/ Greek Biotope/Wetland Centre (EKBY)
116 Reg Environ Change (2004) 4:107–117
Original article
8/6/2019 Freshwater Use in Wetlands
http://slidepdf.com/reader/full/freshwater-use-in-wetlands 11/11
GOB (1998) http://gob.balears.netGroot RS de (1992) Functions of Nature, Evaluation of nature in
environmental planning, management and decision making.Wolters-Noordhoff, Groningen
Groot RS de, Perk J van der, Chiesura A, Marguliew S (2000)Ecological functions and socio-economic values of critical nat-ural capital as a measure for ecological integrity and environ-mental health. In: Crabbe P (ed) Implementing Ecological
Integrity. Kluwer, Dordrecht, pp 191–214Howe C (1989) Albufera, aspects of hydrology, vegetation andmanagement. University College London
INE (1996) http://www.ine.es. INSTITUTO NACIONAL DE EST-ADISTICA, Madrid
IUCN (2000) Vision for water and nature. A world strategy forconservation and sustainable management of water resources inthe 21st century. Compilation of All Project Documents. IUCN,Gland, Switzerland and Cambridge, 224 pp
Jongman RHG, Braak CJF ter, Tongeren OFR van (1987) Dataanalyses in community and landscape ecology. Pudoc Wagen-ingen, 1987
Juncosa M (1991) Estudio hidrogeologico de la zona humeda des’Albufera (Mallorca). M.Sc Thesis
Marba N, Duarte CM (1997) Interannual changes in seagrass
(Posidonia oceanica) growth and environmental change in theSpanish Mediterranean littoral zone. Limnology Oceanography 42(5):800–810
Martınez-Taberner (1988) Caracteristiques limnologiques des’Albufera de Mallorca. Tesi doctoral, Departament de Biologia,Universitat de less Illes Balears,Palma de Mallorca
Martınez-Taberner A, Moya G (1991a) Chemical hydrology andmacrophyte vegetation in the canals of a Mediterranean coastalmarsh. Archiv fur die Hydrobiologie, Departament de Biologia,Palma de Mallorca, Vol. 120(1), pp 67–87
Martınez-Taberner A, Moya G (1991b) Water chemistry toleranceof Charophytes in a Mediterranean coastal marsh. NovaHedwiga 52(1–2):113–129
Martınez-Taberner A, Moya G (1993) Submerged vascular plantsand water chemistry in the coastal marsh Albufera de Mallorca
(Balearic Islands). Hydrobiologia 271:129–139Martınez-Taberner A, Mayol-Serra J (eds) (1995) s’Albufera deMallorca, societat d’historia natural de les Balears. EditorialMoll, Mallorca, Spain
Martınez-Taberner A, Moya G, Ramon G, Forteza V (1990)Limnological criteria for the rehabilitation of a coastal marsh.The albufera of Majorca, Balearic Islands. Ambio 1:21–27
Martınez-Taberner A, Ruiz-Perez M, Mestre I, Forteza V (1992)Prediction of potential submerged vegetation in a silted coastalmarsh, Albufera of Majorca, Balearic Islands. J Environ Manage35:1–12
Mata M, Hein LG, Groot RS de (1997) Assessment of functionsand socio-economic values of natural ecosystems and protectedareas. Pilot study on the Parc Natural de s’Albufera de Mallorca,FSD working paper 9702, Wageningen, the Netherlands
Ministerio de agricultura, pesca y alimentacion (1988) Evaluacionde recursos agrarios. Mapa de cultivos y aprovechamientos(escala 1:50,000), Inca, Isla de Mallorca (Baleares). Definiciongeneral de la produccion agraria, Madrid
Morrilo HR (1992) Estudio hidrogeologico de s’ Albufera deAlcudia con enfasis hydrogeoquimico e isotopico ambiental(Isla de Mallorca). Postgraduate Thesis, Departamento deIngeniera del Terreno y Cartografica, Universidad Polytecnicade Cataluna
Riddiford N (2004) S’ Albufera biodiversity catalogue (in prep)Salamanca OR, Rodrıguez-Perea A (1999) Los problemas de
abastecimiento de agua en las Islas Baleares. In: Gil A, Morales
A (ed) Los usos de agua en Espana, caja de Ahorros del Med-iterraneo/instituto Universitario de geografıa de la universidadde Alicante, pp 615–643
Santamaria-Galdon LE (1995) The ecology of Ruppia drepanensisTineo in a Mediterranean brackish marsh (Donana NationalPark, SW Spain), a basis for the management of semiaridfloodplain wetlands. Postgraduate Thesis, Wageningen Agri-cultural University and International Institute for Infrastruc-tural Hydraulic and Environmental engineering. Balkema,Rotterdam
Santamaria LE, Amezaga JM (1999) Improving the managementof large protected wetlands: Learning the lessons from theDonana nature reserves. Ecosystems and Sustainable Develop-ment, second international conference on ecosystems and sus-tainable development
Santamaria LE, Montes C, Hootsmans MJM (1996) Influence of environmental parameters on the biomass development of Ruppia drepanensis populations in the Donana National Park:the importance of conditions affecting the underwater lightclimate. Salt Lake Research 5:157–180
Veraart JA (1999) Selection of bio-indicators to monitor effects of agriculture and tourist developments on water quality andaquatic biodiversity in s’Albufera Natural Park. Thesis, Envi-ronmental systems Analysis Group, Aquatic Ecology and WaterQuality Group, Wageningen, the Netherlands
Veraart JA (2000) Towards the use of bio-indicators to assess theanthropogenic impacts on aquatic biodiversity and waterquality in s’Albufera Natural Park. Report 00–03, Foundationfor Sustainable Development, Wageningen
Vierssen W van (1982) The ecology of communities dominated
by Zannichellia taxa in western Europe. I. Characterization andautecology of the Zannichellia taxa. Aquatic Botany 12:103–105Vives PT (ed) (1996) Monitoring Mediterranean Wetlands: a
Methodological Guide. Medwet Publication; Wetland Interna-tional, Slimbridge, UK and ICN, Lisbon
Whittingham E (1999) The coastal zone of Alcudia Bay, Mallorca:an assessment of change and potential anthropogenic impactson the Posidonia oceanica seagrass habitat. Dissertation, TheCentre for Tropical Coastal Management, University of Newcastle-upon-Tyne
Wood B (ed) (1989) A monitoring programme for s’Albufera deMallorca. Discussion papers in conservation, no 52, Ecology andConservation unit, University College London
Wood B (ed) (1990) Futher studies towards a monitoring pro-gramme for s’Albufera de Mallorca. Discussion papers in con-
servation, no 55, Ecology and Conservation unit, University College London
Original article