Embed Size (px)
Citation preview

21st International Conference on Composite Materials
Xi’an, 20-25th August 2017
FREQUENCY EFFECT ON LIFETIME AND TEMPERATURE OF
A TAILORED BLANK C/PPS THERMOPLASTIC COMPOSITE
Roman Ruzek1, Martin Kadlec2, and Lucie Nováková3
1 VZLU - Aerospace Research and Test Establishment, Strength of Structures Department,
Beranových 130, 199 05 Prague, Czech Republic, [email protected], www.vzlu.cz 2 VZLU - Aerospace Research and Test Establishment, Strength of Structures Department,
Beranových 130, 199 05 Prague, Czech Republic, [email protected], www.vzlu.cz 3 VZLU - Aerospace Research and Test Establishment, Strength of Structures Department,
Beranových 130, 199 05 Prague, Czech Republic, [email protected], www.vzlu.cz
Keywords: Thermoplastic resin, Tailored blanks, Fatigue, Frequency, Temperature, Mechanical
properties.
ABSTRACT
Applications of advanced thermoplastic matrix composites facilitate the use of modern
manufacturing technologies such as hot forming and tailored blanks. This study investigates the
influence of the loading frequency on the temperature, fatigue behaviour, and failure mechanisms of
carbon fibre fabric–reinforced polyphenylenesulphide (PPS) laminates whose thickness is varied using
ply drops. The effects of two ply drop configurations and fatigue loading frequencies from 0.5 to 15 Hz
were considered. Fractographic examination revealed loading frequency based fracture surface features.
The loading frequency had a significant influence on the fatigue lifetime of specimens with thickness
variation. The local temperature increased significantly while the fatigue life decreased as the loading
frequency was increased. In particular, the fatigue life decreased by more than one order of magnitude.
An analytic relation between load rate and local temperature was defined. At low loading frequency, the
matrix exhibited small plastic deformations and textured microflow was apparent. At high loading
frequency, larger matrix features, such as rollers and debris, were found. Fibrils caused by large matrix
deformation may be attributed to the higher temperature at higher frequencies.
1 INTRODUCTION
Thermoplastic matrix composites (TPMCs), which are used in airframes, have become increasingly
popular in the aerospace industry owing to their superior impact damage resistance [1] or formability
[2] compared to conventional epoxy-based laminates. Moreover, the possibility of recycling TPMCs [3]
is a significant advantage in terms of environmental conservation. Previously, the large-scale use of
TPMCs was hindered by their complex manufacturing process and high cost. These obstacles are less
severe today, as larger batches of material are ordered and modern manufacturing technologies can be
applied. TPMCs are used as constant-thickness materials in the construction of primary airframe
components. A wide range of thermoplastic resins is available. Polyetheretherketone (PEEK) and
polyphenylene sulphide (PPS) are among the most widely used high-performance TP resins [4]. This
paper focuses on the mechanical behaviour of carbon/PPS (C/PPS) composites.
Fatigue loading is one of the main types of loading in structural elements, which can lead to
catastrophic failure in certain situations. The fatigue response of C/PPS thermoplastic materials,
especially those with varying thickness and ply drop, has not been investigated in sufficient detail thus
far. Extensive experimental studies are required in this regard. Design against fatigue failure is complex
because fatigue life can be influenced by a number of variables, such as maximum and minimum stress
levels, temperature, loading frequency, component size and geometry, and environment. Continuous
fibre–reinforced composites are characterized by the development and accumulation of several types of
defects, including matrix cracking of the fibres, delamination between adjacent plies, debonding
between matrix and fibres, and fracture of fibres. Such defects in composite systems are not isolated but
interconnected. Thus, the identification of crack paths is a highly complex task. Moreover, most of these
defects occur long before ultimate failure; hence, there can be many types of subcritical failure [5, 6-8].
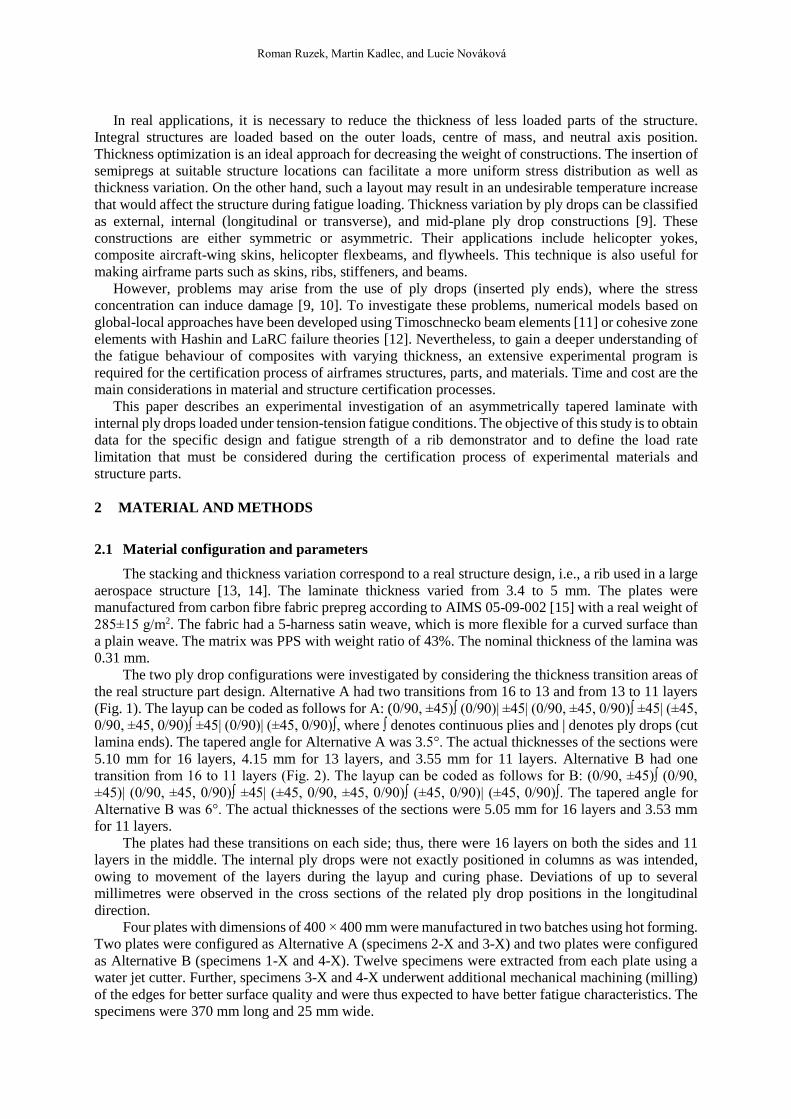
Roman Ruzek, Martin Kadlec, and Lucie Nováková
In real applications, it is necessary to reduce the thickness of less loaded parts of the structure.
Integral structures are loaded based on the outer loads, centre of mass, and neutral axis position.
Thickness optimization is an ideal approach for decreasing the weight of constructions. The insertion of
semipregs at suitable structure locations can facilitate a more uniform stress distribution as well as
thickness variation. On the other hand, such a layout may result in an undesirable temperature increase
that would affect the structure during fatigue loading. Thickness variation by ply drops can be classified
as external, internal (longitudinal or transverse), and mid-plane ply drop constructions [9]. These
constructions are either symmetric or asymmetric. Their applications include helicopter yokes,
composite aircraft-wing skins, helicopter flexbeams, and flywheels. This technique is also useful for
making airframe parts such as skins, ribs, stiffeners, and beams.
However, problems may arise from the use of ply drops (inserted ply ends), where the stress
concentration can induce damage [9, 10]. To investigate these problems, numerical models based on
global-local approaches have been developed using Timoschnecko beam elements [11] or cohesive zone
elements with Hashin and LaRC failure theories [12]. Nevertheless, to gain a deeper understanding of
the fatigue behaviour of composites with varying thickness, an extensive experimental program is
required for the certification process of airframes structures, parts, and materials. Time and cost are the
main considerations in material and structure certification processes.
This paper describes an experimental investigation of an asymmetrically tapered laminate with
internal ply drops loaded under tension-tension fatigue conditions. The objective of this study is to obtain
data for the specific design and fatigue strength of a rib demonstrator and to define the load rate
limitation that must be considered during the certification process of experimental materials and
structure parts.
2 MATERIAL AND METHODS
2.1 Material configuration and parameters
The stacking and thickness variation correspond to a real structure design, i.e., a rib used in a large
aerospace structure [13, 14]. The laminate thickness varied from 3.4 to 5 mm. The plates were
manufactured from carbon fibre fabric prepreg according to AIMS 05-09-002 [15] with a real weight of
285±15 g/m2. The fabric had a 5-harness satin weave, which is more flexible for a curved surface than
a plain weave. The matrix was PPS with weight ratio of 43%. The nominal thickness of the lamina was
0.31 mm.
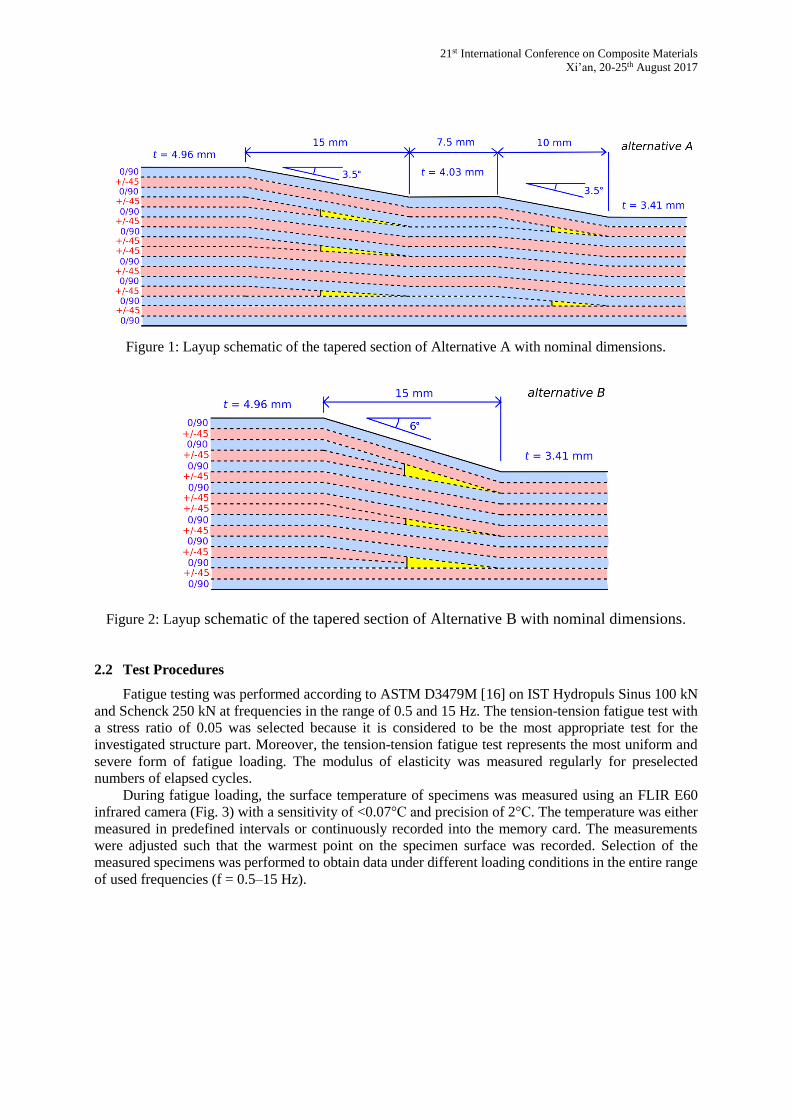
The two ply drop configurations were investigated by considering the thickness transition areas of
the real structure part design. Alternative A had two transitions from 16 to 13 and from 13 to 11 layers
(Fig. 1). The layup can be coded as follows for A: (0/90, ±45)∫ (0/90)| ±45| (0/90, ±45, 0/90)∫ ±45| (±45,
0/90, ±45, 0/90)∫ ±45| (0/90)| (±45, 0/90)∫, where ∫ denotes continuous plies and | denotes ply drops (cut
lamina ends). The tapered angle for Alternative A was 3.5°. The actual thicknesses of the sections were
5.10 mm for 16 layers, 4.15 mm for 13 layers, and 3.55 mm for 11 layers. Alternative B had one
transition from 16 to 11 layers (Fig. 2). The layup can be coded as follows for B: (0/90, ±45)∫ (0/90,
±45)| (0/90, ±45, 0/90)∫ ±45| (±45, 0/90, ±45, 0/90)∫ (±45, 0/90)| (±45, 0/90)∫. The tapered angle for
Alternative B was 6°. The actual thicknesses of the sections were 5.05 mm for 16 layers and 3.53 mm
for 11 layers.
The plates had these transitions on each side; thus, there were 16 layers on both the sides and 11
layers in the middle. The internal ply drops were not exactly positioned in columns as was intended,
owing to movement of the layers during the layup and curing phase. Deviations of up to several
millimetres were observed in the cross sections of the related ply drop positions in the longitudinal
direction.
Four plates with dimensions of 400 × 400 mm were manufactured in two batches using hot forming.
Two plates were configured as Alternative A (specimens 2-X and 3-X) and two plates were configured
as Alternative B (specimens 1-X and 4-X). Twelve specimens were extracted from each plate using a
water jet cutter. Further, specimens 3-X and 4-X underwent additional mechanical machining (milling)
of the edges for better surface quality and were thus expected to have better fatigue characteristics. The
specimens were 370 mm long and 25 mm wide.
21st International Conference on Composite Materials
Xi’an, 20-25th August 2017
Figure 1: Layup schematic of the tapered section of Alternative A with nominal dimensions.
Figure 2: Layup schematic of the tapered section of Alternative B with nominal dimensions.
2.2 Test Procedures
Fatigue testing was performed according to ASTM D3479M [16] on IST Hydropuls Sinus 100 kN
and Schenck 250 kN at frequencies in the range of 0.5 and 15 Hz. The tension-tension fatigue test with
a stress ratio of 0.05 was selected because it is considered to be the most appropriate test for the
investigated structure part. Moreover, the tension-tension fatigue test represents the most uniform and
severe form of fatigue loading. The modulus of elasticity was measured regularly for preselected
numbers of elapsed cycles.
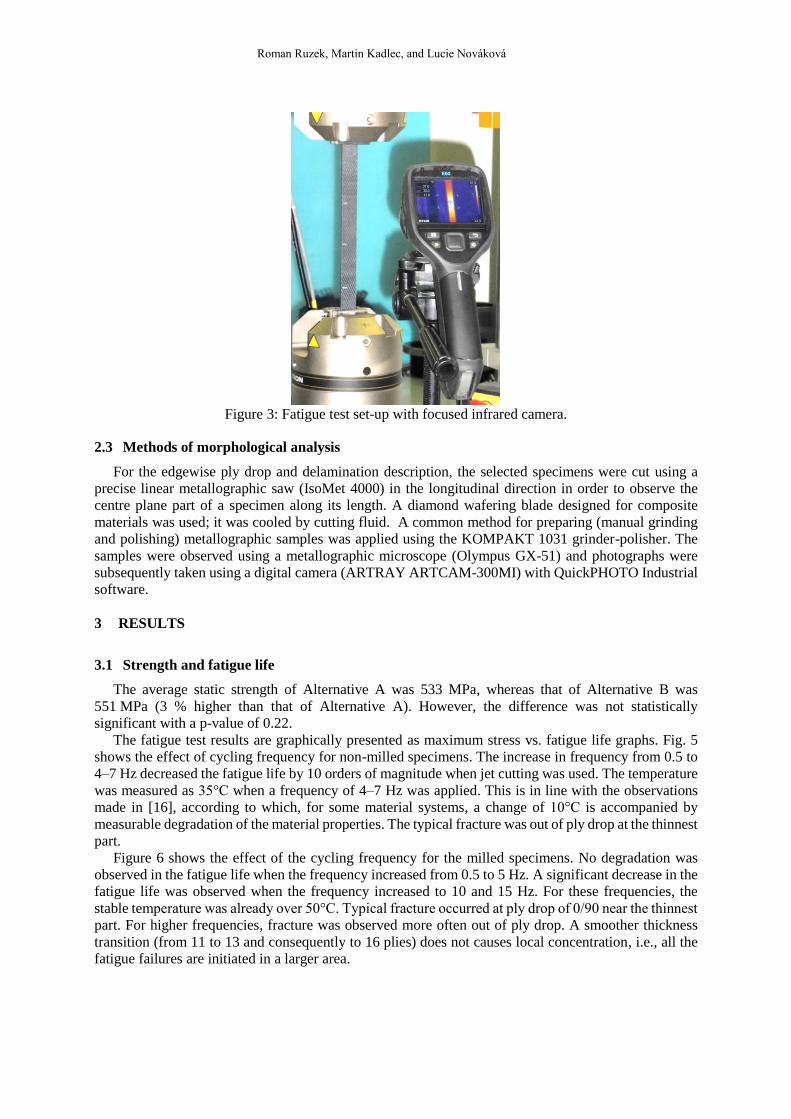
During fatigue loading, the surface temperature of specimens was measured using an FLIR E60
infrared camera (Fig. 3) with a sensitivity of <0.07°C and precision of 2°C. The temperature was either
measured in predefined intervals or continuously recorded into the memory card. The measurements
were adjusted such that the warmest point on the specimen surface was recorded. Selection of the
measured specimens was performed to obtain data under different loading conditions in the entire range
of used frequencies (f = 0.5–15 Hz).
Roman Ruzek, Martin Kadlec, and Lucie Nováková
Figure 3: Fatigue test set-up with focused infrared camera.
2.3 Methods of morphological analysis
For the edgewise ply drop and delamination description, the selected specimens were cut using a
precise linear metallographic saw (IsoMet 4000) in the longitudinal direction in order to observe the
centre plane part of a specimen along its length. A diamond wafering blade designed for composite
materials was used; it was cooled by cutting fluid. A common method for preparing (manual grinding
and polishing) metallographic samples was applied using the KOMPAKT 1031 grinder-polisher. The
samples were observed using a metallographic microscope (Olympus GX-51) and photographs were
subsequently taken using a digital camera (ARTRAY ARTCAM-300MI) with QuickPHOTO Industrial
software.
3 RESULTS
3.1 Strength and fatigue life
The average static strength of Alternative A was 533 MPa, whereas that of Alternative B was
551 MPa (3 % higher than that of Alternative A). However, the difference was not statistically
significant with a p-value of 0.22.
The fatigue test results are graphically presented as maximum stress vs. fatigue life graphs. Fig. 5
shows the effect of cycling frequency for non-milled specimens. The increase in frequency from 0.5 to
4–7 Hz decreased the fatigue life by 10 orders of magnitude when jet cutting was used. The temperature
was measured as 35°C when a frequency of 4–7 Hz was applied. This is in line with the observations
made in [16], according to which, for some material systems, a change of 10°C is accompanied by
measurable degradation of the material properties. The typical fracture was out of ply drop at the thinnest
part.
Figure 6 shows the effect of the cycling frequency for the milled specimens. No degradation was
observed in the fatigue life when the frequency increased from 0.5 to 5 Hz. A significant decrease in the
fatigue life was observed when the frequency increased to 10 and 15 Hz. For these frequencies, the
stable temperature was already over 50°C. Typical fracture occurred at ply drop of 0/90 near the thinnest
part. For higher frequencies, fracture was observed more often out of ply drop. A smoother thickness
transition (from 11 to 13 and consequently to 16 plies) does not causes local concentration, i.e., all the
fatigue failures are initiated in a larger area.

21st International Conference on Composite Materials
Xi’an, 20-25th August 2017
Figure 5: Effect of edge cycling frequency: jet cutting. The frequency was increased from 0.5 to 4–7
Hz, which caused the fatigue life to decrease by 10 orders of magnitude.
Figure 6: Effect of edge cycling frequency: edge milling (0.5 – 15 Hz). An increase in frequency
from 5 to 15 Hz caused the fatigue life to decrease by more than 10 orders of magnitude.
3.2 Temperature
Initially, the highest temperature area was always formed in the middle part of a specimen, where
the thickness was constant (11 plies). This area corresponds to the area with the highest stress level.
During the following fatigue cycling, the warmest point was subsequently shifted to an area located
much closer to the thickness transition zone where the final failure occurred. The global temperature
increase was caused by rapid cyclic deformation; no global microcracking was observed in the cross
section. The highest temperature increase corresponds to the area with fatigue crack (delamination)
initiation and propagation. Examples of the highest temperature area gradually moving from the middle
part of the specimens with constant thickness to the failed area are shown in Fig. 7 (test frequency of 10
300
400
500
600
1 000 10 000 100 000 1 000 000
Alternative A
Alternative B
N ( cycles )
sm
ax
(
MP
a )
R = 0.05
f = 0.5 Hzf = 4 - 7 Hz
f = 4 - 7 Hz
Run out .
300
400
500
600
1 000 10 000 100 000 1 000 000
Alternative A (edge milling)
Nf ( cycles )
sm
ax
(
MP
a)
R = 0.05
10 Hz 10 Hz
15 Hz15 Hz
5 Hz
10 Hz
5 Hz0.5 Hz
0.5 Hz10 Hz

Roman Ruzek, Martin Kadlec, and Lucie Nováková
Hz). In the first stage of the fatigue test, the stabilized warmest point had a temperature of 32.2°C in the
middle part of the specimen with constant thickness (Fig. 7a). During continuous loading, the heat
produced by rapid deformation accumulated and increased the temperature of the warmest point to
64.4°C (Fig.7b). In addition, this point moved towards the thickness transition area (ply drop) where the
initial delamination shearing led to an even higher temperature. Fig. 7c shows the area with the highest
temperature of 85.6°C just before failure. Fig. 7d shows the specimen just after failure, when the
individual failed ends disconnected (subsequently, the temperature rapidly decreased).
Figure 7: Thermo-images of fatigued specimen. The upper numbers denote the temperature in degrees
Celsius at the red crosses, and the bottom numbers denote the temperature in degrees Celsius of the
laboratory environment.
The evolution of the temperature measured during fatigue testing for individual specimens under
different load conditions is shown in Figs. 8–13. The initial phase in which the temperature rapidly
increased can be recognized for higher frequency values. After several elapsed cycles, the temperature
stabilized at a certain value. This value depends on the maximum stress value, test frequency, and layup
configuration. The stabilized temperature was achieved between 5,000 and 20,000 cycles. A maximum
stabilized temperature level of 75°C was measured. This value is relatively close to the glass transition
temperature of C/PPS composites (i.e., Tg = 98°C). The fatigue life was significantly reduced in this
case. At a frequency of 0.5 Hz, no surface temperature changes were observed (see Figs. 8 and 9). On
the other hand, the stabilized temperature was not reached in certain conditions (highest frequency and
load levels; see Fig. 13).
20
30
40
50
60
70
80
0 10 000 20 000 30 000 40 000
A
B
A
A
A
B
A
A
B
N ( cycles )
Te
mp
era
ture
( C
)
f = 7 Hz
f = 0.5 Hz
f = 10 Hz
f = 4 Hz
f = 15 HzMax stress 420 - 434 MPa
Alternative:
a) b) c) d)
21st International Conference on Composite Materials
Xi’an, 20-25th August 2017
Figure 8: Temperature evolution up to stabilized value during cyclic loading for various frequencies
(maximum stress in the range of 420–434 MPa).
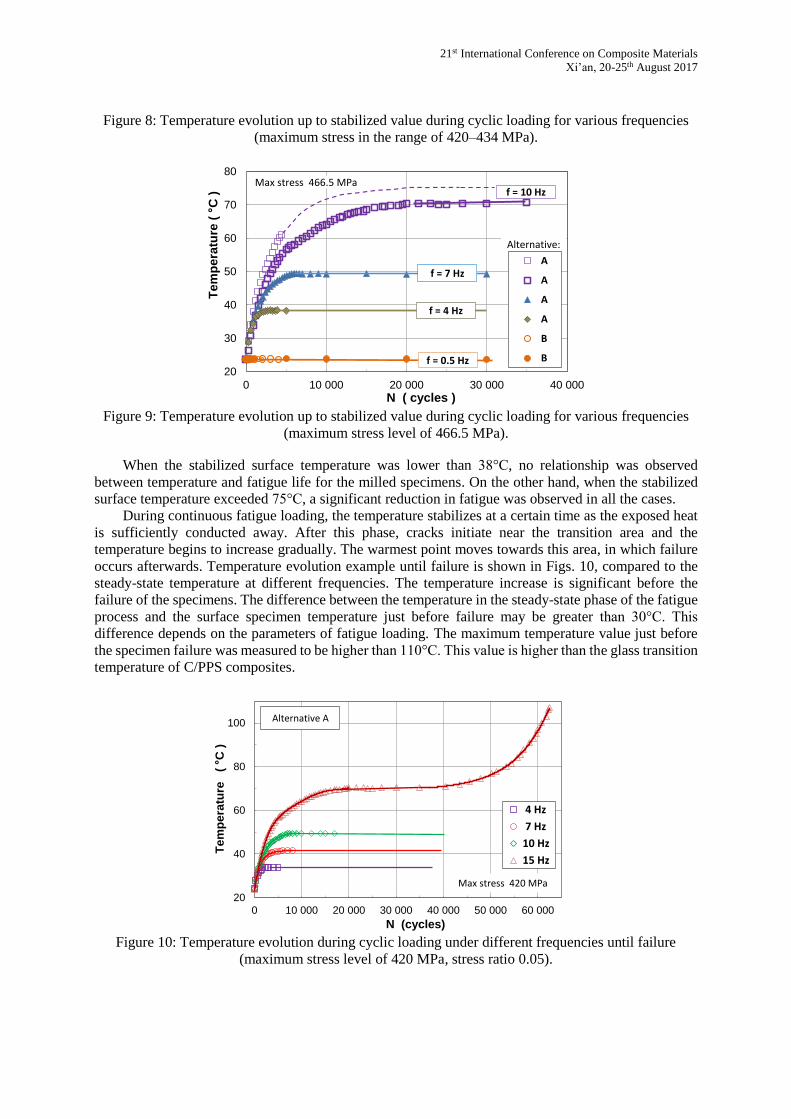
Figure 9: Temperature evolution up to stabilized value during cyclic loading for various frequencies
(maximum stress level of 466.5 MPa).
When the stabilized surface temperature was lower than 38°C, no relationship was observed
between temperature and fatigue life for the milled specimens. On the other hand, when the stabilized
surface temperature exceeded 75°C, a significant reduction in fatigue was observed in all the cases.
During continuous fatigue loading, the temperature stabilizes at a certain time as the exposed heat
is sufficiently conducted away. After this phase, cracks initiate near the transition area and the
temperature begins to increase gradually. The warmest point moves towards this area, in which failure
occurs afterwards. Temperature evolution example until failure is shown in Figs. 10, compared to the
steady-state temperature at different frequencies. The temperature increase is significant before the
failure of the specimens. The difference between the temperature in the steady-state phase of the fatigue
process and the surface specimen temperature just before failure may be greater than 30°C. This
difference depends on the parameters of fatigue loading. The maximum temperature value just before
the specimen failure was measured to be higher than 110°C. This value is higher than the glass transition
temperature of C/PPS composites.
Figure 10: Temperature evolution during cyclic loading under different frequencies until failure
(maximum stress level of 420 MPa, stress ratio 0.05).
20
30
40
50
60
70
80
0 10 000 20 000 30 000 40 000
A
A
A
A
B
B
N ( cycles )
Te
mp
era
ture
( C
)
f = 4 Hz
f = 0.5 Hz
f = 7 Hz
f = 10 HzMax stress 466.5 MPa
Alternative:
20
40
60
80
100
0 10 000 20 000 30 000 40 000 50 000 60 000
4 Hz
7 Hz
10 Hz
15 Hz
N (cycles)
Te
mp
era
ture
( C
)
Teleso 3.6
Max stress 420 MPa
Alternative A
Roman Ruzek, Martin Kadlec, and Lucie Nováková
3.3 Fractography
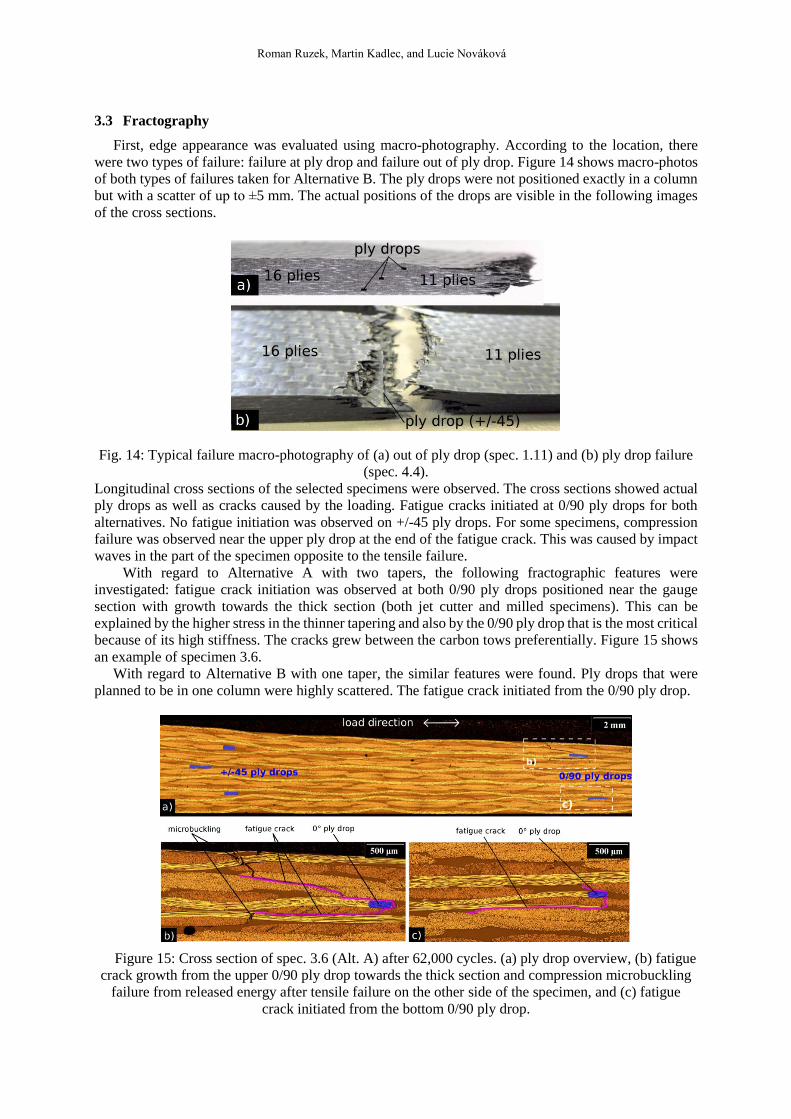
First, edge appearance was evaluated using macro-photography. According to the location, there
were two types of failure: failure at ply drop and failure out of ply drop. Figure 14 shows macro-photos
of both types of failures taken for Alternative B. The ply drops were not positioned exactly in a column
but with a scatter of up to ±5 mm. The actual positions of the drops are visible in the following images
of the cross sections.
Fig. 14: Typical failure macro-photography of (a) out of ply drop (spec. 1.11) and (b) ply drop failure
(spec. 4.4).
Longitudinal cross sections of the selected specimens were observed. The cross sections showed actual
ply drops as well as cracks caused by the loading. Fatigue cracks initiated at 0/90 ply drops for both
alternatives. No fatigue initiation was observed on +/-45 ply drops. For some specimens, compression
failure was observed near the upper ply drop at the end of the fatigue crack. This was caused by impact
waves in the part of the specimen opposite to the tensile failure.
With regard to Alternative A with two tapers, the following fractographic features were
investigated: fatigue crack initiation was observed at both 0/90 ply drops positioned near the gauge
section with growth towards the thick section (both jet cutter and milled specimens). This can be
explained by the higher stress in the thinner tapering and also by the 0/90 ply drop that is the most critical
because of its high stiffness. The cracks grew between the carbon tows preferentially. Figure 15 shows
an example of specimen 3.6.
With regard to Alternative B with one taper, the similar features were found. Ply drops that were
planned to be in one column were highly scattered. The fatigue crack initiated from the 0/90 ply drop.
Figure 15: Cross section of spec. 3.6 (Alt. A) after 62,000 cycles. (a) ply drop overview, (b) fatigue
crack growth from the upper 0/90 ply drop towards the thick section and compression microbuckling
failure from released energy after tensile failure on the other side of the specimen, and (c) fatigue
crack initiated from the bottom 0/90 ply drop.

21st International Conference on Composite Materials
Xi’an, 20-25th August 2017
6 DISCUSSION
The data presented above indicate a strong correlation between the loading parameters,
temperature, and its influence on fatigue life. The local ply drop shift leads to friction between plies and
results in a temperature increase above acceptable levels. Vieille at al. [17] and Franco at al. [18] stated
that the mechanical properties of notched and un-notched laminates subjected to temperatures higher
than the glass transition temperature of C/PPS composites (i.e., Tg = 98°C) can severely degrade the
mechanical properties of angle-ply laminates. The results presented herein show that in the case of ply
drop composition, the critical temperature considering the degradation of fatigue properties is
significantly lower. The critical temperature seems to be around 40°C. The temperature is significantly
dependent on the loading parameters.
Figure 20 shows the dependence of the temperature on the load rate. A linear relation between load
rate and temperature can be observed. The load rate in MPa.sec-1 is defined as the ratio of stress
amplitude to loading frequency. Using linear regression, the following equation was defined for the
stabilized temperature evaluation:
𝑇 = 0.0091𝑣 + 21.6, (1)
where T is the temperature and v is the load rate [MPa.sec-1]. The value of 21.6°C represents the ambient
temperature. This equation can serve as an important tool for design and control of fatigue experiments
for composites with ply drops. From the results, it is evident that temperatures higher than 40°C are
attained for loading frequencies in the range of 4 to 7 Hz, or for load rates higher than 2,000 MPa.sec-1.
These values imply a significant influence on the fatigue life, and they can be adopted as criteria for
fatigue test design and execution.
Figure 20: Temperature dependence (steady-state phase) on the load rate.
Significant scatter was observed in the horizontal positioning of the ply drops. This may be due to
manual positioning or movement during moulding. The positions of the ply drops can affect the fatigue
initiation, as the ply drops near the gauge section are more susceptible to damage, as will be discussed
later. The fatigue crack initiation occurred only for the 0/90 ply drops. For the +/-45 ply drops in the
second taper, no delamination was observed. For Alternative A (two tapers), the crack initiated only
from the tapering near the gauge section. Crack initiation near the thin region is in line with the
observations made in [19], which investigated fatigue at R = -1, and the first two ply drops close to the
thin section were observed to be the most critical for damage initiation. In [20], for laminates with ply
drops in multiple steps, the onset of delamination was observed to occur at the terminated ply group
closest to the thinnest (gauge) region. An optimal approach would be to end the 0° plies in the thicker
section and the 45° plies in the thinner section with higher stress. This would also be in line with the
0
20
40
60
80
100
0 1 000 2 000 3 000 4 000 5 000 6 000
Load rate ( MPa/sec )
Te
mp
era
ture
( C
)

Roman Ruzek, Martin Kadlec, and Lucie Nováková
design guidelines presented in [21], which state, ‘The plies should be dropped in decreasing order of
their stiffness. 0° plies should be dropped first.’
According to [22], the failure mechanisms of fatigue are very similar to those under static loading. It
is believed that the main driving force is the straightening out of the kinked cover plies. However, for
the present specimens, the layers are pressed into each other with no significant kink. Therefore, the
straightening of the cover plies is not the issue here.
6 CONCLUSION
This paper discussed the influence of loading frequency on the temperature, fatigue behaviour, and
failure mechanisms of carbon-fibre-fabric-reinforced PPS laminates whose thickness was varied using
of ply drops. The main objective was to evaluate the material characteristics and parameters that
significantly influence the fatigue characteristics, especially the influence of frequency. This
requirement arises from the need to reduce costs and save time in the experimental verification of
structures. The effects of two ply drop configurations and fatigue loading frequencies from 0.5 to 15 Hz
were investigated. The fatigue crack initiation occurred only for the 0/90 ply drops. For the +/-45 ply
drops in the second taper, no delamination was observed.
The loading frequency was shown to have a significant influence on the fatigue lifetime of
specimens with varying thickness. The local temperature increased significantly whereas the fatigue life
decreased as the loading frequency was increased. In particular, the fatigue life decreased by more than
one order of magnitude. Frequencies higher than 4–7 Hz were shown to significantly influence the
fatigue life of the investigated tailored blank structures in relation to the applied load level. Load rates
higher than 2,000 MPa.sec-1 are critical from the viewpoint of their influence on fatigue life.
ACKNOWLEDGEMENTS
This research was funded by institutional support from the Ministry of Industry and Trade of the
Czech Republic.
REFERENCES
[1] G. Reyes, U. Sharma, Modeling and damage repair of woven thermoplastic composites
subjected to low velocity impact, Composite Structures, Volume 92, Issue 2, January 2010, pp.
523-531.
[2] B. Maron, Ch. Garthaus, A. Hornig, F. Lenz, M. Hübner, M. Gude, Forming of carbon fiber
reinforced thermoplastic composite tubes – Experimental and numerical approaches, Journal of
Manufacturing Science and Technology, 7 October 2016, ISSN 1755-5817,
http://dx.doi.org/10.1016/j.cirpj.2016.09.004.
[3] S. Boria, A. Scattina, G. Belingardi, Experimental evaluation of a fully recyclable thermoplastic
composite, Composite Structures, Volume 140, 15 April 2016, pp. 21-35.
[4] R. Vodicka, Defence Science and Technology Organization, Australian Government of
Defence, Report n◦ DSTOTR-0424, 2006.
[5] V. Bellenger, J. Decelle, N. Huet, Ageing of a carbon epoxy composite for aeronautic
applications, Composites Part B, 36, 2005, pp. 189–194.
[6] R. Talreja, Damage mechanics of composite materials, Vol. 9, 1st Edition, Elsevier, ISBN:
978044488852, 1994.
[7] E. Dan-Jumbo, S.G. Zhou, C.T. Sun, Load-frequency effect on fatigue life of IMP6/APC-2
thermoplastic composite laminates, Advances in thermoplastic matrix composite materials,
ASTM STP 1044, 1989, pp. 113- 132.
[8] L.A.L. Franco, Fractographic Analysis of Advanced Polymeric Composites, MSc Thesis, ITA,
Sao Jos´e dos Campos, Brazil, 2003.
21st International Conference on Composite Materials
Xi’an, 20-25th August 2017
[9] K. He, S.. Hoa, R. Ganesan, The study of tapered laminated composite structures: a review,
Compos. Sci. Technol. 60, 2000, pp. 2643–2657 (doi:10.1016/S0266-3538(00)00138-X).
[10] S. V. Hoa, J. Daoust, B.L. Du, T. Vu-Khanh, Interlaminar stresses in tapered laminates, Polym.
Compos., 9, 1988, pp. 337–344 (doi:10.1002/pc.750090506).
[11] K.W. Gan, G. Allegri, S.R. Hallett, A simplified layered beam approach for predicting ply drop
delamination in thick composite laminates, Mater. Des., 108, 2016, pp. 570–580 (doi:
10.1016/j.matdes.2016.06.105).
[12] J. Šedek, R. Hron, M. Kadlec, Bond Joint Analysis of Thermoplastic Composite Made from
Stacked Tailored Blanks. Applied Mechanics and Materials, 827, 2015. pp. 161-168, ISSN
1662-7482 (doi: 10.4028/www.scientific.net/AMM.827.161).
[13] J. Šedek, Optimization of composite airframe rib using tailoring blank technology, In Plánička
F., Krystek J. (eds.), EAN 2016, 54th International Conference on Experimental Stress
Analysis, Hotel Srní, Srní, Czech Republic, May 30 – June 2, 2016, Department of Mechanics,
Faculty of Applied Sciences, University of West Bohemia, pp. 401-404, ISBN: 978-1-5108-
2670-0.
[14] R. Růžek, J. Šedek, M. Kadlec, P. Kucharský, Mechanical behavior of thermoplastic rib under
loading representing real structure conditions. 54th International Conference on Experimental
Stress Analysis, EAN 2016, Hotel Srni, Srni; Czech Republic; 30 May 2016 through 2 June
2016; Code 123122, Department of Mechanics, Faculty of Applied Sciences, University of
West Bohemia, pp. 356-359, ISBN: 978-1-5108-2670-0.
[15] AIMS05-09-002. Airbus Material Specification / Carbon Fiber Reinforced Thermoplastic
Materials. Airbus Industrie Engineering Directorate 31707 Blachnac Cedex France: Airbus
Industrie, 1998.
[16] ASTM D 3479/D3479M - 12. Standard Test Method for Tension-Tension Fatigue of Polymer
Matrix Composite Materials, 100 Barr Harbor Drive, PO Box C700, West Conshohocken, PA
19428-2959, United States: ASTM International, 2007.
[17] B. Vieille , J. Aucher, L. Taleb, Influence of temperature on the behavior of carbon, Materials
Science and Engineering A, 517, 2009, pp. 51–60 (doi: 10.1016/j.msea.2009.03.038).
[18] L.A.L. Franco, M.L.A. Graca, F.S. Silva, Fractography analysis and fatigue of thermoplastic
composite laminates at different environmental conditions. Materials Science and Engineering
A, 488, 2008, pp. 505–513 (doi: 10.1016/j.msea.2007.11.053).
[19] A. Weiss, W. Trabelsi, L. Michel, J.J. Barrau, S. Mahdi, Influence of ply-drop location on the
fatigue behaviour of tapered composites laminates. Procedia Engineering, 2, 2010, pp. 1105–
1114.
[20] Shim, D. J., Role of delamination and interlaminar fatigue in the failure of laminates with ply
drop offs. Massachusetts Institute of Technology, Dept. of Aeronautics and Astronautics, Thesis
(Ph. D.), Cambridge, MA, 2002 (URL: http://hdl.handle.net/1721.1/29245).
[21] A. Mukherjee, B. Varughese, Design guidelines for ply drop-off in laminated composite
structures. Composites: Part B, 32, 2001, pp. 153–164.
[22] M. R. Wisnom, R. Dixon, G. Hill, Delamination in asymmetrically tapered composites loaded in
tension, Composite Structures, Vol. 35, Iss. 3, 1996, pp. 309-322.