Embed Size (px)
Citation preview
ISWS/CIR-172/89
Circular 172
STATE OF ILLINOIS
DEPARTMENT OF ENERGY AND NATURAL RESOURCES
Frequency Distributions of Heavy Rainstorms
in Illinois
by FLOYD A. HUFF and JAMES R. ANGEL
ILLINOIS STATE WATER SURVEY
CHAMPAIGN
1989
CIRCULAR 172
Frequency Distributions of Heavy Rainstorms
in Illinois
by FLOYD A. HUFF and JAMES R. ANGEL
Title: Frequency Distributions of Heavy Rainstorms in Illinois.
Abstract: This publication represents a condensed version of an extensive report on the distributions ofheavy rainstorms in Illinois, based on data for 61 precipitation stations operated during 1901-1983. Shownare annual frequency distributions of point rainfall for periods ranging from 5 minutes to 10 days and forrecurrence intervals varying from 2 months to 100 years. Results are presented in two forms: mean relationsfor ten regions of approximately homogeneous precipitation climate, and statewide isohyetal maps based onthe 61 -station data The report also discusses the results of a special investigation pertaining to Chicago andthe surrounding six counties subject to urban influences on the precipitation distribution. The final sectionof the report provides information on the urban influences on the two Illinois counties adjacent to St. Louis.
Reference: Huff, Floyd A., and James R. Angel. Frequency Distributions of Heavy Rainstorms in Illinois.Illinois State Water Survey, Champaign, Circular 172, 1989.
Indexing Terms: Climatology, heavy rainstorms, hydroclimatology, hydrometeorology, Illinois, rainfall.
STATE OF ILLINOISHON. JAMES R. THOMPSON, Governor
DEPARTMENT OF ENERGY AND NATURAL RESOURCESKaren A. Witter, M.S., Director
BOARD OF NATURAL RESOURCES AND CONSERVATION
Karen A. Witter, M.S., Chair
Robert H. Benton, B.S.C.E., Engineering
Seymour O. Schlanger, Ph.D., Geology
H.S. Gutowsky, Ph.D., Chemistry
Roy L. Taylor, Ph.D., Plant Biology
Robert L. Metcalf, Ph.D., Biology
Judith Liebman, Ph.D.University of Illinois
John H. Yopp, Ph.D.Southern Illinois University
STATE WATER SURVEY DIVISIONRICHARD G. SEMONIN, Chief
2204 GRIFFITH DRIVECHAMPAIGN, ILLINOIS 61820
1989
ISSN 0097-5524
Printed by authority of the State of Illinois on recycled and recyclable paper
(First Printing 7-89)(Second Printing 4-92-300)
CONTENTS
PAGEIntroduction ........................................................................................................................................................... 1
Acknowledgments. .......................................................................................................................... 1Part 1: Frequency of Heavy Rainfall Events ......................................................................................................... 2Part 2: Update of Heavy Rainfall Relations in Chicago
and Northeastern Illinois. ........................................................................................................................ 26Adjustments to Report of Investigation 82 (Huff and Vogel, 1976)................................................ 27
Part 3: The St. Louis Anomaly .............................................................................................................................. 34
FIGURES
1. Precipitation-reporting stations and climatic sections usedin developing Illinois frequency relations .................................................................................................. 3
2. Locations of recording-gage stations ............................................................................................................ 43. Spatial distributions of 30-minute rainfall (inches) ....................................................................................... 84. Spatial distributions of l-hour rainfall (inches) ............................................................................................. 105. Spatial distributions of 2-hour rainfall (inches) ............................................................................................ 126. Spatial distributions of 3-hour rainfall (inches) ............................................................................................. 147. Spatial distributions of 6-hour rainfall (inches) ............................................................................................ 168. Spatial distributions of 12-hour rainfall (inches) .......................................................................................... 189. Spatial distributions of 24-hour rainfall (inches) .......................................................................................... 2010. Spatial distributions of 48-hour rainfall (inches) . ......................................................................................... 2211. Spatial distributions of 72-hour rainfall (inches) .......................................................................................... 2412. Location maps for northeast Illinois study. ................................................................................................... 2613. Frequency distribution of 24-hour maximum rainfall (inches),
Chicago urban area (adjusted). ...................................................................................................................... 2814. Frequency distribution of 24-hour maximum rainfall (inches),
six-county area (adjusted) ............................................................................................................................. 30
TABLES
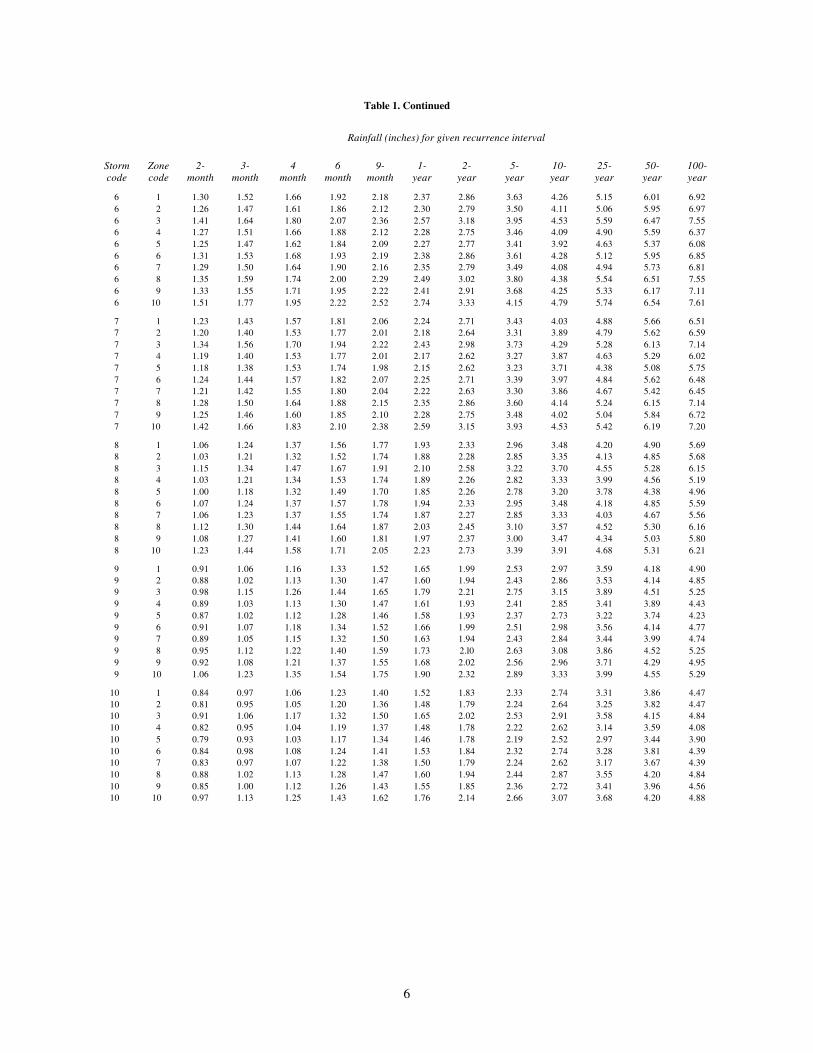
1. Sectional Frequency Distributions for Storm Periods of 5 Minutesto 10 Days and Recurrence Intervals of 2 Months to 100 Years.................................................................... 5
2. Average Ratios of X-Hour/24-Hour Rainfall for Illinois................................................................... 323. Ratios of Illinois Rainfall Amounts for Recurrence Intervals of
Less than 1 Year to Rainfall Amounts for Recurrence Intervals of 1 Year,for Various Rainstorm Periods....................................................................................................................... 32
4. Frequency Relations for Madison County, Adjusted forSt. Louis Urban Effect...................................................................................................................................... 35
FREQUENCY DISTRIBUTIONS OF HEAVY RAINSTORMSIN ILLINOIS
by Floyd A. Huff and James R. Angel
INTRODUCTION
The statewide frequency relations provided in this document have been ab-stracted from a comprehensive report on the frequency distributions and hydro-climatic characteristics of heavy rainstorms in Illinois (Huff and Angel, 1989). Therelations are those most commonly used by hydrologists, soil scientists, and otherswho need information on extreme rainfalls, and they are presented in a convenientform for application. The user is referred to the Huff-Angel report for details (if de-sired) on the methods and techniques used in the research that led to the resultsshown here. The Huff-Angel publication also addresses other aspects of Illinois ex-treme rain events, including climatic trends in heavy rainfall frequencies, urban ef-fects on the distribution of heavy rainfall, sampling variability within regions of sim-ilar rainfall climate, the seasonal distribution of heavy rainfall events, and otherpertinent spatial and temporal characteristics of heavy rainstorms.
The frequency relations presented here represent both an updating and anexpansion of those previously published by Huff and Neill (1959), Hershfield (1961),and Ackermann (1970). Their use is strongly recommended in preference to existingrelations, since they were based on longer periods of record, more observational sta-tions, consideration of climatic trends, and evaluation of urban and topographic in-fluences on heavy rainfall distributions.
All results have been expressed in the English system of units; that is, inchesas opposed to the metric system’s use of millimeters or centimeters. The frequencyrelations were derived from the partial-duration system of ranking rainfall events,which is considered most appropriate for hydrologic and most other applications. Asopposed to the annual-maxima method of frequency analysis, which incorporatesonly the highest values for each year, this system incorporates all of the highest val-ues regardless of the year in which they occur. Thus more than one value used in afrequency distribution can occur in a single year.
Acknowledgments
This report was prepared under the direction of Richard G. Semonin, Chief ofthe Illinois State Water Survey, and with the general guidance of Peter J. Lamb,Head of the Water Survey’s Climate and Meteorology Section. The research waspartially supported by the Illinois Department of Transportation, Division of WaterResources. John Vogel directed the initial research for this project. John Brother,Linda Riggin, and Lynn Weiss prepared the illlustrations, and Gail Taylor edited thereport.
1
PART 1: FREQUENCY OF HEAVY RAINFALL EVENTS
Frequency distributions were determined for rain periods ranging from 5minutes to 10 days and for recurrence intervals varying from 2 months to 100 years.Analyses were based on carefully edited daily data from 61 Illinois precipitation-re-porting stations in operation during 1901-1983 (figure 1) and 55 recording-gage sta-tions operated in and near Illinois during 1948-1983 (figure 2).
The state was divided into ten sections of approximately homogeneous pre-cipitation climate with respect to the distribution of heavy rainstorm events (figure1). This division was based on assessment of the 83-year sample of heavy rainstormsand on consideration of pertinent meteorological and climatological factors. Bothsectional mean and point rainfall frequency distributions were derived, after ad-justing for the climatic trend found in the 83-year sample. Sectional mean relation-ships were developed because this approach lessens the effects of natural and hu-man-induced variability (undetected measurement and computational errors) be-tween points in an area of approximately homogeneous precipitation climate. How-ever, some users prefer to use individual point relationships; these are included inthe Huff-Angel report (1989), but not in this abbreviated version.
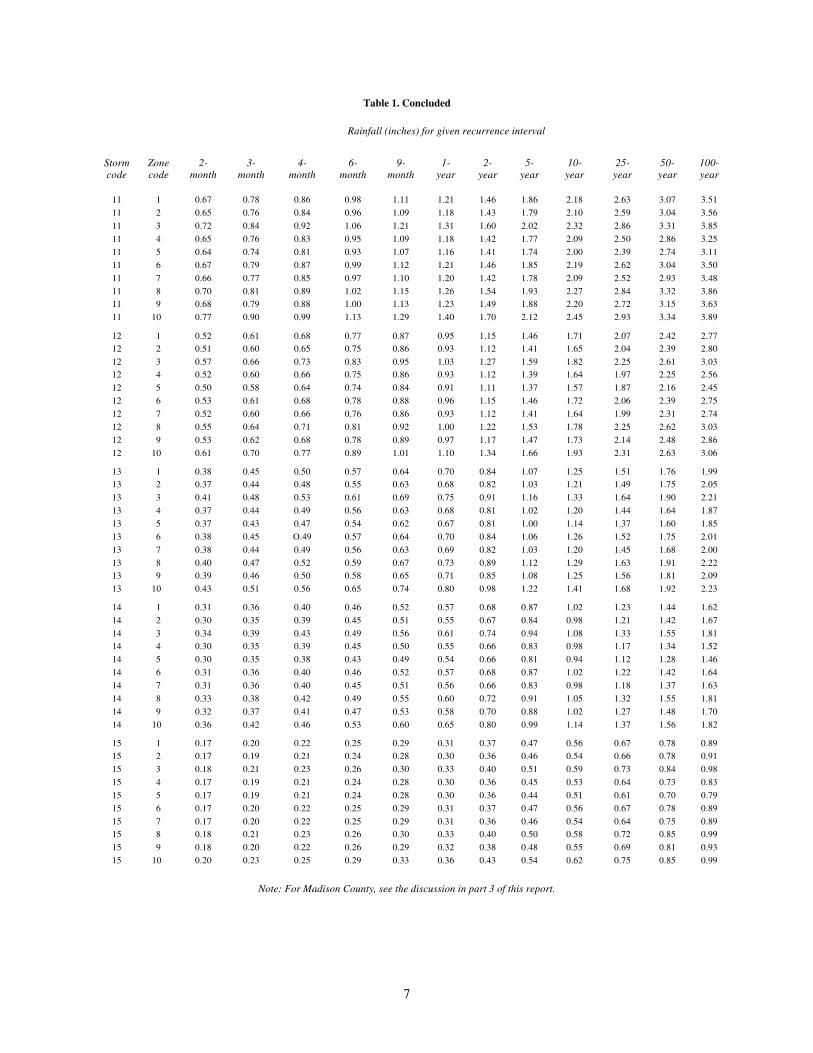
The sectional relations are presented in table 1. In this table, the first column(storm code) refers to the storm (rain) period. The codes are numbered consecutivelyfrom 1 to 15, with code 1 representing 10-day storm periods and code 15 representing5-minute periods. The second column (zone code) refers to the ten climatic sections.Thus zone 1 is the northwestern section, zone 2 is northeastern, and so on, asindicated in the code explanations included with the table.
For each storm period, rainfall amounts are shown for each climatic sectionfor each recurrence interval from 2 months to 100 years. For example, assume a userwishes to know the 10-year frequency of 24-hour rainfall in the central section.First, move to storm code 5 (24-hour rainfall). In the code 5 grouping, move to zone 4(central section) and continue across the page to the column labeled "10-year." Atthis point (storm code 5, zone 4) the rainfall amount is 4.45 inches, which is the 24-hour rainfall to be expected, on the average, once in 10 years at any given point in thecentral section.
Figures 3 through 11 are isohyetal maps for selected storm periods andrecurrence intervals, based on point rainfall frequencies derived for each of the 61long-term stations (1901-1983). Isohyetal presentations are preferred over sectionalmeans by some hydrologists, especially when interpolation between adjoining basinsis involved. Therefore, isohyetal maps are shown for storm periods ranging from 30minutes to 72 hours and for recurrence intervals of 2 to 100 years, which are thestorm periods and recurrence intervals most commonly used in hydrologic designproblems. The six-county cutoff in northeastern Illinois in these figures was thesubject of a special study. This study is summarized in part 2 of this report and isdiscussed in detail by Huff and Angel (1989).
2
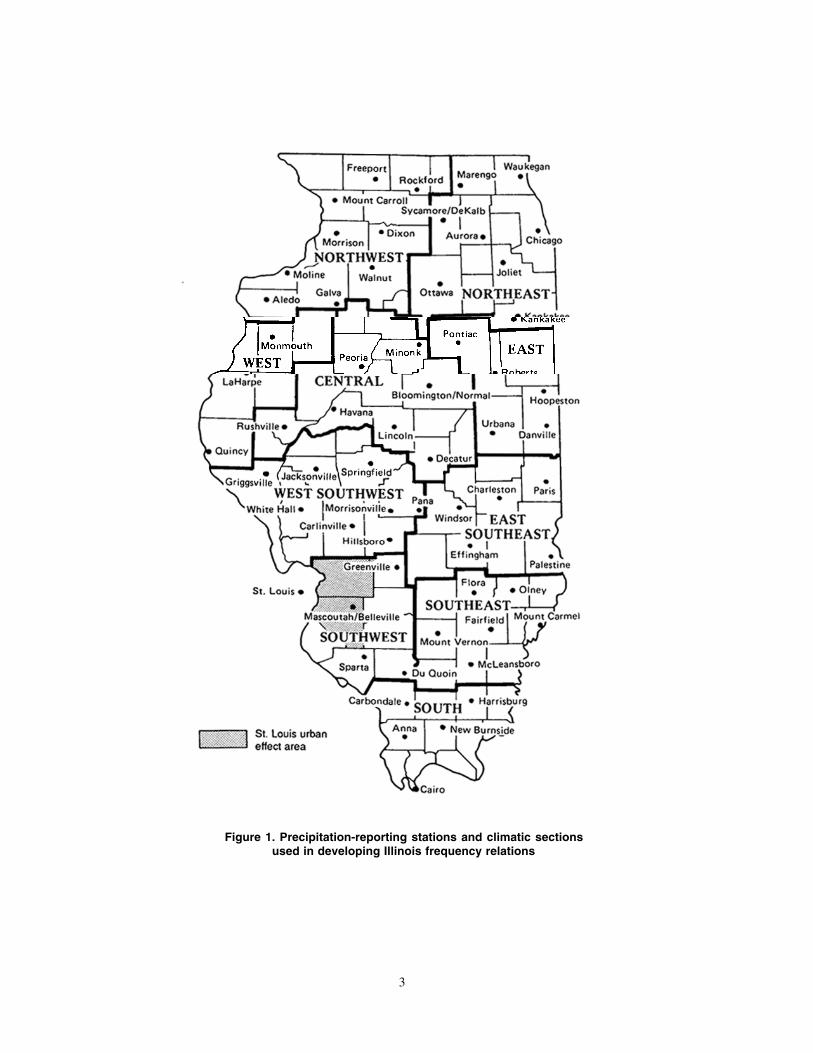
Figure 1. Precipitation-reporting stations and climatic sectionsused in developing Illinois frequency relations
3
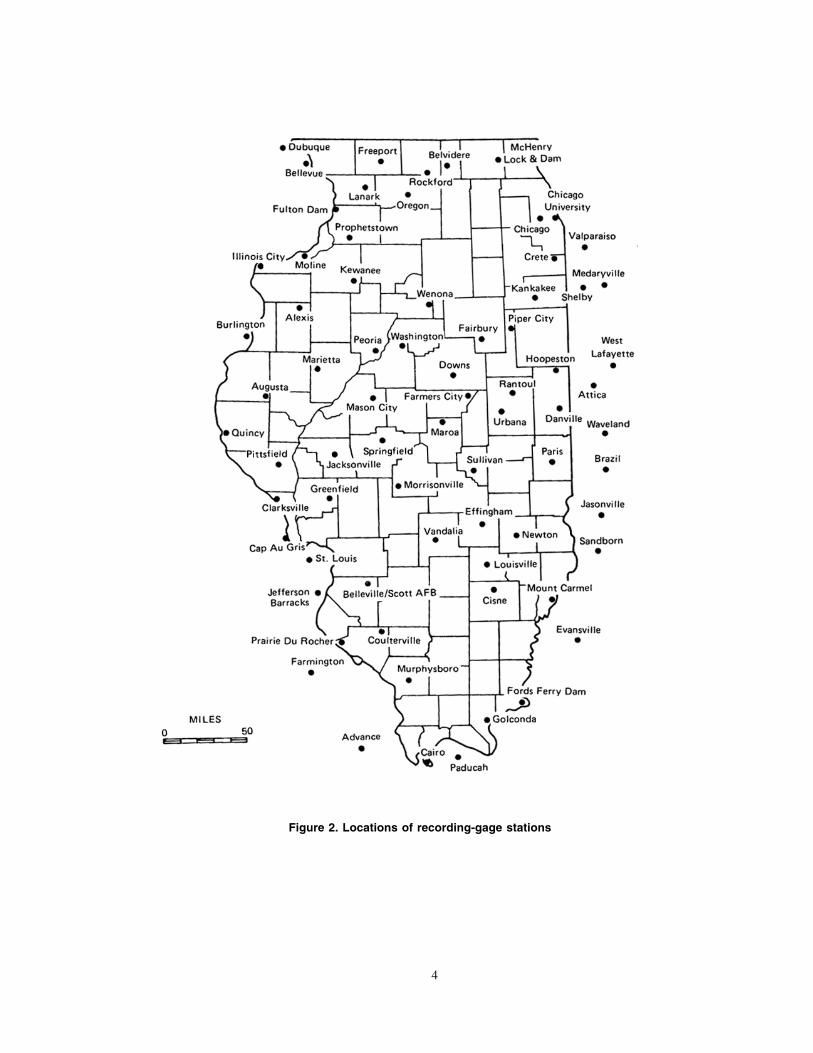
Figure 2. Locations of recording-gage stations
4
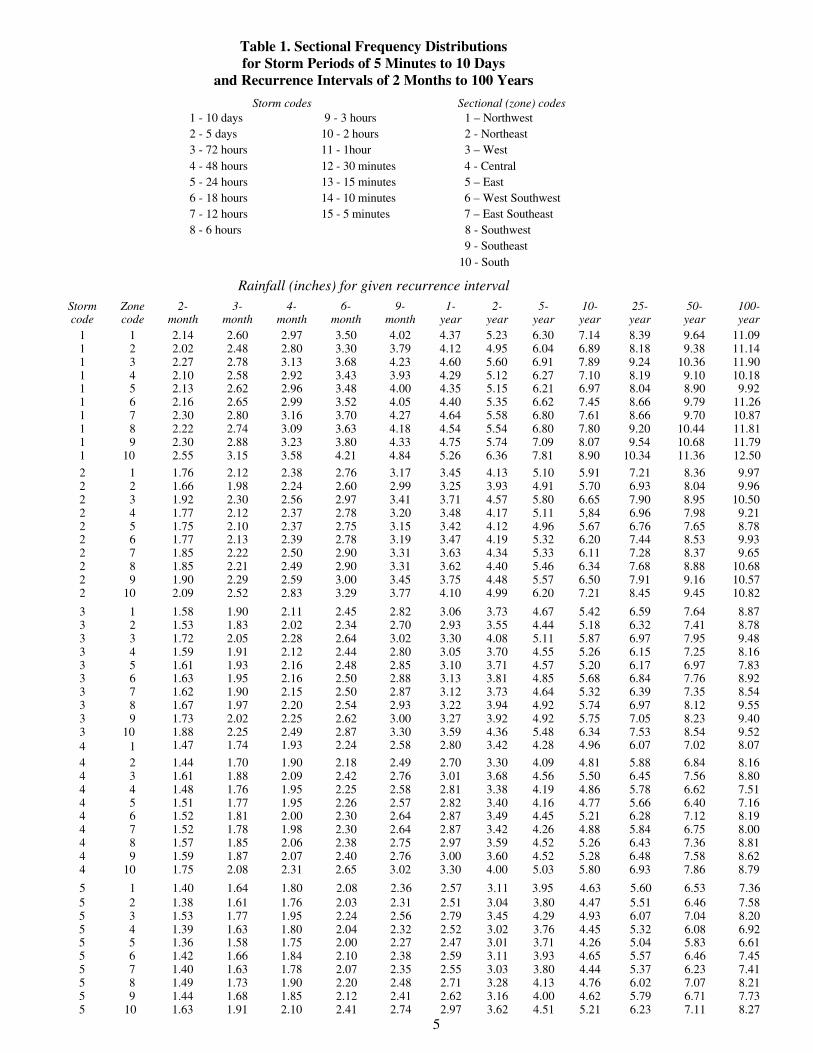
Table 1. Sectional Frequency Distributionsfor Storm Periods of 5 Minutes to 10 Days
and Recurrence Intervals of 2 Months to 100 Years
Storm codes Sectional (zone) codes1 - 10 days 9 - 3 hours 1 – Northwest2 - 5 days 10 - 2 hours 2 - Northeast3 - 72 hours 11 - 1hour 3 – West4 - 48 hours 12 - 30 minutes 4 - Central5 - 24 hours 13 - 15 minutes 5 – East6 - 18 hours 14 - 10 minutes 6 – West Southwest7 - 12 hours 15 - 5 minutes 7 – East Southeast8 - 6 hours 8 - Southwest
9 - Southeast10 - South
Rainfall (inches) for given recurrence intervalStormcode
Zonecode
2-month
3-month
4-month
6-month
9-month
1-year
2-year
5-year
10-year
25-year
50-year
100-year
1 1 2.14 2.60 2.97 3.50 4.02 4.37 5.23 6.30 7.14 8.39 9.64 11.091 2 2.02 2.48 2.80 3.30 3.79 4.12 4.95 6.04 6.89 8.18 9.38 11.141 3 2.27 2.78 3.13 3.68 4.23 4.60 5.60 6.91 7.89 9.24 10.36 11.901 4 2.10 2.58 2.92 3.43 3.93 4.29 5.12 6.27 7.10 8.19 9.10 10.181 5 2.13 2.62 2.96 3.48 4.00 4.35 5.15 6.21 6.97 8.04 8.90 9.921 6 2.16 2.65 2.99 3.52 4.05 4.40 5.35 6.62 7.45 8.66 9.79 11.261 7 2.30 2.80 3.16 3.70 4.27 4.64 5.58 6.80 7.61 8.66 9.70 10.871 8 2.22 2.74 3.09 3.63 4.18 4.54 5.54 6.80 7.80 9.20 10.44 11.811 9 2.30 2.88 3.23 3.80 4.33 4.75 5.74 7.09 8.07 9.54 10.68 11.791 10 2.55 3.15 3.58 4.21 4.84 5.26 6.36 7.81 8.90 10.34 11.36 12.50
2 1 1.76 2.12 2.38 2.76 3.17 3.45 4.13 5.10 5.91 7.21 8.36 9.972 2 1.66 1.98 2.24 2.60 2.99 3.25 3.93 4.91 5.70 6.93 8.04 9.962 3 1.92 2.30 2.56 2.97 3.41 3.71 4.57 5.80 6.65 7.90 8.95 10.502 4 1.77 2.12 2.37 2.78 3.20 3.48 4.17 5.11 5,84 6.96 7.98 9.212 5 1.75 2.10 2.37 2.75 3.15 3.42 4.12 4.96 5.67 6.76 7.65 8.782 6 1.77 2.13 2.39 2.78 3.19 3.47 4.19 5.32 6.20 7.44 8.53 9.932 7 1.85 2.22 2.50 2.90 3.31 3.63 4.34 5.33 6.11 7.28 8.37 9.652 8 1.85 2.21 2.49 2.90 3.31 3.62 4.40 5.46 6.34 7.68 8.88 10.682 9 1.90 2.29 2.59 3.00 3.45 3.75 4.48 5.57 6.50 7.91 9.16 10.572 10 2.09 2.52 2.83 3.29 3.77 4.10 4.99 6.20 7.21 8.45 9.45 10.82
3 1 1.58 1.90 2.11 2.45 2.82 3.06 3.73 4.67 5.42 6.59 7.64 8.873 2 1.53 1.83 2.02 2.34 2.70 2.93 3.55 4.44 5.18 6.32 7.41 8.783 3 1.72 2.05 2.28 2.64 3.02 3.30 4.08 5.11 5.87 6.97 7.95 9.483 4 1.59 1.91 2.12 2.44 2.80 3.05 3.70 4.55 5.26 6.15 7.25 8.163 5 1.61 1.93 2.16 2.48 2.85 3.10 3.71 4.57 5.20 6.17 6.97 7.833 6 1.63 1.95 2.16 2.50 2.88 3.13 3.81 4.85 5.68 6.84 7.76 8.923 7 1.62 1.90 2.15 2.50 2.87 3.12 3.73 4.64 5.32 6.39 7.35 8.543 8 1.67 1.97 2.20 2.54 2.93 3.22 3.94 4.92 5.74 6.97 8.12 9.553 9 1.73 2.02 2.25 2.62 3.00 3.27 3.92 4.92 5.75 7.05 8.23 9.403 10 1.88 2.25 2.49 2.87 3.30 3.59 4.36 5.48 6.34 7.53 8.54 9.524 1 1.47 1.74 1.93 2.24 2.58 2.80 3.42 4.28 4.96 6.07 7.02 8.07
4 2 1.44 1.70 1.90 2.18 2.49 2.70 3.30 4.09 4.81 5.88 6.84 8.164 3 1.61 1.88 2.09 2.42 2.76 3.01 3.68 4.56 5.50 6.45 7.56 8.804 4 1.48 1.76 1.95 2.25 2.58 2.81 3.38 4.19 4.86 5.78 6.62 7.514 5 1.51 1.77 1.95 2.26 2.57 2.82 3.40 4.16 4.77 5.66 6.40 7.164 6 1.52 1.81 2.00 2.30 2.64 2.87 3.49 4.45 5.21 6.28 7.12 8.194 7 1.52 1.78 1.98 2.30 2.64 2.87 3.42 4.26 4.88 5.84 6.75 8.004 8 1.57 1.85 2.06 2.38 2.75 2.97 3.59 4.52 5.26 6.43 7.36 8.814 9 1.59 1.87 2.07 2.40 2.76 3.00 3.60 4.52 5.28 6.48 7.58 8.624 10 1.75 2.08 2.31 2.65 3.02 3.30 4.00 5.03 5.80 6.93 7.86 8.79
5 1 1.40 1.64 1.80 2.08 2.36 2.57 3.11 3.95 4.63 5.60 6.53 7.36
58.275 10 1.63 1.91 2.10 2.41 2.74 2.97 3.62 4.51 5.21 6.23 7.117.735 9 1.44 1.68 1.85 2.12 2.41 2.62 3.16 4.00 4.62 5.79 6.718.215 8 1.49 1.73 1.90 2.20 2.48 2.71 3.28 4.13 4.76 6.02 7.077.415 7 1.40 1.63 1.78 2.07 2.35 2.55 3.03 3.80 4.44 5.37 6.237.455 6 1.42 1.66 1.84 2.10 2.38 2.59 3.11 3.93 4.65 5.57 6.466.615 5 1.36 1.58 1.75 2.00 2.27 2.47 3.01 3.71 4.26 5.04 5.83
5 2 1.38 1.61 1.76 2.03 2.31 2.51 3.04 3.80 4.47 5.51 6.46
6.92
7.58
5 4 1.39 1.63 1.80 2.04 2.32 2.52 3.02 3.76 4.45 5.32 6.088.205 3 1.53 1.77 1.95 2.24 2.56 2.79 3.45 4.29 4.93 6.07 7.04
6
Table 1. Continued
Rainfall (inches) for given recurrence interval
Storm code
Zone code
2- month
3- month
4 month
6 month
9- month
1- year
2- year
5- year
10- year
25- year
50- year
100- year
6 1 1.30 1.52 1.66 1.92 2.18 2.37 2.86 3.63 4.26 5.15 6.01 6.92 6 2 1.26 1.47 1.61 1.86 2.12 2.30 2.79 3.50 4.11 5.06 5.95 6.97 6 3 1.41 1.64 1.80 2.07 2.36 2.57 3.18 3.95 4.53 5.59 6.47 7.55 6 4 1.27 1.51 1.66 1.88 2.12 2.28 2.75 3.46 4.09 4.90 5.59 6.37 6 5 1.25 1.47 1.62 1.84 2.09 2.27 2.77 3.41 3.92 4.63 5.37 6.08 6 6 1.31 1.53 1.68 1.93 2.19 2.38 2.86 3.61 4.28 5.12 5.95 6.85 6 7 1.29 1.50 1.64 1.90 2.16 2.35 2.79 3.49 4.08 4.94 5.73 6.81 6 8 1.35 1.59 1.74 2.00 2.29 2.49 3.02 3.80 4.38 5.54 6.51 7.55 6 9 1.33 1.55 1.71 1.95 2.22 2.41 2.91 3.68 4.25 5.33 6.17 7.11 6 10 1.51 1.77 1.95 2.22 2.52 2.74 3.33 4.15 4.79 5.74 6.54 7.61
7 1 1.23 1.43 1.57 1.81 2.06 2.24 2.71 3.43 4.03 4.88 5.66 6.51 7 2 1.20 1.40 1.53 1.77 2.01 2.18 2.64 3.31 3.89 4.79 5.62 6.59 7 3 1.34 1.56 1.70 1.94 2.22 2.43 2.98 3.73 4.29 5.28 6.13 7.14 7 4 1.19 1.40 1.53 1.77 2.01 2.17 2.62 3.27 3.87 4.63 5.29 6.02 7 5 1.18 1.38 1.53 1.74 1.98 2.15 2.62 3.23 3.71 4.38 5.08 5.75 7 6 1.24 1.44 1.57 1.82 2.07 2.25 2.71 3.39 3.97 4.84 5.62 6.48 7 7 1.21 1.42 1.55 1.80 2.04 2.22 2.63 3.30 3.86 4.67 5.42 6.45 7 8 1.28 1.50 1.64 1.88 2.15 2.35 2.86 3.60 4.14 5.24 6.15 7.14 7 9 1.25 1.46 1.60 1.85 2.10 2.28 2.75 3.48 4.02 5.04 5.84 6.72 7 10 1.42 1.66 1.83 2.10 2.38 2.59 3.15 3.93 4.53 5.42 6.19 7.20
8 1 1.06 1.24 1.37 1.56 1.77 1.93 2.33 2.96 3.48 4.20 4.90 5.69 8 2 1.03 1.21 1.32 1.52 1.74 1.88 2.28 2.85 3.35 4.13 4.85 5.68 8 3 1.15 1.34 1.47 1.67 1.91 2.10 2.58 3.22 3.70 4.55 5.28 6.15 8 4 1.03 1.21 1.34 1.53 1.74 1.89 2.26 2.82 3.33 3.99 4.56 5.19 8 5 1.00 1.18 1.32 1.49 1.70 1.85 2.26 2.78 3.20 3.78 4.38 4.96 8 6 1.07 1.24 1.37 1.57 1.78 1.94 2.33 2.95 3.48 4.18 4.85 5.59 8 7 1.06 1.23 1.37 1.55 1.74 1.87 2.27 2.85 3.33 4.03 4.67 5.56 8 8 1.12 1.30 1.44 1.64 1.87 2.03 2.45 3.10 3.57 4.52 5.30 6.16 8 9 1.08 1.27 1.41 1.60 1.81 1.97 2.37 3.00 3.47 4.34 5.03 5.80 8 10 1.23 1.44 1.58 1.71 2.05 2.23 2.73 3.39 3.91 4.68 5.31 6.21
9 1 0.91 1.06 1.16 1.33 1.52 1.65 1.99 2.53 2.97 3.59 4.18 4.90 9 2 0.88 1.02 1.13 1.30 1.47 1.60 1.94 2.43 2.86 3.53 4.14 4.85 9 3 0.98 1.15 1.26 1.44 1.65 1.79 2.21 2.75 3.15 3.89 4.51 5.25 9 4 0.89 1.03 1.13 1.30 1.47 1.61 1.93 2.41 2.85 3.41 3.89 4.43 9 5 0.87 1.02 1.12 1.28 1.46 1.58 1.93 2.37 2.73 3.22 3.74 4.23 9 6 0.91 1.07 1.18 1.34 1.52 1.66 1.99 2.51 2.98 3.56 4.14 4.77 9 7 0.89 1.05 1.15 1.32 1.50 1.63 1.94 2.43 2.84 3.44 3.99 4.74 9 8 0.95 1.12 1.22 1.40 1.59 1.73 2.l0 2.63 3.08 3.86 4.52 5.25 9 9 0.92 1.08 1.21 1.37 1.55 1.68 2.02 2.56 2.96 3.71 4.29 4.95 9 10 1.06 1.23 1.35 1.54 1.75 1.90 2.32 2.89 3.33 3.99 4.55 5.29
10 1 0.84 0.97 1.06 1.23 1.40 1.52 1.83 2.33 2.74 3.31 3.86 4.47 10 2 0.81 0.95 1.05 1.20 1.36 1.48 1.79 2.24 2.64 3.25 3.82 4.47 10 3 0.91 1.06 1.17 1.32 1.50 1.65 2.02 2.53 2.91 3.58 4.15 4.84 10 4 0.82 0.95 1.04 1.19 1.37 1.48 1.78 2.22 2.62 3.14 3.59 4.08 10 5 0.79 0.93 1.03 1.17 1.34 1.46 1.78 2.19 2.52 2.97 3.44 3.90 10 6 0.84 0.98 1.08 1.24 1.41 1.53 1.84 2.32 2.74 3.28 3.81 4.39 10 7 0.83 0.97 1.07 1.22 1.38 1.50 1.79 2.24 2.62 3.17 3.67 4.39 10 8 0.88 1.02 1.13 1.28 1.47 1.60 1.94 2.44 2.87 3.55 4.20 4.84 10 9 0.85 1.00 1.12 1.26 1.43 1.55 1.85 2.36 2.72 3.41 3.96 4.56 10 10 0.97 1.13 1.25 1.43 1.62 1.76 2.14 2.66 3.07 3.68 4.20 4.88
7
Table 1. Concluded
Rainfall (inches) for given recurrence interval
Storm code
Zone code
2- month
3- month
4- month
6- month
9- month
1- year
2- year
5- year
10- year
25- year
50- year
100- year
11 1 0.67 0.78 0.86 0.98 1.11 1.21 1.46 1.86 2.18 2.63 3.07 3.51
11 2 0.65 0.76 0.84 0.96 1.09 1.18 1.43 1.79 2.10 2.59 3.04 3.56
11 3 0.72 0.84 0.92 1.06 1.21 1.31 1.60 2.02 2.32 2.86 3.31 3.85
11 4 0.65 0.76 0.83 0.95 1.09 1.18 1.42 1.77 2.09 2.50 2.86 3.25
11 5 0.64 0.74 0.81 0.93 1.07 1.16 1.41 1.74 2.00 2.39 2.74 3.11
11 6 0.67 0.79 0.87 0.99 1.12 1.21 1.46 1.85 2.19 2.62 3.04 3.50
11 7 0.66 0.77 0.85 0.97 1.10 1.20 1.42 1.78 2.09 2.52 2.93 3.48
11 8 0.70 0.81 0.89 1.02 1.15 1.26 1.54 1.93 2.27 2.84 3.32 3.86 11 9 0.68 0.79 0.88 1.00 1.13 1.23 1.49 1.88 2.20 2.72 3.15 3.63
11 10 0.77 0.90 0.99 1.13 1.29 1.40 1.70 2.12 2.45 2.93 3.34 3.89
12 1 0.52 0.61 0.68 0.77 0.87 0.95 1.15 1.46 1.71 2.07 2.42 2.77 12 2 0.51 0.60 0.65 0.75 0.86 0.93 1.12 1.41 1.65 2.04 2.39 2.80
12 3 0.57 0.66 0.73 0.83 0.95 1.03 1.27 1.59 1.82 2.25 2.61 3.03 12 4 0.52 0.60 0.66 0.75 0.86 0.93 1.12 1.39 1.64 1.97 2.25 2.56
12 5 0.50 0.58 0.64 0.74 0.84 0.91 1.11 1.37 1.57 1.87 2.16 2.45
12 6 0.53 0.61 0.68 0.78 0.88 0.96 1.15 1.46 1.72 2.06 2.39 2.75
12 7 0.52 0.60 0.66 0.76 0.86 0.93 1.12 1.41 1.64 1.99 2.31 2.74
12 8 0.55 0.64 0.71 0.81 0.92 1.00 1.22 1.53 1.78 2.25 2.62 3.03
12 9 0.53 0.62 0.68 0.78 0.89 0.97 1.17 1.47 1.73 2.14 2.48 2.86
12 10 0.61 0.70 0.77 0.89 1.01 1.10 1.34 1.66 1.93 2.31 2.63 3.06
13 1 0.38 0.45 0.50 0.57 0.64 0.70 0.84 1.07 1.25 1.51 1.76 1.99 13 2 0.37 0.44 0.48 0.55 0.63 0.68 0.82 1.03 1.21 1.49 1.75 2.05
13 3 0.41 0.48 0.53 0.61 0.69 0.75 0.91 1.16 1.33 1.64 1.90 2.21
13 4 0.37 0.44 0.49 0.56 0.63 0.68 0.81 1.02 1.20 1.44 1.64 1.87
13 5 0.37 0.43 0.47 0.54 0.62 0.67 0.81 1.00 1.14 1.37 1.60 1.85
13 6 0.38 0.45 O.49 0.57 0.64 0.70 0.84 1.06 1.26 1.52 1.75 2.01
13 7 0.38 0.44 0.49 0.56 0.63 0.69 0.82 1.03 1.20 1.45 1.68 2.00
13 8 0.40 0.47 0.52 0.59 0.67 0.73 0.89 1.12 1.29 1.63 1.91 2.22 13 9 0.39 0.46 0.50 0.58 0.65 0.71 0.85 1.08 1.25 1.56 1.81 2.09
13 10 0.43 0.51 0.56 0.65 0.74 0.80 0.98 1.22 1.41 1.68 1.92 2.23
14 1 0.31 0.36 0.40 0.46 0.52 0.57 0.68 0.87 1.02 1.23 1.44 1.62
14 2 0.30 0.35 0.39 0.45 0.51 0.55 0.67 0.84 0.98 1.21 1.42 1.67
14 3 0.34 0.39 0.43 0.49 0.56 0.61 0.74 0.94 1.08 1.33 1.55 1.81 14 4 0.30 0.35 0.39 0.45 0.50 0.55 0.66 0.83 0.98 1.17 1.34 1.52
14 5 0.30 0.35 0.38 0.43 0.49 0.54 0.66 0.81 0.94 1.12 1.28 1.46
14 6 0.31 0.36 0.40 0.46 0.52 0.57 0.68 0.87 1.02 1.22 1.42 1.64
14 7 0.31 0.36 0.40 0.45 0.51 0.56 0.66 0.83 0.98 1.18 1.37 1.63
14 8 0.33 0.38 0.42 0.49 0.55 0.60 0.72 0.91 1.05 1.32 1.55 1.81
14 9 0.32 0.37 0.41 0.47 0.53 0.58 0.70 0.88 1.02 1.27 1.48 1.70
14 10 0.36 0.42 0.46 0.53 0.60 0.65 0.80 0.99 1.14 1.37 1.56 1.82
15 1 0.17 0.20 0.22 0.25 0.29 0.31 0.37 0.47 0.56 0.67 0.78 0.89 15 2 0.17 0.19 0.21 0.24 0.28 0.30 0.36 0.46 0.54 0.66 0.78 0.91
15 3 0.18 0.21 0.23 0.26 0.30 0.33 0.40 0.51 0.59 0.73 0.84 0.98
15 4 0.17 0.19 0.21 0.24 0.28 0.30 0.36 0.45 0.53 0.64 0.73 0.83
15 5 0.17 0.19 0.21 0.24 0.28 0.30 0.36 0.44 0.51 0.61 0.70 0.79
15 6 0.17 0.20 0.22 0.25 0.29 0.31 0.37 0.47 0.56 0.67 0.78 0.89
15 7 0.17 0.20 0.22 0.25 0.29 0.31 0.36 0.46 0.54 0.64 0.75 0.89 15 8 0.18 0.21 0.23 0.26 0.30 0.33 0.40 0.50 0.58 0.72 0.85 0.99
15 9 0.18 0.20 0.22 0.26 0.29 0.32 0.38 0.48 0.55 0.69 0.81 0.93
15 10 0.20 0.23 0.25 0.29 0.33 0.36 0.43 0.54 0.62 0.75 0.85 0.99
Note: For Madison County, see the discussion in part 3 of this report.
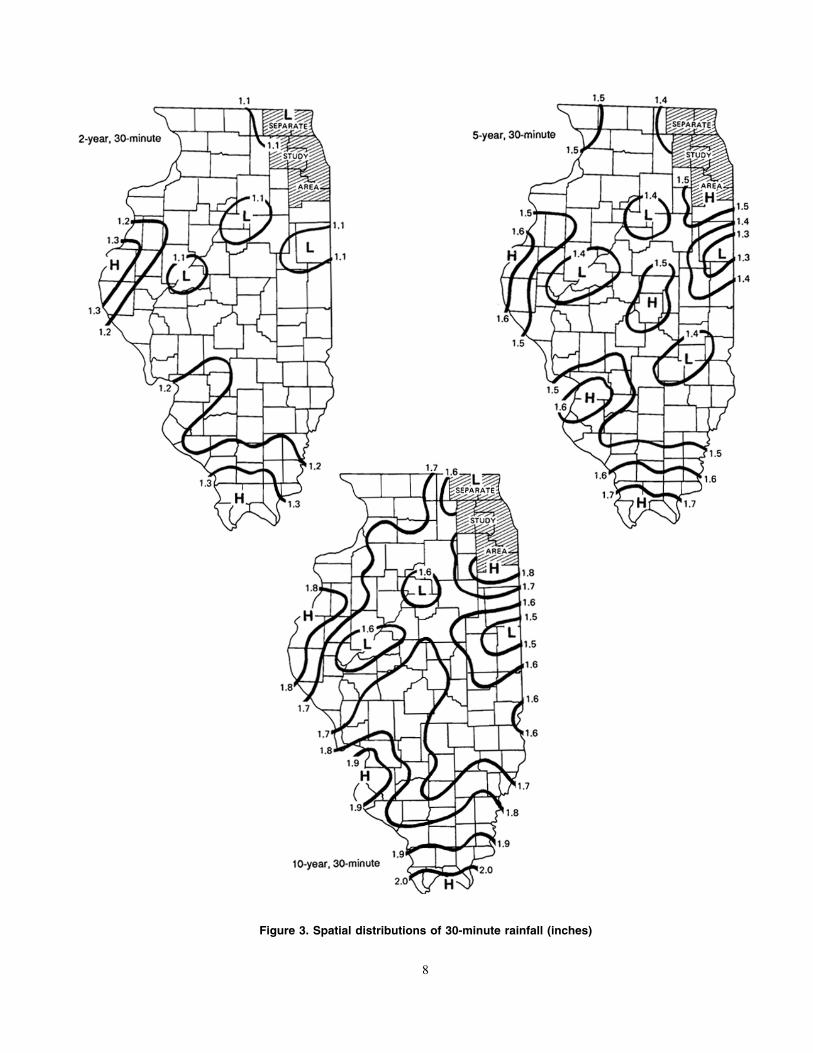
Figure 3. Spatial distributions of 30-minute rainfall (inches)
8
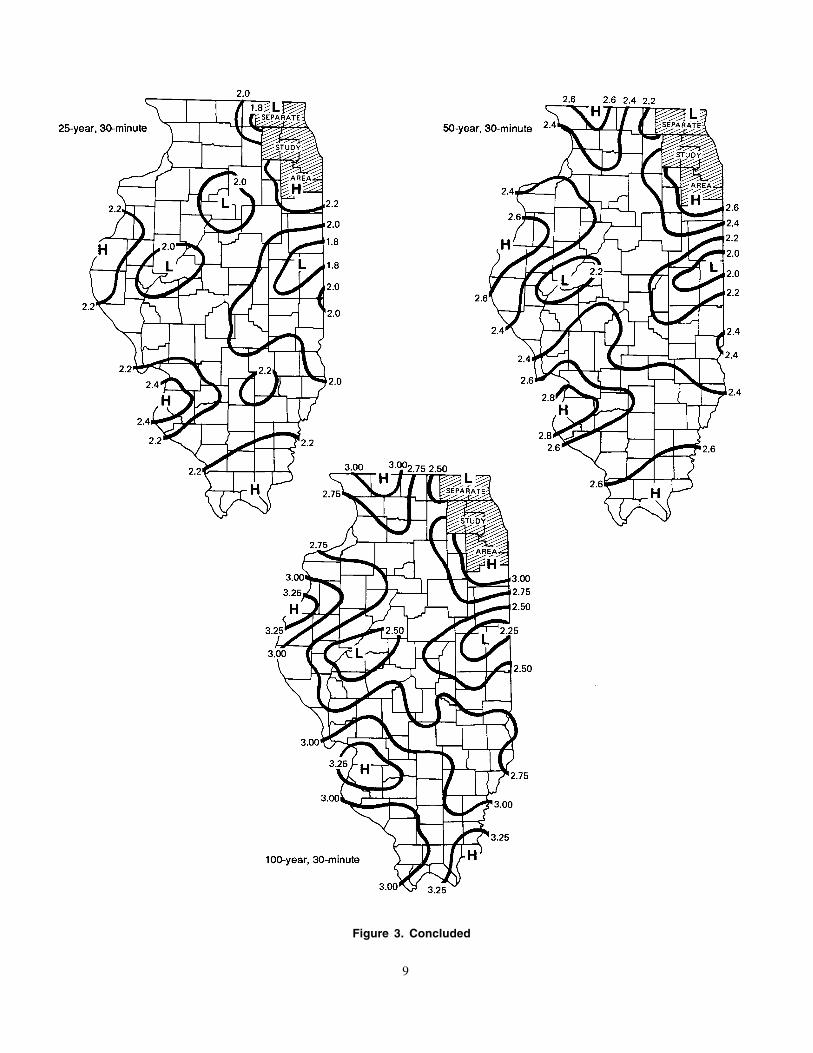
Figure 3. Concluded
9
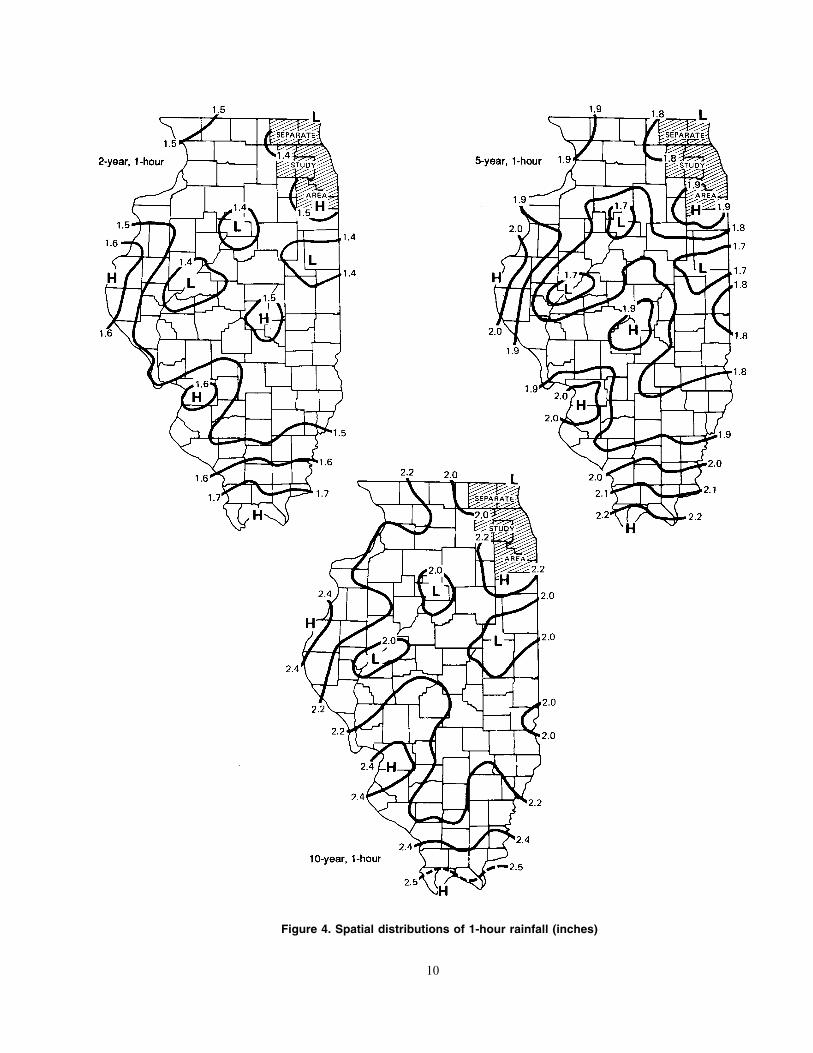
Figure 4. Spatial distributions of 1-hour rainfall (inches)
10
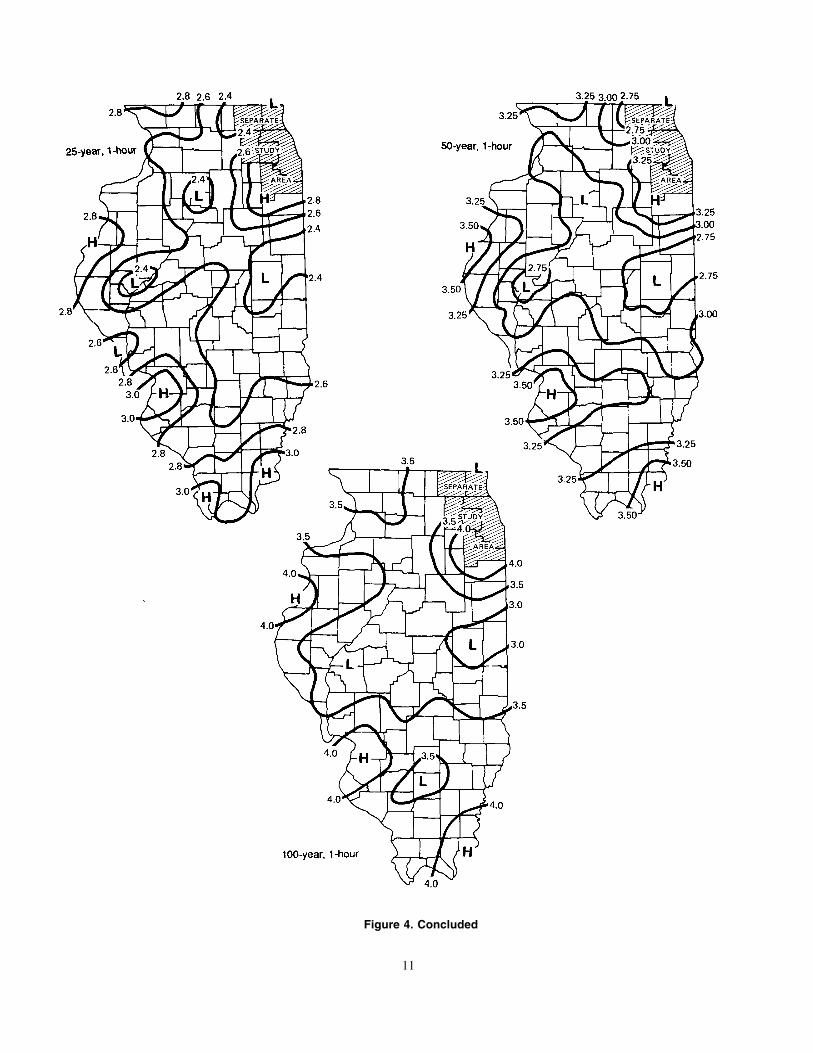
Figure 4. Concluded
11
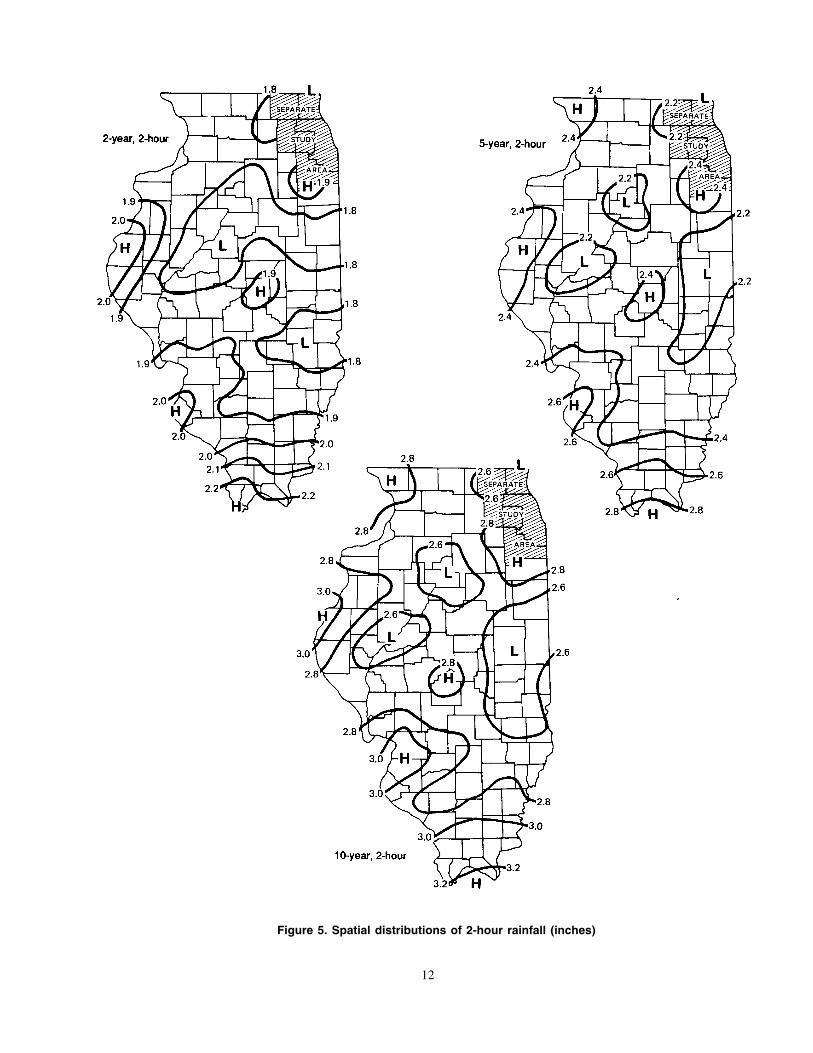
Figure 5. Spatial distributions of 2-hour rainfall (inches)
12
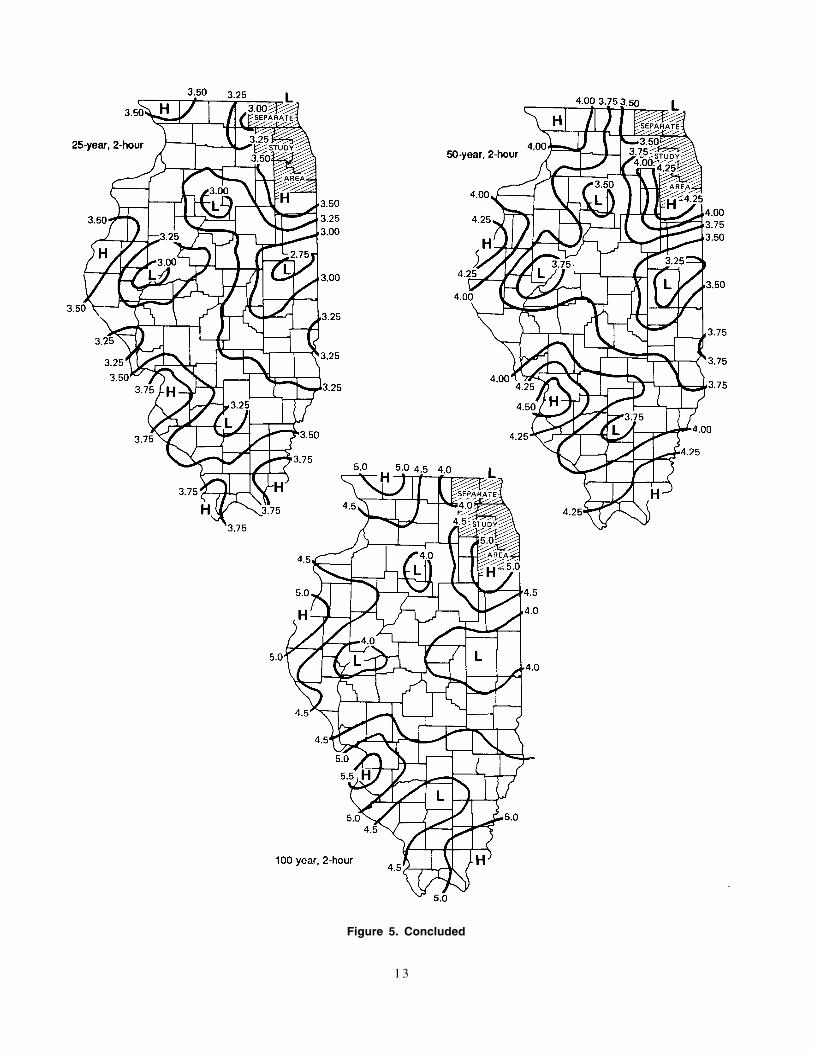
Figure 5. Concluded
1 3
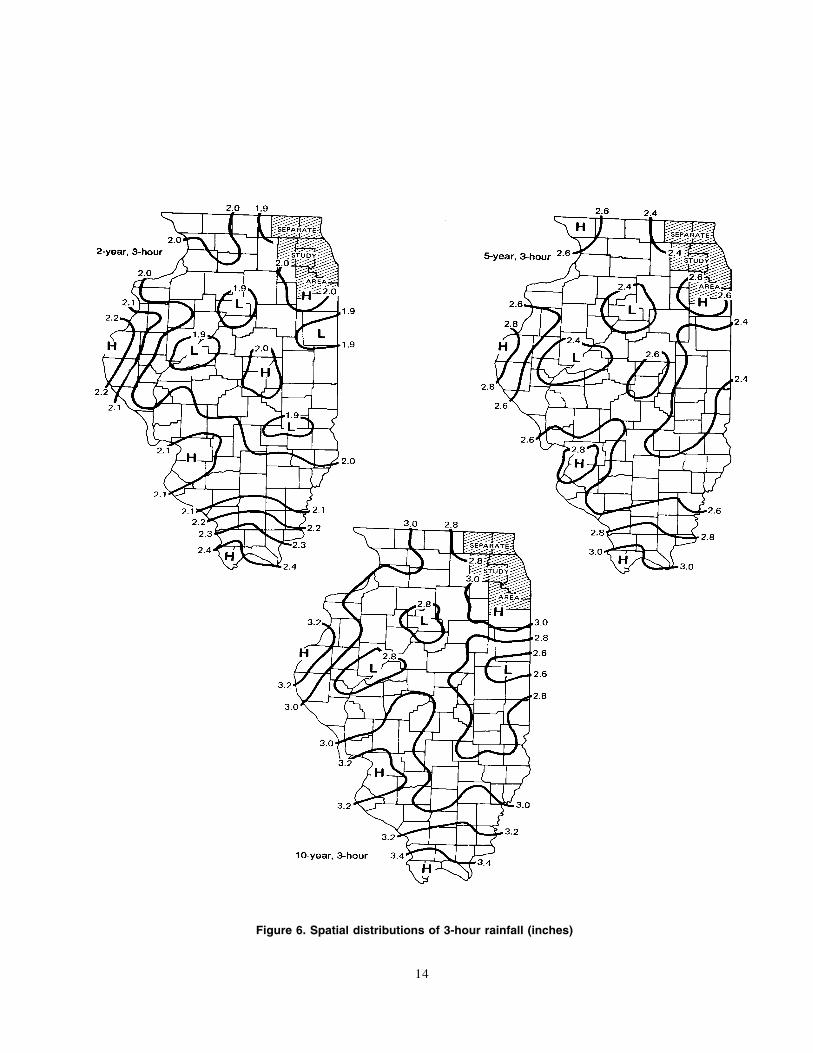
Figure 6. Spatial distributions of 3-hour rainfall (inches)
14
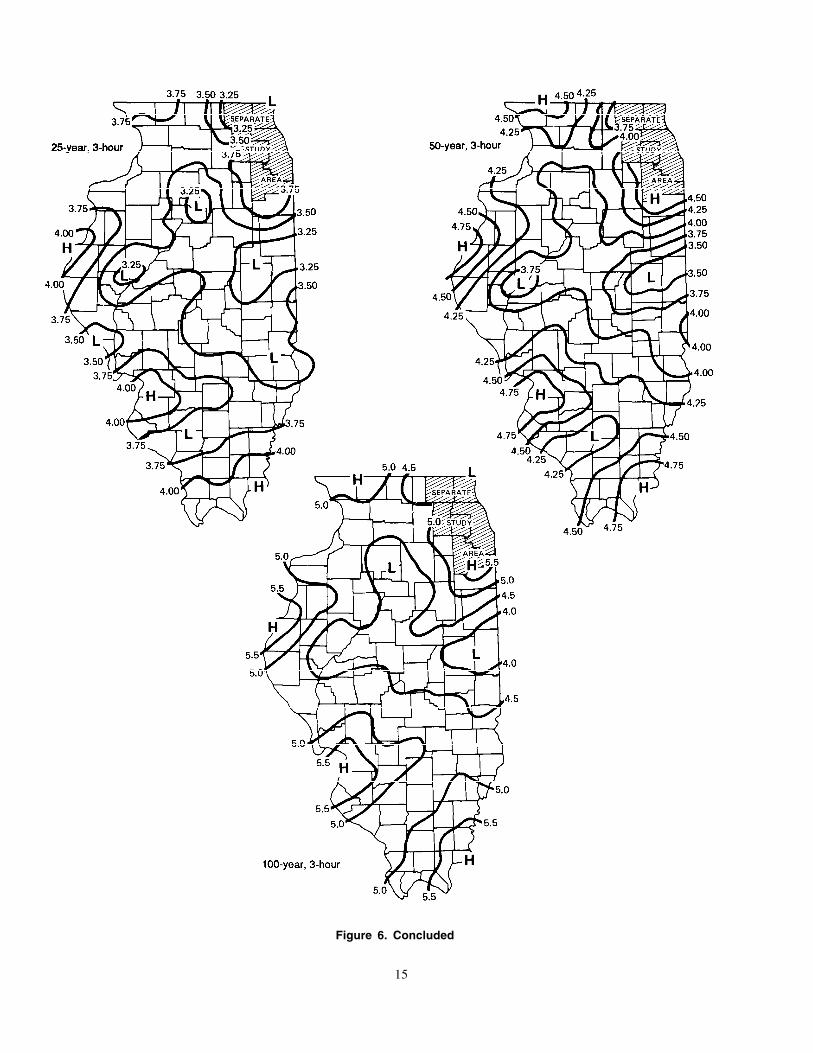
Figure 6. Concluded
15
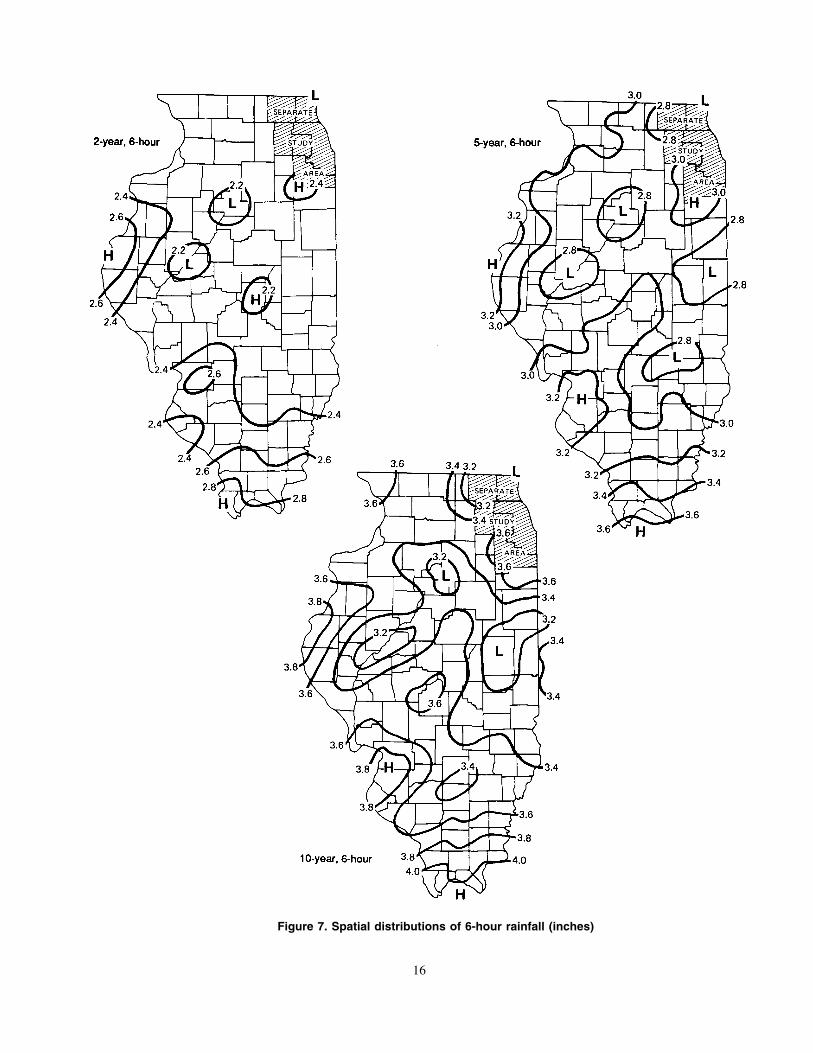
Figure 7. Spatial distributions of 6-hour rainfall (inches)
16
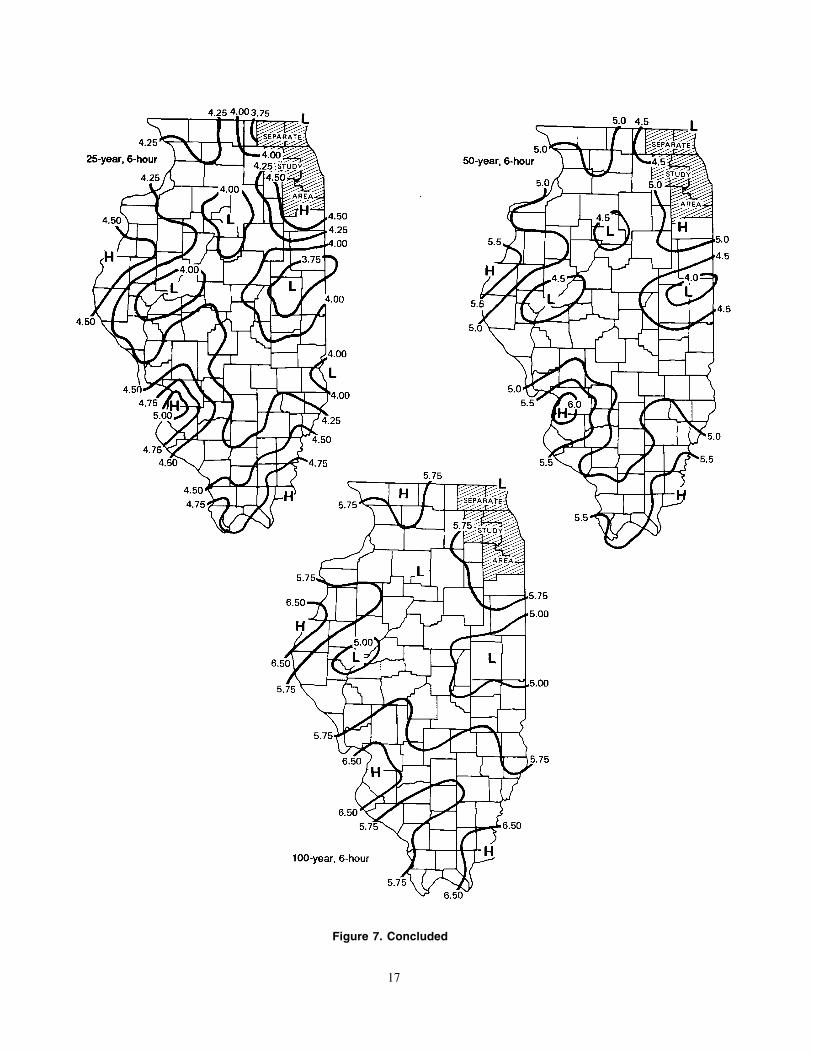
Figure 7. Concluded
17
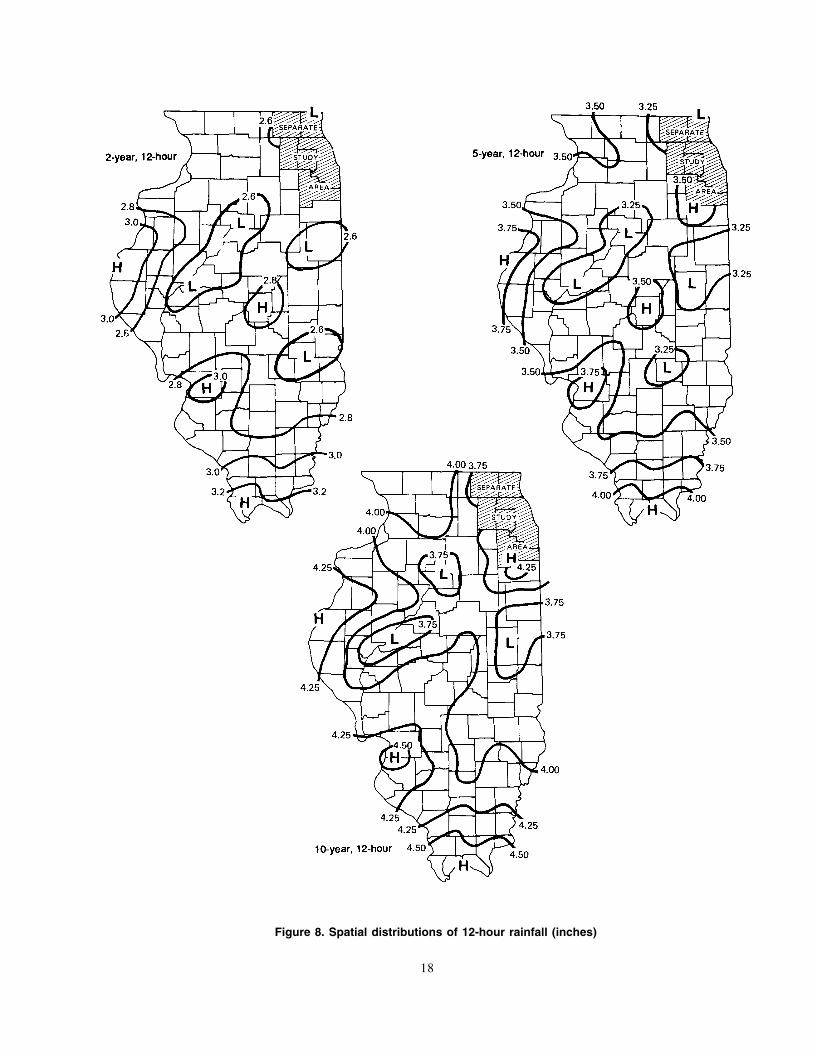
Figure 8. Spatial distributions of 12-hour rainfall (inches)
18
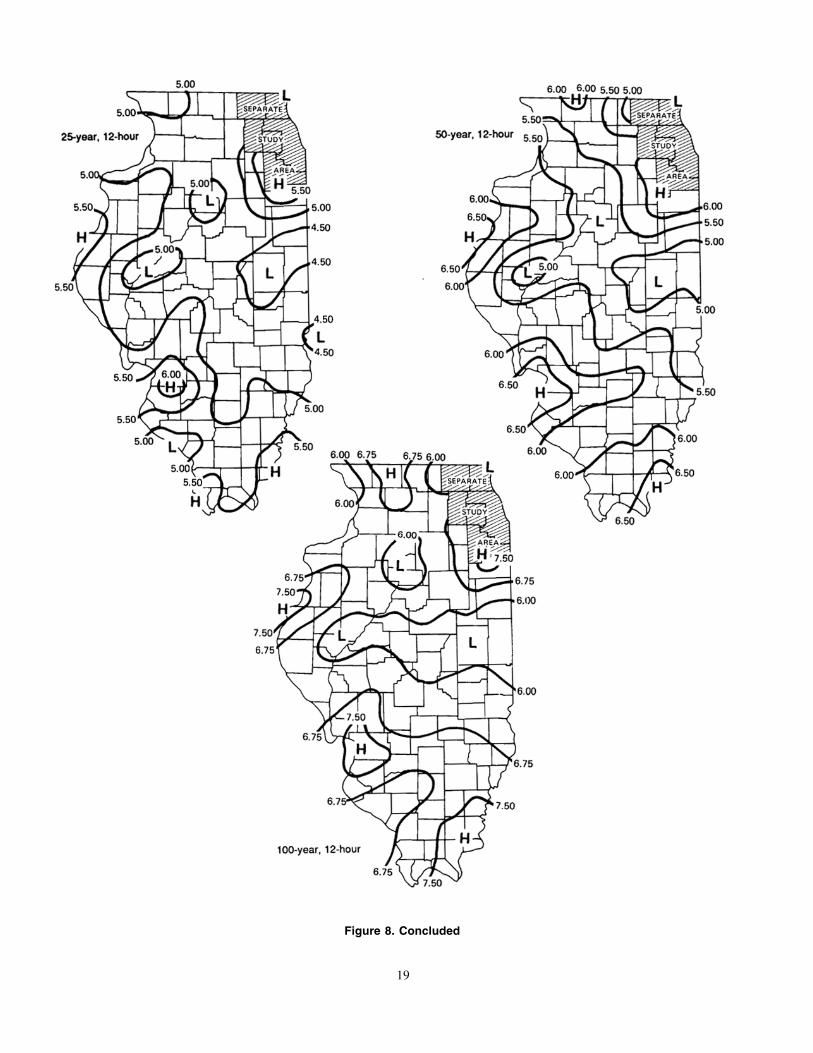
Figure 8. Concluded
19
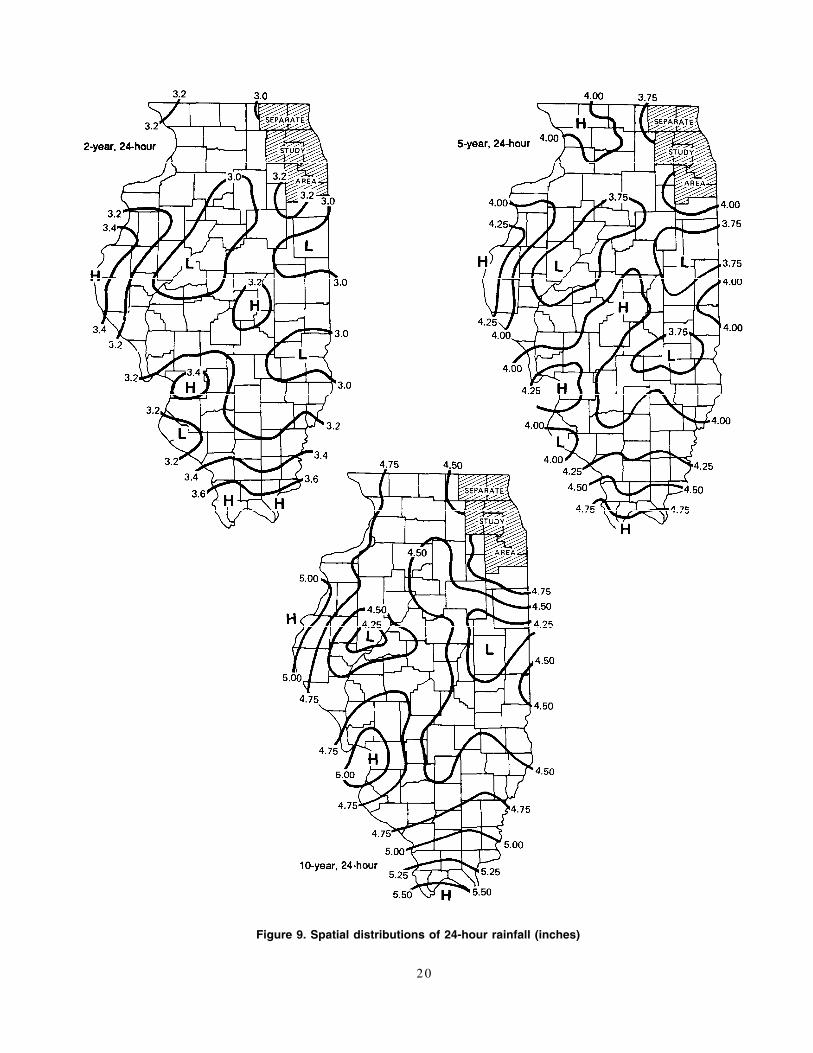
Figure 9. Spatial distributions of 24-hour rainfall (inches)
2 0
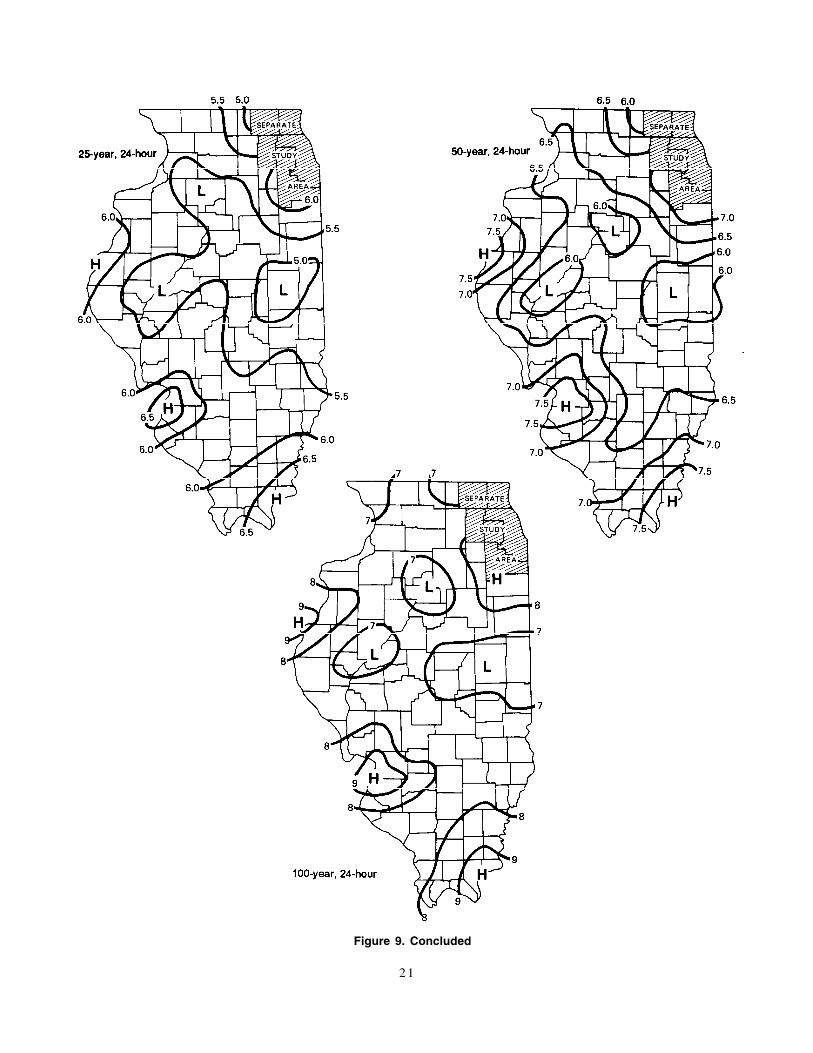
Figure 9. Concluded
2 1
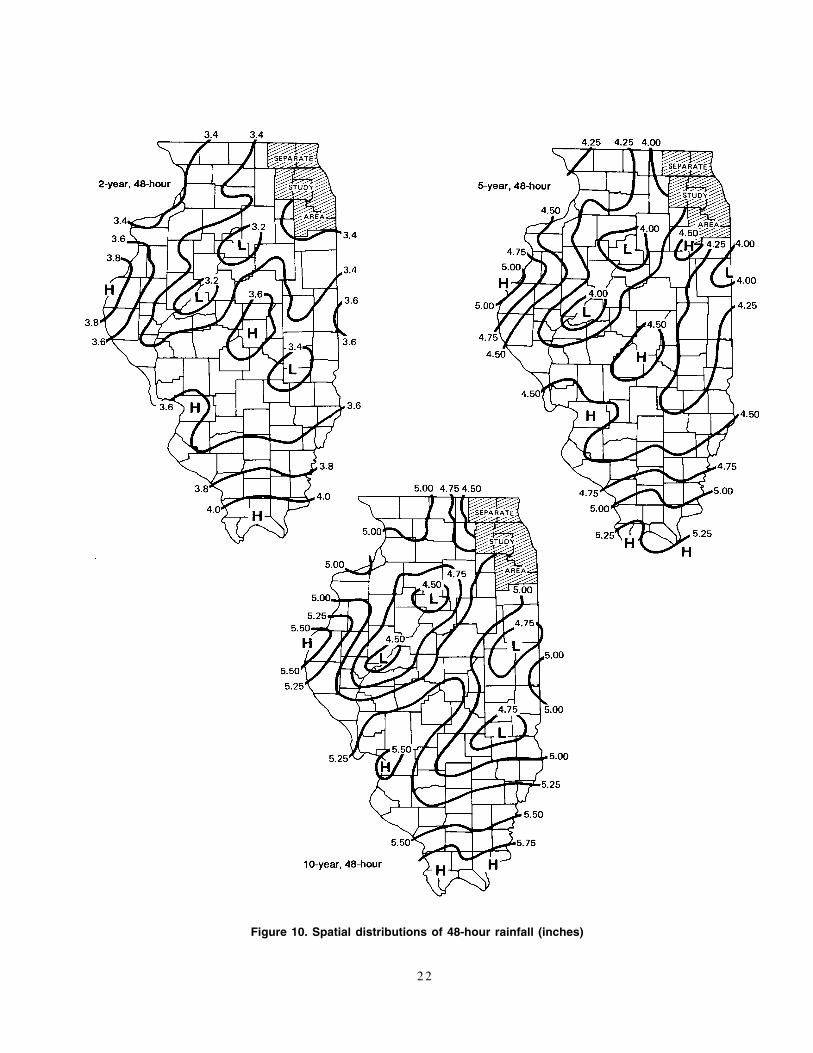
Figure 10. Spatial distributions of 48-hour rainfall (inches)
2 2
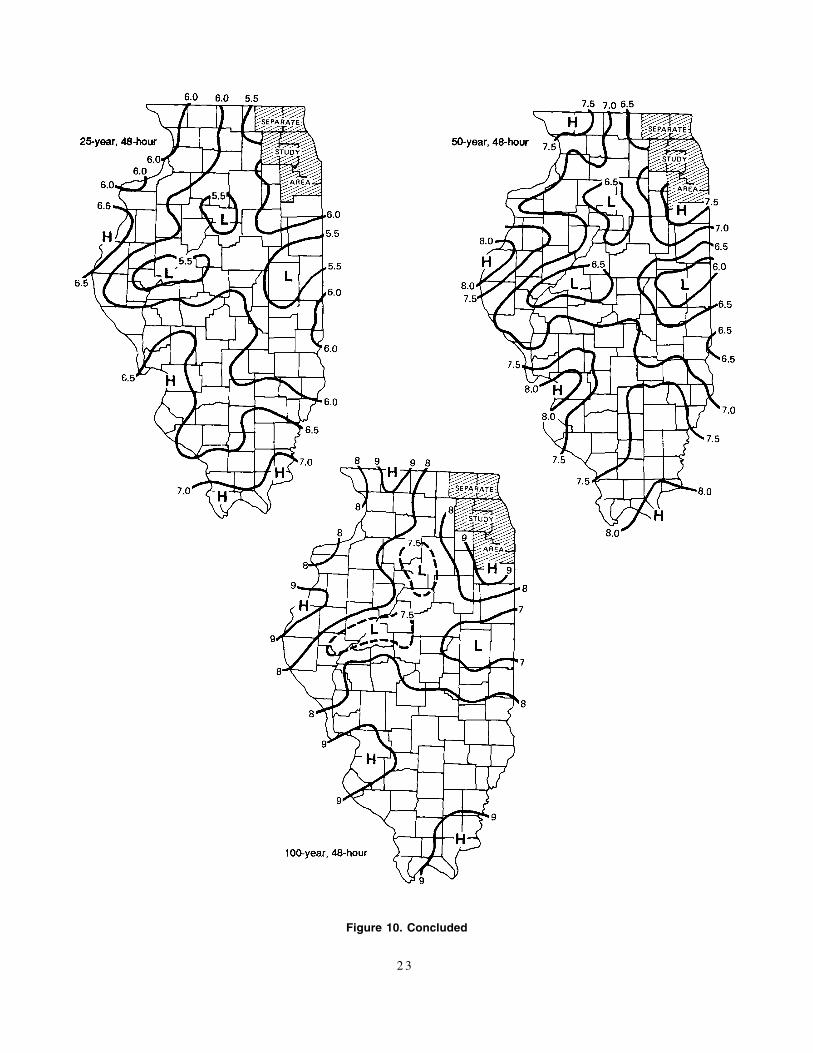
Figure 10. Concluded
2 3
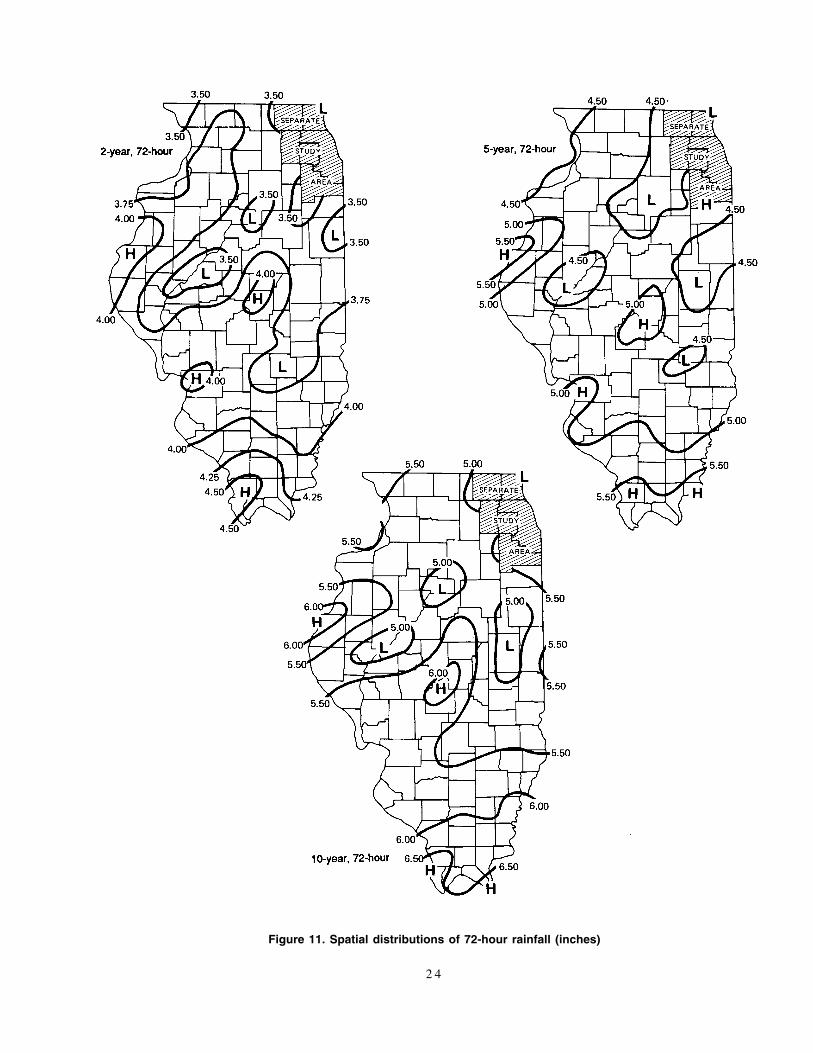
Figure 11. Spatial distributions of 72-hour rainfall (inches)
2 4
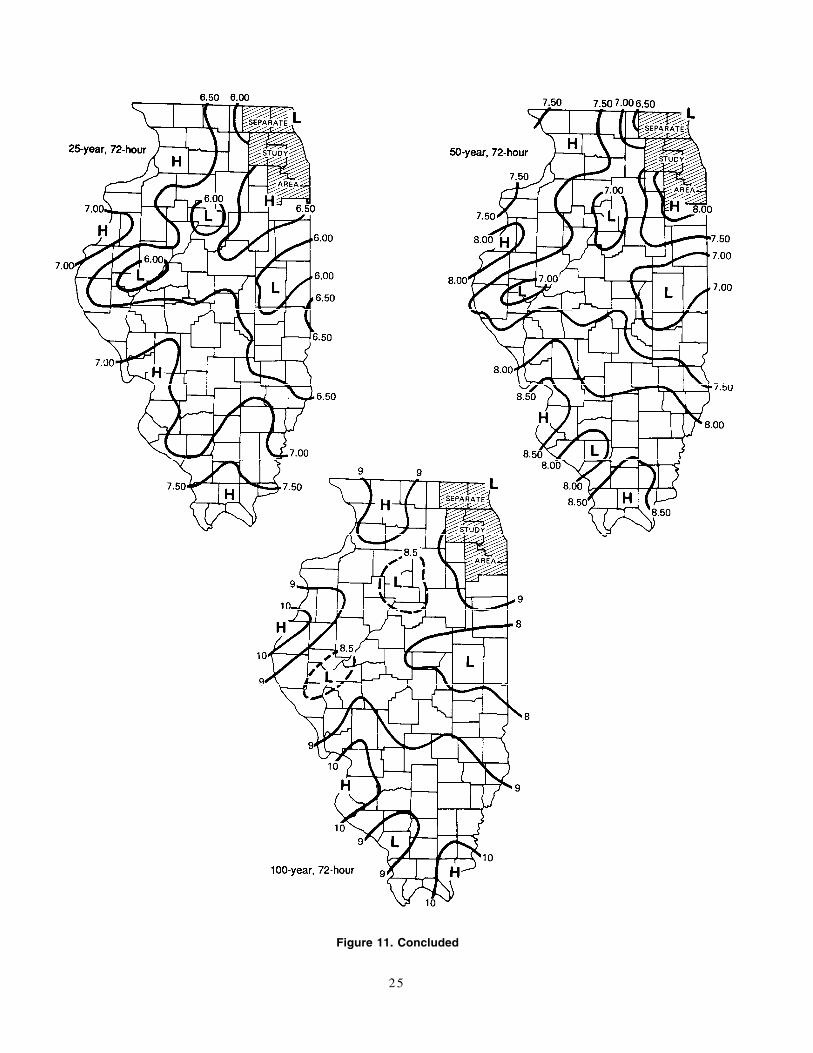
Figure 11. Concluded
2 5
PART 2: UPDATE OF HEAVY RAINFALL RELATIONSIN CHICAGO AND NORTHEASTERN ILLINOIS
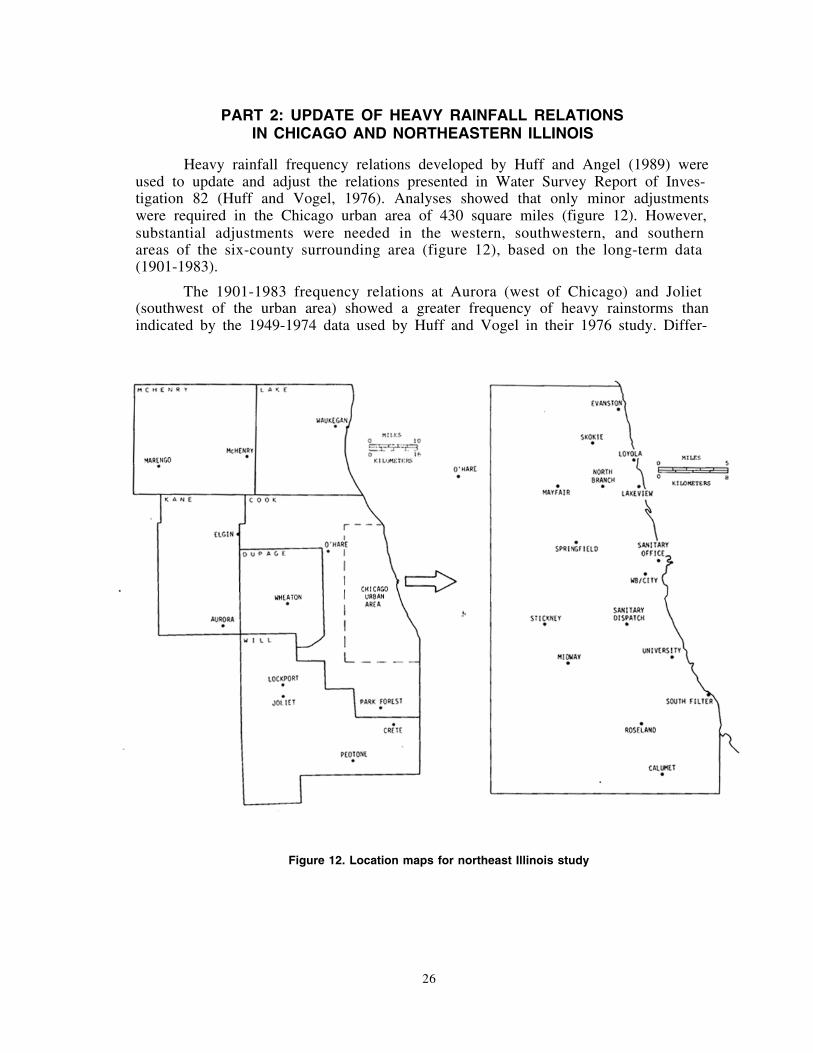
Heavy rainfall frequency relations developed by Huff and Angel (1989) wereused to update and adjust the relations presented in Water Survey Report of Inves-tigation 82 (Huff and Vogel, 1976). Analyses showed that only minor adjustmentswere required in the Chicago urban area of 430 square miles (figure 12). However,substantial adjustments were needed in the western, southwestern, and southernareas of the six-county surrounding area (figure 12), based on the long-term data(1901-1983).
The 1901-1983 frequency relations at Aurora (west of Chicago) and Joliet(southwest of the urban area) showed a greater frequency of heavy rainstorms thanindicated by the 1949-1974 data used by Huff and Vogel in their 1976 study. Differ-
Figure 12. Location maps for northeast Illinois study
26
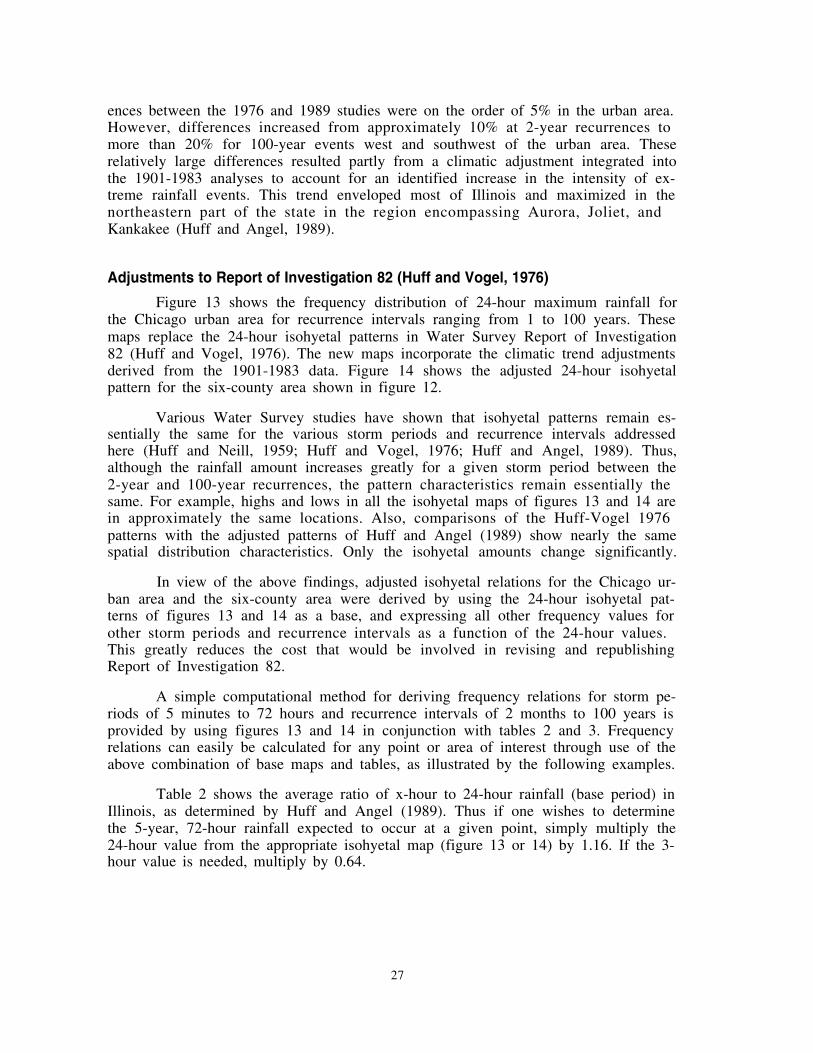
ences between the 1976 and 1989 studies were on the order of 5% in the urban area.However, differences increased from approximately 10% at 2-year recurrences tomore than 20% for 100-year events west and southwest of the urban area. Theserelatively large differences resulted partly from a climatic adjustment integrated intothe 1901-1983 analyses to account for an identified increase in the intensity of ex-treme rainfall events. This trend enveloped most of Illinois and maximized in thenortheastern part of the state in the region encompassing Aurora, Joliet, andKankakee (Huff and Angel, 1989).
Adjustments to Report of Investigation 82 (Huff and Vogel, 1976)
Figure 13 shows the frequency distribution of 24-hour maximum rainfall forthe Chicago urban area for recurrence intervals ranging from 1 to 100 years. Thesemaps replace the 24-hour isohyetal patterns in Water Survey Report of Investigation82 (Huff and Vogel, 1976). The new maps incorporate the climatic trend adjustmentsderived from the 1901-1983 data. Figure 14 shows the adjusted 24-hour isohyetalpattern for the six-county area shown in figure 12.
Various Water Survey studies have shown that isohyetal patterns remain es-sentially the same for the various storm periods and recurrence intervals addressedhere (Huff and Neill, 1959; Huff and Vogel, 1976; Huff and Angel, 1989). Thus,although the rainfall amount increases greatly for a given storm period between the2-year and 100-year recurrences, the pattern characteristics remain essentially thesame. For example, highs and lows in all the isohyetal maps of figures 13 and 14 arein approximately the same locations. Also, comparisons of the Huff-Vogel 1976patterns with the adjusted patterns of Huff and Angel (1989) show nearly the samespatial distribution characteristics. Only the isohyetal amounts change significantly.
In view of the above findings, adjusted isohyetal relations for the Chicago ur-ban area and the six-county area were derived by using the 24-hour isohyetal pat-terns of figures 13 and 14 as a base, and expressing all other frequency values forother storm periods and recurrence intervals as a function of the 24-hour values.This greatly reduces the cost that would be involved in revising and republishingReport of Investigation 82.
A simple computational method for deriving frequency relations for storm pe-riods of 5 minutes to 72 hours and recurrence intervals of 2 months to 100 years isprovided by using figures 13 and 14 in conjunction with tables 2 and 3. Frequencyrelations can easily be calculated for any point or area of interest through use of theabove combination of base maps and tables, as illustrated by the following examples.
Table 2 shows the average ratio of x-hour to 24-hour rainfall (base period) inIllinois, as determined by Huff and Angel (1989). Thus if one wishes to determinethe 5-year, 72-hour rainfall expected to occur at a given point, simply multiply the24-hour value from the appropriate isohyetal map (figure 13 or 14) by 1.16. If the 3-hour value is needed, multiply by 0.64.
27
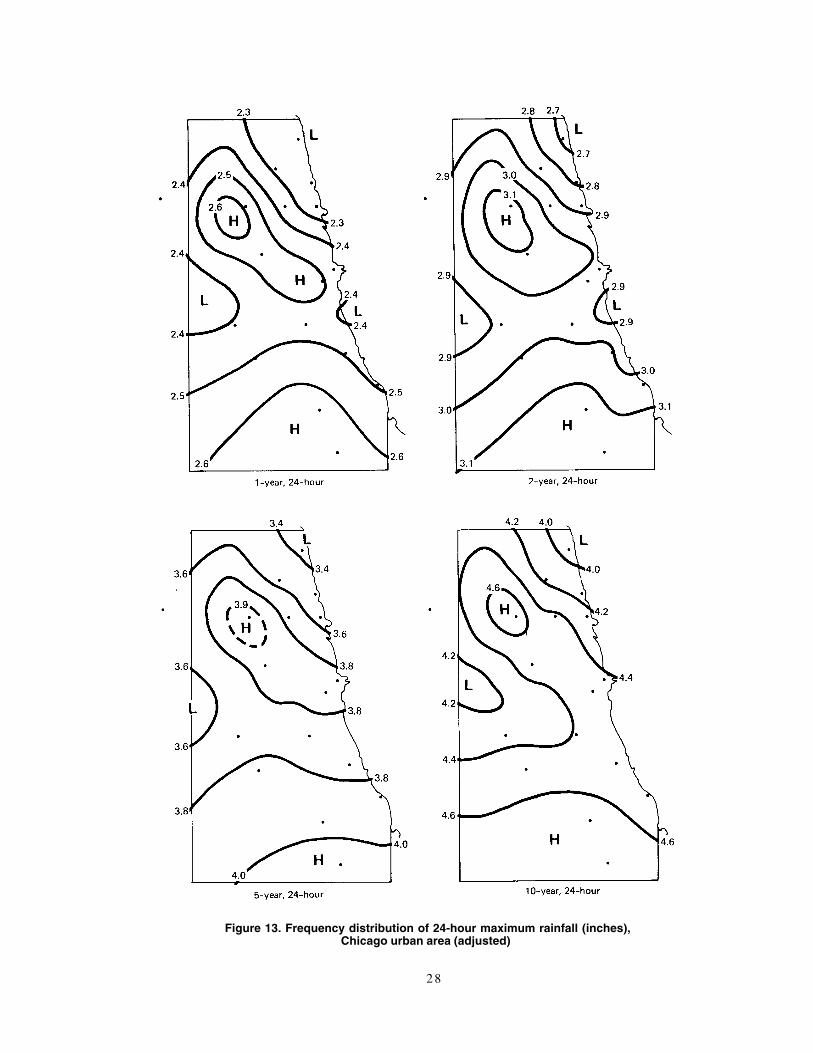
Figure 13. Frequency distribution of 24-hour maximum rainfall (inches),Chicago urban area (adjusted)
2 8
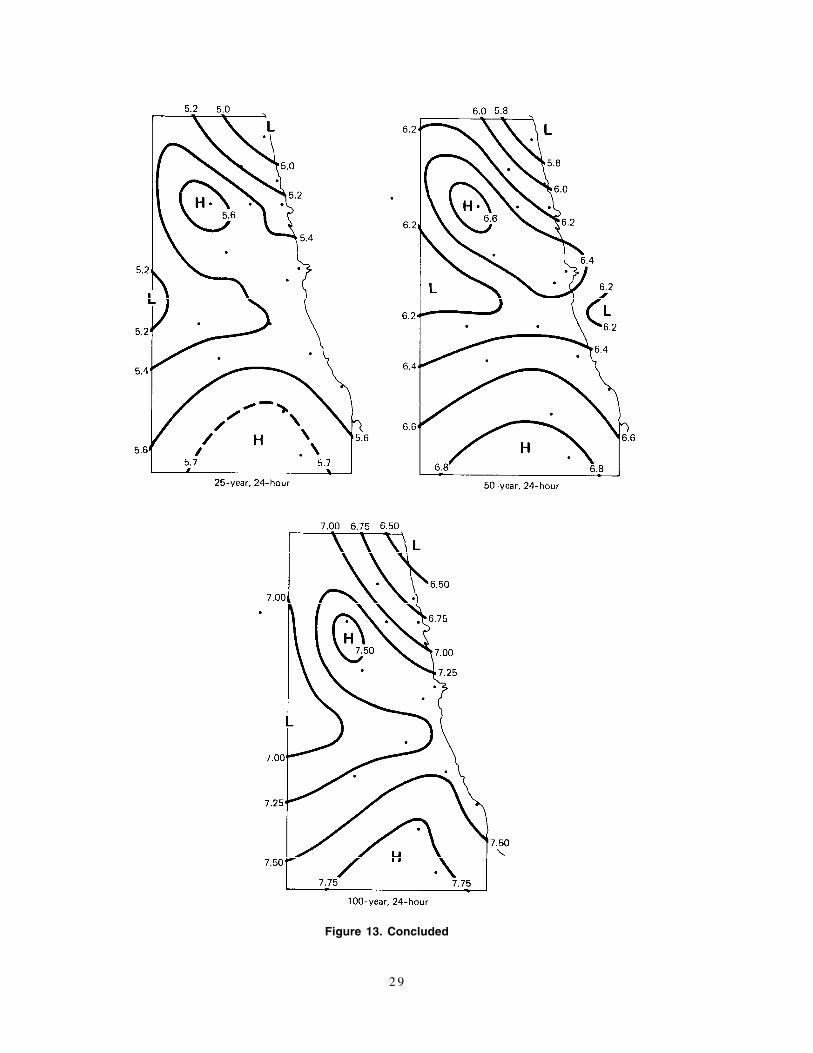
Figure 13. Concluded
2 9
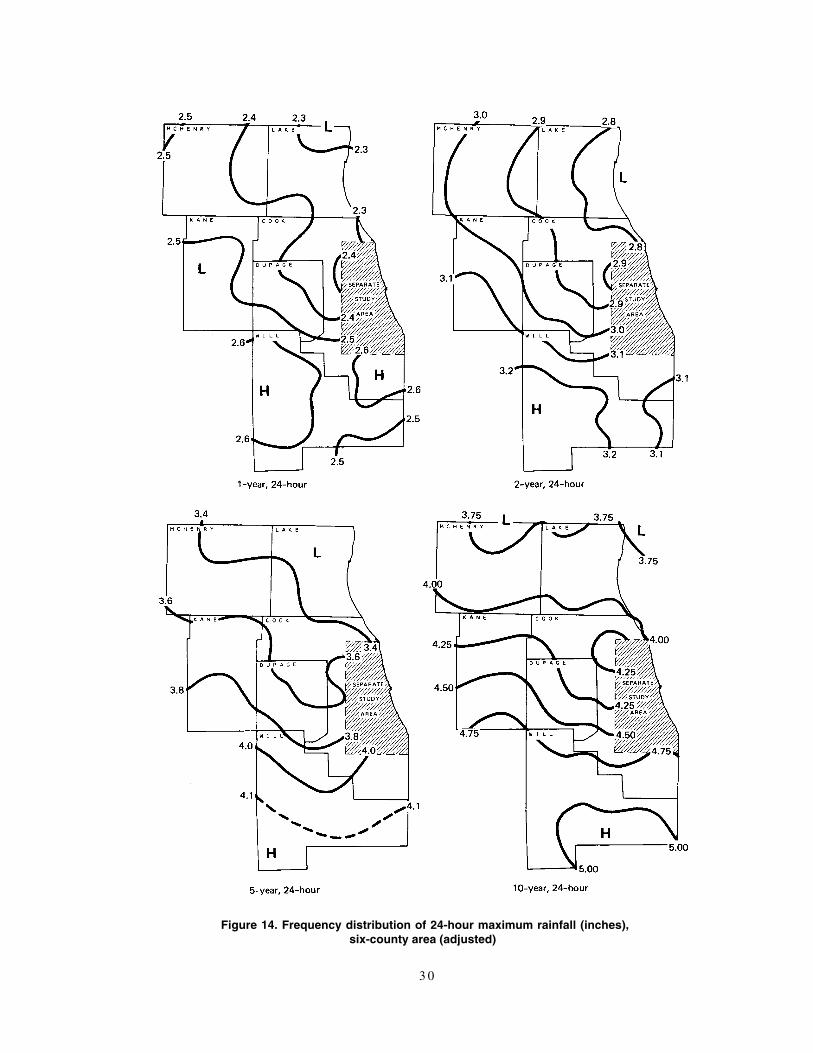
Figure 14. Frequency distribution of 24-hour maximum rainfall (inches),six-county area (adjusted)
3 0
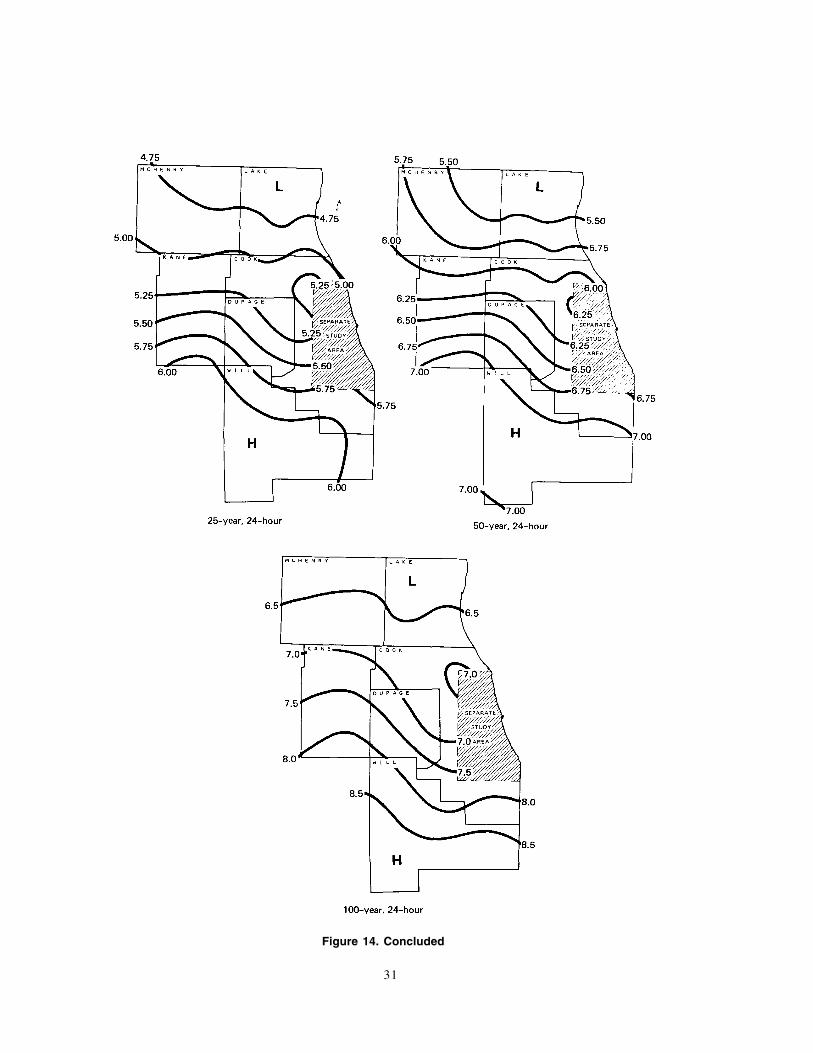
Figure 14. Concluded
31
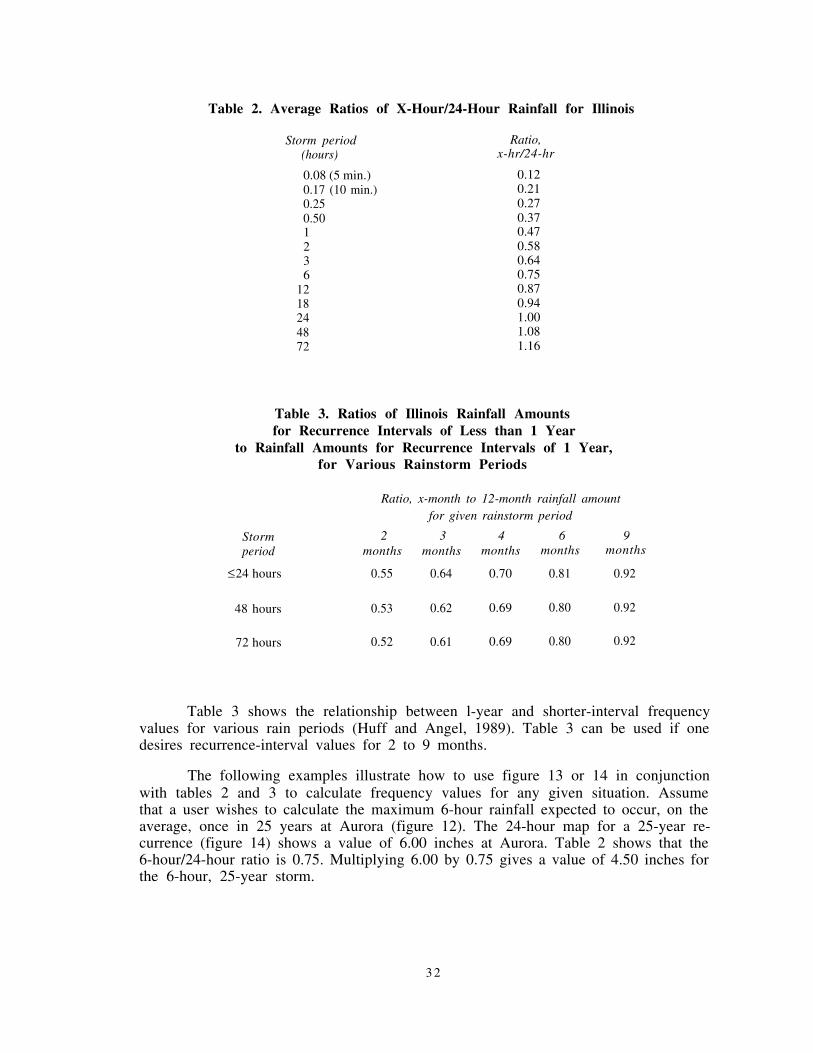
Table 2. Average Ratios of X-Hour/24-Hour Rainfall for Illinois
Storm period Ratio,(hours) x-hr/24-hr
0.08 (5 min.)0.17 (10 min.)0.250.501236
1218244872
0.120.210.270.370.470.580.640.750.870.941.001.081.16
Table 3. Ratios of Illinois Rainfall Amountsfor Recurrence Intervals of Less than 1 Year
to Rainfall Amounts for Recurrence Intervals of 1 Year,for Various Rainstorm Periods
Stormperiod
≤24 hours
48 hours
72 hours
Ratio, x-month to 12-month rainfall amountfor given rainstorm period
2 3 4 6 9months months months months months
0.55 0.64 0.70 0.81 0.92
0.53 0.62 0.69 0.80 0.92
0.52 0.61 0.69 0.80 0.92
Table 3 shows the relationship between l-year and shorter-interval frequencyvalues for various rain periods (Huff and Angel, 1989). Table 3 can be used if onedesires recurrence-interval values for 2 to 9 months.
The following examples illustrate how to use figure 13 or 14 in conjunctionwith tables 2 and 3 to calculate frequency values for any given situation. Assumethat a user wishes to calculate the maximum 6-hour rainfall expected to occur, on theaverage, once in 25 years at Aurora (figure 12). The 24-hour map for a 25-year re-currence (figure 14) shows a value of 6.00 inches at Aurora. Table 2 shows that the6-hour/24-hour ratio is 0.75. Multiplying 6.00 by 0.75 gives a value of 4.50 inches forthe 6-hour, 25-year storm.
3 2
Now assume further that the user wishes to determine the 6-hour rainfall tobe expected once in 6 months, on the average. Figure 14 shows that the l-year, 24-hour storm value at Aurora is 2.55 inches. The l-year, 6-hour value is obtained bymultiplying 2.55 by 0.75, which gives 1.91 inches. Table 3 indicates that the average6-month value is 81% (0.81) of the l-year amount. Then 1.91 multiplied by 0.81yields 1.55 inches for the 6-month, 6-hour amount.
Next, assume that a user wishes to obtain frequency values for a rain periodother than 24 hours for an area within or between basins. This can be done quitereadily by replacing the 24-hour values for each isohyet with the computed value forany rain period of interest. For example, assume that the user wants to determinethe frequency distribution of 12-hour rainfall having a 5-year recurrence in DuPageCounty. Turning to the 5-year, 24-hour map in figure 14, multiply each isohyetalvalue by 0.87, the 12-hour/24-hour ratio in table 2. Then the 3.4-inch isohyet offigure 14 becomes 2.96 inches, and the 3.6-, 3.8-, and 4.0-inch isohyets convert to3.13, 3.31, and 3.48 inches, respectively.
33
PART 3: THE ST. LOUIS ANOMALY
Previous Water Survey studies (Huff and Changnon, 1972; Changnon et al.,1977) have shown that inadvertent weather modification by the St. Louis urban en-vironment substantially increases rainfall downwind of the city, and the urban en-hancement tends to be largest in relatively heavy rainstorms. The anomaly islargely contained within a 25-mile radius extending northeast, east, and southeast ofcentral St. Louis, and no significant effect has been identified beyond 50 miles. Theeffect is most pronounced in spring and summer, when the majority of the excessiverainstorms occur, particularly those producing 25-year to 100-year events.
Results of the St. Louis METROMEX studies indicate that in Illinois, only St.Clair and Madison Counties are significantly affected by the urban anomaly. The ef-fect should be most pronounced in Madison County northeast and east of the city. Ofthe stations used in the present study of Illinois frequency distributions, only St.Louis (Lambert Field) and Mascoutah-Belleville could incorporate any of the poten-tial urban effect on the natural rainfall distribution. Furthermore, Lambert Field isusually upwind of the major urban area.
According to the METROMEX research, the urban effect is most prominent instorms with relatively short durations (Changnon et al., 1977). Except during theMETROMEX research in 1971-1975, there has been no raingage network of suffi-cient density, such as the Chicago urban network used in the northeastern Illinoisstudy, to identify and define the intensity and areal extent of the St. Louis anomaly.
According to the St. Louis research, the effect is limited largely to storms of24 hours or less. Maximum effect was indicated in excessive storm periods of 3 hoursor less. For the larger, more intense storms producing amounts expected to occuronly on the average of once in 10 years or longer, the urban effect appears to be min-imal in comparison with the natural precipitation output generated by the control-ling synoptic storm systems. It appears that these storm systems strongly suppressor eliminate urban influences on the natural precipitation processes.
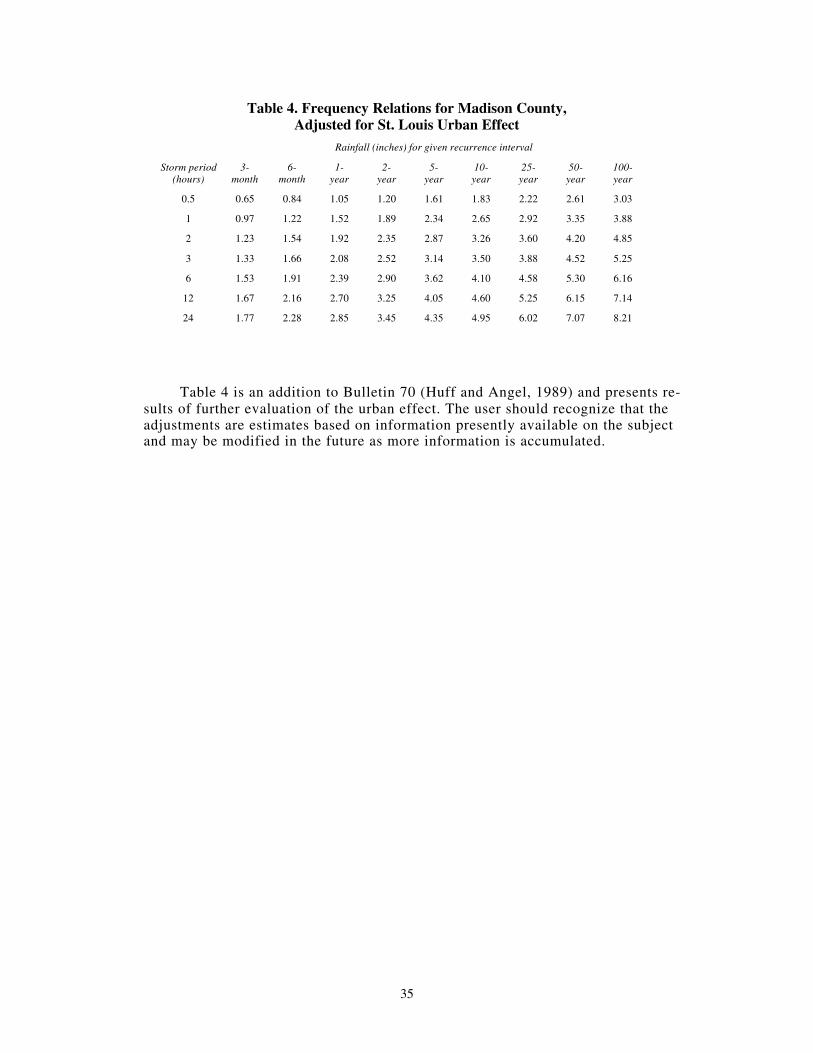
No adjustment is recommended for St. Clair County, because the Mascoutah-Belleville data for 1901-1983 appear to have accounted adequately for the urbananomaly in that region. For Madison County, which lies within the southwest sec-tion, the values appearing in table 1 for that section may be used with the adjust-ments shown in table 4 and discussed below.
Table 4 shows adjusted frequency values for Madison County, based on find-ings in the METROMEX research and other urban studies of inadvertent weathermodification. The estimates provided in this table indicate urban-induced increasesof 20-25% for storm periods of 3 hours or less and recurrence intervals less than 5years. These changes decrease gradually as the storm period and recurrence intervalincrease. Thus, for a storm period of 12 hours and a recurrence interval of 10 years,the urban effect decreases to 12-15%. It becomes insignificant at recurrenceintervals of 25 years and longer and storm periods of 48 hours and longer.
3 4
35
Table 4. Frequency Relations for Madison County, Adjusted for St. Louis Urban Effect
Rainfall (inches) for given recurrence interval
Storm period (hours)
3- month
6- month
1- year
2- year
5- year
10- year
25- year
50- year
100- year
0.5 0.65 0.84 1.05 1.20 1.61 1.83 2.22 2.61 3.03
1 0.97 1.22 1.52 1.89 2.34 2.65 2.92 3.35 3.88
2 1.23 1.54 1.92 2.35 2.87 3.26 3.60 4.20 4.85
3 1.33 1.66 2.08 2.52 3.14 3.50 3.88 4.52 5.25
6 1.53 1.91 2.39 2.90 3.62 4.10 4.58 5.30 6.16
12 1.67 2.16 2.70 3.25 4.05 4.60 5.25 6.15 7.14
24 1.77 2.28 2.85 3.45 4.35 4.95 6.02 7.07 8.21
Table 4 is an addition to Bulletin 70 (Huff and Angel, 1989) and presents re- sults of further evaluation of the urban effect. The user should recognize that the adjustments are estimates based on information presently available on the subject and may be modified in the future as more information is accumulated.
REFERENCES
Ackermann, W. C. 1970. Technical Letter 13 - Rainfall Frequencies. Illinois StateWater Survey, 5 p.
Changnon, S. A., F. A. Huff, P. T. Schickedanz, and J. L.Vogel. 1977. Summary ofMETROMEX, Volume 1: Weather Anomalies and Impacts. Illinois State WaterSurvey Bulletin 62, 260 p.
Hershfield, D. M. 1961. Rainfall Frequency Atlas of the United States. U.S. De-partment of Commerce, Weather Bureau Technical Paper 40, Washington,D.C., 115 p.
Huff, F. A., and J. R. Angel. 1989. Frequency Distributions and HydroclimaticCharacteristics of Heavy Rainstorms in Illinois. Illinois State Water SurveyBulletin 70, 177 p.
Huff, F. A., and S. A. Changnon, Jr. 1972. Climatological Assessment of Urban Ef-fects on Precipitation. Final Report, Part II, Illinois State Water Survey forNational Science Foundation Grant GA-18781,237 p.
Huff, F. A., and J. C. Neill. 1959. Frequency Relations for Storm Rainfall in Illinois.Illinois State Water Survey Bulletin 46, 65 p.
Huff, F. A., and J. L. Vogel. 1976. Hydrometeorology of Heavy Rainstorms inChicago and Northeastern Illinois. Illinois State Water Survey Report of In-vestigation 82,63 p.
3 6