Embed Size (px)
Citation preview
Procedia - Social and Behavioral Sciences 47 ( 2012 ) 540 – 551
1877-0428 © 2012 Published by Elsevier Ltd. Selection and/or peer review under responsibility of Prof. Dr. Hüseyin Uzunboylu doi: 10.1016/j.sbspro.2012.06.693
CY-ICER 2012
Frequency and aim of web 2.0 tools usage by secondary school students and their awareness level of these tools
Dilek Dogana*, Hatice Gokce Bilgicb, Duygu Dumanb, S. Sadi Seferoglub a , Faculty of Education, 25240, Erzurum, Turkey
bHacettepe University, Faculty of Education, 06800, Ankara, Turkey
Abstract
Web 2.0 tools, such as wikis, blogs, social networks, photograph and video sharing sites, instant messaging, and podcasts provide easy applications to users without having knowledge on computer programming or computer systems. Moreover, Web 2.0 tools provide young users virtual environments, in which they have opportunities to become socially active, interact with their peers, and share, cooperate as well as create their own projects. This study focused Web 2.0 tools, and dealt with the frequency and aim of their usage. The working group consisted of 111 secondary school students from Ankara, Adana and Erzurum provinces of Turkey. The data were collected through a survey questionnaire. In data analysis, frequency distributions, percentages, mean and standard deviation scores were calculated. According to the results, social networks, instant messaging services and video sharing sites were most frequently used tools by students. Although most of the students were aware of Web 2.0 tools, only a small number of students used wikis and podcasts. Students who were using Internet in their daily life used it mostly for entertainment purposes. However, as frequency of the students who used Internet decreased their objectives for using it changed. In conclusion, changed according to needs of students. The students preferred to use search engines and Facebook more than other tools. Besides, gender was an important factor in the usage of the Internet.
Keywords: : Internet usage, high school students, Web 2.0 tools
1. Introduction
Information and Communication Technologies (ICT) development is a global revolution. It has become a subject of great significance and concern to all mankind. Dynamic and constantly developing, ICT has provided the necessary environment for the development and use of Web 2.0 tools. Furthermore, the changes with the ICT in educational process lead to changes in teachers and students roles as well. Thus, in order to follow these changes and their related effects and emerging needs in education, frequency of use of web technologies in education has increased rapidly in recent years, and is still increasing. The rapid developments in web technologies leads people to move a new standing, by changing them from people, who are reading and getting the information passively, to people, who are producing information and sharing that information with others. In educational settings, web technologies increase the interaction between instructor and learner. This interaction should be used as a helpful way in order to create an effective teaching-learning process (Hartshorne & Ajjan, 2009). Web 2.0 technologies are one type of these developing technologies, which is also spreading in the educational environments. Web 2.0
* . Tel.: +90-442-231-5652 E-mail address: [email protected]
Available online at www.sciencedirect.com
541 Dilek Dogan et al. / Procedia - Social and Behavioral Sciences 47 ( 2012 ) 540 – 551
applications, widely known as just Web 2.0 are multi-participatory, which are giving wide authority to the user, providing environment to produce information instead of just consuming it passively. These applications also make the static structure dynamic. There are interactive learning environments where people can communicate, produce, edit and share in a social community in these applications. In the light of these functions it can be claimed that using Web 2.0 technologies, which promote the collaborative work, provide the social interaction among people in an electronic environment, and support sharing of information in different formats should be focus of attention in education & . with computers and especially on the Internet. Thus, with Web 2.0 applications which do not require one to have computer programming and computer systems knowledge, enjoyable, creative, effective and socially active environments can be provided. By using these applications, students can create their own products, interact with their peers, share their products and cooperate with other students. Contemporary approaches to learning about teaching, such as social constructivism, and the needs of today's society, such as information literacy, group work predisposition, analyzing the information and problem-solving skills, leads to the emergence of Web 2.0 applications and the importance of pedagogical potential of these applications (Karaman, & Kaban, 2008).
Web 2.0 tools not only create countless opportunities for interaction between teacher and students, but also create opportunities for interaction between knowledgeable people (i.e., parents, specialists and other students). Thus, it provides effective learning opportunities for students (Hartshorne & Ajjan, 2009). Computer games, e-mail, internet, mobile phones, instant messaging services, social network are nearly indispensable students. New generation students have become more capable than their teachers about using computers, instant messaging, sharing photo-video-music-files and surfing the Internet. Therefore, teachers must use these technologies properly in order to gain attention of students to their courses. Learning and teaching roles have changed by the effect of technology. People who are responsible with the teaching have gained a new role of integrating technology into the learning-teaching process (technologies, which is combined with face to face training, it will create a strong and effective blending learning
& Students who do not use Web 2.0 technologies for getting information from web sites, use them for creating
information and sharing it with other people (Maloney 2007; quoted by Hartshorne & Ajjan, 2009). In fact, the main aim of integrating Web 2.0 tools into teaching and learning process is improving students ability of producing knowledge instead of getting passive knowledge from static web sites or books. It also leads them to criticize the existing knowledge found in a web page while sharing their knowledge with others through communication over the Web 2.0 tools such as forums, wikis, blogs and etc.
students use Facebook, instant messaging, social interaction sites and searching engines and many others in their daily lives. However, in order to lead students using these applications more consciously through their learning process both in their school lives and in their life-long learning process, the educators should aim to integrate these applications into educational settings.
Web 2.0 technologies and social networks-especially MySpace and Facebook, have quite strong impact on the lives of students (Schroeder & Greenbowe, 2009). Many researchers are wondering about this impact, and wondered whether this impact is real or not. Then many of them questioned whether this possible impact has a real effect. Thus, they are agreed on the fact that social networks must be used in educational process (Joly, 2007). In Horizon Report, prepared by New Media Consortium and EDUCAUSE in 2008, the importance of this issue was emphasized and was suggested that strategies must be developed to take advantage of social networks for educational purpose (The New Media Consortium, 2008).
Web 2.0 tools like Facebook, MSN, blogs, forum web sites and etc. in their daily lives very frequently, and are exposed to development of ICT tools rapidly. These kids are surrounded with mobile phones, computers, tablets and the Internet. Therefore, research need to be conducted to find out frequencies of students usage and their awareness level of these tools. Moreover, in a research about Web 2.0 usage conducted by
(2008), it was found that most of the studies were concentrated at the undergraduate level. These researchers suggested that if education promote the use of Web 2.0 tools in schools, students' awareness levels of these technologies would change accordingly. Thus, the purpose of this study is to
542 Dilek Dogan et al. / Procedia - Social and Behavioral Sciences 47 ( 2012 ) 540 – 551
investigate the frequency of use of Web 2.0 applications, their levels of Web 2.0 application uses, their perceptions about Web 2.0 tools and their aim of using these tools.
2. Methods
2.1. Study Group
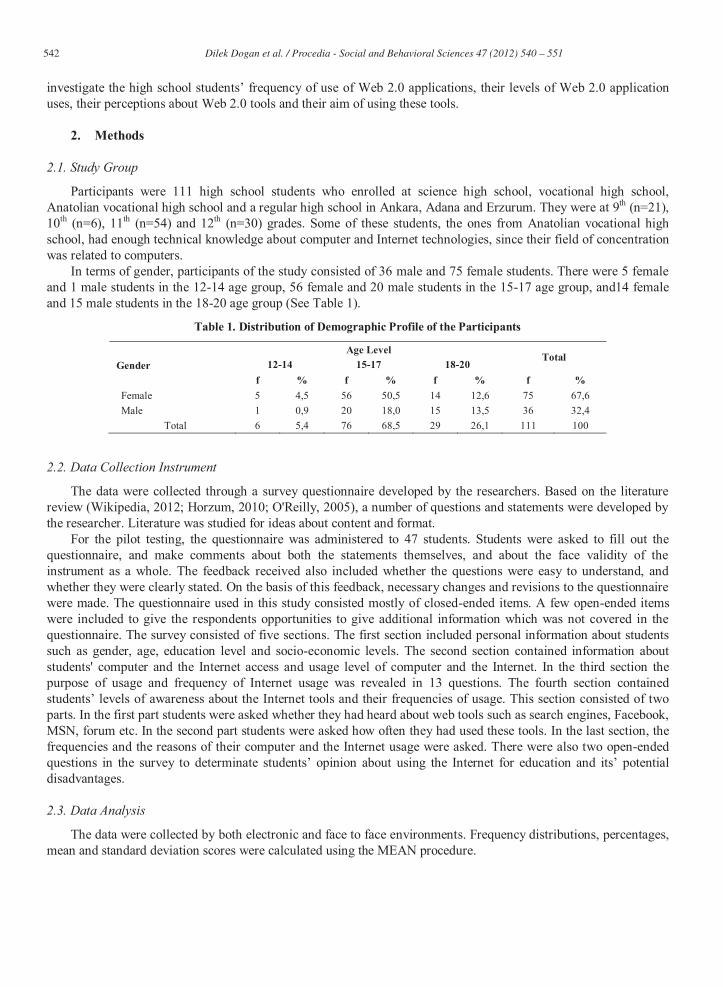
Participants were 111 high school students who enrolled at science high school, vocational high school, Anatolian vocational high school and a regular high school in Ankara, Adana and Erzurum. They were at 9th (n=21), 10th (n=6), 11th (n=54) and 12th (n=30) grades. Some of these students, the ones from Anatolian vocational high school, had enough technical knowledge about computer and Internet technologies, since their field of concentration was related to computers.
In terms of gender, participants of the study consisted of 36 male and 75 female students. There were 5 female and 1 male students in the 12-14 age group, 56 female and 20 male students in the 15-17 age group, and14 female and 15 male students in the 18-20 age group (See Table 1).
Table 1. Distribution of Demographic Profile of the Participants
Gender Age Level
Total 12-14 15-17 18-20
f % f % f % f % Female 5 4,5 56 50,5 14 12,6 75 67,6 Male 1 0,9 20 18,0 15 13,5 36 32,4 Total 6 5,4 76 68,5 29 26,1 111 100
2.2. Data Collection Instrument
The data were collected through a survey questionnaire developed by the researchers. Based on the literature review (Wikipedia, 2012; Horzum, 2010; O'Reilly, 2005), a number of questions and statements were developed by the researcher. Literature was studied for ideas about content and format.
For the pilot testing, the questionnaire was administered to 47 students. Students were asked to fill out the questionnaire, and make comments about both the statements themselves, and about the face validity of the instrument as a whole. The feedback received also included whether the questions were easy to understand, and whether they were clearly stated. On the basis of this feedback, necessary changes and revisions to the questionnaire were made. The questionnaire used in this study consisted mostly of closed-ended items. A few open-ended items were included to give the respondents opportunities to give additional information which was not covered in the questionnaire. The survey consisted of five sections. The first section included personal information about students such as gender, age, education level and socio-economic levels. The second section contained information about students' computer and the Internet access and usage level of computer and the Internet. In the third section the purpose of usage and frequency of Internet usage was revealed in 13 questions. The fourth section contained students levels of awareness about the Internet tools and their frequencies of usage. This section consisted of two parts. In the first part students were asked whether they had heard about web tools such as search engines, Facebook, MSN, forum etc. In the second part students were asked how often they had used these tools. In the last section, the frequencies and the reasons of their computer and the Internet usage were asked. There were also two open-ended questions in the survey t using the Internet for education potential disadvantages.
2.3. Data Analysis
The data were collected by both electronic and face to face environments. Frequency distributions, percentages, mean and standard deviation scores were calculated using the MEAN procedure.
543 Dilek Dogan et al. / Procedia - Social and Behavioral Sciences 47 ( 2012 ) 540 – 551
3. Results
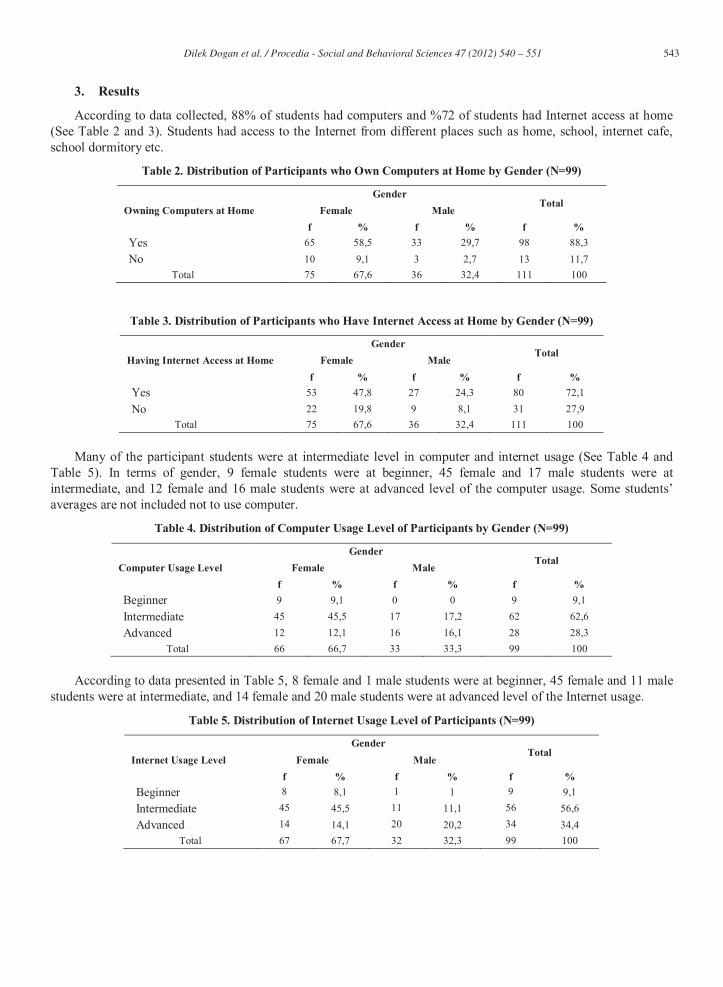
According to data collected, 88% of students had computers and %72 of students had Internet access at home (See Table 2 and 3). Students had access to the Internet from different places such as home, school, internet cafe, school dormitory etc.
Table 2. Distribution of Participants who Own Computers at Home by Gender (N=99)
Owning Computers at Home Gender
Total Female Male
f % f % f % Yes 65 58,5 33 29,7 98 88,3 No 10 9,1 3 2,7 13 11,7 Total 75 67,6 36 32,4 111 100
Table 3. Distribution of Participants who Have Internet Access at Home by Gender (N=99)
Having Internet Access at Home Gender
Total Female Male
f % f % f % Yes 53 47,8 27 24,3 80 72,1 No 22 19,8 9 8,1 31 27,9 Total 75 67,6 36 32,4 111 100
Many of the participant students were at intermediate level in computer and internet usage (See Table 4 and
Table 5). In terms of gender, 9 female students were at beginner, 45 female and 17 male students were at intermediate, and 12 female and 16 male students were at advanced level of the computer usage. averages are not included not to use computer.
Table 4. Distribution of Computer Usage Level of Participants by Gender (N=99)
Computer Usage Level Gender
Total Female Male
f % f % f % Beginner 9 9,1 0 0 9 9,1 Intermediate 45 45,5 17 17,2 62 62,6 Advanced 12 12,1 16 16,1 28 28,3 Total 66 66,7 33 33,3 99 100
According to data presented in Table 5, 8 female and 1 male students were at beginner, 45 female and 11 male
students were at intermediate, and 14 female and 20 male students were at advanced level of the Internet usage.
Table 5. Distribution of Internet Usage Level of Participants (N=99)
Internet Usage Level Gender
Total Female Male
f % f % f % Beginner 8 8,1 1 1 9 9,1 Intermediate 45 45,5 11 11,1 56 56,6 Advanced 14 14,1 20 20,2 34 34,4 Total 67 67,7 32 32,3 99 100
544 Dilek Dogan et al. / Procedia - Social and Behavioral Sciences 47 ( 2012 ) 540 – 551
Participant students learned to use computers from diverse places, such as at school, computer courses, by themselves or by getting help from others (relatives, friends, books and digital environments). The learning process for the Internet was similar.
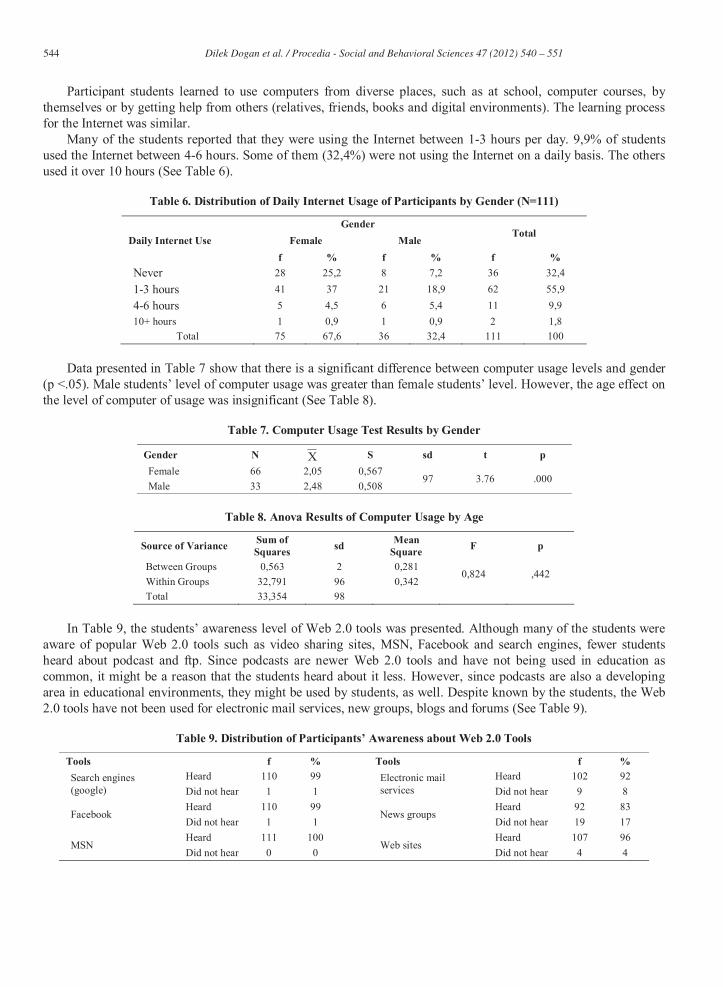
Many of the students reported that they were using the Internet between 1-3 hours per day. 9,9% of students used the Internet between 4-6 hours. Some of them (32,4%) were not using the Internet on a daily basis. The others used it over 10 hours (See Table 6).
Table 6. Distribution of Daily Internet Usage of Participants by Gender (N=111)
Daily Internet Use Gender
Total Female Male
f % f % f % Never 28 25,2 8 7,2 36 32,4 1-3 hours 41 37 21 18,9 62 55,9 4-6 hours 5 4,5 6 5,4 11 9,9 10+ hours 1 0,9 1 0,9 2 1,8 Total 75 67,6 36 32,4 111 100
Data presented in Table 7 show that there is a significant difference between computer usage levels and gender
(p <.05). Male students level of computer usage was greater than female students . However, the age effect on the level of computer of usage was insignificant (See Table 8).
Table 7. Computer Usage Test Results by Gender
Gender N X S sd t p Female 66 2,05 0,567
97 3.76 .000 Male 33 2,48 0,508
Table 8. Anova Results of Computer Usage by Age
Source of Variance Sum of Squares sd Mean
Square F p
Between Groups 0,563 2 0,281 0,824 ,442
Within Groups 32,791 96 0,342 Total 33,354 98
In Table 9 level of Web 2.0 tools was presented. Although many of the students were
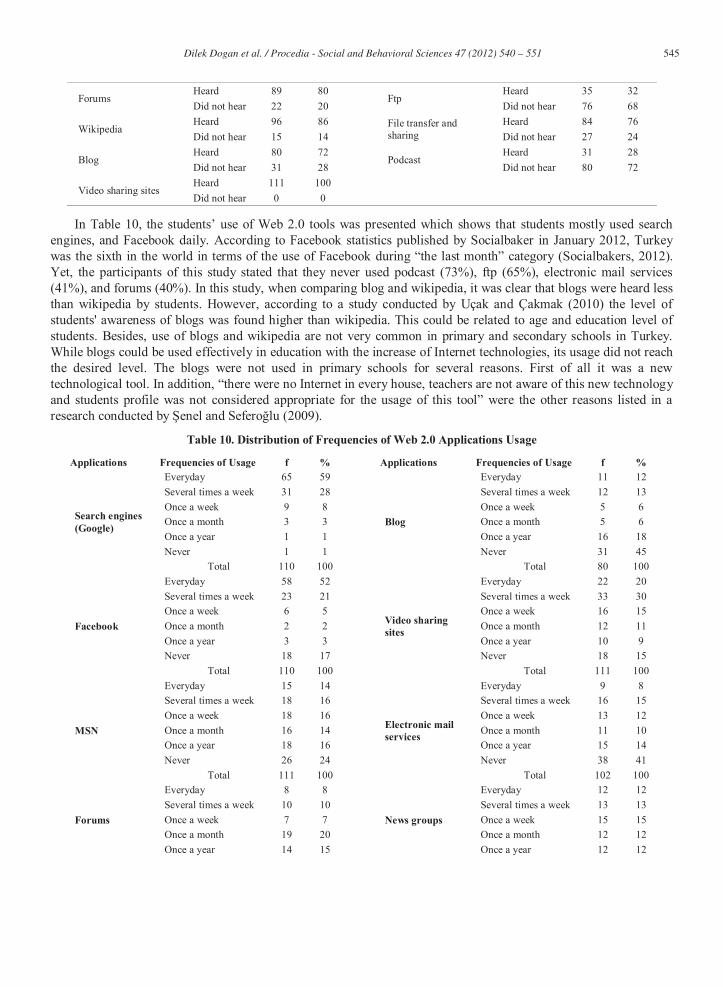
aware of popular Web 2.0 tools such as video sharing sites, MSN, Facebook and search engines, fewer students heard about podcast and ftp. Since podcasts are newer Web 2.0 tools and have not being used in education as common, it might be a reason that the students heard about it less. However, since podcasts are also a developing area in educational environments, they might be used by students, as well. Despite known by the students, the Web 2.0 tools have not been used for electronic mail services, new groups, blogs and forums (See Table 9).
Table 9. Awareness about Web 2.0 Tools
Tools f % Tools f % Search engines (google)
Heard 110 99 Electronic mail services
Heard 102 92 Did not hear 1 1 Did not hear 9 8
Facebook Heard 110 99 News groups
Heard 92 83 Did not hear 1 1 Did not hear 19 17
MSN Heard 111 100 Web sites
Heard 107 96 Did not hear 0 0 Did not hear 4 4
545 Dilek Dogan et al. / Procedia - Social and Behavioral Sciences 47 ( 2012 ) 540 – 551
Forums Heard 89 80 Ftp
Heard 35 32 Did not hear 22 20 Did not hear 76 68
Wikipedia Heard 96 86 File transfer and
sharing Heard 84 76
Did not hear 15 14 Did not hear 27 24
Blog Heard 80 72
Podcast Heard 31 28
Did not hear 31 28 Did not hear 80 72
Video sharing sites Heard 111 100 Did not hear 0 0
In Table 10, the use of Web 2.0 tools was presented which shows that students mostly used search engines, and Facebook daily. According to Facebook statistics published by Socialbaker in January 2012, Turkey was the sixth in the world in terms of the use of Facebook (Socialbakers, 2012). Yet, the participants of this study stated that they never used podcast (73%), ftp (65%), electronic mail services (41%), and forums (40%). In this study, when comparing blog and wikipedia, it was clear that blogs were heard less than wikipedia by students. However, according to students' awareness of blogs was found higher than wikipedia. This could be related to age and education level of students. Besides, use of blogs and wikipedia are not very common in primary and secondary schools in Turkey. While blogs could be used effectively in education with the increase of Internet technologies, its usage did not reach the desired level. The blogs were not used in primary schools for several reasons. First of all it was a new technological tool. In addition, there were no Internet in every house, teachers are not aware of this new technology and students profile was not considered appropriate
2009).
Table 10. Distribution of Frequencies of Web 2.0 Applications Usage
Applications Frequencies of Usage f % Applications Frequencies of Usage f %
Search engines (Google)
Everyday 65 59
Blog
Everyday 11 12 Several times a week 31 28 Several times a week 12 13 Once a week 9 8 Once a week 5 6 Once a month 3 3 Once a month 5 6 Once a year 1 1 Once a year 16 18 Never 1 1 Never 31 45 Total 110 100 Total 80 100
Everyday 58 52
Video sharing sites
Everyday 22 20 Several times a week 23 21 Several times a week 33 30 Once a week 6 5 Once a week 16 15 Once a month 2 2 Once a month 12 11 Once a year 3 3 Once a year 10 9 Never 18 17 Never 18 15 Total 110 100 Total 111 100
MSN
Everyday 15 14
Electronic mail services
Everyday 9 8 Several times a week 18 16 Several times a week 16 15 Once a week 18 16 Once a week 13 12 Once a month 16 14 Once a month 11 10 Once a year 18 16 Once a year 15 14 Never 26 24 Never 38 41 Total 111 100 Total 102 100
Forums
Everyday 8 8
News groups
Everyday 12 12 Several times a week 10 10 Several times a week 13 13 Once a week 7 7 Once a week 15 15 Once a month 19 20 Once a month 12 12 Once a year 14 15 Once a year 12 12
546 Dilek Dogan et al. / Procedia - Social and Behavioral Sciences 47 ( 2012 ) 540 – 551
Never 31 40 Never 24 36 Total 89 100 Total 88 100
Wikipedia
Everyday 11 11
Web sites
Everyday 29 27 Several times a week 24 24 Several times a week 19 18 Once a week 18 18 Once a week 20 19 Once a month 16 16 Once a month 11 10 Once a year 11 11 Once a year 5 5 Never 16 20 Never 23 23 Total 96 100 Total 107 102
Ftp
Everyday 1 2
Podcast
Everyday 3 4 Several times a week 5 9 Several times a week 2 4 Once a week 5 9 Once a week 5 9 Once a month 5 9 Once a month 3 6 Once a year 3 6 Once a year 2 4 Never 16 65 Never 16 73 Total 35 100 Total 31 100
File transfer and sharing
Everyday week 11 12 Several times a 9 10 Once a week 13 15 Once a month 14 16 Once a year 14 16 Never 23 31 Total 84 100
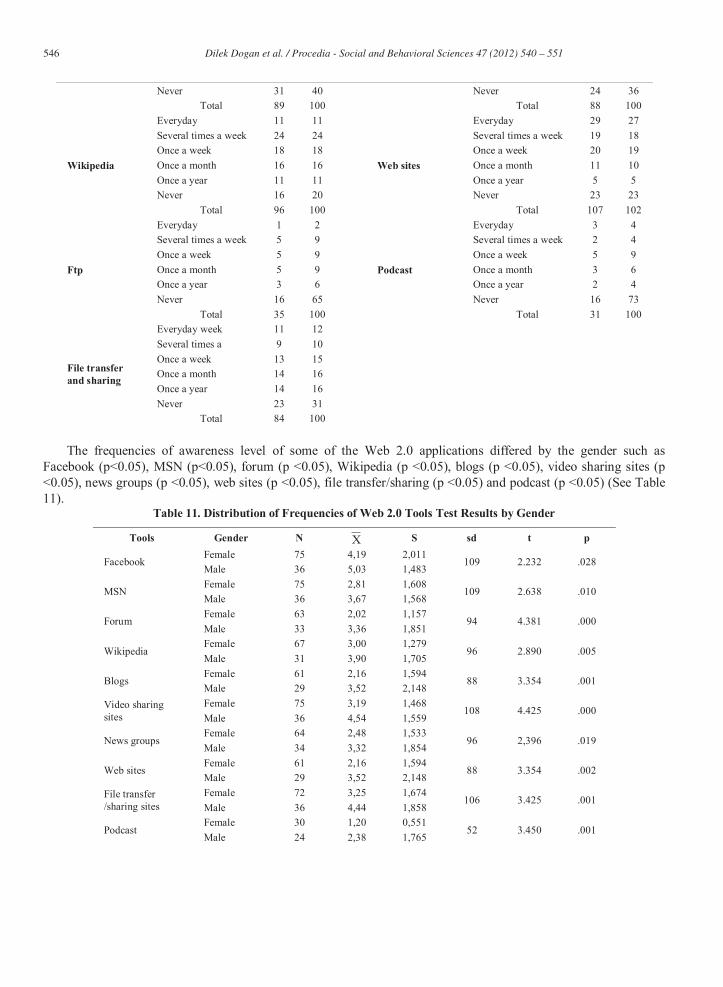
The frequencies of awareness level of some of the Web 2.0 applications differed by the gender such as
Facebook (p<0.05), MSN (p<0.05), forum (p <0.05), Wikipedia (p <0.05), blogs (p <0.05), video sharing sites (p <0.05), news groups (p <0.05), web sites (p <0.05), file transfer/sharing (p <0.05) and podcast (p <0.05) (See Table 11).
Table 11. Distribution of Frequencies of Web 2.0 Tools Test Results by Gender
Tools Gender N X S sd t p
Facebook Female 75 4,19 2,011
109 2.232 .028 Male 36 5,03 1,483
MSN Female 75 2,81 1,608
109 2.638 .010 Male 36 3,67 1,568
Forum Female 63 2,02 1,157
94 4.381 .000 Male 33 3,36 1,851
Wikipedia Female 67 3,00 1,279
96 2.890 .005 Male 31 3,90 1,705
Blogs Female 61 2,16 1,594
88 3.354 .001 Male 29 3,52 2,148
Video sharing sites
Female 75 3,19 1,468 108 4.425 .000
Male 36 4,54 1,559
News groups Female 64 2,48 1,533
96 2,396 .019 Male 34 3,32 1,854
Web sites Female 61 2,16 1,594
88 3.354 .002 Male 29 3,52 2,148
File transfer /sharing sites
Female 72 3,25 1,674 106 3.425 .001
Male 36 4,44 1,858
Podcast Female 30 1,20 0,551
52 3.450 .001 Male 24 2,38 1,765
547 Dilek Dogan et al. / Procedia - Social and Behavioral Sciences 47 ( 2012 ) 540 – 551
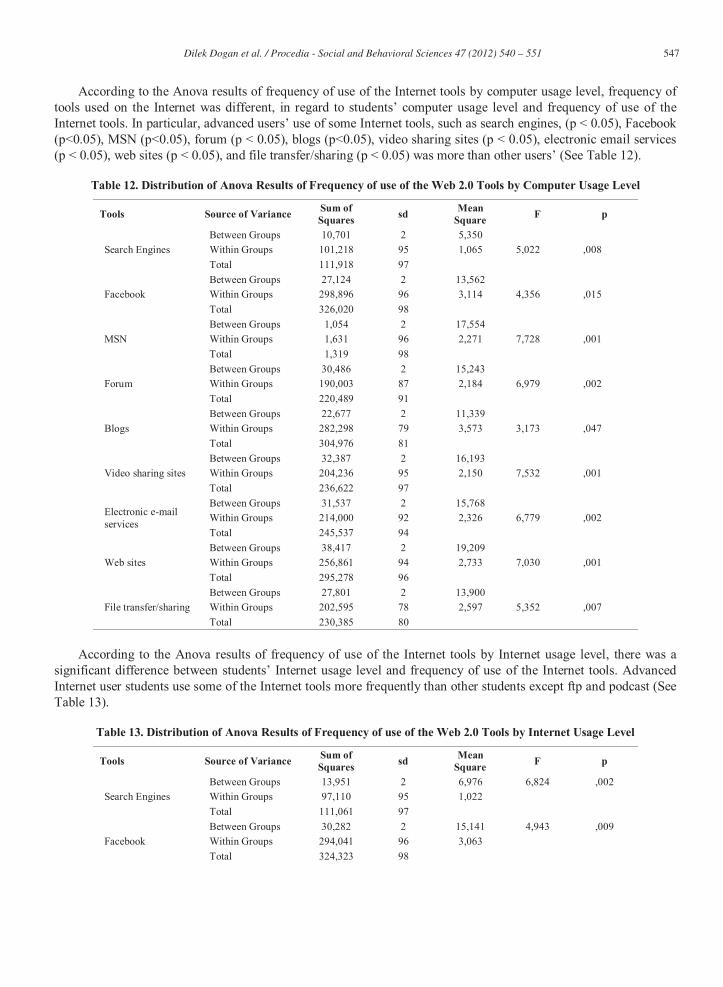
According to the Anova results of frequency of use of the Internet tools by computer usage level, frequency of tools used on the Internet was different, in regard to the
of some Internet tools, such as search engines, (p < 0.05), Facebook (p<0.05), MSN (p<0.05), forum (p < 0.05), blogs (p<0.05), video sharing sites (p < 0.05), electronic email services (p < 0.05), web sites (p < 0.05), and file transfer/sharing (p < 0.05) was more than other users (See Table 12).
Table 12. Distribution of Anova Results of Frequency of use of the Web 2.0 Tools by Computer Usage Level
Tools Source of Variance Sum of Squares sd Mean
Square F p
Search Engines Between Groups 10,701 2 5,350
5,022 ,008 Within Groups 101,218 95 1,065 Total 111,918 97
Facebook Between Groups 27,124 2 13,562
4,356 ,015 Within Groups 298,896 96 3,114 Total 326,020 98
MSN Between Groups 1,054 2 17,554
7,728 ,001 Within Groups 1,631 96 2,271 Total 1,319 98
Forum Between Groups 30,486 2 15,243
6,979 ,002 Within Groups 190,003 87 2,184 Total 220,489 91
Blogs Between Groups 22,677 2 11,339
3,173 ,047 Within Groups 282,298 79 3,573 Total 304,976 81
Video sharing sites Between Groups 32,387 2 16,193
7,532 ,001 Within Groups 204,236 95 2,150 Total 236,622 97
Electronic e-mail services
Between Groups 31,537 2 15,768 6,779 ,002 Within Groups 214,000 92 2,326
Total 245,537 94
Web sites Between Groups 38,417 2 19,209
7,030 ,001 Within Groups 256,861 94 2,733 Total 295,278 96
File transfer/sharing Between Groups 27,801 2 13,900
5,352 ,007 Within Groups 202,595 78 2,597 Total 230,385 80
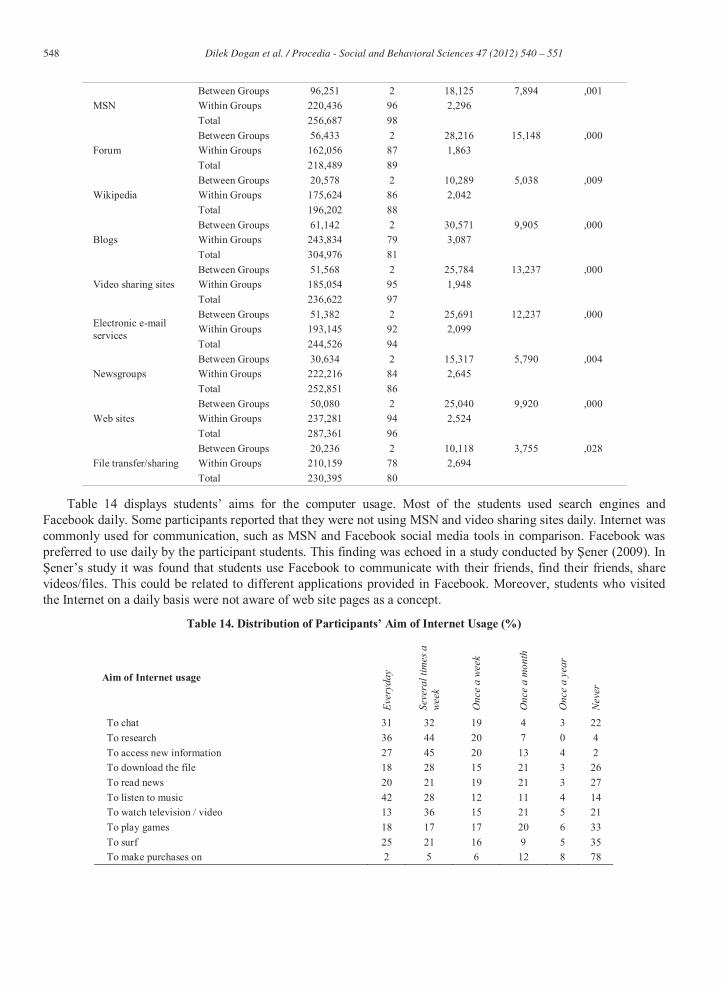
According to the Anova results of frequency of use of the Internet tools by Internet usage level, there was a
significant difference Internet usage level and frequency of use of the Internet tools. Advanced Internet user students use some of the Internet tools more frequently than other students except ftp and podcast (See Table 13).
Table 13. Distribution of Anova Results of Frequency of use of the Web 2.0 Tools by Internet Usage Level
Tools Source of Variance Sum of Squares sd Mean
Square F p
Search Engines Between Groups 13,951 2 6,976 6,824 ,002 Within Groups 97,110 95 1,022 Total 111,061 97
Facebook Between Groups 30,282 2 15,141 4,943 ,009 Within Groups 294,041 96 3,063 Total 324,323 98
548 Dilek Dogan et al. / Procedia - Social and Behavioral Sciences 47 ( 2012 ) 540 – 551
MSN Between Groups 96,251 2 18,125 7,894 ,001 Within Groups 220,436 96 2,296 Total 256,687 98
Forum Between Groups 56,433 2 28,216 15,148 ,000 Within Groups 162,056 87 1,863 Total 218,489 89
Wikipedia Between Groups 20,578 2 10,289 5,038 ,009 Within Groups 175,624 86 2,042 Total 196,202 88
Blogs Between Groups 61,142 2 30,571 9,905 ,000 Within Groups 243,834 79 3,087 Total 304,976 81
Video sharing sites Between Groups 51,568 2 25,784 13,237 ,000 Within Groups 185,054 95 1,948 Total 236,622 97
Electronic e-mail services
Between Groups 51,382 2 25,691 12,237 ,000 Within Groups 193,145 92 2,099 Total 244,526 94
Newsgroups Between Groups 30,634 2 15,317 5,790 ,004 Within Groups 222,216 84 2,645 Total 252,851 86
Web sites Between Groups 50,080 2 25,040 9,920 ,000 Within Groups 237,281 94 2,524 Total 287,361 96
File transfer/sharing Between Groups 20,236 2 10,118 3,755 ,028 Within Groups 210,159 78 2,694 Total 230,395 80
Table 14 displays for the computer usage. Most of the students used search engines and Facebook daily. Some participants reported that they were not using MSN and video sharing sites daily. Internet was commonly used for communication, such as MSN and Facebook social media tools in comparison. Facebook was preferred to use daily by the participant students. This finding was echoed in a study conducted
it was found that students use Facebook to communicate with their friends, find their friends, share videos/files. This could be related to different applications provided in Facebook. Moreover, students who visited the Internet on a daily basis were not aware of web site pages as a concept.
Table
Aim of Internet usage
Ever
yday
Seve
ral t
imes
a
wee
k
Onc
e a
wee
k
Onc
e a
mon
th
Onc
e a
year
Nev
er
To chat 31 32 19 4 3 22 To research 36 44 20 7 0 4 To access new information 27 45 20 13 4 2 To download the file 18 28 15 21 3 26 To read news 20 21 19 21 3 27 To listen to music 42 28 12 11 4 14 To watch television / video 13 36 15 21 5 21 To play games 18 17 17 20 6 33 To surf 25 21 16 9 5 35 To make purchases on 2 5 6 12 8 78
549 Dilek Dogan et al. / Procedia - Social and Behavioral Sciences 47 ( 2012 ) 540 – 551
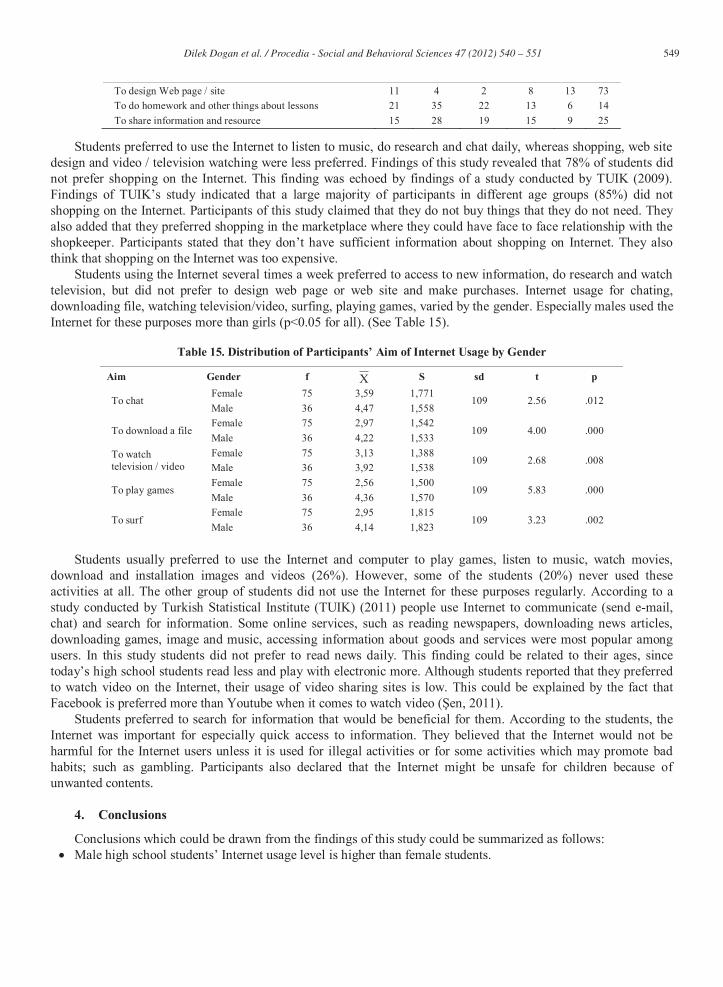
To design Web page / site 11 4 2 8 13 73 To do homework and other things about lessons 21 35 22 13 6 14 To share information and resource 15 28 19 15 9 25
Students preferred to use the Internet to listen to music, do research and chat daily, whereas shopping, web site design and video / television watching were less preferred. Findings of this study revealed that 78% of students did not prefer shopping on the Internet. This finding was echoed by findings of a study conducted by TUIK (2009).
a large majority of participants in different age groups (85%) did not shopping on the Internet. Participants of this study claimed that they do not buy things that they do not need. They also added that they preferred shopping in the marketplace where they could have face to face relationship with the
sufficient information about shopping on Internet. They also think that shopping on the Internet was too expensive.
Students using the Internet several times a week preferred to access to new information, do research and watch television, but did not prefer to design web page or web site and make purchases. Internet usage for chating, downloading file, watching television/video, surfing, playing games, varied by the gender. Especially males used the Internet for these purposes more than girls (p<0.05 for all). (See Table 15).
Table 15. Aim of Internet Usage by Gender
Aim Gender f X S sd t p
To chat Female 75 3,59 1,771
109 2.56 .012 Male 36 4,47 1,558
To download a file Female 75 2,97 1,542
109 4.00 .000 Male 36 4,22 1,533
To watch television / video
Female 75 3,13 1,388 109 2.68 .008
Male 36 3,92 1,538
To play games Female 75 2,56 1,500
109 5.83 .000 Male 36 4,36 1,570
To surf Female 75 2,95 1,815
109 3.23 .002 Male 36 4,14 1,823
Students usually preferred to use the Internet and computer to play games, listen to music, watch movies,
download and installation images and videos (26%). However, some of the students (20%) never used these activities at all. The other group of students did not use the Internet for these purposes regularly. According to a study conducted by Turkish Statistical Institute (TUIK) (2011) people use Internet to communicate (send e-mail, chat) and search for information. Some online services, such as reading newspapers, downloading news articles, downloading games, image and music, accessing information about goods and services were most popular among users. In this study students did not prefer to read news daily. This finding could be related to their ages, since
y with electronic more. Although students reported that they preferred to watch video on the Internet, their usage of video sharing sites is low. This could be explained by the fact that Facebook is preferred more than Youtube when it comes to watch video ( , 2011).
Students preferred to search for information that would be beneficial for them. According to the students, the Internet was important for especially quick access to information. They believed that the Internet would not be harmful for the Internet users unless it is used for illegal activities or for some activities which may promote bad habits; such as gambling. Participants also declared that the Internet might be unsafe for children because of unwanted contents.
4. Conclusions
Conclusions which could be drawn from the findings of this study could be summarized as follows: Male high school nternet usage level is higher than female students.
550 Dilek Dogan et al. / Procedia - Social and Behavioral Sciences 47 ( 2012 ) 540 – 551
Many students indicated that they heard about popular Web 2.0 tools such as video sharing sites, MSN, Facebook and search engines. On the other hand podcast and ftp was known by fewer students.
Search engines and Facebook are the most popular tools among students. Those tools also are used daily by the participants. However, students do not prefer to use other tools daily such as electronic mail services, new groups, blogs and forums.
Students use MSN and Facebook commonly. However, they use Facebook more frequently than MSN. Availability of different application in Facebook could be related with this finding.
Students generally use Internet to listen to music, do research and chat. However, they do not prefer it for shopping, web site design and watching video/television.
Many participants of this study do not have technical knowledge of some concepts such as web site. Participants stated that they use Internet to chat, to do research, to download files etc. However, they do not know that the platform they are using those tools are called web sites. They indicated that they used it fewer than Facebook, search engines, etc.
Finally, as the frequency of students' Internet usage decrease, their Internet usage aim change according to their needs.
References , & Web 2.0 .
. [Available online at: http://ab.org.tr/ab10/bildiri/175.doc], Retrieved on January 10, 2011) G kta , Y. (2006). The current status of information and communication technologies integration into schools of teacher education and K-12 in
Turkey. Unpublished doctoral dissertation, Middle East Technical University, Ankara, Turkey. [Available online at: http://etd.lib.metu.edu.tr/upload/12607829/index.pdf], Retrieved on December 24, 2011.
Hartshorne, R.., & Ajjan, H. (2009). Examining student decisions to adopt Web 2.0 technologies: Theory and empirical tests. Computer High Education, 21, 183-198. [Available online at: http://www.springerlink.com/content/565114m2062t6737/], Retrieved on December 12, 2011.
Horzum, M. B. (2010). Web 2.0 , kullan m s kla ndan
incelenmesi. ergisi, 7(1), 603-634. [Available online at: http://www.insanbilimleri.com/ojs/index.php/uib/article/view/910], Retrieved on December 12, 2011.
, S., & Kaban, A. (2008). y uygulamalar rmalar
. inet- - Bildir . [Available online at: http://inet-tr.org.tr/inetconf13/kitap/karaman_yildirim_inet08.pdf], Retrieved on December 12, 2011.
Joly, K. (2007). Facebook, MySpace, and Co.: IHEs ponder whether or not to embrace social networking sites . University Business, April 2007.
[Available online at: http://www.universitybusiness.com/ViewArticle.aspx?articleid=735], Retrieved on June 14, 2008. New Media Consortium and the EDUCAUSE Learning Initiative (2008). The Horizon Report, 2008 edition. The New Media Consortium.
[Available online at: http://www.nmc.org/pdf/2008-Horizon-Report.pdf], Retrieved on December 24, 2011. Schroeder, J. D., & Greenbowe, T. J. (2009). The chemistry of FB.: Using social networking to create an online community for organic for the
organic chemistry laboratory export. Innovate Journal of Online Education, 5(4). [Available online at: http://innovateonline.info/pdf/vol5_issue4/The_Chemistry_of_Facebook-__Using_Social_Networking_to_Create_an_Online_Community_for_the_Organic_Chemistry_Laboratory.pdf], Retrieved on December 24, 2011.
Socialbakers (2012). Facebook statistics by country. [Available online at: hhttp://www.socialbakers.com/facebook-statistics/?interval=last-month#chart-intervals], Retrieved on January 31, 2012.
. [Available online at: http://blog.ttnet.com.tr/turkiye%E2%80%99de-
internet-kullanimiyla-ilgili-carpici-veriler/], Retrieved on January 30, 2012.
k k a December12-13, 2009. [Available online at: http://inet-tr.org.tr/inetconf14/bildiri/4.pdf], Retrieved on January 30, 2012.
551 Dilek Dogan et al. / Procedia - Social and Behavioral Sciences 47 ( 2012 ) 540 – 551
. C., & -2009). 6- -Ankara. [Available online at:
http://yunus.hacettepe.edu.tr/~sadi/yayin/yayinlar.html], Retrieved on January 30, 2012. TUIK (2011). . [Available online at:
http://www.tuik.gov.tr/PreHaberBultenleri.do?id=6308&tb_id=20], Retrieved on January 30, 2012. , T. (2010). a k zellikleri. 2.
-24, 2010, Hacettepe University. [Available online at: http://by2010.bilgiyonetimi.net/bildiriler/ucak.pdf], Retrieved on January 30, 2012.