Embed Size (px)
Citation preview
1
Freight data collection using GPS and web-based surveys: insights
from US truck drivers’ survey and perspectives for urban freight
Moshe Ben-Akiva1, Tomer Toledo2, Jorge Santos1, Nathanael Cox1, Fang Zhao3, Yin Jin Lee1,
Vittorio Marzano4*
1 Intelligent Transportation Systems Laboratory – Massachusetts Institute of Technology – Cambridge, MA, USA
2 Technion - Israel Institute of Technology, Haifa, Israel
3 Singapore-MIT Alliance for Research and Technology (SMART-MIT) - Singapore
4 University of Naples “Federico II” – Department of Civil, Architectural and Environmental Engineering – Via Claudio
21, 80125 Napoli, Italy. Tel: +39 081 7683935 E-mail: [email protected].
Published in Case Studies in Transport Policy, 4(1), pp. 38-44, 2016.
Abstract
This paper reports on tools, methods and experimental designs that have
been developed to study the routing behavior and movement of trucks. The
application of these capabilities is demonstrated with a case study on the
route choices of North American intercity truck drivers’, with a focus on the
choice between tolled and free roads. An extension to the urban freight
context, currently ongoing in Singapore, is briefly discussed, highlighting the
challenges and main differences compared to the intercity case.
Keywords
GPS tracking, intercity freight route choice, urban freight modeling
1. Introduction
Freight transport accounts for a considerable share of urban and intercity traffic, and the
associated externalities. In the US, trucks carry the largest share of freight: in 2002, trucks
moved 64% of freight by value, 58% by weight, and 32% by ton-miles (BTS 2011). The
movement of freight shipment tonnage is projected to increase by 65-70% by 2020 (FHWA
2007); trucks are expected to haul 75% of the freight tonnage by 2020 (FHWA 2005) and 68%
of the value by 2040 (FHWA 2011c). The total annual highway miles driven by trucks increased
by 109% between 1980 and 2008, a higher percentage increase than for other vehicle types.
Similar trends have also been observed in the EU and other developed economies. The
development of models and methods for planning and appraisal of freight transport systems is
therefore a key priority. Current freight flow models are based on strong simplifying assumptions
and weak behavioral foundations, which limit their explanatory power. A lack of data further
limits their applicability. Thus, forecasts based on current models may be biased or imprecise.
There are three main dimensions of freight data collection: freight flows between the points of
production and consumption (P-C); the logistics characteristics of shipments (e.g. shipment

2
size, frequency of restocking, structure of the supply chain); and the transport characteristics of
shipments (e.g. modes, routes). Freight flows are normally collected using costly and infrequent
commodity flow surveys, providing a broad picture of national freight flows. These enable basic
forecasting/planning, but do not include detailed information on the underlying logistics and
transport choices. Thus, they do not support conversion of P-C flows into origin-destination (O-
D) freight flows with the relevant characteristics of each leg of the logistics chain. The complete
sequence of O-D flows corresponding to a P-C flows can only be traced by surveying producers
and logistics operators, carriers and multimodal transport operators. This information provides
useful insights into the supply chain structure (e.g. echelons and intermediate warehouses) and
intermediate transport stops (e.g. transit points and intermodal terminals) for the various legs of
the transport chain. Unfortunately, such data are not commonly available. When available, they
are collected through traditional surveys, which have high costs and low response rates.
Traditional surveys also tend to have non-representative samples. These stem from response
biases resulting from respondents’ short attention spans and limited ability to accurately recall
information. In addition, traditional surveys fail in revealing the inter-relations and dependencies
among the various entities involved in the freight industry that may influence their choices.
Improving freight data collection is needed to support the development of the next generation of
freight transport models. Within the industry, there is already considerable penetration of
sensing devices, such as smartphones, GPS loggers and RFID tags. These provide an
opportunity to leverage technology to unobtrusively collect a wealth of high-quality data, which
could be complemented with information from other sources, such as shippers and carriers.
This paper presents an implementation of a next-generation freight data collection effort. It
leverages GPS loggers, advanced sensing and communication technologies and machine
learning architecture to deliver previously unobtainable data. These data reflect observed rather
than stated information on the decisions of shippers and carriers.
The paper is structured as follows. Section 2 reviews the research on truck intercity route
choices. Section 3 describes the data collection approach. Section 4 illustrates the results,
showing the potential data quality and detail improvements that can be gained using this
approach. Section 5 discusses the adaptation of a similar approach to collection of data on
urban freight movements and then concludes.
2. Intercity truck route choices
Toll roads are an increasingly important part of the US road network, with 30-40% of new urban
expressway mileage and about 150 new centerline miles expected per year (Perez and
Lockwood 2006). Trucks make up a more significant percentage of toll road revenues than their
traffic share suggests, because they typically pay higher tolls than cars. Standard & Poor’s
(2005) report that heavy trucks usually make up around 10% of traffic flow on toll roads, but
25% of the revenues. Accurate predictions of truck flows and the corresponding revenues are
therefore crucial for toll road feasibility studies. Unfortunately, there is a record of significant
biases and high variance in toll road forecasts (Bain 2009). One source of these errors is in
3
truck drivers’ route choice modelling, mainly resulting from the lack of relevant routing behavior
observations.
Compared to passenger transportation, only limited work has been done on route choice in the
trucking industry. Most truck route choice studies reported in the literature are based on stated
preference (SP) data (e.g. Small et al. 1999, Kurri et al. 2000, Bolis and Maggi 2001, Austroads
2003, Hunt and Abraham 2004, Danielis et al. 2005, Fowkes and Whiteing 2006, Zhou et al.
2009, Wood 2011, Toledo et al. 2013). SP studies present respondents with simplified
hypothetical choice scenarios. The data collected may suffer from various biases and is
generally considered less reliable compared to revealed preference (RP) data. Several studies
(Jovicic 1998, de Jong et al. 2004, Hess et al. 2014) use RP data in addition to SP data. These
were collected using paper or computerized questionnaires in which respondents recorded their
travel. These studies are limited in level of detail and accuracy in which the routes are reported,
and in the number of observations that may be obtained from each respondent.
Large-scale data sets on truck route choice behavior have been obtained in varying ways.
Hagino et al. (2010) used records of traffic permit applications submitted by drivers. Knorring et
al. (2005) collected GPS traces using in-truck systems. However, both studies suffer from
substantial limitations: they do not collect any information about the shipments or the drivers.
Further, they only include a limited set of route attributes (e.g. travel times, distances and tolls
and road characteristics, such as number of lanes) that may be directly derived from a map
database. Knorring et al.’s study exemplifies the great potential of the use of GPS data, which is
readily available in large quantities from in-truck navigation systems. However, it also shows the
need to complement the location data with additional information related to the attributes of the
trip and the constraints imposed by the shipment schedule and other factors.
In the first phase of the current study, a traditional driver questionnaire with SP route choice
questions was administered. The results of analysis of the collected data are reported in Sun et
al. (2013) and Toledo et al. (2013). They show a wide variability in preferences towards toll
roads and tolls, with route choices depending on multiple factors that include not only travel
times and tolls, but also the probabilities and magnitudes of delays, toll bearing terms, driver
compensation methods and shipment characteristics.
The next section describes the second phase of the study, which included a GPS-based RP
survey using off-the-shelf GPS loggers to monitor all trips continuously and complemented by
web-based prompted recall questionnaires.
3. Data collection system and methods
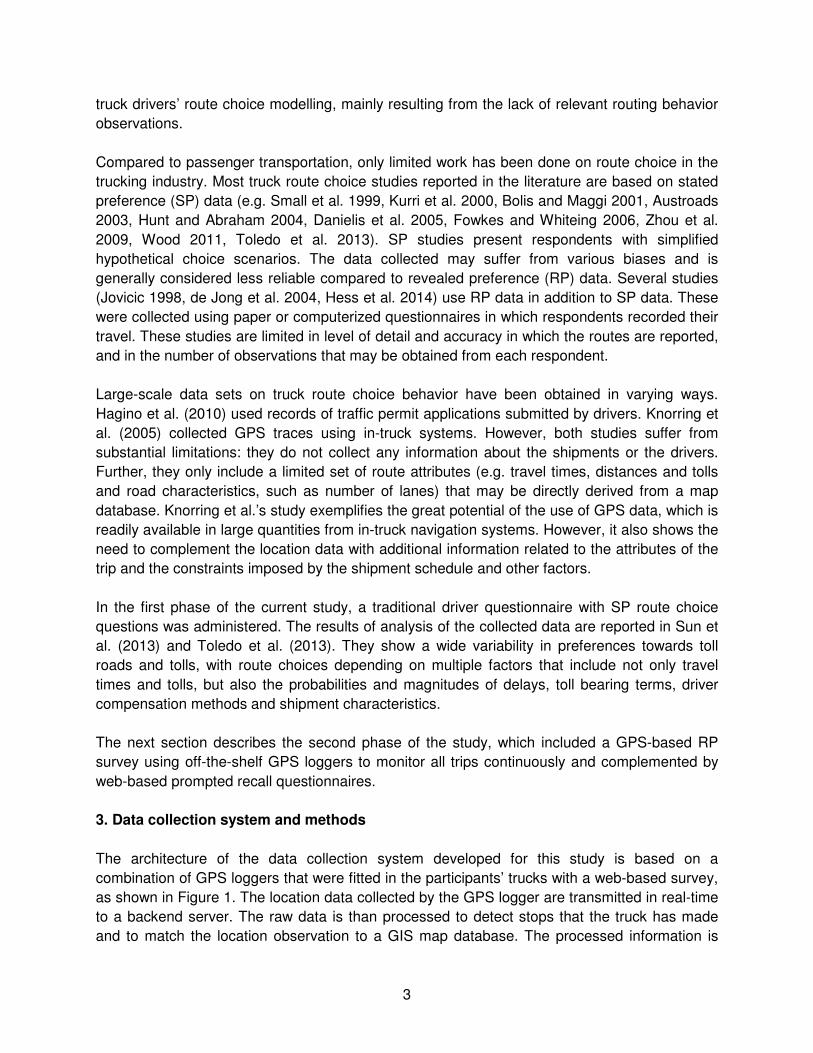
The architecture of the data collection system developed for this study is based on a
combination of GPS loggers that were fitted in the participants’ trucks with a web-based survey,
as shown in Figure 1. The location data collected by the GPS logger are transmitted in real-time
to a backend server. The raw data is than processed to detect stops that the truck has made
and to match the location observation to a GIS map database. The processed information is
4
displayed to the participants in a web-interface. The participants are asked to validate the data
presented to them and to respond to an additional prompted recall questionnaire.
Figure 1 – Architecture for the truck’ drivers route choice survey
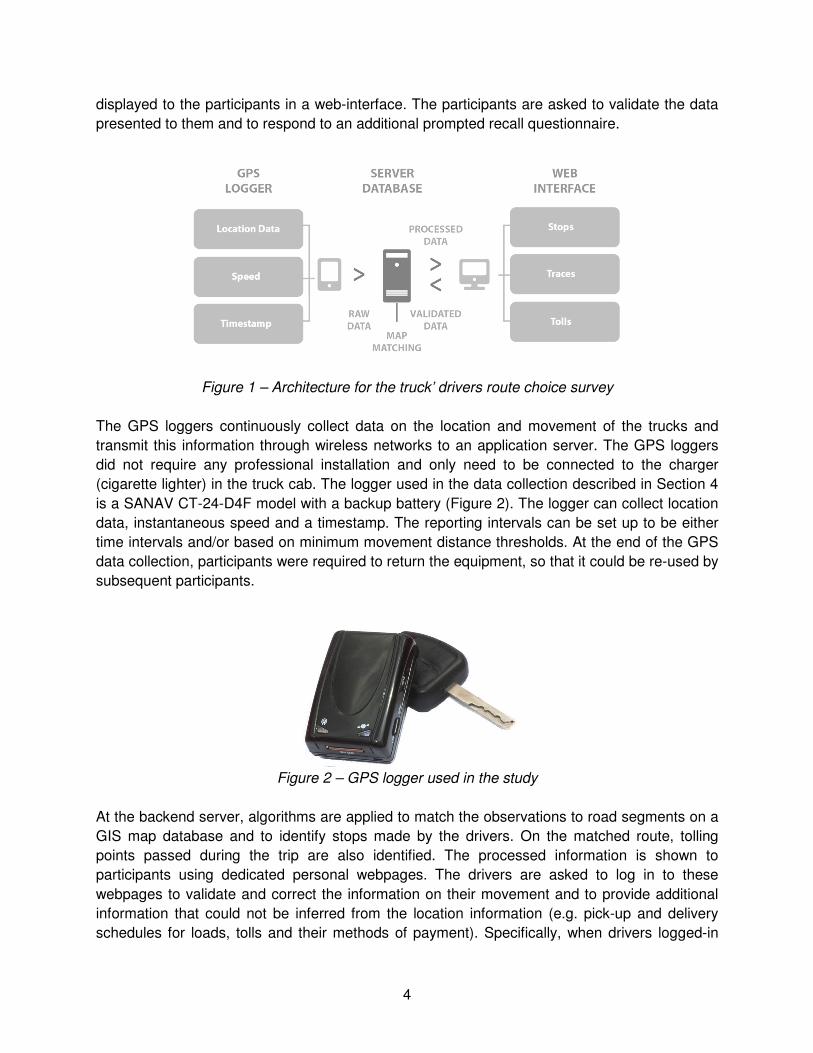
The GPS loggers continuously collect data on the location and movement of the trucks and
transmit this information through wireless networks to an application server. The GPS loggers
did not require any professional installation and only need to be connected to the charger
(cigarette lighter) in the truck cab. The logger used in the data collection described in Section 4
is a SANAV CT-24-D4F model with a backup battery (Figure 2). The logger can collect location
data, instantaneous speed and a timestamp. The reporting intervals can be set up to be either
time intervals and/or based on minimum movement distance thresholds. At the end of the GPS
data collection, participants were required to return the equipment, so that it could be re-used by
subsequent participants.
Figure 2 – GPS logger used in the study
At the backend server, algorithms are applied to match the observations to road segments on a
GIS map database and to identify stops made by the drivers. On the matched route, tolling
points passed during the trip are also identified. The processed information is shown to
participants using dedicated personal webpages. The drivers are asked to log in to these
webpages to validate and correct the information on their movement and to provide additional
information that could not be inferred from the location information (e.g. pick-up and delivery
schedules for loads, tolls and their methods of payment). Specifically, when drivers logged-in
5
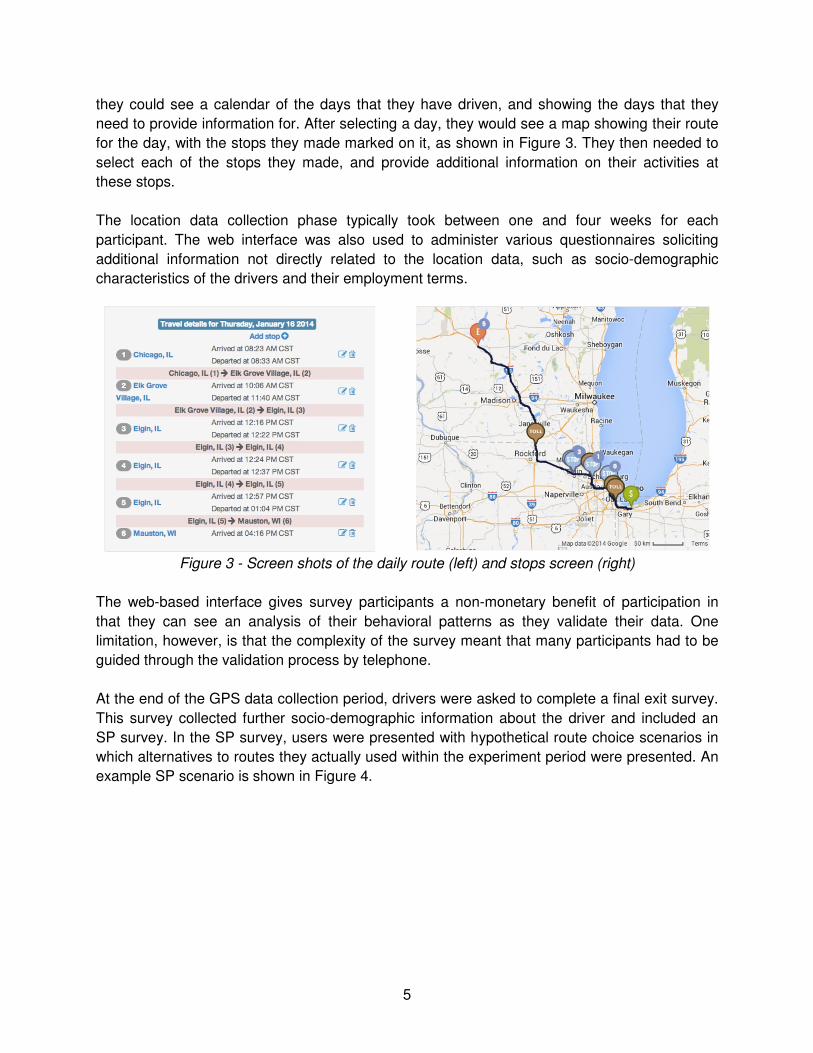
they could see a calendar of the days that they have driven, and showing the days that they
need to provide information for. After selecting a day, they would see a map showing their route
for the day, with the stops they made marked on it, as shown in Figure 3. They then needed to
select each of the stops they made, and provide additional information on their activities at
these stops.
The location data collection phase typically took between one and four weeks for each
participant. The web interface was also used to administer various questionnaires soliciting
additional information not directly related to the location data, such as socio-demographic
characteristics of the drivers and their employment terms.
Figure 3 - Screen shots of the daily route (left) and stops screen (right)
The web-based interface gives survey participants a non-monetary benefit of participation in
that they can see an analysis of their behavioral patterns as they validate their data. One
limitation, however, is that the complexity of the survey meant that many participants had to be
guided through the validation process by telephone.
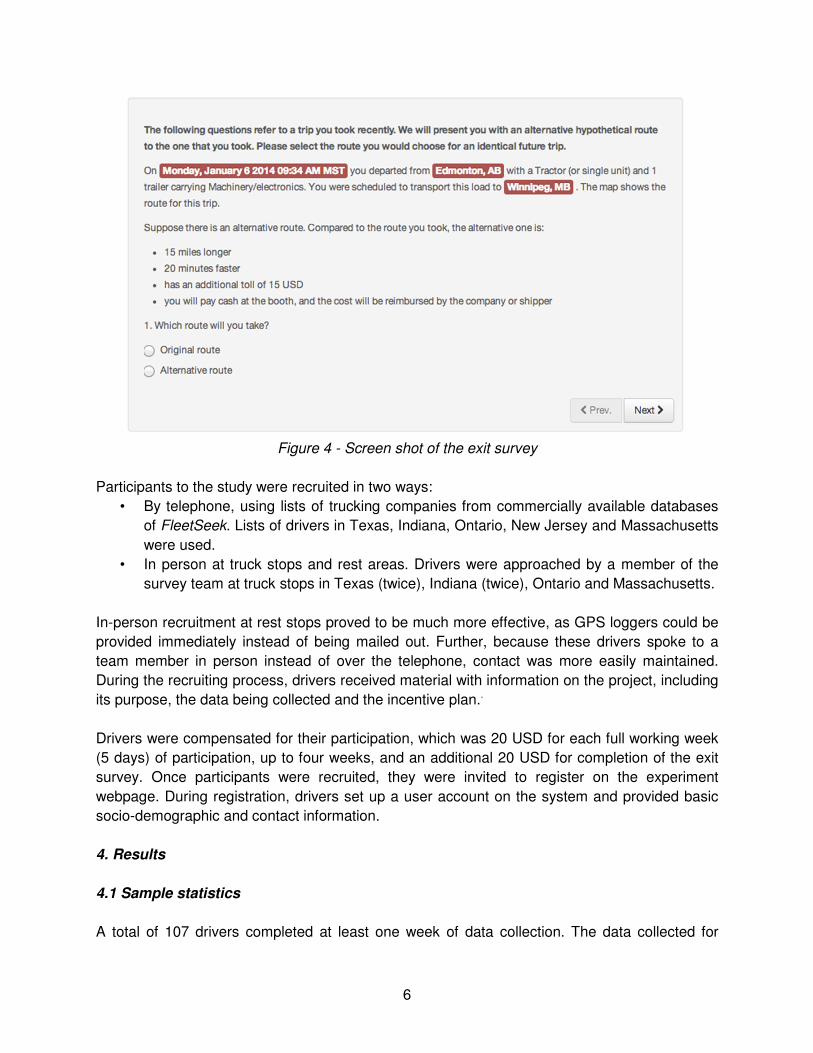
At the end of the GPS data collection period, drivers were asked to complete a final exit survey.
This survey collected further socio-demographic information about the driver and included an
SP survey. In the SP survey, users were presented with hypothetical route choice scenarios in
which alternatives to routes they actually used within the experiment period were presented. An
example SP scenario is shown in Figure 4.
6
Figure 4 - Screen shot of the exit survey
Participants to the study were recruited in two ways:
• By telephone, using lists of trucking companies from commercially available databases
of FleetSeek. Lists of drivers in Texas, Indiana, Ontario, New Jersey and Massachusetts
were used.
• In person at truck stops and rest areas. Drivers were approached by a member of the
survey team at truck stops in Texas (twice), Indiana (twice), Ontario and Massachusetts.
In-person recruitment at rest stops proved to be much more effective, as GPS loggers could be
provided immediately instead of being mailed out. Further, because these drivers spoke to a
team member in person instead of over the telephone, contact was more easily maintained.
During the recruiting process, drivers received material with information on the project, including
its purpose, the data being collected and the incentive plan..
Drivers were compensated for their participation, which was 20 USD for each full working week
(5 days) of participation, up to four weeks, and an additional 20 USD for completion of the exit
survey. Once participants were recruited, they were invited to register on the experiment
webpage. During registration, drivers set up a user account on the system and provided basic
socio-demographic and contact information.
4. Results
4.1 Sample statistics
A total of 107 drivers completed at least one week of data collection. The data collected for
7
them covers 2255 validated days. Within this time, 12,617 stops were validated and 1,480 toll
point passages were recorded.
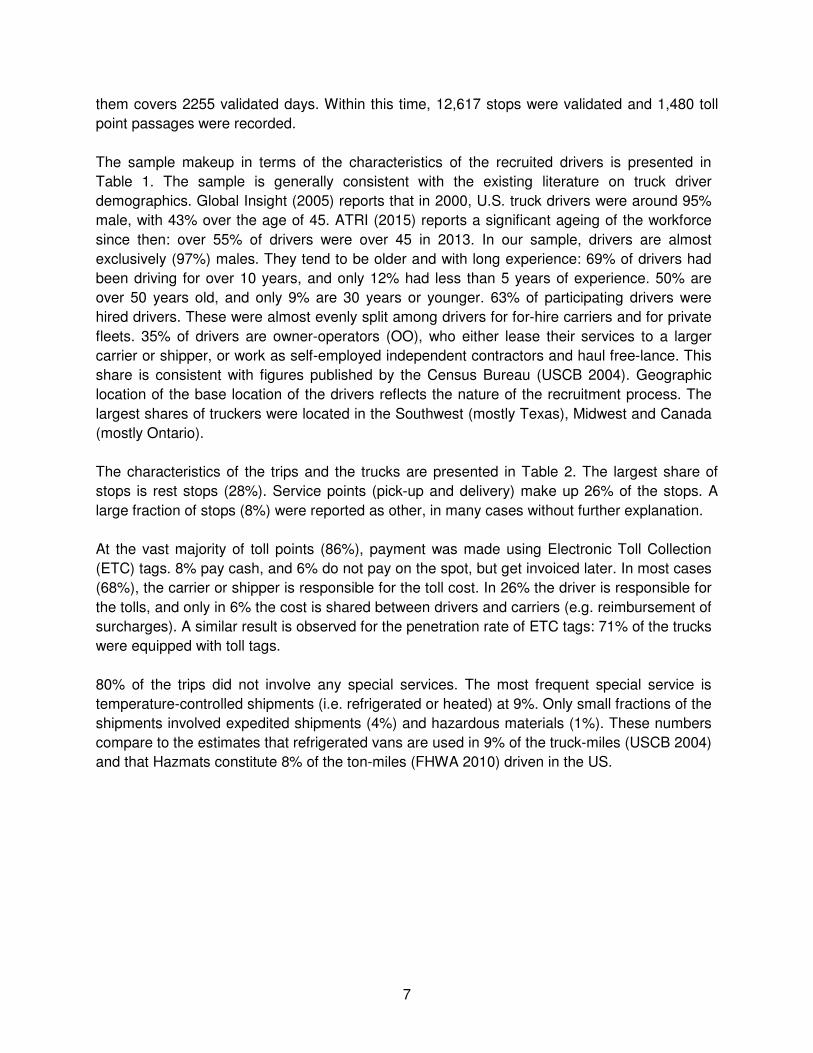
The sample makeup in terms of the characteristics of the recruited drivers is presented in
Table 1. The sample is generally consistent with the existing literature on truck driver
demographics. Global Insight (2005) reports that in 2000, U.S. truck drivers were around 95%
male, with 43% over the age of 45. ATRI (2015) reports a significant ageing of the workforce
since then: over 55% of drivers were over 45 in 2013. In our sample, drivers are almost
exclusively (97%) males. They tend to be older and with long experience: 69% of drivers had
been driving for over 10 years, and only 12% had less than 5 years of experience. 50% are
over 50 years old, and only 9% are 30 years or younger. 63% of participating drivers were
hired drivers. These were almost evenly split among drivers for for-hire carriers and for private
fleets. 35% of drivers are owner-operators (OO), who either lease their services to a larger
carrier or shipper, or work as self-employed independent contractors and haul free-lance. This
share is consistent with figures published by the Census Bureau (USCB 2004). Geographic
location of the base location of the drivers reflects the nature of the recruitment process. The
largest shares of truckers were located in the Southwest (mostly Texas), Midwest and Canada
(mostly Ontario).
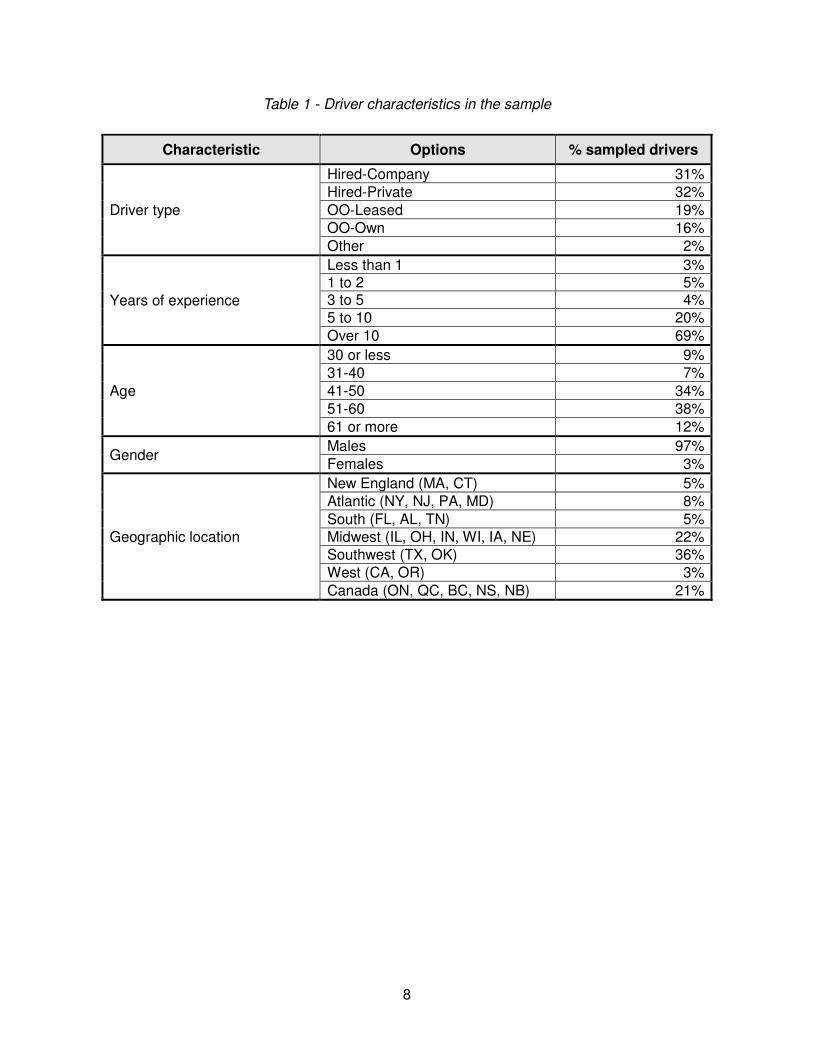
The characteristics of the trips and the trucks are presented in Table 2. The largest share of
stops is rest stops (28%). Service points (pick-up and delivery) make up 26% of the stops. A
large fraction of stops (8%) were reported as other, in many cases without further explanation.
At the vast majority of toll points (86%), payment was made using Electronic Toll Collection
(ETC) tags. 8% pay cash, and 6% do not pay on the spot, but get invoiced later. In most cases
(68%), the carrier or shipper is responsible for the toll cost. In 26% the driver is responsible for
the tolls, and only in 6% the cost is shared between drivers and carriers (e.g. reimbursement of
surcharges). A similar result is observed for the penetration rate of ETC tags: 71% of the trucks
were equipped with toll tags.
80% of the trips did not involve any special services. The most frequent special service is
temperature-controlled shipments (i.e. refrigerated or heated) at 9%. Only small fractions of the
shipments involved expedited shipments (4%) and hazardous materials (1%). These numbers
compare to the estimates that refrigerated vans are used in 9% of the truck-miles (USCB 2004)
and that Hazmats constitute 8% of the ton-miles (FHWA 2010) driven in the US.
8
Table 1 - Driver characteristics in the sample
Characteristic Options % sampled drivers
Driver type
Hired-Company 31%
Hired-Private 32%
OO-Leased 19%
OO-Own 16%
Other 2%
Years of experience
Less than 1 3% 1 to 2 5% 3 to 5 4%
5 to 10 20%
Over 10 69%
Age
30 or less 9%
31-40 7%
41-50 34%
51-60 38%
61 or more 12%
Gender Males 97%
Females 3%
Geographic location
New England (MA, CT) 5%
Atlantic (NY, NJ, PA, MD) 8%
South (FL, AL, TN) 5%
Midwest (IL, OH, IN, WI, IA, NE) 22%
Southwest (TX, OK) 36%
West (CA, OR) 3%
Canada (ON, QC, BC, NS, NB) 21%
9
Table 2 - Freight- and service- related characteristics in the sample
Characteristic Option % sample composition
Stops
Load or pick-up 11%
Unload or drop-off 15%
Fuel 7%
Maintenance 4%
Meals 10% Rest 28% Home 3%
Depot 5%
Other 18%
Toll payments
ETC 86%
Cash 8%
Invoice 6%
Toll responsibility
Carrier or shipper 68%
Shared 6%
Driver 26%
Electronic tags Yes 71%
No 29%
Special services
None 80%
Temperature controlled 9%
Expedited or express 4%
Hazardous materials 1%
Other 6%
4.3 Analysis illustration
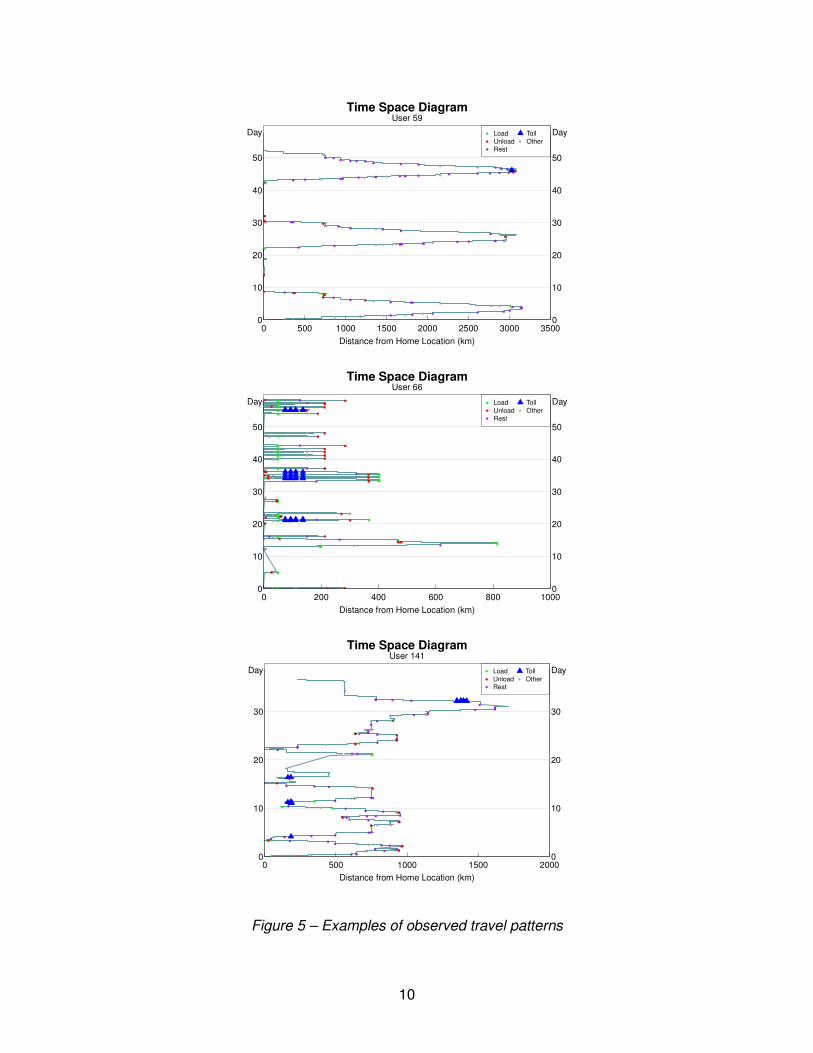
Significant variation in drivers’ behavioral patterns is observed, showing several distinct
categories of drivers: (i) Drivers who made a series of regular, long tours spanning several days
or more; (ii) Drivers who made shorter tours within a smaller region; (iii) Drivers who made a
combination of short and long tours; and (iv) Drivers who did not exhibit a distinctive tour
pattern, traveling from city to city in search of work. Figure 5 shows examples of time-space
diagrams of drivers’ travel. The x-axis reports the distance from the drivers’ base location
(usually home or depot) and the y-axis the time (in days) of observation. Stops are shown as
points on the time-space trajectories. The top diagram shows a driver making regular week-long
round trips. The middle diagram shows a driver making mostly single day trips (thus returning to
the base location every day) with different destinations and the occasional longer trip. The
bottom diagram shows a driver with long irregular trips and no clear pattern also with respect to
visits to the base location.
10
Figure 5 – Examples of observed travel patterns
Distance from Home Location (km)
● ●● ●
●●●
●●●
●
●
● ● ●●●●● ● ●● ●
●●●
●
● ● ● ● ● ●● ●
●●
●●●
●
●●●
● ●● ●
●●●
●●●
● ●● ● ● ●
●●
●
●
● ● ●●●
● ●
●●
●
●●
●
●
●●●●
●●●
●
●●
●●
●●
●
●●●●
● ●● ● ●
●
●●
●●●
●
●
●
●●
● ●
●
●●
●●
●●
●●
●● ●
●●
●
●
●
●
●
●●●●
●
●●●●●
●
●
●
●
Time Space DiagramUser 59
0
10
20
30
40
50
Day
0
10
20
30
40
50
Day
0 500 1000 1500 2000 2500 3000 3500
●
●
●
●
Load
UnloadRest
Toll
Other
Distance from Home Location (km)
●
●● ●
●
●
●
●
●
●●
● ●
●
●●●● ●
●
●●●● ●●
●●●
●●●●●
●●●
●●●
● ●●●●
●●
●●●
●●
●●●●●●●
●●●
● ●●●●●
●●●●
● ●●●● ● ●
●
●
●●●●●●
●
●●●●●●●●
●
●
●
●
●
●
●●●
●
● ●●●●
●●
●
●
●
●
●●
●
●
●●
●
●●
●
●
●
●●●●●
●
●● ●●●
●
●●●●
●●●● ●●●
●●
●●
●●●●●
●
●●
●●●
●●●●
●
Time Space DiagramUser 66
0
10
20
30
40
50
Day
0
10
20
30
40
50
Day
0 200 400 600 800 1000
●
●
●
●
Load
Unload
Rest
Toll
Other
Distance from Home Location (km)
●
●●
●●● ●
●
●
●
●
●●
●
●
●
●
●●
●●
●●●●
●● ● ●●●●
●
●●
●●
●●●
●
●
●
●
●
●●
●
●
●
●
●●
●
●●●
●
●
●
●
●
● ●
●
●
●
●
● ● ●
●●●
●●●
●●
●
●
●
●● ●●
●
●●
●
●●●
●●
●
●
●
●●●
●●● ●
●
●
●
●
●
●
●●
●
●
●
●
●
●
●
●
●
●
●
●
●
●
●
●●
●
●
●
●●
●
●
●
●
●
●●
●
●●
●
●
●
●●
Time Space DiagramUser 141
0
10
20
30
Day
0
10
20
30
Day
0 500 1000 1500 2000
●
●
●
●
Load
UnloadRest
Toll
Other
11
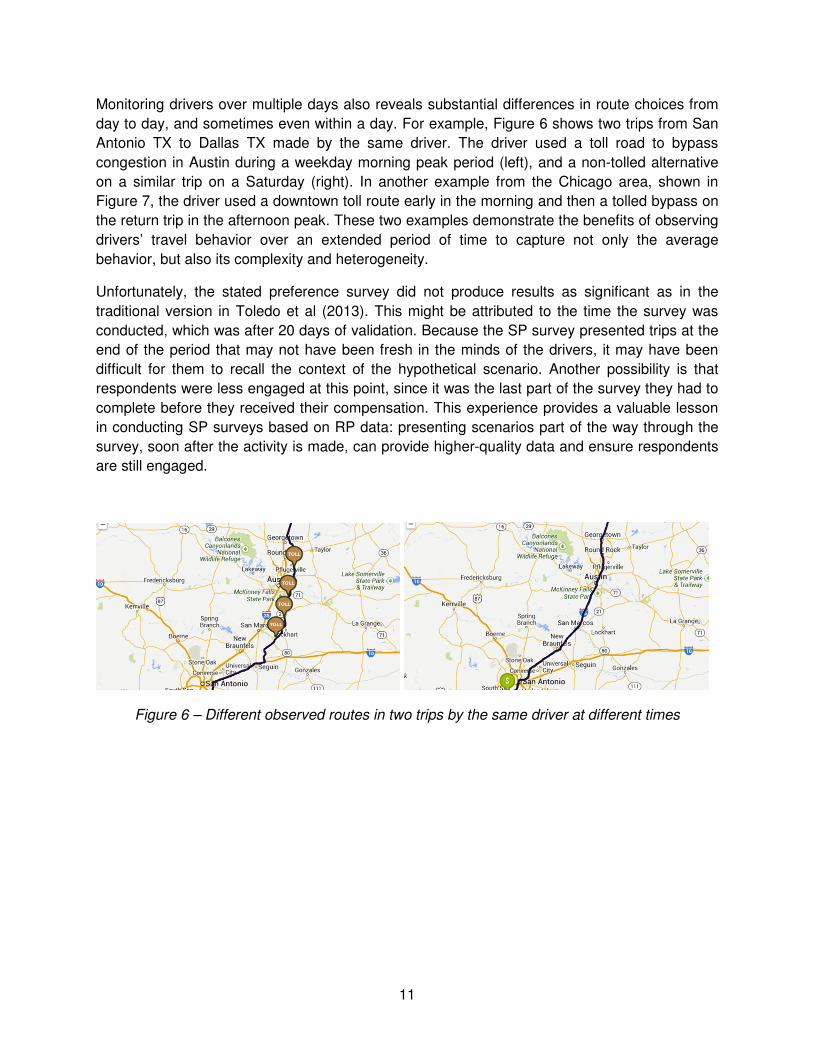
Monitoring drivers over multiple days also reveals substantial differences in route choices from
day to day, and sometimes even within a day. For example, Figure 6 shows two trips from San
Antonio TX to Dallas TX made by the same driver. The driver used a toll road to bypass
congestion in Austin during a weekday morning peak period (left), and a non-tolled alternative
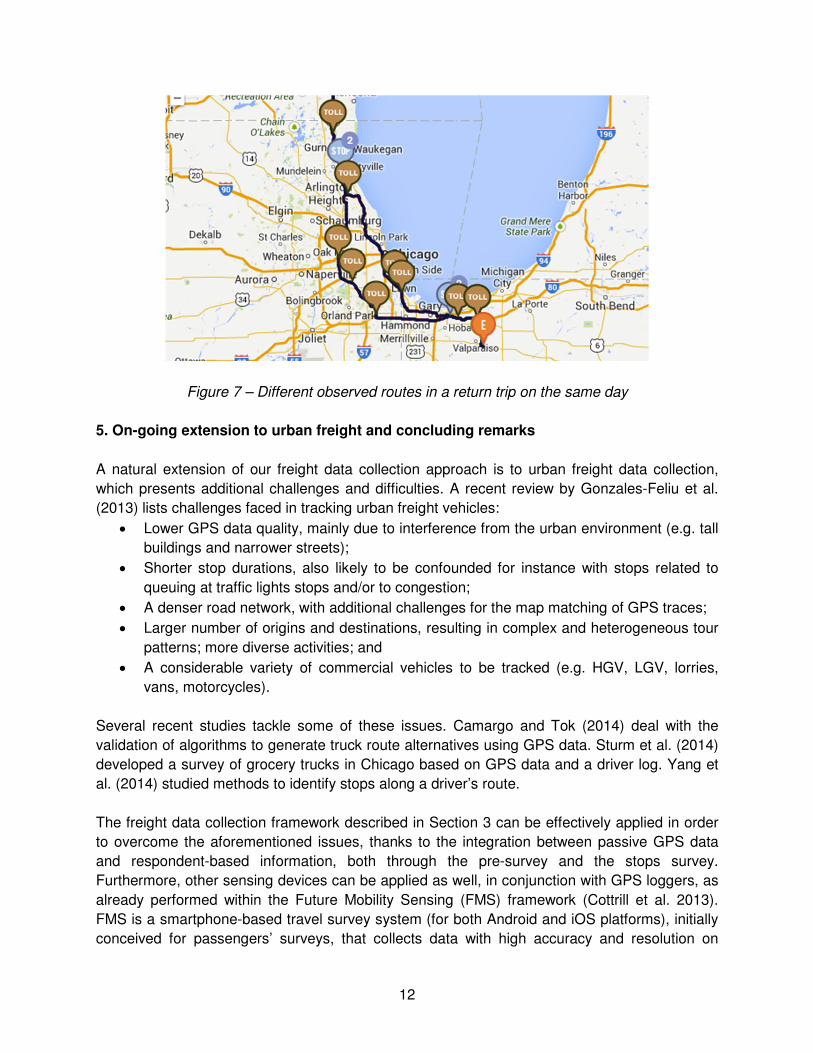
on a similar trip on a Saturday (right). In another example from the Chicago area, shown in
Figure 7, the driver used a downtown toll route early in the morning and then a tolled bypass on
the return trip in the afternoon peak. These two examples demonstrate the benefits of observing
drivers’ travel behavior over an extended period of time to capture not only the average
behavior, but also its complexity and heterogeneity.
Unfortunately, the stated preference survey did not produce results as significant as in the
traditional version in Toledo et al (2013). This might be attributed to the time the survey was
conducted, which was after 20 days of validation. Because the SP survey presented trips at the
end of the period that may not have been fresh in the minds of the drivers, it may have been
difficult for them to recall the context of the hypothetical scenario. Another possibility is that
respondents were less engaged at this point, since it was the last part of the survey they had to
complete before they received their compensation. This experience provides a valuable lesson
in conducting SP surveys based on RP data: presenting scenarios part of the way through the
survey, soon after the activity is made, can provide higher-quality data and ensure respondents
are still engaged.
Figure 6 – Different observed routes in two trips by the same driver at different times
12
Figure 7 – Different observed routes in a return trip on the same day
5. On-going extension to urban freight and concluding remarks
A natural extension of our freight data collection approach is to urban freight data collection,
which presents additional challenges and difficulties. A recent review by Gonzales-Feliu et al.
(2013) lists challenges faced in tracking urban freight vehicles:
• Lower GPS data quality, mainly due to interference from the urban environment (e.g. tall
buildings and narrower streets);
• Shorter stop durations, also likely to be confounded for instance with stops related to
queuing at traffic lights stops and/or to congestion;
• A denser road network, with additional challenges for the map matching of GPS traces;
• Larger number of origins and destinations, resulting in complex and heterogeneous tour
patterns; more diverse activities; and
• A considerable variety of commercial vehicles to be tracked (e.g. HGV, LGV, lorries,
vans, motorcycles).
Several recent studies tackle some of these issues. Camargo and Tok (2014) deal with the
validation of algorithms to generate truck route alternatives using GPS data. Sturm et al. (2014)
developed a survey of grocery trucks in Chicago based on GPS data and a driver log. Yang et
al. (2014) studied methods to identify stops along a driver’s route.
The freight data collection framework described in Section 3 can be effectively applied in order
to overcome the aforementioned issues, thanks to the integration between passive GPS data
and respondent-based information, both through the pre-survey and the stops survey.
Furthermore, other sensing devices can be applied as well, in conjunction with GPS loggers, as
already performed within the Future Mobility Sensing (FMS) framework (Cottrill et al. 2013).
FMS is a smartphone-based travel survey system (for both Android and iOS platforms), initially
conceived for passengers’ surveys, that collects data with high accuracy and resolution on
13
participants’ travel and activity information, thus yielding more detailed and varied data than
traditional travel survey approaches. The FMS system was field tested in Singapore (Zhao et al
2015) in conjunction with the 2012 Singapore Land Transport Authority (LTA)’s Household
Interview Travel Survey (HITS). More than 1500 participants signed up for the smartphone
based survey, and about 800 of them completed the survey (collected data for at least 14 days,
and validated at least 5 days). Comparison between FMS and HITS reveals several advantages
of FMS over traditional surveys including highly accurate and detailed data, capability to capture
heterogeneity of user pattern over multiple days, and low cost.
The FMS concept is currently being adapted to the urban freight context. In this respect, the
questionnaires used in the US truck drivers’ survey have been enhanced with further
information on frequent stops, routes, trips and activity types to capture repetitive behavior.
Further stop type options have been added to allow drivers to more accurately describe their
activities. In addition, improvements to stop/activity detection algorithms are under development,
to extend the period of observation and to enhance machine learning algorithms to include user
history and Points of Interest (POI) data. Data collection is already under way in Singapore with
new, less expensive GPS loggers (SANAV CT-58). We plan to integrate the GPS traces with
smartphone traces to enhance the quality of location data, and also with specially designed on-
board diagnostics (OBD) devices to estimate carbon footprint and fuel consumption, both major
concerns in city logistics operations.
In summary, the research reported in this paper demonstrates how advanced sensing and
communication technologies, combined with machine learning architecture, can be used to
collect previously unattainable freight data. Our data collection effort provides a rich, high-quality
data set without the participant burden typically faced in traditional surveys. The data reveal in
great detail the complexity and heterogeneity of freight travel patterns, providing the building
blocks for the next generation of effective and innovative freight models.
Acknowledgments
Support for the urban freight data collection research research has been provided by the Future
Urban Mobility project of the Singapore-MIT Alliance for Research and Technology (SMART).
References
Austroads (2003), Economic Evaluation of Road Investment Proposals: Valuing Travel Time
Savings for Freight, Publication No. AP–R230/03, Austroads Publication No. AP–R230/03
Sydney, Australia.
ATRI (2015), Analysis of Trick Driver Age Demographics Across Two Decades, available at:
http://atri-online.org/wp-content/uploads/2014/12/Analysis-of-Truck-Driver-Age-
Demographics-FINAL-12-2014.pdf
Bain R. (2009). Error and optimism bias in toll road traffic forecasts. Transportation 36, pp. 469-
482.
Ben-Akiva M., Meersman H, Van Der Voorde E. (eds) (2013). Freight Transport Modelling.
14
Emerald Group Publishing.
Ben-Akiva M., Meersman H, Van Der Voorde E. (eds) (2008). Recent Developments in
Transport Modelling: Lessons for the Freight Sector. Emerald Group Publishing Limited.
BTS (2011), Freight Data and Statistics, Bureau of Transportation Statistics, US Department of
Transportation, Washington DC. Available at:
http://www.bts.gov/programs/freight_transportation/html/trucking.html
Bolis S. and Maggi R. (2001), Evidence on Shippers' Transport and Logistics Choice, in
Proceedings of the 1st Swiss Transport Research Conference, Ascona, Switzerland.
Camargo P.V., Tok A. (2014). Validating truck route enumeration algorithms using GPS data, in
Proceedings of 93rd meeting of the Transportation Research Board, Washington DC.
Cottrill, C., F.C. Pereira, F. Zhao, I. Dias, H. B. Lim, M. Ben-Akiva, and C. Zegras (2013), Future
Mobility Survey: Experience in Developing a Smart-Phone-Based Travel Survey in
Singapore, Transportation Research Record 2354, pp 59-67.
Danielis R., Marcucci E. and Rotaris L., (2005), Logistics Managers’ Stated Preferences for
Freight Service Attributes, Transportation Research Part E 41, pp. 201-215.
De Jong G., Bakker S., Pieters M., Donselaar P.W. (2004). New values of time and reliability in
freight transport in the Netherlands, in Proceedings of European Transport Conference 2004.
Fowkes, A.S. and Whiteing A. (2006), The Value of Freight Travel Time savings and Reliability
improvements – Recent Evidence from Great Britain, in Proceedings of the European
Transport Conference 2006.
FHWA (2005), Freight Facts and Figures 2005, Federal Highway Administration US Department
of Transportation, Washington DC.
FHWA (2007), Financing Freight Improvements, Federal Highway Administration, US
Department of Transportation, Washington DC. Available at:
http://www.ops.fhwa.dot.gov/freight/publications/freightfinancing/freightfinancing.pdf
FHWA (2010a), Our Nation’s Highways: 2010, Federal Highway Administration, US Department
of Transportation, Washington DC. Available at:
http://www.fhwa.dot.gov/policyinformation/pubs/hf/pl10023/fig1_8.cfm
FHWA (2010b), US 2010 Freight Facts and Figures, Federal Highway Administration, US
Department of Transportation, Washington DC.
FHWA (2011c), US 2011 Freight Facts and Figures, Federal Highway Administration, US
Department of Transportation, Washington DC.
Global Insight (2005), The U.S. Truck Driver Shortage: Analysis and Forecasts. Available at:
https://www.cdlschool.com/_pdf/ATADriverShortageStudy05.pdf
Gonzalez-Feliu J., Pluvinet P., Serouge M., Gardrat M. (2013). GPS-based data production in
urban freight distribution. Internal report, Laboratoire d’Economie des Transports, University
of Lyon, France.
Hagino Y., Hyodo T. Endo K. and Nishi R. (2010). Truck route choice analysis by traffic
application data. The 3rd International Conference on Transportation and Logistics (T-LOG
2010), Fukuoka, Japan
Hess, S., Quddus, M., Rieser, N. & Daly, A.J. (2014). Developing advanced route choice
models for heavy goods vehicles using GPS data. Working paper, Institute for Transport
Studies, University of Leeds (UK)
Hunt J.D. and Abraham J.E. (2004), Stated Response Examination of Factors Influencing
15
Commercial Movement Route Choice Behavior, in Proceedings of the 8th International
Conference on Applications of Advanced Technologies in Transportation Engineering,
Beijing, China, pp. 72-77.
Jong G. de, Bakker S., Pieters M. and Donselaar P.W., (2004), New Values of Time and
Reliability in Freight Transport in the Netherlands, in Proceedings of the European Transport
Conference 2004.
Jovicic G. (1998), Application of Models based on Stated and Revealed Preference Data for
Forecasting Danish International Freight Transport, in Proceedings of the Annual Transport
Conference at Aalborg University.
Knorring J.H., He R. and Kornhauser A.L. (2005). Analysis of route choice decisions by long-
haul truck drivers. Transportation Research Record 1923, pp. 46–60.
Kurri J., Sirkia A. and Mikola J. (2000), Value of Time in Freight Transport in Finland,
Transportation Research Record 1725, pp.26-30.
Perez B. and Lockwood S. (2006), Current Toll Road Activity in the U.S.- A Survey and
Analysis, Federal Highway Administration US Department of Transportation, Washington DC.
Available at: http://www.fhwa.dot.gov/ipd/pdfs/toll_survey_0906.pdf
Small K.A., Noland R., Chu X. and Lewis D. (1999), Valuation of Travel Time Savings and
Predictability in Congested conditions for Highway User Cost Estimation, NCHRP Report
431, US Department of Transportation, Washington DC.
Standard & Poor’s (2005). Standard & Poor's Traffic Forecasting Risk Study Update.
Sturm K., Pourabdollahi Z., Mohammadian A., Kawamura K. (2014). GPS and driver log-based
survey of grocery trucks in Chicago, in Proceedings of 93rd meeting of the Transportation
Research Board, Washington DC.
Toledo T., Sun Y., Rosa K., Ben-Akiva M., Flanagan K., Sanchez R., Spissu E. (2013).
Decision-Making Process and Factors Affecting Truck Routing, in Ben-Akiva M., Meersman
H., van de Voorde E. (eds.), Freight Transport Modelling, Emerald Books, Bingley, UK.
USCB (2004), 2002 Economic Census: Vehicle Inventory and Use Survey, U.S. Census
Bureau, Washington DC.
Wood H.P. (2011), Truck Tolling: Understanding Industry Tradeoffs When Using or Avoiding
Toll Facilities, Final Report NCFRP Project 19 and NCHRP Project 19-09, US Department of
Transportation, Washington DC.
Yang X., Sun Z., Ban X., Wojtowicz J., Holguín-Veras J. (2014). Urban Freight Performance
Evaluation Using GPS Data, in Proceedings of 93rd meeting of the Transportation Research
Board, Washington DC.
Zhao F., Pereira F. C., Ball R., Kim Y., Han Y., Zegras C., and Ben-Akiva M. (2015) Exploratory
analysis of a smartphone-based travel survey in Singapore, in Proceedings of 94th Annual
Meeting of the Transportation Research Board, Washington DC.
Zhou L., Burris M.W., Baker R.T. and Geiselbrecht T. (2009), Impact of Incentives on Toll Road
Use by Trucks, Transportation Research Record 2115, pp. 84-93.


![Untitled-1 [] · CHOCOMILO; Bouillon - MAGGI CUBE, MAGGI CHICKEN, MAGGI CRAYFISH, MAGGI MIX'PY; and table water ... and marketing company](https://img.pdfslide.us/doc/110x75/5aedc9577f8b9a6625906f43/untitled-1-bouillon-maggi-cube-maggi-chicken-maggi-crayfish-maggi-mixpy.jpg)