Embed Size (px)
Citation preview
Page 1 of 12
Freeze Fitting Project – Test Report 12/10/15
Important Note:
The data and conclusions in this test report are for SlideRite Materials ONLY and not applicable to other manufacturers or materials.
1.1 Purpose :
To accumulate and record data regarding the behavior of three grades of SlideRite composite materials: P103, P302 and P314 when subjected to a shrink fit, using LN2,
and installed into a steel housing. All measurements are in inches. The data will be used to:
1.1.1 Calculate the amount and percentage the outside diameter reduces when
immersed in LN2 for a period of 20-25 Minutes.
1.1.2 The amount of press transferred to the inside diameter, calculation the amount
of loss, if any, due to the elasticity of the material.
1.1.3 Determine if the three material grades react differently with respect to 1.1.1 and
1.1.2
1.1.4 Create an operator friendly computer program using the data to determine the
machining dimensions of any size bushing.
1.2 Set-up :
1.2.1 Housings
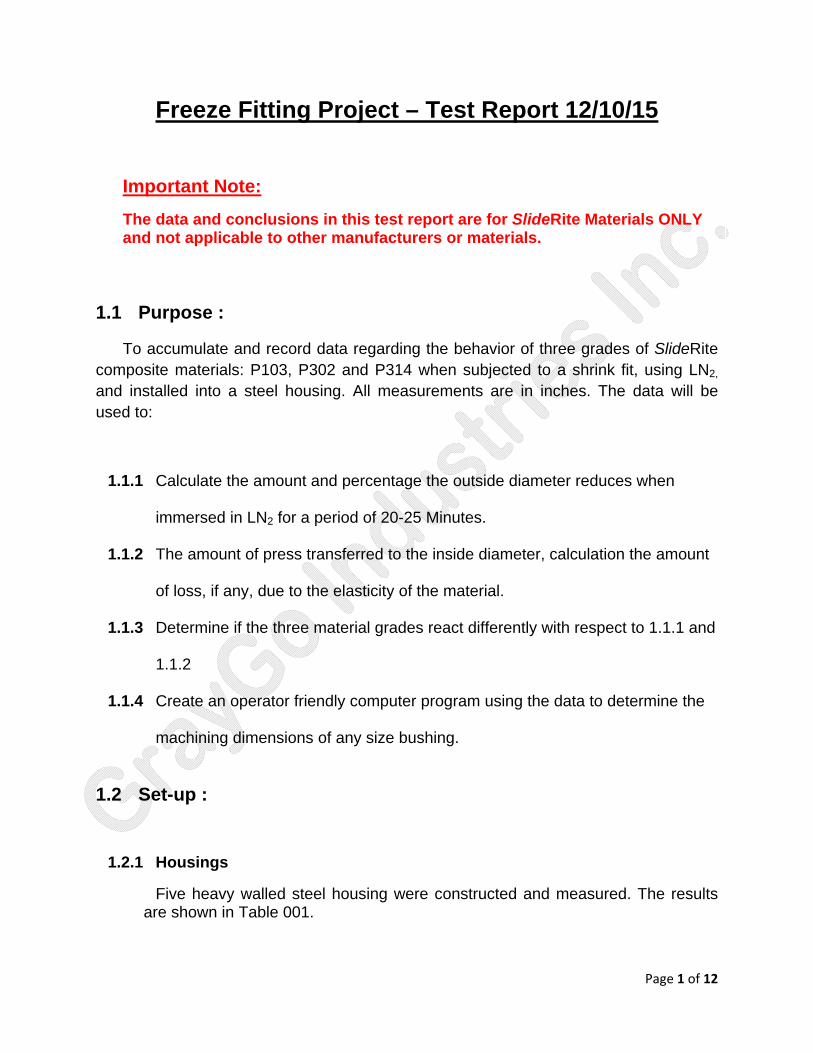
Five heavy walled steel housing were constructed and measured. The results are shown in Table 001.
Page 2 of 12
Table 001
1.2.2 Bushing
Bushing samples were machined using an ID - OD tool. This technique
eliminates the variance in the wall thickness that occurs when using a ‘single
point’ method of machining, and subsequently the need to factor in tolerances
when recording the data. All bushing were machined using a .25% interference
fit. Samples are marked with an index number. Results are recorded in tables
002-004 by material specification.
Table 002 P103
Inside Diameter Outside Diameter Length5.000 6.75 3.50
6.700 8.50 3.50
9.229 12.00 3.50
14.128 16.75 3.50
20.180 22.75 3.50
Index Number Cross Section Outside Diameter1 0.499 5.015
2 0.749 5.015
2 0.995 5.015
4 0.499 6.721
5 0.750 6.720
6 0.995 6.721
7 0.499 9.320
8 0.750 9.320
9 0.994 9.321
10 0.750 14.180
11 0.994 14.181
12 1.225 14.180
13 0.750 20.225
14 0.994 20.226
15 1.224 20.225
Page 3 of 12
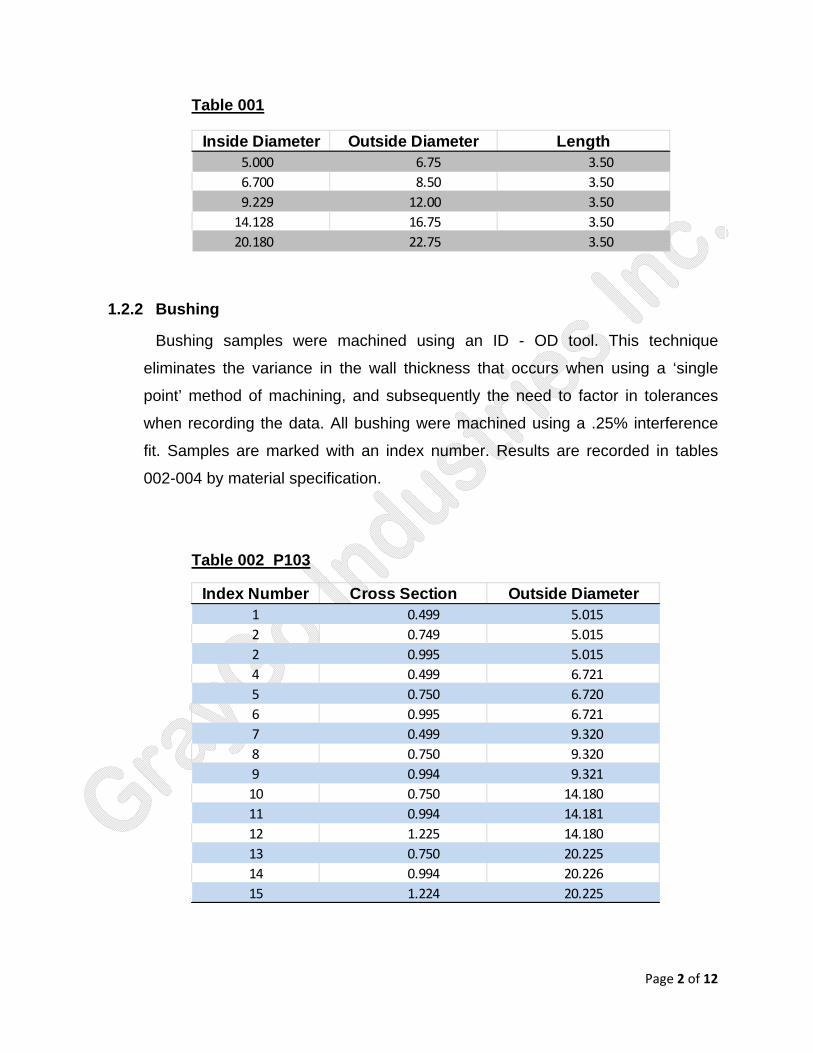
Table 003 P302
Table 004 P314
Index Number Cross Section Outside Diameter1 0.490 5.016
2 0.750 5.014
2 0.795 5.015
4 0.499 6.720
5 0.750 6.721
6 0.995 6.721
7 0.499 9.320
8 0.750 9.320
9 0.994 9.321
10 0.750 14.180
11 0.994 14.180
12 1.250 14.180
13 0.750 20.224
14 0.994 20.225
15 1.250 20.225
Index Number Cross Section Outside Diameter1 0.499 5.015
2 0.750 5.016
2 0.995 5.015
4 0.499 6.721
5 0.750 6.720
6 0.995 6.721
7 0.499 9.319
8 0.750 9.320
9 0.994 9.321
10 0.750 14.180
11 0.994 14.181
12 1.249 14.180
13 0.749 20.225
14 0.994 20.225
15 1.251 20.225
Page 4 of 12
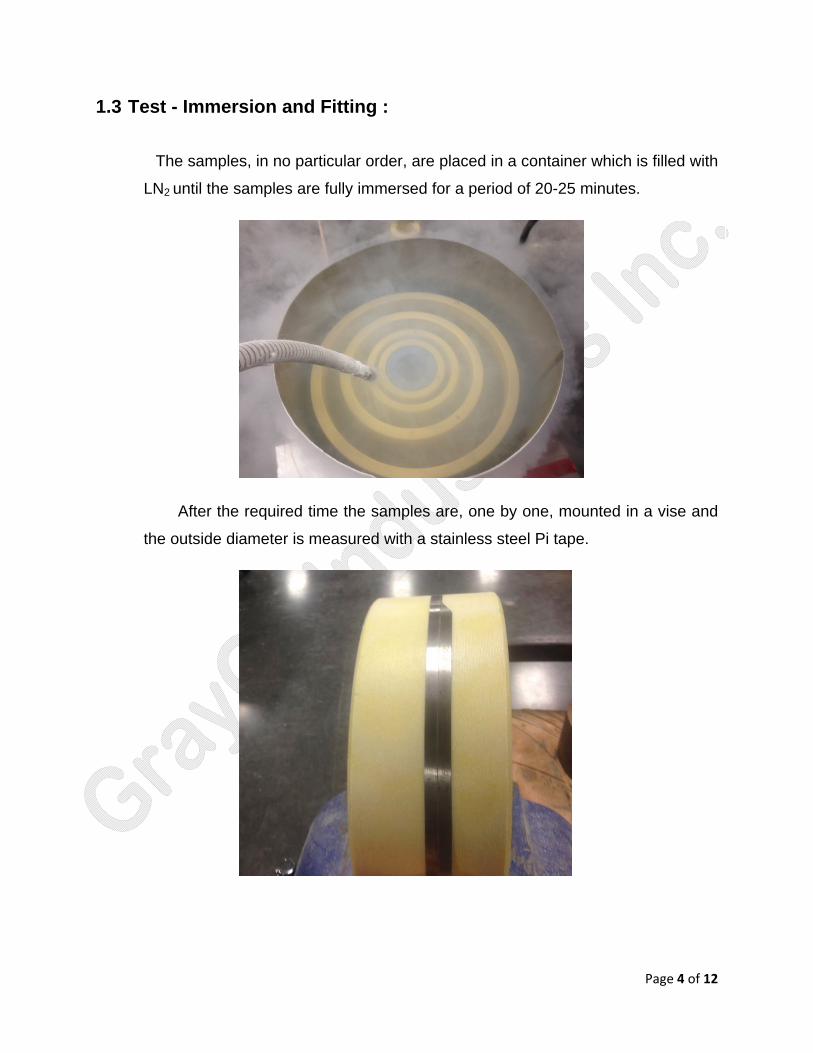
1.3 Test - Immersion and Fitting :
The samples, in no particular order, are placed in a container which is filled with
LN2 until the samples are fully immersed for a period of 20-25 minutes.
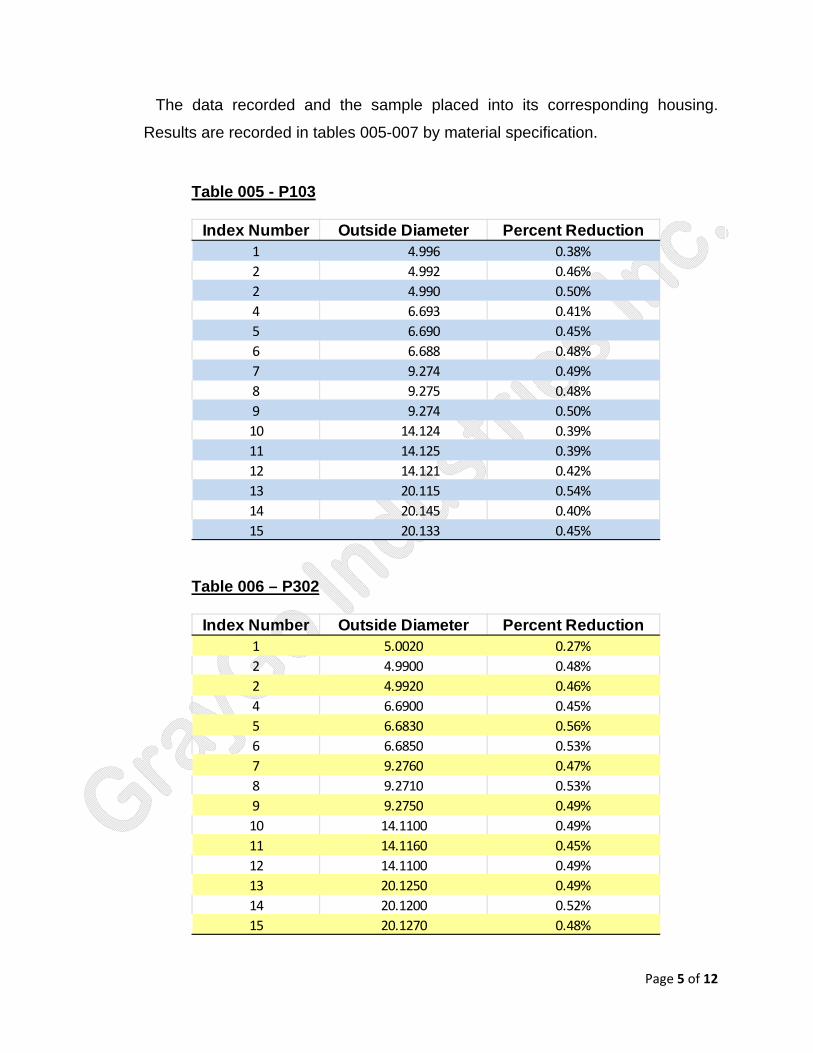
After the required time the samples are, one by one, mounted in a vise and
the outside diameter is measured with a stainless steel Pi tape.
Page 5 of 12
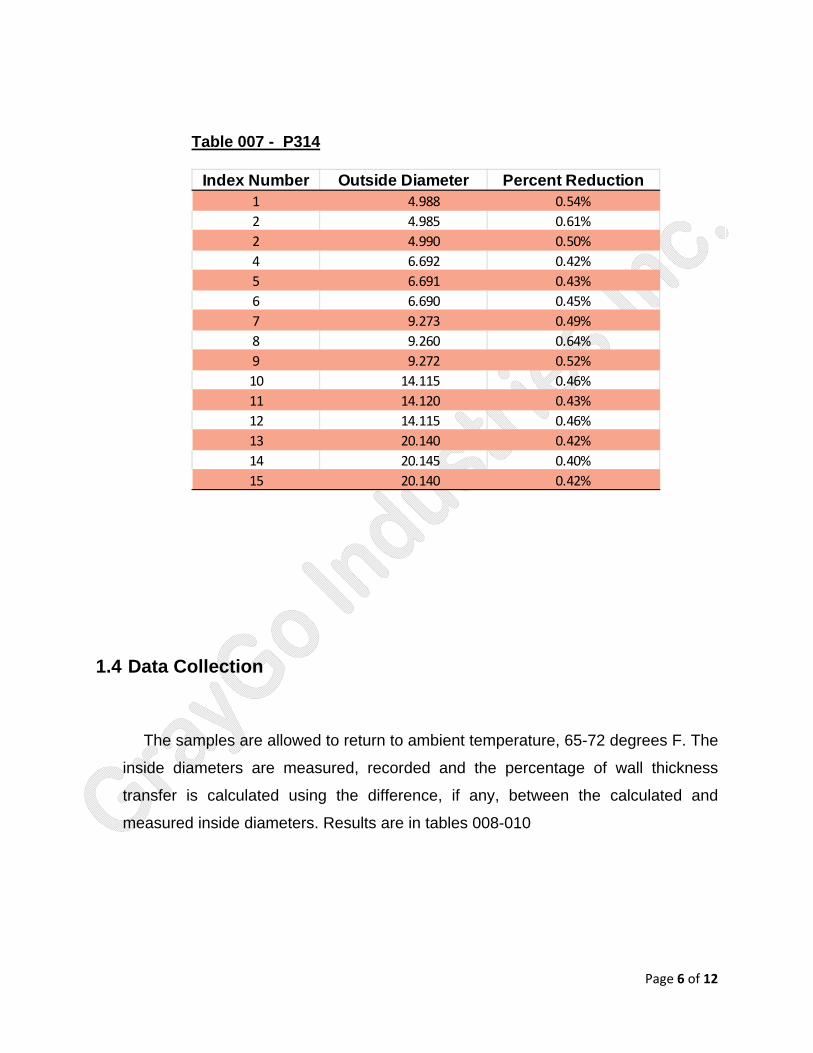
The data recorded and the sample placed into its corresponding housing.
Results are recorded in tables 005-007 by material specification.
Table 005 - P103
Table 006 – P302
Index Number Outside Diameter Percent Reduction1 4.996 0.38%
2 4.992 0.46%
2 4.990 0.50%
4 6.693 0.41%
5 6.690 0.45%
6 6.688 0.48%
7 9.274 0.49%
8 9.275 0.48%
9 9.274 0.50%
10 14.124 0.39%
11 14.125 0.39%
12 14.121 0.42%
13 20.115 0.54%
14 20.145 0.40%
15 20.133 0.45%
Index Number Outside Diameter Percent Reduction1 5.0020 0.27%
2 4.9900 0.48%
2 4.9920 0.46%
4 6.6900 0.45%
5 6.6830 0.56%
6 6.6850 0.53%
7 9.2760 0.47%
8 9.2710 0.53%
9 9.2750 0.49%
10 14.1100 0.49%
11 14.1160 0.45%
12 14.1100 0.49%
13 20.1250 0.49%
14 20.1200 0.52%
15 20.1270 0.48%
Page 6 of 12
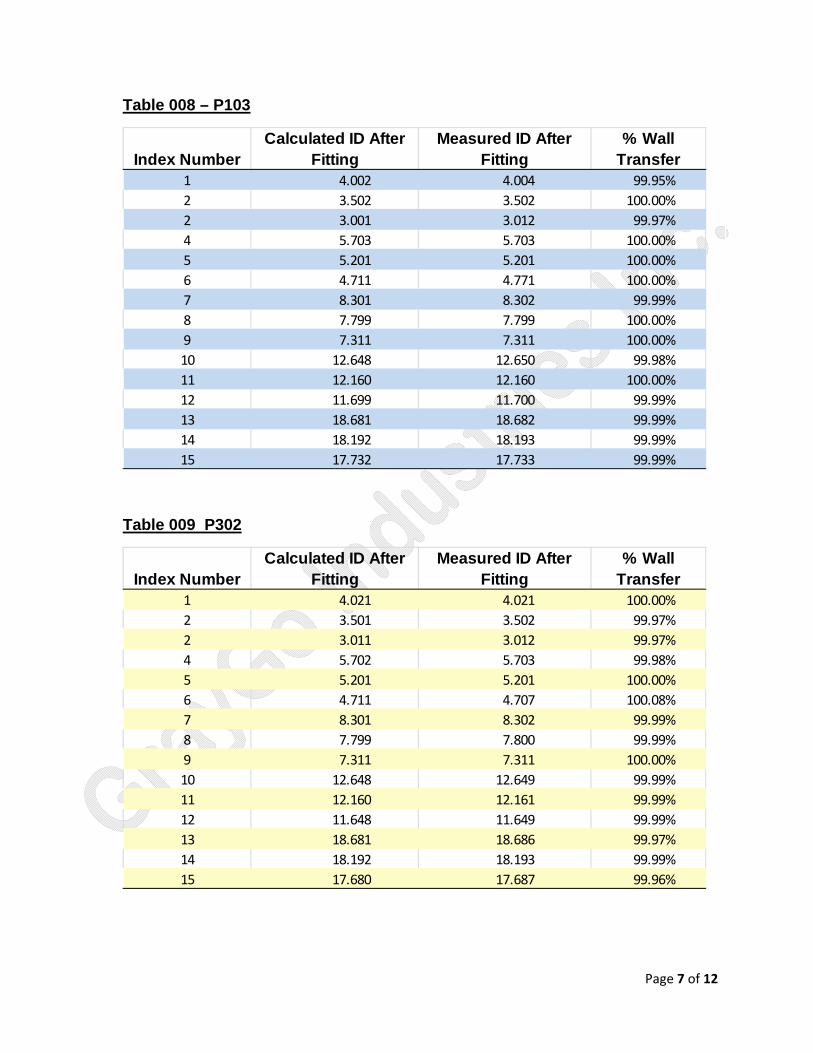
Table 007 - P314
1.4 Data Collection
The samples are allowed to return to ambient temperature, 65-72 degrees F. The
inside diameters are measured, recorded and the percentage of wall thickness
transfer is calculated using the difference, if any, between the calculated and
measured inside diameters. Results are in tables 008-010
Index Number Outside Diameter Percent Reduction1 4.988 0.54%
2 4.985 0.61%
2 4.990 0.50%
4 6.692 0.42%
5 6.691 0.43%
6 6.690 0.45%
7 9.273 0.49%
8 9.260 0.64%
9 9.272 0.52%
10 14.115 0.46%
11 14.120 0.43%
12 14.115 0.46%
13 20.140 0.42%
14 20.145 0.40%
15 20.140 0.42%
Page 7 of 12
Table 008 – P103
Table 009 P302
Index NumberCalculated ID After
FittingMeasured ID After
Fitting% Wall
Transfer1 4.002 4.004 99.95%
2 3.502 3.502 100.00%
2 3.001 3.012 99.97%
4 5.703 5.703 100.00%
5 5.201 5.201 100.00%
6 4.711 4.771 100.00%
7 8.301 8.302 99.99%
8 7.799 7.799 100.00%
9 7.311 7.311 100.00%
10 12.648 12.650 99.98%
11 12.160 12.160 100.00%
12 11.699 11.700 99.99%
13 18.681 18.682 99.99%
14 18.192 18.193 99.99%
15 17.732 17.733 99.99%
Index NumberCalculated ID After
FittingMeasured ID After
Fitting% Wall
Transfer1 4.021 4.021 100.00%
2 3.501 3.502 99.97%
2 3.011 3.012 99.97%
4 5.702 5.703 99.98%
5 5.201 5.201 100.00%
6 4.711 4.707 100.08%
7 8.301 8.302 99.99%
8 7.799 7.800 99.99%
9 7.311 7.311 100.00%
10 12.648 12.649 99.99%
11 12.160 12.161 99.99%
12 11.648 11.649 99.99%
13 18.681 18.686 99.97%
14 18.192 18.193 99.99%
15 17.680 17.687 99.96%
Page 8 of 12
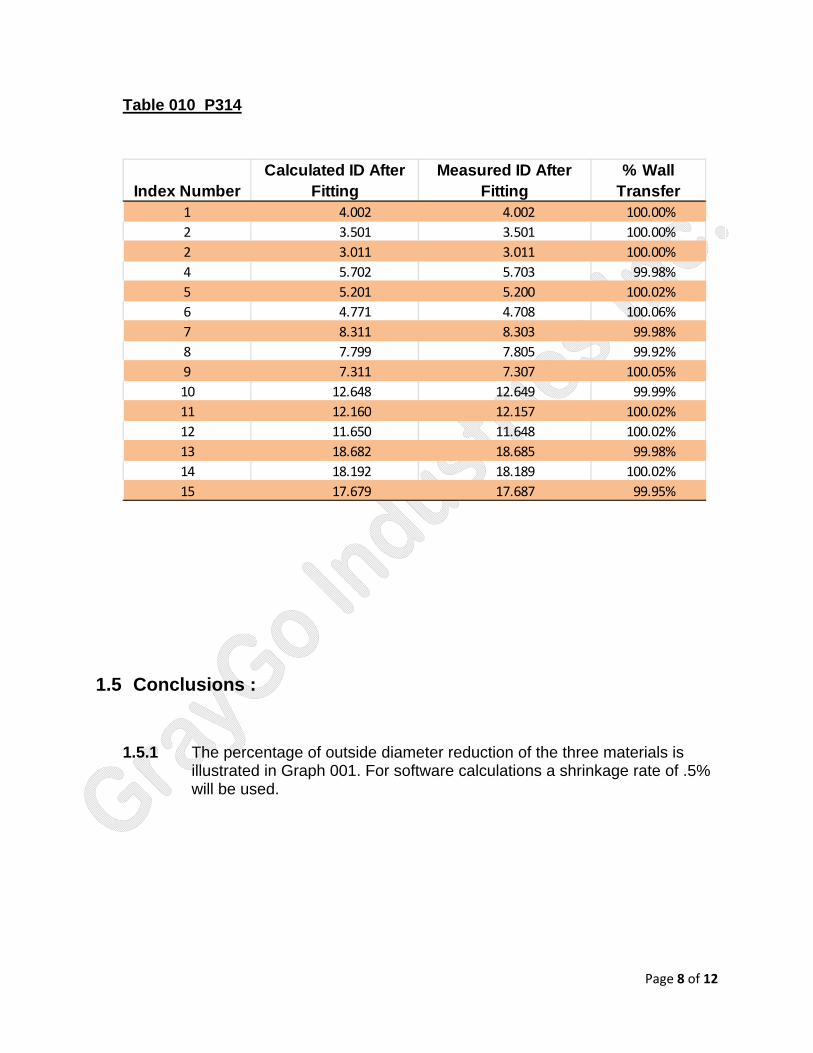
Table 010 P314
1.5 Conclusions :
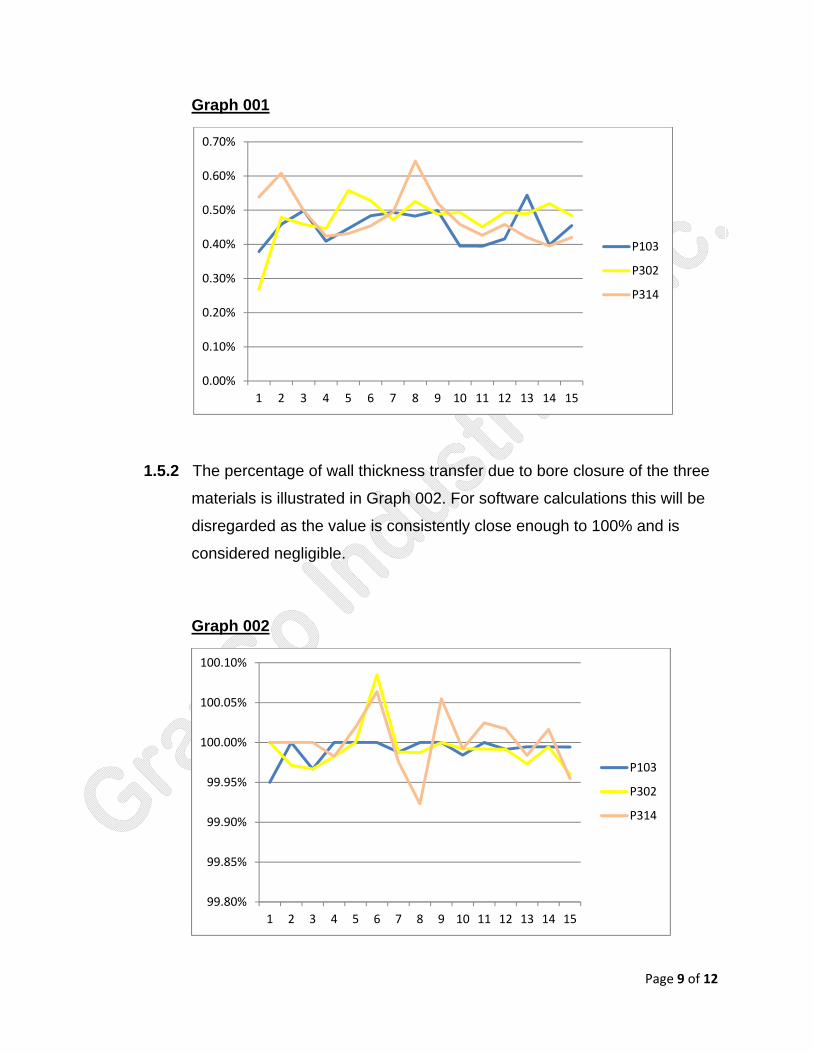
1.5.1 The percentage of outside diameter reduction of the three materials is illustrated in Graph 001. For software calculations a shrinkage rate of .5% will be used.
Index NumberCalculated ID After
FittingMeasured ID After
Fitting% Wall
Transfer1 4.002 4.002 100.00%
2 3.501 3.501 100.00%
2 3.011 3.011 100.00%
4 5.702 5.703 99.98%
5 5.201 5.200 100.02%
6 4.771 4.708 100.06%
7 8.311 8.303 99.98%
8 7.799 7.805 99.92%
9 7.311 7.307 100.05%
10 12.648 12.649 99.99%
11 12.160 12.157 100.02%
12 11.650 11.648 100.02%
13 18.682 18.685 99.98%
14 18.192 18.189 100.02%
15 17.679 17.687 99.95%
Page 9 of 12
Graph 001
1.5.2 The percentage of wall thickness transfer due to bore closure of the three
materials is illustrated in Graph 002. For software calculations this will be
disregarded as the value is consistently close enough to 100% and is
considered negligible.
Graph 002
0.00%
0.10%
0.20%
0.30%
0.40%
0.50%
0.60%
0.70%
1 2 3 4 5 6 7 8 9 10 11 12 13 14 15
P103
P302
P314
99.80%
99.85%
99.90%
99.95%
100.00%
100.05%
100.10%
1 2 3 4 5 6 7 8 9 10 11 12 13 14 15
P103
P302
P314
Page 10 of 12
1.5.3 The materials do not react differently and is a non-factor in bushing design
dimensions with respect to freeze fitting techniques.
1.5.4 Software calculations are as follows:
Bushing interference fit = Outside Diameter * .25%
Bushing Shrink in LN2 = Outside Diameter * .50%
1.6 Addendum:
Three additional questions arose during the testing:
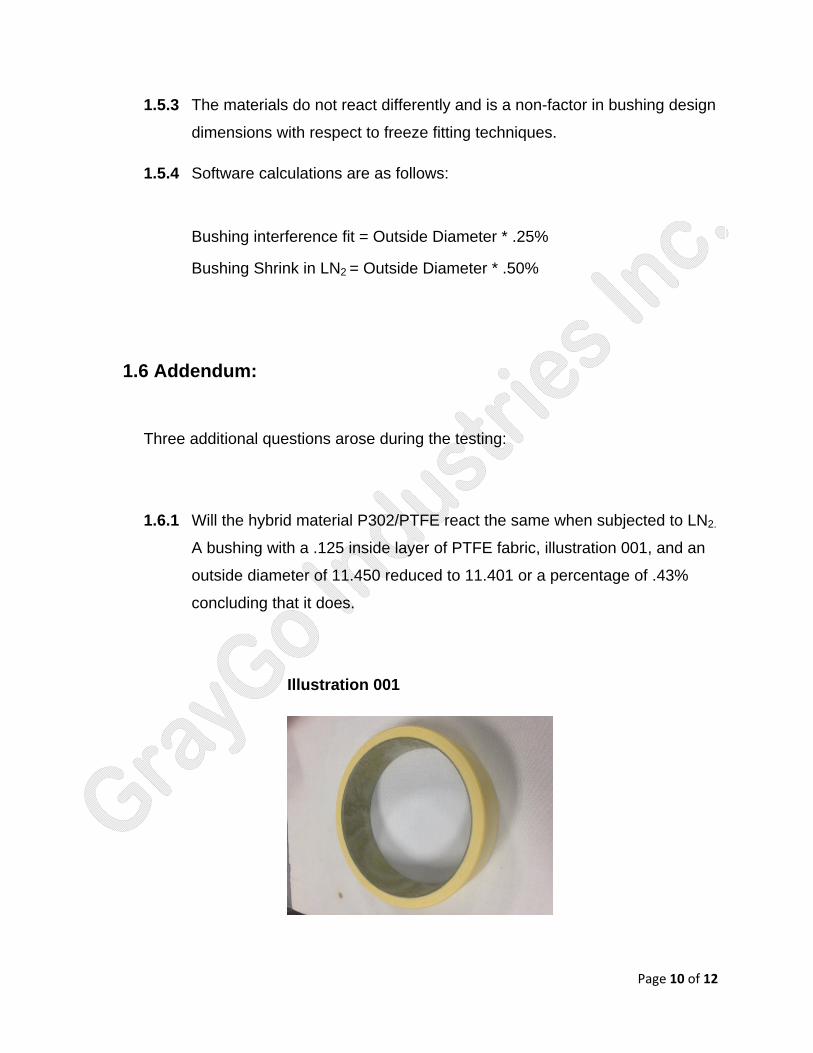
1.6.1 Will the hybrid material P302/PTFE react the same when subjected to LN2.
A bushing with a .125 inside layer of PTFE fabric, illustration 001, and an
outside diameter of 11.450 reduced to 11.401 or a percentage of .43%
concluding that it does.
Illustration 001
Page 11 of 12
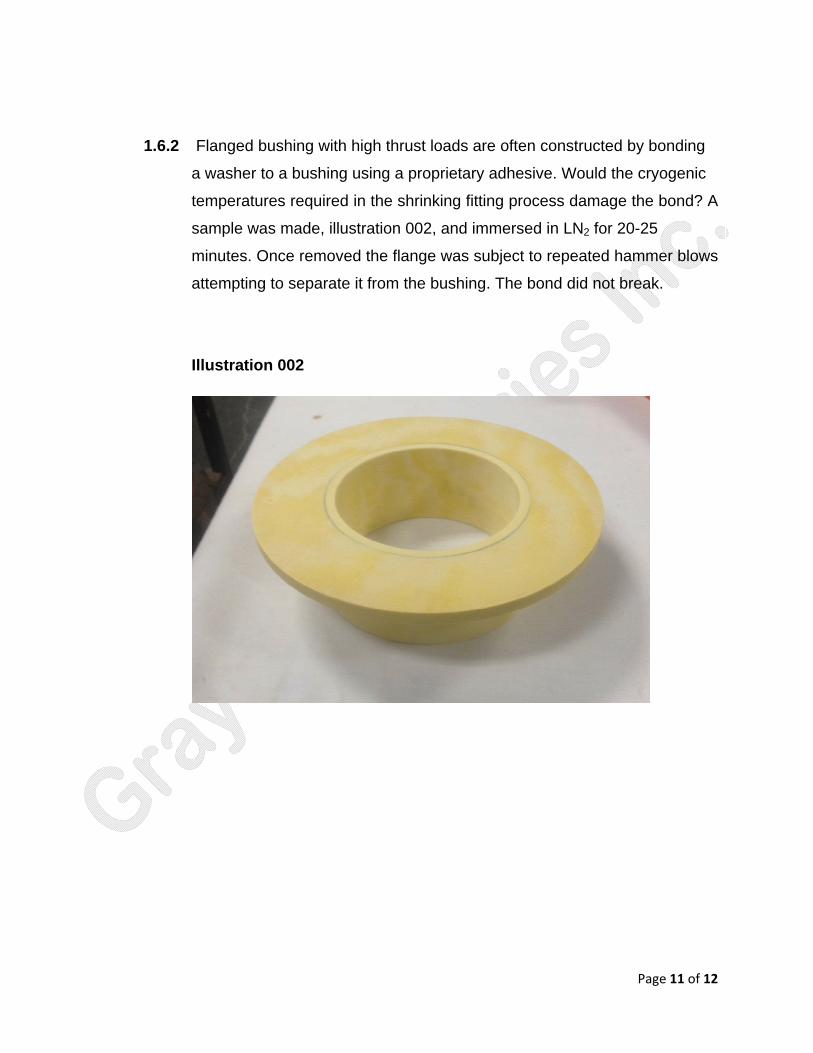
1.6.2 Flanged bushing with high thrust loads are often constructed by bonding
a washer to a bushing using a proprietary adhesive. Would the cryogenic
temperatures required in the shrinking fitting process damage the bond? A
sample was made, illustration 002, and immersed in LN2 for 20-25
minutes. Once removed the flange was subject to repeated hammer blows
attempting to separate it from the bushing. The bond did not break.
Illustration 002
Page 12 of 12
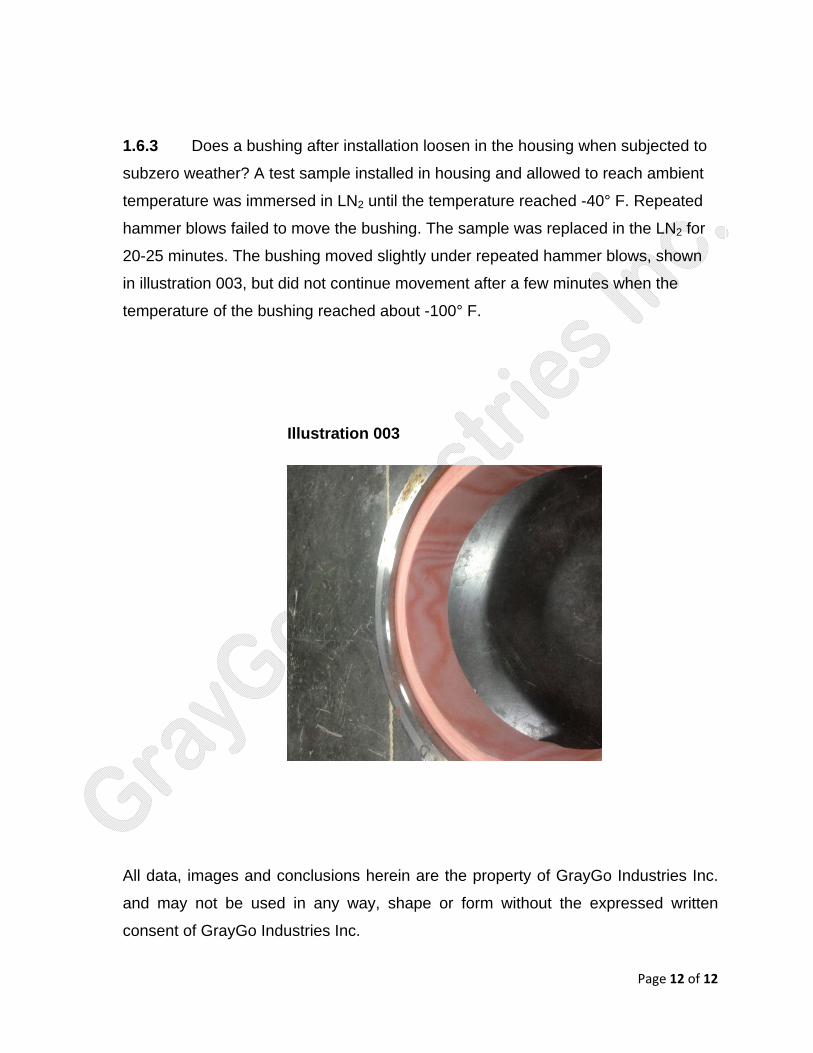
1.6.3 Does a bushing after installation loosen in the housing when subjected to
subzero weather? A test sample installed in housing and allowed to reach ambient
temperature was immersed in LN2 until the temperature reached -40° F. Repeated
hammer blows failed to move the bushing. The sample was replaced in the LN2 for
20-25 minutes. The bushing moved slightly under repeated hammer blows, shown
in illustration 003, but did not continue movement after a few minutes when the
temperature of the bushing reached about -100° F.
Illustration 003
All data, images and conclusions herein are the property of GrayGo Industries Inc.
and may not be used in any way, shape or form without the expressed written
consent of GrayGo Industries Inc.