Embed Size (px)
Citation preview
Freeform User Interfaces
for Graphical Computing
Takeo Igarashi
A doctoral dissertation
Graduate School of Information Engineering
The University of Tokyo
December 1999

ii
Copyright © 1999Takeo Igarashi
All Rights Reserved

iii
Abstract
It is difficult to communicate graphical ideas or images to computers using current
WIMP-style GUI. Users have to decompose the graphics desired in their minds into
simple elements such as points, lines, or boxes, and manipulate those elements using
click-and-drag operations. On the other hand, people have long used simple drawings
based on freeform strokes to express arbitrary visual messages quickly. Freeform User
Interfaces is an interface design framework that leverages the power of freeform strokes
to achieve fluent interaction between users and computers in performing graphical
tasks.
In Freeform UI, users express their graphical ideas as freeform strokes using pen-based
systems, and the computer takes appropriate actions based on the perceptual features
of the strokes. The results of processing are displayed in an informal manner to
facilitate exploratory thinking. Freeform UI is different from typical pen-based systems
in that it analyzes the perceptual structure of the drawings instead of applying simple
pattern-matching. This dissertation explores the concept of Freeform UI and shows its
possibilities with the following four example systems.
Beautification and prediction for 2D geometric drawing allow the user to construct
precise illustrations without using complicated editing commands.
Path-drawing technique for virtual space navigation enables the user to explore 3D
virtual space efficiently even when the rendering speed is slow.
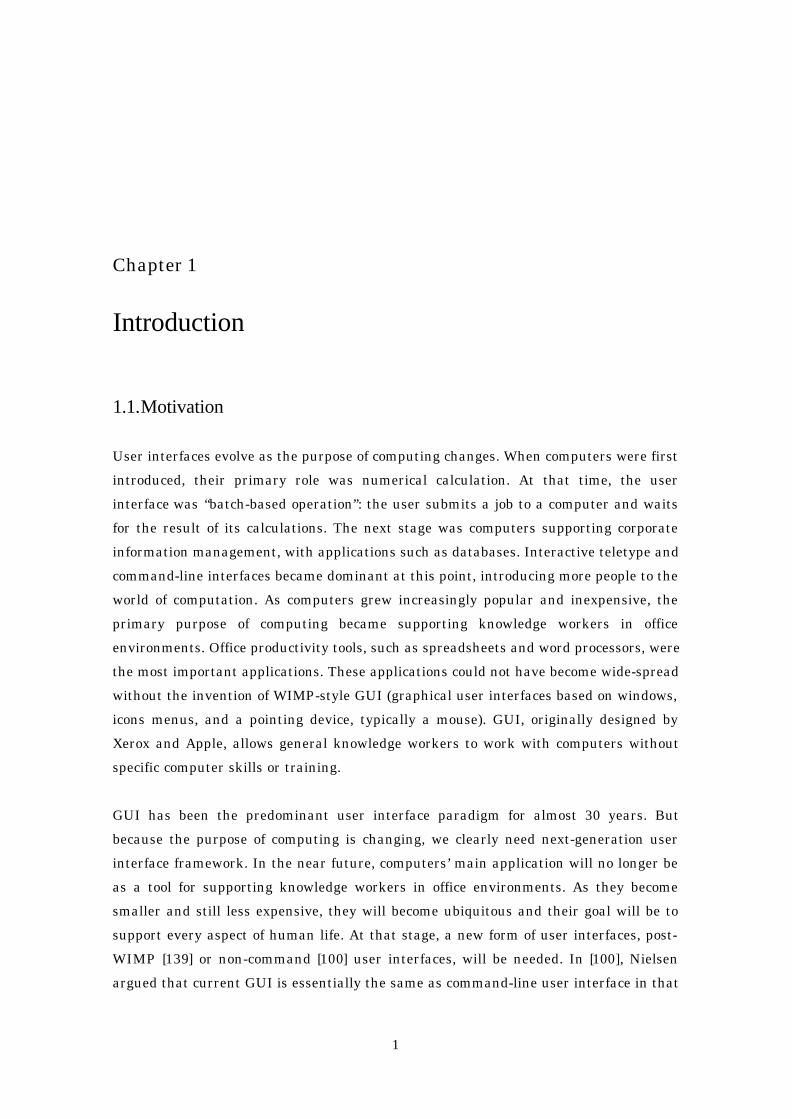
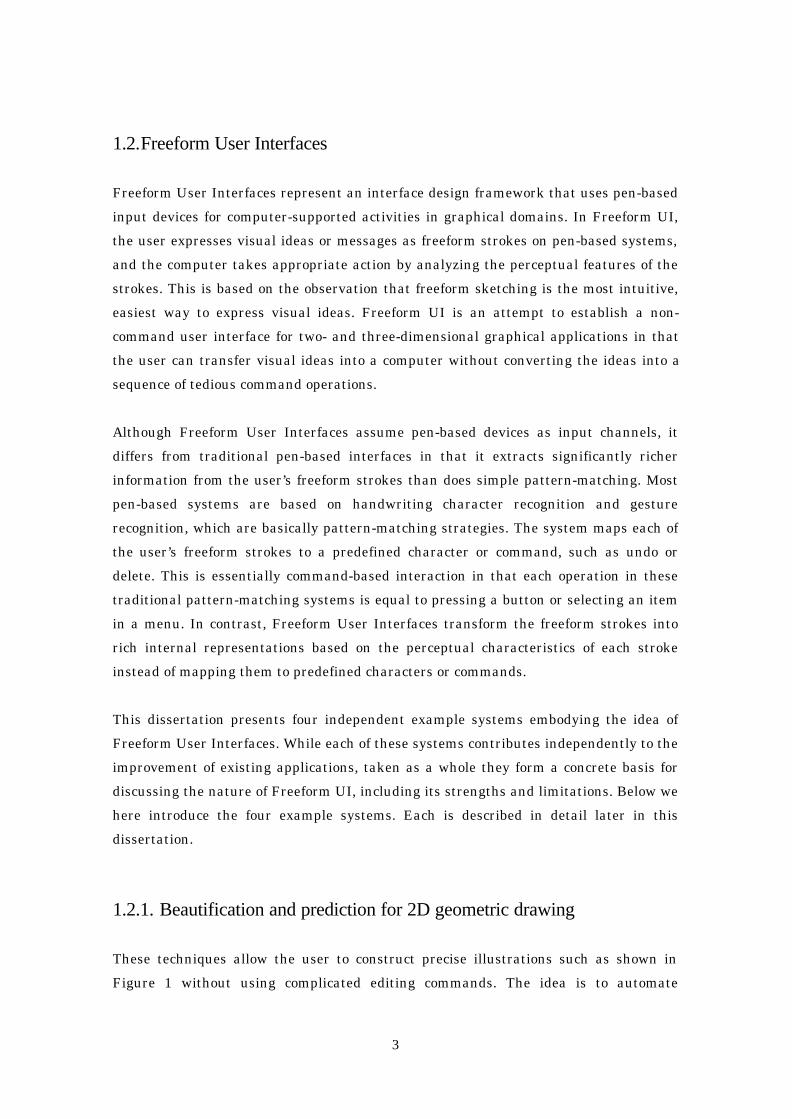
Stroke-based architecture for electronic whiteboards provides a basic framework for
building task-specific applications using freeform strokes as the only input.
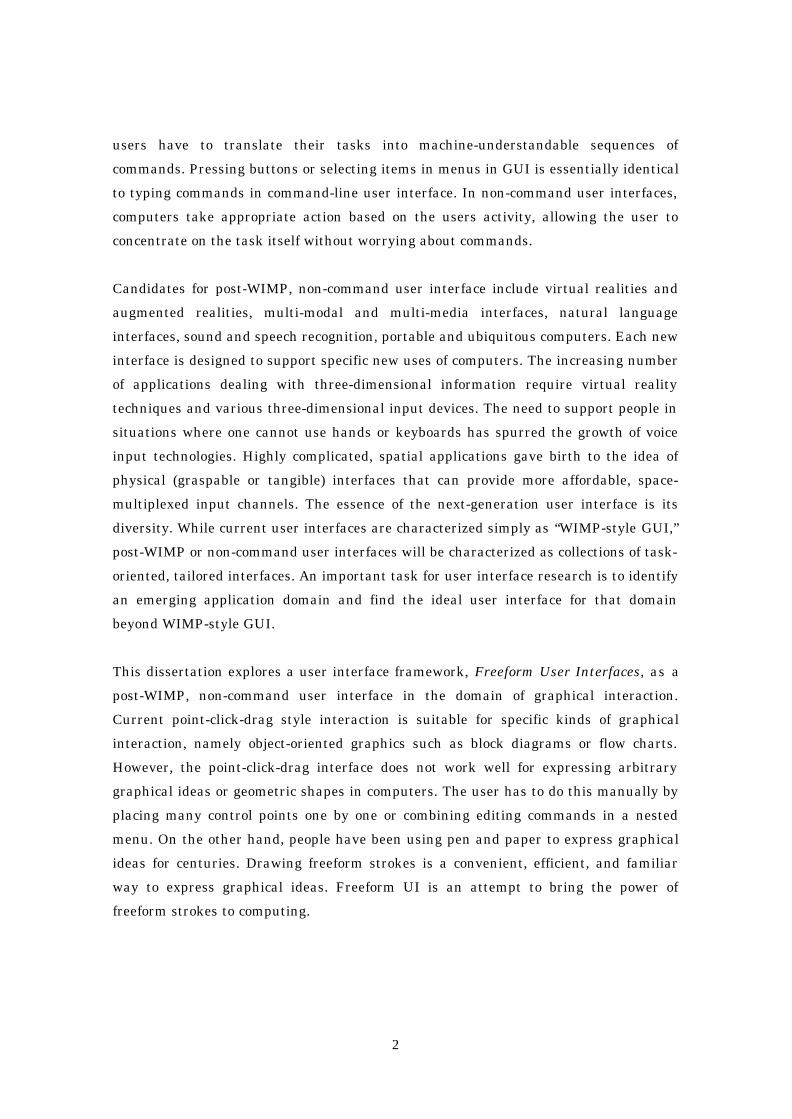
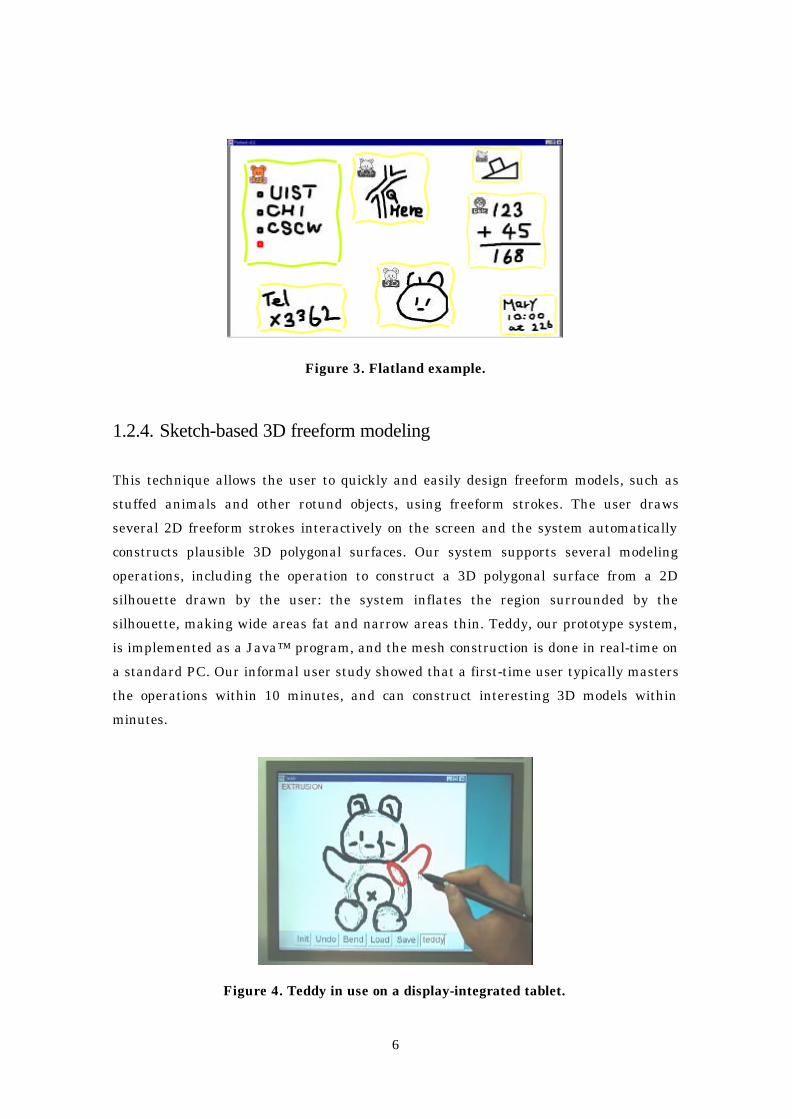
Sketch-based 3D freeform modeling allows the user to create natural-looking rotund 3D
models quickly just by drawing 2D outlines.
Independently, each of these systems contributes to the improvement of existing
applications. But taken together, they form a concrete basis for discussing the nature of
Freeform UI and clarifying its limitations and possibilities. While Freeform UI is not
suitable for precise, production-oriented applications because of its ambiguity and
imprecision, it does provide a natural, highly interactive computing environment for
pre-productive, exploratory activities in various graphical applications.

iv
Acknowledgements
The entire body of work presented in this dissertation is the result of collaboration with
many people at various institutes. It is impossible to list all the names in this limited
space, but I would like to express my gratitude to all those who have supported me
during the six years of research that went into this project. I was truely fortunate to
have so many kind, ingenious mentors and friends across the countries.
I am deeply grateful to Prof. Hidehiko Tanaka, thesis supervisor, who led me to the
right direction with thoughtful advice. I would like to thank Prof. Satoshi Matsuoka for
continuous encouragement and invaluable suggestions throughout the study. I thank
Prof. Shuichi Sakai for his kindest help and encouragement. I would also like to thank
my committee members, Hidehiko Tanaka, Hirochika Inoue, Masato Takeichi, Mitsuru
Ishizuka, Toyoaki Nishida, and Shuichi Sakai, for their insightful comments on this
dissertation.
Special thanks to Sachiko Kawachiya, co-researcher in the early work on interactive
beautification. My interest in pen computing came partly form her early works on pen-
based interaction techniques.
I first tested the path drawing technique at NTT basic research laboratory under the
supervision of Yasunori Harada and Rikio Onai. Then, I refined the idea and evaluated
it at ATR media integrated communications laboratory under the supervision of Rieko
Kadobayashi and Kenji Mase. I would like to thank them for their supervision, as well
as others at these research laboratories for their kindest support and help. I also thank
those who kindly helped me by serving as subjects of the user studies at ATR.
From my work on the Flatland system at Xerox PARC as a summer intern, I would like
to thank Elizabeth Mynatt, Keith Edwards, and Anthony LaMarca who invited me to
join this wonderful project. I also thank all the others at Xerox PARC for supporting me
during my internship there duing two summers. Especially, I would like to thank Jock
Mackinlay, Polle Zellweger, and Bay-Wei Chang, Tom Moran, Ed Chi, Kimiko Nishina,
and Lorna Fear. In addition, I thank Marshall Bern for invaluable suggestions for the
Teddy implementation.

v
I thank Stage3 research group at Carnegie Mellon University, Randy Pausch, Jeffrey
Pierce, Dennis Cosgrove, and other students, for their general support for Teddy. It was
a great experience to work with these enjoyable people.
I thank the graphics group at Brown University, including Robert Zeleznik, Lee
Markosian, and John Hughes. Teddy was inspired by Zeleznik’s SKETCH system and
Markosian’s amazing demo of real-time NPR and SKIN. Prof. Hughes encouraged me to
work on Pegasus and Teddy, and helped our SIGGRAPH paper writing. I thank other
individuals who helped me for writing our SIGGRAPH paper, Hiromasa Suzuki, Joe
Marks, Jock Mackinlay, Andrew Glassner, and Brygg Ullmer. They kindly offered in-
house reviewing and gave us invaluable feedback.
I thank past and present members of the TRIP group, especially Shin Takahashi,
Hiroshi Hosobe, Yuji Ayatsuka, Buntarou Shizuki, Masashi Toyoda, Hironobu Takagi,
and Mahoro Anabuki for many productive suggestions and discussions throughout my
student life. Attending various conferences with these friends was an unforgettable
experience. I also thank Toshiyuki Masui and Jun Rekimoto at Sony CSL for various
insightful discussions.
I would like to express my gratitude to past and present members of Tanaka Sakai
laboratory for help in developing systems and in daily life. I especially thank Takao
Mohri, Kenji Nagamatsu, Tomoyuki Uchida, Tomoyuki Shiraishi, Ichiro Ide, and
Tomoyoshi Kinoshita for their kindest support.
Finally, I would like to thank my parents, Toshio and Hiroko Igarashi, for their endless
encouragement and support.
vi
Table of Contents
1. INTRODUCTION .. . . . . . . . . . . . . . . . . . . . . . . . . . . . . . . . . . . . . . . . . . . . . . . . . . . . . . . . . . . . . . . . . . . . . . . . . . . . . . . . . . . . 1
1.1. MOTIVATION...........................................................................................................1
1.2. FREEFORM USER INTERFACES.................................................................................3
1.2.1. Beautification and prediction for 2D geometric drawing .................................3
1.2.2. Path-drawing technique for virtual space navigation ......................................4
1.2.3. Stroke-based architecture for electronic whiteboards......................................5
1.2.4. Sketch-based 3D freeform modeling................................................................6
1.3. CONTRIBUTIONS .....................................................................................................8
1.4. ORGANIZATION.......................................................................................................8
2. BACKGROUND .. . . . . . . . . . . . . . . . . . . . . . . . . . . . . . . . . . . . . . . . . . . . . . . . . . . . . . . . . . . . . . . . . . . . . . . . . . . . . . . . . . . . 10
2.1. NON-COMMAND USER INTERFACES........................................................................10
2.1.1. 3D Interface and Virtual Reality................................................................... 11
2.1.2. Augmented Reality.......................................................................................12
2.1.3. Multimodal Input .........................................................................................13
2.1.4. Ubiquitous Computing .................................................................................14
2.1.5. Summary .....................................................................................................14
2.2. PEN-BASED COMPUTING .......................................................................................15
2.2.1. Pen-based Input Devices ..............................................................................15
2.2.2. Handwriting Character Recognition .............................................................17
2.2.3. Fast Text Input Methods ..............................................................................17
2.2.4. Gesture and Shape Recognition ....................................................................19
2.2.5. Handheld Devices.........................................................................................20
2.2.6. Electronic Whiteboards ................................................................................21
2.2.7. Sketch-based Systems for Exploratory Thinking...........................................22
2.2.8. Drawing Applications...................................................................................23
2.2.9. Summary .....................................................................................................25
3. FREEFORM USER INTERFACES.. . . . . . . . . . . . . . . . . . . . . . . . . . . . . . . . . . . . . . . . . . . . . . . . . . . . . . . . . . . . . . 28
3.1. PROBLEMS AND RESEARCH GOALS.........................................................................28
3.2. FREEFORM USER INTERFACES...............................................................................30
3.2.1. Stroke-based Input.......................................................................................30
3.2.2. Perceptual Processing...................................................................................32
3.2.3. Informal Presentation ..................................................................................34

vii
3.3. TARGET DOMAIN ..................................................................................................35
3.4. APPROACH ...........................................................................................................37
4. BEAUTIFICATION AND PREDICTION FOR 2D GEOMETRIC DRAWING .. . . . . . . . . . . 39
4.1. INTRODUCTION.....................................................................................................39
4.2. RELATED WORK ...................................................................................................41
4.3. INTERACTIVE BEAUTIFICATION..............................................................................43
4.3.1. User Interface ..............................................................................................43
4.3.2. Algorithm.....................................................................................................50
4.3.3. Evaluation....................................................................................................56
4.4. PREDICTIVE DRAWING ..........................................................................................61
4.4.1. User Interface ..............................................................................................62
4.4.2. Algorithm.....................................................................................................63
4.5. PROTOTYPE SYSTEM PEGASUS...............................................................................66
4.6. LIMITATIONS AND FUTURE WORK ..........................................................................68
4.7. CONCLUSION........................................................................................................69
5. PATH-DRAWING FOR VIRTUAL SPACE NAVIGATION .. . . . . . . . . . . . . . . . . . . . . . . . . . . . . . . . . . 70
5.1. INTRODUCTION.....................................................................................................70
5.2. PATH DRAWING FOR 3D WALKTHROUGH .................................................................71
5.3. EVALUATION ........................................................................................................72
5.3.1. Task .............................................................................................................72
5.3.2. Result...........................................................................................................74
5.3.3. Summary .....................................................................................................75
5.4. DISCUSSION.........................................................................................................76
5.5. CONCLUSIONS AND FUTURE WORK .........................................................................76
6. STROKE-BASED ARCHITECTURE FOR ELECTRONIC WHITEBOARDS .. . . . . . . . . . . . 77
6.1. INTRODUCTION.....................................................................................................77
6.2. RELATED WORK ...................................................................................................80
6.3. FLATLAND USER INTERFACES................................................................................81
6.3.1. Inking and Segmenting ................................................................................81
6.3.2. Application Behaviors ..................................................................................82
6.3.3. History Management and Context-based Search ..........................................85
6.4. FLATLAND ARCHITECTURE OVERVIEW ...................................................................85
6.5. STROKES AS UNIVERSAL INPUT AND OUTPUT..........................................................87
6.5.1. Processing an Input Stroke...........................................................................87

viii
6.5.2. Strokes as Universal Output ........................................................................88
6.6. DYNAMIC SEGMENTATION .....................................................................................89
6.6.1. Distribution of an Input Stroke....................................................................90
6.6.2. Moving a Segment........................................................................................90
6.6.3. Pushing and Squashing a Segment...............................................................90
6.6.4. Merging and Splitting Segments ..................................................................90
6.7. PLUGGABLE BEHAVIORS........................................................................................91
6.7.1. Event Processing ..........................................................................................91
6.7.2. Embedded Behaviors....................................................................................92
6.7.3. Application Behaviors ..................................................................................92
6.7.4. Reapplication of Application Behaviors.........................................................95
6.8. HISTORY MANAGEMENT........................................................................................96
6.8.1. Undo/Redo Model .........................................................................................97
6.8.2. Supporting Undo/Redo with Extensible Behaviors........................................98
6.8.3. A Transaction Model for State Changes ........................................................99
6.8.4. Local versus Global Timeline Management................................................. 100
6.8.5. Persistence................................................................................................. 100
6.8.6. Search ........................................................................................................ 101
6.9. IMPLEMENTATION NOTES.................................................................................... 102
6.10. SUMMARY AND FUTURE WORK ......................................................................... 102
7. SKETCH-BASED 3D FREEFORM MODELING .. . . . . . . . . . . . . . . . . . . . . . . . . . . . . . . . . . . . . . . . . . . . 104
7.1. INTRODUCTION................................................................................................... 104
7.2. RELATED WORK ................................................................................................. 106
7.3. USER INTERFACE................................................................................................ 107
7.4. MODELING OPERATIONS ..................................................................................... 108
7.4.1. Overview.................................................................................................... 108
7.4.2. Creating a New Object................................................................................ 110
7.4.3. Painting and Erasing on the Surface.......................................................... 111
7.4.4. Extrusion ................................................................................................... 111
7.4.5. Cutting....................................................................................................... 112
7.4.6. Smoothing .................................................................................................. 113
7.4.7. Transformation........................................................................................... 114
7.5. ALGORITHM ....................................................................................................... 115
7.5.1. Creating a New Object................................................................................ 116
7.5.2. Painting on the Surface.............................................................................. 118
7.5.3. Extrusion ................................................................................................... 119
ix
7.5.4. Cutting....................................................................................................... 121
7.5.5. Smoothing .................................................................................................. 121
7.6. IMPLEMENTATION............................................................................................... 122
7.7. USER EXPERIENCE ............................................................................................. 123
7.8. FUTURE WORK ................................................................................................... 123
7.9. SUMMARY .......................................................................................................... 124
8. FREEFORM USER INTERFACES REVISITED .. . . . . . . . . . . . . . . . . . . . . . . . . . . . . . . . . . . . . . . . . . . . 125
8.1. ANALYZING FREEFORM USER INTERFACE SYSTEMS............................................... 125
8.2. LIMITATIONS ...................................................................................................... 127
8.3. GUIDELINES TO MITIGATE THE LIMITATIONS ........................................................ 128
8.4. SUMMARY .......................................................................................................... 130
9. CONCLUSION .. . . . . . . . . . . . . . . . . . . . . . . . . . . . . . . . . . . . . . . . . . . . . . . . . . . . . . . . . . . . . . . . . . . . . . . . . . . . . . . . . . . . . 131
9.1. SUMMARY .......................................................................................................... 131
9.2. FUTURE DIRECTIONS.......................................................................................... 133
9.3. CONCLUDING REMARKS...................................................................................... 135
BIBLIOGRAPHY.. . . . . . . . . . . . . . . . . . . . . . . . . . . . . . . . . . . . . . . . . . . . . . . . . . . . . . . . . . . . . . . . . . . . . . . . . . . . . . . . . . . . . 136

x
List of Figures
Figure 1. A diagram drawn using interactive beautification and predictive
drawing............................................................................................................... 4
Figure 2. An example of a path-drawing walkthrough............................................. 5
Figure 3. Flatland example. ...................................................................................... 6
Figure 4. Teddy in use on a display-integrated tablet............................................... 6
Figure 5. Examples of pen-based devices. ............................................................... 16
Figure 6. Unistroke [47]. ......................................................................................... 18
Figure 7. Cirring [79] and QuickWriting [106]. ...................................................... 19
Figure 8. POBox [84]. .............................................................................................. 19
Figure 9. PerSketch [127]........................................................................................ 24
Figure 10. The SKETCH system [161].................................................................... 25
Figure 11. A simple drawing communicates many ideas. ....................................... 26
Figure 12. Stroking vs. dragging............................................................................. 31
Figure 13. A diagram drawn on the prototype system Pegasus. ............................. 40
Figure 14. Basic operation of interactive beautification ......................................... 44
Figure 15. Supported geometric relations............................................................... 45
Figure 16. Example use of interval equality among segments ............................... 46
Figure 17. Construction of a diagram with many constraints ................................ 47
Figure 18. Construction of a symmetric diagram.................................................... 47
Figure 19. Interaction with multiple candidates..................................................... 49
Figure 20. Trimming operation ............................................................................... 50
Figure 21. Operational model of interactive beautification .................................... 51
Figure 22. Structure of the beautification routine .................................................. 52
Figure 23. Relation between geometric relations and equalities............................ 53
Figure 24. Algorithm for constraint solving ............................................................ 55
Figure 25. The diagrams used in the experiment, and required geometric relations
.......................................................................................................................... 57
Figure 26. Drawing time required for each task. .................................................... 58
Figure 27. The ratio of finished sessions. ................................................................ 59
Figure 28. Estimation for time required for a subject to draw the three diagrams.
.......................................................................................................................... 60
Figure 29. The ratio of diagrams where required constraints are perfectly satisfied.
.......................................................................................................................... 61
Figure 30. Predictive drawing: the user’s view. ...................................................... 62
xi
Figure 31. Starting prediction by clicking an existing segment. ............................ 63
Figure 32. The algorithm of predictive drawing. .................................................... 64
Figure 33. Extension to the basic prediction........................................................... 65
Figure 34. Prediction based on self reference.......................................................... 65
Figure 35. Construction of various diagram using prediction. ............................... 66
Figure 36. Diagrams for Physics and Mathematics. ............................................... 67
Figure 37. 3D Illustrations. ..................................................................................... 67
Figure 38. Geometric Illustrations. ......................................................................... 68
Figure 39. An example of path drawing walkthrough ............................................ 71
Figure 40. The world map used in the experiment................................................. 72
Figure 41. An example of subject’s view in the experiment.................................... 73
Figure 42. Averaged time to get to the goal............................................................. 74
Figure 43. Subjective evaluations. .......................................................................... 75
Figure 44. Flatland example ................................................................................... 78
Figure 45. Segmenting ............................................................................................ 82
Figure 46. Moving and squashing........................................................................... 82
Figure 47. To Do behavior ....................................................................................... 83
Figure 48. Map Drawing behavior .......................................................................... 83
Figure 49. 2D Geometric Drawing behavior ........................................................... 83
Figure 50. 3D Drawing behavior............................................................................. 84
Figure 51. Calculation behavior.............................................................................. 84
Figure 52. Overview of the Flatland architecture................................................... 85
Figure 53. Input stroke processing.......................................................................... 88
Figure 54. Behavior specific internal structures. .................................................... 93
Figure 55. Re-application of a To Do behavior. ....................................................... 95
Figure 56. Re-application of a Map behavior. ......................................................... 96
Figure 57. An example of transaction...................................................................... 99
Figure 58. Local versus Global Timeline............................................................... 100
Figure 59. Teddy in use on a display-integrated tablet......................................... 105
Figure 60. Painted models created using Teddy and painted using a commercial
texture-map editor. ......................................................................................... 106
Figure 61. Overview of the modeling operations................................................... 109
Figure 62. Summary of the gestural operations.....................................................110
Figure 63. Examples of creation operation.............................................................111
Figure 64. Examples of extrusion...........................................................................112
Figure 65. More extrusion operations. ...................................................................112

xii
Figure 66. Cutting operation..................................................................................113
Figure 67. Extrusion after cutting. ........................................................................113
Figure 68. Smoothing operation.............................................................................114
Figure 69. Examples of transformation..................................................................115
Figure 70. Internal representation.........................................................................115
Figure 71. Finding the spine. .................................................................................116
Figure 72. Pruning. ................................................................................................117
Figure 73. Polygonal mesh construction. ...............................................................118
Figure 74. Construction of surface lines.................................................................119
Figure 75. Extrusion algorithm............................................................................. 120
Figure 76. Sweeping the base ring........................................................................ 120
Figure 77. Unintuitive extrusions. ........................................................................ 121
Figure 78. Cutting algorithm. ............................................................................... 121
Figure 79. Smoothing algorithm. .......................................................................... 122
Figure 80. 3D models created by novice users in Teddy. ....................................... 123
Figure 81. Interface systems with Freeform UI property ratings. ....................... 126
1
Chapter 1
Introduction
1.1. Motivation
User interfaces evolve as the purpose of computing changes. When computers were first
introduced, their primary role was numerical calculation. At that time, the user
interface was “batch-based operation”: the user submits a job to a computer and waits
for the result of its calculations. The next stage was computers supporting corporate
information management, with applications such as databases. Interactive teletype and
command-line interfaces became dominant at this point, introducing more people to the
world of computation. As computers grew increasingly popular and inexpensive, the
primary purpose of computing became supporting knowledge workers in office
environments. Office productivity tools, such as spreadsheets and word processors, were
the most important applications. These applications could not have become wide-spread
without the invention of WIMP-style GUI (graphical user interfaces based on windows,
icons menus, and a pointing device, typically a mouse). GUI, originally designed by
Xerox and Apple, allows general knowledge workers to work with computers without
specific computer skills or training.
GUI has been the predominant user interface paradigm for almost 30 years. But
because the purpose of computing is changing, we clearly need next-generation user
interface framework. In the near future, computers’ main application will no longer be
as a tool for supporting knowledge workers in office environments. As they become
smaller and still less expensive, they will become ubiquitous and their goal will be to
support every aspect of human life. At that stage, a new form of user interfaces, post-
WIMP [139] or non-command [100] user interfaces, will be needed. In [100], Nielsen
argued that current GUI is essentially the same as command-line user interface in that
2
users have to translate their tasks into machine-understandable sequences of
commands. Pressing buttons or selecting items in menus in GUI is essentially identical
to typing commands in command-line user interface. In non-command user interfaces,
computers take appropriate action based on the users activity, allowing the user to
concentrate on the task itself without worrying about commands.
Candidates for post-WIMP, non-command user interface include virtual realities and
augmented realities, multi-modal and multi-media interfaces, natural language
interfaces, sound and speech recognition, portable and ubiquitous computers. Each new
interface is designed to support specific new uses of computers. The increasing number
of applications dealing with three-dimensional information require virtual reality
techniques and various three-dimensional input devices. The need to support people in
situations where one cannot use hands or keyboards has spurred the growth of voice
input technologies. Highly complicated, spatial applications gave birth to the idea of
physical (graspable or tangible) interfaces that can provide more affordable, space-
multiplexed input channels. The essence of the next-generation user interface is its
diversity. While current user interfaces are characterized simply as “WIMP-style GUI,”
post-WIMP or non-command user interfaces will be characterized as collections of task-
oriented, tailored interfaces. An important task for user interface research is to identify
an emerging application domain and find the ideal user interface for that domain
beyond WIMP-style GUI.
This dissertation explores a user interface framework, Freeform User Interfaces, as a
post-WIMP, non-command user interface in the domain of graphical interaction.
Current point-click-drag style interaction is suitable for specific kinds of graphical
interaction, namely object-oriented graphics such as block diagrams or flow charts.
However, the point-click-drag interface does not work well for expressing arbitrary
graphical ideas or geometric shapes in computers. The user has to do this manually by
placing many control points one by one or combining editing commands in a nested
menu. On the other hand, people have been using pen and paper to express graphical
ideas for centuries. Drawing freeform strokes is a convenient, efficient, and familiar
way to express graphical ideas. Freeform UI is an attempt to bring the power of
freeform strokes to computing.
3
1.2. Freeform User Interfaces
Freeform User Interfaces represent an interface design framework that uses pen-based
input devices for computer-supported activities in graphical domains. In Freeform UI,
the user expresses visual ideas or messages as freeform strokes on pen-based systems,
and the computer takes appropriate action by analyzing the perceptual features of the
strokes. This is based on the observation that freeform sketching is the most intuitive,
easiest way to express visual ideas. Freeform UI is an attempt to establish a non-
command user interface for two- and three-dimensional graphical applications in that
the user can transfer visual ideas into a computer without converting the ideas into a
sequence of tedious command operations.
Although Freeform User Interfaces assume pen-based devices as input channels, it
differs from traditional pen-based interfaces in that it extracts significantly richer
information from the user’s freeform strokes than does simple pattern-matching. Most
pen-based systems are based on handwriting character recognition and gesture
recognition, which are basically pattern-matching strategies. The system maps each of
the user’s freeform strokes to a predefined character or command, such as undo or
delete. This is essentially command-based interaction in that each operation in these
traditional pattern-matching systems is equal to pressing a button or selecting an item
in a menu. In contrast, Freeform User Interfaces transform the freeform strokes into
rich internal representations based on the perceptual characteristics of each stroke
instead of mapping them to predefined characters or commands.
This dissertation presents four independent example systems embodying the idea of
Freeform User Interfaces. While each of these systems contributes independently to the
improvement of existing applications, taken as a whole they form a concrete basis for
discussing the nature of Freeform UI, including its strengths and limitations. Below we
here introduce the four example systems. Each is described in detail later in this
dissertation.
1.2.1. Beautification and prediction for 2D geometric drawing
These techniques allow the user to construct precise illustrations such as shown in
Figure 1 without using complicated editing commands. The idea is to automate

4
complicated drawing operations by having the computer infer possible geometric
constraints and the user’s next steps from the user’s freeform strokes. Interactive
beautification receives the user's free stroke input and beautifies it by considering
possible geometric constraints among line segments by generating multiple alternatives
to prevent recognition errors. Predictive drawing predicts the user's next drawing
operation based on the spatial relationships among existing segments on the screen. A
prototype system is implemented as a Java™ program, and our preliminary user study
showed promising results.
Figure 1. A diagram drawn using interactive beautification and predictive drawing.
1.2.2. Path-drawing technique for virtual space navigation
This technique allows the user to navigate through a virtual 3D space by drawing the
intended path directly on the screen. After drawing the path, the avatar and camera
automatically move along the path (Figure 2). The system calculates the path by
projecting the stroke drawn on the screen onto the walking surface in the 3D world.
Using this technique, with a single stroke the user can specify not only the goal position,
but also the route to take and the camera orientation at the goal. A prototype system is
tested using a display-integrated tablet, and experimental results suggest that the
technique can enhance existing walkthrough techniques.

5
Figure 2. An example of a path-drawing walkthrough.
1.2.3. Stroke-based architecture for electronic whiteboards
This is a software architecture for our pen-based electronic whiteboard system, called
Flatland. Flatland is designed to support various activities for which personal office
whiteboards are used, while maintaining the outstanding ease of use and informal
appearance of conventional whiteboards. The GUI framework of existing window
systems requires too many, complicated operations to achieve this goal, and so we
designed a new architecture that works as a kind of window system for pen-based
applications. Our architecture is characterized by its use of freeform strokes as the
primary element for both input and output, flexible screen space segmentation,
pluggable applications that can operate on each segment, and built-in history
management mechanisms. This architecture is carefully designed to achieve simple,
unified coding and high extensibility, which were essential to the iterative prototyping
of the Flatland interface. While the current implementation is optimized for large office
whiteboards, this architecture is useful for the implementation of various pen-based
systems.
6
Figure 3. Flatland example.
1.2.4. Sketch-based 3D freeform modeling
This technique allows the user to quickly and easily design freeform models, such as
stuffed animals and other rotund objects, using freeform strokes. The user draws
several 2D freeform strokes interactively on the screen and the system automatically
constructs plausible 3D polygonal surfaces. Our system supports several modeling
operations, including the operation to construct a 3D polygonal surface from a 2D
silhouette drawn by the user: the system inflates the region surrounded by the
silhouette, making wide areas fat and narrow areas thin. Teddy, our prototype system,
is implemented as a Java™ program, and the mesh construction is done in real-time on
a standard PC. Our informal user study showed that a first-time user typically masters
the operations within 10 minutes, and can construct interesting 3D models within
minutes.
Figure 4. Teddy in use on a display-integrated tablet.

7
Freeform User Interfaces are characterized by the following three features: the use of
pen-based stroking as input, perceptual processing of strokes, and informal
presentation of the result. Pen-based stroking input allows the user to express their
graphical ideas quickly and intuitively. In addition, the informal nature of pen-based
sketching encourages the user to freely explore various possibilities without careful
consideration beforehand. Perceptual processing of strokes mimics the human ability to
infer a variety of meaningful information from simple drawings. Such information may
include, for example, implicit geometric relations among the strokes or a possible three-
dimensional shape represented by a two-dimensional drawing. It automatically infers
the user’s high-level idea and intention from the freeform drawing and can delegate
tedious fine-grained command operations. In short, perceptual processing allows the
user to perform complicated operations with a minimum of input. Informal presentation
is important to in creating for the user the appropriate impression and expectations
about the system’s behavior. Freeform UI is inherently ambiguous and transient to
encourage informal, pre-productive activities. Informal presentation can implicitly and
effectively present Freeform UI’s inherent qualities to the user and can avoid possible
frustration and confusion caused by misunderstanding.
Although ambiguity and imprecision are the major strengths of the Freeform User
Interface, they are at the same time its fundamental difficulty. The result of a
computation based on ambiguous strokes can be different from the user’s expectation.
This is also a problem of perceptual processing. Perception is personal in nature, and it
is impossible to represent everyone’s expectation correctly. The imprecise nature of
Freeform UI prevents it from application to activities of refinement and detailing.
Based on our implementation and user study experience, we found that the following
techniques are useful for mitigating the problem of ambiguity and imprecision. First,
the construction of multiple interpretations is useful to minimize the problems of
ambiguity. By presenting multiple interpretations, the probability increases that the
user will find the version she expected to find. Second, the informal presentation can
hide the details and thus prevent the user from expecting precise operation. The user
naturally understands the ambiguous nature of the system, and frustrations caused by
misconceptions can be minimized. Third, quickly responding fluent interaction allows
the user to explore various possibilities without heavy overhead. If it takes time for a
user to specify an operation and for a computer to return a result, it is frustrating to
repeatedly try various inputs when the system repeatedly returns the wrong result.

8
Freeform UI can be applicable to a wide range of applications involving graphical
information processing that can be tedious when using standard GUI. Examples include
sketching on PDAs, taking notes on notebook computers, communicating over window-
size computers, supporting medical operations, or creating designs for 2D and 3D
presentations. Overall, Freeform UI is useful for creative, informal, and exploratory
thinking activities in the graphical domains.
1.3. Contributions
This dissertation introduces the concept of Freeform User Interfaces and discusses its
strengths and limitations using four stroke-based interaction techniques and systems
as examples. The thesis postulated by this dissertation is that the freeform stroke is a
powerful interface for communicating graphical ideas to computers. The contributions
of the research include the following:
The concept of Freeform User Interfaces. We characterize Freeform User Interfaces by
stroke-based input, perceptual processing of strokes, and informal presentation. This
combination is suitable for informal, creative activity using a computer in a graphical
application domain. The essential difficulties are inherent ambiguity and inaccuracy in
interpreting freeform strokes, but this problem can be minimized by presenting
multiple possibilities, controlling the user’s expectation by the informal presentation,
and providing a carefully designed quickly responding interaction style.
The four independently useful techniques and systems. Interactive beautification and
predictive drawing are useful techniques for drawing 2D geometric illustrations. Path
drawing navigation is a useful technique for navigating through virtual 3D space.
Flatland is a useful software system for personal electronic whiteboards. Teddy is a
powerful tool for constructing simple 3D models quickly. Each contributes innovative
ideas, strong implementation, and valuable insight into each application domain.
1.4. Organization
We first review related work in this field in Chapter 2. We briefly overview the various

9
research projects to explore next-generation, non-command user interfaces. We also
review many pen-based techniques and systems in depth to clarify the context of this
research.
In Chapter 3, we propose the concept of Freeform UI as a pen-based non-command user
interface for graphical applications. We define the concept with three properties, and
discuss possible application domains where Freeform UI can be useful.
We then describe our example systems in detail. Chapter 4 describes our 2D geometric
drawing system, and introduces interactive beautification and predictive drawing. An
evaluation of the beautification technique is provided. Chapter 5 introduces the path
drawing technique for 3D virtual space navigation, and provides the results of an
informal user study. Chapter 6 presents the stroke-based software architecture for
personal electronic whiteboards. The architecture can be a platform for implementing
various applications based on Freeform UI. Chapter 7 introduces the sketch-based
interface for constructing freeform 3D models.
Next, in Chapter 8, we revisit the concept of Freeform UI and discuss its strengths and
limitations based on the example systems discussed in the preceding chapters. Several
guidelines for designing effective Freeform UI are presented.
Finally, Chapter 9 summarizes the dissertation and discusses several future directions.

10
Chapter 2
Background
This chapter introduces the dissertation’s background. We first review various research
efforts aimed at designing next-generation user interfaces. These efforts are not
technically related to pen-based computing directly, but they broaden the context of our
efforts and illustrate general ideas and principles necessary for designing non-command
user interfaces. Then, we review existing technologies and previous efforts in pen-based
computing in detail. Some important related work is discussed again in Chapter 8.
2.1. Non-command User Interfaces
The goal of this dissertation is to explore next-generation, non-command user interfaces
in graphical application domains. Although research projects pursuing non-command
user interfaces in other domains are not directly related to our stroke-based techniques,
we briefly review representative projects to illustrate a broader perspective on the
entire user interface research area. The following research projects are just a small
sampling of the vast research efforts now underway to create next-generation user
interfaces beyond WIMP-style GUI.
The concept of non-command user interfaces was introduced in [100]. In that paper,
Nielsen argued that all previous generations of user interfaces, including batch-based,
time-sharing command line, and graphical user interfaces, are all characterized as
command-based interfaces, where the user explicitly commands the computer to do
something. In contrast, Nielsen wrote next-generation user interfaces can be
characterized as non-command user interfaces, where the interaction between humans
and computers is not based on explicit command operation by the user. In non-command
11
user interfaces, the computer automatically interprets the user’s action and does
appropriate operations without having received explicit commands, allowing the user to
concentrate on the task itself rather than controlling the computer. Examples he listed
of next-generation, non-command user interfaces included virtual realities, head-
mounted displays, sound and speech, pen and gesture recognition, animation and
multimedia, limited artificial intelligence, and highly portable computers with cellular
or other wireless communication capabilities.
2.1.1. 3D Interface and Virtual Reality
WIMP-style GUI is basically designed for 2D desktop applications. The increasing
number of 3D applications necessitates post-WIMP, specialized interfaces [139]. The
WIMP interface for 3D applications today typically consists of a number of 2D widgets
around the 3D world view, causing a significant cognitive distance between the end user
action (2D widget control) and the system response (change in the 3D world). We will
review interaction techniques based on 3D input devices and stereo vision as examples
of post-WIMP user interfaces for 3D applications.
A natural approach for manipulating 3D objects is to use a six-degree-of-freedom
tracking device as input [111]. The user can translate and move objects in a 3D scene
simply by manipulating the physical handle with the tracker. This approach can be
more powerful when the system supports two-handed interaction using two six-degree-
of-freedom trackers [54, 110]. It is also possible to add force-feedback functionality to
these 3D input devices [107]. These interfaces can be called non-command user
interfaces because the user can manipulate 3D objects directly by moving their hands in
the air, without explicitly manipulating graphical interface widgets in the 2D screen.
Virtual reality systems with head-mounted display with trackers are one extreme of
these approaches [141]. There is also growing interest in room-size immersive
environments with 3D image projection to the walls around the user [25]. These
systems convince users that they are in the artificial three-dimensional space by
presenting stereoscopic vision and allowing them to interact with the environment by
moving their limbs or bodies. The important feature is that the view presented to the
user is calculated based on the user’s head position and orientation, rather than
depending upon the user’s explicit camera control using 2D widgets, such as sliders or
12
buttons. The result is that the user can concentrate on the task in the three-
dimensional world without worrying about camera control or object manipulation.
2.1.2. Augmented Reality
The approach opposite from virtual reality is augmented reality, which uses computers
to augment objects in the real world instead of enclosing people in an artificial world
[150]. While a wide range of systems can be considered augmented reality systems, we
review some systems that overlay computer generated images onto everyday physical
objects in a scene using projectors and see-through displays.
The Digital Desk [149] is an attempt to computationally augment the physical desktop
with paper documents. A computer display is projected down onto a desk and video
cameras observe the user’s activity on the desk. The goal of the project is to seamlessly
merge physical and electronic artifacts. For example, users can specify drawings on a
physical paper using their fingers, and copy the drawings to some other area. The
duplicated image is synthesized by the computer and projected onto the desk surface.
The KARMA system [37] presents to the user additional information on top of physical
objects using a see-through, head-mounted display and tracking devices. For example,
the user can see the internal components of a laser printer or instructions to repair it.
The system accesses expert systems and knowledge bases to understand the properties
and behaviors of the physical artifacts. The main interest of the KARMA system is to
accurately align computational images to corresponding physical objects, but it is
important to note that their interface requires no explicit control of computers. The
system generates appropriate images automatically, based on the spatial relationships
between the user’s head and the objects without the user explicitly controlling the
computer.
While the KARMA system addresses the problem of presenting information accurately
to specific objects such as a printer, the NaviCam system [116] proposes an interface for
presenting corresponding information for spatially distributed objects across a room or
a building. This system uses a hand-held display with a video camera. The image
observed by the camera is presented on the display along with computer generated
image. This interaction is analogous to a magnifying glass: the user looks at the target

13
object through the device to obtain additional information. The system uses a two-
dimensional bar code and vision-based recognition technique to recognize which object
the user is looking at and to determine what information to present.
From the viewpoint of non-command user interfaces, augmented reality systems use the
user’s natural interaction with physical objects as input to perform appropriate actions
without explicit command operations by the user. With the Digital Desk, the system
responds to the user’s manipulation of physical papers, while KARMA and NaviCam
present information attached to a physical object when the user looks at the object
through the see-through display. As a result, the user can focus on the task in the real
world, rather than on the abstract manipulation of the computer.
2.1.3. Multimodal Input
Human beings communicate with each other using various modalities, such as voice,
gaze, and bodily gestures. Multimodal interfaces try to take advantage of these
modalities beyond simple point-and-click operations.
Many commercial products based on voice recognition have appeared recently [97], but
their targets are dictation and simple command operations using word recognition.
Since voice recognition is essentially error-prone, it is important to design interfaces
considering this nature. A solution is to combine voice with another modality, such as
gesture. Bolz’s Put-That-There system [14] allows users to point at objects on a map
using their fingers and to speak commands to modify the objects. By using this pointing
gesture, a user can simply say “Put that there” instead of “put the orange square to the
right of the blue triangle,” thus minimizing the system’s recognition error and the user’s
cognitive overhead.
Gaze is a difficult modality to use as input because it is impossible to tell whether the
user is looking something intentionally or merely resting the gaze unintentionally [64].
A good solution is to use gaze as a secondary, supporting input. An interactive fiction
system called The Little Prince [132] changes its scenario based on the pattern of the
user’s eye movement. In this system, the computer modifies its behavior without the
user’s explicit command input.
14
Bodily gesture has been used mainly for entertainment applications. The HoloWall
system [85] emits infrared light from a translucent wall, and recognizes the user’s
bodily gestures by observing the reflected light from the body. Applications include a
paddleball game using the body as a paddle, a “life” game using body shape as initial
input, and interaction with artificial animals reacting to the user’s body. MIT’s pfinder
system [157] is used to recognize the user’s bodily interaction with an artificial dog
“living” in a wall-sized display [20]. These systems allow the user to interact with
artificial animals without explicit command operations, by observing the user’s natural
bodily action.
2.1.4. Ubiquitous Computing
The ubiquitous computing project [145][146] proposes an environment that is
surrounded by hundreds of wireless, interconnected computers. In this environment,
the relation between the user and the computer is one-to-many, instead of the current
one-to-one relation. The project introduced several computing devices with varying
scales including active badge, PARC tab, pad, and LiveBoard. Active badge [144] is a
small device attached to individuals, and it constantly transmits the identity and
location of the person to the computing infrastructure. PARC tab is a palm-sized device
with a touch-sensitive screen that stores personal information. One can hand the
information to a colleague’s tab using a wireless infrared connection. The LiveBoard
[138] is a wall-sized electronic whiteboard system designed around pen-based input.
Compared with the WIMP-style interface for a single console, the ubiquitous computing
environment provides interfaces with a much wider bandwidth. The environment can
make use of rich information, such as the user’s location and the device the user is
interacting with, and thus it requires less explicit control by the user.
2.1.5. Summary
We reviewed a small representative sample of various research activities now underway
to develop next-generation user interfaces. The important observation is that most
systems reduce the amount of the user’s explicit control by automatically inferring the
user’s intention from the natural actions taken in each application domain; such actions
include head motion, gazing, manipulation of physical objects, speech, and movement in

15
a physical world. Like these systems, Freeform UI infers the user’s intention from
freeform drawings using pen-based input.
We can learn several lessons from the systems we have just discussed. First, interfaces
must be specialized to their target application domains. While WIMP-style GUI is used
universally for every application today, next-generation interfaces are characterized by
their diversity. Freeform UI is designed for informal activities in graphical computing
domains, and we must be aware that it does not work well in other domains. Second, to
design effective interfaces, it is important to understand the essential strength of each
input stream. For example, gaze was not successful as an explicit cursor control. Gaze is
best suited to finding the target of the user’s attention in the screen. We focus on the
fact that pen-based sketching is the best way to express graphical ideas rapidly, instead
of using a pen for direct manipulation of objects. Finally, new forms of interfaces can
evolve only by implementing actual working prototypes and accumulating experience
with them. Prototyping and user studies are the only ways to innovate. We
implemented the four example systems and tested the ideas behind each using
prototype systems according to the lesson.
2.2. Pen-based Computing
Pen-based computing has a long history of research and development in both hardware
and software [86]. In this section, we briefly review existing products and technologies.
First, we explain the current status of commercial pen-based hardware products. Next,
we review basic interaction techniques in pen computing, including handwriting
recognition, fast text input methods, and gesture/shape recognition. Finally, we review
several experimental research projects related to pen computing. We divided the
projects into four categories (handheld, whiteboards, exploratory, and drawing) for
convenience’s sake, but these areas interrelate closely with each other.
2.2.1. Pen-based Input Devices
Today, several kinds of pen-based computing devices are available, including tablets,
display integrated tablets, electronic whiteboards, pen-based portable computers, and
PDAs. Illustrators and graphic designers use tablets to draw pictures. Tablets are small

16
and relatively cheap, but they require additional cognitive overhead because the
graphical objects on the screen are distant from the physical location of the pen. Display
integrated tablets offer more natural interaction similar to real pen and ink, but they
are not widely used because they are currently quite expensive. The largest market for
display integrated tablets today is healthcare institutions. Physicians use these devices
to take notes on electronic medical records. Some commercial electronic whiteboards are
available including both rear-projected and front-projected ones. They are mainly used
in meeting situations to record, share, and print handwritten notes on a board. Pen-
based portable computers are mainly used in retail stores and warehouses with custom
software, such as car price calculations based on various options or counting goods in
stock. In most cases, people use standard window systems with these pen-based devices,
and they use pens to just press buttons or select menus other than for handwriting
recognition. Personal digital assistants (PDAs), which are palm-sized computers, have
become increasingly popular recently. People use these devices for personal information
management. Fast text input methods such as Graffiti are widely used on these devices.
a) Hand held PDA (Sharp Zaurus [160]) b) Pen-based portable computer (Mitubishi AMiTY [2])
c) Display integrated tablet (Mutoh MVT-14[92]) d) Electronic whiteboard (SMART Board[130])
Figure 5. Examples of pen-based devices.

17
2.2.2. Handwriting Character Recognition
Handwriting recognition1 has been the primary interest of researchers from the
beginning of pen computing [27]. The idea was to let the user input texts into computers
without a keyboard. Handwriting recognition was expected to be intuitive as well as an
efficient text input method for novice users who are not familiar with keyboard typing.
The early systems required the user to write characters separately in a sequence of
boxes. Some commercial products still use this strategy for reliable recognition [160].
Advanced recognition techniques allow the user to write printed characters in a free
space. In this case, the system has to divide the set of strokes into independent
characters first, which can introduce more recognition errors. Recent systems also allow
the user to write cursive, continuous texts freely [58]. This kind of technique was used
in the Apple Newton™ [19].
In spite of vast research efforts and commercial attempts, handwriting recognition has
not yet become widespread. The primary reasons are recognition errors and the fact
that handwriting text input is significantly slower than typing on a keyboard. In a
desktop computing environment, almost all use a keyboard. As a text input method for
small devices, such as PDAs and mobile phones, simplified character input (described in
the next section), software keyboards, and buttons are what most people use. It is not
clear whether character recognition will become dominant in the future, but it can be
said that the interface based on handwriting recognition should be designed in an
error-tolerant manner or should be used in applications in which a certain, if small,
amount of error is acceptable.
2.2.3. Fast Text Input Methods
Because handwriting recognition is too error-prone and slow, there have been several
1 In this dissertation, handwriting recognition refers to on-line handwriting recognition,which recognize characters written on the electronic tablets in real-time. Off-linerecognition, which recognizes characters that have been scanned from paper, is notdiscussed further. Good reviews on handwriting recognition can be found in [137].
18
attempts to explore alternative methods for fast and reliable pen-based text input. One
way is to use simple, artificial “alphabets” that are easier for the computer to recognize,
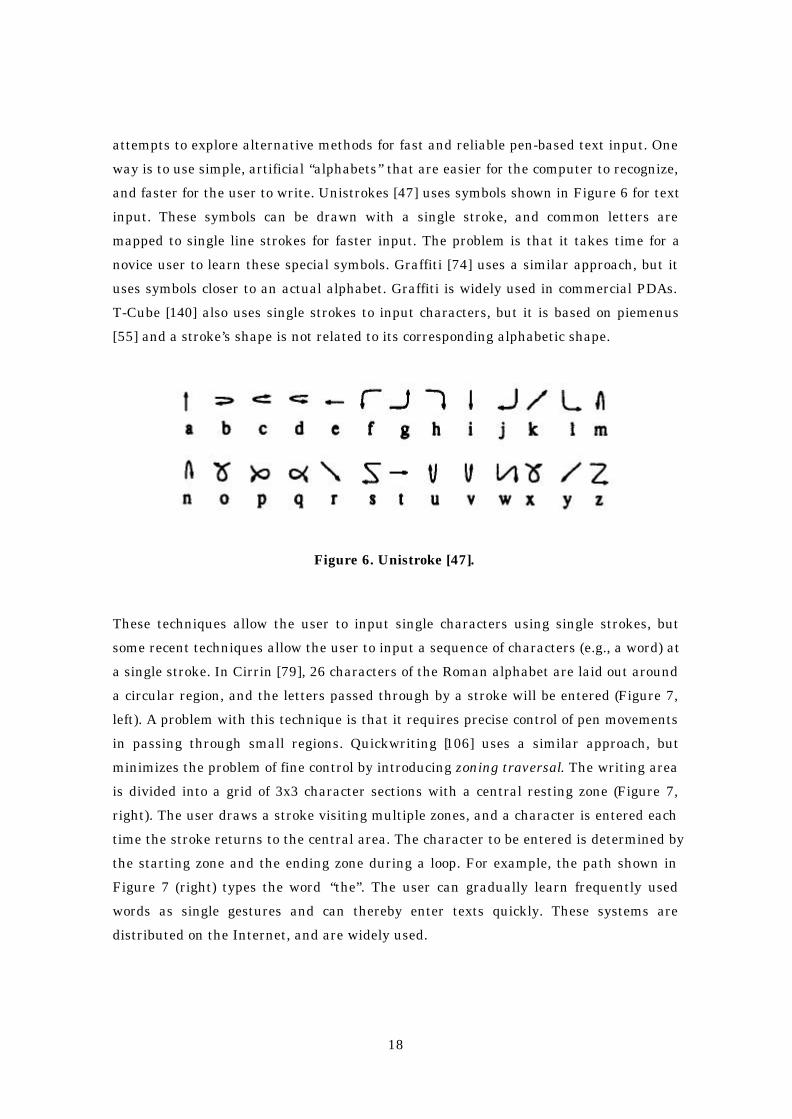
and faster for the user to write. Unistrokes [47] uses symbols shown in Figure 6 for text
input. These symbols can be drawn with a single stroke, and common letters are
mapped to single line strokes for faster input. The problem is that it takes time for a
novice user to learn these special symbols. Graffiti [74] uses a similar approach, but it
uses symbols closer to an actual alphabet. Graffiti is widely used in commercial PDAs.
T-Cube [140] also uses single strokes to input characters, but it is based on piemenus
[55] and a stroke’s shape is not related to its corresponding alphabetic shape.
Figure 6. Unistroke [47].
These techniques allow the user to input single characters using single strokes, but
some recent techniques allow the user to input a sequence of characters (e.g., a word) at
a single stroke. In Cirrin [79], 26 characters of the Roman alphabet are laid out around
a circular region, and the letters passed through by a stroke will be entered (Figure 7,
left). A problem with this technique is that it requires precise control of pen movements
in passing through small regions. Quickwriting [106] uses a similar approach, but
minimizes the problem of fine control by introducing zoning traversal. The writing area
is divided into a grid of 3x3 character sections with a central resting zone (Figure 7,
right). The user draws a stroke visiting multiple zones, and a character is entered each
time the stroke returns to the central area. The character to be entered is determined by
the starting zone and the ending zone during a loop. For example, the path shown in
Figure 7 (right) types the word “the”. The user can gradually learn frequently used
words as single gestures and can thereby enter texts quickly. These systems are
distributed on the Internet, and are widely used.

19
Figure 7. Cirring [79] and QuickWriting [106].
POBox [84] combines software keyboards with prediction. When the user types the first
few characters of a word on the software keyboard, the possible entire words are
automatically predicted based on the built-in dictionary, and they appear in whole form
below the software keyboard (Figure 8). If the desired word appears, the user can tap
the word to automatically complete the typing. If the desired word does not appear, the
user can continue typing, refining the prediction. This technique is especially useful for
languages with many characters such as Japanese, and it is widely used as a primary
text input method on PDAs.
Figure 8. POBox [84].
These predictions appear when the user types “i” in Japanese.
2.2.4. Gesture and Shape Recognition
While handwriting recognition allows the user to input texts, gesture recognition allows
the user to input commands, such as undo and delete, using freeform strokes. Gestures
20
were used for document editing and mark-up in early research projects on electronic
paper systems [155, 18]. More recently, they have become widely used in commercial
pen-based products such as Apple’s Newton™ [99], Go’s PenPoint™ [45] and Microsoft
Windows for Pen Computing™ [88]. Using gestures, the user can input commands
quickly within the work space without moving the cursor (pen) to buttons or menus at
the periphery. The problem with gestures is that the user has to memorize them first.
Before memorizing all gestures, the user has to frequently consult a gesture chart,
which can be critically time-consuming.
Shape recognition allows the user to put graphical objects at a target location quickly.
For example, the user can sketch a rectangular shape to put a rectangle object on the
screen without having to choose a rectangle in a menu and then having to specify size
and location using direct manipulation. This kind of technique is used in object-oriented
diagram editors [159] and various applications involving the spatial arrangement of
objects [50,73].
Handwriting recognition, gesture recognition and shape recognition are based on
similar technologies. In general, these recognition techniques use pattern-matching
algorithms. The system classifies an input stroke as one of a number of predefined
characters, gestures, or shapes. A common approach is to use generic classification
methods, such as neural networks [82] or statistical methods [121]. In this case, the
system designer trains the classification engine first using massive examples. This
approach is much more powerful, robust, and generic than hard-coding a recognition
routine for each pattern. However, recognition accuracy still depends on the design of
the recognition engine (e.g., which feature of a stroke to extract as input) and of the
training set.
2.2.5. Handheld Devices
In this section, we review recent research projects targeted for pen-based handheld
devices. While early researches and products focused on recognition techniques for
handwriting recognition and gesture recognition, recent projects focus on various
application-specific interaction techniques.
FX Pal has several interesting projects related to handheld pen-based computing. The
21
Dynomite project [151] introduced pen-based system for personal note-taking activities.
Dynomite is unique in that it synchronizes handwritten notes on the screen with
recorded sounds (voices). If the user clicks a part of a handwritten note, the system
plays a sound sequence recorded when that part was written. Xlibris [128] is a portable
document-reading device for “active reading,” where the user adds various notations,
such as underlines and comments, on top of the document. The system allows the user
to search and reorganize the document based on these notations. NotePals [28]
introduced networked system for sharing personal handwriting notes. The users take
notes on their PDAs in mobile environments, and upload their personal notes to a
shared server. As a result, any user can read any other user’s notes over the Internet.
Sony CSL introduced a pen-based interaction technique for exchanging information
across multiple devices [117,118]. As one drags and drops an icon within a single
computer, one picks up an icon from a device and drops it into another device. In this
way, one can transfer a file across computers without worrying about file names and
computer names, which was required when transferring files using floppy disks, email
or ftp. Using this pick-and-drop technique, one can hand a file from one’s PDA to a
partner’s PDA, can pick a file for one’s PDA from an electronic bulletin board, or can
select a color in a handheld electronic palette and paint a picture on an electronic
whiteboard as if using a physical palette and canvas.
2.2.6. Electronic Whiteboards
Some commercial electronic whiteboard systems are available, but people generally use
standard graphical user interfaces for various operations other than simple scribbling.
Research projects for electronic whiteboards explore interaction techniques specialized
for large screen spaces and beyond simple click-and-drag operations.
A research group at Xerox PARC has been working on pen-based meeting-support
software running on LiveBoard [36]. Tivoli [112] uses a combination of static interface
widgets and gestures for editing meeting notes. It introduced the “wipe” operation,
which allows the user to change the properties of strokes at once. Tivoli also introduced
an automatic grouping mechanism for the material on the board [89], and a set of
gesture-based techniques for organizing the materials [90]. Recently, it developed a
mechanism for defining semantic relations between the objects on a board [91]. Using

22
this mechanism, the user can add desired computational support for a specific meeting.
These systems are deployed at Xerox PARC and used in actual meetings.
Nakagawa’s group at Tokyo University of Agriculture and Technology has developed an
experimental whiteboard system called IdeaBoard [96]. It introduced several interface
widgets optimized for pen-based operations on large surfaces. For example, they allow
the user to scroll the screen by dragging the scrolling area around the work space, and
to slide the screen by dragging the surface. Nakagawa’s group also implemented several
applications for use with the system, such as a word processor and an animation design
program.
Geissler et al. developed a wall-sized interactive display and introduced several
interaction techniques suitable for the extremely large display [43]. For example, they
designed a simple gesture set to throw a window to a distant location without dragging
it all the way manually.
Kramer discussed a mechanism for organizing information on electronic whiteboards
flexibly [69]. Instead of organizing visual elements by static windows, they used
dynamic, freeform patches for grouping relevant information on the board. These
patches are translucent, and the user can overlap multiple patches to construct a
desired workspace temporarily. This mechanism is appropriate for stroke-based
applications for meetings because the structure of information in these environments is
dynamic and changes constantly during the discussion.
2.2.7. Sketch-based Systems for Exploratory Thinking
Many research projects use pen-based input because it is a natural choice for special
computing environments, such as mobile computing on PDAs or meeting-support using
electronic whiteboards. In contrast, several projects use pen-based input because of its
ability to facilitate exploratory thinking.
SILK [73] is one of these experimental systems specifically designed for exploratory
activity. It is a system for a designer to design graphical user interfaces. The designer
quickly sketches the GUI widgets using freeform strokes on a tablet, and the
handwritten widgets become active immediately allowing the user to interact instantly
23
with the sketched interface. For example, the “knob” in a sketched scroll bar can be
dragged up and down. The recognized widgets preserve their sketchy appearance
instead of being replaced by predefined graphics. The use of gesture-based input can
free the designer from tedious operations required in standard interface builders, and
the informal presentation prevents the designer from worrying about details too much.
The Electronic Cocktail Napkin [49,50] also uses pen-based drawing as input for
conceptual and creative design activities. It works as a front-end interface for
information retrieval, simulation, design critiquing, and collaborative work. It
recognizes simple primitives, such as boxes, lines, circles, and triangles, and also
recognizes the configuration of these primitives. This system’s designers emphasized
the importance of contextual recognition, where the meaning of a primitive relies on the
context surrounding it. For example, a blob can be recognized as a circle or a box
depending on the drawings around the blob.
The Music notepad [138] is a system for editing musical score using pen-based gestural
input. The user can input notes and rests, and edit them using simple gestures without
using a standard WIMP-style interface. Its designers argue that a sketch-based
interface is much closer to sketching music with a real pen and paper, and is thus
desirable for informal scoring of music than a WIMP-based UI.
Lakin’s vmacs [72] is an electronic design notebook for engineers. The designer draws
arbitrary sketches on a blank canvas, and the system later tries to find its hierarchical
structure in the drawing by applying various visual parsers. The idea of visual parsing
was derived from grammatical parsers for natural languages.
2.2.8. Drawing Applications
An important advantage of pen-based input, other than allowing handwritten text and
gestures, is that it is the most intuitive method for drawing pictures on computers.
People find it difficult to draw arbitrary shapes using a mouse, but pen-based
interaction is significantly closer to shape-drawing using pen-and-paper and thus
people find it intuitive and desirable. The user can benefit from pen-based drawing
significantly even in simple drawing programs designed for mouse-based interaction
(e.g., Microsoft’s Paint program in Windows), but researchers have been exploring

24
various systems and interaction techniques to make the most of pen-based drawing.
Some commercial products such as Apple’s Newton™ [99], GO’s Penpoint™ [45], and
freeform stroke drawing mode in typical drawing editors (SmartSketch™ [131], Corel
Draw™, etc.) provide various computational supports for pen-based freeform drawings.
They convert freeform strokes into vector segments, automatically connect nearby
points, and recognize basic primitives, such as ovals and rectangles.
The PerSketch system [127] facilitates the editing of informal drawing by recognizing
perceptual structures in freeform drawings. In standard object-oriented drawing
systems, each primitive, such as an oval or rectangle, has a permanent identity. Even
when an oval overlaps a rectangle, they are still recognized as two separate objects
unless the user groups them together. However, in informal line drawings, the user
naturally can perceive multiple possible grouping structures in overlapping strokes
(Figure 9). To allow the user to interact with these perceptual groups efficiently, the
system decomposes the strokes into small elements and returns the appropriate group
of strokes upon the user’s request.
The user draws a diagramconsisting of an oval and a rectangle.
The user perceives multiple possiblegrouping structures in the diagram.
Figure 9. PerSketch [127].
In common drawing programs, the user has to edit curves positioning control points
manually using a mouse, but it is difficult to design desired curve shapes using control
points. Baudel’s technique [6] allows the user to directly draw desired curve shape on
the screen using a pen-based device; the system calculates appropriate control points
and parameters. In addition to drawing a new line, the system also supports over
stroking for modifying an existing curve. Cohen et al. extended the technique for editing
3D curves [22]. The user can specify the 3D curves by drawing the curve as it appears
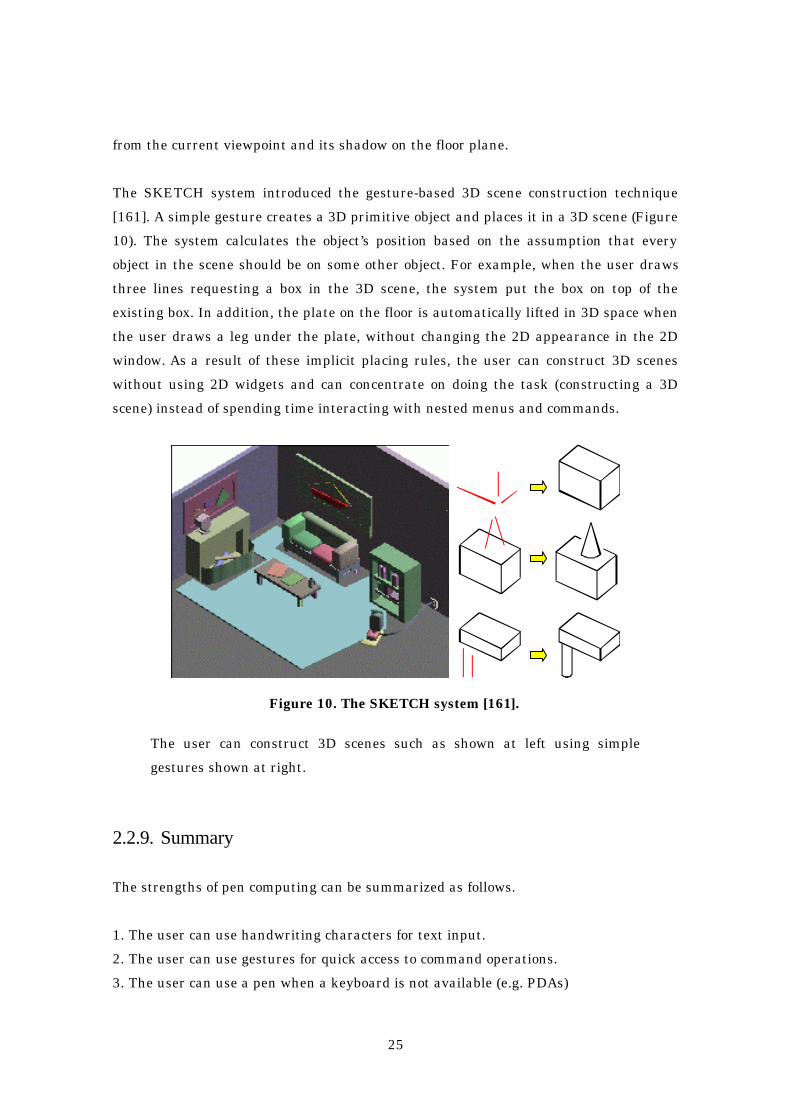
25
from the current viewpoint and its shadow on the floor plane.
The SKETCH system introduced the gesture-based 3D scene construction technique
[161]. A simple gesture creates a 3D primitive object and places it in a 3D scene (Figure
10). The system calculates the object’s position based on the assumption that every
object in the scene should be on some other object. For example, when the user draws
three lines requesting a box in the 3D scene, the system put the box on top of the
existing box. In addition, the plate on the floor is automatically lifted in 3D space when
the user draws a leg under the plate, without changing the 2D appearance in the 2D
window. As a result of these implicit placing rules, the user can construct 3D scenes
without using 2D widgets and can concentrate on doing the task (constructing a 3D
scene) instead of spending time interacting with nested menus and commands.
Figure 10. The SKETCH system [161].
The user can construct 3D scenes such as shown at left using simple
gestures shown at right.
2.2.9. Summary
The strengths of pen computing can be summarized as follows.
1. The user can use handwriting characters for text input.
2. The user can use gestures for quick access to command operations.
3. The user can use a pen when a keyboard is not available (e.g. PDAs)

26
4. Sketching is a casual interaction and is thus useful in supporting creative activities.
5. Drawing strokes using a pen is the best way to draw pictures.
Traditionally, the research has focused on the first three properties, aiming at the
development of pen-based techniques for doing things conventionally done by a mouse.
Handwriting recognition is an attempt to replace keyboard typing. Gesture recognition
was designed to replace menu selection and button clicking. Interaction techniques
developed for PDAs tried to achieve operations done on desktop computers.
In contrast, researchers have started working on the last two properties recently. These
are attempts to do something not possible or extremely tedious when using a mouse as
the input device. The goal of this dissertation is to push this effort further and present a
framework for making the most of these strengths. We discuss the relationship between
our Freeform UI framework and similar previous research efforts in Chapter 8.
To be specific here, however, it can be said that existing attempts have not achieved
fluent communication of graphical ideas as seen among human beings. A person can
communicate a significant amount of implicit messages to another person through a
simple drawing. For example, when one sees a drawing shown in Figure 11(left), one
can perceive many implicit messages, such as “this represents a bear,” “this is almost
horizontally symmetric,” “this consists of three parts, ” “this represents a certain 3D
geometry,” “this is cute.” Human-computer interaction can be much more fluent and
comfortable if computers can have this kind of ability. This dissertation introduces our
efforts to implement this ability in computers.
Symmetry 3 groups
3D geometry
Bear
Figure 11. A simple drawing communicates many ideas.

27

28
Chapter 3
Freeform User Interfaces
In this chapter, we propose the concept of Freeform User Interfaces as pen-based
interface design frameworks for informal graphical computing beyond traditional GUI.
The concept defined in this chapter is examined further in the following four chapters
with various application-specific systems. Chapter 8 revisits the concept to analyze its
nature based on the four example systems.
3.1. Problems and Research Goals
This dissertation proposes the concept of Freeform UI with four example systems. In
this section, we explain the problems we try to address and goals to be fulfilled by the
body of work presented in this dissertation.
In the broadest context, the goal of this work is to explore the new form of user
interfaces beyond traditional command-based interfaces. As computers become more
powerful and ubiquitous, the applications running on them become more complicated
and diverse. Traditional command-based interfaces are not appropriate for these new
computing environments, and researchers are exploring alternative interface
frameworks that can achieve fluent human-computer interaction. However, one
important property of next-generation user interfaces is diversity. Although the
currently predominant WIMP-style GUI is used for almost all application domains,
next-generation user interfaces will be a collection of various interfaces specialized for
each application domain [100]. Our goal is to explore next-generation, non-command
user interfaces in the domain of pen-based graphical computing, and to provide insights
for designing better interfaces for emerging computing environments.
29
The problem we try to address is that it is still difficult to communicate arbitrary
graphical ideas to computers using WIMP-style GUI. Direct manipulation allows the
user to grab objects on the screen directly and move them to the desired places. This
strategy works well for object-oriented diagrams, such as flow-charts and node-link
diagrams. However, direct manipulation is not good for expressing arbitrary freeform
shapes rapidly because it requires explicit manipulation of multiple points to control
curves. Furthermore, traditional GUI-based diagram editors require the user to
combine various editing commands to impose additional structures to the drawings. For
example, to draw a symmetric diagram, the user has to duplicate a half of the diagram,
flip it, and move it. Selecting appropriate commands from a large menu causes both
operational and psychological overhead. Our research goal is to propose alternative
interaction techniques for expressing graphical ideas rapidly without tedious
manipulation of control points or complicated editing commands.
Another problem in current computing environments is that they do not support
exploratory, creative processes that occur in the early stages of intellectual activities
[72,95]. Computers are generally used in production activities, such as editing
documents, preparing presentations, and drawing diagrams for publication, because
computers make it possible to prepare professionally-looking cleaner documents than is
possible by pen and paper. However, these application programs are too complicated to
use in earlier processes, such as conceiving an idea, outlining long documents, or
sketching rough conceptual designs. People use traditional pen and paper in these kinds
of exploratory processes because of their simplicity, and move on to a computing
environment later, when basic ideas have gelled into some clear form. Our goal is to
remove this barrier and to design interfaces that can support exploratory, creative
activities.
Finally, another goal of this work is to bring out the real strength of pen-based input.
Pen-based devices are becoming popular and available to everyone, but interaction
techniques for pen-based computing have not been explored enough. Popular pen-based
computing environments support handwriting recognition and gesture-based control.
Other than that, pen-based systems still use standard GUI widgets, such as buttons,
scroll bars, and pull-down menus. Some pen-based systems use shape recognition but
the user’s strokes are limited to a predefined shape set. An important strength of a
pen-based interface is that it is easy to draw arbitrary freeform strokes representing
30
various graphical ideas. Computers can use these freeform strokes as an interface
beyond simple scribbling programs, recording freeform strokes as-is, like with a
physical pen and paper.
3.2. Freeform User Interfaces
Freeform UI is an interface design framework using pen-based input for computer-
supported activities in graphical domains. In Freeform UI, the user expresses visual
ideas or messages as freeform strokes on pen-based systems, and the computer takes
appropriate action by analyzing the perceptual features of the strokes. This is based on
the observation that freeform sketching is the most intuitive, easiest way to express
visual ideas. The fluent, lightweight nature of freeform sketching makes Freeform UI
suitable for exploratory, creative design activities. Freeform UI embodies a non-
command user interface for two- and three-dimensional graphical applications in that
the user can transfer visual ideas into target computers without converting the ideas
into a sequence of tedious command operations.
Specifically, Freeform UI is characterized by the following three basic properties: the
use of pen-based stroking as input, perceptual processing of strokes, and informal
presentation of the result. We describe each property in detail in the following sections.
3.2.1. Stroke-based Input
Freeform UI is characterized by its use of strokes as user input. A stroke is a single path
specified by the movement of a pen and is represented as a sequence of points internally.
Stroking is usually recognized as a dragging operation in a standard programming
environment: it is initiated by “button press” event, followed by a sequence of “mouse
move” event, and terminated by “button release” event. However, stroking is actually a
significantly different interface model than dragging. In short, stroking corresponds to
physical drawing activity using real pen and paper, while dragging corresponds to a
physical grab-and-move operation of objects. During a stroking operation, the trajectory
of the pen’s movement is shown on the screen, and the system responds to the event
when the user stops stroking by lifting the pen. The system’s reaction is based on the
entire trajectory of the pen’s movement during the stroking, not just the pen’s position

31
at the end (Figure 12). In contrast, in a typical dragging operation, the current cursor
position is shown on the screen. Possibly, the object shape specified by the current
cursor position is shown as a feedback object, but the trajectory of the cursor movement
is not shown. The system’s action is based on the final cursor position and possibly the
starting position of dragging. In stroking, the user first imagines the desired stroke
shape and then draws the shape on the screen at once, while the user constantly adjusts
the cursor position observing the feedback objects during dragging.
Start Intermediate End
Stroking
Dragging
Figure 12. Stroking vs. dragging.
Pen-based stroking is an intuitive, fast, and efficient way to express arbitrary graphical
ideas in computing environments. This is because a pen-based stroking operation, or
sketching, has been for centuries the primary interaction technique for expressing
graphical ideas, and is therefore familiar to us. Specifically, stroking is suitable for
quickly entering rough images that internally consist of many parameters from the
computer’s point of view. On the other hand, mouse-based dragging is suitable for
more-delicate control of simple parameters. Dragging has been the dominant
interaction technique because traditional computer-based drawing applications are
designed for the careful construction of precise diagrams. The argument of this
dissertation is that graphical computing in the future should support informal drawing
activities and thus require a pen-based stroking interface.
We use the term “pen-based input” to refer to pen devices based on various technologies

32
[86], including light pens, pressure-sensitive tablets, electromagnetic digitizers, etc. It is
possible to use a tablet with a separate display, but a display-integrated device is the
best device for drawing strokes. Several input devices other than pens can be used for
Freeform UI. Users can draw freeform strokes using a finger on a pressure-sensitive
display surface or in a vision-based finger-tracking environment [149]. Small physical
handles may be used for drawing strokes on tablets. The important feature is one-to-one
correspondence between physical location in the input device and cursor location in
virtual space. Other pointing devices, such as a mouse, trackball, force-sensitive stick
[123] and pressure-sensitive touchpad, are not appropriate for drawing strokes because
they control virtual position by indirectly specifying the relative location or velocity of
the cursor movement. The input devices that are suitable for Freeform UI may be called
“drawing devices” in contrast to the more general “pointing devices.”
3.2.2. Perceptual Processing
The next important property that characterizes Freeform UI as a non-command user
interface, and that makes Freeform UI different from plain pen-based scribbling
systems, is its advanced processing of freeform strokes inspired by human perception.
Scribbling programs such as those used in commercial electronic whiteboards simply
convert the user’s pen movement into a painted stroke on the screen without any
further processing. Character-recognition and gesture-recognition systems convert a
stroke into a predefined character or command, using pattern-matching algorithms. In
these recognition systems, the output of the recognition is represented as a single
symbol. The stroking operation in these systems is essentially equivalent to key-typing
and button-pressing. “Perceptual processing” refers to mechanisms that infer
information from simple strokes that is richer than mere symbols. The idea behind
perceptual processing is inspired by the observation that human beings perceive rich
information in simple drawings, such as possible geometric relations among line
primitives, three-dimensional shapes from two-dimensional silhouettes. Perceptual
processing is an attempt to simulate human perception at least in limited domains.
The goal of perceptual processing is to allow the user to perform complicated tasks with
a minimum amount of explicit control. In traditional command-based interfaces, the
user must decompose a task into a sequence of machine-understandable, fine-grained
command operations, then input the commands one by one. As we discussed in Chapter
33
2, non-command user interfaces try to avoid this process and allow the user to directly
interact with tasks without worrying about low-level commands. Freeform UI frees
users from detailed command operations by this perceptual processing of freeform
strokes. For example, Pegasus frees the user from tedious geometric operations such as
rotation and duplication by automatically inferring desired geometric constraints, and
Teddy eliminates the manual positioning of many vertices in 3D space by automatically
constructing 3D geometry from the input stroke. This simplicity also significantly
reduces the effort spent on learning commands. In traditional command-based systems,
the user has to learn many fine-grained editing commands to do something simple. In
Freeform UI, on the other hand, the user can do a variety of things simply after learning
a single operation.
It is important to consider the context surrounding a stroke in addition to the stroke
itself. A single stroke itself contains severely limited information, but human beings
perceive rich information from the spatial relationships among the target stroke and
other strokes in the scene. In Pegasus, the system infers possible geometric constraints
from the spatial relationship among the input stroke and existing line segments. The
path-drawing navigation system calculates the path in a 3D scene by projecting the
input stroke onto the walking surface. In Teddy, the resulting shape is defined by the
current object shape, camera angle, and input stroke.
To make perceptual processing work effectively, it is crucial to restrict an interface to a
specific target domain. Since freeform strokes have limited information and are highly
ambiguous, it is essentially impossible to infer the user’s intention correctly without
assuming a specific task domain. This limits the user’s freedom and reduces the
flexibility of the system in a sense: the user cannot draw freeform drawings in Pegasus
and cannot construct rectiliniear objects in Teddy. However, Freeform UI provides
greater freedom to explore a wider design space within each task domain than is
possible with command-based operations. The serious problem with typical command-
based interfaces is that massive freedom and flexibility overwhelm the users. As a
result, the interaction tends to be a combination of relatively obvious operations and the
user’s activity is constrained by the command set provided by the system. In contrast,
Freeform UI frees the users from having to learn numerous command operations and
lets them explore a large design space within each domain.
In addition to restricting the interface to a specific domain, it is also inevitable to

34
impose certain implicit rules to make the perceptual processing work. The system
recognizes the user’s freeform stroke based on specific predefined rules, but it may go
against the user’s intuition. For example, in Teddy, the extrusion operation consists of
two strokes, but the user may want to extrude the surface using one or three strokes.
The idea of perceptual processing is to design the interface to make the system’s
behavior conform to the intuitive expectations of most users, but it can be
counterintuitive to a specific user. Ultimately, each individual user needs his or her own
perceptual processing scheme to attain a desired result perfectly. Automatic adaptation
or explicit manual customization might be able to mitigate the problem to a certain
extent, but interface designers should be aware of this limitation when implementing
perceptual processing systems. This limitation also implies that the user must learn the
system’s behavior to a certain extent. The learning in Freeform UI is different from
learning in traditional command-based systems in that the system’s behavior varies
depending on each context, and the behavior is difficult to explain in the form of a static
document. It is important to provide appropriate feedback to the user to facilitate
learning by experience.
“Perceptual processing” does not mean a specific algorithm or technology. It is a kind of
design principle for making efficient, intuitive interfaces. A command-based operation
in traditional computer programs corresponds to a single-step operation against an
internal data structure. For example, in 3D modeling systems, a 3D model consists of
vertices, edges and faces; command operations were designed to manipulate these
elements directly. In contrast, perceptual processing encourages the system designers to
reorganize operation primitives so that each operation corresponds to the user’s single
procedure which may consist of multiple internal operations from the system’s point of
view. For example, the extrusion operation of Teddy is a simple procedure from the
user’s point of view, but it actually causes multiple operations, such as vertex deletion,
creation, or replacement, against the internal data structure.
3.2.3. Informal Presentation
The last property of Freeform UI is informal presentation of contents. The system
displays the materials to manipulate or the result of computation in an informal
manner, using sketchy representation without standard, cleaned-up graphics. This
informal presentation is important not only for an aesthetically pleasing appearance,
35
but also to arouse appropriate expectations in the user’s mind about the system’s
functionality. If the system gives feedback in precise, detailed graphics, the user
naturally expects that the result of computation will be precise and detailed. In contrast,
if the system’s feedback is in informal presentation, the user can concentrate on the
general structure of the information without worrying about the details too much. The
importance of informal presentation in exploratory design activities has been discussed
in many papers [12,46,124,156].
Several experimental systems implemented sketchy presentation techniques.
Strothotte et al. introduced a non-photorealistic renderer for an architectural CAD
system [134]. The system used cubic lines for representing straight line segments to
make them appear hand-drawn. The SKETCH system [161] also used non-
photorealistic rendering to give a sketchy appearance to a 3D scene being constructed.
The system intentionally displaced the vertex position when rendering projected 2D line
segments. While these early systems addressed the rendering of silhouette lines and
edges only, more elaborate systems draw shadows and shades using pen-and-ink style
[154]. Teddy uses a real-time pen-and-ink rendering technique developed by Markosian
et al. [80]. It efficiently detects the silhouette lines of a 3D model, and renders the
silhouettes in various styles.
While these systems are designed for 3D graphics, some systems introduced sketchy
rendering for 2D applications. The EtchaPad system [87] used synthesized wiggly lines
for displaying GUI widgets in order to give them an informal look. It used Perlin’s noise
function [105] to create wiggly lines that look hand-written. Other systems employ the
user’s freeform strokes as-is to represent recognized primitives without cleaning up the
drawings. SILK [73] allows the user to interact with the GUI widgets sketched on the
screen. The Electronic Cocktail Napkin system [50] also retains and displays the as-
inked representation of hand-drawn graphical primitives. Pegasus used intentionally
thick line segments to show beautified drawings to give them an informal look.
3.3. Target Domain
The traditional graphical user interface has been predominantly used for almost all
applications running on desktop computational environments. However, as the forms of
computing devices and the purposes of computing get diverse, each application area

36
requires a specific interface paradigm beyond WIMP-style GUI. 3D applications require
3D interfaces, and real world computing applications require special interfaces such as
augmented reality. This section discusses what kinds of applications require Freeform
UI.
First, Freeform UI is an interface for 2D and 3D graphical applications. While some
pen-based interface systems use handwriting characters and gestural commands for
textual applications [18], Freeform UI emphasizes drawing aspects of pen-based
computing. Freeform strokes are associated with specific graphical representations
through perceptual processing, and the resulting graphics are presented in an informal
manner.
Second, Freeform UI is for exploratory, informal activities such as note-taking,
brainstorming, the early stages of design, and real-time communication. This is in
contrast to the fact that traditional graphical user interfaces are suitable for more
production-oriented activities such as desktop publishing and editing presentation
slides. Freeform UI supports exploratory activities by its simple input stream (freeform
strokes) and its informal presentation. However, Freeform UI is not appropriate for
production-orientated applications because the combination of freeform strokes and
perceptual processing has inherent ambiguity.
More specifically, Freeform UI might be useful in the following applications and
situations: sketching on pen-based portable devices in mobile environments, graphical
note-taking on notebook computers in meeting environments, drawing diagrams during
presentations using electronic whiteboards, communicating and collaborating over pen-
based systems, supporting for the early stages of 2D and 3D design activity and novices’
exploring of graphical systems.
Examples of applications not suitable for Freeform UI are object-oriented diagram
editors, such as node-link diagrams, state transition diagrams, structured flow-charts
and binary trees. These diagrams essentially represent symbolic, abstract data
structures rather than some geometric information. In other words, the semantics
behind the diagram are important and not the specific appearance itself. Gesture-based
interfaces may be useful to edit these diagrams quickly, but they are not Freeform UI.
Professional CAD systems are another example application that is not suitable for
Freeform UI. Although Freeform UI is useful in the conceptual design phase, it is too
37
ambiguous and informal to use in the final production stage. In this stage, detailed
precision operation is required and command-based operations are appropriate for it.
Another important question is whether Freeform UI is for novice users or experts. The
answer is that novices and experts both benefit from Freeform UI, but in different ways.
Freeform UI allows novice users to interact with the application without intensive
training. Freeform UI does require first-time users to learn a minimal number of
interaction rules, but the interaction style resembles real pen-and-paper sketching, and
it is much easier than learning many command-based operations. The novice users may
not be able to construct elaborate things at first, but they can do something interesting
soon, which is essential to ensuring that the first-time user can overcome the initial
psychological barrier.
On the other hand, expert users can benefit from Freeform UI because it allows them to
quickly construct rough sketches of the intended final product. Although experts can
control command-based applications fluently, command-based interfaces are too fine-
grained and require multiple complicated steps to get the final result. This is inevitable
in creating a detailed, precise final product, but it is completely undesirable in the early
stages of design. Experts can use Freeform UI initially for quick prototyping, and then
shift to a command-based interface for detailed production.
3.4. Approach
This chapter proposed the concept of Freeform UI. Freeform UI is an attempt to design
next-generation, non-command user interfaces for graphical applications beyond
traditional GUI. We defined Freeform UI according to three basic properties: the use of
pen-based stroking as input, perceptual processing of strokes, and informal
presentation of the result. We then explained exploratory activities in graphical
computing domains as the designated application area for Freeform UI.
The concept itself is essentially a collection of design guidelines for building better
interfaces for pen-based graphical applications, rather than a single, solid idea
representing a specific technology or algorithm. Our approach is to implement
independent example systems for specific application domains based on the concept of
Freeform UI, and analyze the strengths and limitations of the concept based on

38
experiences with these example systems. In this dissertation, we introduce four
example systems based on Freeform UI. Their application domains include geometric
drawing, 3D virtual space navigation, electronic whiteboard, and 3D modeling. Each
system is useful in each application domain, but more importantly, they embody the
idea of Freeform UI as a whole and suggest the future of user interfaces. The following
chapters introduce the four example systems in detail, and Chapter 8 discusses the
strengths and limitations of Freeform UI based on these examples.

39
Chapter 4
Beautification and Prediction for
2D Geometric Drawing
This chapter introduces two novel interaction techniques for rapid geometric design,
interactive beautification and predictive drawing, and a prototype system called
Pegasus. The motivation is to solve the problem with current drawing systems: too
many commands, and unintuitive procedures to satisfy geometrical constraints.
Interactive beautification receives the user's freeform stroke and beautifies it
considering geometrical constraints among segments. A single stroke is beautified at a
time, preventing accumulation of recognition errors or catastrophic deformation. The
system supports geometric constraints such as perpendicularity, congruence, and
symmetry, which were not seen in existing freeform stroke recognition systems. In
addition, the system generates multiple candidates as a result of beautification to solve
the problem of ambiguity. A user study showed that the users can draw the required
diagrams faster and more precisely using the interactive beautification than direct
manipulation techniques. Predictive drawing predicts the user's next drawing operation
based on the spatial relationship among existing segments on the screen. The user can
duplicate, flip, and repeat existing drawings just by clicking intended segments
displayed by the prediction mechanism. Using these techniques, the user can draw
precise diagrams with geometrical relations rapidly without using any editing
commands explicitly.
4.1. Introduction
Commercial Object-Oriented (OO) drawing editors, such as MacDraw and CAD systems,
have various editing commands and special interaction modes. A user can construct a

40
diagram with geometric constraints by combining these commands appropriately. For
example, symmetry can be achieved by the combination of duplication, flipping, and
location adjustment, while perpendicularity can be achieved by duplication and 90
degree rotation. In addition, CAD systems often have special interaction modes such as
a mode for drawing perpendicular lines. However, invoking these commands or
switching to the special editing modes requires additional overhead, and selection of
appropriate commands or interaction modes is difficult, especially for novice users [59].
Figure 13. A diagram drawn on the prototype system Pegasus.
This diagram was drawn without any editing commands such as rotation,
copy, or gridding.
To solve these problems, we propose new interaction techniques for drawing, interactive
beautification [60] and predictive drawing [61]. Interactive beautification is a technique
for rapid construction of geometric diagrams (an example is shown in Figure 13)
without using any editing commands or special interaction modes. Interactive
beautification can be seen as an extension of freeform stroke vectorization [21] and
diagram beautification [104]. It receives a user's freeform stroke and beautifies the
stroke considering various geometric constraints among segments. The intuitiveness of
the technique allows novice users to draw precise diagrams rapidly without any
training.

41
Interactive beautification is characterized by the following three features; 1) stroke by
stroke beautification, 2) automatic inference and satisfaction of higher level geometric
constraints, and 3) generation and selection of multiple candidates as a result of
beautification. These three features work together to achieve rapid and intuitive
drawing, avoiding the problem of ambiguity.
Predictive drawing further enhances interactive beautification by actively predicting
the user’s next drawings based on the spatial relationship among existing segments on
the canvas. When a new segment is added to the screen, the system searches the canvas
for reference segments whose shapes are identical to the new segment. Then, the
system copies the drawings around the reference segments to the vicinity of the newly
drawn segment. This simple prediction mechanism can efficiently support various
drawing patterns such as duplication, flipping, and iteration. The result of prediction is
displayed on the screen in form of multiple candidates, and the user can select desired
one by clicking on it. The user can draw precise diagrams just by continuously clicking
segments shown on the screen as long as the prediction finds appropriate candidates.
Interactive beautification and predictive drawing are currently implemented on a
prototype system named Pegasus (an acronym for “Perceptually Enhanced Geometric
Assistance Satisfies US!”), and user evaluations using it shows promising results. This
chapter introduces interactive beautification and predictive drawing, and describes the
implementation of the prototype system in detail.
The remainder of chapter is organized as follows: the next section describes related
work in diagram drawing on computers. Then, we describe interactive beautification
using several examples, and it’s algorithm detail. A user study performed to confirm the
effectiveness of the technique is described. Next, we describe the user interface and the
algorithm of predictive drawing in detail. We introduce the prototype system Pegasus
and example drawings. Finally, we consider the limitation of our current
implementation and conclude the chapter.
4.2. Related Work
At a glance, the system may seem similar to existing sketch-based interfaces including

42
commercial products such as Apple Newton, GO Penpoint, and freeform stroke drawing
mode in typical drawing editors (SmartSketch, Corel Draw, etc.). These systems convert
freeform strokes into vector segments and satisfy primitive geometric constraints such
as connection. The difference is that interactive beautification considers complex, global
constraints such as parallelism, symmetry, or congruence, which enhances the range of
geometric models. In addition, the generation and selection of multiple candidates
is unseen in the existing systems.
Gesture based systems [3,159,122,73] also employ freeform stroke input, but they
convert input strokes into independent primitives, while interactive beautification
converts them into simple line segments satisfying geometric relations. Gross et al.
pointed out the importance of context in solving the problem of ambiguity [49,50], which
has influenced our idea.
Beautification systems [104,15,71] are basically batch-based, which can lead to
unwanted results because of ambiguity in the user's input. Interactive beautification
prevents such results by interactively presenting multiple candidates and requesting
the user's confirmation.
While interactive beautification systems control the placement of two vertices (start and
end) simultaneously, many existing drawing systems assist the placement of a vertex by
controlling the movement of the mouse cursor. Snap Dragging systems [9,10,44] extends
gravity-active grids by letting users specify various geometric relations, and some
systems such as Rockit[67] and Aldus Intellidraw automatically infer possible gridding
constraints.
Compared to these techniques, the advantages of interactive beautification are as
follows: 1) Freeform stroke drawing is more intuitive and less cumbersome than careful
manipulation of the cursor, especially for a pen-based interface [6]; and 2) The system
can gather more information from a freeform stroke trace than cursor placement. For
example, equality of interval between parallel lines cannot be detected from the
placement of a single vertex.
Rockit is similar to our system in that both automatically infer possible constraints and
provide easy access to alternative possibilities. However, Rockit is suitable for
specification of perpetual spatial relationships among movable objects, while we focus

43
on construction of static line-based illustrations.
Saund et al.'s work [127] shares our motivation, to support natural human perception of
underlying spatial structures, but does not support the construction of precise
diagrams.
Constraint based systems [16,17,53,66,98,136] facilitate the construction of complex
diagrams with many constraints, but require considerable amount of effort to specify
the constraints. Interactive beautification aims at an opposite goal: to reduce the effort
by focusing on relatively simple diagrams.
Prediction mechanisms have been explored in several research efforts [26,83], but their
predictions are mainly based on the regularity found in the operation sequence
(repeated operation, etc.). Our prediction mechanism is different in that we make use of
regularities found in static spatial configurations in a given drawing.
Graphical search and replace [71] and visual rule based system [52] search for diagrams
that match the reference pattern specified by the user, and replace them with the
specific goal pattern. Our predictive drawing works in a similar way, but is unique in
that it performs the search implicitly to assist simple drawing activity.
4.3. Interactive Beautification
4.3.1. User Interface
Basically, interactive beautification is a freeform stroke vectorization system; it receives
a freeform stroke and converts it into a vector segment, inferring and satisfying
geometric constraints.
First, the user draws an approximate shape of his desired segment with a freeform
stroke using a pen or a mouse (Figure 14a). Then, the system infers geometric
constraints the input stroke should satisfy by checking the geometric relationship
among the input stroke and existing segments (Figure 14b). Finally, the system
calculates the placement of the beautified segment by solving the simultaneous
equations of inferred constraints, and displays the result to the user (Figure 14c). In

44
addition, the system generates multiple candidates to deal with the ambiguity of the
freeform stroke (Figure 14d).
Freeform stroke input
a)
Inferred constraints
b)
Beautified segment
c)
d)
PerpendicularityConnectionHorizontal alignment
Multiple candidates
Figure 14. Basic operation of interactive beautification.
The characteristics of interactive beautification are 1) stroke by stroke beautification,
satisfying higher level constraints such as congruence, perpendicularity, or symmetry,
and 2) generation and selection of multiple candidates. We describe the details of the
interaction in the following subsections.
4.3.1.1. Stroke by Stroke Beautification Satisfying Geometric Constraints
This subsection describes how diagrams are constructed using stroke by stroke freeform
stroke beautification, satisfying various geometric constraints. To make it simple, we
assume that the system generates only one candidate as a result of beautification in this
subsection. The next subsection describes the generation of multiple candidates in
detail.

45
a)Connection(to a vertex)
Input Stroke Beautified Segment
b)Connection(to a segment)
c)Parellelism
d)Perpendicularity
e)Alignment
f)Congruence
g)Symmetry
h)IntervalEquality
Figure 15. Supported geometric relations.
Figure 15 shows some examples of supported constraints, input strokes, and beautified
segments & feedback. Figure 15a,b describe the connection constraint. If the user draws
a freeform stroke whose start or end point is located near a vertex of an existing
segment, the system automatically detects the adjacency and connects the point to the
vertex or the body of a segment.
Figure 15c,d illustrate parallelism and perpendicularity constraints. The system
compares the slope of the input stroke and those of existing segments, and if it finds an
existing segment with approximately the same slope, it makes the slope of the
beautified segment identical to the detected slope. Similarly, if the system finds an

46
existing segment approximately perpendicular to the input stroke, it converts the stroke
into a precisely perpendicular segment.
Figure 15e shows vertical and horizontal alignment constraints. When a freeform stroke
is drawn, the system individually checks the x and y coordinates of the vertices of the
input stroke, and makes the coordinates precisely identical to the existing ones if they
are near.
Figure 15f,g illustrate congruence and symmetry constraints. When a new input stroke
is drawn, the system searches for a segment almost congruent to the stroke among the
existing segments. If such a segment is found, the system makes the input stroke
exactly congruent to the segment (Figure 15f). Similarly, the system searches for a
segment that is similar to the vertically or horizontally flipped input stroke. If such a
segment is found, the system makes the input stroke exactly congruent to the flipped
one (Figure 15g).
Figure 15h describes interval equality. This relation is detected by comparing the
interval between the input stroke and an existing line segment parallel to the stroke,
and intervals between existing parallel segments. This mechanism can be used to draw
a pipe with a constant width or to draw cross stripes or grids (Figure 16). Construction
of these diagrams is particularly difficult with menu-based systems, where the user
must copy, rotate, and move the segments.
a) b)
Figure 16. Example use of interval equality among segments.
In actual drawing, the geometric constraints described above are combined and work
together to produce a precise diagram. In Figure 17a, relations such as connection,
perpendicularity, and y-coordinate alignment are simultaneously satisfied. In Figure
17b, interval equality, y-coordinate alignment and flipped congruence (symmetry) work
together to generate the arch (the unnecessary line fragments can be removed easily by
an `erasing' gesture, which is explained later).

47
a)
b)
Figure 17. Construction of a diagram with many constraints
Drawing Process Inferred Constraints
ConnectionSymemtry
ConnectionAlignment
ConnectionCongruence
ConnectionAlignment
ConnectionCongruenceAlignment
Figure 18. Construction of a symmetric diagram.
Figure 18 illustrates how a symmetric diagram is constructed using interactive
beautification. For each input stroke, the system infers appropriate constraints and
48
returns a beautified segment. Notice that, except for the slope sides which constitute
the arrowhead, the symmetry for the rest of the arrow shape is achieved solely by locally
defined relationships (alignment, congruence and connection constraints) without
resorting to some special constraints to achieve global symmetry.
4.3.1.2. Generation and Selection of Multiple Candidates
The inherent difficulty with any freeform stroke recognition system is that a freeform
stroke is ambiguous in nature. The user draws an input stroke with an intended image
in mind, and the system must infer the intended image based on the shape of the
freeform stroke. However, it is not an easy problem to reconstruct the intended image
from the ambiguous input stroke. For example, when the system observes an input
stroke shown in Figure 19a, it is difficult to guess which segment in Figure 19b is the
one the user intended. Existing systems do not consider these multiple possibilities, and
just return a single segment as a result. If the user is not satisfied with the result, he
must draw the stroke again, but the revised stroke may also fail.
To solve the problem, interactive beautification infers all possible candidates and allows
the user to select one among them (Figure 19c). If the user is not satisfied with the
primary candidate, he can select other candidates by tapping on them directly (Figure
19e). During the selection, the system visually indicates what kinds of constraints are
satisfied by the currently selected candidate. Visualized constraints ensure that the
desired constraints are precisely satisfied. In addition, they assist the selection of a
candidate in a cluttered region, where it is difficult to find the desired one. The selection
completes when the user taps outside the candidates or draws the next stroke (Figure
19d,f).

49
a)
c) d)
e) f)
b)
Multiple candidates aregenerated.
Select a candidate bytapping.
Confirm
Confirm(tapping outside)
Multiple possibilities
Existing segment
Primay or currently selected candidate
Multiple candidate
Geometric constraints satisfied by the current candidate
Figure 19. Interaction with multiple candidates.
The user can select a candidate by tapping on it, and satisfied constraints
are visually indicated.
Generation of multiple candidates, together with visualization of the satisfied
constraints, greatly reduces the failure in recognition, and makes it possible to
construct complex diagrams such as Figure 13} using freeform stroke only. Additional
overhead caused by candidate selection is minimized because the user can directly go to
the next stroke without any additional operation when the primary candidate is
satisfactory.
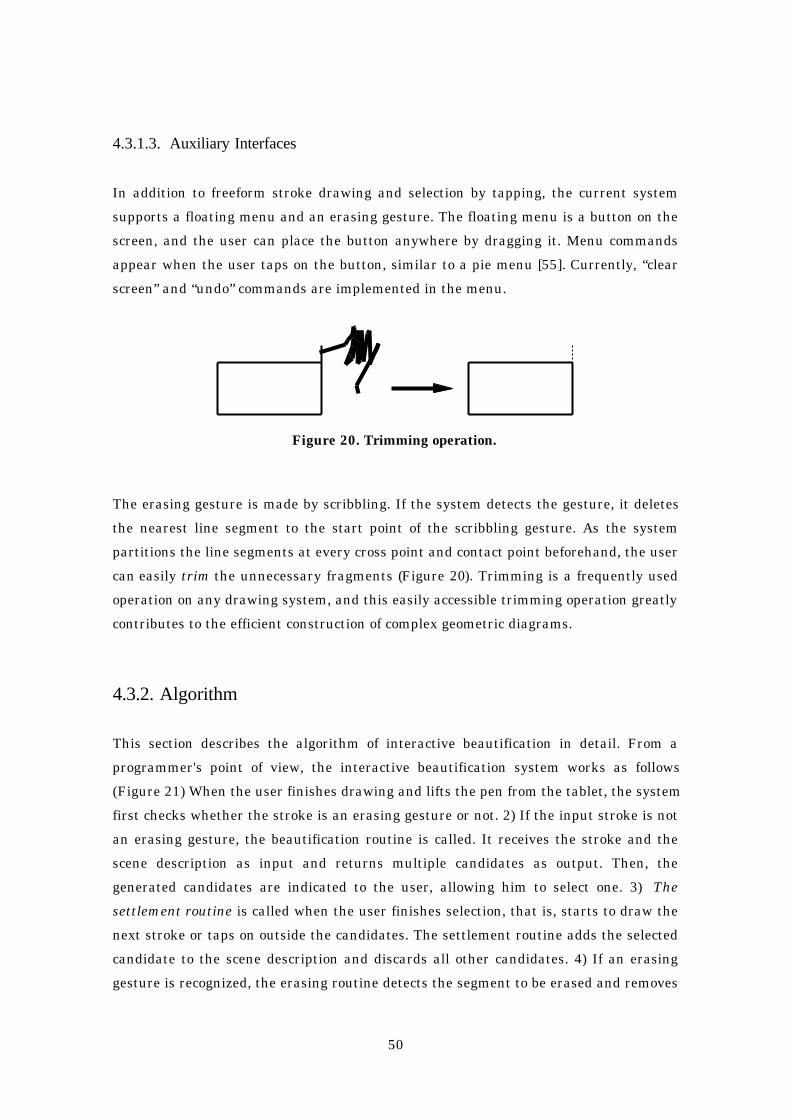
50
4.3.1.3. Auxiliary Interfaces
In addition to freeform stroke drawing and selection by tapping, the current system
supports a floating menu and an erasing gesture. The floating menu is a button on the
screen, and the user can place the button anywhere by dragging it. Menu commands
appear when the user taps on the button, similar to a pie menu [55]. Currently, “clear
screen” and “undo” commands are implemented in the menu.
Figure 20. Trimming operation.
The erasing gesture is made by scribbling. If the system detects the gesture, it deletes
the nearest line segment to the start point of the scribbling gesture. As the system
partitions the line segments at every cross point and contact point beforehand, the user
can easily trim the unnecessary fragments (Figure 20). Trimming is a frequently used
operation on any drawing system, and this easily accessible trimming operation greatly
contributes to the efficient construction of complex geometric diagrams.
4.3.2. Algorithm
This section describes the algorithm of interactive beautification in detail. From a
programmer's point of view, the interactive beautification system works as follows
(Figure 21) When the user finishes drawing and lifts the pen from the tablet, the system
first checks whether the stroke is an erasing gesture or not. 2) If the input stroke is not
an erasing gesture, the beautification routine is called. It receives the stroke and the
scene description as input and returns multiple candidates as output. Then, the
generated candidates are indicated to the user, allowing him to select one. 3) The
settlement routine is called when the user finishes selection, that is, starts to draw the
next stroke or taps on outside the candidates. The settlement routine adds the selected
candidate to the scene description and discards all other candidates. 4) If an erasing
gesture is recognized, the erasing routine detects the segment to be erased and removes

51
the segment from the scene. The settlement routine is called after the erasing routine to
refresh the scene description. The settlement routine also performs some preliminary
calculations to accelerate the beautification process (sorting the vertex coordinates, for
example).
Straight stroke
Scribbling
Generate multiple candidates
Erase a segment
Confirm the selection
Select a candidate
Draw a freeform stroke
Tapping outside ordrawing a new stroke
User action
System action
Legend
Figure 21. Operational model of interactive beautification.
We now describe the algorithm of the beautification routine in detail. The beautification
routine consists of three separate modules (Figure 22). First, a constraint inference
module infers the underlining constraints the input stroke should satisfy. Next, a
constraint solver generates multiple candidates based on the set of inferred constraints.
Finally, an evaluation module evaluates the certainty of generated candidates and
selects a primary candidate. The separation of the constraint inference and the
constraint solving remarkably improves the efficiency of multiple candidates generation,
because the system performs the most time-consuming task of checking all
combinations of segments only once, instead of performing the task for each candidate.

52
Generated Candidates
Ordered Candidates
Segment CoordinatesInput (1,50, 9,51),Exist (0,50,0,52),(10,50,10,52)
(x0=0, x1=10, y0=50, y1=52, y0=y1)
(0,50,10,50),(0,50,10,52)
Constraint inference module
Constraint solver module
Candidate evaluation module
A Set of Inferred Constraints
primary (0,50,10,52),secondary (0,50,10,50)
Figure 22. Structure of the beautification routine.
Constraints are represented as numerical equalities binding four variables (coordinates
of the new segment). The constraint inference module communicates the inferred
geometric relations in a form of numerical equalities, and the constraint solver solves
the simultaneous equations. Figure 23 shows the currently supported geometric
relations and the corresponding numerical equalities.

53
x0 = const y0 = const
x1 = consty1 = const
Alignment (start -x ) x0 = const
Alignment (start -y ) y0 = const
Alignment (end -x )
Alignment (end -y )
x1 = const
y1 = const
Congruence x1 - x0 = consty1 - y0 = const
y1 - y0 = const * ( x1 - x0 )Parallelism ( Perpendicularity)
y0 = const * x0 + const
y1 = const * x1 + const
y0 = const * x0 + consty1 = const * x1 + const
Geometric Relations Corresponding Equalities
Vertical line x0 = x1
Horizontal line y0 = y1
Interval equality
Connection(end point on a vertex)
Connection(start point on a vertex)
Connection(start point on a line)
Connection(end point on a line)
(Symmetry)
Figure 23. Relation between geometric relations and equalities.
4.3.2.1 Constraint Inference module
First, the system searches the table of parameters of all the existing segments, in order
to find values that are `adjacent' to those of the input stroke and generates constraints
that would constrain the parameters of the input stroke variables. To be specific, the
system examines and compares the 5 parameters of the input stroke (x, y coordinates of
start/end vertex, and the slope of the stroke). As a result, constraints to represent
geometric relations such as x and y coordinate alignment, parallelism, and
perpendicularity, are generated. As the parameters of all segments in the scene are
sorted in the settlement routine, the computational complexity of this routine is O(log n)
while n is the number of existing segments. Perpendicular segments are found by
storing 90 degrees rotation of the existing slopes.
54
Next, all the segments in the scene are examined to find various geometric relations
between the existing segments and the input stroke, such as congruence, connection
and symmetry. In addition, to find the equality of intervals among segments, this
routine calculates the interval between the input stroke and each approximately
parallel segment in the scene, and searches for stored intervals that are adjacent. The
computational complexity of this routine is O(n log n).
This two-phased constraint inference process generates a set of constraints to be
satisfied. To reduce unnecessary overhead in constraint solving, the system checks for
duplication whenever a new constraint is created during the inference.
4.3.2.2 Constraint Solver
After the constraint inference, the system calculates the coordinates of the beautified
segment based on the inferred constraints. As the inferred constraints are usually over-
constrained (they cannot be under-constrained because all variables are automatically
bound to the original coordinates of the input stroke), the system searches for all the
possible combinations of inferred constraints to generate multiple candidates.
The constraint solver is a modification of the equality solver of CLP(R)[65] with an
extension to generate multiple candidates from over-constrained equalities. Similar to
the equality solver of CLP(R), the initial state consists of an empty valuation, and the
system tries to apply the constraints one by one to the intermediate valuation. The
difference is that the system maintains a set of valuations instead of a single valuation,
and the new valuation is added to the valuation set without discarding the previous
valuation when a constraint is successfully applied.
Figure 24 shows how the solver works using a simplified example with two variables
and four constraints. First, the solver creates an empty valuation (1), and then, applies
the first constraint (x=1) to the valuation. Naturally, the constraint is successfully
applied and a new valuation is created (1,-)(2). Note that the initial valuation (-,-)
is preserved instead of being replaced by the new valuation (3). When the solver tries to
apply the constraint (x-y=0) to the valuation (1,2), the application fails and no new
valuation is created (4). On the other hand, the constraint can be successfully applied to
the empty valuation (-,-), creating a new valuation with a suspended (delayed)
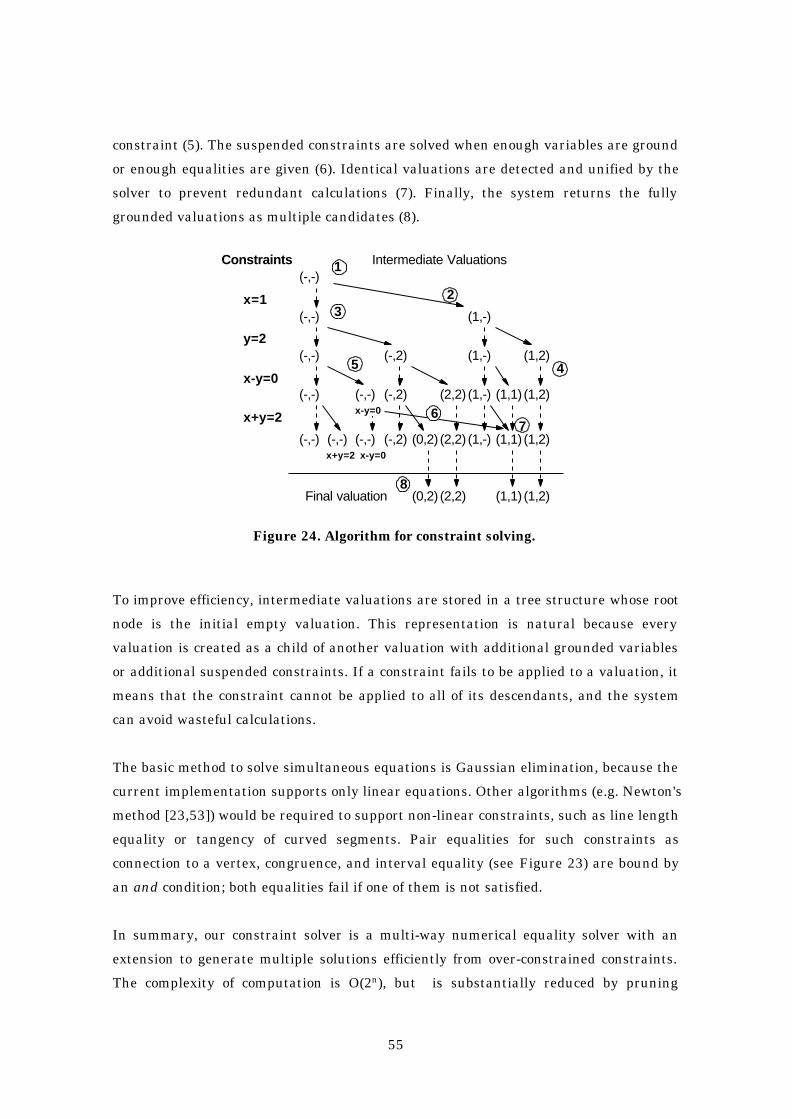
55
constraint (5). The suspended constraints are solved when enough variables are ground
or enough equalities are given (6). Identical valuations are detected and unified by the
solver to prevent redundant calculations (7). Finally, the system returns the fully
grounded valuations as multiple candidates (8).
(-,-)
(1,-)
(-,-) (1,2)
(1,-)
(-,2)
(1,1)(2,2)
(-,-)
(-,-)
(1,-)
(-,2)(-,-) (1,2)
(1,1)(2,2)(-,-) (-,2)(-,-) (1,2)x-y=0
x=1
y=2
x-y=0
x+y=2
(-,-)x+y=2
(0,2) (1,-)
(0,2) (2,2) (1,1) (1,2)
x-y=0
Final valuation
1
23
45
67
8
Constraints Intermediate Valuations
Figure 24. Algorithm for constraint solving.
To improve efficiency, intermediate valuations are stored in a tree structure whose root
node is the initial empty valuation. This representation is natural because every
valuation is created as a child of another valuation with additional grounded variables
or additional suspended constraints. If a constraint fails to be applied to a valuation, it
means that the constraint cannot be applied to all of its descendants, and the system
can avoid wasteful calculations.
The basic method to solve simultaneous equations is Gaussian elimination, because the
current implementation supports only linear equations. Other algorithms (e.g. Newton's
method [23,53]) would be required to support non-linear constraints, such as line length
equality or tangency of curved segments. Pair equalities for such constraints as
connection to a vertex, congruence, and interval equality (see Figure 23) are bound by
an and condition; both equalities fail if one of them is not satisfied.
In summary, our constraint solver is a multi-way numerical equality solver with an
extension to generate multiple solutions efficiently from over-constrained constraints.
The complexity of computation is O(2n), but is substantially reduced by pruning

56
wasteful calculations using a tree structure and unifying identical intermediate
valuations, and has not caused problems in interaction so far in our prototype system.
4.3.2.3 Candidate evaluation module
The evaluation process must follow the solver because it is necessary to consider the
resulting coordinates as well as the satisfied constraints to calculate the certainty of a
candidate. That is, candidates located close to the input stroke should be scored highly,
but the location is unknown until the constraints are solved.
Currently, we use an ad-hoc scoring function to calculate the certainty of candidates
considering type of satisfied constraints and the distance between resulting coordinates
and original input stroke. A candidate with the highest score is selected as a primary
one, and those whose scores are under a specific threshold are discarded.
4.3.3. Evaluation
This section describes an experiment performed to evaluate the interactive
beautification using the prototype system compared to existing drawing systems in
some diagram drawing tasks. We were particularly interested in whether or not
interactive beautification would improve the task performance time (rapidness) and the
completeness of the geometric constraint satisfaction in the diagrams (precision).
4.3.3.1. Method
Systems
The experiment was conducted on a Mitsubishi pen computer AMiTY SP (i486DX4
75MHz, Windows95) [2]. Along with our prototype system, we used a CAD system (Auto
Sketch by AutoDesk Inc.) and an OO-based drawing system (Smart Sketch [131]). The
CAD system is used as a representative for precise geometric design systems, and the
OO-based editor is selected as a representative for easy-to-use rapid drawing editors.

57
Task
Subjects were required to draw three diagrams shown in Figure 25 using the editors.
They were instructed to 1) draw as rapidly as possible, satisfying the required geometric
relations as much as possible, 2) to quit drawing when drawing time exceeds the limit of
5 minutes, and 4) give the completion of drawing priority over the complete constraint
satisfaction, if it appears to be too difficult.
parallelism (b,d)
perpendicularity (a,b)
a
b c
d
connection
symmetry (triangle)
symmetry (horns)
connection (all vertices)
(all vertices)
connection (all vertices)
parallelism (slopes)
parallelism (horizontal lines)
parallelism (a,c)
vertical and horizontal alignment interval equality between the parallel lines
Figure A Figure B Figure C
Figure 25. The diagrams used in the experiment, and required geometric relations.
Subjects
18 student volunteers served as subjects in the experiment. They varied in their
proficiency in using computers and each software. 8 subjects were accustomed to typical
window-based GUIs, but other subjects had little experience with computers.
Procedure
To avoid the effect of learning, the order of editor usage was changed for each subject
in a balanced way. The experiment consisted of 18 (subjects) × 3 (systems) × 3
(diagrams) = 162 diagram drawing sessions in total. Each session lasted less than 5
minutes and they were video-recorded and examined later.
Prior to performing the experiment with each system, each subject was given a brief
explanation of each system and a practice trial. This tutorial session lasted 5 - 10
minutes varying among systems and subjects. The CAD system generally required more

58
tutorial time than the others.
4.3.3.2. Result and discussion
Rapidness
Figure 26 shows the time required for each subject to complete each task. Each column
corresponds to a drawing session of a subject. The order of subjects is sorted by the
drawing time. As the drawing time was limited to 300sec., drawing sessions which
exceeded the limit are indicated as 300sec. The time required with the prototype system
was clearly shorter than with other systems, and all sessions finished within the limit,
while many sessions exceeded the limit with the CAD system and the OO-based
drawing editor.
0
5 0
1 0 0
1 5 0
2 0 0
2 5 0
3 0 0
Tim
e (s
ec.)
0
5 0
1 0 0
1 5 0
2 0 0
2 5 0
3 0 0
Tim
e (s
ec.)
0
5 0
1 0 0
1 5 0
2 0 0
2 5 0
3 0 0
Tim
e (s
ec.)
CAD Pegasus
Fig. A
Fig. B
Fig. C
Draw
Subjects(sorted)
Figure 26. Drawing time required for each task.
Each column corresponds to a drawing session of a subject.
The order of subjects is sorted by the time required.
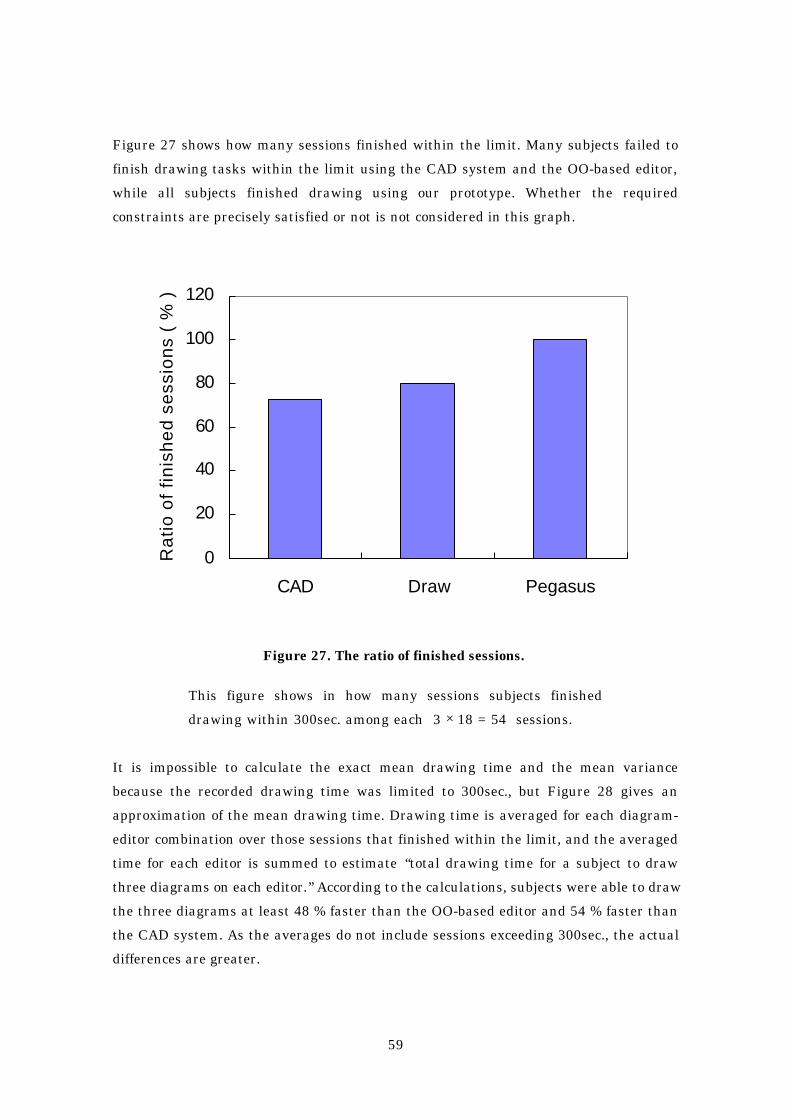
59
Figure 27 shows how many sessions finished within the limit. Many subjects failed to
finish drawing tasks within the limit using the CAD system and the OO-based editor,
while all subjects finished drawing using our prototype. Whether the required
constraints are precisely satisfied or not is not considered in this graph.
0
20
40
60
80
100
120
CAD Draw Pegasus
Rat
io o
f fin
ishe
d se
ssio
ns (
% )
Figure 27. The ratio of finished sessions.
This figure shows in how many sessions subjects finished
drawing within 300sec. among each 3 × 18 = 54 sessions.
It is impossible to calculate the exact mean drawing time and the mean variance
because the recorded drawing time was limited to 300sec., but Figure 28 gives an
approximation of the mean drawing time. Drawing time is averaged for each diagram-
editor combination over those sessions that finished within the limit, and the averaged
time for each editor is summed to estimate “total drawing time for a subject to draw
three diagrams on each editor.” According to the calculations, subjects were able to draw
the three diagrams at least 48 % faster than the OO-based editor and 54 % faster than
the CAD system. As the averages do not include sessions exceeding 300sec., the actual
differences are greater.
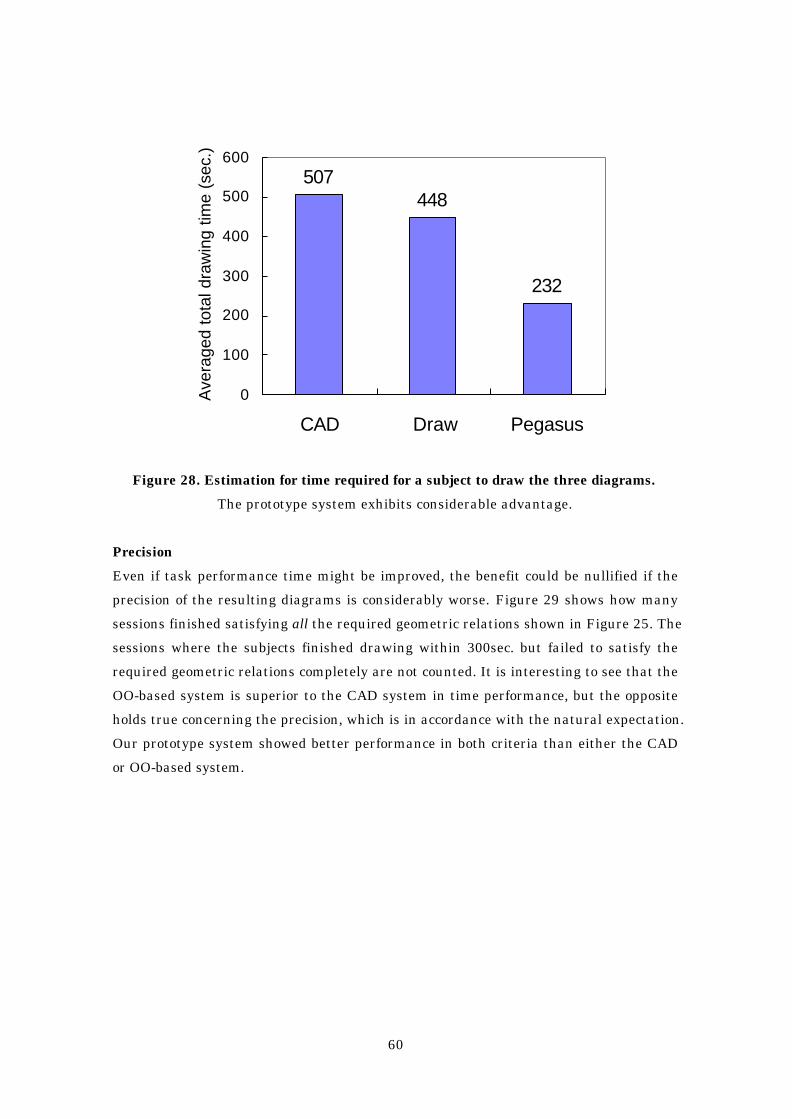
60
507448
232
0
100
200
300
400
500
600
CAD Draw Pegasus
Ave
rage
d to
tal d
raw
ing
time
(sec
.)
Figure 28. Estimation for time required for a subject to draw the three diagrams.
The prototype system exhibits considerable advantage.
Precision
Even if task performance time might be improved, the benefit could be nullified if the
precision of the resulting diagrams is considerably worse. Figure 29 shows how many
sessions finished satisfying all the required geometric relations shown in Figure 25. The
sessions where the subjects finished drawing within 300sec. but failed to satisfy the
required geometric relations completely are not counted. It is interesting to see that the
OO-based system is superior to the CAD system in time performance, but the opposite
holds true concerning the precision, which is in accordance with the natural expectation.
Our prototype system showed better performance in both criteria than either the CAD
or OO-based system.

61
0102030405060708090
100
CAD Draw Pegasus
Rat
io o
f pre
fect
dra
win
gs (
% )
Figure 29. The ratio of diagrams where required constraints are perfectly satisfied.
This graph shows in how many sessions subjects successfully satisfied all
the required geometric constraints among each 3 × 18 = 54 sessions.
We must note, however, that this experiment is still a preliminary evaluation. Many
important aspects of diagram drawing are not accounted for, such as line pattern
variation, scaling, rotation. Curves, circles, and text did not appear in the diagrams.
Also, various kinds of diagrams must be considered, such as node-link diagrams,
informal illustrations and complex mechanical diagrams. In spite of these limitations,
this preliminary experiment clearly shows a promising potential of the interactive
beautification system, particularly its significant advantage in rapid and precise
construction of simple geometric diagrams. Time performance and constraint
satisfaction rate were considerably improved, even though interactive beautification is
rather new for the subjects compared with other systems.
4.4. Predictive Drawing
Geometric illustrations often contain numerous identical local configurations.
Duplicate command is used in existing drawing editors to generate identical
configurations. By contrast, by using interactive beautification, duplication is implicitly
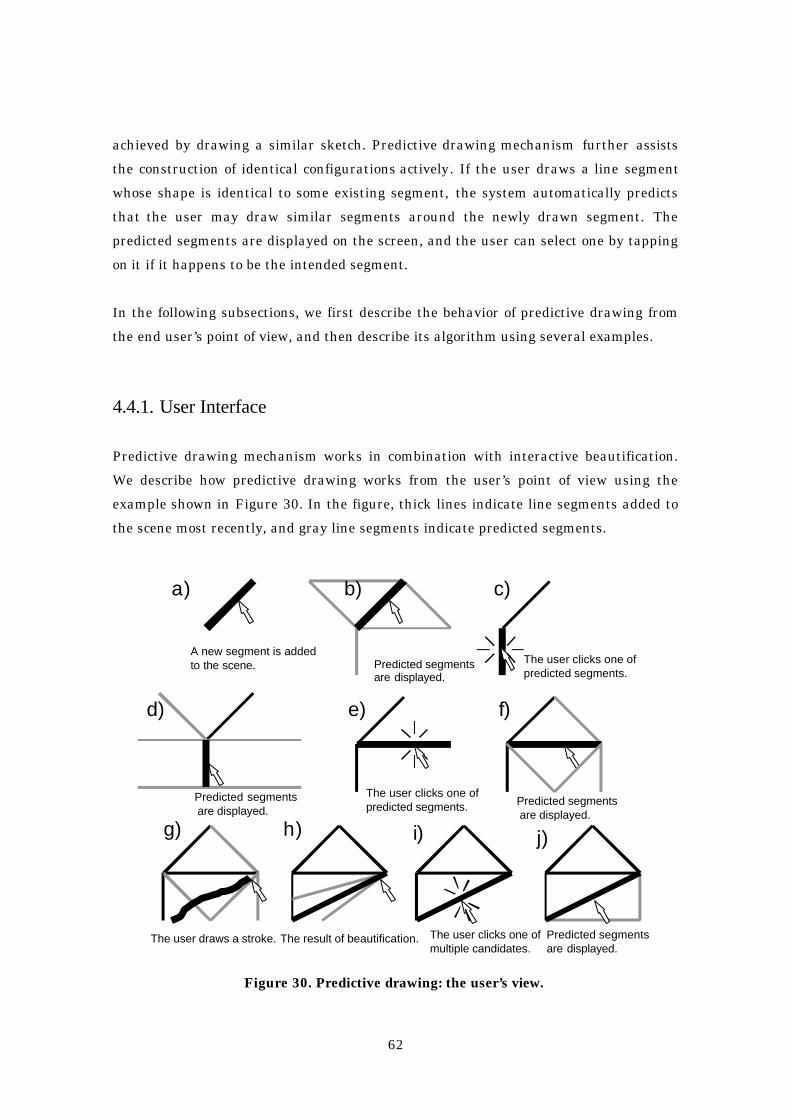
62
achieved by drawing a similar sketch. Predictive drawing mechanism further assists
the construction of identical configurations actively. If the user draws a line segment
whose shape is identical to some existing segment, the system automatically predicts
that the user may draw similar segments around the newly drawn segment. The
predicted segments are displayed on the screen, and the user can select one by tapping
on it if it happens to be the intended segment.
In the following subsections, we first describe the behavior of predictive drawing from
the end user’s point of view, and then describe its algorithm using several examples.
4.4.1. User Interface
Predictive drawing mechanism works in combination with interactive beautification.
We describe how predictive drawing works from the user’s point of view using the
example shown in Figure 30. In the figure, thick lines indicate line segments added to
the scene most recently, and gray line segments indicate predicted segments.
A new segment is addedto the scene. Predicted segments
are displayed.
The user clicks one ofpredicted segments.
The user draws a stroke. The result of beautification. The user clicks one ofmultiple candidates.
a) b) c)
d) e) f)
g) h) i) j)
The user clicks one ofpredicted segments. Predicted segments
are displayed.
Predicted segments are displayed.
Predicted segmentsare displayed.
Figure 30. Predictive drawing: the user’s view.
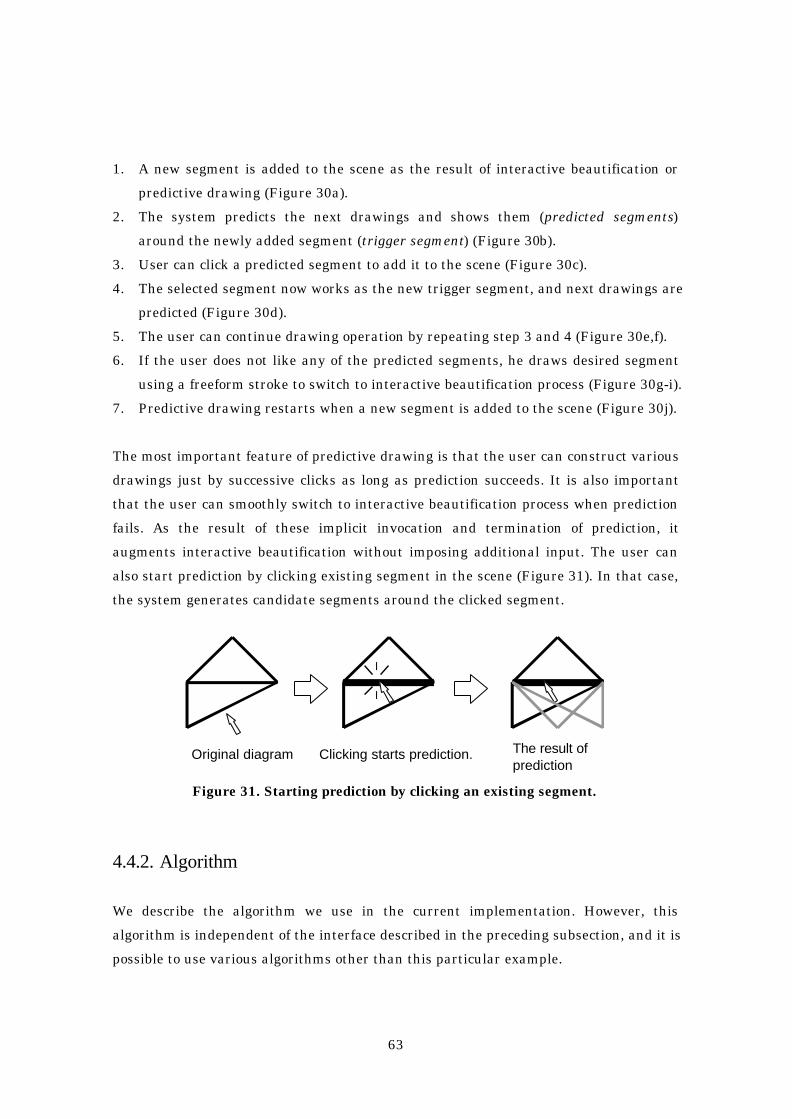
63
1. A new segment is added to the scene as the result of interactive beautification or
predictive drawing (Figure 30a).
2. The system predicts the next drawings and shows them (predicted segments)
around the newly added segment (trigger segment) (Figure 30b).
3. User can click a predicted segment to add it to the scene (Figure 30c).
4. The selected segment now works as the new trigger segment, and next drawings are
predicted (Figure 30d).
5. The user can continue drawing operation by repeating step 3 and 4 (Figure 30e,f).
6. If the user does not like any of the predicted segments, he draws desired segment
using a freeform stroke to switch to interactive beautification process (Figure 30g-i).
7. Predictive drawing restarts when a new segment is added to the scene (Figure 30j).
The most important feature of predictive drawing is that the user can construct various
drawings just by successive clicks as long as prediction succeeds. It is also important
that the user can smoothly switch to interactive beautification process when prediction
fails. As the result of these implicit invocation and termination of prediction, it
augments interactive beautification without imposing additional input. The user can
also start prediction by clicking existing segment in the scene (Figure 31). In that case,
the system generates candidate segments around the clicked segment.
Original diagram Clicking starts prediction. The result ofprediction
Figure 31. Starting prediction by clicking an existing segment.
4.4.2. Algorithm
We describe the algorithm we use in the current implementation. However, this
algorithm is independent of the interface described in the preceding subsection, and it is
possible to use various algorithms other than this particular example.

64
This algorithm is based on the following simple idea: when the user draws a new
segment that is identical to a part of some existing diagram, he may want to draw
similar diagrams around the new segment. Specifically, the algorithm works as follows
(Figure 32)
1. When a new segment (trigger segment)(g) is added to the scene, the system
searches for the existing segments (reference segments)(a) whose length and angle
are identical to the trigger segment.
2. The system records the spatial relationships among the reference segments and the
segments (context segments)(b,c,d) directly connected to the reference segments.
3. The system generates predicted segments(h,i,j) around the trigger segment in such
a way that the relation between each predicted segment and the trigger segment is
identical to that of the context segment and the reference segment.
4. The user clicks a predicted segment (j). i and n is generated because j is identical to
d. k,l,m are generated because j is identical to d.
1)
2)
a bc
d ef
g h
ij
j
ik
l
m n
a bc
efd
Figure 32. The algorithm of predictive drawing.
In this way, the user can duplicate an independent diagram, and can draw repetitive
diagrams by successive clicking.
In addition, the system automatically supports the construction of symmetric diagrams
and rotated diagrams by adding flipped and rotated segments to the reference segments
(Figure 33). e and f are predicted because d is horizontally symmetric to a . h and g are
predicted because d is vertically symmetric to a . j,k,l, and m are predicted because i is

65
±90-degree rotation of a . p and q are predicted because n is identical to a, while r and q
are predicted because n is 180-degree rotation of a .
a b
c
de
f
g
h
Flip
90 degrees rotation
no
p
r
180degreesrotation
qi
m
l
k
j
Figure 33. Extension to the basic prediction.
It is also possible to use the newly added segment (target segment) itself as a reference
segment (Figure 34). In this case, It is not necessary that reference segments exist in
the scene beforehand.
1) 2) 3)
1) 2) 3)
Existing segment
A new segmentis added.
Predicted segments(self reference)
Figure 34. Prediction based on self reference.
In the actual drawing process, multiple segments in the scene matches as reference
segments, and many candidate segments are generated as predicted segments. Figure
35 shows how the user draws repetitive diagram and symmetric diagram using this
prediction mechanism.

66
1) 2) 3) 4)
1) 2) 3) 4)
Newly added segmentExisting segment
Predicted segment
Figure 35. Construction of various diagram using prediction.
4.5. Prototype System Pegasus
The prototype system, Pegasus, was first developed under Microsoft Visual Basic and
Visual C++ on Windows 95. The user interface part of the code that manages the input
operations and visual feedback was written in Visual Basic for ease of implementation
and frequent revision. The beautification routine was written in Visual C++ in order to
accelerate the most time consuming process. Recently, we ported the entire program to
Java™ to add miscellaneous features such as zooming, and opened it to the public as a
Java applet at www.mtl.t.u-tokyo.ac.jp/~takeo/java/pegasus/pegasus.html.
Pegasus can work on any computing environment that supports Java 1.1. However, as
Pegasus is basically designed for pen-based input, Pegasus is developed and tested
mainly on portable pen computers (Mitsubishi AMiTY SP) and pen-based electronic
blackboard system (Xerox Liveboard). As pen-based freeform stroke input and mouse
based freeform stroke have considerably different characteristics, the preprocessor of
the recognition algorithm needs to be tuned to some degree to be used with mouse based
input.
We show some of pictures that have been produced with Pegasus. Figure 36 implies the
usage of the technique in classrooms. Menu-based operations have prevented the use of
precise diagrams on electronic whiteboard systems during verbal communication, but
the simplicity of interactive beautification may encourage the use of more precise
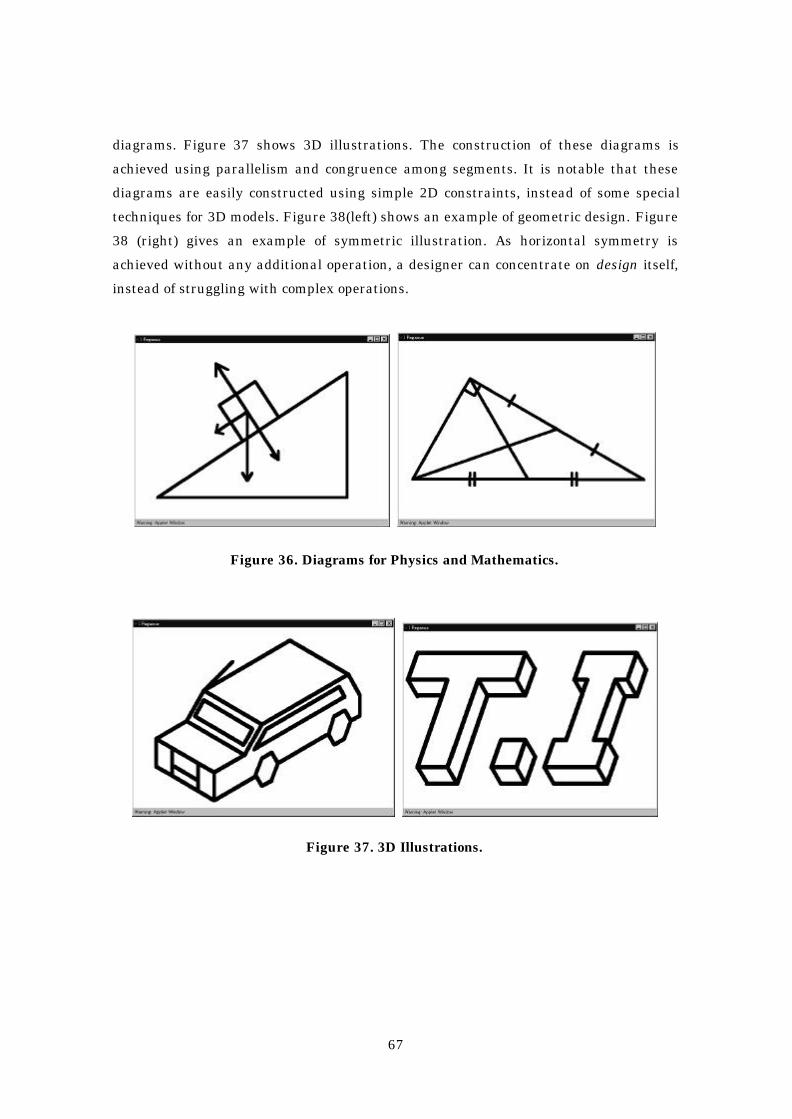
67
diagrams. Figure 37 shows 3D illustrations. The construction of these diagrams is
achieved using parallelism and congruence among segments. It is notable that these
diagrams are easily constructed using simple 2D constraints, instead of some special
techniques for 3D models. Figure 38(left) shows an example of geometric design. Figure
38 (right) gives an example of symmetric illustration. As horizontal symmetry is
achieved without any additional operation, a designer can concentrate on design itself,
instead of struggling with complex operations.
Figure 36. Diagrams for Physics and Mathematics.
Figure 37. 3D Illustrations.
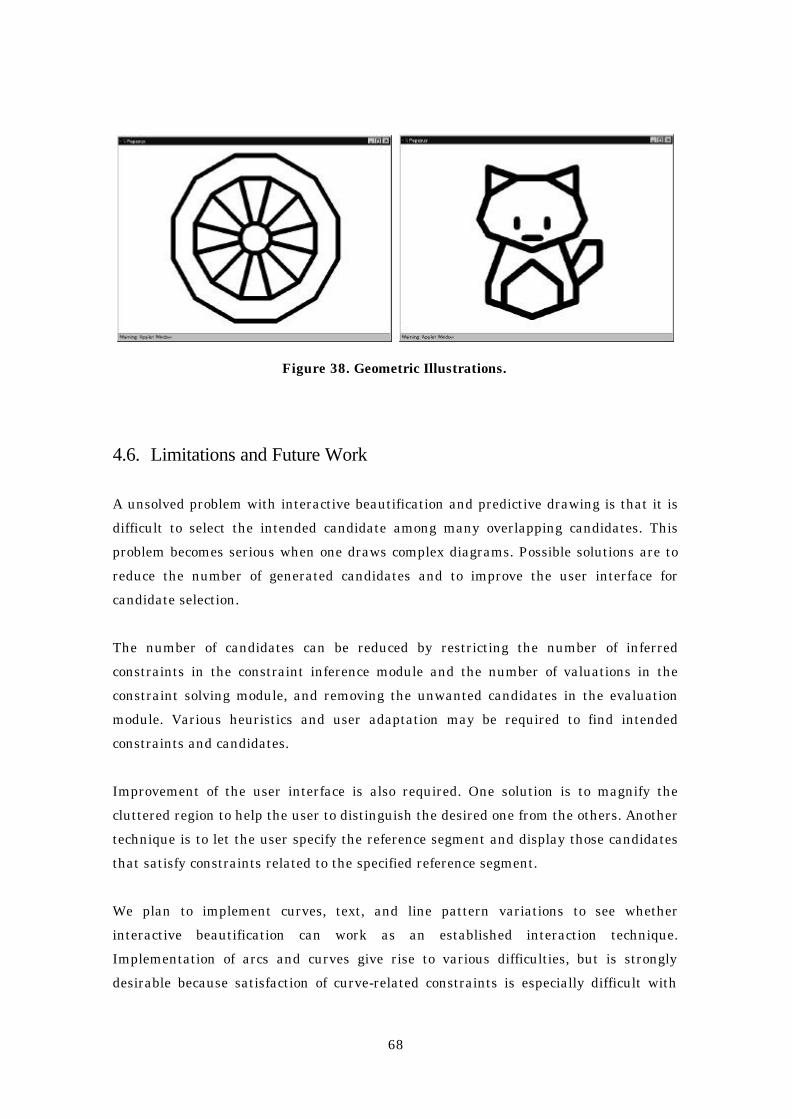
68
Figure 38. Geometric Illustrations.
4.6. Limitations and Future Work
A unsolved problem with interactive beautification and predictive drawing is that it is
difficult to select the intended candidate among many overlapping candidates. This
problem becomes serious when one draws complex diagrams. Possible solutions are to
reduce the number of generated candidates and to improve the user interface for
candidate selection.
The number of candidates can be reduced by restricting the number of inferred
constraints in the constraint inference module and the number of valuations in the
constraint solving module, and removing the unwanted candidates in the evaluation
module. Various heuristics and user adaptation may be required to find intended
constraints and candidates.
Improvement of the user interface is also required. One solution is to magnify the
cluttered region to help the user to distinguish the desired one from the others. Another
technique is to let the user specify the reference segment and display those candidates
that satisfy constraints related to the specified reference segment.
We plan to implement curves, text, and line pattern variations to see whether
interactive beautification can work as an established interaction technique.
Implementation of arcs and curves give rise to various difficulties, but is strongly
desirable because satisfaction of curve-related constraints is especially difficult with

69
conventional menu based editors.
We would like to perform more user studies to answer various questions: what kinds of
constraints are required for rapid geometric design, how fast users can master the
effective use of the technique, and to what extent the generation of multiple candidates
facilitates the interaction, etc.
Integration of interactive beautification into 3D scene construction systems such as
[161] is also being considered. The most challenging issue may be how to display half-
constructed 3D models and multiple candidates without confusing the user.
4.7. Conclusion
We have proposed interactive beautification and predictive drawing, techniques for
rapid geometric design. Interactive beautification receives a freeform stroke and
converts it into a precise segment. The technique is characterized by stroke-by-stroke
beautification, recognition of global geometric constraints, and generation and selection
of multiple candidates. Predictive drawing predicts the user’s next drawings
automatically based on the spatial relationship among the segments on the canvas.
These techniques support precise geometric design preserving considerable dexterity.
Our prototype system, Pegasus, is implemented on pen computers, and user evaluations
showed promising results.
This technique can be used for geometric modeling on traditional CAD systems, but
more informal, simple drawing using pen-based input seems to be the most promising
target. To be specific, interactive beautification and predictive drawing appear to be an
ideal technique for note-taking on pen-based PDA systems and graphical explanation on
electronic whiteboards during meeting or in classrooms. Finally, these techniques can
be used to support creative design processes [72], which has been done with traditional
pen and paper rather than on computers because of complex operations.
70
Chapter 5
Path-drawing for Virtual Space Navigation
This chapter introduces an interaction technique for walkthrough in virtual 3D spaces,
where the user draws the intended path directly on the scene, and the avatar
automatically moves along the path. The system calculates the path by projecting the
stroke drawn on the screen to the walking surface in the 3D world. Using this technique,
the user can specify not only the goal position, but also the route to take and the camera
direction at the goal with a single stroke. A prototype system is tested using a display-
integrated tablet, and experimental results suggest that the technique can enhance
existing walkthrough techniques.
5.1. Introduction
Efficient 3D navigation techniques are required to meet the increasing popularity of
virtual spaces. Existing walkthrough techniques can be divided into roughly two
categories. One is driving, where the user continuously changes the camera position
using advancing and turning buttons (arrow keys, joysticks, or button widgets on the
screen). The other is flying, where the camera automatically jumps to the goal position
that the user had specified using a pointing device [78]. Driving is commonly used for
computer games, but can cause unwanted overhead when the walking is not the
primary purpose of the interaction, because the user has to continuously press buttons
during the movement. This problem gets serious especially when the rendering speed is
slow, which is often the case with current desktop VR on PCs. Flying provides a solution
to the problem, freeing the user from continuous control. All the user has to do is to click
the target, then he can arrive at the target position instantly. However, flying suffers
from its limited expressive power. The user cannot specify which route to take during

71
the movement, nor can he control the orientation of the camera directly.
5.2. Path drawing for 3D walkthrough
We propose a path drawing technique [62] for 3D space navigation, which is an
extension of the flying technique. It allows the user to draw the desired walkthrough
path directly on the screen using a free stroke. Then, the system automatically
calculates the moving path in the 3D world by projecting the stroke onto the walking
surface, and presents the movement of the avatar and the camera in an animated
manner. The avatar’s direction is fixed to the tangent of the projected stroke. The user
can draw a new stroke during the movement to modify the path, which is important
because the far end of a stroke can easily get out of control. Figure 39 illustrates an
example of path drawing navigation.
The user can draw either a long stroke specifying the detailed intermediate route to
follow, or just a short stroke near the goal position. Long strokes are useful when the
user is interested in how to get to the target position, while the user can conveniently
specify the goal position and camera direction at once using short strokes. The user can
also turn at the current position by drawing a short stroke at his foot in the intended
direction.
Figure 39. An example of path drawing walkthrough.
The user draws the desired path directly on the screen (left), and the avatar and camera
move along the projected path (right).
This technique can work more effectively when the system is given a detailed structure

72
of the virtual space. For example, it is possible to achieve the automatic avoidance of
obstacles when the direct projection of the user’s stroke intersects the obstacles
[108,158]. Climbing slopes and going through a gate can be detected by checking the
polygon connectivity along the projected path (Figure 39).
A prototype system is developed using Inventor 2.1 on SGI graphics workstations.
Automatic obstacle avoidance, slope climbing, and gate through are implemented and
tested. However, these additional functions are turned off during the following
evaluation.
5.3. Evaluation
5.3.1. Task
An experiment is performed to clarify the characteristics of path drawing against
driving and flying techniques. Twelve subjects (computer science researchers)
participate the study. Their expertise in 3D interaction is varied. Subjects are
instructed to get to the specified goal as rapidly as possible, navigating through a
virtual space while avoiding obstacles. Figure 40 shows the map of we used in the study.
During the navigation, the camera is fixed just behind the avatar (Figure 41), and the
avatar stops when it collides with an obstacle while traversing.
Figure 40. The world map used in the experiment.
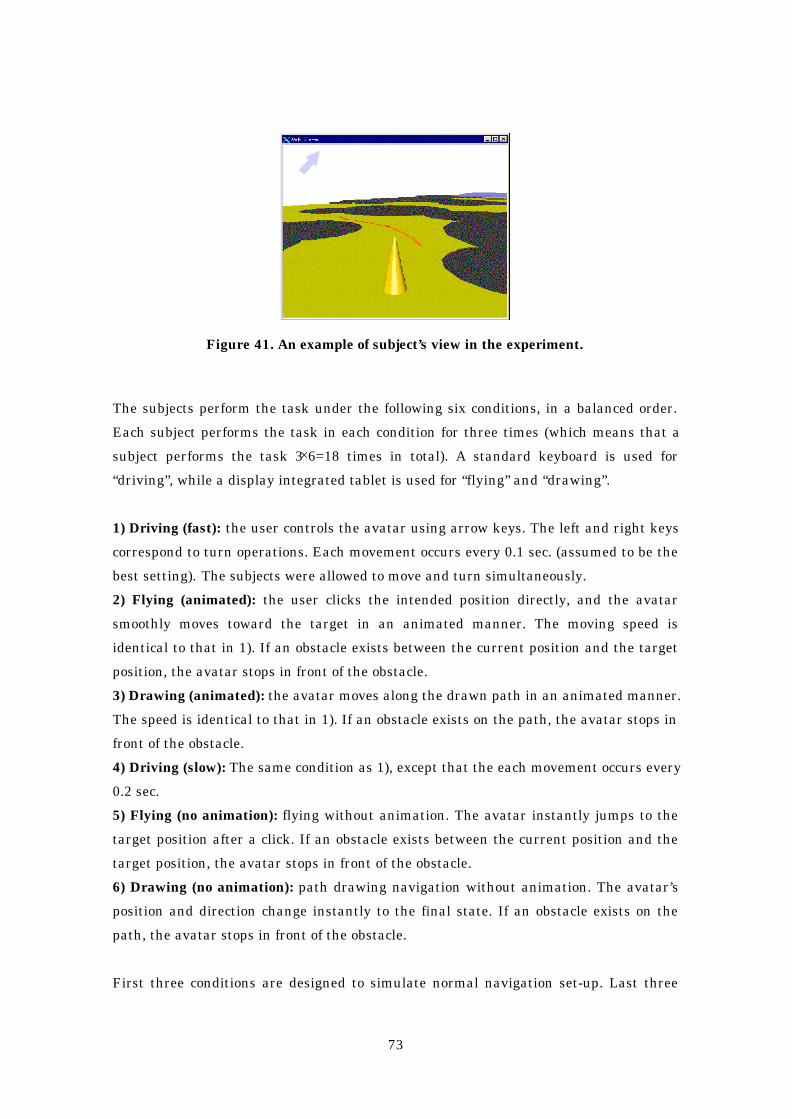
73
Figure 41. An example of subject’s view in the experiment.
The subjects perform the task under the following six conditions, in a balanced order.
Each subject performs the task in each condition for three times (which means that a
subject performs the task 3×6=18 times in total). A standard keyboard is used for
“driving”, while a display integrated tablet is used for “flying” and “drawing”.
1) Driving (fast): the user controls the avatar using arrow keys. The left and right keys
correspond to turn operations. Each movement occurs every 0.1 sec. (assumed to be the
best setting). The subjects were allowed to move and turn simultaneously.
2) Flying (animated): the user clicks the intended position directly, and the avatar
smoothly moves toward the target in an animated manner. The moving speed is
identical to that in 1). If an obstacle exists between the current position and the target
position, the avatar stops in front of the obstacle.
3) Drawing (animated): the avatar moves along the drawn path in an animated manner.
The speed is identical to that in 1). If an obstacle exists on the path, the avatar stops in
front of the obstacle.
4) Driving (slow): The same condition as 1), except that the each movement occurs every
0.2 sec.
5) Flying (no animation): flying without animation. The avatar instantly jumps to the
target position after a click. If an obstacle exists between the current position and the
target position, the avatar stops in front of the obstacle.
6) Drawing (no animation): path drawing navigation without animation. The avatar’s
position and direction change instantly to the final state. If an obstacle exists on the
path, the avatar stops in front of the obstacle.
First three conditions are designed to simulate normal navigation set-up. Last three

74
conditions are designed to simulate special condition where the screen rendering speed
is extremely low because of poor computer performance or slow network connection. In
this condition, driving technique requires constant control throughout the slow
movement, which is significantly frustrating. Flying and drawing techniques use
alternative “instant jump” technique to achieve efficient move in this condition.
5.3.2. Result
Figure 42 shows the averaged elapsed time to get to the goal. A subject performed the
task three times each, and the fastest among the three was selected and averaged.
Among the first three conditions, driving is the fastest and drawing is the slowest
(statistically significant (p<0.05)). Among the last three conditions, flying and drawing
are significantly faster than driving (p<0.05). There is no significant difference in flying
and drawing.
05
10152025303540
45
drive-fast
fly-slow
draw-slow
Averaged time (sec)
drive-slow
draw-fast
fly-fast
Standard deviation
Figure 42. Averaged time to get to the goal.
Figure 43 shows the users’ subjective evaluation of each technique. Subjects gave relative
scores ranging from 1 to 5 depending on the extent they like each technique as a general
navigation technique. Drawing exhibits the highest scores in both fast and slow
condition. Flaying technique in slow condition gets the lowest score.
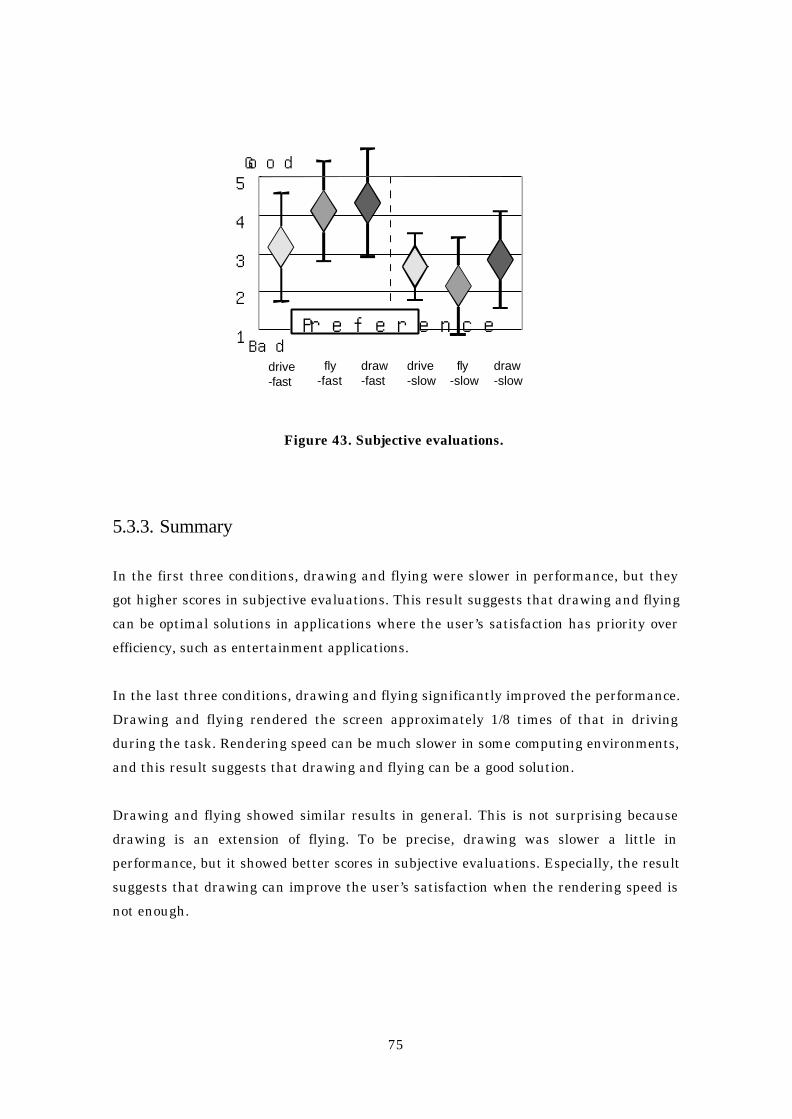
75
1
2
3
4
5
Preference
Good
Baddrive-fast
fly-slow
draw-slow
drive-slow
draw-fast
fly-fast
Figure 43. Subjective evaluations.
5.3.3. Summary
In the first three conditions, drawing and flying were slower in performance, but they
got higher scores in subjective evaluations. This result suggests that drawing and flying
can be optimal solutions in applications where the user’s satisfaction has priority over
efficiency, such as entertainment applications.
In the last three conditions, drawing and flying significantly improved the performance.
Drawing and flying rendered the screen approximately 1/8 times of that in driving
during the task. Rendering speed can be much slower in some computing environments,
and this result suggests that drawing and flying can be a good solution.
Drawing and flying showed similar results in general. This is not surprising because
drawing is an extension of flying. To be precise, drawing was slower a little in
performance, but it showed better scores in subjective evaluations. Especially, the result
suggests that drawing can improve the user’s satisfaction when the rendering speed is
not enough.
76
5.4. Discussion
Path drawing can be used with any pointing device, but is most suitable for a pen-based
or touch panel system. It is also possible to use this technique in immersive VR
environments with HMD and data gloves, where the user draws the path using the
finger [40,109].
A limitation of path drawing is that it cannot be directly applied to completely free 3D
movements (not constrained to a walking surface). However, path drawing is expected
to be applicable to most applications because human activity in real world is
constrained on 2D walking surface. A surface with small ups and downs or stairs can be
handled by path drawing technique without any additional complications.
Another limitation is that the avatar must be present on the screen in order for a path
to be drawn at the avatar’s feet. However, this problem may not be so serious because
path drawing can naturally coexist with flying and driving in real applications. The
user can press arrow buttons or keys to move to a near target.
5.5. Conclusions and future work
We presented a technique for 3D virtual space walkthrough, in which the user specifies
the intended path by drawing a free stroke on a virtual walking surface on the screen.
This technique is superior to conventional driving in that the user does not have to
continuously control the movement, and enhances flying by letting the user specify the
route and direction at once. Experimental results show that the technique can be a good
alternative at least for some users, improving subjective evaluation while maintaining a
comparable operation speed.
Path drawing navigation is useful especially when the rendering speed is low or the
communication delay is large, because the user can give detailed instructions to the
computer at once, and the system can take time to perform time-consuming operations.
We plan to apply this technique to remote robot control and wheelchair navigation [136],
where the user draws strokes on camera images

77
Chapter 6
Stroke-based Architecture for Electronic Whiteboards
This chapter describes the software architecture for our pen-based electronic
whiteboard system, called Flatland. The design goal of Flatland is to support various
activities on personal office whiteboards, while maintaining the outstanding ease of use
and informal appearance of conventional whiteboards. The GUI framework of existing
window systems is too complicated and heavy-weight to achieve this goal, and so we
designed a new architecture that works as a kind of window system for pen-based
applications. Our architecture is characterized by its use of freeform strokes as the
basic primitive for both input and output, flexible screen space segmentation, pluggable
applications that can operate on each segment, and built-in history management
mechanisms. This architecture is carefully designed to achieve simple, unified coding
and high extensibility, which was essential to the iterative prototyping of the Flatland
interface. While the current implementation is optimized for large office whiteboards,
this architecture is useful for the implementation of a range of various pen-based
systems.
6.1. Introduction
Office whiteboards are one of the most common tools in a personal working environment.
People use whiteboards to take notes, organize to do lists, sketch paper outlines, and as
a communication medium for discussions with office mates. In general, people use office
white boards for informal, unstructured activities in contrast to well-organized
activities on desktop computers [94].
Based on our observations, we are currently developing a computationally augmented

78
office whiteboard, called Flatland (Figure 44) [95]. Our research goal is to provide
computational support such as storage, calculation, networking, and diagram
beautification, while preserving the physical whiteboard’s lightweight interaction style
and informal appearance. We envision that these enhanced whiteboards will support
informal activities that are difficult on current desktop computers. Our current
hardware configuration is a touch sensitive large board (SMART Board [130]) and a
LCD projector.
Figure 44. Flatland example.
In this chapter, we introduce the user interface and implementation of Flatland in
detail. We introduce our new software architecture to support various stroke-based
operations, and describe how our example applications are implemented on the
architecture. This architecture can be seen as a variant of Kramer’s representation-
based architecture [70]. While the current implementation is optimized for electronic
whiteboard systems with large physical surfaces, our architecture is applicable to
various pen-based systems such as small hand held PDAs, display-integrated tablet
systems, and huge wall size interfaces.
The software architecture we present is analogous to a pen version of GUI-based
window system for desktop computers. Both divide the screen into several regions
(windows in standard window systems and segments in Flatland) to provide
independent workplaces. Both have mechanisms to support task specific activities
within the region (applications and behaviors). The difference is that our target is
informal, pre-production activities while existing window systems are designed for

79
well-structured, goal-oriented activities. To be specific, we observed the following design
requirements, which led us to our unique architecture.
First, the user’s input must be simple, and the system’s output should be informal to
encourage lightweight interaction. Standard window systems support a variety of
operations such as typing, clicking and dragging, but these are too complicated for
informal interaction. Likewise, their rectilinear widgets and printed text discourage
pre-production activities. In order to provide the appropriate look and feel of real
whiteboards, Flatland uses a unified notion of “strokes” for input and output. The user
input is always in the form of handwritten strokes, and system feedback is given as a
set of “handwriting style” strokes.
Second, informal activities on a whiteboard are dynamic: the structure of the drawings
on the board can change over time, and each drawing can serve different purposes
depending on the situation. This is quite different from well-organized, goal-oriented
activities on desktop computers, and the traditional notion of static windows and
applications turned out to be inappropriate. This observation led to two important
design decisions: dynamic segmenting and pluggable behaviors.
Users do not have to decide on the organization of their board before they start working.
They can simply pick up a pen and begin writing. The system will use heuristics to try
to group strokes into segments as needed, and users can flexibly override the system’s
behavior by joining and splitting segments as desired. Likewise, behaviors—code that
supports the semantics of a particular domain or application—can be flexibly attached
to or removed from the segment on the fly. So a user can write a “to do” list on the board
and then later apply a behavior to cause the strokes to begin to “act like” a to do list.
Other behaviors could be applied to the same strokes over the lifetime of the segment.
This flexible relationship is quite different from static, persistent relationship between
windows and applications in standard window systems.
Finally, drawings on whiteboards can persist for a significantly long time and can be
continuously changing. Additionally, each “chunk” of information on a board can be
significantly small compared with a document in a desktop environment. Traditional
file based open-edit-close style document management causes too much overhead to
maintain this fine grained, ever-changing information. So instead, Flatland is equipped
with automatic backup mechanisms and allows the user to recover the drawing at any
80
time in the past. This history maintenance mechanism actually records every event
occurring on the board, and thus influenced the design of entire architecture.
The rest of the paper is organized as follows. After discussing related work, we briefly
introduce how Flatland works from the user’s point of view. Then we describe the
overall architecture of the system in detail. Finally, we briefly note some
implementation issues, and discuss limitations and implications of our architecture.
6.2. Related Work
This work is closely related to Kramer’s seminal work on dynamic interpretations
[69,70]. He introduced the idea of dynamic association between representation and
internal data structure in the context of electronic whiteboards. He allowed the user to
apply different interpretations (applications) to the same marks (freeform strokes on
the screen). His goal was to capture the ambiguous nature of design activities.
We share basic ideas and research goals with him. The contribution of our work is to
extend and complement his work. While he established the framework for the
representation-centered architecture, we address various implementation issues with
more details and introduce a variety of example applications. To be specific, we discuss
how a stroke-oriented architecture enables flexible screen real-estate control and
efficient history management.
Pen-based computing has become an active research area recently. In addition to
research and commercial work on handwriting recognition, much work has been done
on efficient text input methods [106] and gesture recognition [48]. Many systems use a
pen-based sketching interface to encourage creative activities: SILK [73] uses it for GUI
design, MusicPad [39] uses it for music composition, SKETCH [161] and Teddy [63] use
it for 3D modeling. Pen-based techniques are commonly used on electronic board
systems [43,112,118], with specialized interfaces designed for large boards. For example,
a series of papers on the Tivoli system [81] proposes many interaction techniques to
organize handwritten notes in meeting environment.
Although this previous work discusses the interaction techniques and specific
applications for pen computers, relatively few papers discuss the software architecture

81
to support pen-based activities in general. Kramer’s preceding papers and our work are
the attempts to design software architecture suitable for hosting these pen-based
applications in a unified way. In a broader perspective, Flatland can be seen as one of a
group of efforts (such as Pad++ [7] and Magic Lens [11]) that explore alternative
software architectures beyond existing GUIs.
6.3. Flatland User Interfaces
This section briefly illustrates how the Flatland system works from the user’s point of
view. Detailed discussion on the user interface design is found in [95].
6.3.1. Inking and Segmenting
As the very first level approximation, Flatland works just like a physical office
whiteboard. The user can draw any handwritten stroke anywhere in the screen just by
dragging the stylus on the surface (called stroking). Erasing is done by drawing a
scribbling stroke with the stylus’s modifier button down (called metastroking).
Unlike a physical whiteboard, painted strokes are automatically grouped together into
clusters, which we call segments. Each segment is explicitly presented to the user by a
boundary surrounding its strokes. When the user draws a stroke on some open space, a
new segment is created for the stroke. If a stroke is drawn within or close to an existing
segment, the stroke joins to the segment. If necessary, the user can also manually split
or join segments (Figure 45).
To ensure visibility, segments are not allowed to overlap. The user can drag a segment
by grabbing its boundary, but if the segment collides with another segment, the collided
segment is pushed away. If no more space is available, the collided segment starts to
shrink to give more space (Figure 46). When the user starts working on a shrunken
segment, it restores its original size.

82
a)Joining to an existing segment b) Assigning a new segment
c) segment joining d) segment splitting
Figure 45. Segmenting.
a) start dragging b) pushing away c) squashing
Figure 46. Moving and squashing.
6.3.2. Application Behaviors
In addition to functioning as a simple whiteboard, Flatland supports specific activities
by allowing the user to attach application behaviors to segments. An application
behavior interprets the user’s freeform strokes, and gives appropriate feedback in
“handwriting” style to preserve informal appearance. An active behavior is indicated as
an animal figure in the corner of the segment. The following is the list of currently
available application behaviors.
To do list: maintains a vertical list of handwritten items with check boxes. A new item is
created when the user draws a short stroke (tap). A vertical stroke starting at a check
box reorders the item, and a horizontal stroke deletes it (Figure 47).

83
a) Adding a new item b) reordering items
Figure 47. To Do behavior.
Map drawing: turns strokes into a double line representing a street. Intersections are
handled appropriately for incoming stroke and erasing operations (Figure 48).
a) Adding a new street b) Erasing a street
Figure 48. Map Drawing behavior.
2D geometric drawing: automatically beautifies freeform strokes considering possible
geometric relations. The system generates multiple candidates as pink line segments,
and the user can select a desired one by tapping on it. This behavior also predicts the
next drawings based on the spatial relation among the new line segment and existing
line segments [61]. The predicted line segments are displayed as pink line segments as
well (Figure 49).
a) Beautification b) Prediction
Figure 49. 2D Geometric Drawing behavior.

84
3D drawing: automatically constructs a 3D model based on the 2D freeform stroke input,
and displays the result in pen-and-ink rendering style [63]. The user can rotate the
model by metastroking. It also supports several editing operations such as cutting and
extrusion (Figure 50).
a) Creation b) Cutting
Figure 50. 3D Drawing behavior.
Calculation: recognizes handwritten formulas in a segment and returns the result of
calculation. The user draws a desired formula using hand drawn numbers, and the
system displays the result in handwriting style when the user draws a long horizontal
line below the formula (Figure 51).
a) user input b) system output
Figure 51. Calculation behavior.
Unlike application programs of standard window systems, these application behaviors
can be flexibly applied to and removed from the segment, and different behaviors can be
used in combination over time. For example, in order to draw a map, the user draws
streets using the map behavior, draws buildings using the 2D geometric drawing
behavior, and writes comments without any application behaviors.

85
6.3.3. History Management and Context-based Search
Another feature of Flatland is its automatic history maintenance mechanism. Every
event on the surface is continuously recorded, and can be retrieved later. This
mechanism frees users from explicit save operations, which are not suitable for informal
activities on whiteboards.
The current implementation provides three interfaces for accessing automatically
stored strokes and segments. The first is infinite undo and redo. Using undo and redo,
the user can access any past state of the segment. Next is the time slider. Using the
slider, the user can specify the time point directly, or use jump buttons to get to discrete
“interesting” time points. Third is context-based search, which is implemented as a
behavior. The search behavior allows the user to retrieve previous strokes and segments
based on context information such as time, segment location, segment size and ink
colors. Search results are shown as a set of thumbnails on the screen, and the user can
work on the stored segment by clicking on a thumbnail.
Segment Segment
Root Segment
Strokes Strokes
Behaviors BehaviorsCalculation
ShowBorder
PaintStroke
DragBorder
PlainDrawing
ShowBorder
PaintStroke
DragBorder
Events
Distributeby type
Distributeby location
= Application behavior
= Embedded behavior
Figure 52. Overview of the Flatland architecture.
6.4. Flatland Architecture Overview

86
This section gives an overview of the entire Flatland architecture. Following sections
describe each feature in detail.
The most basic primitive in the Flatland system is a stroke. The system receives user
input as a stroke, and stores information as a set of strokes. All information processing
in the system can be seen as manipulation of the stroke set on the screen. This
simplifies the implementation, and matches the user’s perceptual model of the physical
whiteboard.
Strokes on the screen are grouped together based on spatial proximity, and are
maintained by a segment. A segment allows the user to manipulate multiple strokes
within the region as a group, and provides a workspace to accomplish specific tasks.
Segments are different from standard windows in that they can be flexibly joined or
split. Every segment is a part of the root segment, which handles the events that
influence the entire whiteboard.
A segment delegates actual computations to behaviors attached to it. Behaviors respond
to various events occurring on the segment, and modify the segment’s stroke set or
perform specific operations (such as painting). At any given time, a segment can have
one “application” behavior and several “embedded” behaviors. Application behaviors
provide task-specific functions and are explicitly attached to the segment by the user.
Embedded behaviors provide basic services—such as inking and event storage—to the
segment, and are not visible to the user. In contrast to applications of standard window
systems, multiple behaviors can be attached to a segment, and a behavior can be
attached or detached on the fly.
Figure 52 shows how the system maintains a set of segments, each of which holds a set
of strokes and a set of behaviors2. When an event occurs, the root segment distributes it
to a child segment, which dispatches the event to its behaviors. Then, a behavior can
modify the segment’s stroke set or perform other specific operations. We will see how
this architecture efficiently supports each feature of the Flatland system in the
following sections.
2 In [140], strokes are called marks or inks, segments are called patches, and behaviorsare called interpretations. Properties in [140] are handled as behavior specific internalstructures in our framework.

87
6.5. Strokes as Universal Input and Output
Flatland is characterized by its use of strokes as a universal primitive for both input
and output. The user’s input always comes into the system in form of a freeform stroke
(called an input stroke), and the system’s feedback is presented as a collection of
handwriting style strokes (called painted strokes). Since both output and input are in
the form of strokes, the system is capable of using its own output as later input—we will
see later some examples of behaviors that exploit this feature. In this section, we
describe how input strokes are processed and how painted strokes are maintained in the
Flatland architecture
6.5.1. Processing an Input Stroke
When a user draws an input stroke on a screen, the root segment first decides which
segment to send it to. If the input stroke is within or close enough to an existing
segment, the root segment sends the input stroke to it. If no segment is found, the
system creates a new segment, and sends the input stroke to it.
The segment does not add the input stroke to its painted stroke set directly when it
receives an input stroke. Instead, the segment sends the input stroke to its application
behavior by calling the addInputStroke method of the behavior. It is the behavior, and
not the segment itself, that adds or modifies the segment’s painted strokes. This allows
an application programmer to build custom application behaviors by just defining the
addInputStroke method which receives input stroke from the segment, without
worrying about low level events (stylus down, stylus move, etc.).
The application behavior analyzes the input stroke, and modifies the segment’s painted
stroke set. For example, the Calculation behavior adds multiple painted strokes
showing the result of calculation when the user draws a horizontal line. The Map
behavior adds two painted strokes based on an input stroke, and it also modifies the
existing painted strokes to represent intersections appropriately.
When the user hasn’t attached a specific application behavior, a default application
behavior called Plain Drawing behavior is installed. This behavior simply adds each

88
incoming input stroke as a painted stroke to the segment’s stroke set, mirroring the
behavior of a physical whiteboard.
An application behavior adds a new painted stroke to the segment by calling the
segment’s addPaintedStroke method with the painted stroke as an argument.
Behaviors can also remove an existing painted stroke by calling the
removePaintedStroke method. These methods actually update the segment’s stroke set,
and perform some low level processing to adjust the segment size and to push away
surrounding segments if necessary. Figure 53 illustrates this event processing flow.
User input based on simple pen down (stroking) is always handled as a single input
stroke in this way. However, user input with the pen’s modifier button down (called
metastroking) is handled in the conventional button down-move-up event model, and
processed variously depending on its location. Metastrokes are used to start
pie/marking menus, drag/split a segment, erase a painted stroke, etc. We do not have
enough space to discuss each of the metastroke operations in detail, but generally,
metastrokes are processed in a similar manner to strokes: an metastroking event starts
from the root segment, goes to the target segment, and is distributed to the appropriate
behaviors.
Segment
Root Segment
StrokesBehaviors ApplicationBehavior
Input stroke
addInputStroke
addInputStroke
addInputStroke
addPaintedStroke
removePaintedStroke
Figure 53. Input stroke processing.
6.5.2. Strokes as Universal Output

89
Flatland uses a stroke as the basic primitive for displaying information. In addition to
directly showing the user’s hand drawn strokes, system feedback is also presented in
the form of freeform strokes. This decision primarily comes from aesthetic reasons to
give informal appearance, but also helps simplify the entire architecture.
When an application behavior wants to give feedback to the user, it has to create an
appropriate new stroke and add it to the segment’s stroke set. Application behaviors are
not allowed to directly paint on the screen using primitive operations such as drawText,
drawLine and drawImage. For example, when the 2D geometric drawing behavior
shows the result of beautification or prediction, it adds corresponding line segments in
form of strokes to the segment’s stroke set, instead of directly drawing lines on the
screen. And the calculation behavior displays the result of calculation by adding a set of
strokes representing numbers instead of drawing printed text directly on the screen.
This design has two benefits from the implementation’s point of view. First, application
programmers do not have to worry about low level painting operations, and they gain
the appropriate informal appearance for free. Second, and more importantly, the system
can recover the appearance of the board just by recording the segment’s stroke set at
each time point. If each behavior paints arbitrary things directly on the screen, the
recovery of the screen snapshot would have to involve the behavior and could be highly
complicated. We will discuss this in detail in the History Management section.
6.6. Dynamic Segmentation
The structure of drawings on a physical whiteboard is very volatile and flexible. Our
dynamic segmenting mechanism is designed to capture this property. Dynamic
segmenting frees the user from defining the structure of the board beforehand, and
allows him or her to organize the board on the fly. Flatland segments are different from
windows in a number of ways.
First, a segment is created automatically in response to the user’s input stroke, while a
window has to be explicitly constructed before stating interaction. Second, segments are
not allowed to overlap. This results in “pushing away and squashing” effects, which
allows more information to be presented while preserving visibility. Finally, segments
can be dynamically merged or split.

90
6.6.1. Distribution of an Input Stroke
When the user draws a freeform stroke, the root segment calculates the distance
between the stroke and existing segments. If the stroke overlaps or is close enough to a
segment, the stroke will be send to the segment. If the stroke overlaps multiple
segments, the system merges the corresponding segments, and sends the stroke to the
resulting segment. If no such segment is found, the root segment generates a new
segment, and sends the stroke to it.
6.6.2. Moving a Segment
The user can move a segment by making a metastroke starting at the segment’s border.
An embedded behavior called Drag Border responds to the event, and moves the
segment according to the pen movement. It generates a surfaceMoved event to the
application behaviors to update their internal structures. This surfaceMoved event also
occurs when the segment is pushed away by another segment.
6.6.3. Pushing and Squashing a Segment
When the Drag Border behavior tries to move a segment, the segment asks the root
segment for space. If any segment occupies the space, the root segment pushes it away
to make space. The pushed segment then requests space for itself, and this continues
until a segment is pushed against the screen boundary.
When this happens, the segment at the boundary starts to shrink to give space. When a
segment shrinks, the actual coordinates of its strokes remain unchanged. Instead, the
segment maintains a “scale” field, and the Paint Stroke embedded behavior renders the
scaled strokes on the fly. In other words, the shrinking effect occurs only superficially.
This frees application programmer from taking care of the scaling effect.
6.6.4. Merging and Splitting Segments
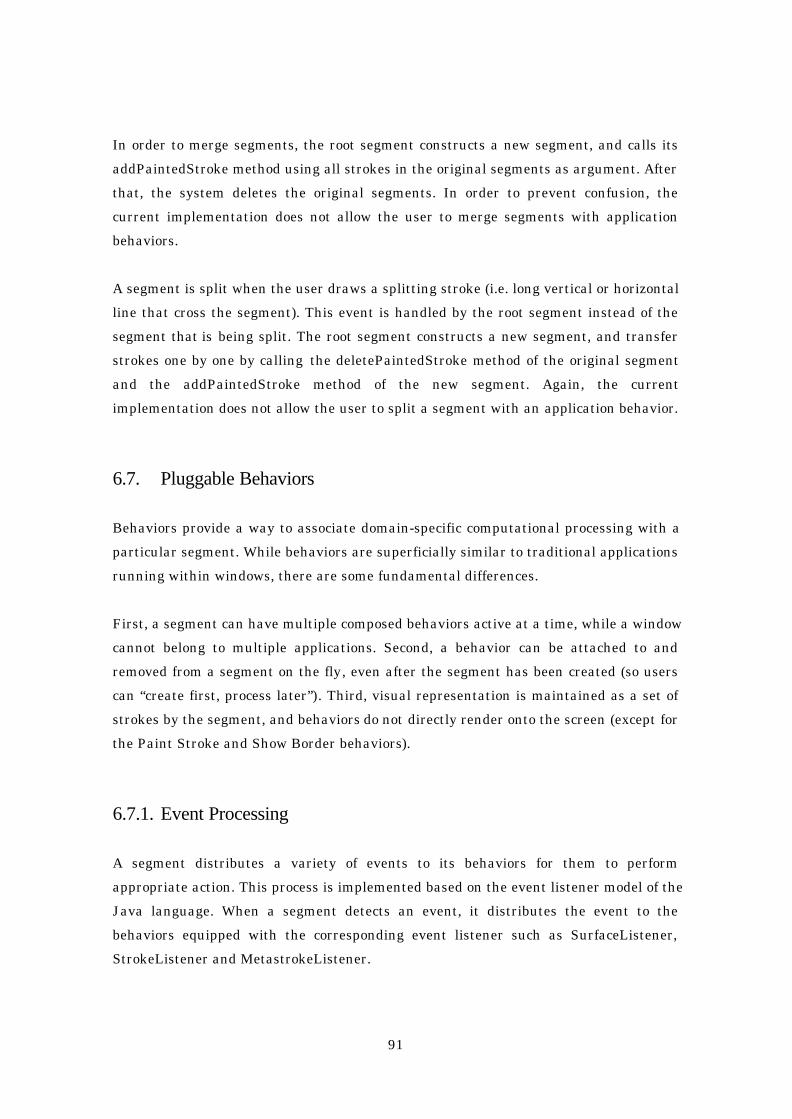
91
In order to merge segments, the root segment constructs a new segment, and calls its
addPaintedStroke method using all strokes in the original segments as argument. After
that, the system deletes the original segments. In order to prevent confusion, the
current implementation does not allow the user to merge segments with application
behaviors.
A segment is split when the user draws a splitting stroke (i.e. long vertical or horizontal
line that cross the segment). This event is handled by the root segment instead of the
segment that is being split. The root segment constructs a new segment, and transfer
strokes one by one by calling the deletePaintedStroke method of the original segment
and the addPaintedStroke method of the new segment. Again, the current
implementation does not allow the user to split a segment with an application behavior.
6.7. Pluggable Behaviors
Behaviors provide a way to associate domain-specific computational processing with a
particular segment. While behaviors are superficially similar to traditional applications
running within windows, there are some fundamental differences.
First, a segment can have multiple composed behaviors active at a time, while a window
cannot belong to multiple applications. Second, a behavior can be attached to and
removed from a segment on the fly, even after the segment has been created (so users
can “create first, process later”). Third, visual representation is maintained as a set of
strokes by the segment, and behaviors do not directly render onto the screen (except for
the Paint Stroke and Show Border behaviors).
6.7.1. Event Processing
A segment distributes a variety of events to its behaviors for them to perform
appropriate action. This process is implemented based on the event listener model of the
Java language. When a segment detects an event, it distributes the event to the
behaviors equipped with the corresponding event listener such as SurfaceListener,
StrokeListener and MetastrokeListener.

92
SurfaceListeners handle events related to the segment configuration. They react to
changes in segment location, size, activation, and inactivation. They also react to
requests for painting of the segment. Most embedded behaviors are instances of this
event listener. For example, the Paint Stroke and Show Border embedded behaviors
respond to requests for surface painting. Some application behaviors respond to this
event to modify their internal structure.
StrokeListeners handle the incoming strokes drawn by the user. This event listener is
used by application behavior to detect input strokes. MetastrokeListener handles the
events related to metastrokes. The Drag Border behavior responds to this event, and
some application behaviors use this event to handle specific gestures such as erasing.
6.7.2. Embedded Behaviors
Embedded behaviors are implicitly attached to the segment, and work as a part of
underlying system service. It would have been possible to implement these services as a
part of a segment, but we chose to implement them as separate entities to make the
entire system highly extensible. For example, it is possible to give the system a
completely different look and feel just by changing the embedded behaviors without
modifying the segment itself. It is also easy to add new features as new embedded
behaviors. Actually, our “moving a segment” feature came later in the development
process; the Drag Border behavior was added without requiring much rewriting of the
segment code.
6.7.3. Application Behaviors
This section describes the implementation of some application behaviors in detail. The
Flatland infrastructure provides an API which programmers can use to build their own
application behaviors, without worrying about low level implementation details of the
entire system.
Basically, an application behavior receives an input stroke from the host segment, and
modifies the set of painted strokes maintained by the segment. An application behavior
can also respond to any other events to maintain some task specific semantics. For
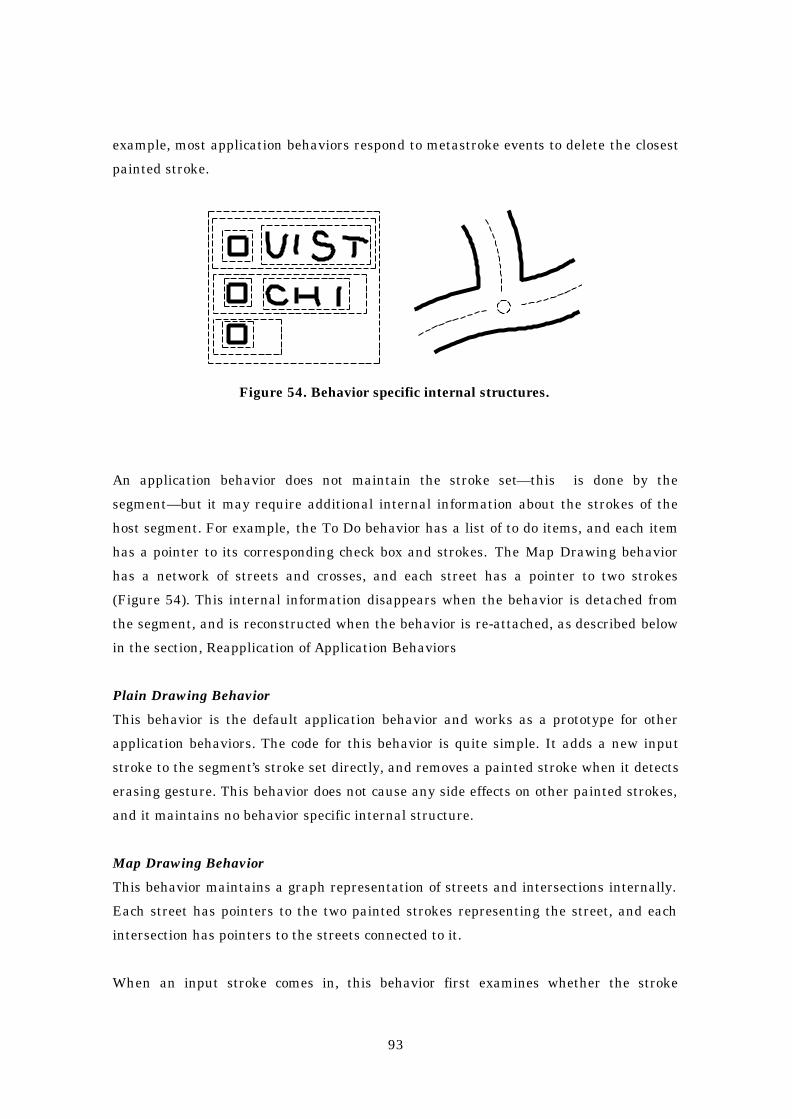
93
example, most application behaviors respond to metastroke events to delete the closest
painted stroke.
Figure 54. Behavior specific internal structures.
An application behavior does not maintain the stroke set—this is done by the
segment—but it may require additional internal information about the strokes of the
host segment. For example, the To Do behavior has a list of to do items, and each item
has a pointer to its corresponding check box and strokes. The Map Drawing behavior
has a network of streets and crosses, and each street has a pointer to two strokes
(Figure 54). This internal information disappears when the behavior is detached from
the segment, and is reconstructed when the behavior is re-attached, as described below
in the section, Reapplication of Application Behaviors
Plain Drawing Behavior
This behavior is the default application behavior and works as a prototype for other
application behaviors. The code for this behavior is quite simple. It adds a new input
stroke to the segment’s stroke set directly, and removes a painted stroke when it detects
erasing gesture. This behavior does not cause any side effects on other painted strokes,
and it maintains no behavior specific internal structure.
Map Drawing Behavior
This behavior maintains a graph representation of streets and intersections internally.
Each street has pointers to the two painted strokes representing the street, and each
intersection has pointers to the streets connected to it.
When an input stroke comes in, this behavior first examines whether the stroke

94
overlaps some existing streets. If no overlap is found, the behavior creates two painted
strokes at the both sides of the input stroke, and adds them to the segment’s stroke set.
In addition, the behavior adds the new street to its street set. If the stroke overlaps
some existing street, the behavior divides the street and the input stroke at the section,
and reconstructs the appropriate graph topology. The behavior deletes the painted
strokes associated with the modified street, and adds a set of new painted strokes.
When the user tries to erase a painted stroke, the behavior erases the corresponding
street. Then it reconfigures the internal graph representation and edits the segment’s
stroke set.
Calculation Behavior
This behavior works just as a plain drawing behavior until the user draws a long
horizontal stroke requesting calculation. When this happens, the behavior searches for
the set of strokes above the horizontal stroke, and hands them to a handwriting
recognizer. The recognizer returns the symbolic representation of a formula. The
behavior calculates it, and adds a set of painted strokes that represent result digits to
the segment’s stroke set. This behavior maintains no internal structure, and scans the
entire segment each time. As a result, this behavior can accepts any painted stroke as
input, including the painted strokes created by the behavior itself or those painted
before the behavior is applied to the segment.
3D Drawing Behavior
This behavior has a 3D polygonal model internally, and renders the model by adding
painted strokes representing visible silhouette edges to the segment’s stroke set. When
the user rotates the model, the behavior removes all previous strokes, and adds new
strokes. Unlike other application behaviors, it directly responds to the low level
metastroke events to implement rotation.
Search Behavior
This behavior is a part of the system infrastructure, and is significantly different from
other application behaviors. While other application behaviors provide feedback by
editing the segment’s stroke set and letting the PaintStroke embedded behavior paint
them, the search behavior paints buttons and search results to the screen by itself. This
prevents the search result to be recorded as new strokes, and gives a distinctive look to
the segment.
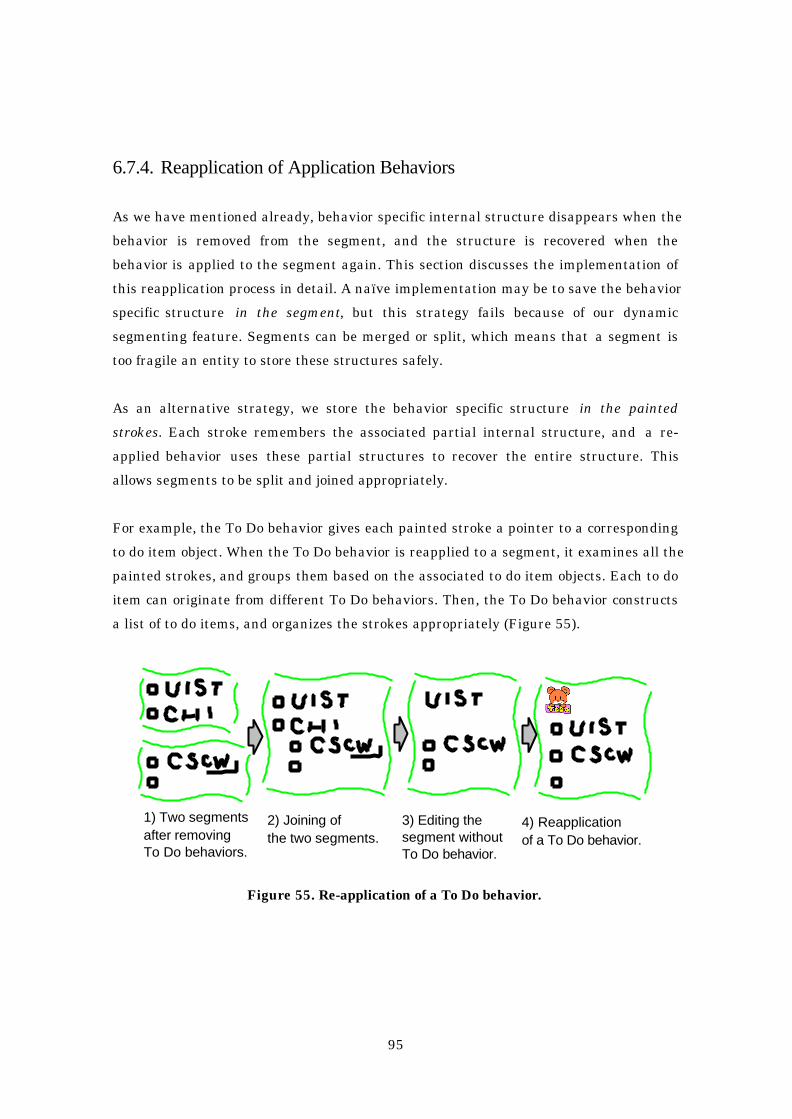
95
6.7.4. Reapplication of Application Behaviors
As we have mentioned already, behavior specific internal structure disappears when the
behavior is removed from the segment, and the structure is recovered when the
behavior is applied to the segment again. This section discusses the implementation of
this reapplication process in detail. A naïve implementation may be to save the behavior
specific structure in the segment, but this strategy fails because of our dynamic
segmenting feature. Segments can be merged or split, which means that a segment is
too fragile an entity to store these structures safely.
As an alternative strategy, we store the behavior specific structure in the painted
strokes. Each stroke remembers the associated partial internal structure, and a re-
applied behavior uses these partial structures to recover the entire structure. This
allows segments to be split and joined appropriately.
For example, the To Do behavior gives each painted stroke a pointer to a corresponding
to do item object. When the To Do behavior is reapplied to a segment, it examines all the
painted strokes, and groups them based on the associated to do item objects. Each to do
item can originate from different To Do behaviors. Then, the To Do behavior constructs
a list of to do items, and organizes the strokes appropriately (Figure 55).
1) Two segmentsafter removing To Do behaviors.
2) Joining ofthe two segments.
3) Editing the segment withoutTo Do behavior.
4) Reapplicationof a To Do behavior.
Figure 55. Re-application of a To Do behavior.
96
1) Two segmentsafter removing Map behaviors.
2) Joining ofthe two segments.
3) Editing the segment withoutMap behavior.
4) Reapplicationof a Map behavior.
Figure 56. Re-application of a Map behavior.
The Map Drawing behavior embeds a pointer to the corresponding street object in a
painted stroke. When a map drawing behavior is reapplied to the segment, it extracts
the set of street objects embedded in the strokes, and constructs a complete street-
intersection graph. Again, each street object can be generated by different Map Drawing
behaviors (Figure 56). Strokes generated by other behaviors remain unchanged.
The 3D drawing behavior embeds a pointer to the 3D model in each stroke. When the
behavior is reapplied to a segment, it extracts the 3D geometry from the stroke. If more
than one 3D model is found in the stroke set, the 3D drawing behavior ignores the rest
of them.
An application programmer has to write code to store and recover the internal
structures when he or she uses internal structures. Currently, this part of coding is too
complicated and difficult. It is our future work to find a more unified way to handle
behavior reapplication.
6.8. History Management
One of the goals of Flatland was to create a “change safe” whiteboard. What this
means is that users should be able to safely change any content on the board, knowing
that they can recover it later if need be. To satisfy this requirement, Flatland must be
able to reconstruct the contents of any given segment as requested by the user.
97
To implement this ability, Flatland uses the combination of two different mechanisms.
One is a command object model, which maintains short-term history and supports
infinite undo/redo and the time slider. Time slider allows the user to view segment
status in the past [119]. The other is a persistent document management system based
on associative memory, which maintains long-term history and supports context based
search.
6.8.1. Undo/Redo Model
Our infinite undo/redo is based on the “command object” idiom [39]. Command objects
are objects—in the object-oriented sense of the word—that encapsulate an operation
that can be performed in an application. Each type of action that the user can take on
the whiteboard is represented as a discrete class of command object. Instances of
commands are “invoked” by calling a well-known method on them that causes them to
perform their operation, updating the state of the board.
In our model, commands can be invoked and they can be reversed. That is, each
command supports the ability to both “do” and “undo” its operation. Once this ability is
added to the base command object pattern, command objects can be connected together
in graphs to form complex histories that represent all of the possible states in which the
application has existed. By traversing the graph, sequential sets of operations can be
done or undone. This model of graphs of command objects as a means to represent time
has been used by Timewarp [34] and other systems. (Although, unlike the generalized
time model supported by Timewarp, Flatland doesn’t allow divergent or revergent
histories—in Flatland, the history graph is strictly linear, and thus avoids issues with
conflicts [32].).
The time slider is implemented based on this infinite undo/redo model. When the user
moves the slider forward, the system invokes redo methods of the command objects
sequentially, and vice versa. Semantic jumping is implemented by putting markers in
the command object sequence. If the user presses the jump button, the system searches
for the next marker and jumps to the time point.
98
6.8.2. Supporting Undo/Redo with Extensible Behaviors
Flatland faced some unique problems in representing its state as a linear graph of
command objects. In “traditional” uses of the command object idiom, each command is
atomic—that is, it can reliably and completely do or undo its operation, and has no side
effects that aren't represented by the state in the command object itself. As an example,
when a command object in a drawing program is rolled forward, it must take care to
store all information needed to completely reset the state of the application if it is rolled
back. If performing the operation causes some change to be made to the graphics
context of the application, the creator of the command must be aware of this side effect,
and must account for it when performing the corresponding undo.
This situation is in contrast to the basic architecture of Flatland, where the use of
extensible, pluggable behaviors means that essentially every interesting update to the
state of the application does occur as a side effect to user input. The set of operations
that can occur when a user draws a stroke on the board is dependent on the set of
behaviors installed, and the current state of each of those behaviors. This leads to
some problems in applying the command object idiom in the face of extensible
behaviors.
One naïve approach would be to represent only the original user input in the command
history. So if a user made a stroke, and the map behavior then drew two parallel
strokes to represent a street, only the original stroke (which doesn't even appear on the
screen after the map behavior is finished with it) would be present in the history. The
problem here is that the history no longer represents the complete state of the
application. Jumping to a different node in the history graph involves “replaying” the
user input to the behaviors, causing them to perform all of the same operations they
would in response to “fresh” user input. The computations done by behaviors can be
arbitrarily complex, which means that jumping to distant states can be arbitrarily
expensive.
Flatland uses an alternative approach, where any behavior expresses its updates in
terms of new command objects. So in the example of the map behavior, the history
would contain a behavior-specific command object indicating that a new street is
present, followed by two painted strokes (added by the map behavior). This approach
has a big advantage: changes based on user input are “pre-computed” by the behaviors,
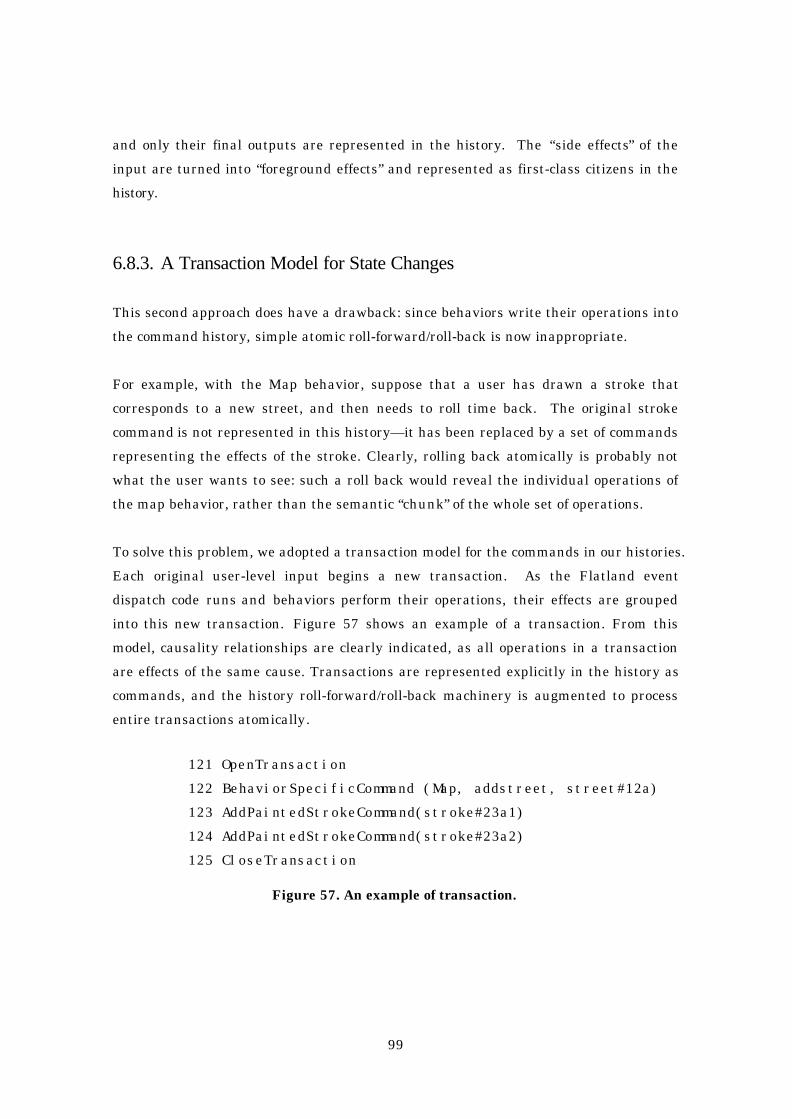
99
and only their final outputs are represented in the history. The “side effects” of the
input are turned into “foreground effects” and represented as first-class citizens in the
history.
6.8.3. A Transaction Model for State Changes
This second approach does have a drawback: since behaviors write their operations into
the command history, simple atomic roll-forward/roll-back is now inappropriate.
For example, with the Map behavior, suppose that a user has drawn a stroke that
corresponds to a new street, and then needs to roll time back. The original stroke
command is not represented in this history—it has been replaced by a set of commands
representing the effects of the stroke. Clearly, rolling back atomically is probably not
what the user wants to see: such a roll back would reveal the individual operations of
the map behavior, rather than the semantic “chunk” of the whole set of operations.
To solve this problem, we adopted a transaction model for the commands in our histories.
Each original user-level input begins a new transaction. As the Flatland event
dispatch code runs and behaviors perform their operations, their effects are grouped
into this new transaction. Figure 57 shows an example of a transaction. From this
model, causality relationships are clearly indicated, as all operations in a transaction
are effects of the same cause. Transactions are represented explicitly in the history as
commands, and the history roll-forward/roll-back machinery is augmented to process
entire transactions atomically.
121 OpenTransaction
122 BehaviorSpecificCommand (Map, addstreet, street#12a)
123 AddPaintedStrokeCommand(stroke#23a1)
124 AddPaintedStrokeCommand(stroke#23a2)
125 CloseTransaction
Figure 57. An example of transaction.

100
6.8.4. Local versus Global Timeline Management
One final timeline management issue we had to deal with was the distinction between
the “local” timelines of individual segments and the “global” timeline of the entire
board. We wanted the ability for users to interact with the timelines of individual
segments without affecting others: the entire history of a segment should appear
continuous, even though in “real” time, operations on other segments may be
interspersed with it. But we also wanted the ability to roll forwards and backwards in
global (whole-board) time. Global undo and redo means that the histories of all
individual segments are “packed” into a single timeline ordered by “real” time, rather
than “segment logical” time.
Segment #1
Segment #2
Segment #3
Local history (segment #1)
Global history
Figure 58. Local versus Global Timeline.
In the implementation, each segment maintains its own local history, and Flatland
creates the illusion of a global history timeline by composing individual segment
histories together. Because users can visit and leave segments as often as needed,
segment histories can be arbitrarily interleaved in “global” time—so the global history
is represented as a list of “chunks” of history from individual segments, stitched
together (Figure 58).
6.8.5. Persistence
Since Flatland whiteboards are designed for long-term use—much as physical
whiteboards are—we needed a way to ensure that all data on the board is saved
persistently. We want to ensure that everything on the board is saved and
recoverable, for the entire duration of the board's use, without requiring users to have to
explicitly save or name files that correspond to segments. Clearly this would violate the
informal nature of the system and, in many cases, the work required to explicitly save a

101
persistent data file would outweigh the benefit of using the board! We needed a much
lighter-weight approach.
Flatland is built atop the Presto document management system [32]. Presto provides a
loosely-structured “information soup” into which arbitrary content can be stored. Presto
presents an associative memory programming model to its users—chunks of
information can be tagged with arbitrary key/value pairs—which maps nicely into the
Java implementation of Flatland (Presto tuples can be arbitrary serialized Java
objects).
Flatland saves every “dirty” segment periodically to stable storage via Presto. Each
segment is represented as a discrete Presto “document,” with Flatland-specific objects
tagged onto it as key/value data. The contents of each document are the serialized
command objects that constitute the segment’s history. The system maintains a
“segment cache,” which reflects all of the “live” segments currently on the board. If an
old segment needs to be retrieved (either because the user searched for it, or an undo or
time slider operation causes the segment to become live again), it is “faulted in” from
persistent storage. Only the storage layer in Flatland needs to know about
persistence—from the perspective of behavior writers, all segments are always “live”
and in core at all times. From the user perspective, users never have to explicitly save at
any time, and they never name the data that is saved.
6.8.6. Search
Our search behavior retrieves past segment states using this document management
system. The system tries to intuit information about the context of a segment's use, and
its content, and uses this information to satisfy queries. For example, users can search
based on content attributes such as segment stroke density (using ambiguous terms like
“dense” or “sparse” or “medium”) and color (“mostly blue”). Context-based searches can
use information about what behaviors were attached to the segment (“my map” or “my
to do list”), and time of last use.
The search result is displayed as a set of thumbnails representing past states of the
segments. The construction of this thumbnail is done by rolling the addPaintedStroke
and removePaintedStroke command objects forward starting from a blank segment,
102
ignoring any behavior specific command objects in the segment history. This allows the
system to reconstruct the segment appearance quickly. If the user tries to interact with
the retrieved segment, the system reconstructs the behavior specific internal structures
by rolling behavior specific command objects forward.
6.9. Implementation Notes
Flatland is implemented in Java, and is approximately 42,000 lines of code.
Handwriting recognition (used by the Calculator behavior) is done by the Calligrapher
online recognizer from Paragraph Corporation.
We did not pay much attention to performance tuning, but the overall speed is
satisfactory on a standard PC as a proof of concept prototype. Some operations such as
the display of search results cause delay, and require improvement.
Implementation of history management is not yet complete. Especially, our long-term
persistent history causes a sort of time travel paradox. Multiple restorations of an old
segment and time traversal over merged or split segments badly confuse the timeline
management, and more research is required to address these problems.
6.10. Summary and Future Work
This chapter has introduced our efforts to build a software platform for a variety of
pen-based applications. Our design goal was to support informal, pre-production
activities on a whiteboard, in contrast to the well-organized activities supported on
desktop computers. To achieve this goal, we have introduced the ideas of strokes as a
basic primitive for both input and output, dynamic segmentation of the screen space,
pluggable behaviors working on a segment, and persistent history management
mechanism.
Our next step is to deploy the Flatland system in real office environment to observe its
usage. However, this is difficult with our current hardware set up, and its requirement
for front projection. We expect that a large plasma display with touch sensitive screen
will be a good solution. We also plan to implement additional application behaviors that

103
support common activities on a white board such as paper outlining, communications,
calendars, and so on.
Another interesting research direction is the application of our architecture to other pen
computing environments. We believe that our architecture can provide a uniform
framework for a variety of pen-based devices to work in corporation.

104
Chapter 7
Sketch-based 3D Freeform Modeling
This chapter introduces a sketching interface for quickly and easily designing freeform
models such as stuffed animals and other rotund objects. The user draws several 2D
freeform strokes interactively on the screen and the system automatically constructs
plausible 3D polygonal surfaces. Our system supports several modeling operations,
including the operation to construct a 3D polygonal surface from a 2D silhouette drawn
by the user: it inflates the region surrounded by the silhouette making wide areas fat,
and narrow areas thin. Teddy, our prototype system, is implemented as a Java™
program, and the mesh construction is done in real-time on a standard PC. Our
informal user study showed that a first-time user typically masters the operations
within 10 minutes, and can construct interesting 3D models within minutes.
7.1. Introduction
Although much progress has been made over the years on 3D modeling systems, they
are still difficult and tedious to use when creating freeform surfaces. Their emphasis
has been the precise modeling of objects motivated by CAD and similar domains.
Recently SKETCH [161] introduced a gesture-based interface for the rapid modeling of
CSG-like models consisting of simple primitives.
Teddy [63] extends these ideas to create a sketching interface for designing 3D freeform
objects. The essential idea is the use of freeform strokes as an expressive design tool.
The user draws 2D freeform strokes interactively specifying the silhouette of an object,
and the system automatically constructs a 3D polygonal surface model based on the
strokes. The user does not have to manipulate control points or combine complicated

105
editing operations. Using our technique, even first-time users can create simple, yet
expressive 3D models within minutes. In addition, the resulting models have a hand-
crafted feel (such as sculptures and stuffed animals) which is difficult to accomplish
with most conventional modelers. Examples are shown in Figure 60.
We describe here the sketching interface and the algorithms for constructing 3D shapes
from 2D strokes. We also discuss the implementation of our prototype system, Teddy.
The geometric representation we use is a standard polygonal mesh to allow the use of
numerous software resources for post-manipulation and rendering. However, the
interface itself can be used to create other representations such as volumes [143] or
metaballs [81].
Like SKETCH [161], Teddy is designed for the rapid construction of approximate
models, not for the careful editing of precise models. To emphasize this design goal and
encourage creative exploration, we use the real-time pen-and-ink rendering described in
[80], as shown in Figure 59. This also allows real-time interactive rendering using Java
on mid-range PCs without dedicated 3D rendering hardware.
Figure 59. Teddy in use on a display-integrated tablet.
An obvious application of Teddy is the design of 3D models for character animation.
However, in addition to augmenting traditional 3D modelers, Teddy’s ease of use has the
potential to open up new application areas for 3D modeling. Possibilities include rapid
prototyping in the early stages of design, educational/recreational use for non-
professionals and children, and real-time communication assistance on pen-based

106
systems.
Figure 60. Painted models created using Teddy and painted using a commercial
texture-map editor.
We publicly provide a videotape that demonstrates Teddy’s user interface. Teddy is
available as a Java applet at the following web site. http://www.mtl.t.u-
tokyo.ac.jp/~takeo/teddy/teddy.htm
7.2. Related Work
A typical procedure for geometric modeling is to start with a simple primitive such as a
cube or a sphere, and gradually construct a more complex model through successive
transformations or a combination of multiple primitives. Various deformation
techniques [77,126] and other shape-manipulation tools [39] are examples of
transformation techniques that let the user create a wide variety of precise, smooth
shapes by interactively manipulating control points or 3D widgets.
Another approach to geometric modeling is the use of implicit surfaces [7,81]. The user
specifies the skeleton of the intended model and the system constructs smooth, natural-
looking surfaces around it. The surface inflation technique [81] extrudes the polygonal
mesh from the skeleton outwards. In contrast, our approach lets the user specify the
silhouette of the intended shape directly instead of by specifying its skeleton.
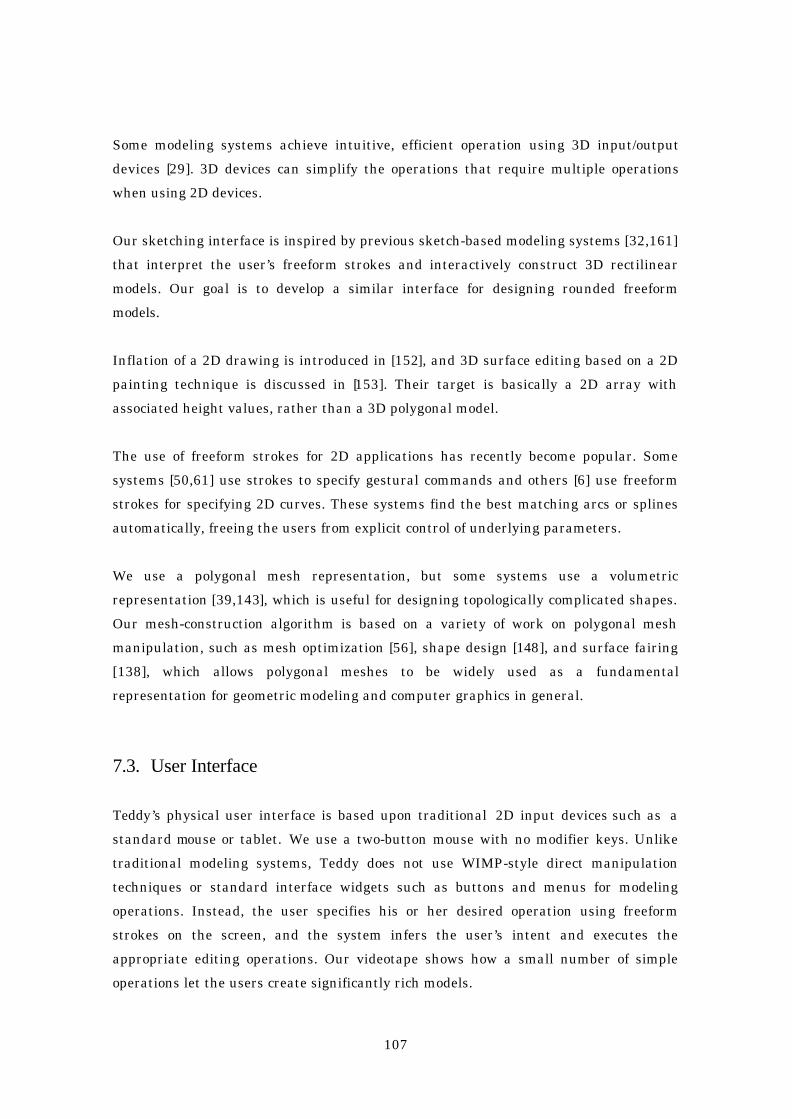
107
Some modeling systems achieve intuitive, efficient operation using 3D input/output
devices [29]. 3D devices can simplify the operations that require multiple operations
when using 2D devices.
Our sketching interface is inspired by previous sketch-based modeling systems [32,161]
that interpret the user’s freeform strokes and interactively construct 3D rectilinear
models. Our goal is to develop a similar interface for designing rounded freeform
models.
Inflation of a 2D drawing is introduced in [152], and 3D surface editing based on a 2D
painting technique is discussed in [153]. Their target is basically a 2D array with
associated height values, rather than a 3D polygonal model.
The use of freeform strokes for 2D applications has recently become popular. Some
systems [50,61] use strokes to specify gestural commands and others [6] use freeform
strokes for specifying 2D curves. These systems find the best matching arcs or splines
automatically, freeing the users from explicit control of underlying parameters.
We use a polygonal mesh representation, but some systems use a volumetric
representation [39,143], which is useful for designing topologically complicated shapes.
Our mesh-construction algorithm is based on a variety of work on polygonal mesh
manipulation, such as mesh optimization [56], shape design [148], and surface fairing
[138], which allows polygonal meshes to be widely used as a fundamental
representation for geometric modeling and computer graphics in general.
7.3. User Interface
Teddy’s physical user interface is based upon traditional 2D input devices such as a
standard mouse or tablet. We use a two-button mouse with no modifier keys. Unlike
traditional modeling systems, Teddy does not use WIMP-style direct manipulation
techniques or standard interface widgets such as buttons and menus for modeling
operations. Instead, the user specifies his or her desired operation using freeform
strokes on the screen, and the system infers the user’s intent and executes the
appropriate editing operations. Our videotape shows how a small number of simple
operations let the users create significantly rich models.

108
In addition to gestures, Teddy supports direct camera manipulation using the secondary
mouse button based on a virtual trackball model [57]. We also use a few button widgets
for auxiliary operations, such as save and load, and for initiating bending operations.
7.4. Modeling Operations
This section describes Teddy’s modeling operations from the user’s point of view; details
of the algorithms are left to the next section. Some operations are executed immediately
after the user completes a stroke, while some require multiple strokes. The current
system supports neither the creation of multiple objects at once, nor operations to
combine single objects. Additionally, models must have a spherical topology; e.g., the
user cannot create a torus. An overview of the model construction process is given first,
and then each operation is described in detail.
The modeling operations are carefully designed to allow incremental learning by novice
users. Users can create a variety of models by learning only the first operation
(creation), and can incrementally expand their vocabulary by learning other operations
as necessary. We have found it helpful to restrict first-time users to the first three basic
operations (creation, painting, and extrusion), and then to introduce other advanced
operations after these basic operations are mastered.
7.4.1. Overview
Figure 61 introduces Teddy’s general model construction process. The user begins by
drawing a single freeform stroke on a blank canvas (Figures 3a-b). As soon as the user
finishes drawing the stroke, the system automatically constructs a corresponding 3D
shape (c). The user can now view the model from a different direction (d). Once a model
is created, it may be modified using various operations. The user can draw a line on the
surface (e-g) by drawing a stroke within the model silhouette. If the stroke is closed, the
resulting surface line turns red and the system enters “extrusion mode” (h-i). Then the
user rotates the model (j) and draws the second stroke specifying the silhouette of the
extruded surface (k-m). A stroke that crosses the silhouette cuts the model (n-o) and
turns the cut section red (p). The user either clicks to complete the operation (q) or

109
draws a silhouette to extrude the section (r-t). Scribbling on the surface erases the line
segments on the surface (u-w). If the user scribbles during the extrusion mode (x-y), the
system smoothes the area surrounded by the closed red line (z-z´).
a) initial state b) input stroke c) result of creation d) rotated view
e) painting stroke f) result of painting g) rotated view
h) before extrusion i) closed stroke j) rotated view k) extruding stroke l) result of extrusion m) rotated view
n) before cutting o) cutting stroke p) result of cutting q) result of click
r) extrusion after cutting s) result of extrusion t) rotated view u) before erasing v) scribbling w) result of erasing
x) closed stroke y) scribbling z) result of smoothing z) rotated view
Figure 61. Overview of the modeling operations.

110
Figure 62 summarizes the modeling operations available on the current
implementation. Note that the appropriate action is chosen based on the stroke’s
position and shape, as well as the current mode of the system.
Closed Create a new object First stroke
Second stroke
Specify reference
Specify target
Inside of the object, not closed Paint on the surface
Inside of the object, closed
Start and end outside of the object
Specify the area to be extruded/smoothed
Cut the object
Scribbling Erase painted strokes
Normal stroke
Scribbling
Click
Extrude the area
Smooth the area
Quit extrusion
Press “Bend” buttonPress “Init” button
PAINTING
EXTRUSION
BENDINGCREATION
Stroke Action
Legend MODE
Figure 62. Summary of the gestural operations.
7.4.2. Creating a New Object
Starting with a blank canvas, the user creates a new object by drawing its silhouette as
a closed freeform stroke. The system automatically constructs a 3D shape based on the
2D silhouette. Figure 63 shows examples of input strokes and the corresponding 3D
models. The start point and end point of the stroke are automatically connected, and the
operation fails if the stroke is self-intersecting. The algorithm to calculate the 3D shape
is described in detail in section 5. Briefly, the system inflates the closed region in both
directions with the amount depending on the width of the region: that is, wide areas
become fat, and narrow areas become thin. Our experience so far shows that this
algorithm generates a reasonable-looking freeform shape. In addition to the creation
operation, the user can begin model construction by loading a simple primitive. The
current implementation provides a cube and a sphere, but adding more shapes is
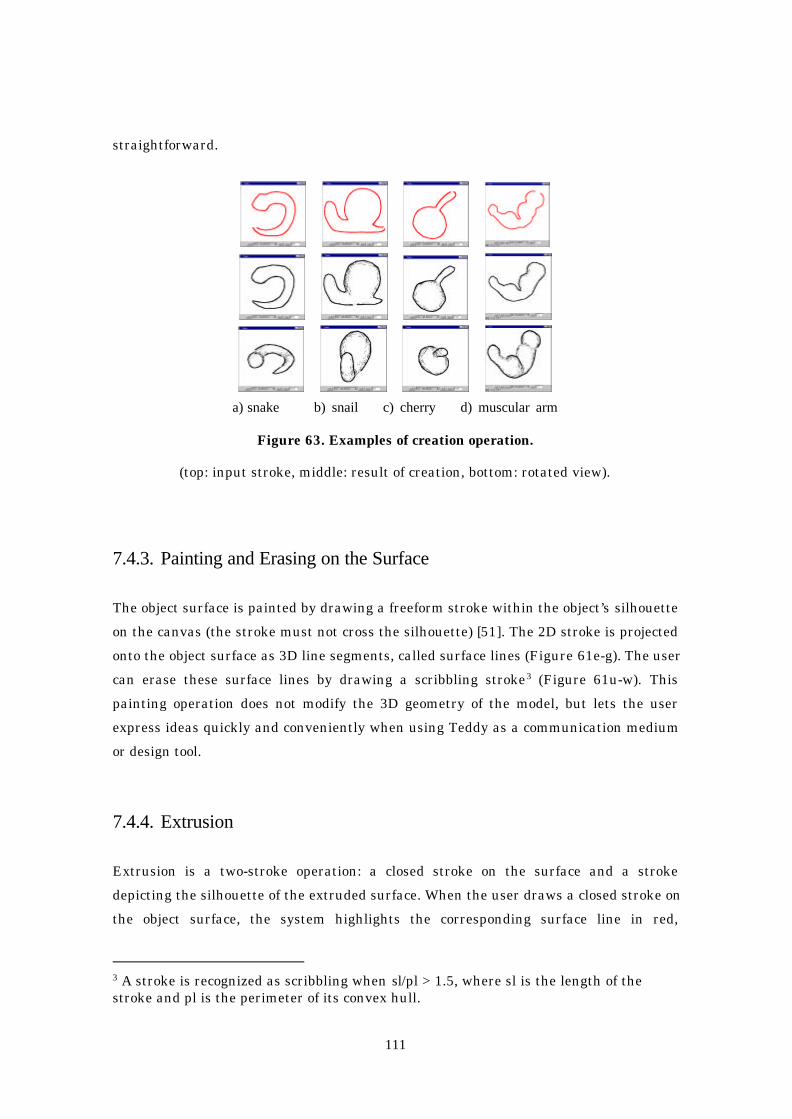
111
straightforward.
a) snake b) snail c) cherry d) muscular arm
Figure 63. Examples of creation operation.
(top: input stroke, middle: result of creation, bottom: rotated view).
7.4.3. Painting and Erasing on the Surface
The object surface is painted by drawing a freeform stroke within the object’s silhouette
on the canvas (the stroke must not cross the silhouette) [51]. The 2D stroke is projected
onto the object surface as 3D line segments, called surface lines (Figure 61e-g). The user
can erase these surface lines by drawing a scribbling stroke3 (Figure 61u-w). This
painting operation does not modify the 3D geometry of the model, but lets the user
express ideas quickly and conveniently when using Teddy as a communication medium
or design tool.
7.4.4. Extrusion
Extrusion is a two-stroke operation: a closed stroke on the surface and a stroke
depicting the silhouette of the extruded surface. When the user draws a closed stroke on
the object surface, the system highlights the corresponding surface line in red,
3 A stroke is recognized as scribbling when sl/pl > 1.5, where sl is the length of thestroke and pl is the perimeter of its convex hull.

112
indicating the initiation of “extrusion mode” (Figure 61i). The user then rotates the
model to bring the red surface line sideways (Figure 61j) and draws a silhouette line to
extrude the surface (Figure 61k). This is basically a sweep operation that constructs the
3D shape by moving the closed surface line along the skeleton of the silhouette (Figure
61l-m). The direction of extrusion is always perpendicular to the object surface, not
parallel to the screen. Users can create a wide variety of shapes using this operation, as
shown in Figure 64. They can also make a cavity on the surface by drawing an inward
silhouette (Figure 65a-c). The current implementation does not support holes that
completely extend to the other side of the object. If the user decides not to extrude, a
single click turns the red stroke into an ordinary painted stroke (Figure 7d-e).
a) long b) thin c) fat d) sharp
Figure 64. Examples of extrusion.
(top: extruding stroke, bottom: result of extrusion).
a) digging stroke b) result c) rotated d) closed stroke e) after click
Figure 65. More extrusion operations.
Digging a cavity (a-c) and turning the closed stroke into a surface drawing (d-e).
7.4.5. Cutting
A cutting operation starts when the user draws a stroke that runs across the object,
starting and terminating outside its silhouette (Figure 61o). The stroke divides the
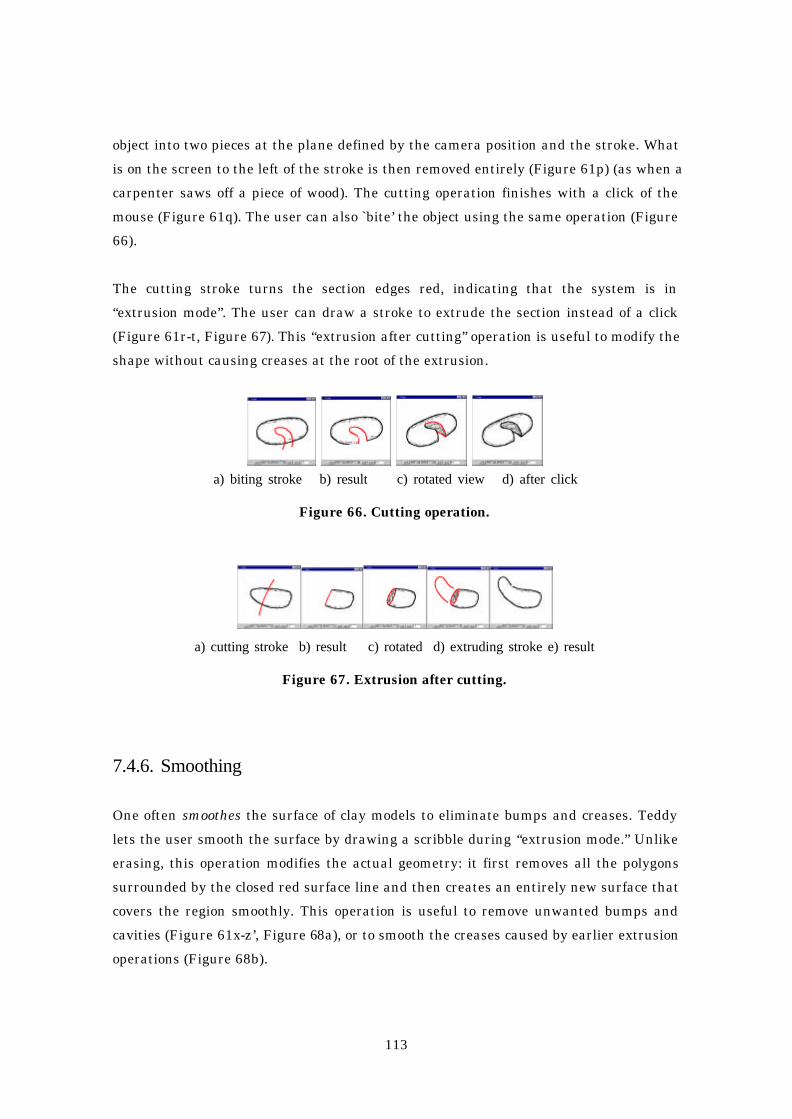
113
object into two pieces at the plane defined by the camera position and the stroke. What
is on the screen to the left of the stroke is then removed entirely (Figure 61p) (as when a
carpenter saws off a piece of wood). The cutting operation finishes with a click of the
mouse (Figure 61q). The user can also `bite’ the object using the same operation (Figure
66).
The cutting stroke turns the section edges red, indicating that the system is in
“extrusion mode”. The user can draw a stroke to extrude the section instead of a click
(Figure 61r-t, Figure 67). This “extrusion after cutting” operation is useful to modify the
shape without causing creases at the root of the extrusion.
a) biting stroke b) result c) rotated view d) after click
Figure 66. Cutting operation.
a) cutting stroke b) result c) rotated d) extruding stroke e) result
Figure 67. Extrusion after cutting.
7.4.6. Smoothing
One often smoothes the surface of clay models to eliminate bumps and creases. Teddy
lets the user smooth the surface by drawing a scribble during “extrusion mode.” Unlike
erasing, this operation modifies the actual geometry: it first removes all the polygons
surrounded by the closed red surface line and then creates an entirely new surface that
covers the region smoothly. This operation is useful to remove unwanted bumps and
cavities (Figure 61x-z’, Figure 68a), or to smooth the creases caused by earlier extrusion
operations (Figure 68b).

114
a) cleaning a cavity
b) smoothing a sharp edge
Figure 68. Smoothing operation.
7.4.7. Transformation
We are currently experimenting with an additional “transformation” editing operation
that distorts the model while preserving the polygonal mesh topology. Although it
functions properly, the interface itself is not fully gestural because the modal transition
into the bending mode requires a button push.
This operation starts when the user presses the “bend” button and uses two freeform
strokes called the reference stroke and the target stroke to modify the model. The
system moves vertices of the polygonal model so that the spatial relation between the
original position and the target stroke is identical to the relation between the resulting
position and the reference stroke. This movement is parallel to the screen, and the
vertices do not move perpendicular to the screen. This operation is described in [24] as
warp; we do not discuss the algorithm further.
Transformation can be used to bend, elongate, and distort the shape (Figure 69). We
plan to make the system infer the reference stroke automatically from the object’s
structure in order to simplify the operation, in a manner similar to the mark-based
interaction technique of [6].
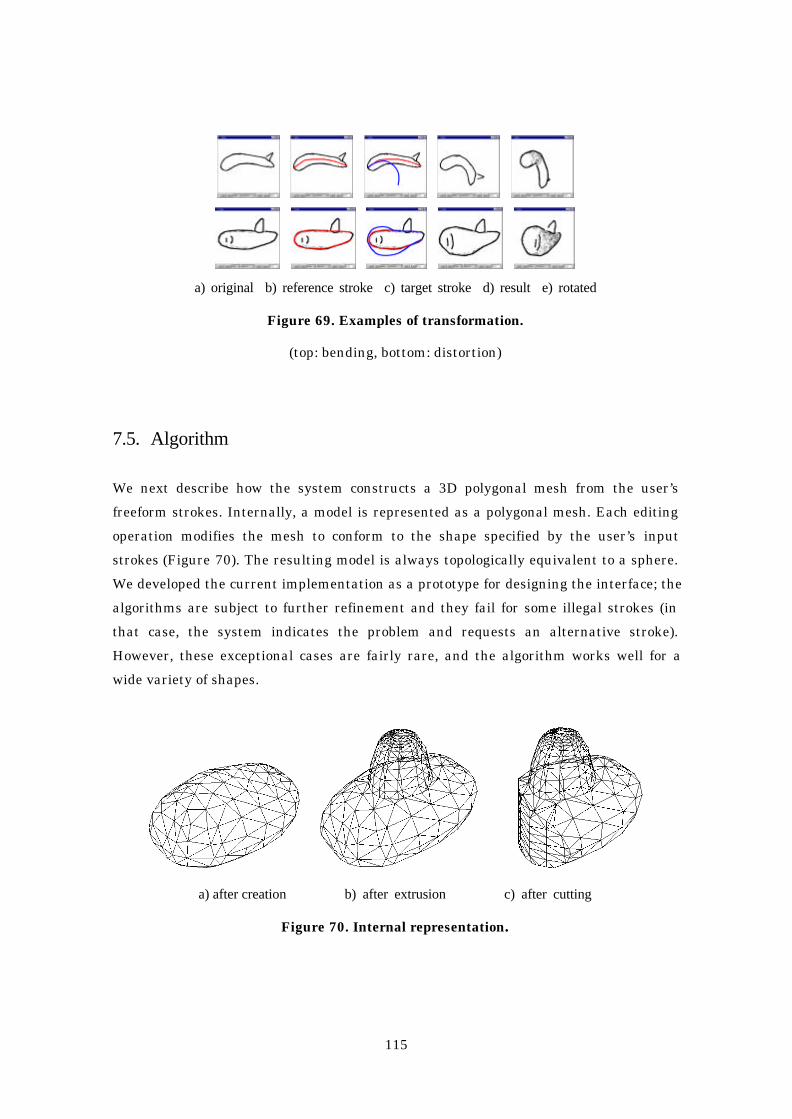
115
a) original b) reference stroke c) target stroke d) result e) rotated
Figure 69. Examples of transformation.
(top: bending, bottom: distortion)
7.5. Algorithm
We next describe how the system constructs a 3D polygonal mesh from the user’s
freeform strokes. Internally, a model is represented as a polygonal mesh. Each editing
operation modifies the mesh to conform to the shape specified by the user’s input
strokes (Figure 70). The resulting model is always topologically equivalent to a sphere.
We developed the current implementation as a prototype for designing the interface; the
algorithms are subject to further refinement and they fail for some illegal strokes (in
that case, the system indicates the problem and requests an alternative stroke).
However, these exceptional cases are fairly rare, and the algorithm works well for a
wide variety of shapes.
a) after creation b) after extrusion c) after cutting
Figure 70. Internal representation.
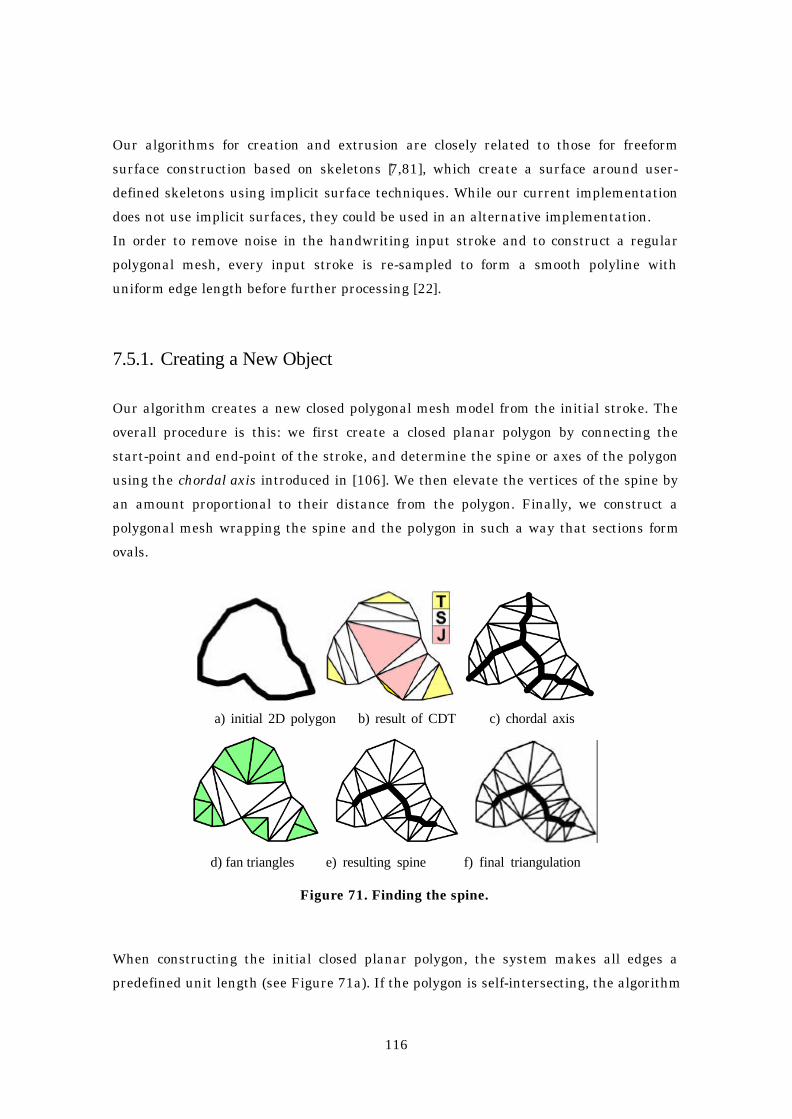
116
Our algorithms for creation and extrusion are closely related to those for freeform
surface construction based on skeletons [7,81], which create a surface around user-
defined skeletons using implicit surface techniques. While our current implementation
does not use implicit surfaces, they could be used in an alternative implementation.
In order to remove noise in the handwriting input stroke and to construct a regular
polygonal mesh, every input stroke is re-sampled to form a smooth polyline with
uniform edge length before further processing [22].
7.5.1. Creating a New Object
Our algorithm creates a new closed polygonal mesh model from the initial stroke. The
overall procedure is this: we first create a closed planar polygon by connecting the
start-point and end-point of the stroke, and determine the spine or axes of the polygon
using the chordal axis introduced in [106]. We then elevate the vertices of the spine by
an amount proportional to their distance from the polygon. Finally, we construct a
polygonal mesh wrapping the spine and the polygon in such a way that sections form
ovals.
a) initial 2D polygon b) result of CDT c) chordal axis
d) fan triangles e) resulting spine f) final triangulation
Figure 71. Finding the spine.
When constructing the initial closed planar polygon, the system makes all edges a
predefined unit length (see Figure 71a). If the polygon is self-intersecting, the algorithm

117
stops and the system requests an alternative stroke. The edges of this initial polygon
are called external edges, while edges added in the following triangulation are called
internal edges.
The system then performs constrained Delaunay triangulation of the polygon (Figure
71b). We then divide the triangles into three categories: triangles with two external
edges (terminal triangle), triangles with one external edge (sleeve triangle), and
triangles without external edges (junction triangle). The chordal axis is obtained by
connecting the midpoints of the internal edges (Figure 71c), but our inflation algorithm
first requires the pruning of insignificant branches and the retriangulation of the mesh.
This pruning algorithm is also introduced in [106].
To prune insignificant branches, we examine each terminal triangle in turn, expanding
it into progressively larger regions by merging it with adjacent triangles (Figure 72a-b).
Let X be a terminal triangle; then X has two exterior edges and one interior edge. We
erect a semicircle whose diameter is the interior edge, and which lies on the same side of
that edge as does X. If all three vertices of X lie on or within this semicircle, we remove
the interior edge and merge X with the triangle that lies on the other side of the edge.
a) start from T-triangle b) advance c) stop d) fan triangles
e) advance to J-triangle f) fan triangles at J-triangle
Figure 72. Pruning.
If the newly merged triangle is a sleeve triangle, then X now has three exterior edges
and a new interior edge. Again we erect a semicircle on the interior edge and check that

118
all vertices are within it. We continue until some vertex lies outside the semicircle
(Figure 72c), or until the newly merged triangle is a junction triangle. In the first case,
we triangulate X with a "fan" of triangles radiating from the midpoint of the interior
edge (Figure 72d). In the second case, we triangulate with a fan from the midpoint of the
junction triangle (Figure 72e-f). The resulting fan triangles are shown in Figure 72d.
The pruned spine is obtained by connecting the midpoints of remaining sleeve and
junction triangles’ internal edges (Figure 71e).
The next step is to subdivide the sleeve triangles and junction triangles to make them
ready for elevation. These triangles are divided at the spine and the resulting polygons
are triangulated, so that we now have a complete 2D triangular mesh between the spine
and the perimeter of the initial polygon (Figure 71f).
Next, each vertex of the spine is elevated proportionally to the average distance
between the vertex and the external vertices that are directly connected to the vertex
(Figure 73a,b). Each internal edge of each fan triangle, excluding spine edges, is
converted to a quarter oval (Figure 73c), and the system constructs an appropriate
polygonal mesh by sewing together the neighboring elevated edges, as shown in Figure
73d. The elevated mesh is copied to the other side to make the mesh closed and
symmetric. Finally, the system applies mesh refinement algorithms to remove short
edges and small triangles [56].
a) before b) elevate spines c) elevate edges d) sew elevated edges
Figure 73. Polygonal mesh construction.
7.5.2. Painting on the Surface
The system creates surface lines by sequentially projecting each line segment of the
input stroke onto the object’s surface polygons. For each line segment, the system first

119
calculates a bounded plane consisting of all rays shot from the camera through the
segment on the screen. Then the system finds all intersections between the plane and
each polygon of the object, and splices the resulting 3D line segments together (Figure
74). The actual implementation searches for the intersections efficiently using polygon
connectivity information. If a ray from the camera crosses multiple polygons, only the
polygon nearest to the camera position is used. If the resulting 3D segments cannot be
spliced together (e.g., if the stroke crosses a “fold” of the object), the algorithm fails.
Figure 74. Construction of surface lines.
7.5.3. Extrusion
The extrusion algorithm creates new polygonal meshes based on a closed base surface
line (called the base ring) and an extruding stroke. Briefly, the 2D extruding stroke is
projected onto a plane perpendicular to the object surface (Figure 75a), and the base
ring is swept along the projected extruding stroke (Figure 75b). The base ring is defined
as a closed 3D polyline that lies on the surface of the polygonal mesh, and the normal of
the ring is defined as that of the best matching plane of the ring.
First, the system finds the plane for projection: the plane passing through the base
ring’s center of gravity and lying parallel to the normal of the base ring4. Under the
4 The normal of the ring is calculated as follows: Project the points of the ring to the
original XY-plane. Then compute the enclosed “signed area” by the formula:
Axy = 0.5*sum(i=0, i=n-1, x[i]*y[i+1]-x[i+1]*y[i])
(indices are wrapped around so that x[n] means x[0]). Calculate Ayx and Azx similarly,
and the vector v=(Ayz,Azx,Axy) is defined as the normal of the ring.

120
above constraints, the plane faces towards the camera as much as possible (Figure 75a).
Then the algorithm projects the 2D extruding stroke onto the plane, producing a 3D
extruding stroke. Copies of the base ring are created along the extruding stroke in such
a way as to be almost perpendicular to the direction of the extrusion, and are resized to
fit within the stroke. This is done by advancing two pointers (left and right) along the
extruding stroke starting from both ends. In each step, the system chooses the best of
the following three possibilities: advance the left pointer, the right pointer, or both. The
goodness value increases when the angle between the line connecting the pointers and
the direction of the stroke at each pointer is close to 90 degrees (Figure 76a). This
process completes when the two pointers meet.
a) projection of the stroke b) sweep along the projected stroke
Figure 75. Extrusion algorithm.
Finally, the original polygons surrounded by the base ring are deleted, and new
polygons are created by sewing the neighboring copies of the base ring together [1]
(Figure 76b). The system uses the same algorithm to dig a cavity on the surface.
a) pointer advancing b) sewing adjacent rings
Figure 76. Sweeping the base ring.
This simple algorithm works well for a wide variety of extrusions but creates

121
unintuitive shapes when the user draws unexpected extruding strokes or when the base
surface is not sufficiently planar (Figure 77).
a) flat extrusion b) wavy extrusion c) wrapping extrusion
Figure 77. Unintuitive extrusions.
7.5.4. Cutting
The cutting algorithm is based on the painting algorithm. Each line segment of the
cutting stroke is projected onto the front and back facing polygons. The system connects
the corresponding end points of the projected edges to construct a planer polygon
(Figure 78). This operation is performed for every line segment, and the system
constructs the complete section by splicing these planer polygons together. Finally, the
system triangulates each planer polygon [118], and removes all polygons to the left of
the cutting stroke.
Figure 78. Cutting algorithm.
7.5.5. Smoothing
The smoothing operation deletes the polygons surrounded by the closed surface line
(called a ring) and creates new polygons to cover the hole smoothly. First, the system

122
translates the objects into a coordinate system whose Z-axis is parallel to the normal of
the ring. Next, the system creates a 2D polygon by projecting the ring onto the XY-plane
in the newly created coordinate system, and triangulates the polygon (Figure 79b). (The
current implementation fails if the area surrounded by the ring contains creases and is
folded when projected on the XY-plane.) The triangulation is designed to create a good
triangular mesh based on [118]: it first creates a constrained Delaunay triangulation
and gradually refines the mesh by edge splitting and flipping; then each vertex is
elevated along the Z-axis to create a smooth 3D surface (Figure 79d).
The algorithm for determining the Z-value of a vertex is as follows: For each edge of the
ring, consider a plane that passes through the vertex and the midpoint of the edge and
is parallel to the Z-axis. Then calculate the z-value of the vertex so that it lies on the 2D
Bezier curve that smoothly interpolates both ends of the ring on the plane (Figure 79c).
The final z-value of the vertex is the average of these z-values.
Finally, we apply a surface-fairing algorithm [138] to the newly created polygons to
enhance smoothness.
a) before b) triangulation c) calculating Z-value d) result
Figure 79. Smoothing algorithm.
7.6. Implementation
Our prototype is implemented as a 13,000 line Java program. We tested a display-
integrated tablet (Mutoh MVT-14, see Figure 1) and an electric whiteboard (Xerox
Liveboard) in addition to a standard mouse. The mesh construction process is
completely real-time, but causes a short pause (a few seconds) when the model becomes
complicated. Teddy can export models in OBJ file format. Figure 2 shows some 3D
models created with Teddy by an expert user and painted using a commercial texture-

123
map editor. Note that these models look quite different from 3D models created in other
modeling systems, reflecting the hand-drawn nature of the shape.
7.7. User Experience
The applet version of Teddy has undergone limited distribution, and has been used
(mainly by computer graphics researchers and students) to create different 3D models.
Feedback from these users indicates that Teddy is quite intuitive and encourages them
to explore various 3D designs. Figure 80 shows some 3D models create by novice users.
Note the users had no experience with traditional 3D modeling systems and they
created these models within several minutes. In addition, we have started close
observation of how first-time users (mainly graduate students in computer science)
learn Teddy. We start with a detailed tutorial and then show some stuffed animals,
asking the users to create them using Teddy. Generally, the users begin to create their
own models fluently within 10 minutes: five minutes of tutorial and five minutes of
guided practice. After that, it takes a few minutes for them to create a stuffed animal
such as those in Figure 60 (excluding the texture).
Figure 80. 3D models created by novice users in Teddy.
7.8. Future Work
Our current algorithms and implementation are robust and efficient enough for
experimental use. However, they can fail or generate unintuitive results when the user
draws unexpected strokes. We must devise more robust and flexible algorithms to
handle a variety of user inputs. In particular, we plan to enhance the extrusion
algorithm to allow more detailed control of surfaces. We are also considering using
implicit surface construction techniques.

124
Another important research direction is to develop additional modeling operations to
support a wider variety of shapes with arbitrary topology, and to allow more precise
control of the shape. Possible operations are creating creases, twisting the model, and
specifying the constraints between the separate parts for animation systems [103].
While we are satisfied with the simplicity of the current set of gestural operations, these
extended operations will inevitably complicate the interface, and careful interface
design will be required.
7.9. Summary
We introduced a sketching interface for freeform design, and described our current
algorithm and the Teddy system implementation. Unlike other sketch-based modelers,
our target is rotund, freeform models such as stuffed animals. The user specifies the
silhouette of the intended model interactively using freeform strokes, and the system
constructs a natural 3D model automatically. The user interface is significantly simple
and easy to use, and our implementation achieves real-time construction of polygonal
mesh based on 2D strokes. Our user experience has so far shown that first-time users
could create various organic models within minutes using the system.

125
Chapter 8
Freeform User Interfaces Revisited
This chapter revisits the concept of the Freeform User Interface. While Chapter 3
explained the basic idea behind Freeform UI and defined it according to three basic
properties, this chapter analyzes its characteristics and limitations based on our
experience with the preceding four example systems. We also provide several design
guidelines for refining Freeform UI systems.
8.1. Analyzing Freeform User Interface Systems
We now review the example systems described in the preceding chapters and other
pen-based research systems for graphical applications from the perspective of Freeform
User Interfaces. In the Figure 81, we rate the previous systems in terms of the three
properties of Freeform UI: freeform strokes as input, perceptual processing, and
informal presentation. The goal of these ratings is to clarify the idea of Freeform UI in
the context of various research activities, rather than to evaluate each research project.
The first five systems are two-dimensional, and the last four systems are three-
dimensional.
System Freeform strokes asinput
Perceptualprocessing
Informalpresentation
SILK [73] △ ─ ◯
Music Notepad [39] △ ─ ─
Baudel’s [6] ◯ △ ─

126
PerSketch [127] ◯ △ ◯
Pegasus △ ◎ ◯
Path-drawing ◯ ◯ △
SKETCH [161] △ ◎ ◎
3D curves [22] ◯ ◯ ◯
Teddy ◯ ◎ ◎
Legend: Low High
─ △ ◯ ◎
Figure 81. Interface systems with Freeform UI property ratings.
SILK [73] and Music Notepad [39] are gesture-based systems. The user’s stroke must
conform to a predefined gesture, and arbitrary shapes are not recognized. This falls
short of the freeform stroking property. The system associates the stroke with an
appropriate symbol using a simple-pattern-matching algorithm. This is, again, in
contrast to the perceptual processing property, which aims to extract high-level implicit
information from strokes. One important contribution of SILK is its use of a sketchy
appearance. The recognized widgets are displayed in the form of freeform strokes
without being replaced by cleaned-up graphics. The authors reported that the informal
appearance facilitated the exploratory design activities.
Baudel’s mark-based technique for editing spline curves [6] is a good example of
stroking as a primary input. The user specifies a desired curve shape using a freeform
stroke, and the system modifies the curve appropriately. The PerSketch system [127] is
important in that it emphasizes the importance of perceptual structure in freeform
drawings. However, it is basically a simple scribbling system and does not perform any
high-level processing other than flexible grouping of line segments.
Current implementation of Pegasus does not sufficiently exhibit Freeform UI properties
in that it supports only straight line segments. It is our future work to support curves
and make Pegasus a complete Freeform UI. Pegasus’s context-aware beautification and
prediction are good examples of perceptual processing in that the system automatically

127
infers high-level structures the user might perceive in the diagram. Pegasus
intentionally uses exceptionally thick line segments for displaying beautified segments
in order to prevent users from drawing too-complicated diagrams and expecting
excessive precision.
Path-drawing for 3D navigation exhibits Freeform UI properties to a reasonable extent.
It uses arbitrary freeform strokes as input, and finds the desired path considering the
structure of virtual 3D space. The painted path is presented in wide polyline in 3D
scenes.
The Sketch system [161] uses simple gestures for placing 3D objects in the scene. Some
gestures involve freeform strokes, but most consist of short straight line segments
representing characteristic edges of geometric primitives. The system calculates the
placement of objects in a 3D scene based on 2D input, considering the structure of the
3D scene and the user’s natural expectation that an object must rest on top of another
object. The authors introduced sketchy representation of 3D scenes, which was followed
by many similar efforts in the computer graphics research community [81]. Like the
SKETCH system, the sketch-based technique for 3D curves [22] infers the 3D shapes of
curves based on simple relationships between lines and shadows.
Teddy is a strong embodiment of Freeform UI. It introduced a fluent, natural interface
designed around stroke-based input for a task that has been considered significantly
complicated and difficult. It automatically infers the 3D shape of an object from a 2D
silhouette drawn by the user based on the assumption that typical freeform objects can
be represented by rotund surface. Teddy uses special pen-and-ink renderings for
displaying resulting 3D objects to facilitate exploratory activity and keep users from
worrying about details too much.
8.2. Limitations
Freeform UI achieves fluent interaction that is not possible with traditional GUI, but
several difficulties are inherent in it. This section discusses three major difficulties
(ambiguity, imprecision and learning), and the next section proposes possible solutions
to mitigate the problems.

128
Freeform UI is characterized by its indirect interaction style. Traditional command-
based interfaces accept explicit command input and perform the command directly
without any hidden processing. In contrast, Freeform UI accepts highly ambiguous
freeform strokes as input, and performs complicated processing internally to infer the
user’s intention from the strokes. This indirectness enables simple and intuitive
interaction, but at the same time the result of computation can be contrary to the user’s
own expectation and can cause frustration. The indirect operation is inherently
associated with the problem of ambiguity. It is difficult to infer appropriate
interpretation from the user’s ambiguous freeform strokes, and the behavior of
perceptual processing can be seen as ambiguous from the user’s perspective.
Imprecision is another problem inherent in Freeform UI. While mouse-based careful
manipulation of each control point in traditional GUI is suitable for editing precise
diagrams, handwritten freeform strokes are not good at precise control. Perceptual
processing and informal presentation are also incompatible with precise manipulation.
The indirect nature of Freeform UI also requires a learning process by the novice user.
Because a simple stroke can transform to a variety of results, the user has to try many
strokes and accumulate experience to master the operation. In other words, Freeform
UI imposes certain implicit rules to infer complicated information from simple strokes,
and the user has to learn the implicit rules through experience. The additional difficulty
is that it is difficult to describe the operations of Freeform UI in a textual manual.
However, once novice users understand the basic behavior of the operations, they can
perform a variety of complicated tasks using a few operations. In contrast, it is
relatively easy to learn a single command operation in traditional command-based
interfaces, but the user has to learn many commands, and their combinations, to
perform practical tasks.
8.3. Guidelines to Mitigate the Limitations
Based on our implementation and user study experience, we found several techniques
and design guidelines to mitigate the these problems. Although it is impossible to
remove these difficulties entirely because they are strongly associated with the
essential nature of Freeform UI, the following tips work as basic guidelines to design a
good Freeform UI system.
129
First, it is important to give users an appropriate impression that the system is not
designed for precise, detailed editing; this will help prevent frustration over ambiguous,
imprecise operation. We have already discussed that informal presentation is essential
to arousing appropriate expectations about the system’s behavior and to hide imprecise
details. In addition, a designer can install similar tricks in many places, such as in the
introduction to the system, in the system’s feedback messages and in the user manuals.
From a technical point of view, construction of multiple alternatives is an effective way
to mitigate ambiguity. This strategy is commonly used in Japanese text input systems
to type thousands of Chinese characters using a limited alphabet. Pegasus constructs
multiple alternatives as a result of beautification and prediction; this feature turned out
to be essential to making beautification and prediction perform practically. Construction
of multiple alternatives is definitely an important feature one should consider when
developing a system based on Freeform UI.
As for the problems of learning and ambiguity, it is important to make the interface
quick-responding and to ensure that changes can be easily undone so as to encourage
trial-and-error experience. It would be considerably frustrating if a user had to input a
lot of commands and wait a long time to see the result of computation for each operation.
In order to assure comfortable interaction with ambiguous Freeform UI systems, the
internal processing should return the result of computation instantly, and the interface
should allow lightweight interaction. Sometimes, it is necessary to sacrifice the quality
of computation to assure this quick response, which is in contrast to the fact that
traditional command-based systems frequently keep the user waiting during
complicated computations. For example, Teddy uses relatively simple algorithms to
calculate geometry quickly sacrificing surface quality, instead of using more advanced,
time-consuming algorithms.
Finally, it is necessary to give explanatory feedback for each operation so that the user
can easily understand why the system returned the unexpected result. This kind of
informative feedback is not very important in traditional command-based interfaces
because the system response is always predictable. However, well-designed informative
feedback is a crucial feature to prevent frustration and to facilitate the learning process
in Freeform UI. For example, Pegasus displays small marks indicating what kinds of
geometric constraints are satisfied by the beautified segment. In Teddy, many users
130
reported that the sound effect was very important to understand the system’s behavior.
We believe that informative feedback can allow the user to learn how to use the system
without having to read manuals or tutorials beforehand; it is our future work to test
this idea through practical implementation and user study.
8.4. Summary
This chapter discussed the concept of Freeform UI from various directions. To clarify the
concept of Freeform UI, several interface systems were reviewed in the context of three
Freeform UI properties. We pointed out that ambiguity, imprecision, and requirement
for learning were the inherent difficulties of Freeform UI. Finally, the following design
guidelines were proposed to mitigate the problem: Informal presentation of contents,
generation of multiple alternatives, quickly responding, easily undoable system, and
informative feedback.
131
Chapter 9
Conclusion
In this dissertation, we have addressed the problem of communicating informal
graphical ideas to computers. This chapter briefly summarizes the work, and discusses
some possibilities for future work.
9.1. Summary
Currently predominant WIMP-style GUI is not sufficient as the user interface design
paradigm to meet emerging needs for computing outside of office applications running
on desktop computers. Nielsen generalized these next-generation user interfaces as
non-command user interfaces [100], which allow the user to accomplish various tasks on
computers without having to give explicit commands. The goal of this dissertation is to
propose a non-command user interface framework for exploratory activities in the
domain of graphical computing.
We proposed an interface design framework for graphical computing based on pen-
based input, and named it Freeform UI. It uses freeform handwriting strokes as input,
allowing the user to convey graphical ideas to computers intuitively and fluently. The
system then recognizes the configuration of the strokes and performs appropriate
actions, freeing the users from tedious command operations. Finally, the system
presents the result of computation using informal rendering, which facilitates creative
thinking. Freeform UI is different from typical pen-based systems in that it analyzes
the perceptual structure of the drawings instead of using simple pattern-matching. We
described the following four example user interface systems as our basis for clarifying
the strengths and limitations of Freeform UI.
Pegasus is a 2D drawing program based on interactive beautification and prediction.

132
The system infers possible geometric constraints in the user’s freeform stroke input,
and automatically beautifies the stroke satisfying the constraints. It generates multiple
alternatives as the result of beautification, as a way to overcome the inherent ambiguity
in freeform strokes. The system also predicts the user’s next drawings from the
surrounding context. Using beautification and prediction, the user can construct precise
2D geometric illustrations without using complicated editing commands. A brief user
study showed that users can draw simple 2D diagrams more precisely and rapidly using
interactive beautification than with traditional CAD and drawing programs.
Path-drawing is a pen-based interaction technique for navigating through virtual 3D
environments fluently. The user draws the desired path on the 2D screen using a
freeform stroke, and the camera and avatar move along the projected path on the
walking surface. This technique frees the user from constant control caused by the
driving technique, and provides richer control than the simple click-and-jump technique.
Path-drawing navigation showed comparable performance and user satisfaction in our
user study.
Flatland is an experimental electronic office whiteboard system. It was designed to
support concurrent and continuous activities on personal office whiteboards as opposed
to task-specific short-term activities in meetings. We introduced an efficient screen real
estate management mechanism, pluggable application behaviors working on the
surface and an efficient history management mechanism. The system works as an
infrastructure for running various stroke-based applications including Pegasus and
Teddy.
Teddy is a sketch-based 3D freeform modeling system. The user draws 2D freeform
strokes interactively, and the system automatically constructs a reasonable 3D
geometry. The system is unique in that it is designed for rotund, freeform models such
as stuffed animals, which have been prohibitively difficult for the novice user to create
with traditional 3D modelers. The system uses interactive non-photorealistic rendering
to prevent the user from worrying about the details and to encourage exploration.
Based on these implementation efforts and user experiences, we observed that
ambiguity, imprecision and the requirement for learning are the inherent difficulties of
Freeform UI. We then proposed several design guidelines to mitigate the problems. For
example, informal presentation of contents gives an appropriate expectation in the
133
user’s mind, and the generation of multiple alternatives can address the problem of
ambiguity to some extent.
9.2. Future Directions
The basic idea behind Freeform UI is to leverage the user’s drawing ability in
computing environments. The four experimental systems described in this dissertation
are only a small sample of the broad possibilities. This section discusses some future
directions to explore further possibilities of drawing-based interfaces.
Various 3D input devices and active force feedback devices [107,111] are already on the
market. The idea of Freeform UI can lead to more-effective use of these devices than is
current the case. In general, research efforts on 3D devices and force feedback devices
focus on simulating the interaction style of the physical world in the virtual world. This
is only a first step, which corresponds to scribbling programs for 2D pen-based systems.
The next step should be to infer an advanced perceptual structure in the 3D trajectory
and to achieve fluent interaction beyond simple scribbling. One inherent difficulty with
these 3D devices is that people are not familiar with drawing strokes in a 3D empty
space. Drawing on a 3D surface using force feedback devices is expected to be better
than drawing freely in an empty space.
Motion can be represented as a freeform path with temporal information, and it might
be possible to use freeform sketching for specifying character animation. The question is
how to specify temporal information using freeform strokes. The temporal information
is not included in physical sketching, and it is not clear what kind of interface metaphor
works well for general users. It might be possible to use the movement of pen during
drawing operation, but it can be unintuitive because people are not used to controlling
temporal parameters during drawing.
Freeform strokes can be used to find similar drawings in a large picture database.
Stroke-based information retrieval is discussed in the Electronic Cocktail Napkin
project [49,50], but those designers use the configuration of simple primitives as the
basis for calculating similarity. Their system can find drawings consisting of simple
primitives such as a circle inside a rectangle, but it cannot find arbitrary freeform
drawings such as a cat’s silhouette. Geometric shape analysis methods, such as those

134
used in Teddy [113] can be a powerful tool for these shape-retrieval systems.
A natural extension of Pegasus and Teddy is to combine them. The idea is to integrate
beautification and prediction into 3D drawing interfaces such as Teddy and SKETCH.
Basic geometric constraints such as connection and symmetry are commonly seen in
typical 3D objects, and it will be significantly helpful to satisfy these constraints
automatically. One possible problem is that it is difficult to visualize multiple
possibilities in a 3D space because they will inevitably overlap each other. It is also
unclear how to let the user select one of several overlapping candidates.
As we have discussed in Chapter 7, the important challenge of Freeform UI is the
design of informative feedback or situated exploratory helps. In command-based UI, it
is relatively easy to describe the system’s behavior to novice users because the system’s
reaction to each command is well defined and obvious. However, the relationship
between the user’s freeform stroke input and the system’s reaction to it is complicated
in Freeform UI, and informative feedback to each user’s input stroke is necessary to
make the user understand this complicated relationship without a manual and a
tutorial. Although we have addressed this problem a little in Pegasus, nothing has been
done along these lines in Teddy. It is in our future work to find a general framework for
designing good informative feedback through implementation efforts and user study.
Adaptation and customization remain unexplored in this dissertation, but these
mechanisms are critical to improving the productivity of Freeform UI systems.
Perceptual processing is inherently ambiguous and arbitrary. Automatic adaptation
and/or explicit customization are required to make perceptual processing produce
appropriate results expected by individual users. It is relatively easy if the system
generates multiple candidates. The system can learn the user’s preference from what
candidate the user selects. In the case of Pegasus, it is possible to learn what kinds of
constraints the user prefers. A more complicated technique is to infer the user’s
preferences from the sequence of undo-and-retry operations. If the user dislikes a result
of an initial stroke, redraws a similar stroke and is satisfied by the new result, the
system can learn that it should generate the second result from the original stroke.
All systems introduced in this dissertation are research prototypes. The real evaluation
and contribution of these ideas will come from the deployment of real products based on
Freeform UI. Many issues must be addressed to make Freeform UI into successful

135
commercial products, including robust algorithms, intensive user studies, refined
system design, and carefully designed manuals, tutorials, and informative feedback. We
suspect that significant amounts of resources and trial-and-error processes will be
required to develop these new kinds of application programs, but only such efforts can
open new frontiers in computing.
9.3. Concluding Remarks
I was fascinated by pen-based computing when I saw the Xerox LiveBoard in 1995. I
spent all day drawing various illustrations on the LiveBoard using Microsoft’s paint
program. It was fun, but I noticed that the system did not make the most of pen-based
input, because the entire interface (Windows for Pen Computing) was designed for
operation with a mouse. It was really frustrating to push buttons, select menus, and
drag handles using a pen. In addition, the drawing activity in the paint program was
essentially nothing more than drawing using a plain pen and paper. Handwriting
character recognition and gesture recognition were commonly used, but I thought that
something more could be possible with pen computers. This experience led me to explore
various pen-based interaction techniques beyond mouse-oriented GUI and physical
pen-and-paper drawings, and that in turn led me to come up with the concept of
Freeform UI.
It is often the case that people simply apply traditional GUI to a new input device, or
they simply import the device’s physical interaction style into a computer, without
considering the essential nature of the input device. For example, early voice
recognition systems used a voice to select an item in a menu, and another typical
program was just to record the voice without any processing. Another good example of
poor application is an attempt to use an eye-tracking system to replace pressing buttons
on a screen. These approaches may be useful to a certain extent, but ultimately, the
most effective use of a new input device can only be possible by designing an
appropriate interaction technique for the device. The biggest message of this
dissertation is that one can design a powerful interaction technique by considering the
essential strength of a new input device, instead of naïvely applying existing interface
framework to the device.

136
Bibliography
1. Akeo,M., Hashimoto,H., Kobayashi,T., Shibusawa,T., Computer Graphics system forreproducing three-dimensional shape from idea sketch, Eurographics '94Proceedings, 13(3):477-488, 1994.
2. AMiTY SP, Mitsubishi Electronic Corp., http://www.melco.co.jp/
3. Apte,A., Kimura.D., A Comparison Study of the Pen and the Mouse in EditingGraphic Diagrams, Proceedings of Visual Languages '93, pp. 352-357, 1993.
4. Apte, A., Vo, V., and Kimura, T.D., Recognizing Multistroke Geometric Shapes: AnExperimental Evaluation, Proceedings of UIST'93, pp. 121 - 128. 1993.
5. Barequet,G., Sharir,M. Piecewise-linear interpolation between polygonal slices. ACM10th Computational Geometry Proceedings, pp. 93-102, 1994.
6. Baudel,T. A mark-based interaction paradigm for free-hand drawing. Proceedings ofUIST’94 Conference Proceedings, pp. 185-192, 1994.
7. Bederson, B.B., Hollan, J.F., Pad++: A Zooming graphical interface for exploringalternate interface physics, Proceedings of UIST’94.
8. Bell, D., Borenstein, J, Levine, S., Koren, Y., Jaros, A. The NavChair: An AssistiveNavigation System for Wheelchairs, based on Mobile Robot Obstacle Avoidance,Proceedings of the 1994 IEEE International Conference on Robotics and Automation,pp. 2012-2017, 1994.
9. Bier,E.A., Snap Dragging: Interactive Geometric Design in Two and ThreeDimensions, Ph.D thesis, U.C. Berkley EECS Department, April, 1988.
10. Bier,E.A., Stone,M.C., Snap Dragging, Computer Graphics, Vol.20, No.4, pp. 233-240, 1986.
11. Bier, E.A., Stone, M.C., Pier, K., Buxton, W., DeRose, T., Toolglass and magic lenses:The see-through interface, SIGGRAPH 93 Conference Proceedings.
12. Black,A. Visible Planning on Paper and on Screen: The Impact of Working Mediumon Decision–making by Novice Graphic Designers. Behavior & InformationTechnology. Vol.9, No.4, pp.283-296, 1990.
13. Bloomenthal,J., Wyvill,B. Interactive techniques for implicit modeling. Proceedingsof Interactive 3D Graphics’90, pp. 109-116, 1990.
137
14. Bolt,R., Put-that-There: Voice and Gesture at the Graphics Interface. SIGGRAPH 80Conference Proceedings, pp.262-270, 1980.
15. Bolz, D., Some Aspects of the User Interface of a Knowledge Based Beautifier forDrawings, Proceedings of 1993 Int'l Workshop on Intelligent User Interfaces,Gray,W.D., Hefley,W.E., Murray,D., Eds., ACM Press, New York, 1993.
16. Borning,A., The Programming Language Aspects of ThingLab, A constraint-Oriented Simulation Laboratory, ACM Transaction on Programming Languages andSystems, Vol.3, No.4, pp.353-387. 1981.
17. Bouma,W., Fudos,I., Hoffman.D., Cai,J., Paige,R., Geometric constraint solver,Computer-Aided Design, Vol.27, No.6, pp. 487-501, 1995.
18. Brocklehurst,E.R. The NPL Electronic Paper Project. International Journal of Man-Machine Studies, Vol.34, No.1, pp.69-95, 1991.
19. Bylinksy,G., Russian Help for Apple’s Newton. Fortune, Vol.128, No.1, p.12, July 12,1993.
20. Casey,M.A., Gardner,W.G., Basu,D. Vision Steered Beam-forming and TransauralRendering for the Artificial Life Interactive Video Environment (ALIVE),Proceedings of the 99th Convention of the Aud. Eng. Soc. (AES), 1995.
21. Chen,C.L.P., Xie,S., Freehand drawing system using a fuzzy logic concept,Computer-Aided Design, Vol.28, No.2, pp.77-89, 1996.
22. Cohen,J.M., Markosian,L., Zeleznik,R.C., Hughes,J.F., Barzel,R. An Interface forSketching 3D Curves. Proceedings of Interactive 3D Graphics’99, pp. 17-21, 1999.
23. Conte,S.D., Boor,d.C., Elementary Numerical Analysis, McGraw-Hill, 1972.
24. Correa,W.T., Jensen,R.J., Thayer,C.E., Finkelstein,A. Texture mapping for celanimation. SIGGRAPH 98 Conference Proceedings, pp. 435-456, 1998.
25. Cruz-Neira,C., Sandin,T.A., DeFanti,R.V. Surround screen projection-based virtualreality: the design and implementation of the cave, SIGGRAPH 94 ConferenceProceedings, pp.135-142, 1993.
26. Cypher,A. Watch What I Do: Programming by Demonstration. Cambridge, MA: MITPress. 1993.
27. Davis, M.R., Ellis,T.O. The Rand Tablet: A Man-MachineGraphical CommunicationDevice. Fall Joint Computer Conference Proceedings, Vol.26, AFIPS, pp.325-331,1964.
28. Davis, R.C., Landay,J.A., et.al. NotePals: Lightweight Note Sharing by the Group,for the Group. Proceeding of CHI’99, pp. 338-345, 1999.
29. Deering,M. The Holosketch VR sketching system. Communications of the ACM,39(5):54-61, May 1996.
30. Dori,D., Vector-Based Arc Segmentation in the Machine Drawing UnderstandingSystem Environment, IEEE Transactions on PAMI, 17(11):1057-1068, 1995.
138
31. Dori,D., Tombre,K. From Engineering Drawings to 3D CAD Models: Are We ReadyNow?, Computer-Aided Design, Vol.27, No.4, pp. 243-254, 1995.
32. Dourish, P., Edwards, W.K., LaMarca, A., Salisbury, M., Using Properties forUniform Interaction in the Presto Document System, Proceedings of UIST’99, 1999.
33. Edwards, W.K., Flexible Conflict Detection and Management in CollaborativeApplications. Proceedings of UIST’97.
34. Edwards, W.K., Mynatt, E.D., Timewarp: Techniques for Autonomous Collaboration.Proceedings of ACM CHI’97.
35. Eggli,L., Hsu,C., Elber,G., Bruderlin,B. Inferring 3D models from freehand sketchesand constraints. Computer-Aided Design, 29(2): 101-112, Feb.1997.
36. Elrod,S., et al. LiveBoard: A Large Interactive Display Supporting Group Meetings,Presentations and Remote Collaboration. Proceedings of ACM CHI’92, pp.599-607,1992.
37. Feiner,S., MacIntyre,B., Seligmann,D. Knowledge-based Augmented Reality.Communications of the ACM, Vol.36, No.7, pp.52-62.
38. Feiner,S., Nagy,S., van Dam, A., An Experimental System for Creating andPresenting Interactive Graphical Documents, ACM Transactions on Graphics, 1,1,January, pp.59-77, 1982.
39. Forsberg, A., Dieterich, M., Zeleznik, R.C. The Music Notepad. Proceedings of UIST'98, pp.203-210, 1998.
40. Fukumoto.M, Suenaga.Y, Mase.K. Finger-Pointer: Pointing Interface by ImageProcessing. Comput. & Graphics, Vol. 18, No. 5, pp. 633-642, 1994.
41. Galyean,T., Hughes,J.F. Sculpting: an interactive volumetric modeling technique.SIGGRAPH ’91 Conference Proceedings, pp. 267-274, 1991.
42. Gamma, E., Helm, R., Johnson, R., Vlissides, J., Design Patterns: Elements ofReusable Object-Oriented Software, Reading, MA, Addison-Wesley Publishing, 1995.
43. Geissler, J. Shuffle, throw or take it! Working efficiently with an interactive wall,CHI 98 Summary, pp.265-266, 1998.
44. Gleicher, M., Witkin,A., Drawing with constraints, The Visual Computer, Vol.11,No.1, pp. 39-51, 1994.
45. GO. PenPoint User Interface Design Reference. Reading, MA, Addison-Wesley, ISBN0-201-60858-8, 1992.
46. Goel,V. Sketches of Thought. The MIT Press. 1995.
47. Goldberg, D., Richardson, C. Touch-typing with a Stylus, Proceedings of ACMINTERCHI’93, pp.80-87, 1993.
48. Grimm,C., Pugmire,D., Bloomental,M., Hughes, J.F., Cohen,E. Visual interfaces forsolids modeling. Proceedings of UIST ’95, pp. 51-60, 1995.
49. Gross,M.D. “Recognizing and Interpreting Diagrams in Design”, Proceedings ofAVI’94, pp.89-94, 1994.

139
50. Gross,M.D., Do,E.Y.L. Ambiguous intentions: A paper-like interface for creativedesign. Proceedings of UIST’96, pp. 183-192, 1996.
51. Hanrahan,P., Haeberli,P. Direct WYSIWYG Painting and Texturing on 3D Shapes,ACM SIGGRAPH 90 Conference Proceedings, pp. 215-224, 1990.
52. Harada,Y., Miyamoto,K. Visual Dispatch: visibility-based application construction.Proceedings of WISS’96, pp.61-70, 1996, (in Japanese).
53. Heydon,A., Nelson,G., The Juno-2 Constraint-Based Drawing Editor, SRC ResearchReport 131a, System Research Center, Digital Equipment Corporation, Palo Alto,California, USA, December, 1994.
54. Hinckley,K., Pausch,R., Goble,J., Kassell, N. Passive real-world interface props forneurosurgical visualization. Proceedings of ACM CHI’94, pp.452-458, 1994.
55. Hopkins,D., The design and implementation of pie menus, Dr.Dobb's Journal 1,Vol.6, No.12, pp.16-26, 1991.
56. Hoppe,H., DeRose,T., Duchamp,T., McDonald,J., Stuetzle,W. Mesh optimization.SIGGRAPH 93 Conference Proceedings, pp. 19-26, 1993.
57. Hultquist,J. A virtual trackball. Graphics Gems (ed. A. Glassner). Academic Press,pp. 462-463, 1990.
58. Hutheesing, N., The Mother of Development. Forbes, Vol.157, No.2, pp.88-89,Jan.22, 1996.
59. Igarashi,T., Kawachiya, S., Matsuoka, S., Tanaka,H. In Search for an IdealComputer-Assisted Drawing System. Proceedings of INTERACT'97, pp.104-111,1997.
60. Igarashi,T., Matsuoka, S., Kawachiya, S., Tanaka,H. Interactive Beautification: ATechnique for Rapid Geometric Design, Proceedings of UIST’97, pp.105-114, 1997.
61. Igarashi,T., Matsuoka, S., Kawachiya, S., Tanaka,H., Pegasus: A Drawing Systemfor Rapid Geometric Design, CHI'98 summary, pp.24-25, 1998
62. Igarashi,T., Kadobayashi,R., Mase,K., Tanaka,H. Path Drawing for 3DWalkthrough. Proceedings of UIST’98, pp.173-174, 1998.
63. Igarashi,T., Matsuoka,S., Tanaka,H., Teddy: A Sketching Interface for 3D FreeformDesign, SIGGRAPH 99 Conference Proceedings, pp.409-416, 1999.
64. Jacob,R.J.K. The use of eye movements in human-computer interaction techniques:What you look at is what you get. ACM Transaction of Information Systems, Vol.9,No.2, pp.152-169, 1991.
65. Jaffar,J., Michaylov,S., Stuckey,P.J., Yap,R.H.C., The CLP(R) Language andSystem, ACM Transactions on Programming Languages and Systems, Vol.14, No.3,pp. 339-395, 1992.
66. Johnson,T.E. SketchpadIII, A computer program for drawing in three dimensions.Tutorial and Selected Readings in Interactive Computer Graphics, ed. HerbertFreeman, IEEE Computer Society, Silver Spring, MD, 1984.
140
67. Karsenty,S., Landay,J.A., Weikart,C., Inferring graphical constraints with Rockit,Proceedings of HCI'92, pp. 137-153, 1992.
68. Kazama,S., Kato,N., Nakagawa,M., A Hand-Drawing System with 'StationeryMetaphores’, Journal of the Information Processing Society of Japan, Vol.35, No.7,pp. 1457-1468, 1994.
69. Kramer, A., Translucent Patches–dissolving windows, Proceedings of UIST’94.
70. Kramer, A., Dynamic Interpretations in Translucent Patches –Representation-BasedApplications-, Proceedings of AVI’ 96.
71. Kurlander,D., Feiner,S., Interactive Constraint-Based Search and Replace,Proceedings of CHI'92, pp.609-618, 1992.
72. Lakin,F., Wambaugh,J., Leifer,S., Cannon,D., Steward,C., The electronic notebook:performing medium and processing medium, Visual Computer, Vol.5, pp.214-226,1989.
73. Landay,J.A., Myers,B.A. Interactive sketching for the early stages of user interfacedesign. Proceedings of CHI’95, pp. 43-50, 1995.
74. Lee, Y.L. PDA Users Can Express Themselves With Graffiti. Infoworld. Vol.16,No.40, p30, October 3, 1994.
75. Lopresti,D., Tomkins,A., Computing in the Ink Domain, Symbiosis of Human andArtifact, Proceedings of HCI'95, Vol.1, pp. 543-548, 1995.
76. MacDraw Manual, Apple Computer Inc., 1984.
77. MacCracken,R., Joy,K.I. Free-form deformations with lattices of arbitrary topology.SIGGRAPH 96 Conference Proceedings, pp. 181-188, 1996.
78. Mackinlay, J., Card, S.K., Robertson, C.G., Rapid Controlled Movement Through aVirtual 3D Workspace. SIGGRAPH 90 Conference Proceedings, pp. 171-176, 1990.
79. Mankoff,J., Abowd,G.D., Cirrin: A word-level unistroke keyboard for pen input.Proceedings of UIST’98, pp.213-214, 1998.
80. Markosian,L., Kowalski,M.A., Trychin,S.J. Bourdev,L.D., Goldstein,D., Hughes, J.F.Real-time nonphotorealistic rendering. SIGGRAPH 97 Conference Proceedings, pp.415-420, 1997.
81. L. Markosian, J.M. Cohen, T. Crulli and J.F. Hughes. Skin: A Constructive Approachto Modeling Free-form Shapes. SIGGRAPH 99 Conference Proceedings, to appear,1999.
82. Martin,G., Pittman,J., Wittenburg,K., Cohen,R., Parish,T. Sign Here, Please(Interactive Tablets), BYTE, Vol.15, No.7, pp.243-251, July, 1990.
83. Masui,T. Nakayama,K. Repeat and predict - two keys to efficient text editing,Proceedings of CHI '94, pp.118-123, 1994.
84. Masui,T. An efficient text input method for pen-based computers. Proceedings ofCHI’98, pp.328-335, 1998.

141
85. Matsushita,N., Rekimoto,J. HoloWall: Designing a Finger, Hand, Body, and ObjectSensitive Wall, Proceedings of UIST'97, pp.209-210, 1997.
86. Meyer, A. Pen computing. ACM SIGCHI Bulletin, Vol.27, No.3, pp.46-91, 1995.
87. Meyer,J. EtchaPad – Disposable Sketch Based Interfaces. CHI’96 ConferenceCompanion, pp.195-198, 1996.
88. Microsoft, Microsoft Windows for Pen Computing Programmer’s Reference, MicrosoftPress, 1992, ISBN 1-55615-469-0.
89. Moran, T.P., Chiu, P., van Melle, W., Kurtenbach, G., Implicit structures for pen-based systems within a freeform interaction paradigm, Proceedings of CHI’95,pp.487-494, 1995.
90. Moran, T.P., Chiu, P., van Melle, W., Kurtenbach, G., Pen-based interactiontechniques for organizing material on an electronic whiteboard. Proceedings ofUIST’97, pp.45-54, 1997.
91. Moran, T.P., van Melle, Chiu, P. Spatial Interpretation of Domain Objects Integratedinto a Freeform Electronic Whiteboard. Proceedings of UIST’98, pp.175-184, 1998
92. MVT-14, MUTOH Industries Ltd., http://www.mutoh.com/
93. Myers,B.A., Wolf,R., Potosnak,K., Graham,C., Huristics in Real User Interfaces,INTERCHI'93 Panel, Proceedings of InterCHI'93, pp.304-307, 1993.
94. Mynatt, E.D., The writing on the wall, Proceedings of INTERACT’99.
95. Mynatt,E.D., Igarashi,T., Edwards, W.K., LaMarca, A., Flatland: New Dimensionsin Office Whiteboards, Proceedings of CHI’99.
96. Nakagawa,M., Oguni,T., Yoshino,T. Human interface and application on IdeaBoard.Proceedings of INTERACT’97, 1997.
97. NaturallySpeaking, Dragon Systems Inc., http://www.dragonsys.com/
98. Nelson,G., Juno, A Constraint-based Graphics System, Computer Graphics, Vol.19,No.3, pp. 235-243, 1985.
99. Newton, Apple Computer, Inc., www.apple.com
100. Nielsen,J. Noncommand User Interfaces. Communications of the ACM, Vol.36,No.4, pp.83-99, 1993
101. Nishimura,H., Hirai,M., Kawai,T., Kawata,T., Shirakawa,I., Omura,K. Objectmodeling by distribution function and a method of image generation. Transactions ofthe Institute of Electronics and Communication Engineers of Japan, J68-D(4):718-725, 1985
102. van Overveld,K., Wyvill,B. Polygon inflation for animated models: a method for theextrusion of arbitrary polygon meshes. Journal of Visualization and ComputerAnimation, Vol. 18, pp. 3-16, 1997.
103. Pausch,R., et.al. Alice: Rapid prototyping system for virtual reality. IEEEComputer Graphics and Applications, 15(3): 8-11, May 1995.

142
104. Pavlidis,T., VanWyk,C.J., An Automatic Beautifier for Drawings and Illustrations,SIGGRAPH 85 Conference Proceedings, pp. 225-234, 1985.
105. Perlin,K. An Image Synthesizer. SIGGRAPH 85 Conference Proceedings, pp.287-296, 1985.
106. Perlin,K. Quikwriting: Continuous Stylus-based Text Entry, Proceedings ofUIST’98, pp.215-216.
107. PHANTOM, SensAble Technologies, Inc., http://www.sensable.com/
108. Phillips, C.B., Badler, N.I., Granieri,J. Automatic viewing control for 3D directmanipulation. Proceedings of Interactive 3D Graphics’92, pp.71-74, 1992.
109. Pierce, J., Forsberg, A., Conway, M., Hong, S., Zeleznik, R., Image Plane InteractionTechniques in 3D Immersive Environments. Proceedings of Interactive 3DGraphics'97, 1997.
110. Pierce,J., Stearns,B., Pausch,R. Two Handed Manipulation of Voodoo Dolls inVirtual Environments. Proceedings of Interactive 3D Graphics’99, 1999.
111. Polhemus Inc., http://www.polhemus.com
112. Prderson,E., McCall,K., Moran,T.P., Halasz,F., Tivoli: An electronic whiteboard forinformal workgroup meetings, Proceedings of INTERCHI’93, pp,391-399, 1993.
113. Prasad,L. Morphological analysis of shapes. CNLS Newsletter, 139: 1-18, July1997.
114. Pugh,D., Designing solid objects using interactive sketch interpretation, ComputerGraphics, Vol.25, No.2, pp. 117-126, 1992.
115. Raisamo,R., Raiha,K., A New Direct Manipulation Technique for Aligning Objectsin Drawing Programs, Proceedings of UIST'96, pp.157-164, 1996.
116. Rekimoto,J., Nagao,K. The World through the Computer: Computer AugmentedInteraction with Real World Environments. Proceedings of UIST’95, pp.29-36, 1995.
117. Rekimoto,J. Pick-and-Drop: A Direct Manipulation Technique for MultipleComputer Environments. Proceedings of UIST'97, pp.31-39, 1997.
118. Rekimoto,J., A Multiple Device Approach for Supporting Whiteboard-basedInteractions, Proceedings of CHI'98.
119. Rekimoto,J., Time-Machine Computing: A Time-centric Approach for theInformation Environment, Proceedings of UIST’99.
120. Rekimoto,J., Nagao,K. The World through the Computer: Computer AugmentedInteraction with Real World Environments, Proceedings of UIST’95, pp.29-36, 1995.
121. Rubine,D., Specifying Gestures by Example, ACM SIGGRAPH 91 ConferenceProceedings, pp.329-337, 1991.
122. Rubine,D., Combining Gestures and Direct Manipulation, Proceedings of CHI'92,pp.659-660, 1992.
143
123. Rutledge,J.D., Selker,T. Force-to-Motion Functions for Pointing, Proceedings ofINTERACT’90, pp.701-705, 1990.
124. Schumann,J., Strothotte,T., Raddb,A., Laser,S., Assessing the Effect of Non-photorealistic Rendered Images in CAD, Proceedings of CHI’96, pp.35-41, 1996.
125. Shewchuk, J.R. Triangle: engineering a 2D quality mesh generator and Delaunytriangulator. First Workshop on Applied Computational Geometry Proceedings, pp.124-133, 1996.
126. Singh,K., Fiume,E. Wires: a geometric deformation technique. SIGGRAPH 98Conference Proceedings, pp. 405-414, 1998.
127. Saund,E., Moran,T.P., A Perceptually Supported Sketch Editor, Proceedings ofUIST'94, pp. 175-184, 1994.
128. Schilit,B.N., Golovchinsky,G., Price,M. Beyond Paper: Supporting Active Readingwith Free Form Digital Ink Annotations. Proceedings of CHI’98, pp. 249-256, 1998.
129. Shneiderman,B., Direct Manipulation: A Step Beyond Programming Languages,IEEE Computer, Vol.16, No.8, pp.57-69, 1983.
130. SMART Board, SMART Technologies Inc., http://www.smarttech.com/
131. SmartSketch, FutureWave Software Inc., http://www.futurewave.com/
132. Starker,I., Bolt,R.A. A gaze-responsive self-disclosing display. Proceedings of ACMCHI’90, pp.3-9, 1989.
133. Streits,N., Gessler,J., Haake,J., Hol,J. Dolphin: integrated meeting support acrosslocal and remote desktop environments and livebaords. Proceedings of CSCW’94,pp.345-358, 1994.
134. Strothotte,T., Preim,B., Raab,A., Schumann,J., Forsey,D.R. How to Render Framesand Influence People. Proceedings of Eurographics’94, pp.455-466, 1994.
135. Sugishita,S., Kondo,K., Sato,H., Shimada,S., Kimura,F., Interactive FreehandSketch Interpreter for Geometric Modeling, Symbiosis of Human and Artifact,Proceedings of HCI'95, Vol.1, pp. 543-548, 1995.
136. Sutherland,I.E., Sketchpad: A Man-Machine Graphical Communication System,Proceedings of Spring Joint Computer Conference., No.23, pp.329-346, 1963.
137. Tappert,C.C., Suen,C.Y., Wakahara,T. The State of the At in On-Line HandwritingRecognition. IEEE Transactions on Pattern Analysis and Machine Intelligence,12(8), pp.787-808, 1990.
138. Taubin,G. A signal processing approach to fair surface design. SIGGRAPH 95Conference Proceedings, pp. 351-358, 1995.
139. van Dam,A. Post-WIMP User Interfaces, Communications of the ACM, Vol.40,No.2, pp. 63-67, 1997.
140. Venolia,D., Neiberg,F. T-Cube: A Fast, Self-Disclosing Pen-Based Alphabet.Proceedings of ACM CHI’94, p.218, 1994.
144
141. Virtual Reality: Scientific and Technology Challenges, Committee on VirtualReality Research and Development, National Research Council, Nathaniel Durlachand Anne Mavor, ed., National Academy of Science Press, 1995, ISBN 0-309-05135-5.
142. Wang,W., Grinstein,G., A Survey of 3D solid reconstruction from 2D projection linedrawings, Computer Graphics Forum, Vol.12, No.2, pp.137-158, 1993.
143. Wang,S.W., Kaufman,A.E. Volume sculpting. Proceedings of Interactive 3DGraphics’95, pp. 109-116, 1995.
144. Want, R., Hopper, A., Falcao,V., Gibbons, J. The Active Badge Location System.ACM Transactions on Information Systems, Vol.10, No.1, pp.91-102, 1992.
145. Weiser, M. The computer for the 21st Century. Scientific American, Vol.265, No.3,pp.66-75, 1991
146. Weiser, M. Some Compuer Science Issues in Ubiquitous Computing.Communications of the ACM, Vol. 36, No.7, pp.75-84, 1993
147. Weitzman,L., Designer: A Knowledge-Based Graphic Design Assistant, ICS Report8609, University of California, San Diego, 1986.
148. Welch,W., Witkin,A. Free-form shape design using triangulated surfaces.SIGGRAPH 94 Conference Proceedings, pp. 247-256, 1994.
149. Wellner, P., Interacting with paper on the DigitalDesk. Communications of theACM, Vol.36, No. 7, July, 1993.
150. Wellner, P., Mackay, W., Gold, R. Special Isuue on Computer AugmentedEnvironments: Back to the Real World. Communications of the ACM, Vol.36, No. 7,July, 1993.
151. Wilcox,L.D., Schilit,B.N., Sawhney,N. Dynomite: A dynamically organized ink andaudio notebook. Proceedings of CHI’97, p.186-193, 1997.
152. Williams,L. Shading in Two Dimensions. Graphics Interface ’91, pp.143-151, 1991.
153. Williams,L. 3D Paint. Proceedings of Interactive 3D Graphics’90, pp.225-233, 1990.
154. Winkenbach,G., Salesin,D.H., Computer Generated Pen-and-Ink Illustration.SIGGRAPH 94 Conference Proceedings, pp.91-100, 1994.
155. Wolf, C.G., Rhyne,J.R., Ellozy,H.A. The Paper-Like Interface. Proceeding of theThird International Conference on Human-Computer Interaction, pp.494-501, 1989.
156. Wong,Y.Y. Rough and Ready Prototypes: Lessons From Graphic Design. Proceedingof CHI’92, pp.83-84, 1992.
157. Wren,C.R., Azarbayejani,A., Darrell,T., Pentland,A. Pfinder: Real-Time Tracking ofthe Human Body, IEEE Transactions on Pattern Analysis and Machine Intelligence,Vol.19, No.7, pp.780-785, 1997.
158. Xiao, D., Hubbold,R. Navigation Guided by Artificial Force Fields, Proceedings ofACM CHI 98, pp. 179-186, 1997.
159. Zao,R., Incremental Recognition in Gesture-Based and Syntax-Directed DiagramEditors, Proceedings of INTERCHI'93, pp. 95-100, 1993.

145
160. Zaurus, Sharp Corp., http://www.sharp.co.jp
161. Zeleznik,R.C., Herndon, K.P., Hughes,J.F. SKETCH: An interface for sketching 3Dscenes. SIGGRAPH 96 Conference Proceedings, pp. 163-170, 1996.