Embed Size (px)
Citation preview
J. Fluid Mech. (2001), vol. 443, pp. 197–229. Printed in the United Kingdom
c© 2001 Cambridge University Press
197
Free vibrations of two side-by-side cylindersin a cross-flow
By Y. Z H O U1†, Z. J. W A N G1, R. M. C. S O1, S. J. X U1
AND W. J I N2
1Department of Mechanical Engineering, The Hong Kong Polytechnic University, Hung Hom,Kowloon, Hong Kong
2Department of Electrical Engineering, The Hong Kong Polytechnic University, Hung Hom,Kowloon, Hong Kong
(Received 4 April 2000 and in revised form 27 March 2001)
Free vibrations of two side-by-side cylinders with fixed support (no rotation anddisplacement) at both ends placed in a cross-flow were experimentally investigated.Two fibre-optic Bragg grating sensors were used to measure the dynamic strain, whilea hot wire and flow visualization were employed to examine the flow field aroundthe cylinders. Three T/d ratios, 3.00, 1.70 and 1.13, were investigated, where T isthe centre-to-centre cylinder spacing and d is the diameter; they give rise to threedifferent flow regimes. The investigation throws new light on the shed vortices andtheir evolution. A new interpretation is proposed for the two different dominantfrequencies, which are associated with the narrow and the wide wake when the gapbetween the cylinders is between 1.5 and 2.0 as reported in the literature. The structuralvibration behaviour is closely linked to the flow characteristics. At T/d = 3.00, thecross-flow root-mean-square strain distribution shows a very prominent peak atthe reduced velocity Ur ≈ 26 when the vortex shedding frequency fs, coincideswith the third-mode natural frequency of the combined fluid–cylinder system. WhenT/d < 3.00, this peak is not evident and the vibration is suppressed because of theweakening strength of the vortices. The characteristics of the system modal dampingratios, including both structural and fluid damping, and natural frequencies are alsoinvestigated. It is found that both parameters depend on T/d. Furthermore, theyvary slowly with Ur , except near resonance where a sharp variation occurs. Thesharp variation in the natural frequencies of the combined system is dictated by thevortex shedding frequency, in contrast with the lock-in phenomenon, where the forcedvibration of a structure modifies the vortex shedding frequency. This behaviour ofthe system natural frequencies persists even in the case of the single cylinder anddoes not seem to depend on the interference between cylinders. A linear analysis ofan isolated cylinder in a cross-flow has been carried out. The linear model predictionis qualitatively consistent with the experimental observation of the system dampingratios and natural frequencies, thus providing valuable insight into the physics offluid–structure interactions.
1. IntroductionWhen a two-dimensional bluff body/cylinder is subject to a cross-flow, vortex
shedding from the structure creates fluid excitation forces which, in turn, cause the
† Author to whom correspondence should be addressed: e-mail [email protected]
198 Y. Zhou, Z. J. Wang, R. M. C. So, S. J. Xu and W. Jin
structure to vibrate. The resultant structural motions influence the flow field, givingrise to fluid–structure coupling and modifying the frequency and magnitude of theinduced forces. The coupling is in general a highly nonlinear function of the structuralmotion and flow velocity and is not well understood. Since flow-induced vibrationshave significant impact on the fatigue life of structures and could have disastrousconsequences, interest in understanding the associated physics and predicting thestructural motions is rapidly growing (Blevins 1994; Ziada & Staubli 2000).
Flow-induced vibration is governed by a number of major parameters. Amongthese are the reduced velocity, Ur , the damping ratio and the mass ratio (Chen1987). Each of these parameters plays a different role in the dynamic response of thecylinder. The damping ratio is the ratio of the energy dissipated by the system to thetotal system energy. The mass ratio, which is the ratio of the cylinder mass to thedisplaced fluid mass, provides a measure of the relative importance of the differentfluid force components. The reduced velocity Ur , defined by U∞/f(1)
0 d, where U∞ isthe free-stream velocity, d is the cylinder diameter and f
(1)0 is the first-mode natural
frequency of a stationary cylinder, is linked to the ratio of the vortex sheddingfrequency fs to the structural natural frequency. Here, the term structural naturalfrequency is used loosely to mean the structural natural frequency of any one of thevibration modes, but is usually taken to imply the first mode. The natural frequency isthe vibration frequency with which a structure or system, after an initial disturbance,oscillates without external forces. In a vortex-induced free vibration problem, fs isresponsible for the creation of the unsteady forces. Therefore, the interplay betweenthe two frequencies determines the resultant behaviour of the cylinder dynamics andthe wake structure. This is especially true when resonance (or synchronization) occurs,which can be loosely defined as the situation where fs is approximately equal to thestructural natural frequency. Strictly speaking, resonance occurs when the naturalfrequency of the combined fluid–structure system is equal to fs. However, the naturalfrequency of the system and, to a certain extent, fs are not known a priori. Therefore,the fluid–structure interaction problem is very complicated and its behaviour at ornear resonance is of great interest to engineers.
The free vibration problem is further complicated by the presence of an identicalneighbouring cylinder, such as in the case of two side-by-side cylinders. Here, besidesthe parameters mentioned above, the problem is also governed by the ratio of thecentre-to-centre cylinder spacing T to diameter d. Varying this ratio could lead to theformation of a single or multiple wakes (Landweber 1942; Spivac 1946; Ishigai et al.1972; Bearman & Wadcock 1973; Zdravkovich 1985; Zhou et al. 2000a) and this, inturn, could affect the dynamic response and the resonance behaviour of the cylinders.Furthermore, the nonlinear interplay between the simultaneous vibrations of the twocylinders and the fluid as a result of flow-induced forces is a far more complicatedprocess than the fluid–cylinder interaction in the single cylinder case.
Interference between circular cylinders placed side-by-side in a cross-flow hasbeen investigated extensively (Zdravkovich 1977) because of its inherent importanceand practical significance in many branches of engineering. The interference dragmeasurements of two side-by-side cylinders facing a uniform flow can be traced backto Biermann & Herrnstein (1933). Zdravkovich & Pridden (1977) measured the liftand drag coefficients and noted that the sum of the low and high drag generated bythe two cylinders was always less than twice the drag of a single cylinder. Using aphotographic method, Landweber (1942) observed a single vortex street for T/d 6 1.5and two distinct vortex streets for T/d > 2. Spivac (1946) measured two differentfrequencies in the two-cylinder wake for T/d < 2 but a single frequency for T/d > 2.
Vibrations of two cylinders in a cross-flow 199
In the latter case, the frequency was further found to be the same as that measured inthe single cylinder wake. A Schlieren optical method was used by Ishigai et al. (1972)to visualize the flow behind two side-by-side cylinders. They observed a remarkablysymmetric vortex formation and shedding for T/d = 2.5 and 3.0, but a biased gapflow for 1.5 < T/d < 2.0. The biased flow was bi-stable and intermittently changedover from one side to another, forming two asymmetric vortex streets of differentfrequencies. Bearman & Wadcock (1973) have made a similar observation in theirexperiments. Based on flow visualization at a low Re (6 200), Williamson (1985)suggested that the two different frequencies, observed in the asymmetric flow regime(1.5 6 T/d 6 2.0), were due to the existence of harmonic vortex-shedding modes. Onthe other hand, the measurements of Kim & Durbin (1988) at Re = 3300 did notsupport this conjecture. Therefore, the mechanism for the two distinct frequencies inthe asymmetric flow regime has yet to be properly understood.
Previous studies were mostly concerned with the behaviour of the wake flow andthe flow-induced vibrations on rigid cylinders. Even in the free vibration case, thecylinders, flexibly mounted at both ends, were relatively rigid. Here, a rigid cylinderis defined as one having infinite structural stiffness. The dynamic characteristics ofan elastic cylinder, defined as one with finite structural stiffness, fix-supported atboth ends (no deflection), can be quite different from a rigid one. For example,there is only one natural frequency for a rigid cylinder system but more than oneassociated with an elastic cylinder system (Zhou et al. 1999; So, Zhou & Liu 2000).There have been relatively few studies on two side-by-side elastic cylinders in across-flow. Consequently, many issues remain to be resolved. For example, how isthe free vibration of an elastic cylinder in a cross-flow affected by the presenceof a neighbouring cylinder? In a forced vibration situation, the imposed vibrationmodifies the vortex shedding frequency. However, in the free vibration case, thevortex shedding generates the excitation forces. Could the vortex shedding modify thenatural frequencies of the fluid–cylinder system? Are these frequencies dependent onT/d and Ur?
Damping is another important issue. It models the energy dissipation of the systemduring vibration and plays an important role in the stability of a structure and itsvibration amplitude. Knowledge of damping is essential if the dynamic behaviour ofthe structures in a cross-flow is to be understood thoroughly. Damping arises fromthe fluid surrounding the structure as well as from the structure itself. While structuraldamping is related to the properties of the structure alone, fluid damping originatesfrom viscous dissipation and fluid drag. In other words, fluid damping is the result ofviscous shearing of the fluid at the surface of the structure and the behaviour of flowseparation. Therefore, it is motion dependent and is much more difficult to estimate.Using an auto-regressive moving average (ARMA) analysis technique, Zhou, So &Mignolet (2000b) and So et al. (2001) deduced the effective and fluid damping ratiosfrom the calculated lift and displacement signals of a single cylinder in a cross-flowover a range of Re. In these studies, the cylinder motion was modelled by a two-degree-of-freedom system. Later, Wang, So & Liu (2000) used the same techniqueto analyse similar signals derived by employing the Euler–Bernoulli beam theory tomodel the free vibration of a single cylinder. All these studies yield reasonable resultscompared to measured fluid damping ratios. In particular, Wang et al. (2000) wereable to deduce the fluid damping ratios for the first and third mode of vibration.However, the issue of how interference between cylinders affects the damping ratioshas yet to be addressed. It is not clear whether damping behaviour is, if at all, relatedto the system natural frequencies.
200 Y. Zhou, Z. J. Wang, R. M. C. So, S. J. Xu and W. Jin
Test rigfixed on ground
Vibrationabsorber
Vibrationabsorber
Vibrationabsorber
Vibrationabsorber
Test cylinders
Contraction Screens
Vibration absorber
Electric motorand centrifugal fan
Working section(350 mm × 350 mm × 500 mm)
Inlet contraction
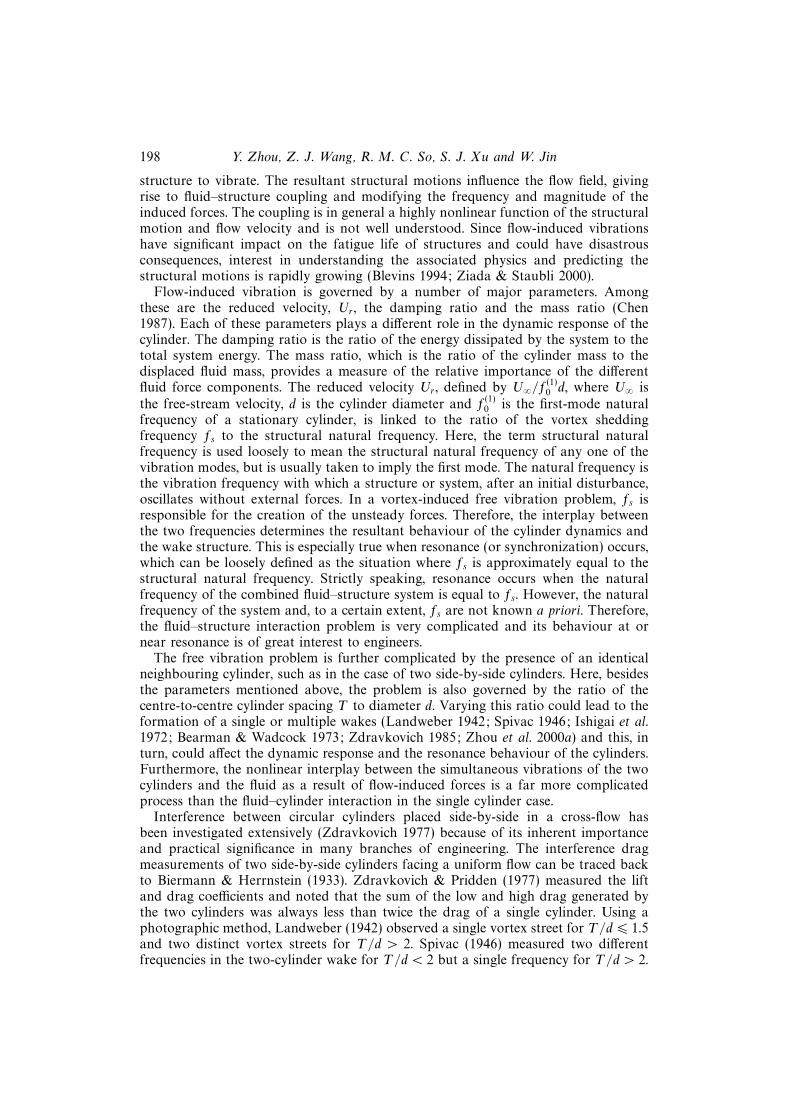
Figure 1. Schematic diagram of the test wind tunnel.
The present work aims to investigate experimentally the free vibration of two side-by-side cylinders placed in a cross-flow and the associated nonlinear fluid–cylinderinteractions. The first objective is to improve the understanding of the flow structurearound the cylinders, including the mean pressure distribution, the induced lift anddrag, and the vortex formation and its evolution at different T/d ratios. In particular,the two distinct frequencies in the asymmetric flow regime are examined basedon flow visualization and hot-wire signals. The second objective is to study fluid–structure interactions. The free vibration of the two cylinders due to flow excitationis characterized in detail. The dependence on T/d and Ur of the natural frequencyof the combined fluid–structure system is investigated thoroughly, in particular atand near resonance. The effective and fluid damping ratios are evaluated from themeasured strain signals using an ARMA technique (Mignolet & Red-Horse 1994).The observations from measurements are further discussed in conjunction with alinear analysis of the fluid–cylinder system in order to gain a better understanding ofthe physics associated with fluid–structure interactions.
2. Experimental details2.1. Experimental setup
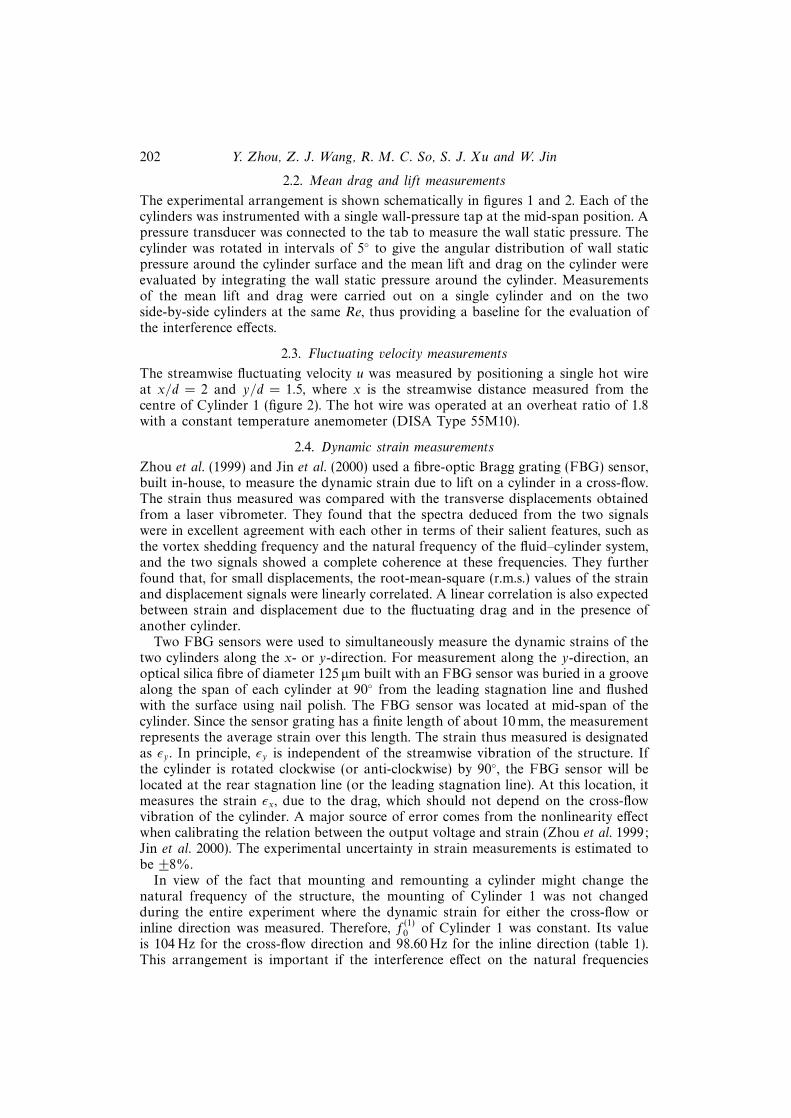
Experiments were carried out in a suction-type wind tunnel with a 0.35 m × 0.35 msquare cross-section that is 0.5 m long (figure 1). The wind speed of the workingsection can be adjusted from 1.5 to 28 m s−1. The streamwise velocity is uniform towithin 0.05% and the free-stream turbulence intensity is 0.2%. In order to minimizetunnel vibrations, the working section is isolated from the motor and fan throughvibration absorbers. More details of the tunnel are given in Zhou et al. (1999) andSo et al. (2000).
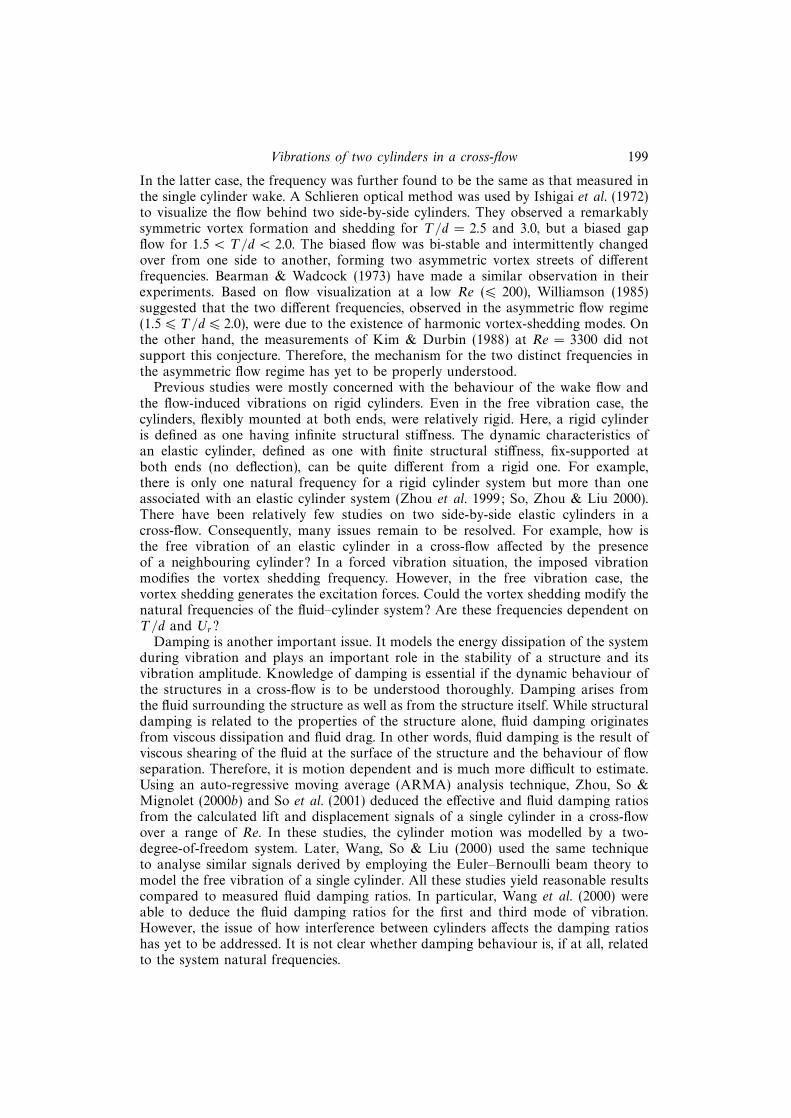
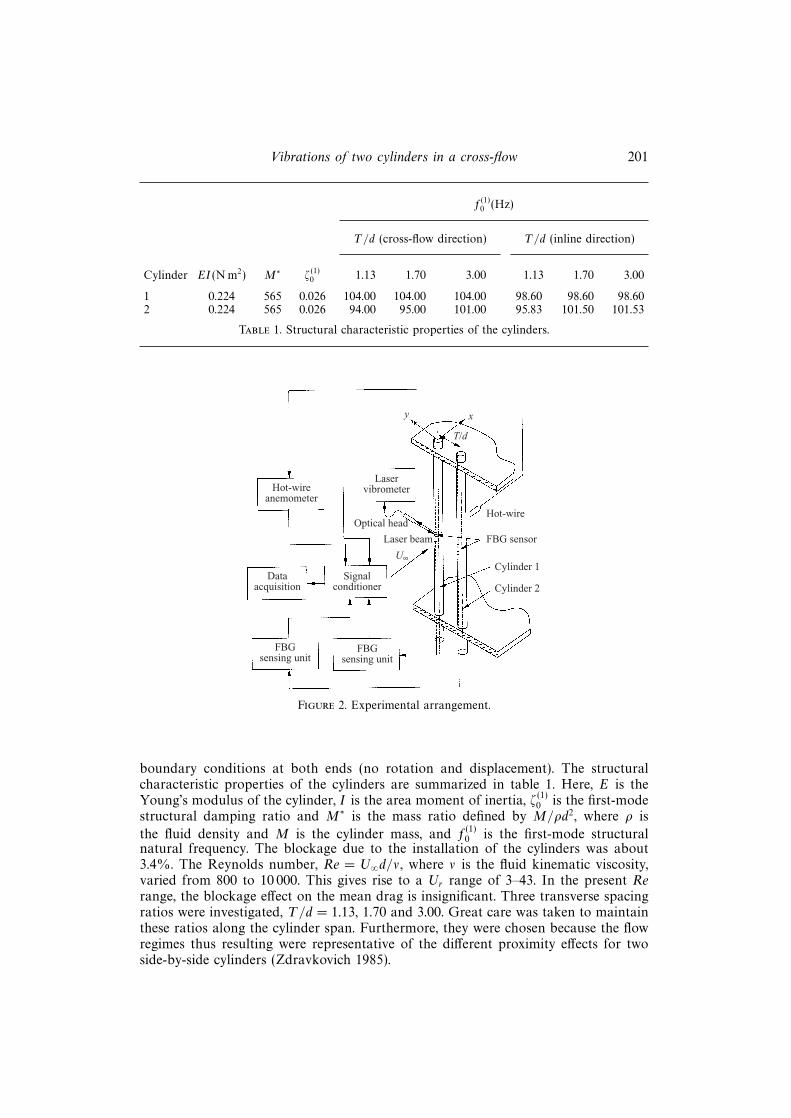
Two identical acrylic tubes with a diameter of d ≈ 0.006 m were mounted verticallyin a side-by-side arrangement and placed symmetrically to the mid-plane of theworking section at 0.20 m downstream of the exit plane of the tunnel contraction(figures 1 and 2). The coordinate system is attached to Cylinder 1 with y equal tozero at the centre of this cylinder (figure 2), and the other is labelled Cylinder 2.The two cylinders were built into the walls of the working section, with fix-supported
Vibrations of two cylinders in a cross-flow 201
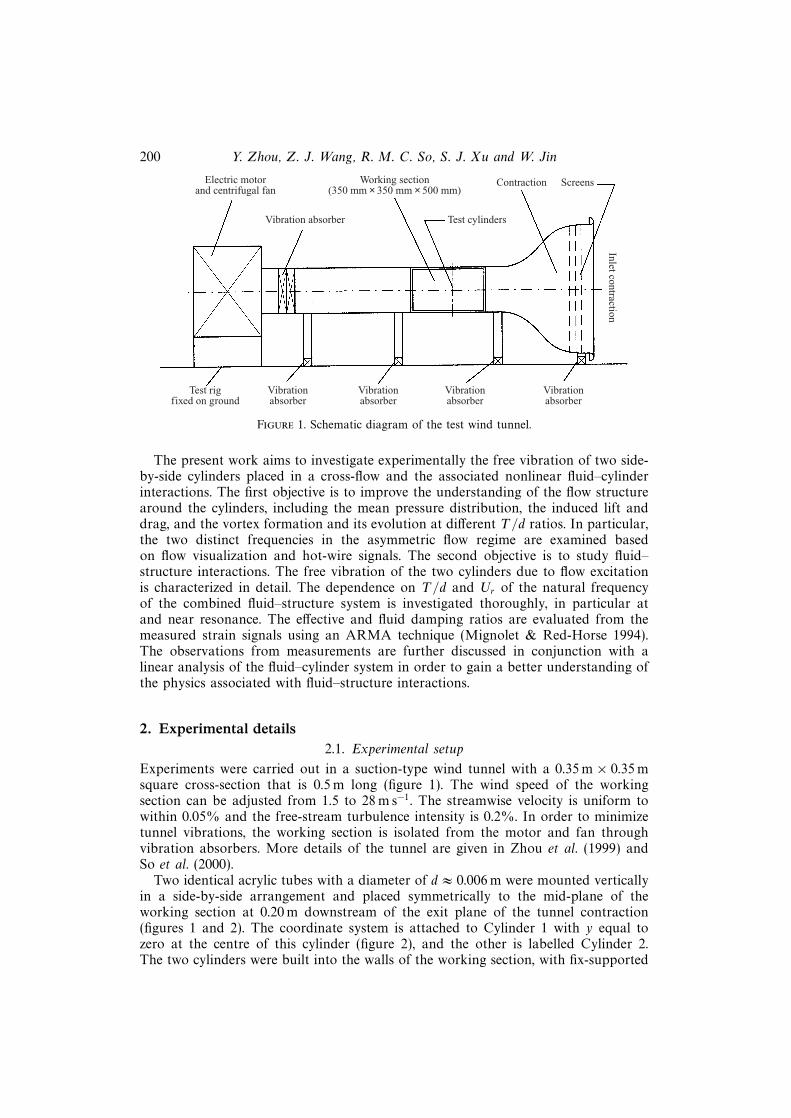
f(1)0 (Hz)
T/d (cross-flow direction) T/d (inline direction)
Cylinder EI(N m2) M∗ ζ(1)0 1.13 1.70 3.00 1.13 1.70 3.00
1 0.224 565 0.026 104.00 104.00 104.00 98.60 98.60 98.602 0.224 565 0.026 94.00 95.00 101.00 95.83 101.50 101.53
Table 1. Structural characteristic properties of the cylinders.
Hot-wireanemometer
Dataacquisition
Signalconditioner
FBGsensing unit
FBGsensing unit
Laservibrometer
Hot-wire
FBG sensor
Cylinder 1
Cylinder 2
y x
T/d
U∞
Optical head
Laser beam
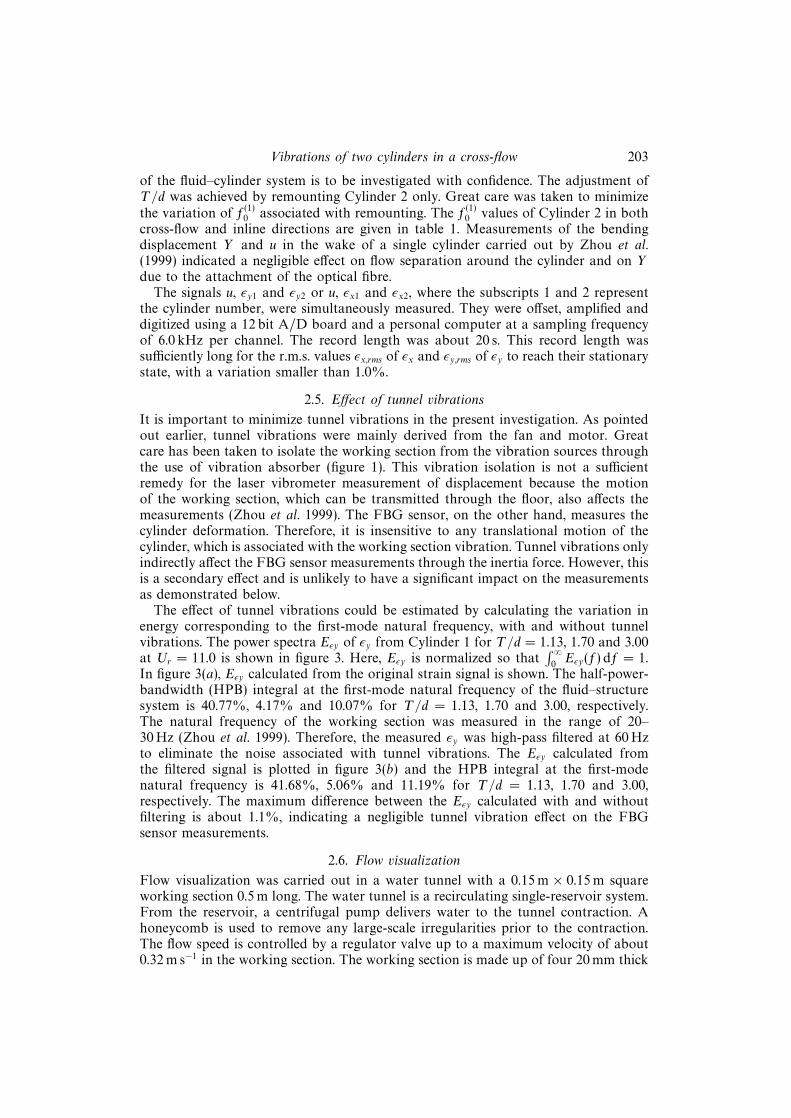
Figure 2. Experimental arrangement.
boundary conditions at both ends (no rotation and displacement). The structuralcharacteristic properties of the cylinders are summarized in table 1. Here, E is theYoung’s modulus of the cylinder, I is the area moment of inertia, ζ(1)
0 is the first-modestructural damping ratio and M∗ is the mass ratio defined by M/ρd2, where ρ is
the fluid density and M is the cylinder mass, and f(1)0 is the first-mode structural
natural frequency. The blockage due to the installation of the cylinders was about3.4%. The Reynolds number, Re = U∞d/ν, where ν is the fluid kinematic viscosity,varied from 800 to 10 000. This gives rise to a Ur range of 3–43. In the present Rerange, the blockage effect on the mean drag is insignificant. Three transverse spacingratios were investigated, T/d = 1.13, 1.70 and 3.00. Great care was taken to maintainthese ratios along the cylinder span. Furthermore, they were chosen because the flowregimes thus resulting were representative of the different proximity effects for twoside-by-side cylinders (Zdravkovich 1985).
202 Y. Zhou, Z. J. Wang, R. M. C. So, S. J. Xu and W. Jin
2.2. Mean drag and lift measurements
The experimental arrangement is shown schematically in figures 1 and 2. Each of thecylinders was instrumented with a single wall-pressure tap at the mid-span position. Apressure transducer was connected to the tab to measure the wall static pressure. Thecylinder was rotated in intervals of 5 to give the angular distribution of wall staticpressure around the cylinder surface and the mean lift and drag on the cylinder wereevaluated by integrating the wall static pressure around the cylinder. Measurementsof the mean lift and drag were carried out on a single cylinder and on the twoside-by-side cylinders at the same Re, thus providing a baseline for the evaluation ofthe interference effects.
2.3. Fluctuating velocity measurements
The streamwise fluctuating velocity u was measured by positioning a single hot wireat x/d = 2 and y/d = 1.5, where x is the streamwise distance measured from thecentre of Cylinder 1 (figure 2). The hot wire was operated at an overheat ratio of 1.8with a constant temperature anemometer (DISA Type 55M10).
2.4. Dynamic strain measurements
Zhou et al. (1999) and Jin et al. (2000) used a fibre-optic Bragg grating (FBG) sensor,built in-house, to measure the dynamic strain due to lift on a cylinder in a cross-flow.The strain thus measured was compared with the transverse displacements obtainedfrom a laser vibrometer. They found that the spectra deduced from the two signalswere in excellent agreement with each other in terms of their salient features, such asthe vortex shedding frequency and the natural frequency of the fluid–cylinder system,and the two signals showed a complete coherence at these frequencies. They furtherfound that, for small displacements, the root-mean-square (r.m.s.) values of the strainand displacement signals were linearly correlated. A linear correlation is also expectedbetween strain and displacement due to the fluctuating drag and in the presence ofanother cylinder.
Two FBG sensors were used to simultaneously measure the dynamic strains of thetwo cylinders along the x- or y-direction. For measurement along the y-direction, anoptical silica fibre of diameter 125 µm built with an FBG sensor was buried in a groovealong the span of each cylinder at 90 from the leading stagnation line and flushedwith the surface using nail polish. The FBG sensor was located at mid-span of thecylinder. Since the sensor grating has a finite length of about 10 mm, the measurementrepresents the average strain over this length. The strain thus measured is designatedas εy . In principle, εy is independent of the streamwise vibration of the structure. Ifthe cylinder is rotated clockwise (or anti-clockwise) by 90, the FBG sensor will belocated at the rear stagnation line (or the leading stagnation line). At this location, itmeasures the strain εx, due to the drag, which should not depend on the cross-flowvibration of the cylinder. A major source of error comes from the nonlinearity effectwhen calibrating the relation between the output voltage and strain (Zhou et al. 1999;Jin et al. 2000). The experimental uncertainty in strain measurements is estimated tobe ±8%.
In view of the fact that mounting and remounting a cylinder might change thenatural frequency of the structure, the mounting of Cylinder 1 was not changedduring the entire experiment where the dynamic strain for either the cross-flow orinline direction was measured. Therefore, f(1)
0 of Cylinder 1 was constant. Its valueis 104 Hz for the cross-flow direction and 98.60 Hz for the inline direction (table 1).This arrangement is important if the interference effect on the natural frequencies
Vibrations of two cylinders in a cross-flow 203
of the fluid–cylinder system is to be investigated with confidence. The adjustment ofT/d was achieved by remounting Cylinder 2 only. Great care was taken to minimizethe variation of f(1)
0 associated with remounting. The f(1)0 values of Cylinder 2 in both
cross-flow and inline directions are given in table 1. Measurements of the bendingdisplacement Y and u in the wake of a single cylinder carried out by Zhou et al.(1999) indicated a negligible effect on flow separation around the cylinder and on Ydue to the attachment of the optical fibre.
The signals u, εy1 and εy2 or u, εx1 and εx2, where the subscripts 1 and 2 representthe cylinder number, were simultaneously measured. They were offset, amplified anddigitized using a 12 bit A/D board and a personal computer at a sampling frequencyof 6.0 kHz per channel. The record length was about 20 s. This record length wassufficiently long for the r.m.s. values εx,rms of εx and εy,rms of εy to reach their stationarystate, with a variation smaller than 1.0%.
2.5. Effect of tunnel vibrations
It is important to minimize tunnel vibrations in the present investigation. As pointedout earlier, tunnel vibrations were mainly derived from the fan and motor. Greatcare has been taken to isolate the working section from the vibration sources throughthe use of vibration absorber (figure 1). This vibration isolation is not a sufficientremedy for the laser vibrometer measurement of displacement because the motionof the working section, which can be transmitted through the floor, also affects themeasurements (Zhou et al. 1999). The FBG sensor, on the other hand, measures thecylinder deformation. Therefore, it is insensitive to any translational motion of thecylinder, which is associated with the working section vibration. Tunnel vibrations onlyindirectly affect the FBG sensor measurements through the inertia force. However, thisis a secondary effect and is unlikely to have a significant impact on the measurementsas demonstrated below.
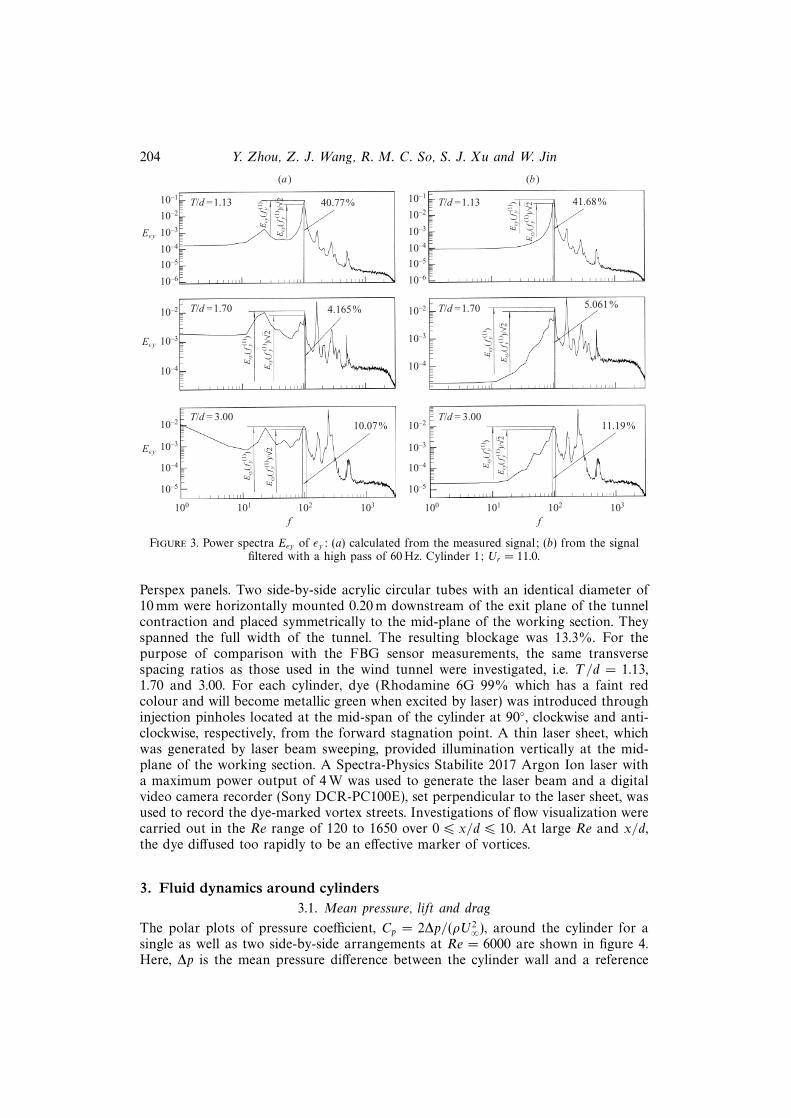
The effect of tunnel vibrations could be estimated by calculating the variation inenergy corresponding to the first-mode natural frequency, with and without tunnelvibrations. The power spectra Eεy of εy from Cylinder 1 for T/d = 1.13, 1.70 and 3.00at Ur = 11.0 is shown in figure 3. Here, Eεy is normalized so that
∫ ∞0Eεy(f) df = 1.
In figure 3(a), Eεy calculated from the original strain signal is shown. The half-power-bandwidth (HPB) integral at the first-mode natural frequency of the fluid–structuresystem is 40.77%, 4.17% and 10.07% for T/d = 1.13, 1.70 and 3.00, respectively.The natural frequency of the working section was measured in the range of 20–30 Hz (Zhou et al. 1999). Therefore, the measured εy was high-pass filtered at 60 Hzto eliminate the noise associated with tunnel vibrations. The Eεy calculated fromthe filtered signal is plotted in figure 3(b) and the HPB integral at the first-modenatural frequency is 41.68%, 5.06% and 11.19% for T/d = 1.13, 1.70 and 3.00,respectively. The maximum difference between the Eεy calculated with and withoutfiltering is about 1.1%, indicating a negligible tunnel vibration effect on the FBGsensor measurements.
2.6. Flow visualization
Flow visualization was carried out in a water tunnel with a 0.15 m × 0.15 m squareworking section 0.5 m long. The water tunnel is a recirculating single-reservoir system.From the reservoir, a centrifugal pump delivers water to the tunnel contraction. Ahoneycomb is used to remove any large-scale irregularities prior to the contraction.The flow speed is controlled by a regulator valve up to a maximum velocity of about0.32 m s−1 in the working section. The working section is made up of four 20 mm thick
204 Y. Zhou, Z. J. Wang, R. M. C. So, S. J. Xu and W. Jin
10–1
10–2
10–3
10–4
10–5
10–6
10–2
10–3
10–4
10–2
10–3
10–4
10–5
Eεy
T/d =1.13
T/d =1.70
T/d = 3.0010.07%
4.165%
40.77%
(a )
Eεy
(fy(1
) )
Eεy
(fy(1
) )/√2
Eεy
(fy(1
) )
Eεy
(fy(1
) )/√2
Eεy
(fy(1
) )
Eεy
(fy(1
) )/√2
101100 102 103
f
10–1
10–2
10–3
10–4
10–5
10–6
10–2
10–3
10–4
10–2
10–3
10–4
10–5
T/d =1.13
T/d =1.70
T/d = 3.0011.19%
5.061%
41.68%
(b )
Eεy
(fy(1
) )
Eεy
(fy(1
) )/√2
Eεy
(fy(1
) )
Eεy
(fy(1
) )/√2
Eεy
(fy(1
) )
Eεy
(fy(1
) )/√2
101100 102 103
f
Eεy
Eεy
Figure 3. Power spectra Eεy of εy: (a) calculated from the measured signal; (b) from the signalfiltered with a high pass of 60 Hz. Cylinder 1; Ur = 11.0.
Perspex panels. Two side-by-side acrylic circular tubes with an identical diameter of10 mm were horizontally mounted 0.20 m downstream of the exit plane of the tunnelcontraction and placed symmetrically to the mid-plane of the working section. Theyspanned the full width of the tunnel. The resulting blockage was 13.3%. For thepurpose of comparison with the FBG sensor measurements, the same transversespacing ratios as those used in the wind tunnel were investigated, i.e. T/d = 1.13,1.70 and 3.00. For each cylinder, dye (Rhodamine 6G 99% which has a faint redcolour and will become metallic green when excited by laser) was introduced throughinjection pinholes located at the mid-span of the cylinder at 90, clockwise and anti-clockwise, respectively, from the forward stagnation point. A thin laser sheet, whichwas generated by laser beam sweeping, provided illumination vertically at the mid-plane of the working section. A Spectra-Physics Stabilite 2017 Argon Ion laser witha maximum power output of 4 W was used to generate the laser beam and a digitalvideo camera recorder (Sony DCR-PC100E), set perpendicular to the laser sheet, wasused to record the dye-marked vortex streets. Investigations of flow visualization werecarried out in the Re range of 120 to 1650 over 0 6 x/d 6 10. At large Re and x/d,the dye diffused too rapidly to be an effective marker of vortices.
3. Fluid dynamics around cylinders3.1. Mean pressure, lift and drag
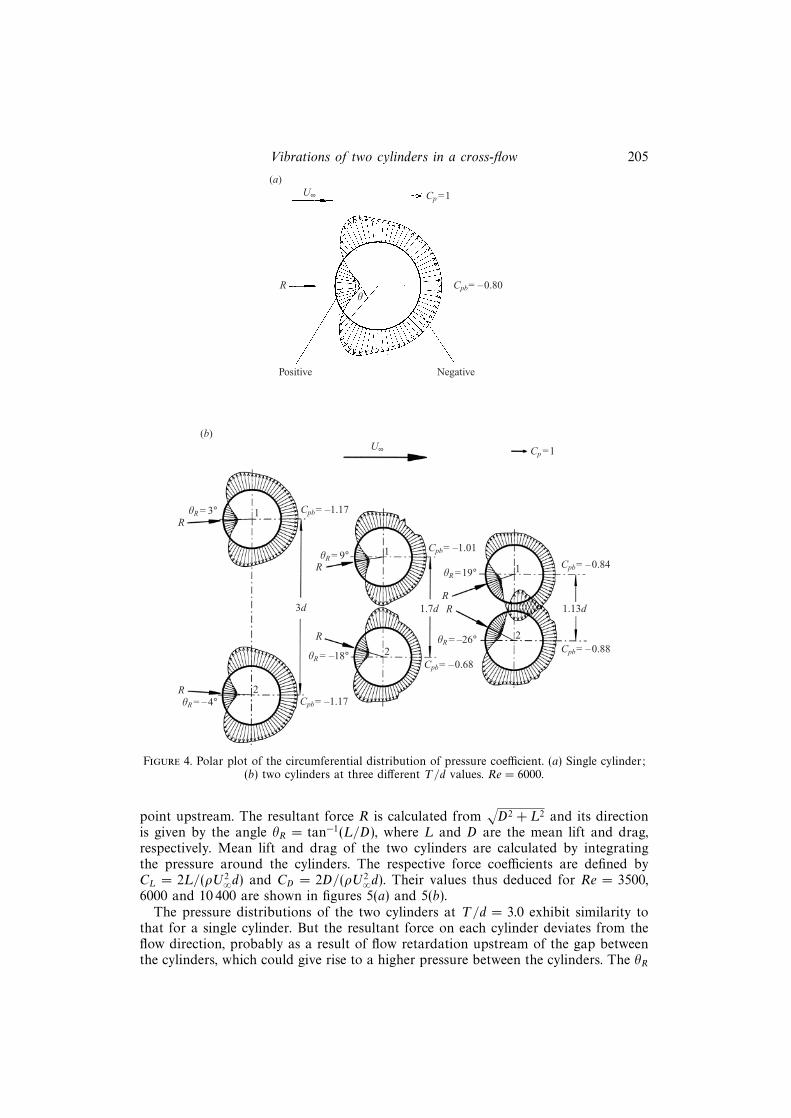
The polar plots of pressure coefficient, Cp = 2∆p/(ρU2∞), around the cylinder for asingle as well as two side-by-side arrangements at Re = 6000 are shown in figure 4.Here, ∆p is the mean pressure difference between the cylinder wall and a reference
Vibrations of two cylinders in a cross-flow 205
R
Positive Negative
Cp =1U∞
(a)
Cpb= –0.80h
Cp =1U∞
(b)
R
RR
R
R
R
Cpb= –1.17
Cpb= –1.01
Cpb= –0.84
Cpb= –0.88
1.13d1.7d3d
Cpb= –0.68
Cpb= –1.17
hR = –18°
hR = 9°
hR = 3°
hR = –4°
hR =19°
hR = –26°
1
1
1
2
2
2
Figure 4. Polar plot of the circumferential distribution of pressure coefficient. (a) Single cylinder;(b) two cylinders at three different T/d values. Re = 6000.
point upstream. The resultant force R is calculated from√D2 + L2 and its direction
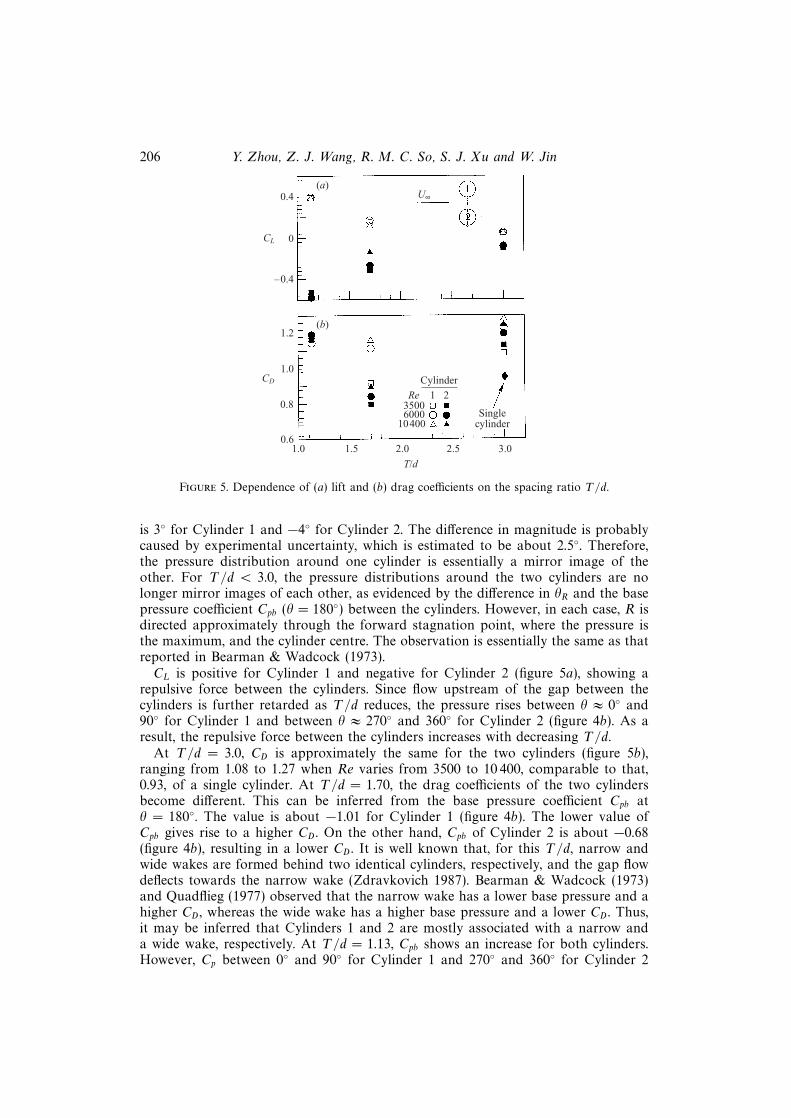
is given by the angle θR = tan−1(L/D), where L and D are the mean lift and drag,respectively. Mean lift and drag of the two cylinders are calculated by integratingthe pressure around the cylinders. The respective force coefficients are defined byCL = 2L/(ρU2∞d) and CD = 2D/(ρU2∞d). Their values thus deduced for Re = 3500,6000 and 10 400 are shown in figures 5(a) and 5(b).
The pressure distributions of the two cylinders at T/d = 3.0 exhibit similarity tothat for a single cylinder. But the resultant force on each cylinder deviates from theflow direction, probably as a result of flow retardation upstream of the gap betweenthe cylinders, which could give rise to a higher pressure between the cylinders. The θR
206 Y. Zhou, Z. J. Wang, R. M. C. So, S. J. Xu and W. Jin
0.4
0
–0.4
1.2
1.0
0.8
0.61.0 1.5 2.0 2.5 3.0
Singlecylinder
1 2
Cylinder
60003500
10400
T/d
CD
CL
(a)
(b)
Re
U∞
Figure 5. Dependence of (a) lift and (b) drag coefficients on the spacing ratio T/d.
is 3 for Cylinder 1 and −4 for Cylinder 2. The difference in magnitude is probablycaused by experimental uncertainty, which is estimated to be about 2.5. Therefore,the pressure distribution around one cylinder is essentially a mirror image of theother. For T/d < 3.0, the pressure distributions around the two cylinders are nolonger mirror images of each other, as evidenced by the difference in θR and the basepressure coefficient Cpb (θ = 180) between the cylinders. However, in each case, R isdirected approximately through the forward stagnation point, where the pressure isthe maximum, and the cylinder centre. The observation is essentially the same as thatreported in Bearman & Wadcock (1973).CL is positive for Cylinder 1 and negative for Cylinder 2 (figure 5a), showing a
repulsive force between the cylinders. Since flow upstream of the gap between thecylinders is further retarded as T/d reduces, the pressure rises between θ ≈ 0 and90 for Cylinder 1 and between θ ≈ 270 and 360 for Cylinder 2 (figure 4b). As aresult, the repulsive force between the cylinders increases with decreasing T/d.
At T/d = 3.0, CD is approximately the same for the two cylinders (figure 5b),ranging from 1.08 to 1.27 when Re varies from 3500 to 10 400, comparable to that,0.93, of a single cylinder. At T/d = 1.70, the drag coefficients of the two cylindersbecome different. This can be inferred from the base pressure coefficient Cpb atθ = 180. The value is about −1.01 for Cylinder 1 (figure 4b). The lower value ofCpb gives rise to a higher CD . On the other hand, Cpb of Cylinder 2 is about −0.68(figure 4b), resulting in a lower CD . It is well known that, for this T/d, narrow andwide wakes are formed behind two identical cylinders, respectively, and the gap flowdeflects towards the narrow wake (Zdravkovich 1987). Bearman & Wadcock (1973)and Quadflieg (1977) observed that the narrow wake has a lower base pressure and ahigher CD , whereas the wide wake has a higher base pressure and a lower CD . Thus,it may be inferred that Cylinders 1 and 2 are mostly associated with a narrow anda wide wake, respectively. At T/d = 1.13, Cpb shows an increase for both cylinders.However, Cp between 0 and 90 for Cylinder 1 and 270 and 360 for Cylinder 2
Vibrations of two cylinders in a cross-flow 207
also increases significantly, due to more severe flow retardation upstream of the gapbetween the cylinders. Consequently, CD is higher for both cylinders. There is stilla difference in the measured CD between the two cylinders, though less pronouncedthan that obtained at T/d = 1.70. At such a small T/d, a single vortex street isexpected behind the cylinders (Landweber 1942). Photographs from laser-illuminatedflow visualization shown in § 3.2 indicate a biased bleeding between the cylinders. Thebiased bleeding probably accounts for the difference in the Cp distribution betweenthe cylinders (figure 4b), and hence unequal CD for the two cylinders.
The mean of the low and high CD values at T/d = 3.00 is 1.2, appreciably higherthan that (0.93) of a single cylinder at Re = 6000. The difference cannot be attributedto the experimental uncertainty, which is estimated to be 2%. Further investigationis needed to understand this observation. For T/d < 3.00, this mean is generally lessthan that determined at T/d = 3.00, consistent with that reported in Zdravkovich& Pridden (1977). In the near wake of an isolated cylinder, about 50% of theshed circulation was cancelled as fluid bearing vorticity was drawn across the wakecentreline into the growing vortex with opposite vorticity (Gerrard 1966; Cantwell &Coles 1983). One would expect that the interference between the narrow and widewakes might cause additional cancellation of vorticity as well as absorb some flowenergy, thus resulting in reduced vortex strength. This, in turn, causes a higher basepressure as exhibited in figure 4, hence a reduced total drag.
3.2. Flow patterns
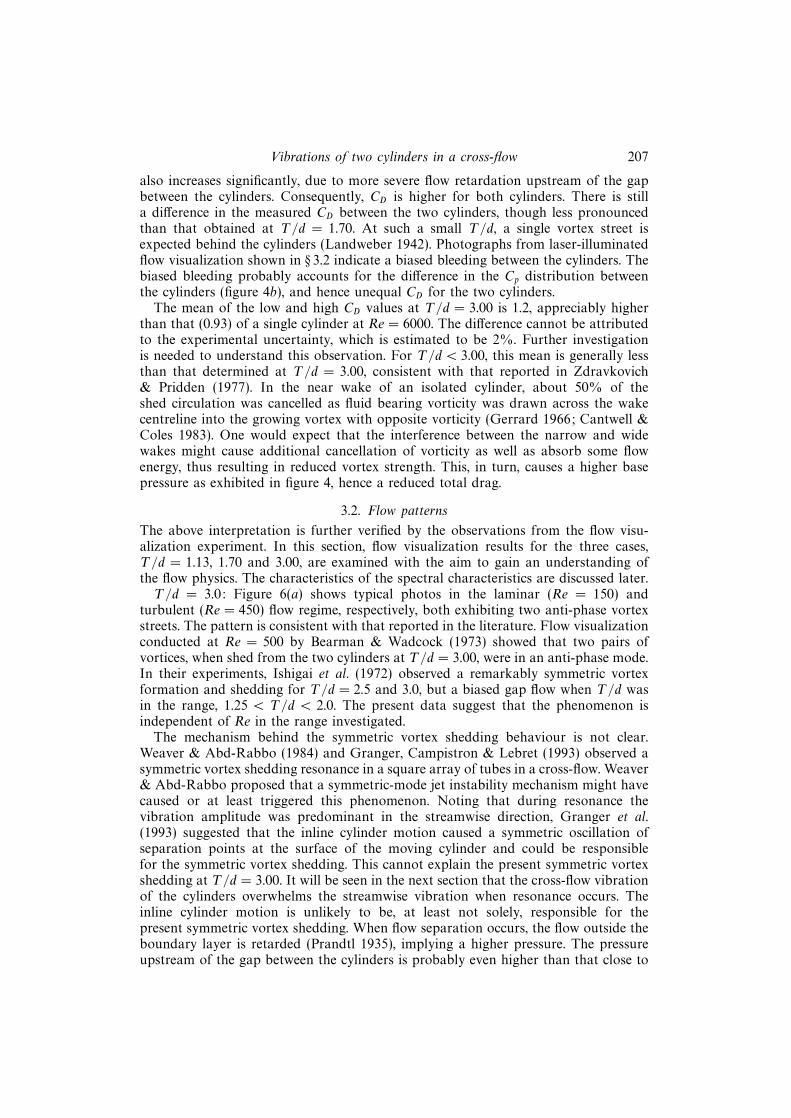
The above interpretation is further verified by the observations from the flow visu-alization experiment. In this section, flow visualization results for the three cases,T/d = 1.13, 1.70 and 3.00, are examined with the aim to gain an understanding ofthe flow physics. The characteristics of the spectral characteristics are discussed later.T/d = 3.0: Figure 6(a) shows typical photos in the laminar (Re = 150) and
turbulent (Re = 450) flow regime, respectively, both exhibiting two anti-phase vortexstreets. The pattern is consistent with that reported in the literature. Flow visualizationconducted at Re = 500 by Bearman & Wadcock (1973) showed that two pairs ofvortices, when shed from the two cylinders at T/d = 3.00, were in an anti-phase mode.In their experiments, Ishigai et al. (1972) observed a remarkably symmetric vortexformation and shedding for T/d = 2.5 and 3.0, but a biased gap flow when T/d wasin the range, 1.25 < T/d < 2.0. The present data suggest that the phenomenon isindependent of Re in the range investigated.
The mechanism behind the symmetric vortex shedding behaviour is not clear.Weaver & Abd-Rabbo (1984) and Granger, Campistron & Lebret (1993) observed asymmetric vortex shedding resonance in a square array of tubes in a cross-flow. Weaver& Abd-Rabbo proposed that a symmetric-mode jet instability mechanism might havecaused or at least triggered this phenomenon. Noting that during resonance thevibration amplitude was predominant in the streamwise direction, Granger et al.(1993) suggested that the inline cylinder motion caused a symmetric oscillation ofseparation points at the surface of the moving cylinder and could be responsiblefor the symmetric vortex shedding. This cannot explain the present symmetric vortexshedding at T/d = 3.00. It will be seen in the next section that the cross-flow vibrationof the cylinders overwhelms the streamwise vibration when resonance occurs. Theinline cylinder motion is unlikely to be, at least not solely, responsible for thepresent symmetric vortex shedding. When flow separation occurs, the flow outside theboundary layer is retarded (Prandtl 1935), implying a higher pressure. The pressureupstream of the gap between the cylinders is probably even higher than that close to
208 Y. Zhou, Z. J. Wang, R. M. C. So, S. J. Xu and W. Jin
Re =150 Re = 450(a)
(b)
(c)
Figure 6. Laser-illuminated flow visualization in the water tunnel behind two side-by-sidecylinders. Flow is from left to right. (a) T/d = 300, (b) 1.70, (c) 1.13.
the free stream, as suggested in figure 4, thus forming a pressure differential on thetwo sides of each cylinder in the cross-flow direction. This pressure differential couldbe symmetrical with respect to the mid-point of the gap and could tend to suppressthe anti-symmetrical vortex shedding and induce the symmetric behaviour.T/d = 1.7: Typical photographs of the near-wake flow (figure 6b) from flow
visualization in the laminar and turbulent flow regimes indicate a deflected gap flowbetween the two cylinders, thus forming one narrow and one wide wake. The resultsare consistent with those for T/d = 1.5 ∼ 2.0 previously reported (Spivack 1946;Ishigai et al. 1972; Bearman & Wadcock 1973; Kamemoto 1976; Kiya et al. 1980;Kim & Durbin 1988; Sumner et al. 1999).T/d = 1.13: The gap vortices were not observed and most vortices were shed alter-
nately from the free-stream side of the two cylinders, as evidenced in the photographs(figure 6c). The photograph at Re = 450 further displays a gap flow or bleedingdeflected towards the upper cylinder. The deflected bleeding is likely to cause a differ-ence in pb between cylinders, and thus be responsible for the different CD (figure 5b).It is worth mentioning that flow visualization data did show the symmetric vortexshedding from time to time when the gap flow was not deflected.
Vibrations of two cylinders in a cross-flow 209
3.3. Spectral characteristics
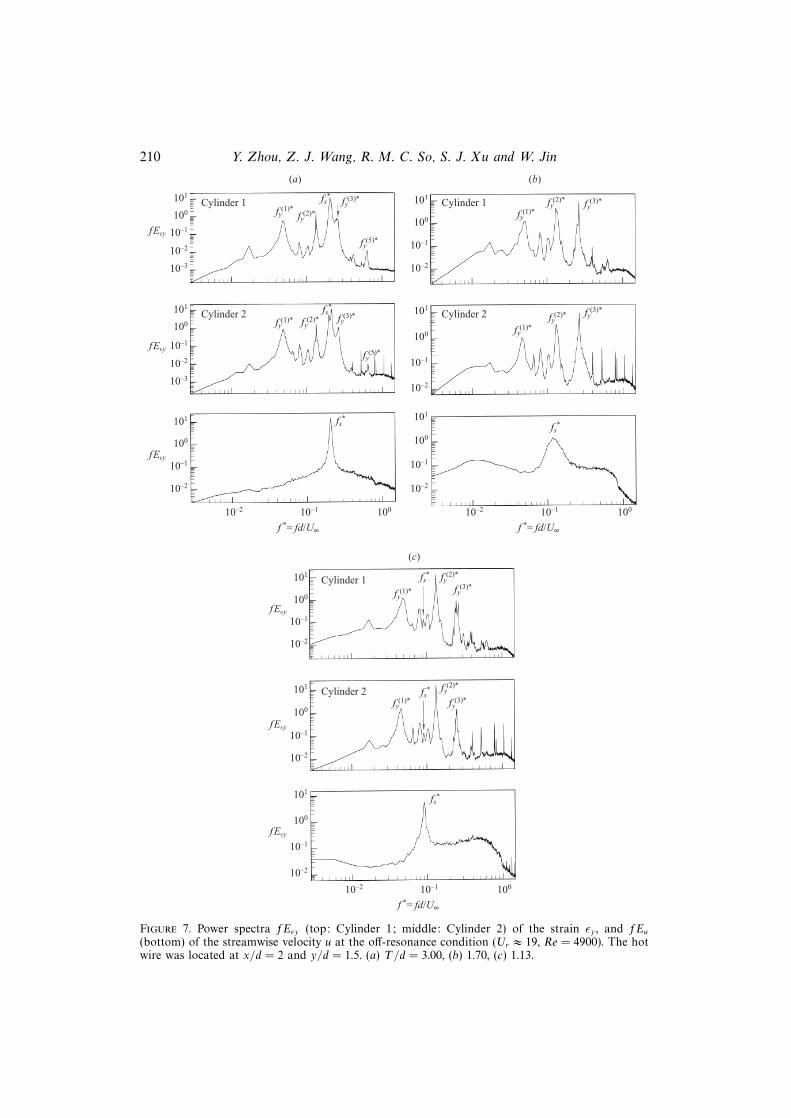
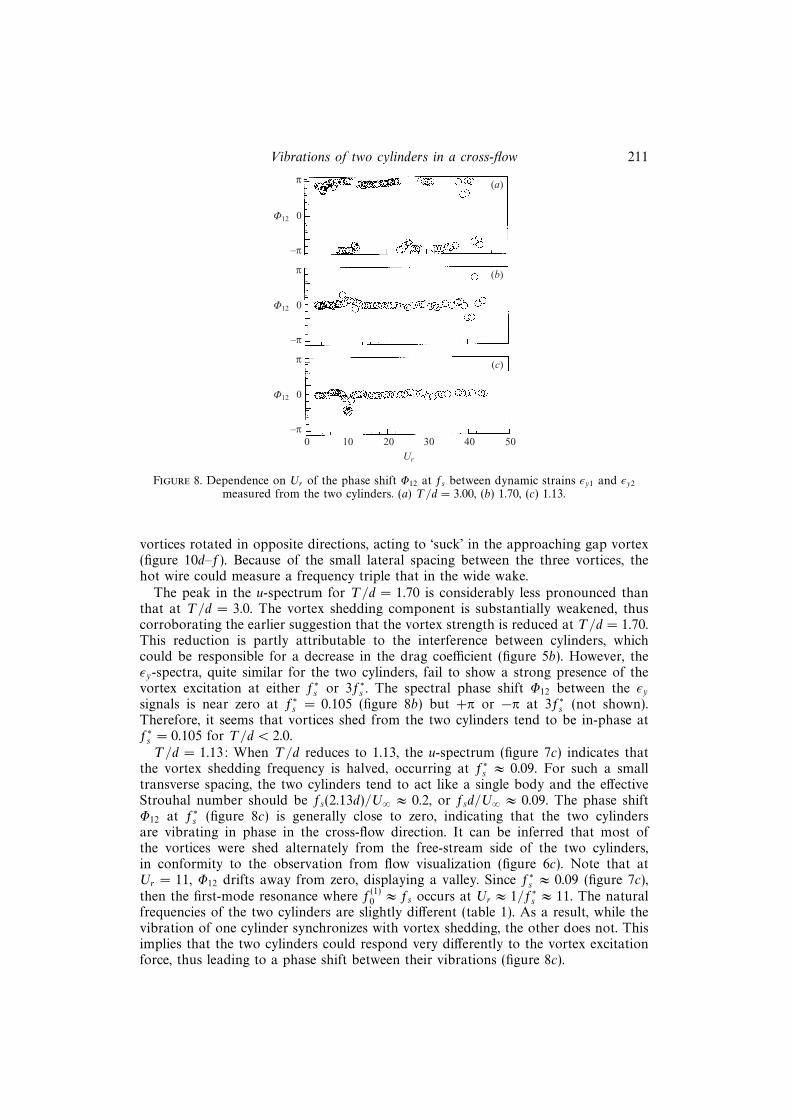
T/d = 3.0: The spectra Eεy of εy from Cylinder 1 and 2 at Ur ≈ 19 for different T/dvalues are presented in figure 7 along with the spectrum Eu of the simultaneouslymeasured streamwise velocity u. No resonance occurs at this reduced velocity. Here,the focus is on flow-related spectral characteristics, while vibration-related behaviour,such as the prominent peaks in the εy-spectrum, is discussed in § 4. At T/d = 3.00,the u-spectrum (figure 7a) yields one major peak at f∗s = fsd/U∞ = 0.20 which isthe same as the normalized vortex shedding frequency (or Strouhal number) of asingle cylinder. This peak is also evident in the strain spectra and it occurs at thesame frequency for the two strain spectra presented, thus indicating that the sheddingfrequency for the two cylinders is identical. The spectral phase shift Φ12 at fs betweenthe εy signals is generally near +π or −π (figure 8a), implying that the two cylindersmove in opposite directions. These results conform to the observation from flowvisualization that the vortices are predominantly shed in symmetric pairs or in ananti-phase mode for the two cylinders.T/d = 1.7: The u-spectrum exhibits a broad peak, ranging from 0.08 to 0.20
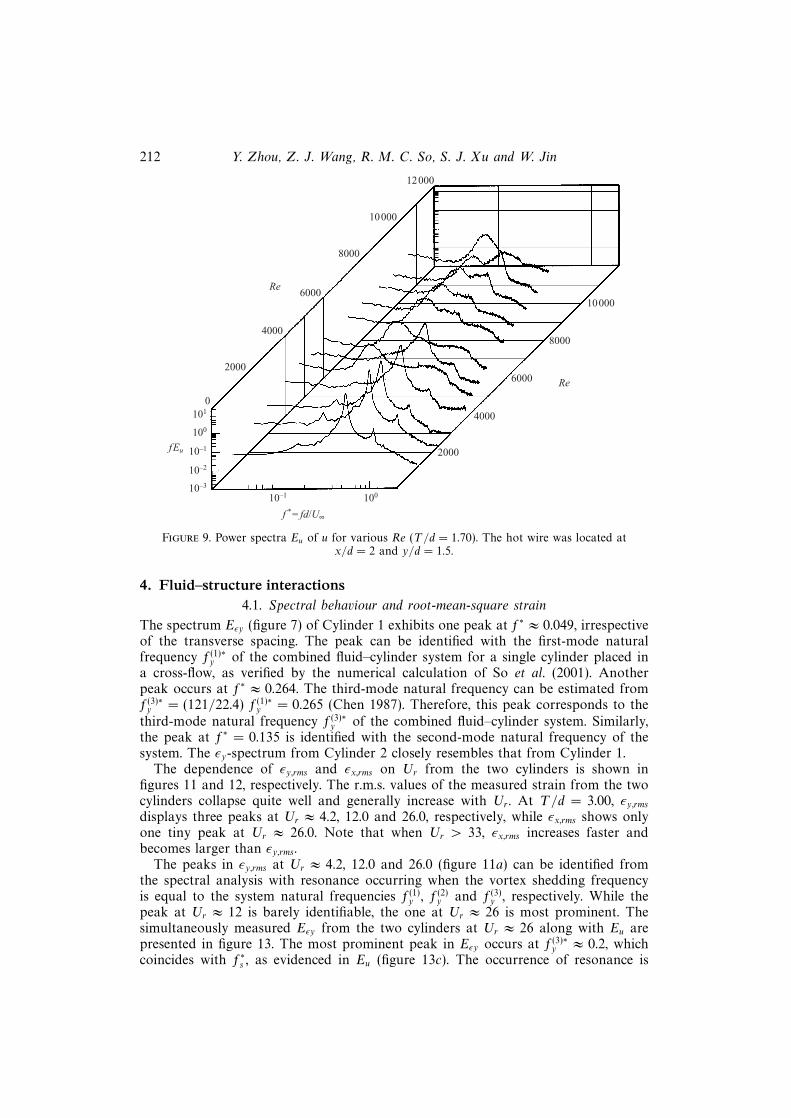
and centred at f∗s = 0.105 (figure 7b). This result seems to indicate a frequencyrange of vortex shedding. It has been reported previously that the narrow and widewakes observed in flow visualization were associated with the high and low vortexfrequencies, respectively (Spivack 1946; Ishigai et al. 1972; Bearman & Wadcock1973; Kamemoto 1976; Kiya et al. 1980; Kim & Durbin 1988; Sumner et al. 1999).The ratio of the two frequencies was close to but less than 3 (Kim & Durbin 1988).This is also observed in the present case. The u-spectra for different Re are shown infigure 9. These spectra show a peak at f∗ ≈ 0.1 or 0.31, or peaks at both frequencies.The physics behind the appearance of two different frequencies is not clear; someresearchers (Sumner et al. 1999; Kim & Durbin 1988) suggested two vortex sheddingprocesses or frequencies. Based on flow visualization at a low Re (6 200), Williamson(1985) proposed that the two frequencies resulted from the existence of harmonicvortex-shedding modes. The present flow visualization in the laminar and turbulentflow regimes suggests another interpretation.
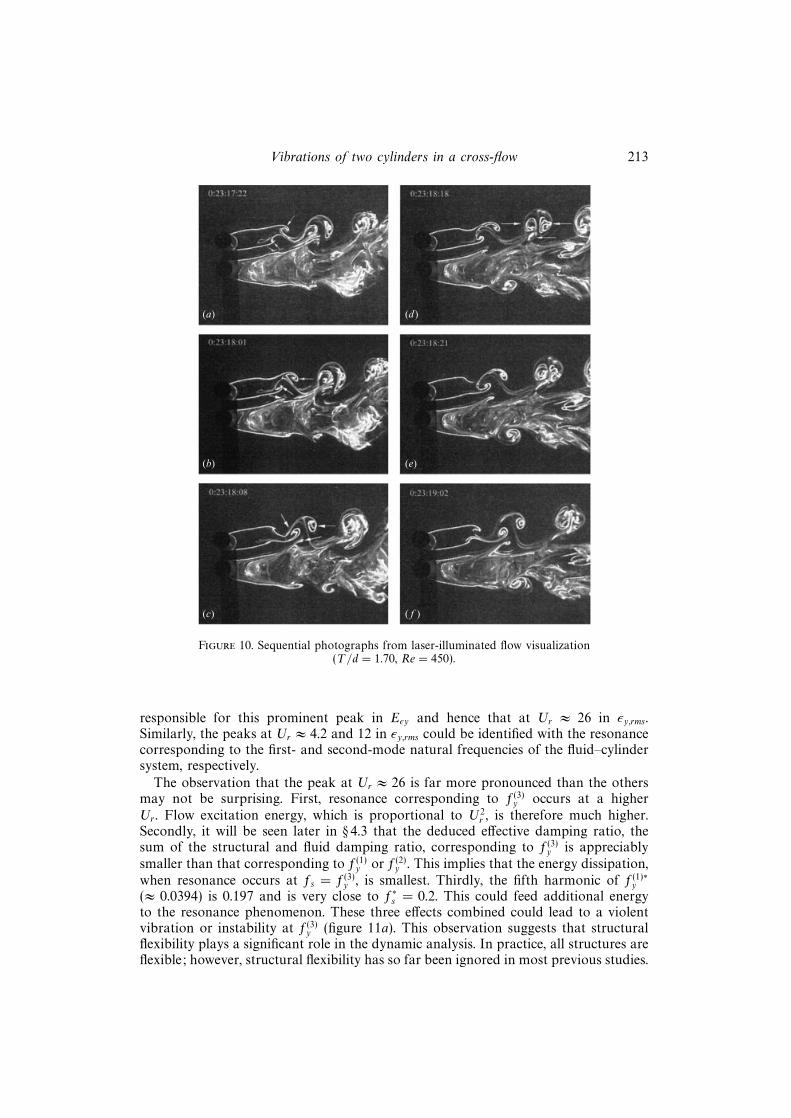
In order to understand the two dominant frequencies observed in the velocityspectra, the flow visualization data were examined in detail. It was noted that vorticeswere generally shed alternately from both sides of each cylinder, though the gapvortices appeared to be weaker than the outer vortices, which were shed on thefree-stream side. Playing back the tape and counting consecutive vortices (about 15pairs) at x/d ≈ 2 for a certain period, it was noted that the vortices were formedat about the same frequency from the two cylinders. For example, at Re = 450, f∗swas about 0.11 for the lower cylinder and 0.126 for the upper. Similar results wereobtained for other Re. This raises the question of why the hot wire measured twofrequencies and the ratio of the two frequencies was about 3. Sequential photographsat Re = 450 are shown in figure 10. The two rows of vortices in the narrow wakeappear squeezed by the wide wake so that their lateral spacing is very small. Initially(figure 10a–c), the longitudinal spacing between two vortices in the narrow wake, asmarked by arrows, is large. However, figures 10(c) and 10(d) show a reduced spacingbetween the vortices, suggesting that the convection velocity of the outer vortex wassmaller than that of the gap vortex, which was possibly carried by the gap flow jetwith a higher mean velocity (Sumner et al. 1999). As a result, the two opposite-signvortices were engaged in a pairing process (figure 10d–f). On the other hand, the gapvortex shed from the lower cylinder, also marked by an arrow, appears pushed intoclose contact with the pairing vortices by the widening wake. Note that the pairing
210 Y. Zhou, Z. J. Wang, R. M. C. So, S. J. Xu and W. Jin
101
100
10–1
10–2
10–3
Cylinder 1
101
100
10–1
10–2
10–3
Cylinder 2
(a)
fy(1)*
fy(2)*
fy(3)*fs
*
fy(5)*
fEεy
fy(1)* fy
(2)* fy(3)*
fs*
fy(5)*
fs*101
100
10–1
10–2
10–2 10–1 100
f *= fd/U∞
101
100
10–1
10–2
Cylinder 1
101
100
10–1
10–2
Cylinder 2
(b)
101
100
10–1
10–2
10–2 10–1 100
f *= fd/U∞
fy(1)*
fy(2)* fy
(3)*
fy(1)*
fy(2)* fy
(3)*
fs*
101
100
10–1
10–2
Cylinder 1
101
100
10–1
10–2
Cylinder 2
(c)
101
100
10–1
10–2
10–2 10–1 100
f *= fd/U∞
fy(1)*
fy(2)*
fy(3)*
fy(1)*
fy(2)*
fy(3)*
fs*
fs*
fs*
fEεy
fEεy
fEεy
fEεy
fEεy
Figure 7. Power spectra fEεy (top: Cylinder 1; middle: Cylinder 2) of the strain εy , and fEu(bottom) of the streamwise velocity u at the off-resonance condition (Ur ≈ 19, Re = 4900). The hotwire was located at x/d = 2 and y/d = 1.5. (a) T/d = 3.00, (b) 1.70, (c) 1.13.
Vibrations of two cylinders in a cross-flow 211
0
–p
p (a)
(b)
(c)
0
–p
p
0
–p
p
0 10 20 30 40 50
Ur
U12
U12
U12
Figure 8. Dependence on Ur of the phase shift Φ12 at fs between dynamic strains εy1 and εy2
measured from the two cylinders. (a) T/d = 3.00, (b) 1.70, (c) 1.13.
vortices rotated in opposite directions, acting to ‘suck’ in the approaching gap vortex(figure 10d–f). Because of the small lateral spacing between the three vortices, thehot wire could measure a frequency triple that in the wide wake.
The peak in the u-spectrum for T/d = 1.70 is considerably less pronounced thanthat at T/d = 3.0. The vortex shedding component is substantially weakened, thuscorroborating the earlier suggestion that the vortex strength is reduced at T/d = 1.70.This reduction is partly attributable to the interference between cylinders, whichcould be responsible for a decrease in the drag coefficient (figure 5b). However, theεy-spectra, quite similar for the two cylinders, fail to show a strong presence of thevortex excitation at either f∗s or 3f∗s . The spectral phase shift Φ12 between the εysignals is near zero at f∗s = 0.105 (figure 8b) but +π or −π at 3f∗s (not shown).Therefore, it seems that vortices shed from the two cylinders tend to be in-phase atf∗s = 0.105 for T/d < 2.0.T/d = 1.13: When T/d reduces to 1.13, the u-spectrum (figure 7c) indicates that
the vortex shedding frequency is halved, occurring at f∗s ≈ 0.09. For such a smalltransverse spacing, the two cylinders tend to act like a single body and the effectiveStrouhal number should be fs(2.13d)/U∞ ≈ 0.2, or fsd/U∞ ≈ 0.09. The phase shiftΦ12 at f∗s (figure 8c) is generally close to zero, indicating that the two cylindersare vibrating in phase in the cross-flow direction. It can be inferred that most ofthe vortices were shed alternately from the free-stream side of the two cylinders,in conformity to the observation from flow visualization (figure 6c). Note that atUr = 11, Φ12 drifts away from zero, displaying a valley. Since f∗s ≈ 0.09 (figure 7c),then the first-mode resonance where f(1)
0 ≈ fs occurs at Ur ≈ 1/f∗s ≈ 11. The naturalfrequencies of the two cylinders are slightly different (table 1). As a result, while thevibration of one cylinder synchronizes with vortex shedding, the other does not. Thisimplies that the two cylinders could respond very differently to the vortex excitationforce, thus leading to a phase shift between their vibrations (figure 8c).
212 Y. Zhou, Z. J. Wang, R. M. C. So, S. J. Xu and W. Jin
101
100
10–1
10–2
10–3
10–1 100
0
2000
4000
6000
8000
10000
12000
2000
4000
6000
8000
10000
Re
Re
f *= fd/U∞
fEu
Figure 9. Power spectra Eu of u for various Re (T/d = 1.70). The hot wire was located atx/d = 2 and y/d = 1.5.
4. Fluid–structure interactions4.1. Spectral behaviour and root-mean-square strain
The spectrum Eεy (figure 7) of Cylinder 1 exhibits one peak at f∗ ≈ 0.049, irrespectiveof the transverse spacing. The peak can be identified with the first-mode naturalfrequency f(1)∗
y of the combined fluid–cylinder system for a single cylinder placed ina cross-flow, as verified by the numerical calculation of So et al. (2001). Anotherpeak occurs at f∗ ≈ 0.264. The third-mode natural frequency can be estimated fromf(3)∗y = (121/22.4) f(1)∗
y = 0.265 (Chen 1987). Therefore, this peak corresponds to thethird-mode natural frequency f(3)∗
y of the combined fluid–cylinder system. Similarly,the peak at f∗ = 0.135 is identified with the second-mode natural frequency of thesystem. The εy-spectrum from Cylinder 2 closely resembles that from Cylinder 1.
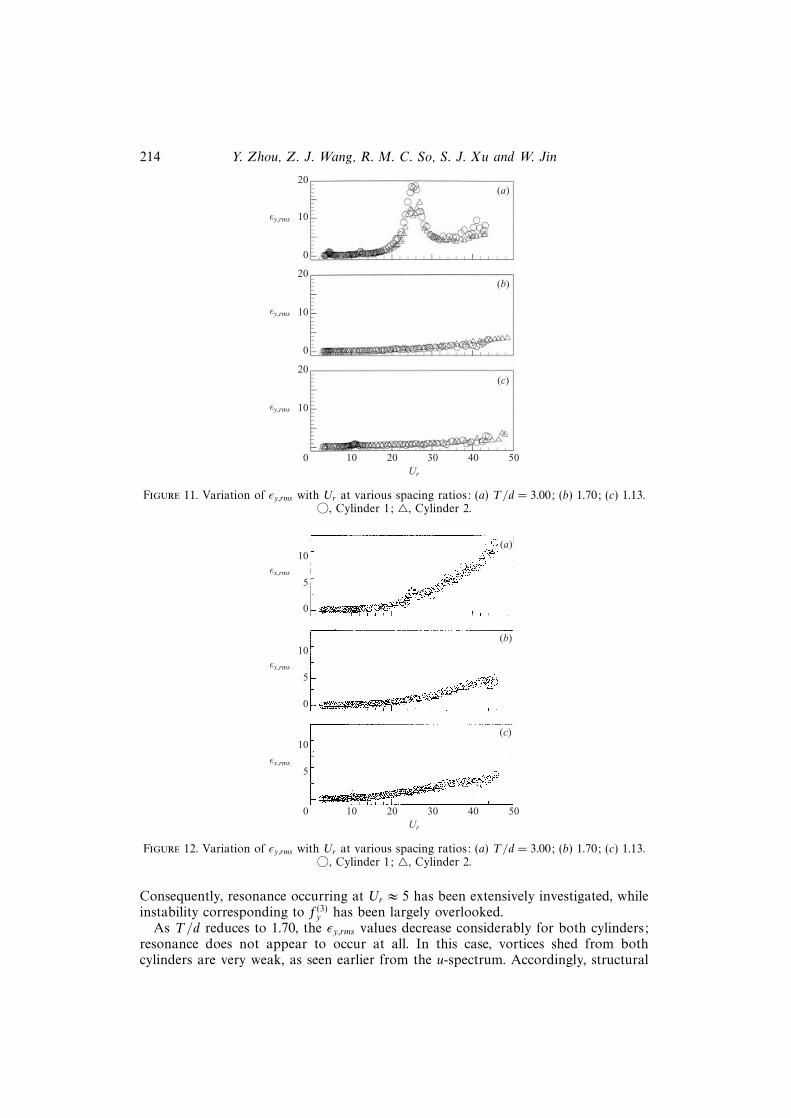
The dependence of εy,rms and εx,rms on Ur from the two cylinders is shown infigures 11 and 12, respectively. The r.m.s. values of the measured strain from the twocylinders collapse quite well and generally increase with Ur . At T/d = 3.00, εy,rmsdisplays three peaks at Ur ≈ 4.2, 12.0 and 26.0, respectively, while εx,rms shows onlyone tiny peak at Ur ≈ 26.0. Note that when Ur > 33, εx,rms increases faster andbecomes larger than εy,rms.
The peaks in εy,rms at Ur ≈ 4.2, 12.0 and 26.0 (figure 11a) can be identified fromthe spectral analysis with resonance occurring when the vortex shedding frequencyis equal to the system natural frequencies f(1)
y , f(2)y and f(3)
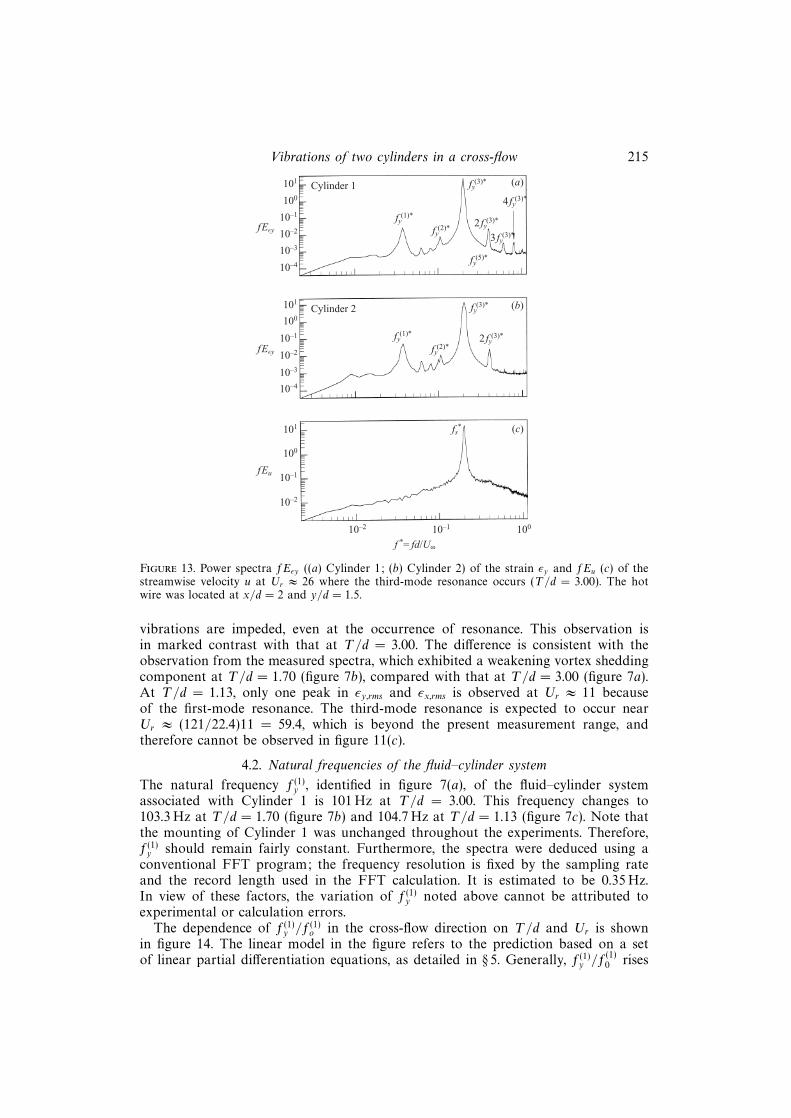
y , respectively. While thepeak at Ur ≈ 12 is barely identifiable, the one at Ur ≈ 26 is most prominent. Thesimultaneously measured Eεy from the two cylinders at Ur ≈ 26 along with Eu arepresented in figure 13. The most prominent peak in Eεy occurs at f(3)∗
y ≈ 0.2, whichcoincides with f∗s , as evidenced in Eu (figure 13c). The occurrence of resonance is
Vibrations of two cylinders in a cross-flow 213
(a) (d)
(b) (e)
(c) ( f )
Figure 10. Sequential photographs from laser-illuminated flow visualization(T/d = 1.70, Re = 450).
responsible for this prominent peak in Eεy and hence that at Ur ≈ 26 in εy,rms.Similarly, the peaks at Ur ≈ 4.2 and 12 in εy,rms could be identified with the resonancecorresponding to the first- and second-mode natural frequencies of the fluid–cylindersystem, respectively.
The observation that the peak at Ur ≈ 26 is far more pronounced than the othersmay not be surprising. First, resonance corresponding to f(3)
y occurs at a higherUr . Flow excitation energy, which is proportional to U2
r , is therefore much higher.Secondly, it will be seen later in § 4.3 that the deduced effective damping ratio, thesum of the structural and fluid damping ratio, corresponding to f(3)
y is appreciablysmaller than that corresponding to f(1)
y or f(2)y . This implies that the energy dissipation,
when resonance occurs at fs = f(3)y , is smallest. Thirdly, the fifth harmonic of f(1)∗
y
(≈ 0.0394) is 0.197 and is very close to f∗s = 0.2. This could feed additional energyto the resonance phenomenon. These three effects combined could lead to a violentvibration or instability at f(3)
y (figure 11a). This observation suggests that structuralflexibility plays a significant role in the dynamic analysis. In practice, all structures areflexible; however, structural flexibility has so far been ignored in most previous studies.
214 Y. Zhou, Z. J. Wang, R. M. C. So, S. J. Xu and W. Jin
20
10
0
20
10
0
εy,rms
εy,rms
20
10
0
εy,rms
10 20 30 40 50Ur
(c)
(b)
(a)
Figure 11. Variation of εy,rms with Ur at various spacing ratios: (a) T/d = 3.00; (b) 1.70; (c) 1.13.©, Cylinder 1; 4, Cylinder 2.
5
10
0
5
10
0
εx,rms
εx,rms
5
10
0
εx,rms
10 20 30 40 50Ur
(c)
(b)
(a)
Figure 12. Variation of εy,rms with Ur at various spacing ratios: (a) T/d = 3.00; (b) 1.70; (c) 1.13.©, Cylinder 1; 4, Cylinder 2.
Consequently, resonance occurring at Ur ≈ 5 has been extensively investigated, whileinstability corresponding to f(3)
y has been largely overlooked.As T/d reduces to 1.70, the εy,rms values decrease considerably for both cylinders;
resonance does not appear to occur at all. In this case, vortices shed from bothcylinders are very weak, as seen earlier from the u-spectrum. Accordingly, structural
Vibrations of two cylinders in a cross-flow 215
101
100
10–1
10–2
10–3
Cylinder 1
101
100
10–1
10–2
10–3
Cylinder 2
fy(1)*
fy(2)*
fy(3)*
fy(5)*
fEεy
fy(1)*
fy(2)*
fy(3)*
fs*101
100
10–1
10–2
10–2 10–1 100
f *= fd/U∞
10–4
fEu
2 fy(3)*
10–4
fEεy2 fy
(3)*
3 fy(3)*
4 fy(3)*
(a)
(b)
(c)
Figure 13. Power spectra fEεy ((a) Cylinder 1; (b) Cylinder 2) of the strain εy and fEu (c) of thestreamwise velocity u at Ur ≈ 26 where the third-mode resonance occurs (T/d = 3.00). The hotwire was located at x/d = 2 and y/d = 1.5.
vibrations are impeded, even at the occurrence of resonance. This observation isin marked contrast with that at T/d = 3.00. The difference is consistent with theobservation from the measured spectra, which exhibited a weakening vortex sheddingcomponent at T/d = 1.70 (figure 7b), compared with that at T/d = 3.00 (figure 7a).At T/d = 1.13, only one peak in εy,rms and εx,rms is observed at Ur ≈ 11 becauseof the first-mode resonance. The third-mode resonance is expected to occur nearUr ≈ (121/22.4)11 = 59.4, which is beyond the present measurement range, andtherefore cannot be observed in figure 11(c).
4.2. Natural frequencies of the fluid–cylinder system
The natural frequency f(1)y , identified in figure 7(a), of the fluid–cylinder system
associated with Cylinder 1 is 101 Hz at T/d = 3.00. This frequency changes to103.3 Hz at T/d = 1.70 (figure 7b) and 104.7 Hz at T/d = 1.13 (figure 7c). Note thatthe mounting of Cylinder 1 was unchanged throughout the experiments. Therefore,f(1)y should remain fairly constant. Furthermore, the spectra were deduced using a
conventional FFT program; the frequency resolution is fixed by the sampling rateand the record length used in the FFT calculation. It is estimated to be 0.35 Hz.In view of these factors, the variation of f(1)
y noted above cannot be attributed toexperimental or calculation errors.
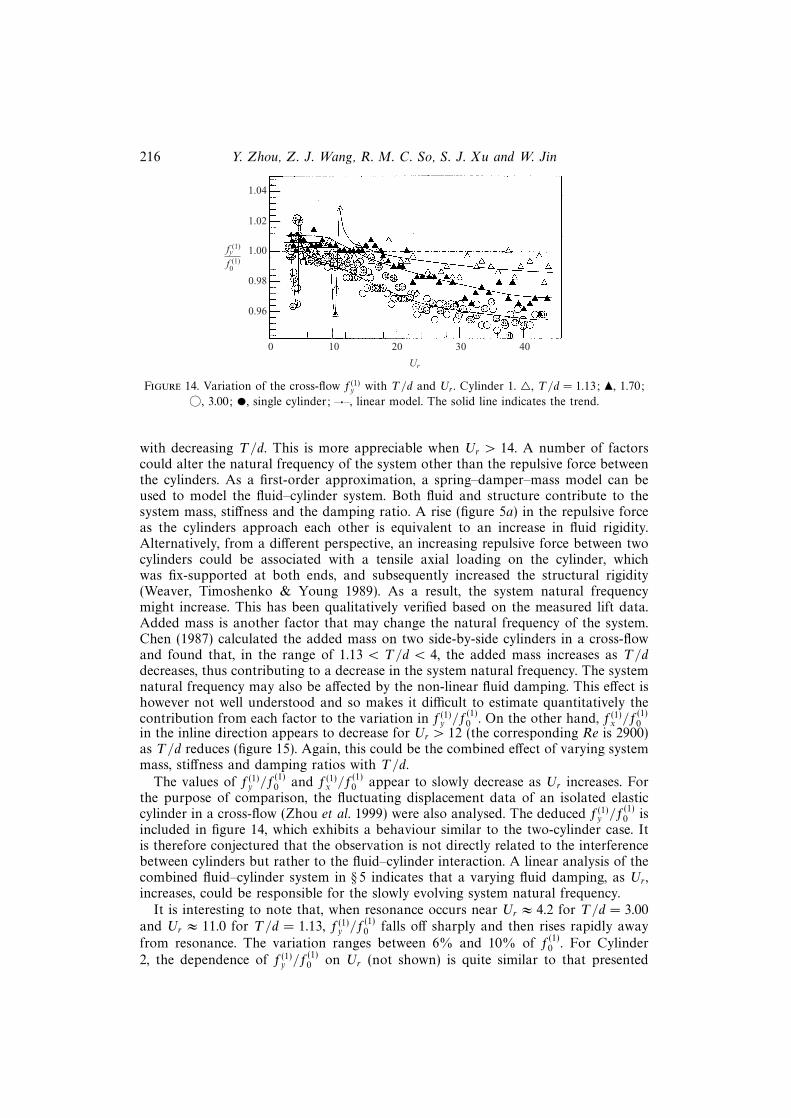
The dependence of f(1)y /f
(1)o in the cross-flow direction on T/d and Ur is shown
in figure 14. The linear model in the figure refers to the prediction based on a setof linear partial differentiation equations, as detailed in § 5. Generally, f(1)
y /f(1)0 rises
216 Y. Zhou, Z. J. Wang, R. M. C. So, S. J. Xu and W. Jin
1.04
1.02
1.00
0.98
0.96
0 10 20 30 40
Ur
fy(1)
f0(1)
Figure 14. Variation of the cross-flow f(1)y with T/d and Ur . Cylinder 1. 4, T/d = 1.13; N, 1.70;
©, 3.00; •, single cylinder; –·–, linear model. The solid line indicates the trend.
with decreasing T/d. This is more appreciable when Ur > 14. A number of factorscould alter the natural frequency of the system other than the repulsive force betweenthe cylinders. As a first-order approximation, a spring–damper–mass model can beused to model the fluid–cylinder system. Both fluid and structure contribute to thesystem mass, stiffness and the damping ratio. A rise (figure 5a) in the repulsive forceas the cylinders approach each other is equivalent to an increase in fluid rigidity.Alternatively, from a different perspective, an increasing repulsive force between twocylinders could be associated with a tensile axial loading on the cylinder, whichwas fix-supported at both ends, and subsequently increased the structural rigidity(Weaver, Timoshenko & Young 1989). As a result, the system natural frequencymight increase. This has been qualitatively verified based on the measured lift data.Added mass is another factor that may change the natural frequency of the system.Chen (1987) calculated the added mass on two side-by-side cylinders in a cross-flowand found that, in the range of 1.13 < T/d < 4, the added mass increases as T/ddecreases, thus contributing to a decrease in the system natural frequency. The systemnatural frequency may also be affected by the non-linear fluid damping. This effect ishowever not well understood and so makes it difficult to estimate quantitatively thecontribution from each factor to the variation in f(1)
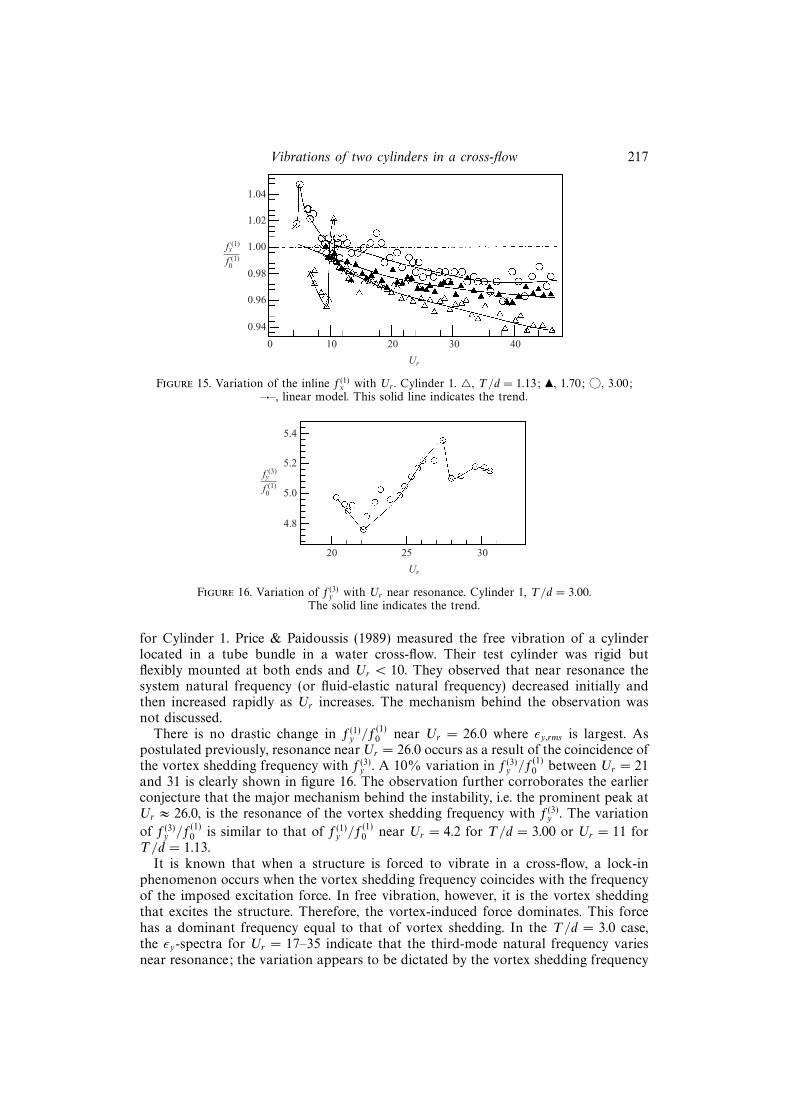
y /f(1)0 . On the other hand, f(1)
x /f(1)0
in the inline direction appears to decrease for Ur > 12 (the corresponding Re is 2900)as T/d reduces (figure 15). Again, this could be the combined effect of varying systemmass, stiffness and damping ratios with T/d.
The values of f(1)y /f
(1)0 and f(1)
x /f(1)0 appear to slowly decrease as Ur increases. For
the purpose of comparison, the fluctuating displacement data of an isolated elasticcylinder in a cross-flow (Zhou et al. 1999) were also analysed. The deduced f(1)
y /f(1)0 is
included in figure 14, which exhibits a behaviour similar to the two-cylinder case. Itis therefore conjectured that the observation is not directly related to the interferencebetween cylinders but rather to the fluid–cylinder interaction. A linear analysis of thecombined fluid–cylinder system in § 5 indicates that a varying fluid damping, as Ur ,increases, could be responsible for the slowly evolving system natural frequency.
It is interesting to note that, when resonance occurs near Ur ≈ 4.2 for T/d = 3.00and Ur ≈ 11.0 for T/d = 1.13, f(1)
y /f(1)0 falls off sharply and then rises rapidly away
from resonance. The variation ranges between 6% and 10% of f(1)0 . For Cylinder
2, the dependence of f(1)y /f
(1)0 on Ur (not shown) is quite similar to that presented
Vibrations of two cylinders in a cross-flow 217
1.04
1.02
1.00
0.98
0.96
0 10 20 30 40
Ur
fx(1)
f0(1)
0.94
Figure 15. Variation of the inline f(1)x with Ur . Cylinder 1. 4, T/d = 1.13; N, 1.70; ©, 3.00;
–·–, linear model. This solid line indicates the trend.
5.4
5.2
5.0
4.8
2520 30
Ur
fy(3)
f0(1)
Figure 16. Variation of f(3)y with Ur near resonance. Cylinder 1, T/d = 3.00.
The solid line indicates the trend.
for Cylinder 1. Price & Paidoussis (1989) measured the free vibration of a cylinderlocated in a tube bundle in a water cross-flow. Their test cylinder was rigid butflexibly mounted at both ends and Ur < 10. They observed that near resonance thesystem natural frequency (or fluid-elastic natural frequency) decreased initially andthen increased rapidly as Ur increases. The mechanism behind the observation wasnot discussed.
There is no drastic change in f(1)y /f
(1)0 near Ur = 26.0 where εy,rms is largest. As
postulated previously, resonance nearUr = 26.0 occurs as a result of the coincidence ofthe vortex shedding frequency with f(3)
y . A 10% variation in f(3)y /f
(1)0 between Ur = 21
and 31 is clearly shown in figure 16. The observation further corroborates the earlierconjecture that the major mechanism behind the instability, i.e. the prominent peak atUr ≈ 26.0, is the resonance of the vortex shedding frequency with f(3)
y . The variation
of f(3)y /f
(1)0 is similar to that of f(1)
y /f(1)0 near Ur = 4.2 for T/d = 3.00 or Ur = 11 for
T/d = 1.13.It is known that when a structure is forced to vibrate in a cross-flow, a lock-in
phenomenon occurs when the vortex shedding frequency coincides with the frequencyof the imposed excitation force. In free vibration, however, it is the vortex sheddingthat excites the structure. Therefore, the vortex-induced force dominates. This forcehas a dominant frequency equal to that of vortex shedding. In the T/d = 3.0 case,the εy-spectra for Ur = 17–35 indicate that the third-mode natural frequency variesnear resonance; the variation appears to be dictated by the vortex shedding frequency
218 Y. Zhou, Z. J. Wang, R. M. C. So, S. J. Xu and W. Jin
f / f0(1)
Ur
fy(3)/f0
(1)fs/f0
(1)
fEεy
5 10 20
17.05
18.61
20.35
21.41
22.37
23.32
24.90
25.37
25.79
26.14
27.47
28.67
30.58
32.69
35.26
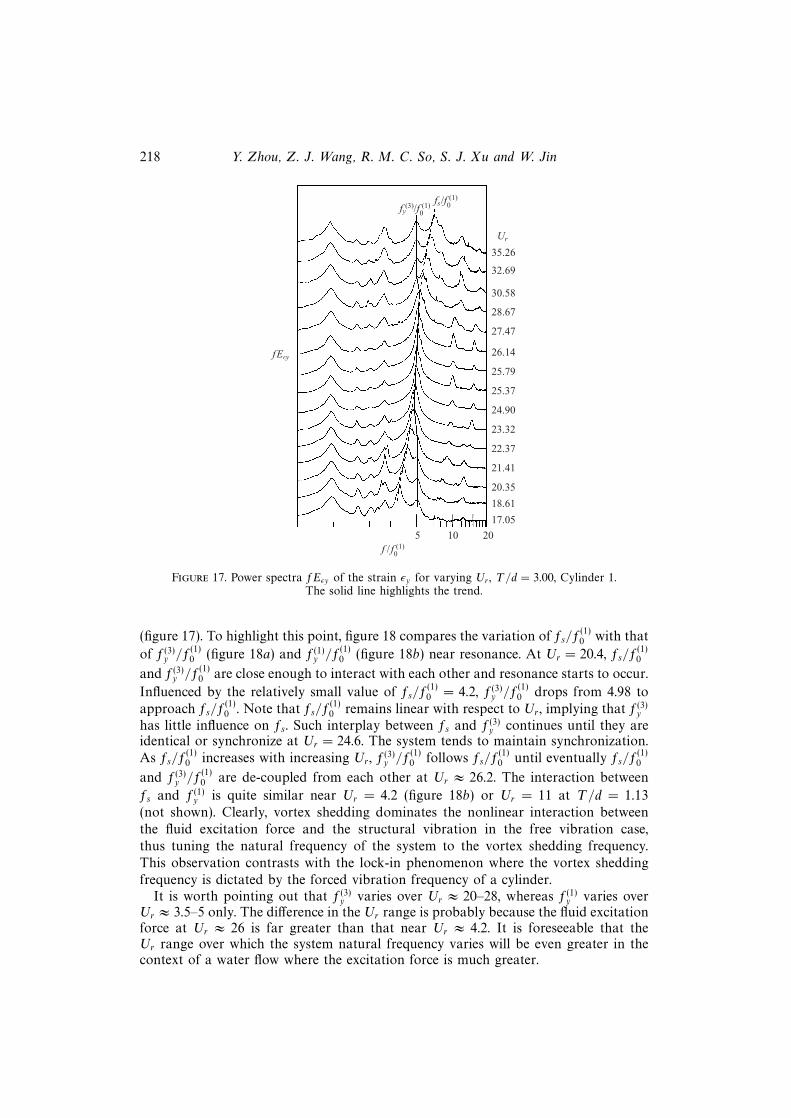
Figure 17. Power spectra fEεy of the strain εy for varying Ur , T/d = 3.00, Cylinder 1.The solid line highlights the trend.
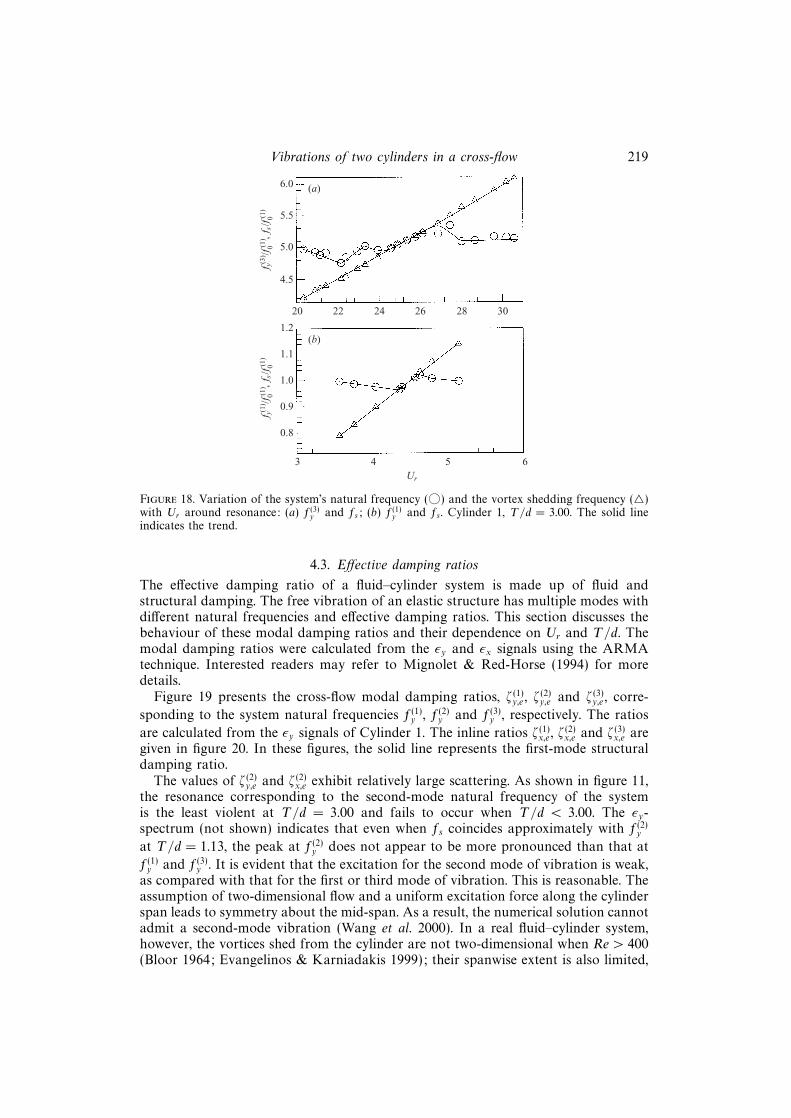
(figure 17). To highlight this point, figure 18 compares the variation of fs/f(1)0 with that
of f(3)y /f
(1)0 (figure 18a) and f(1)
y /f(1)0 (figure 18b) near resonance. At Ur = 20.4, fs/f
(1)0
and f(3)y /f
(1)0 are close enough to interact with each other and resonance starts to occur.
Influenced by the relatively small value of fs/f(1)0 = 4.2, f(3)
y /f(1)0 drops from 4.98 to
approach fs/f(1)0 . Note that fs/f
(1)0 remains linear with respect to Ur , implying that f(3)
y
has little influence on fs. Such interplay between fs and f(3)y continues until they are
identical or synchronize at Ur = 24.6. The system tends to maintain synchronization.As fs/f
(1)0 increases with increasing Ur , f
(3)y /f
(1)0 follows fs/f
(1)0 until eventually fs/f
(1)0
and f(3)y /f
(1)0 are de-coupled from each other at Ur ≈ 26.2. The interaction between
fs and f(1)y is quite similar near Ur = 4.2 (figure 18b) or Ur = 11 at T/d = 1.13
(not shown). Clearly, vortex shedding dominates the nonlinear interaction betweenthe fluid excitation force and the structural vibration in the free vibration case,thus tuning the natural frequency of the system to the vortex shedding frequency.This observation contrasts with the lock-in phenomenon where the vortex sheddingfrequency is dictated by the forced vibration frequency of a cylinder.
It is worth pointing out that f(3)y varies over Ur ≈ 20–28, whereas f(1)
y varies overUr ≈ 3.5–5 only. The difference in the Ur range is probably because the fluid excitationforce at Ur ≈ 26 is far greater than that near Ur ≈ 4.2. It is foreseeable that theUr range over which the system natural frequency varies will be even greater in thecontext of a water flow where the excitation force is much greater.
Vibrations of two cylinders in a cross-flow 219
6.0
5.5
5.0
4.5
20 22 24 26 28 30
(a)
f y(3) /f
0(1) ,
f s/f
0(1)
1.2
1.1
1.0
0.9
0.8
3 4 5 6
(b)
f y(1) /f
0(1) ,
f s/f
0(1)
Ur
Figure 18. Variation of the system’s natural frequency (©) and the vortex shedding frequency (4)with Ur around resonance: (a) f(3)
y and fs; (b) f(1)y and fs. Cylinder 1, T/d = 3.00. The solid line
indicates the trend.
4.3. Effective damping ratios
The effective damping ratio of a fluid–cylinder system is made up of fluid andstructural damping. The free vibration of an elastic structure has multiple modes withdifferent natural frequencies and effective damping ratios. This section discusses thebehaviour of these modal damping ratios and their dependence on Ur and T/d. Themodal damping ratios were calculated from the εy and εx signals using the ARMAtechnique. Interested readers may refer to Mignolet & Red-Horse (1994) for moredetails.
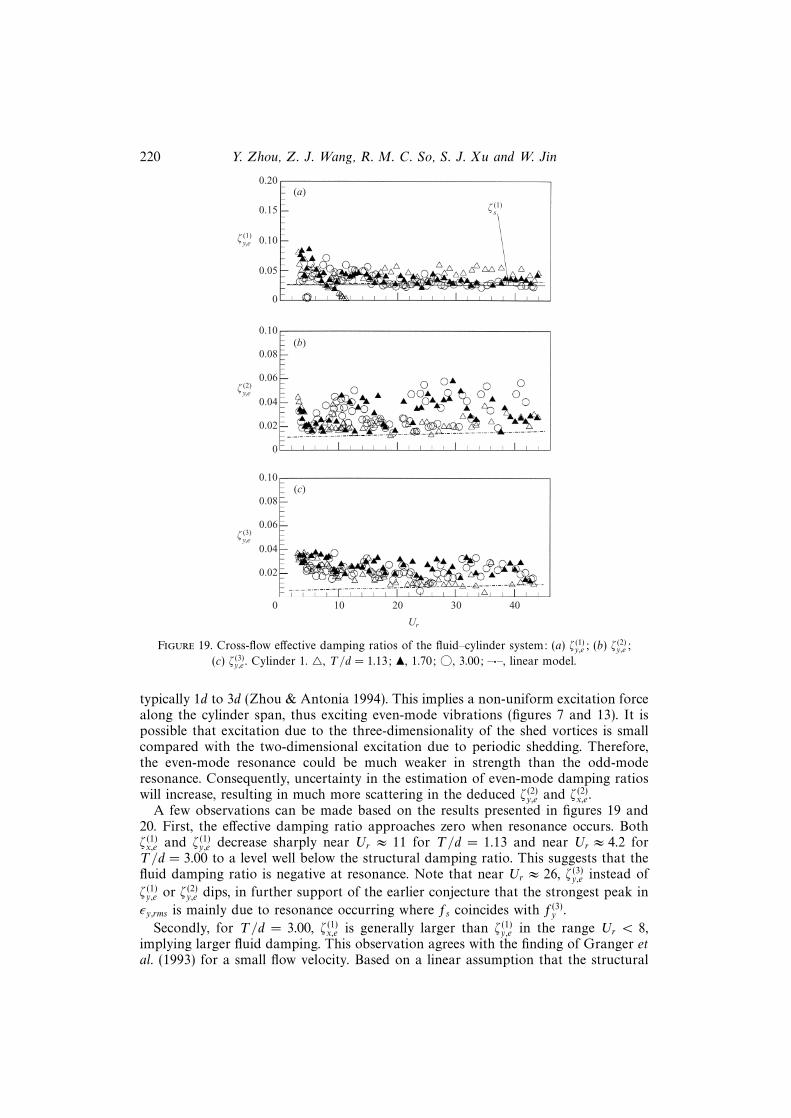
Figure 19 presents the cross-flow modal damping ratios, ζ(1)y,e , ζ
(2)y,e and ζ(3)
y,e , corre-
sponding to the system natural frequencies f(1)y , f(2)
y and f(3)y , respectively. The ratios
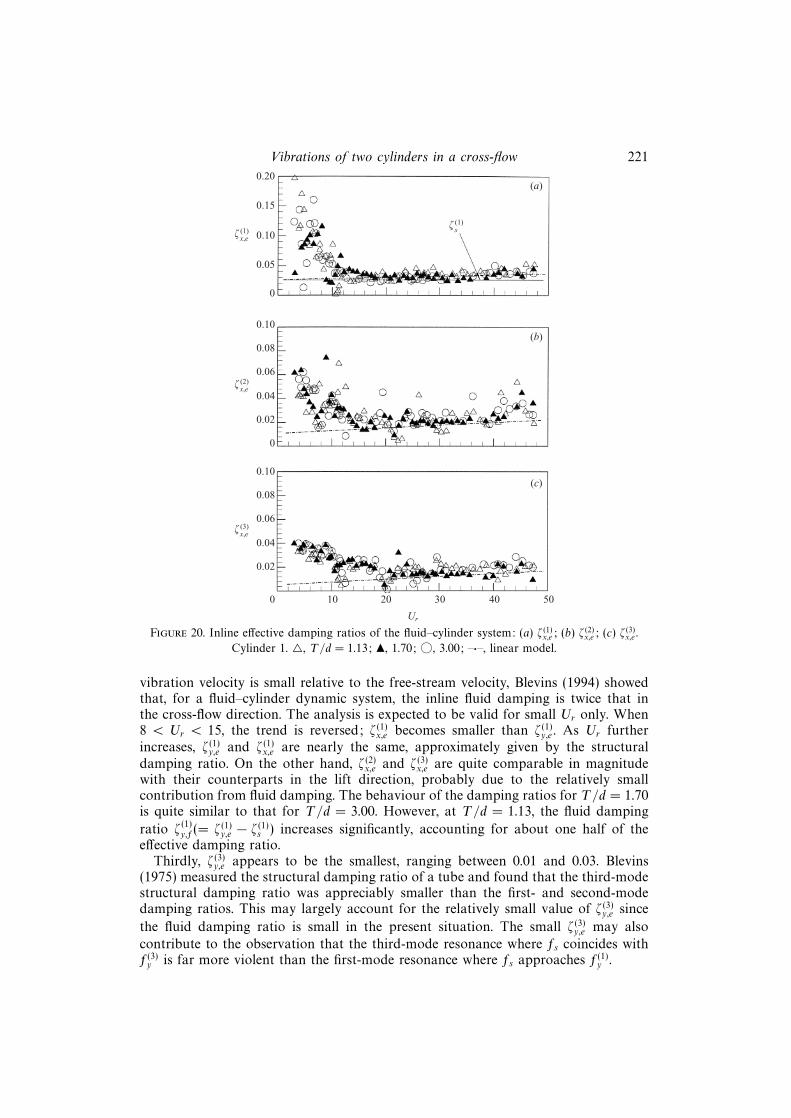
are calculated from the εy signals of Cylinder 1. The inline ratios ζ(1)x,e , ζ
(2)x,e and ζ(3)
x,e aregiven in figure 20. In these figures, the solid line represents the first-mode structuraldamping ratio.
The values of ζ(2)y,e and ζ(2)
x,e exhibit relatively large scattering. As shown in figure 11,the resonance corresponding to the second-mode natural frequency of the systemis the least violent at T/d = 3.00 and fails to occur when T/d < 3.00. The εy-spectrum (not shown) indicates that even when fs coincides approximately with f(2)
y
at T/d = 1.13, the peak at f(2)y does not appear to be more pronounced than that at
f(1)y and f(3)
y . It is evident that the excitation for the second mode of vibration is weak,as compared with that for the first or third mode of vibration. This is reasonable. Theassumption of two-dimensional flow and a uniform excitation force along the cylinderspan leads to symmetry about the mid-span. As a result, the numerical solution cannotadmit a second-mode vibration (Wang et al. 2000). In a real fluid–cylinder system,however, the vortices shed from the cylinder are not two-dimensional when Re > 400(Bloor 1964; Evangelinos & Karniadakis 1999); their spanwise extent is also limited,
220 Y. Zhou, Z. J. Wang, R. M. C. So, S. J. Xu and W. Jin
(a)
(b)
Ur
(c)
0.20
0.15
0.10
0.05
0
0.10
0.08
0.06
0.04
0.02
0
0.10
0.08
0.06
0.04
0.02
0 10 20 30 40
ú (3)y,e
ú (2)y,e
ú (1)y,e
ú (1)s
Figure 19. Cross-flow effective damping ratios of the fluid–cylinder system: (a) ζ(1)y,e; (b) ζ(2)
y,e;
(c) ζ(3)y,e . Cylinder 1. 4, T/d = 1.13; N, 1.70; ©, 3.00; –·–, linear model.
typically 1d to 3d (Zhou & Antonia 1994). This implies a non-uniform excitation forcealong the cylinder span, thus exciting even-mode vibrations (figures 7 and 13). It ispossible that excitation due to the three-dimensionality of the shed vortices is smallcompared with the two-dimensional excitation due to periodic shedding. Therefore,the even-mode resonance could be much weaker in strength than the odd-moderesonance. Consequently, uncertainty in the estimation of even-mode damping ratioswill increase, resulting in much more scattering in the deduced ζ(2)
y,e and ζ(2)x,e .
A few observations can be made based on the results presented in figures 19 and20. First, the effective damping ratio approaches zero when resonance occurs. Bothζ(1)x,e and ζ(1)
y,e decrease sharply near Ur ≈ 11 for T/d = 1.13 and near Ur ≈ 4.2 forT/d = 3.00 to a level well below the structural damping ratio. This suggests that thefluid damping ratio is negative at resonance. Note that near Ur ≈ 26, ζ(3)
y,e instead of
ζ(1)y,e or ζ(2)
y,e dips, in further support of the earlier conjecture that the strongest peak in
εy,rms is mainly due to resonance occurring where fs coincides with f(3)y .
Secondly, for T/d = 3.00, ζ(1)x,e is generally larger than ζ(1)
y,e in the range Ur < 8,implying larger fluid damping. This observation agrees with the finding of Granger etal. (1993) for a small flow velocity. Based on a linear assumption that the structural
Vibrations of two cylinders in a cross-flow 221
(a)
(b)
Ur
(c)
0.20
0.15
0.10
0.05
0
0.10
0.08
0.06
0.04
0.02
0
0.10
0.08
0.06
0.04
0.02
0 10 20 30 40
ú (3)x,e
ú (1)s
50
ú (2)x,e
ú (1)x,e
Figure 20. Inline effective damping ratios of the fluid–cylinder system: (a) ζ(1)x,e; (b) ζ(2)
x,e; (c) ζ(3)x,e .
Cylinder 1. 4, T/d = 1.13; N, 1.70; ©, 3.00; –·–, linear model.
vibration velocity is small relative to the free-stream velocity, Blevins (1994) showedthat, for a fluid–cylinder dynamic system, the inline fluid damping is twice that inthe cross-flow direction. The analysis is expected to be valid for small Ur only. When8 < Ur < 15, the trend is reversed; ζ(1)
x,e becomes smaller than ζ(1)y,e . As Ur further
increases, ζ(1)y,e and ζ(1)
x,e are nearly the same, approximately given by the structuraldamping ratio. On the other hand, ζ(2)
x,e and ζ(3)x,e are quite comparable in magnitude
with their counterparts in the lift direction, probably due to the relatively smallcontribution from fluid damping. The behaviour of the damping ratios for T/d = 1.70is quite similar to that for T/d = 3.00. However, at T/d = 1.13, the fluid damping
ratio ζ(1)y,f(= ζ(1)
y,e − ζ(1)s ) increases significantly, accounting for about one half of the
effective damping ratio.Thirdly, ζ(3)
y,e appears to be the smallest, ranging between 0.01 and 0.03. Blevins(1975) measured the structural damping ratio of a tube and found that the third-modestructural damping ratio was appreciably smaller than the first- and second-modedamping ratios. This may largely account for the relatively small value of ζ(3)
y,e since
the fluid damping ratio is small in the present situation. The small ζ(3)y,e may also
contribute to the observation that the third-mode resonance where fs coincides withf(3)y is far more violent than the first-mode resonance where fs approaches f(1)
y .
222 Y. Zhou, Z. J. Wang, R. M. C. So, S. J. Xu and W. Jin
Finally, the effective damping ratios rise, though slowly, as Ur increases beyond 15,apparently resulting from increasing fluid damping.
5. A linear analysis of the fluid–cylinder systemFrom § 4, it is obvious that variation of the system natural frequencies with Ur exists
for an isolated cylinder as well as for two cylinders. Therefore, it could be conjecturedthat the phenomenon is independent of the interference between cylinders. In viewof this and for the sake of theoretical simplicity, an isolated cylinder, fixed at bothends, in a cross-flow is considered in an attempt to seek a dynamic analysis of thefluid–cylinder system. This analysis could provide valuable insight into the mechanismbehind the experimental observations.
Let X, Y and Z denote the displacement in the x-, y- and z-directions, respectively.Based on the Euler–Bernoulli beam theory, the displacement field of the cylinder canbe written as
X = X(z, t),
Y = Y (z, t),
Z = Z1(x′, z, t) + Z2(y
′, z, t), x′, y′ ∈ [−d/2, d/2],
where Z1 = −x′∂X/∂z, Z2 = −y′∂Y /∂z. Neglecting damping, the governing equationsof the bending vibration, based on Hamilton’s principle (Rao 1992), are
EI∂4X(z, t)
∂z4+ ρsA
∂2X(z, t)
∂t2= qx, (5.1a)
EI∂4Y (z, t)
∂z4+ ρsA
∂2Y (z, t)
∂t2= qy, (5.1b)
where ρs is the density of the structure, A is the cross-sectional area, qx and qy arethe flow excitation forces in the x- and y-direction, respectively. When the effects ofviscous damping and added mass are considered, (5.1) becomes
EI∂4X(z, t)
∂z4+ c
∂X(z, t)
∂t+ (cm + 1)ρsA
∂2X(z, t)
∂t2= qx, (5.2a)
EI∂4Y (z, t)
∂z4+ c
∂Y (z, t)
∂t+ (cm + 1)ρsA
∂2Y (z, t)
∂t2= qy, (5.2b)
where c is the structural viscous damping coefficient and cm is the added masscoefficient. The flow excitation forces qx and qy are largely dependent on the flowaround the cylinder, which is governed by the Navier–Stokes equations,
∇ · V = 0, (5.3)
DV
Dt= −1
ρ∇p+ ν∇2V . (5.4)
Here, D/Dt is the material derivative, t is time, V is the instantaneous velocity vectorand p is the static pressure. Equations (5.2)–(5.4) are the governing equations for thefluid–cylinder system.
In order to solve (5.2), the flow excitation forces need to be specified. The excitationforces in (5.2) can be decomposed into three components, qβ = qβ + qβ + q′β , where theoverbar, tilde and prime denote the time-mean, periodical and random components
Vibrations of two cylinders in a cross-flow 223
of the fluid force, respectively. The subscript β stands for either the x- or y-direction.Assuming the random fluctuating force q′β to be negligible, in view of the fact that thevortex shedding excitation is dominant, the other two components can be representedby
qx = 12ρU∞d
[CD
(Urel − Urel
U∞ ucyl
)+ CL
Urel
U∞ vcyl
], (5.5a)
qx = 12ρU2∞dC ′D sinΩDt, (5.5b)
qy = 12ρU∞d
[CL
(Urel − Urel
U∞ ucyl
)− CD Urel
U∞ vcyl
], (5.5c)
qy = 12ρU2∞dC ′L sinΩLt. (5.5d)
In the above equations, C ′D and C ′L are the fluctuating drag and lift coefficients,ucyl = ∂X/∂t and Vcyl = ∂Y /∂t are velocities of the cylinder in the x- and y-direction,respectively, ΩD and ΩL are the fluctuating drag and lift frequency, respectively, andUrel is the relative velocity between the flow and the cylinder.
The present experimental conditions give rise to the approximation U∞ ucyl orvcyl . For example, when the third-mode resonance occurs at U∞ ≈ 16 m s−1, ucyl orvcyl is estimated to be of the order of 0.2 m s−1, or about 0.012U∞. Consequently,
Urel =√v2cyl + (U∞ − ucyl)2 ≈ U∞ − ucyl , and (Urel/U∞) ≈ 1. For an isolated cylinder,
CL = 0. Therefore, the coupled nonlinear equations (5.2) may be decoupled and lin-earized. Rearranging (5.2) yields the following linear and decoupled partial differentialequations:
EI∂4X(z, t)
∂z4+ (c+ ρU∞dCD)
∂X(z, t)
∂t+ (cm + 1)ρsA
∂2X(z, t)
∂t2
= 12ρU2∞d(CD + C ′D sinΩDt), (5.6a)
EI∂4Y (z, t)
∂z4+ (c+ 1
2ρU∞dCD)
∂Y (z, t)
∂t+ (cm + 1)ρsA
∂2Y (z, t)
∂t2
= 12ρU2∞dC
′L sinΩLt. (5.6b)
The system natural frequencies can be obtained by solving the set of homogeneousequations (5.6). Assuming that the general solution of (5.6a) is given by
X(z, t) = Ax(z)est, (5.7)
where Ax(z) is a function of z (Weaver et al. 1989) and s is a complex coefficient,the shape of the natural mode of vibration in the drag direction can be determined.Substituting (5.7) into (5.6a), the following characteristic equation can be deducedfrom the homogeneous equation:
EI∂4Ax(z)
∂z4+ (scx +Ms2)Ax(z) = 0, (5.8)
where M = (cm + 1)ρsA is the sum of the cylinder mass and added mass per unitlength and
cx = c+ ρU∞dCD (5.9)
is the viscous damping coefficient of the fluid–cylinder system in the drag direction.
224 Y. Zhou, Z. J. Wang, R. M. C. So, S. J. Xu and W. Jin
The second term on the right-hand side of (5.9) is the drag-induced fluid dampingcoefficient.
Noting that the boundary conditions of the cylinder fixed at both ends are givenby
Ax(0) = Ax(l) =∂Ax
∂z
∣∣∣z=0
=∂Ax
∂z
∣∣∣z=l
= 0,
where l is the length of the cylinder, the eigenvalues of (5.8) can be solved to give thefollowing frequency equation (James et al. 1994):
cos r1l cosh r1l = 1, (5.10)
where r1 = 4√−(Ms2 + cxs)/EI . Applying a method similar to that used by Weaver
et al. (1989) to (5.10), its roots can be approximated with satisfactory accuracy by thefollowing formula;
r1l ≈ 2n+ 1
2π, n = 1, 2, . . . . (5.11)
Assuming weak damping and substituting the solution of (5.11) in terms of s into(5.7) yields
X(z, t) = Ax(z)e−cx/2M(C1 sin (
√4MEI((2n+ 1)π/2l)4 − c2
x/2M)t
+C2 cos(√
4MEI((2n+ 1)π/2l)4 − c2x/2M)t), (5.12)
where C1, and C2 are constants determined from the initial condition. Evidently, thenatural frequencies are given by
f(n)x =
ω(n)x
2π=
√4MEI((2n+ 1)π/2l)4 − c2
x
4πM, (5.13)
where n denotes the nth mode of vibration.Neglecting damping, i.e. setting cx = 0, (5.13) is reduced to
f(n)0 =
(2n+ 1
3
)2
f(1)0 , n = 1, 2, . . . , (5.14)
where f(1)0 = 9
8π√EI/Ml4 is the first-mode natural frequency of the cylinder without
considering damping. After some algebra, (5.13) can be rewritten as
f(n)x = f
(n)0
√1− (ζ(n)
x,e)2, n = 1, 2, . . . , (5.15)
where the viscous damping ratio or damping factor is given by
ζ(n)x,e =
cx
2Mω(n)0
=cx
4πMf(n)0
, n = 1, 2, . . . . (5.16)
Considering (5.9), ζ(n)x,e may be decomposed as
ζ(n)x,e = ζ(n)
s + ζ(n)x,f , (5.17)
where
ζ(n)s =
c
4πMf(n)0
(5.18)
originates from the structural damping and
ζ(n)x,f =
9CD4π(2n+ 1)2M∗Ur (5.19)
Vibrations of two cylinders in a cross-flow 225
is the drag-induced inline fluid damping ratio. The mass ratio M∗ in (5.19) is definedby M/ρd2. Similarly, the cross-flow natural frequencies of the system are given by
f(n)y = f
(n)0
√1− (ζ(n)
y,e)2. (5.20)
The cross-flow viscous damping ratio ζ(n)y,e is given by
ζ(n)y,e = ζ(n)
s + ζ(n)y,f , (5.21)
where
ζ(n)y,f =
9CD8π(2n+ 1)2M∗Ur (5.22)
is the drag-induced cross-flow fluid damping ratio. The drag-induced fluid dampingratios (5.19 and 5.22) obtained here are consistent with those given in Chen (1987).
Equations (5.14)–(5.22) describe the behaviour of the system natural frequencies andviscous damping ratios for a linear fluid–cylinder dynamic system. The two parametersare related. Evidently, the fluid damping ratios and the system natural frequenciesdepend on the dimensionless parameters M∗, CD and Ur . With M∗ fixed and littlevariation in CD , the effect of Ur becomes significant. To the lowest order, the model isqualitatively consistent with experimental observation. First, as the structural mode nincreases, the natural frequencies (5.14) of the cylinder increase and the correspondingstructural damping ratios (5.18) decrease. On the other hand, the fluid damping ratiosare virtually independent of the structural mode because the effects of n and Ur cancelout each other ((5.19) or (5.22)). For instance, at the first-mode resonance (n = 1),(2n + 1)2 = 9 and Ur ≈ 5. At the third-mode resonance (n = 3), (2n + 1)2 = 49 andUr ≈ 26. The ratio Ur/(2n + 1)2 remains almost unchanged. The resultant effectivedamping ratios therefore decrease for a higher vibration mode. The model prediction(figures 19 and 20) agrees reasonably well with the experimental effective dampingratios at T/d = 3.00, in particular in the streamwise direction for Ur > 10. Secondly,as Ur increases, the drag-induced fluid damping ratios ((5.19) and (5.22)) increase.However, the contribution from fluid damping to the effective damping ratios is smallin the present context. This could explain why the effective damping ratios (figures 19and 20) increase slowly when Ur > 15, which is consistent with the observationthat the measured effective damping ratios are quite comparable in the inline andcross-flow directions. Thirdly, since fluid damping is increasing, albeit only slowly,with increasing Ur , the system natural frequencies ((5.15) and (5.20)) will decrease, asseen in the measurements. The linear model of the dynamic system cannot predictthe sharp variation in the measured natural frequencies around resonance, becausethe nonlinear fluid–cylinder interactions are expected to be strong near resonance.Furthermore, the model predictions of f(1)
x and f(1)y , though qualitatively consistent
with measurements, deviate from experimental data at T/d = 3.00 (figures 14 and 15).The following analysis of the dimensionless governing equations of the fluid–cylindersystem indicates that dimensionless parameters other than Ur , CD and M∗ may alsoplay a role in the behaviour of f(n)
x and f(n)y .
The characteristic length and velocity scales are taken to be d and U∞, respectively,(5.3), (5.4) and the vector form of (5.6) can be made dimensionless by these scales, sothat X∗ = X/d, Y ∗ = Y /d, z∗ = z/d, t∗ = tU∞/d, D/Dt∗ = (U∞/d)D/Dt, ∇∗ = d∇and p∗ = p/ρU2. The dimensionless equations can be written as
∇∗ · V ∗ = 0, (5.23a)
226 Y. Zhou, Z. J. Wang, R. M. C. So, S. J. Xu and W. Jin
DV ∗
Dt∗= −∇∗p∗ +
1
Re∇∗2V ∗, (5.23b)
l∗4
U2r
∂4w∗
∂z∗+
9π3(2n+ 1)2
16Ur
ζe∂w∗
∂t∗+
81π2
64
∂2w∗
∂t∗2=
81π2
128M∗Cf. (5.23c)
Here, the aspect ratio is l∗ = l/d, the dimensionless displacement vector is w∗ =X∗, Y ∗, the dimensionless force vector is Cf = Cx,f = CD + C ′D sinΩDt, Cy,f =C ′L sinΩLt and the effective damping ratios are ζe = ζ(n)
x,e in the x-direction and ζ(n)y,e in
the y-direction.There is a total of eight dimensionless parameters in this set of fluid–cylinder
governing equations: Re, Ur , l∗, M∗, Cx,f and Cy,f , ζe, including ζ(n)
s and ζ(n)x,f or
ζ(n)y,f(ζ
(n)x,f = 2ζ(n)
y,f). In each direction, there are six dimensionless parameters. It isobvious that if the fluid–cylinder interaction problem is to be understood thoroughly,all the parameters need to be investigated systematically. In the present investigation,the cylinder and boundary conditions are fixed. Therefore, l∗, M∗ and ζ(n)
s are constant.Furthermore, with f
(1)0 fixed, varying Re is equivalent to changing Ur . The structural
responses are therefore determined by three parameters, i.e. Ur , ζ(n)x,f or ζ(n)
y,f and Cx,for Cy,f , which is evident from (5.16)–(5.22).
The issue is raised of whether fluid damping has been adequately accounted for.Fluid damping is very difficult to evaluate accurately. In the present analysis, only alinear drag-induced fluid damping (5.19) and (5.22) was considered. Most likely, thisis inadequate to model fluid damping, because fluid–structure interaction is by naturea nonlinear function of fluid velocity and structural motion. Among the availablemodels, the fluid damping force Ff = hf |w|αw with 0 6 α 6 1, where w is the structuralvibration displacement and hf is a positive constant that is a function of the cylindergeometry and fluid properties, is most appropriate for moderate Re (Nayfeh & Mook1995). The equation points to an effect of the force coefficient on fluid dampingdue to the fact that the force and vibration amplitude are directly correlated. Ifthis is incorporated into (5.2), the nonlinear damping implied in the above equationcould significantly increase the difficulty in solving the governing equations for thesystem natural frequencies. Evidently, the linear approximation to the nonlinear fluiddamping would affect the correct calculation of the system natural frequencies. Thenonlinear fluid damping effect, which could not be quantified here, is most likely tocontribute to the discrepancy between experimental observation and the linear modelprediction (figures 14 and 15). In the presence of a neighbouring cylinder, anotherparameter T/d is also important. This parameter, not considered in the derivation of(5.7)–(5.11), could also be partially responsible for the discrepancy.
6. ConclusionsFluid–structure interactions of two freely vibrating elastic cylinders in a cross-flow
have been experimentally investigated. The following conclusions can be drawn.1. Vortex formation and its evolution around the cylinders have been examined. The
spectral phase shift Φ12 between the vibrations of the two cylinders is ±π at T/d = 3.0.This observation is consistent with previously reported results (Ishigai et al. 1972;Bearman & Wadcock 1973) that vortex pairs are symmetrically formed and shedfrom the two cylinders for a sufficiently large transverse spacing. Accordingly, the twovortex streets immediately behind the cylinders are predominantly in the anti-phasemode. Furthermore, this finding is found to be independent of Re. As T/d reduces to1.7, one narrow and one wide wake were observed and the corresponding normalized
Vibrations of two cylinders in a cross-flow 227
dominant frequencies, as seen from velocity spectra, were 0.31 and 0.105, respectively.Flow visualization results suggest that vortices might be shed from both sides of eachcylinder at the same frequency, i.e. f∗s ≈ 0.1. The two vortices across the narrow wakedisplayed different convection velocity and subsequently underwent pairing. The twocounter-rotating pairing vortices further acted to ‘suck’ in the gap vortex in the widewake generated by the other cylinder. Consequently, the three vortices merged andhad a small lateral spacing, resulting in a prominent peak in the velocity spectra atf∗ ≈ 0.3. Further investigation is needed to verify this interpretation. At T/d = 1.13,Φ12 is generally near zero, indicating a dominance by the alternate vortex shedding,though symmetric shedding is seen from the flow visualization data from time to time.
2. Vibration characteristics of the elastic cylinders contrast distinctly with thoseof rigid ones. The instability of a rigid circular cylinder occurs at the first-moderesonance only. For the T/d = 3.0 elastic cylinder case, the present measurementsindicate the occurrence of first-, second- and third-mode resonance. The third-moderesonance is far more violent due to the combined effect of higher flow energy,smaller effective damping ratio, and synchronization of vortex shedding with the fifthharmonic of f(1)
y . This finding points to the significant role structural flexibility playsin structural instability, which has been overlooked in most previous studies. Theinline vibration appears to be far less violent for the third-mode resonance than thecross-flow one.
3. The natural frequencies of the combined fluid–cylinder system change as aresult of fluid–structure interactions. First, the natural frequencies of the systemexperience a rather sudden variation, up to 10%, near resonance. The variationalways displays the pattern of a dip followed by a rise. In the free vibration case,vortex shedding dominates the nonlinear interaction between the fluid excitationforce and the structural vibration. As a result, when the vortex shedding and systemnatural frequency components approach each other, the system natural frequency ismodified so as to adapt to the vortex shedding frequency. The observation contrastswith the lock-in phenomenon where the vortex shedding frequency is tuned to theforced vibration frequency of a cylinder. Secondly, the cross-flow natural frequenciesof the system increase when the transverse spacing ratio is decreased. Presumably, thefluid–cylinder system may be modelled by a mass–spring–damper system; both fluidand structures contribute to the stiffness and damping. The observed increase in therepulsive force between the cylinders as they approach each other could be seen asan increase in fluid stiffness, thus causing a rise in the cross-flow natural frequencyof the system. Thirdly, the natural frequencies of the fluid–cylinder system appear todecrease, albeit slowly, as Ur increases. The observation, which also persists for thesingle-cylinder case, does not seem to depend on the interference between cylinders.A linear analysis of an isolated cylinder in a cross-flow has been conducted. Theanalysis suggests that fluid damping increases with Ur , thus causing a decrease inthe system natural frequencies. Theoretical analysis further indicates that, in additionto the reduced velocity and fluid damping ratios, force coefficients and the spacingratio also affect the natural frequencies. This, along with the nonlinearity of thefluid–cylinder system, may account for the deviation between the linear analysis andexperimental data.
4. The effective damping ratios of the cylinders with a relatively large mass ratiohave been characterized. The values of ζ(1)
y,e approach zero when resonance occurs nearUr ≈ 11 for T/d = 1.13 and near Ur ≈ 4.2 for T/d = 3.00, so does ζ(3)
y,e near Ur ≈ 26,thus indicating negative fluid damping. Off-resonance, the variation of the ratios isconsistent with the linear analysis of the fluid–cylinder system for relatively small
228 Y. Zhou, Z. J. Wang, R. M. C. So, S. J. Xu and W. Jin
Ur . When Ur > 15, the ratios are quite comparable in the lift and drag directions,probably the result of a small fluid damping in the present case. The cross-flow fluiddamping becomes significant at T/d = 1.13, accounting for about one half of theeffective damping. The third-mode effective damping ratio ζ(3)
y,e is appreciably smallerthan that corresponding to the first or second mode. This could be attributed to asubstantial decrease of the structural damping ratios for higher modes of vibrations,as suggested by the linear analysis of the fluid–cylinder system.
The authors wish to acknowledge support given to them by the Central Re-search Grant of The Hong Kong Polytechnic University through Grant G-V529 andthe Research Grants Council of the Government of the HKSAR through GrantsPolyU5125/98E, and PolyU5128/98E.
REFERENCES
Bearman, P. W. & Wadcock, A. J. 1973 The interference between a pair of circular cylindersnormal to a stream. J. Fluid Mech. 61, 499–511.
Biermann, D. & Herrnstein, W. H., Jr 1933 The interference between struts in various combina-tions. National Advisory Committee for Aeronautics, Tech. Rep. 468.
Blevins, R. D. 1975 Vibration of a loosely held tube. J. Engng Indust. 97, 1301–1304.
Blevins, R. D. 1994 Flow-Induced Vibration. Krieger.
Bloor, M. S. 1964 The transition to turbulence in the wake of a circular cylinder. J. Fluid Mech.19, 290–304.
Cantwell, B. & Coles, D. 1983 An experimental study of entrainment and transport in theturbulent near wake of a circular cylinder. J. Fluid Mech. 136, 321–374.
Chen, S. S. 1987 Flow-Induced Vibration of Circular Cylindrical Structures, pp. 52–55. Hemisphere.
Evangelinos, C. & Karniadakis, G. E. 1999 Dynamics and flow structures in the turbulent wakeof rigid and flexible cylinders subject to vortex-induced vibrations. J. Fluid Mech. 400, 91–124.
Gerrard, J. H. 1966 The mechanics of the formation region of vortices behind bluff bodies.J. Fluid Mech. 25, 401–413.
Granger, S., Campistron, R. & Lebret, J. 1993 Motion-dependent excitation mechanisms ina square in-line tube bundle subject to water cross-flow: an experimental modal analysis.J. Fluids Struct. 7, 521–550.
Ishigai, S., Nishikawa, E., Nishmura, K. & Cho, K. 1972 Experimental study on structure of gasflow in tube banks with tube axes normal to flow (Part 1, Karman vortex flow around twotubes at various spacings. Bull. JSME 15, 949–956.
James, M. L., Smith, G. M., Wolford, J. C. & Whaley, P. W. 1994 Vibration of Mechanicaland Structural Systems with Microcomputer Applications, pp. 57–61. Harper Collins CollegePublishers.
Jin, W., Zhou, Y., Chan, P. K. C. & Xu, H. G. 2000 An optical fibre Bragg grating sensor forflow-induced structural vibration measurement. Sensors and Actuators 79, 36–45.
Kamemoto, K. 1976 Formation and interaction of two parallel vortex streets. Bull. JSME 19,283–290.
Kim, H. J. & Durbin, P. A. 1988 Investigation of the flow between a pair of circular cylinders inthe flopping regime. J. Fluid Mech. 196, 431–448.
Kiya, M., Arie, M., Tamura, H. & Mori, H. 1980 Vortex shedding from two circular cylinders instaggered arrangement. Trans. ASME: J. Fluids Engng 102, 166–173.
Landweber, L. 1942 Flow about a pair of adjacent, parallel cylinders normal to a stream. D. W.Taylor Model Basin, Rep. 485. Department of the Navy, Washington, DC.
Mignolet, M. P. & Red-Horse, J. R. 1994 ARMAX identification of vibrating structures: model andmodel order estimation. In Proc. 35th Structures, Structural Dynamics, and Material Conference,AIAA/ASME, Hilton Head, South Carolina, April 18–20, pp. 1628–1637.
Nayfeh, A. H. & Mook, D. T. 1995 Nonlinear Oscillations, pp. 96–97. John Wiley & Sons.
Prandtl, L. 1935 The mechanics of viscous fluid. Reprinted in Aerodynamics Theory: A GeneralReview of Progress (ed. W. F. Durand). Gloucester Mass., Peter Smith Publisher, 1976.
Vibrations of two cylinders in a cross-flow 229
Price, S. J. & Paidoussis, M. P. 1989 The flow-induced response of a single flexible cylinder in anin-line array of rigid cylinders. J. Fluids Struct. 3, 61–82.
Qaudflieg, H. 1977 Vortex induced load on the cylinder pair at high Re. Forsch. Ing. Wes. 43, 9–18.
Rao J. S. 1992 Advanced Theory of Vibration, pp. 132–134. John Wiley & Sons.
So, R. M. C., Liu, Y., Chan, S. T. & Lam, K. 2001 Numerical studies of a freely vibrating cylinderin a cross flow. J. Fluid Struct. (to appear).
So, R. M. C., Zhou, Y. & Liu, M. H. 2000 Free vibrations of an elastic cylinder in a cross flow andtheir effects on the near wake. Exps. Fluids 29, 130–144.
Spivac, H. M. 1946 Vortex frequency and flow pattern in the wake of two parallel cylinders atvaried spacings normal to an air stream. J. Aero. Sci. 13, 289–297.
Sumner, D., Wong, S. S. T., Price, S. J. & Paidoussis, M. P. 1999 Fluid Behaviour of side-by-sidecircular cylinders in steady cross-flow. J. Fluids Struct. 13, 309–338.
Wang, X. Q:, So, R. M. C. & Liu, Y. 2000 Flow-induced vibration of an Euler-Bernoulli beam.J. Sound Vib. 243, 241–268.
Weaver, D. S. & Abd-Rabbo, A. 1984 A flow visualization study of a square array of tubes inwater cross-flow. Proc. Symp. On Flow-Induced Vibrations, Vol. 2 (ed. M. P. Paidoussis, M. K.Au-Yang & S. S. Chen), pp. 165–177.
Weaver, W., Timoshenko, S. P. & Young, D. H. 1989 Vibration Problems in Engineering, 5th edn,pp. 54–55, 366, 426–432 & 454–456. John Wiley & Sons.
Williamson, C. H. K. 1985 Evolution of a single wake behind a pair of bluff bodies. J. Fluid Mech.159, 1–18.
Zdravkovich, M. M. 1977 Review of flow interference between two circular cylinders in variousarrangements. Trans. ASME: J. Fluids Engng 99, 618–633.
Zdravkovich, M. M. 1985 Flow-induced oscillations of two interfering circular cylinders. J. SoundVib. 101, 511–521.
Zdravkovich, M. M. 1987 The effects of interference between circular cylinders in cross flow.J. Fluids Struct. 1, 239–261.
Zdravkovich, M. M. & Pridden, D. L. 1977 Interference between two circular cylinders; series ofunexpected discontinuities. J. Indust. Aerodyn. 2, 255–260.
Zhou, Y. & Antonia, R. A. 1994 Effect of initial conditions on structures in a turbulent near-wake.AIAA J. 32, 1207–1213.
Zhou, Y., SO, R. M. C., Jin, W., Xu, H. G. & Chan, P. K. C. 1999 Dynamic strain measurements ofa circular cylinder in a cross flow using a fibre Bragg grating sensor. Exps. Fluids 27, 359–367.
Zhou, Y., So, R. M. C., Liu, M. H. & Zhang, H. J. 2000a Complex turbulent wakes generated bytwo and three side-by-side cylinders. Intl J. Heat Fluid Flow 21, 125–133.
Zhou, C. Y., So, R. M. C. & Mignolet, M. P. 2000b Fluid damping of an elastic cylinder in a crossflow. J. Fluids Struct. 14, 303–322.
Ziada, S. & Staubli, T. (eds.) 2000 Flow-Induced Vibration. A. A. Balkema.