Embed Size (px)
Citation preview
©Институт народнохозяйственного прогнозирования© Institute of Economic Forecasting
XX INFORUM WORLD CONFERENCE
ALEXANDRIA September, 2014
Free Trade Zone for Eurasian Economic Union and European Union: When it may be possible?
IEF RAS
© Institute of Economic ForecastingIEF RAS
THE GENERAL IDIA of MODEL COMPLEX
Macromodels for important countries
I-O models for important countries
Model for World energy supply and demand
Macromodels for Russia I-O models for Russia
Model for energy demand in Russian economy
Macromodels for regions Model for energy demand for Russian regions
2
© Institute of Economic ForecastingIEF RAS
The key issues
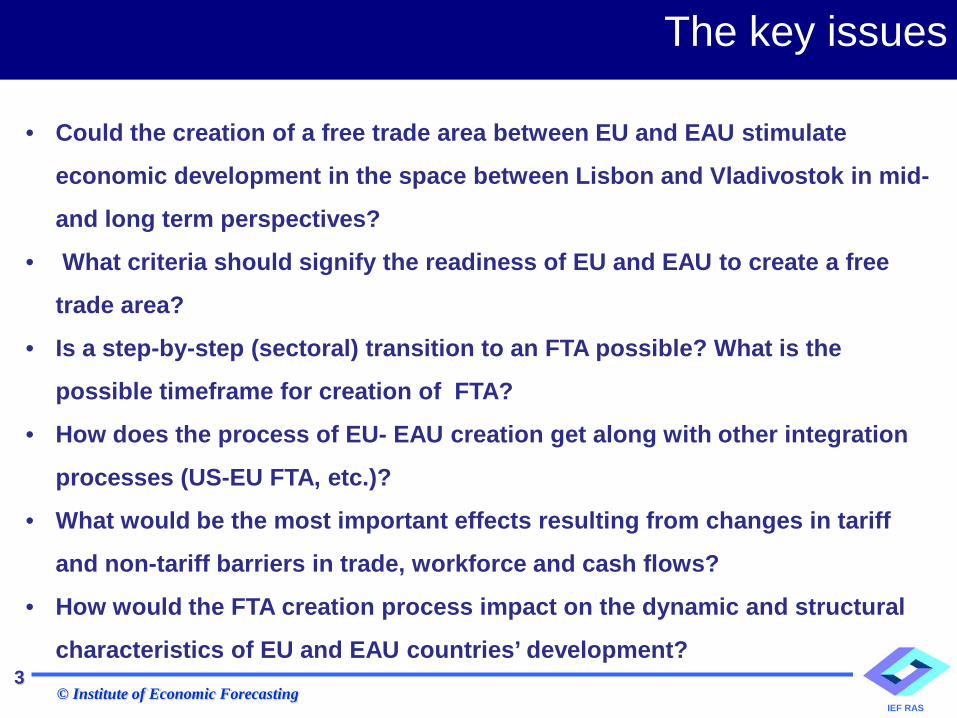
• Could the creation of a free trade area between EU and EAU stimulate
economic development in the space between Lisbon and Vladivostok in mid-
and long term perspectives?
• What criteria should signify the readiness of EU and EAU to create a free
trade area?
• Is a step-by-step (sectoral) transition to an FTA possible? What is the
possible timeframe for creation of FTA?
• How does the process of EU- EAU creation get along with other integration
processes (US-EU FTA, etc.)?
• What would be the most important effects resulting from changes in tariff
and non-tariff barriers in trade, workforce and cash flows?
• How would the FTA creation process impact on the dynamic and structural
characteristics of EU and EAU countries’ development? 3
© Institute of Economic ForecastingIEF RAS
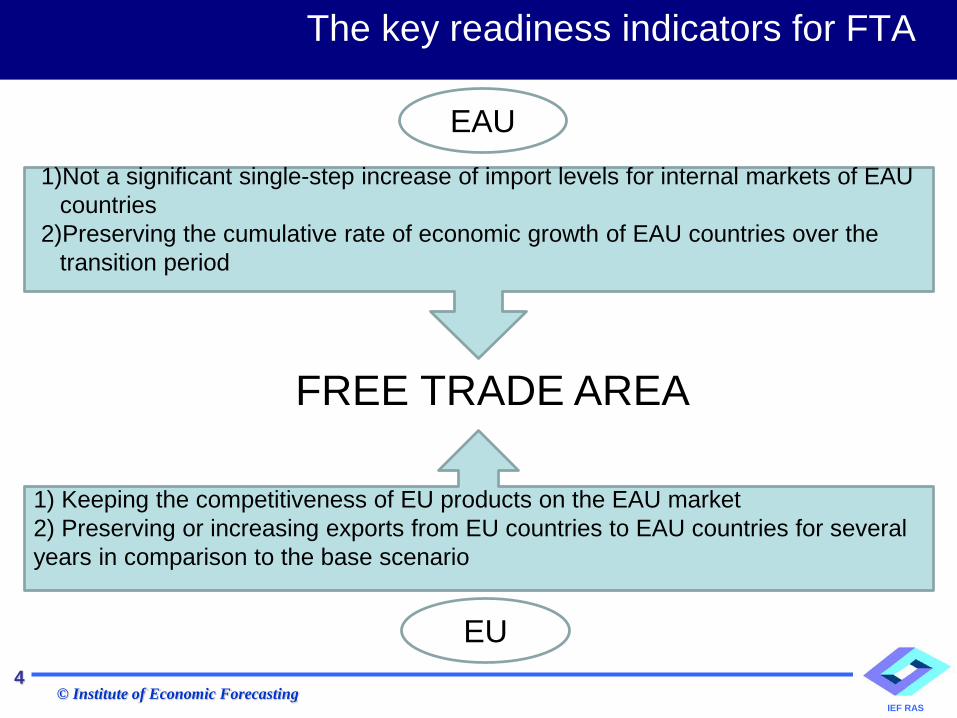
The key readiness indicators for FTA
1) Keeping the competitiveness of EU products on the EAU market2) Preserving or increasing exports from EU countries to EAU countries for several years in comparison to the base scenario
FREE TRADE AREA
EAU
EU
1)Not a significant single-step increase of import levels for internal markets of EAU countries
2)Preserving the cumulative rate of economic growth of EAU countries over the transition period
4
© Institute of Economic ForecastingIEF RAS
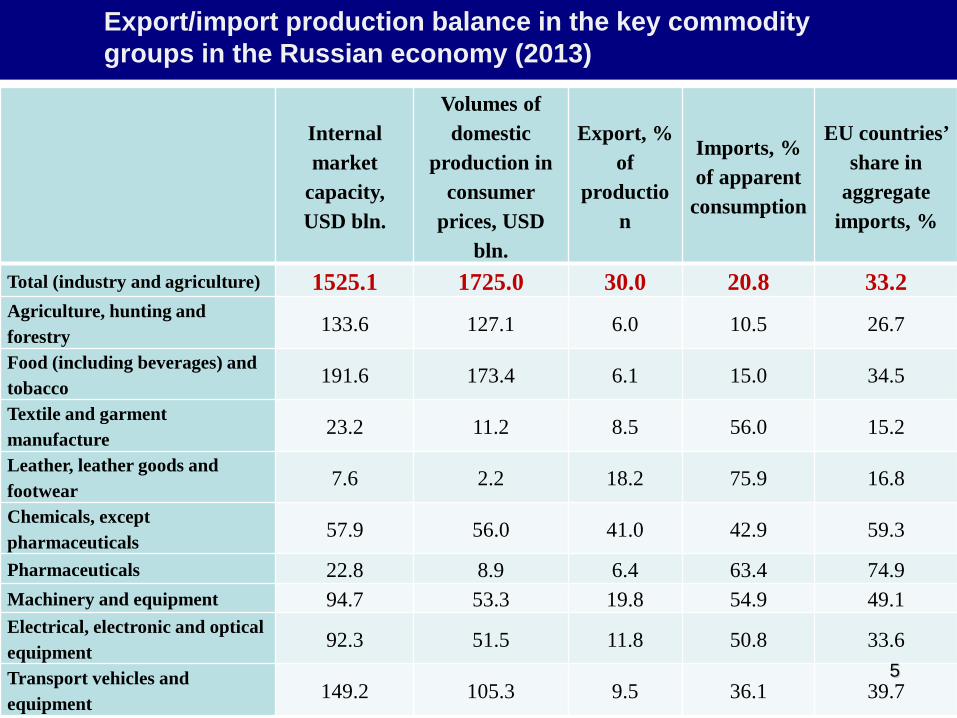
Export/import production balance in the key commodity groups in the Russian economy (2013)
Internal market
capacity, USD bln.
Volumes of domestic
production in consumer
prices, USD bln.
Export, % of
production
Imports, % of apparent
consumption
EU countries’ share in
aggregate imports, %
Total (industry and agriculture) 1525.1 1725.0 30.0 20.8 33.2Agriculture, hunting and forestry 133.6 127.1 6.0 10.5 26.7
Food (including beverages) and tobacco 191.6 173.4 6.1 15.0 34.5
Textile and garment manufacture 23.2 11.2 8.5 56.0 15.2
Leather, leather goods and footwear 7.6 2.2 18.2 75.9 16.8
Chemicals, except pharmaceuticals 57.9 56.0 41.0 42.9 59.3
Pharmaceuticals 22.8 8.9 6.4 63.4 74.9Machinery and equipment 94.7 53.3 19.8 54.9 49.1Electrical, electronic and optical equipment 92.3 51.5 11.8 50.8 33.6
Transport vehicles and equipment 149.2 105.3 9.5 36.1 39.7
5
© Institute of Economic ForecastingIEF RAS
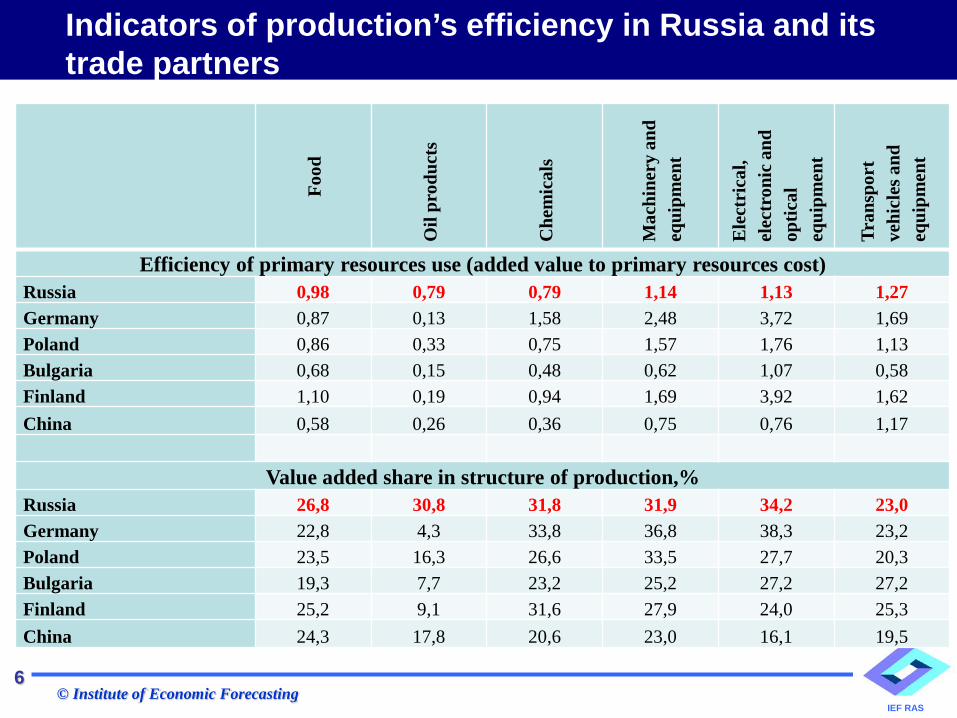
Indicators of production’s efficiency in Russia and its trade partners
Food
Oil
prod
ucts
Che
mic
als
Mac
hine
ry a
nd
equi
pmen
t
Ele
ctri
cal,
elec
tron
ic a
nd
optic
al
equi
pmen
t
Tran
spor
t ve
hicl
es a
nd
equi
pmen
t
Efficiency of primary resources use (added value to primary resources cost)Russia 0,98 0,79 0,79 1,14 1,13 1,27Germany 0,87 0,13 1,58 2,48 3,72 1,69Poland 0,86 0,33 0,75 1,57 1,76 1,13Bulgaria 0,68 0,15 0,48 0,62 1,07 0,58Finland 1,10 0,19 0,94 1,69 3,92 1,62China 0,58 0,26 0,36 0,75 0,76 1,17
Value added share in structure of production,%Russia 26,8 30,8 31,8 31,9 34,2 23,0Germany 22,8 4,3 33,8 36,8 38,3 23,2Poland 23,5 16,3 26,6 33,5 27,7 20,3Bulgaria 19,3 7,7 23,2 25,2 27,2 27,2Finland 25,2 9,1 31,6 27,9 24,0 25,3China 24,3 17,8 20,6 23,0 16,1 19,5
6
© Institute of Economic ForecastingIEF RAS
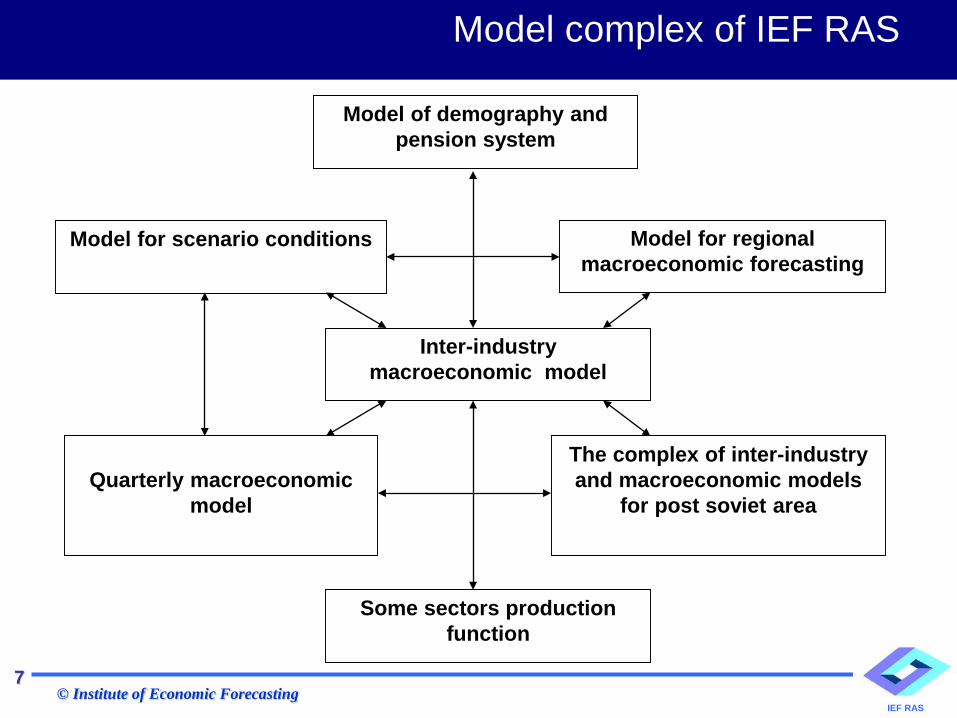
Model complex of IEF RAS
Inter-industry macroeconomic model
Model for scenario conditions Model for regional macroeconomic forecasting
Quarterly macroeconomic model
The complex of inter-industry and macroeconomic models
for post soviet area
Some sectors production function
Model of demography and pension system
7
© Institute of Economic ForecastingIEF RAS
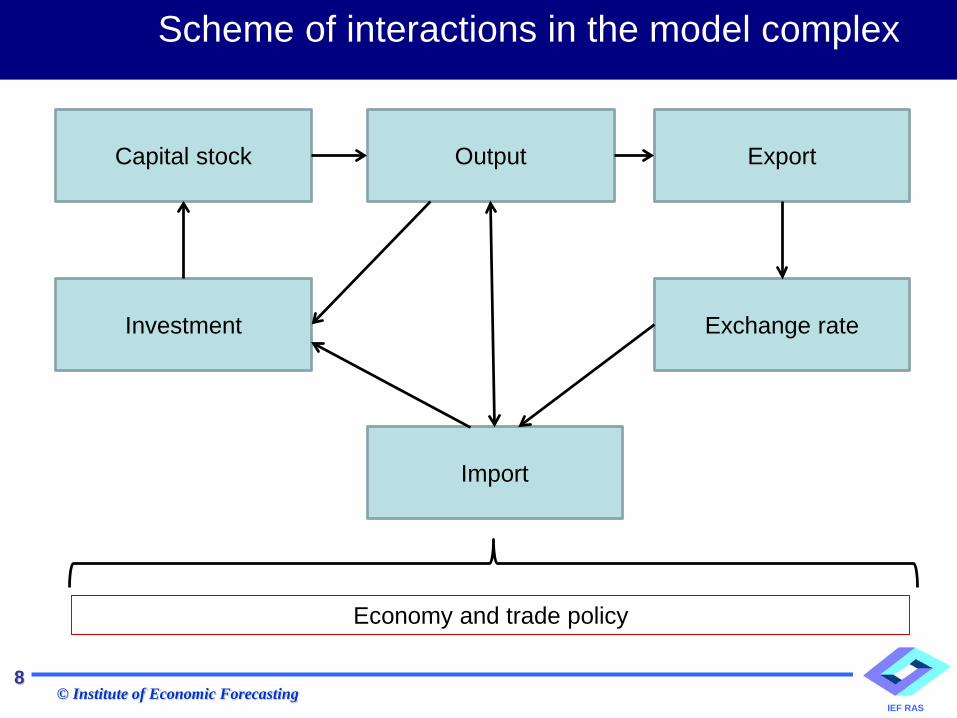
OutputCapital stock Export
Exchange rateInvestment
Import
Scheme of interactions in the model complex
Economy and trade policy
8
© Institute of Economic ForecastingIEF RAS
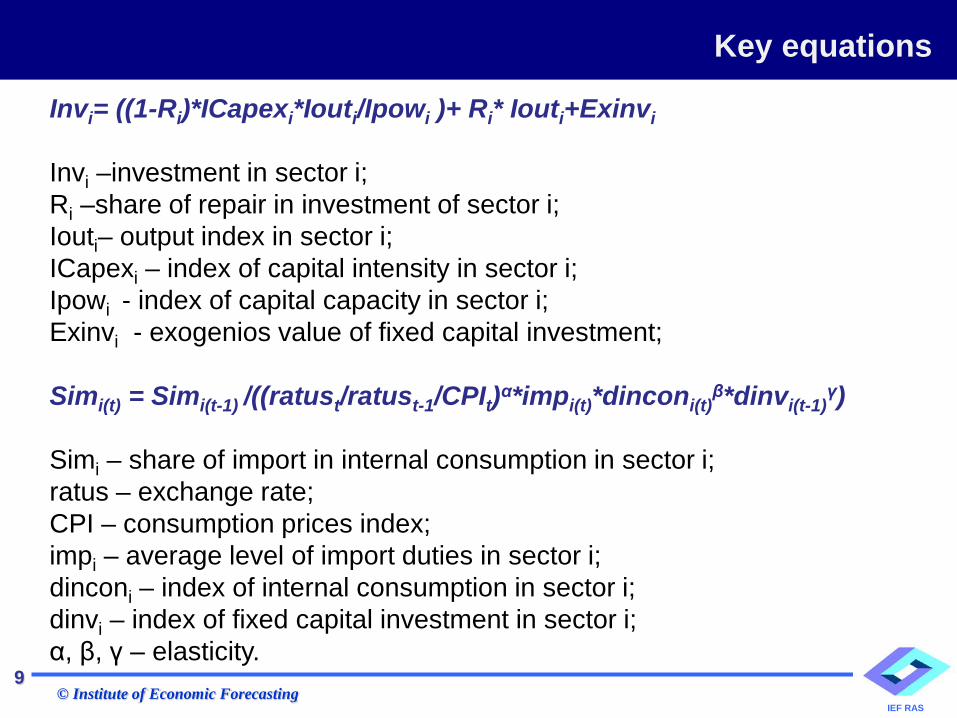
Invi= ((1-Ri)*ICapexi*Iouti/Ipowi )+ Ri* Iouti+Exinvi
Invi –investment in sector i;Ri –share of repair in investment of sector i;Iouti– output index in sector i;ICapexi – index of capital intensity in sector i;Ipowi - index of capital capacity in sector i;Exinvi - exogenios value of fixed capital investment;
Simi(t) = Simi(t-1) /((ratust/ratust-1/CPIt)α*impi(t)*dinconi(t)β*dinvi(t-1)
γ)
Simi – share of import in internal consumption in sector i;ratus – exchange rate;CPI – consumption prices index;impi – average level of import duties in sector i;dinconi – index of internal consumption in sector i;dinvi – index of fixed capital investment in sector i;α, β, γ – elasticity.
Key equations
9
© Institute of Economic ForecastingIEF RAS
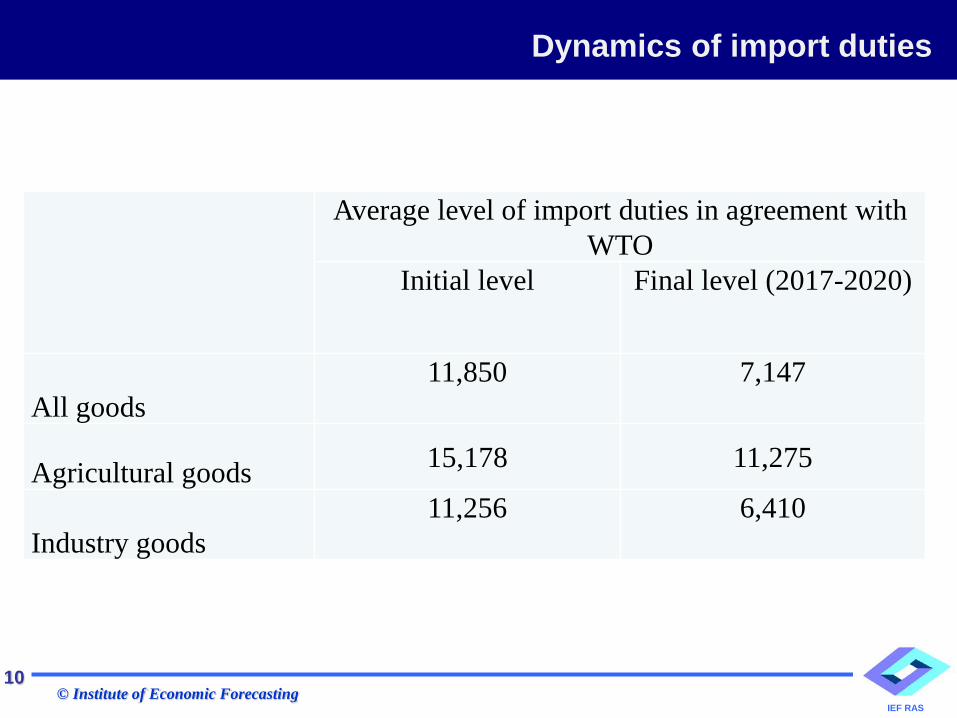
Average level of import duties in agreement with WTO
Initial level Final level (2017-2020)
All goods11,850 7,147
Agricultural goods 15,178 11,275
Industry goods11,256 6,410
Dynamics of import duties
10
© Institute of Economic ForecastingIEF RAS
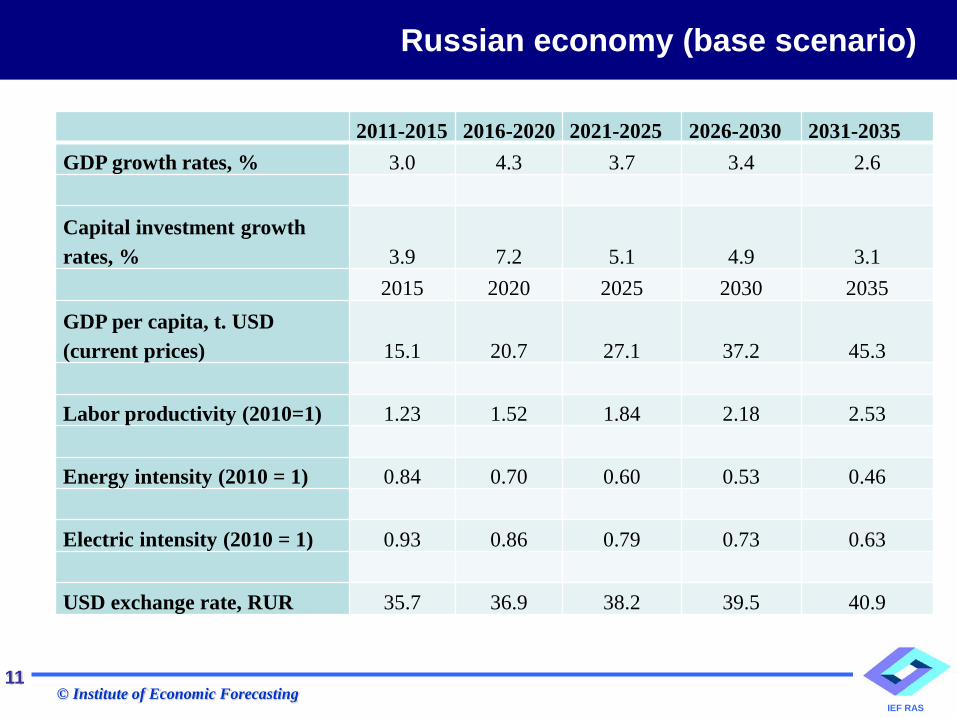
2011-2015 2016-2020 2021-2025 2026-2030 2031-2035GDP growth rates, % 3.0 4.3 3.7 3.4 2.6
Capital investment growth rates, % 3.9 7.2 5.1 4.9 3.1
2015 2020 2025 2030 2035GDP per capita, t. USD (current prices) 15.1 20.7 27.1 37.2 45.3
Labor productivity (2010=1) 1.23 1.52 1.84 2.18 2.53
Energy intensity (2010 = 1) 0.84 0.70 0.60 0.53 0.46
Electric intensity (2010 = 1) 0.93 0.86 0.79 0.73 0.63
USD exchange rate, RUR 35.7 36.9 38.2 39.5 40.9
Russian economy (base scenario)
11
© Institute of Economic ForecastingIEF RAS
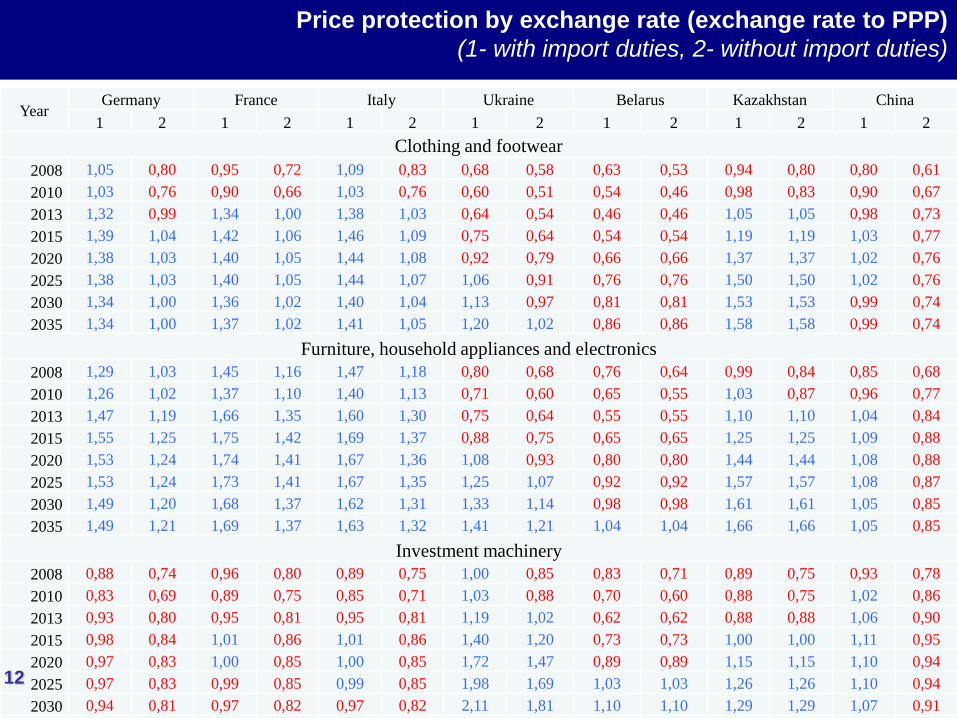
YearGermany France Italy Ukraine Belarus Kazakhstan China
1 2 1 2 1 2 1 2 1 2 1 2 1 2Clothing and footwear
2008 1,05 0,80 0,95 0,72 1,09 0,83 0,68 0,58 0,63 0,53 0,94 0,80 0,80 0,612010 1,03 0,76 0,90 0,66 1,03 0,76 0,60 0,51 0,54 0,46 0,98 0,83 0,90 0,672013 1,32 0,99 1,34 1,00 1,38 1,03 0,64 0,54 0,46 0,46 1,05 1,05 0,98 0,732015 1,39 1,04 1,42 1,06 1,46 1,09 0,75 0,64 0,54 0,54 1,19 1,19 1,03 0,772020 1,38 1,03 1,40 1,05 1,44 1,08 0,92 0,79 0,66 0,66 1,37 1,37 1,02 0,762025 1,38 1,03 1,40 1,05 1,44 1,07 1,06 0,91 0,76 0,76 1,50 1,50 1,02 0,762030 1,34 1,00 1,36 1,02 1,40 1,04 1,13 0,97 0,81 0,81 1,53 1,53 0,99 0,742035 1,34 1,00 1,37 1,02 1,41 1,05 1,20 1,02 0,86 0,86 1,58 1,58 0,99 0,74
Furniture, household appliances and electronics2008 1,29 1,03 1,45 1,16 1,47 1,18 0,80 0,68 0,76 0,64 0,99 0,84 0,85 0,682010 1,26 1,02 1,37 1,10 1,40 1,13 0,71 0,60 0,65 0,55 1,03 0,87 0,96 0,772013 1,47 1,19 1,66 1,35 1,60 1,30 0,75 0,64 0,55 0,55 1,10 1,10 1,04 0,842015 1,55 1,25 1,75 1,42 1,69 1,37 0,88 0,75 0,65 0,65 1,25 1,25 1,09 0,882020 1,53 1,24 1,74 1,41 1,67 1,36 1,08 0,93 0,80 0,80 1,44 1,44 1,08 0,882025 1,53 1,24 1,73 1,41 1,67 1,35 1,25 1,07 0,92 0,92 1,57 1,57 1,08 0,872030 1,49 1,20 1,68 1,37 1,62 1,31 1,33 1,14 0,98 0,98 1,61 1,61 1,05 0,852035 1,49 1,21 1,69 1,37 1,63 1,32 1,41 1,21 1,04 1,04 1,66 1,66 1,05 0,85
Investment machinery2008 0,88 0,74 0,96 0,80 0,89 0,75 1,00 0,85 0,83 0,71 0,89 0,75 0,93 0,782010 0,83 0,69 0,89 0,75 0,85 0,71 1,03 0,88 0,70 0,60 0,88 0,75 1,02 0,862013 0,93 0,80 0,95 0,81 0,95 0,81 1,19 1,02 0,62 0,62 0,88 0,88 1,06 0,902015 0,98 0,84 1,01 0,86 1,01 0,86 1,40 1,20 0,73 0,73 1,00 1,00 1,11 0,952020 0,97 0,83 1,00 0,85 1,00 0,85 1,72 1,47 0,89 0,89 1,15 1,15 1,10 0,942025 0,97 0,83 0,99 0,85 0,99 0,85 1,98 1,69 1,03 1,03 1,26 1,26 1,10 0,942030 0,94 0,81 0,97 0,82 0,97 0,82 2,11 1,81 1,10 1,10 1,29 1,29 1,07 0,91
Price protection by exchange rate (exchange rate to PPP)(1- with import duties, 2- without import duties)
12
© Institute of Economic ForecastingIEF RAS
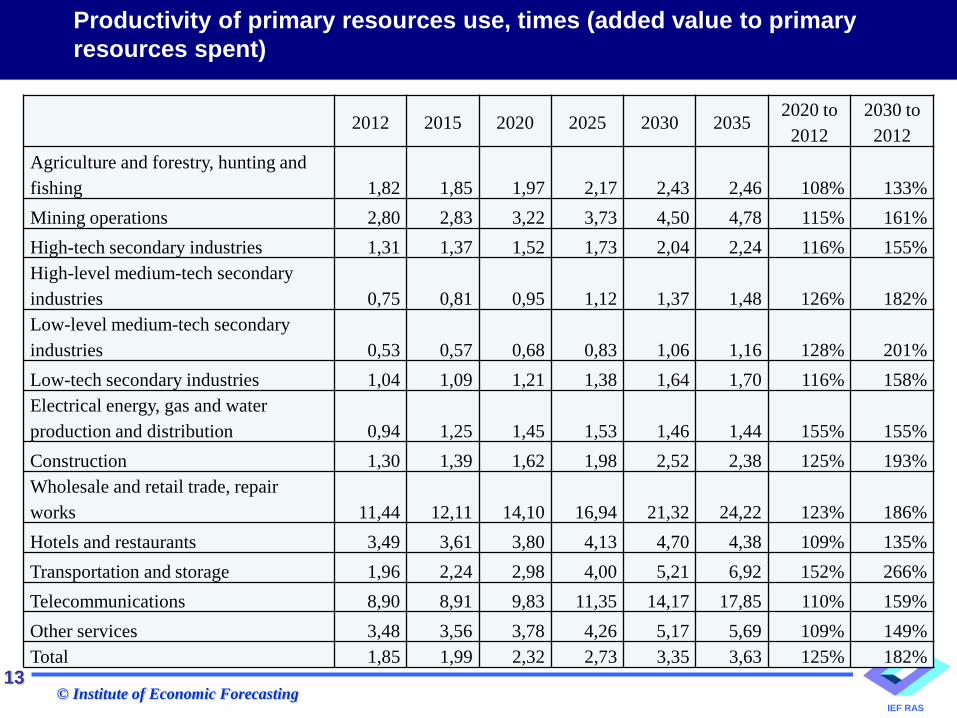
2012 2015 2020 2025 2030 20352020 to
20122030 to
2012Agriculture and forestry, hunting and fishing 1,82 1,85 1,97 2,17 2,43 2,46 108% 133%Mining operations 2,80 2,83 3,22 3,73 4,50 4,78 115% 161%High-tech secondary industries 1,31 1,37 1,52 1,73 2,04 2,24 116% 155%High-level medium-tech secondary industries 0,75 0,81 0,95 1,12 1,37 1,48 126% 182%Low-level medium-tech secondary industries 0,53 0,57 0,68 0,83 1,06 1,16 128% 201%Low-tech secondary industries 1,04 1,09 1,21 1,38 1,64 1,70 116% 158%Electrical energy, gas and water production and distribution 0,94 1,25 1,45 1,53 1,46 1,44 155% 155%Construction 1,30 1,39 1,62 1,98 2,52 2,38 125% 193%Wholesale and retail trade, repair works 11,44 12,11 14,10 16,94 21,32 24,22 123% 186%Hotels and restaurants 3,49 3,61 3,80 4,13 4,70 4,38 109% 135%Transportation and storage 1,96 2,24 2,98 4,00 5,21 6,92 152% 266%Telecommunications 8,90 8,91 9,83 11,35 14,17 17,85 110% 159%Other services 3,48 3,56 3,78 4,26 5,17 5,69 109% 149%Total 1,85 1,99 2,32 2,73 3,35 3,63 125% 182%
Productivity of primary resources use, times (added value to primary resources spent)
13
© Institute of Economic ForecastingIEF RAS
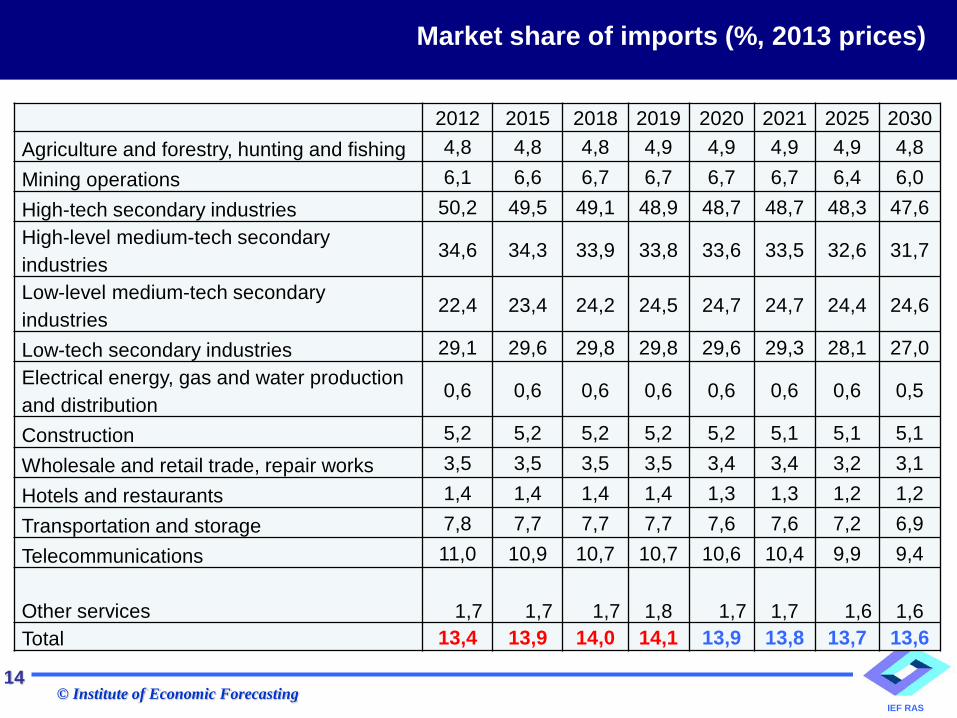
2012 2015 2018 2019 2020 2021 2025 2030Agriculture and forestry, hunting and fishing 4,8 4,8 4,8 4,9 4,9 4,9 4,9 4,8Mining operations 6,1 6,6 6,7 6,7 6,7 6,7 6,4 6,0High-tech secondary industries 50,2 49,5 49,1 48,9 48,7 48,7 48,3 47,6High-level medium-tech secondary industries
34,6 34,3 33,9 33,8 33,6 33,5 32,6 31,7
Low-level medium-tech secondary industries
22,4 23,4 24,2 24,5 24,7 24,7 24,4 24,6
Low-tech secondary industries 29,1 29,6 29,8 29,8 29,6 29,3 28,1 27,0Electrical energy, gas and water production and distribution
0,6 0,6 0,6 0,6 0,6 0,6 0,6 0,5
Construction 5,2 5,2 5,2 5,2 5,2 5,1 5,1 5,1Wholesale and retail trade, repair works 3,5 3,5 3,5 3,5 3,4 3,4 3,2 3,1Hotels and restaurants 1,4 1,4 1,4 1,4 1,3 1,3 1,2 1,2Transportation and storage 7,8 7,7 7,7 7,7 7,6 7,6 7,2 6,9Telecommunications 11,0 10,9 10,7 10,7 10,6 10,4 9,9 9,4
Other services 1,7 1,7 1,7 1,8 1,7 1,7 1,6 1,6 Total 13,4 13,9 14,0 14,1 13,9 13,8 13,7 13,6
Market share of imports (%, 2013 prices)
14

© Institute of Economic ForecastingIEF RAS
THANK YOU
FOR YOU ATTENTION
15