Embed Size (px)
Citation preview

Markus Herrmann and Erik Luhr
Supervisor: Martin Johanson
Free on the Web!
The Profitability of a Radical Price
Master’s Thesis, Department of Business Studies, Uppsala University
Autumn term 2009

Abstract
This thesis examines companies offering their services for free to Internet users, by
employing digital free business models. As a framework Chris Anderson’s classifications
of “free” business models are used. A sample of eleven companies that provide “free”
services was selected and divided into four groups. These were search engine, social
networking/community, content based and others. Their profitability was then measured
in relation to their valuation with the help of P/E ratios within and among the groups. A
regression analysis was also conducted to compare profitability of either one of two
“free” business models used by the researched companies.
Findings were that search engine and social networking/community companies appear to
have profits for the period researched. No strong trend for overvaluation could be found
in either of these groups, except for individual companies with high P/E ratios. Neither
company within the content based group showed any profits. Their marginal costs were
too high but this may change with technological progress. Regression analysis could not
show any significant results employing either the “Freemium” or the advertising “free”
business model to be more profitable than the other. Significant results could be shown
being a content based company and being unprofitable. Comparison between specific
companies gave mixed results but network effects appear to create dominant players
within each group. Employing more than only the advertising “free” business model
seems to be efficient in raising revenue per user for social networking/community
companies.
Keywords: Free Business Models, Digital Free, Three Party Markets, Advertising,
Internet, Search Engine, Social Network, Community, Net Income, Valuation, P/E ratio,
dot-com companies, Chris Anderson.!

Table of Contents
1. Introduction................................................................................................................... 2
1.1 Background...........................................................................................................................2
1.2 Purpose and Research Question .........................................................................................5
2. Theory ............................................................................................................................ 6
2.1 Going from free to fee ..........................................................................................................7
2.2 The four “free” business models .........................................................................................7
2.3 Network effects .....................................................................................................................9
3. Method ......................................................................................................................... 10
3.1 Delimitations .......................................................................................................................11
3.2 Sample .................................................................................................................................11
3.3 Criticism of the sources......................................................................................................13
4. Results .......................................................................................................................... 15
4.1 Search engines.....................................................................................................................15
4.2 Social Networks/ Community............................................................................................17
4.2.3 Myspace............................................................................................................................21
4.3 Content based .....................................................................................................................25
4.4 Other....................................................................................................................................28
4.5 Regression model results....................................................................................................29
5. Analysis and Discussion.............................................................................................. 32
6. Conclusion ................................................................................................................... 38
7. Future research ........................................................................................................... 39
List of references ............................................................................................................. 40
Academic Papers ......................................................................................................................40
Books..........................................................................................................................................40
Newspaper articles ...................................................................................................................40
Web Sources..............................................................................................................................42
Journals .....................................................................................................................................47
Appendix 1. Definitions and abbreviations .................................................................. 48
Appendix 2. Calculations ............................................................................................... 50
Appendix 3. Cross references......................................................................................... 57
!

!"#$%&&'())#()*#+"#,-.&/#0&%%#1)#2.%#3%45#6.%#7&1892(49:92;#18#(#<(*9=(:#7&9=%/#
! "!
1. Introduction
There’s an old joke about a businessman who gives his products away. The joke goes
something like this: A customer asks the businessman: “How do you make money by
giving away all of your products for free?” The businessman answers: “Well, I make it up
in volume!” At first the business model of the gentle businessman does not make any
sense at all. On the Internet it could very well do. To give away products and services has
become a legitimate business model on the Internet. This has been going on for quite
some time and you can find plenty of examples in our economy. One example of it are
daily newspapers such as The New York Times that offer an online version of its content
for free, containing the very same information as in the charged printed version. Another
example is banks that give away credit cards for free but charge the merchants a
transaction fee. Chris Anderson, editor in chief of Wired Magazine and former editor at
the The Economist, is one of the main advocates of the concept of “digital free”. He
recently published a book, “Free - The Future of a Radical Price”, where he argues that
everything on the Internet will essentially become free and that there are companies that
already are or will build their business model around the concept of free. The main reason
for that statement is that the marginal cost of offering content and services on the Internet
will be close to zero in the near future. This thesis will explore the possibilities of digital
free business models and research the profitability and valuations of companies that are
using free as their business model.
1.1 Background Digital Free
The traditional way of conducting business includes an exchange of goods and services in
return for money. Today the online market suggests a shift away from this model. Chris
Anderson suggests a move of our present economy of mutual exchange of goods and
services for money, to an “economy of bits” where digital content is provided for free.
(Anderson, C. 2009, p. 12)

!"#$%&&'())#()*#+"#,-.&/#0&%%#1)#2.%#3%45#6.%#7&1892(49:92;#18#(#<(*9=(:#7&9=%/#
! #!
On the Internet a vast amount of products and services can be found that are available to
the user for free. Everything from social networks to music and video can be accessed at
virtually no cost to the user. How is this possible? The simple answer is the low marginal
cost to the supplier. When something is digitally created, be it a scanned in picture, a
written document or a created program the cost to create a copy is virtually zero. This is a
large contrast to the world of atoms were creating a copy of something requires the same
amount of material as the creation of the first object required.
The Internet has further enhanced this development. Before the Internet a transfer of
something between two computers normally required a physical storage that carried data
from one computer to another for example a CDR or a Floppy disk. With the growth of
the Internet this is no longer required, data can be spread to a countless number of users
without as much as a single floppy disk. That the Internet is a strong driver for
distributing free services and that the market is huge cannot be doubted. Out of the ten
most visited websites all ten primarily provide free services (Alexa, 2009).
A key concept to explain the emergence of digital free is the theory of the Bertrand
equilibrium. It states that in a competitive market the price will eventually equal marginal
cost. This means that the price of an item that is sold should equal the marginal cost
induced by the seller to create and sell this extra item. According to Chris Anderson
technological progress, especially on the Internet, will bring the marginal cost for
delivering digital content to zero, and if the Internet is a competitive market this will
make the content free. (Anderson, C. 2009 p.172) Technological progress is the key
driver to make this happen since crucial elements in the storing and sharing of digital
content is computer processing power, bandwidth and storage (with the latter two being
especially important for the Internet). When it comes to computer processing Gordon
Moore found a correlation between processing power and its price that has proven to still
be applicable, it is referred to as Moore’s law. The “Law” came about in 1965 he
published findings indicating that computer-processing power, the amount of transistors a
semiconductor chip can hold, doubles every 18 months for the former equivalent price. A
similar trend has been found in the price/performance of hard drive storage, the amount
of bytes that can be stored on a hard drive doubles every year. The fastest grower in

!"#$%&&'())#()*#+"#,-.&/#0&%%#1)#2.%#3%45#6.%#7&1892(49:92;#18#(#<(*9=(:#7&9=%/#
! $!
price/performance of the three cost elements is bandwidth that doubles every nine months
due to technology progression using fiber optic cables to transfer digital content.
(Anderson, C. 2009 p.78)
This technological evolution will in turn promote the use of free since the cost of
delivering and storing content will decrease. It will go on until it is close to zero, then it is
just a question of rounding down and earn money on advertising or selling premium
services.
The dot-com bubble
The rise of the Internet in the end of the nineties led to an explosion of companies with
less than well thought through business models. These companies promised a whole new
economy, their success was largely measured by how much money they were going to
earn in the future, not how much money they actually earned. In 2001 it all came to an
end as investors realized that the valuations attributed to these companies were
completely unmotivated. Most of the companies lacked sufficient business models and
had revenue and profits far from what their valuation demanded. Investors fled the
technology stocks and the companies with value primarily comprised of expectations
disappeared. (Anderson, C. 2009 p. 237)
A lot has changed since then. Dot-com companies hoping for a successful IPO today
need more than just talk about a new economy to go public. Growing value through
promises of future revenues has become harder on the stock market. There is however
still a lot being invested in the future prospects of some dot-com companies. A notable
trait of several of these companies as opposed to what happened during the last dot-com
boom is that they are privately held instead of publicly traded. This allows for a great
deal of secrecy about financial information. What leaks are generally valuations of the
companies as various venture capitalists buy into the companies in founding rounds.
These companies supply different kinds of services and many of them can boast several
million users. The common denominator these companies have is not just that they are
dot-com companies generally considered to be huge successes; they also provide their
services for free to users.

!"#$%&&'())#()*#+"#,-.&/#0&%%#1)#2.%#3%45#6.%#7&1892(49:92;#18#(#<(*9=(:#7&9=%/#
! %!
1.2 Purpose and Research Question
Today Internet users can access a whole range of services and products for free. Two
necessary questions to ask are: How is this possible? And how profitable are dot-com
companies that provide these online products and services for free? The purpose of this
study is to answer those two questions by measuring the profitability of a sample of
major dot-com “free” companies. When evaluating profitability it will be in relation to
the valuation of the respective company, this in order to find indications of possible
overvaluation. History shows that overvaluation is a possibility and the companies could
lack profits like their predecessors during the dot-com bubble.
As framework for the study Chris Anderson’s classifications of “free” business models
will be used. Three sub-purposes are devised in order to study variations in success and
their reasons in employing the concept of free:
1. Comparing the profitability of companies employing either one of two selected “free”
business models in a regression analysis.
2. Compare the profitability of groups within the sample in order to research if one group
is more likely to be profitable or unprofitable than the others.
3. Comparison of profitability between specific companies in the sample groups.
(For definitions of the italicized words see Appendix 1.)

!"#$%&&'())#()*#+"#,-.&/#0&%%#1)#2.%#3%45#6.%#7&1892(49:92;#18#(#<(*9=(:#7&9=%/#
! &!
2. Theory
Research shows that there is more to free than just a price, it changes the way we think
about things. An important psychological finding regarding this “concept of free” is that
our feelings about free products are relative not absolute. In a case were something that
used to cost some money is made free, people tend to have lower expectations of the
quality. If on the other hand the product from the beginning has been offered for free we
do not feel the same way. (Anderson, C. 2009, p.56)
Research by economist Nick Szabo shows that people who are charged for a product are
instantly faced with a mental evaluation of the cost and benefits, that eventually leads to a
decision to buy the product or not. In the case of a zero price product these “mental
transaction costs” as Szabo calls them are eliminated. The costs for buying a free product
therefore become zero and the transaction now only contains benefits. Szabo’s findings
illustrate that charging a price creates a mental barrier in contrast to a free product. There
is however mental transaction costs when consuming a free product. It can evoke
environmental concerns, for example creating a surplus of waste, or people may find
themselves looked upon as being cheap which is socially disregarded. (Anderson, C.
2009, p. 59) Neither of these aspects are however applicable to “digital free” since, for
many online services, “free” is more the rule than the exception, and the pollution effects
of Internet usage are neglected by virtually all users.
Hosanger, a professor at Wharton, builds on Szabo’s findings by showing how demand
for a zero price product is many times higher than the demand for a product at a low price
(Anderson, C. 2009, p. 62). Schampanier, Mazar and Ariely confirmed Hosanger findings
in an empirical study on zero price effect on personal behavior. Schampanier, Mazar and
Ariely conducted an experiment aimed at measuring the difference between an almost
zero-priced product and a zero-priced product. The research showed that when people are
faced with a choice between two products, where one of them is offered for free, people
tend to overreact to the free product. It seems as if zero price not only means a low cost
!"#$%&&'())#()*#+"#,-.&/#0&%%#1)#2.%#3%45#6.%#7&1892(49:92;#18#(#<(*9=(:#7&9=%/#
! '!
for buying the product but also results in a higher valuation of the product compared to a
product offered in a positive monetary term (price > 0). (Schampanier et al. 2007 p.743)
2.1 Going from free to fee An empirical study on the subject of digital free covers a company that changed their
previously ad-financed service to a two versions service. The free version featured ads
and restricted access to the material available, most articles were however still available.
The premium version was ad-free and gave access to all material. The company
researched provided content of interest to marketing professionals. (Pauwels, K., &
Weiss, A. 2008 p.16) The transition from free to fee was successful and led to a net
income gain, a loss in growth of free subscribers did however also occur (Pauwels, K., &
Weiss, A. 2008 p.28). If these findings are translatable to other free services is however
questioned by the authors, for example it is suggested that the younger generation is not
willing to pay for anything on the Internet, something that will cause problems for
companies that primarily serve young users. This study only covers one company in dept
but mentions a competitor that attempted a similar move as the researched company. The
competitor failed to raise net income (possibly due to bad pricing). It is also noteworthy
that many of the clients that paid for the content were companies that used the research in
their business. This study shows that a transition from free to fee is possible, if the
findings are translatable to other companies that have their users within the general public
is as stated by the authors “questionable”. (Pauwels, K., & Weiss, A. 2008 p.29)
2.2 The four “free” business models Currently only limited empirical research that specifically targets companies with “free”
strategies exist, models and classifications are therefore equally rare. Below is a general
classification, as suggested by author and editor Chris Anderson:
1. Cross-Subsidy: The business model offers services for free to one user group
while at the same time earning money from another. This model is employed by
for example auction companies that charge money from sellers but not from
buyers. (Anderson, C. 2009 p.23)
2. The Three Party Market: This business model is an old “Free” model, a
publisher provides a free service to one group (users) but earns revenue by selling
!"#$%&&'())#()*#+"#,-.&/#0&%%#1)#2.%#3%45#6.%#7&1892(49:92;#18#(#<(*9=(:#7&9=%/#
! (!
the attention of the users to advertisers. Revenue is earned by displaying
advertising as the service or product is in use, something that has already been in
use a long time in for example commercial radio and free newspapers. (Anderson,
C. 2009 p.24) The Internet is full of Three Party Markets, this since ad-financing
is very common online. Advertising on the web is generally based on displaying
ads next to the actual topic of interest to the user. An advertiser buys a certain
number of “views” of their ad on a website. A company that solely relies on
selling advertising on its website has revenues equal to Revenue per thousand
page views times their total page views divided by thousand. Revenue per
thousand page views is determined by what user group the site is targeting, how
big the banner is, where it is placed and the rate of clicks on it. The Click-
through-rate is a major issue for advertisers wanting to draw traffic to their own
site. Research on this subject made by firms’ comScore and Starcom has shown
that 8 percent of US Internet users account for 85 percent of all clicks on
advertising banners and 84 percent of Internet users do not click on them at all
(Lipsman, A. 2009a).
3. Freemium: When the “Freemium” model is employed a small group of premium
users, that get more advanced services or a more advanced version of the product
or service, pay and thereby make a basic version of the product available to basic
users for free. There are several reasons for giving away the free version. Such as:
let users try the product before buying the premium version, grow the number of
users and hope to turn the product into a standard or even harm competitors that
charge for its competing product. When digital, this is done at pretty much zero
marginal cost since copying and distributing most digital content is virtually free.
(Anderson, C. 2009 p.26)
4. Nonmonetary Markets/Gift Economy: Finally we have what is on the Internet
and for digital goods in general perceived as the open source model (see
Appendix 1).The development of Open Source or “Wiki” projects is to a large
extent created with motivators such as building reputation, intellectual stimulation
and gaining new knowledge and skills (Iansiti and Sarnoff 2006 p.6). This model
does not really generate revenue for the creator and it is based more on
!"#$%&&'())#()*#+"#,-.&/#0&%%#1)#2.%#3%45#6.%#7&1892(49:92;#18#(#<(*9=(:#7&9=%/#
! )!
cooperation and mutual benefit than actual profit maximization (the products
created by the open source movement are however often used for commercial
purposes, see for example Iansiti and Sarnoff 2006 p.23) (Anderson, C. 2009
p.27). A popular open source project is the online encyclopedia Wikipedia were
users add content to the encyclopedia without getting paid.
There is often no clear distinction between the different models and companies frequently
use more than one model to generate revenue. Anderson does not specify any other
aspect than how revenue is generated and it is in that context “business model” should be
understood.
2.3 Network effects An important factor on the Internet is Network effects. The theory states that growth in
the quantity of individuals within a population that use a product or service promotes
further growth in the quantity of users of the particular product or service within that
population, this since the benefits of using the product or service will increase if it has
more users (Anderson, C. 2009 p.172). On the Internet this is highly relevant, when
people for example begin registering on a social community where most of the content is
created by the members and thereby most relevant to people close to them. The company
behind the website will encourage its users to invite other people they know to join the
website. When successful it will allow the website to show ads to more users or improve
the odds of selling more of their own products and services. The incentive for members to
invite their friends is to create a service with higher relevancy for themselves and their
friends. This can explain the “hype” leading to fast acceleration of user growth as
witnessed by certain online communities. And since most social communities are free
there is no need for those mental calculations that could make friends think twice about
joining.
!"#$%&&'())#()*#+"#,-.&/#0&%%#1)#2.%#3%45#6.%#7&1892(49:92;#18#(#<(*9=(:#7&9=%/#
! *+!
3. Method
In order to measure the profitability of companies that pursue “free” strategies as their
main business model we will create a sample of companies that consist of some of the
most well known “Digital Free” companies. Research will be performed in order to
determine the efficiency of each company’s strategy and if any common denominators
exist among companies that do turn a profit as opposed to companies that don’t. The two
measures chosen in order to determine profitability is the latest available Net Income and
the P/E ratio. Both measures require relatively little information and suit the purpose of
the study well. For unquoted companies we will use estimated numbers of Net Income
and the most recent valuation or when no plausible valuation exists calculate an estimate
(in order to calculate the P/E ratio). The companies will be assessed values according to
whether or not they turn a profit. Regression with dummy variables will then examine if
there is any link between the employment of advertising (Three Party Market) or
Freemium business models of the respective companies and their profit. We will also
look for apparent differences in profitability between search engines, social networks and
content providers. We are however aware of the weakness of these results due to the
relatively small sample of companies. When possible revenue per user and revenue per
thousand page views has been calculated in order to compare the effectiveness in
generating revenue between the sampled companies. (For definitions of the italicized
words see Appendix 1.)
The primary sources for gathering data will be articles from well-established newspapers,
academic papers and when available annual reports from the companies’ researched as
well as other data presented by the respective companies on their web sites. An important
aspect is that several of the companies researched are privately held and therefore not
obligated to provide information on earnings and other financial data, their reluctance to
do so is probably motivated by competition. The business press is however often able to
retrieve information regarding numbers usable for making estimates. By cross-
referencing such sources the credibility of the estimates is increased. Our aim is to create
!"#$%&&'())#()*#+"#,-.&/#0&%%#1)#2.%#3%45#6.%#7&1892(49:92;#18#(#<(*9=(:#7&9=%/#
! **!
a study that is relevant today and uses as recent material as possible, therefore we have
used numbers from the last quarter in 2008 and the three first of 2009 when calculating
net income. For the companies were estimations have been necessary the period covered
is 2009. Since so little financial information is published about several of the companies
in the study the use of estimation techniques is necessary. When selecting between
techniques a search for the “least bad technique” led to different choices for different
companies. For example some numbers are based upon known ratios of publicly traded
companies that run a similar business as the company for which estimation is made. The
implication of having to rely on such techniques undermines the research’s credibility.
Therefore the estimated numbers presented should be interpreted more as indications than
facts.
3.1 Delimitations
This thesis will examine profit-maximizing businesses. Open Source projects are
generally created with other motives and are therefore left out in this study. In order to
have a large enough sample to allow some comparison between business models focus
will be solely on companies that use the Three Party Market model and/or the Freemium
model. These two are currently the dominant free business models on the Internet and
have therefore been selected. Due to this the comparatively rare Cross- Subsidy Business
Model is also excluded since an inclusion of one or two such companies would further
limit the comparability among the two business models researched.
3.2 Sample The companies included in this sample have all been selected based on variables such as
size, service provided, data available and business model. The biggest emphasis has been
on presenting information on publicly known companies that have a substantial amount
of users and are generally considered as big successes. It is also a requirement that the
company selected offer at least their basic services for free to the public. The reason for
choosing major firms follows from the assumption that if not even the market leaders are
making profits, then who is? Eleven companies were selected, partly based on the amount
of traffic their respective site is generating, this as measured by the website traffic
company Alexa.com.

!"#$%&&'())#()*#+"#,-.&/#0&%%#1)#2.%#3%45#6.%#7&1892(49:92;#18#(#<(*9=(:#7&9=%/#
! *"!
In order to show how often a website is visited on a global scale we included the rank of
the companies in our sample (shown in brackets) that are listed on Alexa.com. The
website calculates a ranking of websites using a combination of average daily visitors and
page views over the past month (observe that the Alexa ranking covers the “.com”
address of most sites in our sample and not country-specific domains like “.se” or
“.co.uk.”) The sample has been categorized into four groups and consists of the
following:
Search engines:
• Baidu: The leading Chinese language search engine in the world (8th place).
• Google: The world’s biggest search engine (1st place).
• Yahoo: The world’s second largest search engine (4th place).
Social networks/Communities:
• Facebook: The world’s largest social network (2nd place).
• LinkedIn: The world’s largest networking site for professionals (40th place ).
• MySpace: Previously the world’s largest social network, currently the second
largest (14th place ).
• Twitter: Market leader in micro-blogging (13th place).
• Xing: The largest career portal in Europe (268th place).
Content based:
• Spotify: A fast growing service for streaming music (N/A).
• Youtube: The world’s largest site for sharing video content (3rd place).
Other:
• Skype: Currently the world’s largest IP-phone company (N/A).
We chose to research the three biggest search engines in the world as they attract most of
the traffic for that service and at the same time offer their services for free. The selection
of social networking/community websites follows from the assumption that Facebook
and MySpace are the social networking websites with most users today. Twitter was

!"#$%&&'())#()*#+"#,-.&/#0&%%#1)#2.%#3%45#6.%#7&1892(49:92;#18#(#<(*9=(:#7&9=%/#
! *#!
chosen under the same category since the company is the biggest in micro blogging and
show strong user growth. The choice to include LinkedIn as a social networking site is
due to it being the biggest professional network in the world in terms of users. Xing is
included since it is the dominating professional network for the German speaking part of
Europe and the biggest professional network in Europe in terms of users (that Xing is
publicly traded was also taken into account). Under “Content based” we sorted
companies that primarily serve as providers of “heavy” content like video and music. In
order to include a service that offers music streaming Spotify was chosen, it is currently
the only company offering this service for free. Youtube was chosen since it is the most
widely used site for video content. We deemed it as being too important to leave out
when researching digital free, despite the fact that it is a part of Google since 2006. Skype
offers free calls between computers as well as selling calls to regular phones, it boasts
over half a billion users. Skype has also recently been partly detached from eBay. For the
search engines and Youtube it is not possible to calculate revenue per user since use of
these services does not require registration. We will only calculate a revenue per
thousand page views for social community companies except Twitter that can be
accessed through a third party application.
3.3 Criticism of the sources The difference in owner structure composes a challenge when providing financial
information for all the companies in our sample. Some are publicly traded others part of a
bigger corporation or privately held. The publicly traded companies being Baidu, Google,
Yahoo and Xing are obligated by law to publicly announce their earnings and costs in an
annual report, hence accurate information was easily retrieved. Other companies have
been acquired and are currently part of bigger corporations: Youtube is part of Google,
MySpace is part of News Corp and Skype was (until very recently) part of eBay. Since
most of the companies do not present financial information separately for these divisions
we had to rely on secondary data from the media. Facebook, LinkedIn, Spotify and
Twitter are privately held and are therefore not required to share any financial
information. Since estimation was required for all non-publicly traded companies the
calculations of their respective net income and P/E ratio are naturally less accurate than
that of publicly traded ones. The estimates were primarily based on numbers presented in

!"#$%&&'())#()*#+"#,-.&/#0&%%#1)#2.%#3%45#6.%#7&1892(49:92;#18#(#<(*9=(:#7&9=%/#
! *$!
newspaper articles and therefore their reliability depend on the accuracy of these
numbers, this should be taken into consideration when studying the results. When
possible we have cross-referenced these sources.
!"#$%&&'())#()*#+"#,-.&/#0&%%#1)#2.%#3%45#6.%#7&1892(49:92;#18#(#<(*9=(:#7&9=%/#
! *%!
4. Results
4.1 Search engines
4.1.1 Baidu
5.2 percent of searches • Founded in the year 2000 •
Chinese language search engine • Ad-based
Baidu is the leading Chinese language search engine in the world and market leader in
China. The company is according to web information company website Alexa.com the 8th
most visited Website in the world. The firm offers various search forms and community
services similar to the ones offered by Yahoo and Google. Ranging from mail services,
mobile Internet to anti virus programs for free (Baidu 2009a). Baidu earns money by
letting customers “pay for performance” (P4P). The business model “pay for
performance” refers to that customers can bid for a better placement of their links to their
websites related to Baidu search results, a kind of ad based model used by most search
engines (Baidu 2009b). This is also similar to what Google and Yahoo does. In the Baidu
annual report for 2008 the company reported net income for Q4 2008 of $42,3 million. In
Q1-Q3 2009 Baidu reported net income of $154,8 million. The TTM net income for Q4
2008 and Q1-Q3 2009 was $197,1 million. We retrieved the market cap of Baidu from
Google Finance on 2009-12-18; it was $14,73billion and resulted in a P/E ratio of 74,73
(see Appendix 2 Table 1).
4.1.2 Google
62.4 percent of searches • Founded in 1996 • Search engine, Webmail,
Maps and more • Ad-based
Google is a dominant player on the Internet, ranked the indisputable number one search
engine in nearly all countries according to Alexa.com (Alexa 2009). Google offers all of
!"#$%&&'())#()*#+"#,-.&/#0&%%#1)#2.%#3%45#6.%#7&1892(49:92;#18#(#<(*9=(:#7&9=%/#
! *&!
its services for free to the public and earns 97 percent of its revenue by selling advertising
space on the Google websites (66%) and from Google Network web sites (31%). The
advertisement is displayed next to search results at Google’s Internet Search, e-mail,
online mapping, social networking and video sharing services. The remaining three
percent of revenues comes from licensing and other revenues. Google is publicly traded
and made its IPO on 19th August 2004 (Google 2009b). In the Google interim report for
Q4 2008 the company reported a net income of $382 million. In Q1-Q3 2009 Google
reported $4,546 billion in net income. The net income for Q4 2008 to Q3 2009 results in
$4,9 billion. Google Market cap retrieved from Google Finance on 14th December 2009
was $188,6 billion resulting in a P/E ratio of 38,26 (see Appendix 2 Table 3).
4.1.3 Yahoo
12.8 percent of searches • Founded 1995 • Search engine, Webmail, Finance and more •
Ad-based
Yahoo is the second biggest search engine on the Internet according to Alexa.com. The
company offers a vast amount of services e.g. web portal, search engine, mail, news,
advertising, online mapping, video and social media websites etc. all are services that are
free to the public. Yahoo was founded in 1995 and launched an IPO in 1996. The
company had 13 500 employees in the first quarter 2009 and makes most of its money
from advertising (Yahoo 2009c). According to the interim report for Q4 2008 Yahoo had
a net loss of $303,4 million for the quarter. In the first nine months 2009 Yahoo’s net
income was $445,0 million. According to data retrieved on the 14th of December 2009
market cap was $21,91 billion resulting in a P/E ratio of 154,7 (see Appendix 2 Table
10).
!"#$%&&'())#()*#+"#,-.&/#0&%%#1)#2.%#3%45#6.%#7&1892(49:92;#18#(#<(*9=(:#7&9=%/#
! *'!
4.2 Social Networks/ Community
4.2.1 Facebook
350 Million users • Founded in 2004 • Social Networking • Ad-based, some Virtual goods
Facebook is currently the largest online community with over 350 million members
worldwide. Growth has been fast and after establishing a sizable number of users in the
USA it quickly became the largest online social networking community in Europe. The
community is free to use and financed through adverting, it is however also possible to
buy gifts for other users, costing a dollar each (Facebook 2009a). After smaller previous
investments in a series A and B funding by various investors Microsoft came in, in 2007
the software giant invested $240 million in Facebook getting a 1,6 percent share and the
right to sell ads on the site outside the USA. This investment valued Facebook to 15
billion dollars, around 500 times its estimated revenue for that year, which was estimated
to about 30 million (Cimilluca, D. 2007). After this valuation significantly lower
estimates have been the rule. In 2008 for example, employees reportedly sold shares that
implied a valuation of 3,75 billion. It is noteworthy that employees chose to sell shares
since stock sales in technology startups are unusual (Ante, S.E. 2007). In May 2009
Facebook received $200 million from Digital Sky Technologies for preferred stock
gaining 1,96 percent share in Facebook. Facebook has in total received $600 million in
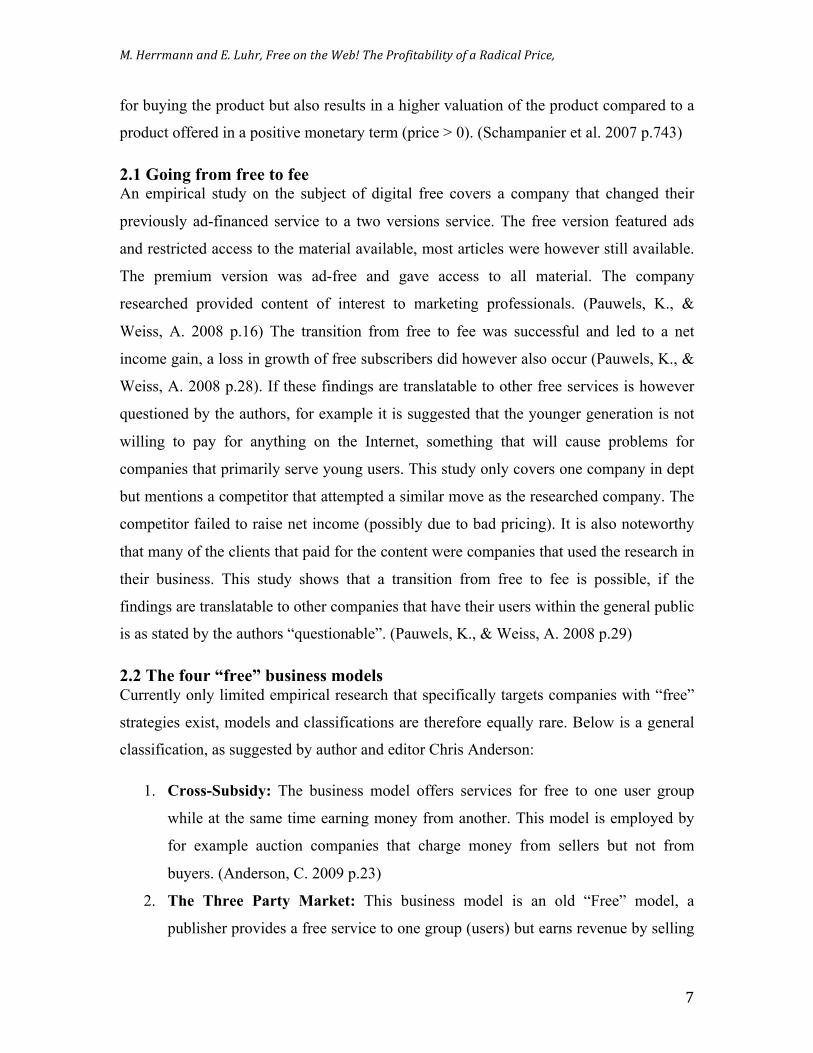
investments by various investors (Deagon, B. 2009). As can be seen from Graph 1, the
valuations have varied over the years.

!"#$%&&'())#()*#+"#,-.&/#0&%%#1)#2.%#3%45#6.%#7&1892(49:92;#18#(#<(*9=(:#7&9=%/#
! *(!
Graph 1. Chart of Facebook valuations (See Appendix 2 table 2)
Generating revenue from the massive number of users has however proven to be hard.
And if generating revenue is hard in the USA and Western Europe it is nothing compared
to were Facebook currently has it’s strongest growth, the developing world. Facebook is
growing strongly in countries like Turkey and Indonesia but it is plagued by the fact that
advertisers are not prepared to pay much for users in these areas, buying power is simply
too low. This has sparked speculation about “how fast the company is losing money” and
if it will be forced to solicit another round of investment. In March 2009 the company
stated that “we will be profitable next year”, this was followed by the CFO leaving the
company. (Stone, B. & Heft, M. 2009)
The latest statements from insiders about the company have however been positive. Marc
Andreesen, a Facebook board member and founder of Netscape, have stated that
Facebook revenue 2007 was $150 million, 2008 about $350 million and in 2009 is
expected to be $500 million. According to Andreesen Facebook could make one billion
in revenues 2009 but is prioritizing user growth instead of profit maximization. He
further pointed out that “Facebook will make billions in the next five years to come”
(Lawsky, D. 2009a). Justin Smith, editor of the website “Inside Facebook”, expected
revenue for 2009 between $500 million and $550 million in line with Andreesen
statement. The main source of income will come through advertising and about $70
million will be micropayments (see Appendix 1) for virtual goods according to Smith
!"#"$"%"&"'!"'#"'$"'%"
!"##"$%&'&
()*+,$$-&.)#/)0$%&

!"#$%&&'())#()*#+"#,-.&/#0&%%#1)#2.%#3%45#6.%#7&1892(49:92;#18#(#<(*9=(:#7&9=%/#
! *)!
(Deagon, B. 2009). Another interesting thing to notice was that Facebook’s CEO Mark
Zuckerberg announced on the company’s website that they had become cash flow
positive in the second quarter 2009, which means that Facebook is now earning enough
revenue to cover all of its daily expenses (Learmonth, M. 2009B).
We took the revenue estimate of $550 million that several sources posted as likely (see
Appendix 3) and calculated a possible net income for 2009. The result was based on a
profit margin of 31,12 percent retrieved from Japanese Social Community Mixi. The
Japanese social community also generates most of its revenues through advertising and
was therefore chosen. This gives an estimated net income of $171,16 million. Being
aware of the fact that our calculated net income may be a bit high considering that
Facebook has just turned cash flow positive. There are not a lot of publicly traded
companies with comparable business models so Mixi was one of few options available, it
was deemed better than an outright guess. With the most recent valuation of $6,5 billion
we calculated a P/E ratio of 38,0. A calculation of revenue per thousand page views
based on $550 million in revenue and 260 billion page views per month gives a number
of $0,176 (see Appendix 2 Table 2). This is a low number but it can be assumed that
Facebook is not able to sell ads on all of its sites. According to the calculations the
revenue per user is $1,57 .
4.2.2 LinkedIn
50 Million users • Founded in 2003 • Networking, Career building • Freemium and Ad-based
Former PayPal CEO Reid Hoffman founded LinkedIn in 2003; today it has over 50
million members reaching more than 170 industries in over 200 countries. The company
aims to enable its members to build a professional network of trusted contacts. The idea
of LinkedIn is that you as a member are able to use your professional network in order to
get access to the right people for work related purposes e.g. gain expertise on a subject or
find a way into a company of interest. This professional approach has attracted other

!"#$%&&'())#()*#+"#,-.&/#0&%%#1)#2.%#3%45#6.%#7&1892(49:92;#18#(#<(*9=(:#7&9=%/#
! "+!
users than social networks aimed at younger people, the average LinkedIn member is 41
years old and has an annual household income of $109 000. (LinkedIn 2009a)
Membership for a basic account on LinkedIn is free of charge. The company also offers
three forms of premium accounts to its members, all with subscription fees. The premium
account user is provided with more tools to search and reach members outside the
member’s own network. (LinkedIn 2008b) It is however estimated that less than one
percent are premium users (Economist 2009).
Between 2003 and 2008 LinkedIn has brought in funding in five separate rounds
amounting to a total of $103 million. The capital comes from venture capital firms and
the last infusion was made on the 22nd October 2008. (Baker, S. 2008) The biggest
investment was made by Bain Capital in June 2008 of $53 million valued LinkedIn to
$1.015 billion (Waters, R. 2008).
LinkedIn is widely seen as a success story among the social networks. This is attributed
to its success in generating revenue, something that has proved difficult for social
networks in general. The fact that the average user is high in income and influence allows
the site to charge more than most when it comes to selling ads. (Madway, G. 2008) In an
interview with current CEO Jeff Weiner in October 2009 he stated that staff is expected
to increase by 50 percent during 2009 and ad sales are up 50 percent year over year. It is
estimated that LinkedIn has revenue of around $100 Million per year. (Lawsky, D.
2009b) Similar numbers have been suggested by former LinkedIn CEO Dan Nye that
stated: “LinkedIn will earn revenue of $75-100 million in 2009” (Ricadela, A. 2008). We
made our own calculations of LinkedIn’s revenue based on numbers from competitor
Xing (that is publicly traded). According to these rough calculations LinkedIn will have
around $99,03 million in revenue in 2009, very close to what the CEO stated in the
interview mentioned above. A calculation of the P/E ratio using the valuation of $1.015
billion divided by the net income as calculated by us to $11,69 million gives a P/E ratio
of 86,86. The revenue per user and the revenue per thousand page views is 1,98
respectively 4,85.
!"#$%&&'())#()*#+"#,-.&/#0&%%#1)#2.%#3%45#6.%#7&1892(49:92;#18#(#<(*9=(:#7&9=%/#
! "*!
4.2.3 Myspace
125 Million users • Founded in 2004 • Social Networking, Music Sharing • Ad-based
MySpace is a social networking site primarily profiled towards music-interested users.
The site allows the users to create a personal profile, share photos and videos. It is being
marketed as the world’s largest music community (MySpace 2009). In October 2005
News Corp acquired the site for $580 million (Segal, J. 2009). After the acquisition
Rupert Murdoch, CEO and major shareholder of News Corp closed a three and a half
year search advertising deal worth $900 Million with Google. The deal guaranteed
MySpace $900 Million in revenue from Google for the given period as long as Fox
Interactive Media, MySpace’s parent company, meet certain traffic requirements
(Goldsmith, J. 2009). The advertisement deal expires in June 2010 after that Google and
MySpace will renegotiate the partnership deal (Teather, D. 2009).
In News Corp’s first-quarter 2009 interim report it was revealed that MySpace’s revenue
was decreasing since it had not met the minimum guarantees in its search deal with
Google. At the same time MySpace revealed that it was losing traffic (Goldsmith, J.
2009). Despite the problems MySpace is facing the site has brought in $1,6 billion in
revenue the last three years. Most of MySpace revenue is coming from its advertising
deal with Google. Google has however already announced that it will only renew the deal
at a far lower price than before (Segal, J. 2009). According to Pali Capital (a financial
service firm) the Google advertising deal might only be worth half as much or according
to other estimates 75 percent less, when renegotiated (MacMillan, R. 2009). If the
partnership would be ended June 2010 MySpace might face annual losses of a $100
million (Segal, J. 2009). Thereby leaving the company unprofitable.
In July 2009, as a response to the declining profits, MySpace announced that it would cut
300 jobs in their international division that consisted of 450 employees. A week earlier
MySpace had announced that it would cut 30 percent of their U.S. staff resulting in 420
jobs cut in the company’s most lucrative market (Lefkow, C. 2009). The problems faced

!"#$%&&'())#()*#+"#,-.&/#0&%%#1)#2.%#3%45#6.%#7&1892(49:92;#18#(#<(*9=(:#7&9=%/#
! ""!
by MySpace was formulated by Debra Aho Williamson, an analyst with researcher
eMarketer, who stated "MySpace ended up not being the leader that it wanted to be in the
social-networking realm, on the tech front, on the ad front -- and now on the usage front,"
This statement was prompted by the fact that Facebook had surpassed MySpace in the
USA in June 2009 according to ComScore. If it is at all possible to stem the decline and
regain market leadership is yet to be seen. History does not provide much hope, the social
network scene has seen several communities rise to become market leaders and then be
completely overtaken by “the next big thing” (Chmielweski, D.C. & Sarno, D. 2009).
In our calculation of Myspace revenue we have assumed that Myspace get a guaranteed
$300 million from it’s partnership deal with Google in 2009. The rest of the company’s
sources of income come from other advertising on the site. We estimated the advertising
revenues to be $195 million due to estimates made by research company eMarketer that
MySpace will earn $495million in 2009 (Chmielweski, D. & Sarno, D. 2009). We used
the same profit margin of Mixi (31,12%) as we did with Facebook to estimate MySpace’s
net income to $154,04 million for 2009. We calculated the revenue per thousand page
views to $1,53. The revenue per user for Myspace is $3,96. For the estimate of
Myspace’s value we performed calculations using Facebook’s value per user, resulting in
a valuation of $2321,43 million. The calculation of a new valuation for MySpace was
necessary, since the last valuation ($580 million) from when News Corp acquired
MySpace in 2005 was no longer plausible. The new valuation makes a comparison with
the other companies in our sample more accurate. The assumption to use Facebook value
per user multiplied with MySpace user number in order to estimate MySpace valuation
follows the assumption that Facebook is a social community that matches the services
provided by MySpace. From this Myspace P/E ratio is calculated to 15,07 (see Appendix
2 table 5).

!"#$%&&'())#()*#+"#,-.&/#0&%%#1)#2.%#3%45#6.%#7&1892(49:92;#18#(#<(*9=(:#7&9=%/#
! "#!
4.2.4 Twitter
55 Million users • Founded in 2006 • Social Networking and Micro-blogging •
Selling search access, some Ad-based
Twitter is a fast growing community based on short text messages so-called “tweets”. A
user writes his or her tweets and follows other users tweets, celebrities and friends alike.
The service has 55 million users and for long it was not clear how it would earn revenue
(Lashinsky, A. 2009). The company has been reluctant to include regular advertising
banners on the site and it is not certain that this would do the job anyway, this since the
Twitter streams are often accessed through a third party application that does not require
users to enter the site (Fine, J 2009). The first signs that revenue has to grow to cover
costs were seen when in April 2008 Twitter was launched in Japanese. The site carried an
advertising banner, something that does not exist on any other Twitter site (we confirmed
this finding on December 4, 2009 when the Japanese version carried a banner and the
English one did not). Furthermore in August 2008, the maximum number of connections
users in the United States could have was reduced to 2000. This was followed by a
removal of the option to send outbound messages to cell phones in all countries except
USA, Canada and India (Beaubien, G 2008).
In September 2009 Twitter confirmed that the company had raised $100 million in
additional funding, the new funding valued Twitter to $1 billion (Stone, B 2009b). The
company is still described as pre-revenue and according to the founders it does not plan
to introduce large-scale advertising until 2010 (Stone, B 2009a).
Well into the year 2009 it appeared as if Twitter could not possibly be profitable. That
advertising banners are only displayed on the Japanese version limits the possible
revenue from this source. The cutbacks mentioned above also signals that current revenue
was not covering the cost associated with these services. We estimated the revenue from
the Japanese Twitter site to $61248 annually, hardly enough to run the company (see
Appendix 2 Table 8.). This did however change as news of search deals with both

!"#$%&&'())#()*#+"#,-.&/#0&%%#1)#2.%#3%45#6.%#7&1892(49:92;#18#(#<(*9=(:#7&9=%/#
! "$!
Microsoft and Google was announced (see Appendix 2 Table 8.). The deals reportedly
gives the company $25 million in revenue for 2009 and according to sources familiar
with the matter a small profit for the year (Ante, S.E. 2009). A calculation of the P/E ratio
results in a number of 390. Twitter’s revenue per user is $0,46. A result for revenue per
thousand page views was not performed due to the fact that Twitter can be accessed
through third party applications, this would make the result misleading.
Something worth noticing is that Twitter just like Facebook currently has its strongest
growth outside the United States and the number of users in the rest of the world
outnumbers those in the USA 2 to 1 (Stone, B 2009a).
4.2.5 Xing AG
8,31 million users • Founded 2003 • Professional social networking •
Freemium and Ad-based
Xing AG is just as LinkedIn a professional social networking site; the difference being
that Xing is the market leader in the German-speaking countries. The company enables
professionals to create their own profiles and build their own networks that they can use
for several work related purposes. Xing AG offers its members a free basic account or a
paid premium account with more advanced services. About eight percent of all members
are premium members (662 000) that pay a monthly subscription fee between 4,95! and
6,95! (30th September 2009). In December 2006 Xing successfully launched an IPO and
is now publicly traded (Xing 2009a).
The four sources of revenue are premium subscriptions, “Jobs”, “Best Offers” and
advertising. Subscription fees are Xing primary source of revenue, in the first three
quarters of 2009 Xing generated !27,82 million from 662 000 premium members (30th
September 2009). The second source of income “Jobs” is revenue retrieved from Xing’s
job portal that it offers to members. The third stream of revenue is “Best Offers” where
companies pay to market their product and services on the Xing.com website. “Best
Offers” and “Jobs” are summed up and renamed e-commerce in our calculation (as in the
Xing interim reports for 2009) and generated !4,876 million in Q4 2008 and Q1-Q3

!"#$%&&'())#()*#+"#,-.&/#0&%%#1)#2.%#3%45#6.%#7&1892(49:92;#18#(#<(*9=(:#7&9=%/#
! "%!
2009, the fourth source of revenue, advertising generated !1,802 million in revenue in Q4
2008 and Q1-Q3 2009 (see Appendix 2 table 9).
We had to make separate calculations for Q4 2008, since Xing does not account for that
period separately in the annual report for 2008. The fourth quarter results are therefore
calculated by subtracting the values from the annual report 2008 results with values from
Q1-Q3 2008. This gave TTM total revenue of !43,391 million. The net income for the
period was !5,118 million resulting in a profit margin for the period of 11,8 percent.
Xing’s market cap of !159,61 million was retrieved on the 15th of December 2009 from
Google Finance (Google 2009e). Xing’s P/E ratio therefore becomes 31,2 (see Appendix
2 table 9). Xing’s revenue per user and revenue per thousand page views is 7,87
respectively 13,39.
4.3 Content based
4.3.1 Spotify
Founded in 2006 • Music Streaming • Freemium and Ad based
Spotify is a downloadable program that streams music, currently around six million songs
are available to users. The streaming service is free as long as a user can stand ads
approximately every 15 minutes. There is however also a premium version that cost £10
a month (UK). Premium users don’t have to listen to ads and get to download up to 3333
tracks to their computer and use them in offline mode as well as transfer them to an
iPhone or a mobile phone running the Google OS Android. (Arthur, C. 2009a)
There has been a lot of debate about the sustainability of Spotify’s business model. Today
the absolute majority of its users do not pay for the premium version; instead they stay
with the ad-supported free version. According to research firms familiar with the business
Spotify would require somewhere around 5-10 percent of its customers to migrate to the
premium version in order to be profitable. (Sonne, P. 2009)
We have performed a calculation on the profitability of Spotify on the UK market. The
basis for this calculation is the costs of a competitor in the UK market, the competitor

!"#$%&&'())#()*#+"#,-.&/#0&%%#1)#2.%#3%45#6.%#7&1892(49:92;#18#(#<(*9=(:#7&9=%/#
! "&!
called We7 offers a paid version similar to that of Spotify (Arthur, C. 2009b). The choice
of We7 to calculate Spotify’s net income and valuation follows the assumption that the
company is providing similar services on the UK market.The difference between Spotify
and We7 is that while We7 offers a limited amount of songs to be played for free on their
website and the rest has to be bought, Spotify offers ,in their basic free version, almost all
songs in their database for free. According to our calculations Spotify should make a loss
of around £16 million each month in the UK alone (See Appendix 2). This is of course
not sustainable no matter how strong it’s funding is. The major share of Spotify’s cost is
the high rates it has to pay to record labels in order to stream music to non-paying users.
The premium version is according to our calculations a high margin business but the
money made from it is simply not enough to cover the costs incurred by streaming music
for free through the ad-based version.
This is however not the whole story since some of the major record labels as well as
several of the minor ones on the European market hold equity stakes in Spotify.
Understandably it would encourage these labels to share their music at a discount. By
doing so the labels are not only hoping to earn revenue from Spotify when more users
migrate to the premium service but also decrease the illegal spreading of their
copyrighted material. Such reasoning follows from that if more users choose Spotify they
are less prone to download and share illegal mp3 songs. They simply don’t need to
anymore since they can access the music for free with the free version of Spotify (Arthur,
C. 2009b). Financial Times published a valuation of Spotify from a funding round in
August 2009. The round gave it a value of $250 million (Menn, J. & Bradshaw, T. 2009).
We choose not to calculate a P/E ratio for Spotify due to the misleading result occurring
at a net loss. The same holds true for the revenue per user and revenue per thousand page
views.
!"#$%&&'())#()*#+"#,-.&/#0&%%#1)#2.%#3%45#6.%#7&1892(49:92;#18#(#<(*9=(:#7&9=%/#
! "'!
4.3.2 Youtube
30 billion Page views November 2009 • Founded in 2005 • Video streaming and sharing • Ad-based
Youtube is the biggest website for sharing video content online. Users all around the
world upload and stream video content. Both the amount of content and number of users
has grown at a very rapid pace. The content is a mix of privately generated content and
copyright protected material that users upload with or without permission of the rights
owners. In October 2006 Google acquired Youtube for $1,65 billion. The site had not yet
produced any profit (Weinman, J. J. 2006). According to Google CEO Eric Schmidt
Youtube was only worth $600 to $700 million at the point of acquisition but he believed
it to be a strategic acquisition to get access to Youtube users quickly (Olszewski, P.
2009).
Youtube is known to have experienced problems with selling advertising space, this since
it is hard for the site to show advertisers in what context their ads will be displayed. If the
site had more professional copy protected material it would be easier. A severe hit to
Youtube’s chances for earning revenue from this did however come about when two
major corporations that provide content set up a joint site. The site is called Hulu and
features content from companies NBC Universal and News Corp (Disney joined later
(Frommer, D. 2009b)). The site is currently only available in the USA but talks with
British content suppliers have been initiated (Kiss, J. 2009). According to Arash Amel, an
analyst at research firm Screen Digest estimated Youtube revenue 2008 was $114 million
with no gross profit compared to Hulu’s $65 million revenue and $12 million in gross
profit for 2008, and this for a company that has a user base less than 1/10th of Youtube’s.
The difference between the companies is that while Youtube can only put advertisement
on 3-4-percent of it’s content Hulu can put advertising on all its content (Lyons, D.
2009). The state is further worsened by the demography of the Youtube users. The site
currently has its strongest growth in the developing world were ad revenue is especially
hard to generate but the cost of streaming video is no less than in the developed world
(Stone, B. & Heft, M. 2009).

!"#$%&&'())#()*#+"#,-.&/#0&%%#1)#2.%#3%45#6.%#7&1892(49:92;#18#(#<(*9=(:#7&9=%/#
! "(!
In 2009 profits still appears to be far away, Credite Suisse estimates that Youtube will
pay $300 million for broadband in 2009. This together with an estimated $240 million in
revenue implies that the site still want be profitable, just the cost of broadband appears to
be hard to cover with the current revenue (Spangler, T. 2009). The research firm
RampRate performed another calculation of Youtube’s result in 2009. According to them
Credite Suisse had overestimated Youtube’s broadband cost significantly. Apart from the
difference in estimation of broadband costs the two calculations did not differ very much
(Greenberg, T. et. Al. 2009). This led us to using averages of these two calculations for
all variables except cost of broadband were we made our own calculations (See Appendix
2 Table 11). Our calculations are based on low and high estimates of Youtube’s
bandwidth cost per terabyte made by RampRate. These numbers were inserted into a
formula designed to measure how many terabytes Youtube uploads per month. Our
results do predict that Youtube is making losses but they do not appear to be of the same
magnitude as suggested by Credite Suisse. We estimate losses ranging from $159 to $276
million per year. Calculation of a P/E ratio results in a negative number due to the loss.
4.4 Other !
4.4.1 Skype
521 million registered users • Founded in 2002 •
IP telecommunication technology, chatting • Freemium and Ad-based
Skype is a software application that enables people to make free video and free voice
calls, send instant messages and transfer files between users. Broadband is required in
order to access the service (Skype 2009a). While calls over the Internet as well as calls to
some free-of-charge numbers in certain countries are free of charge, Skype charges a fee
for calls to other landlines and calls and text messages to mobile phones (Skype 2009b).
In September 2005 eBay acquired Skype for $2,6 billion paid in cash and eBay stock.
Sellers were along with venture capitalists the founders Niklas Zennström and Janus Friis
(eBay 2005). This acquisition was however not lasting. On November 19th 2009 eBay
completed the sale of 70 percent of Skype to an investor group led by venture capitalist
!"#$%&&'())#()*#+"#,-.&/#0&%%#1)#2.%#3%45#6.%#7&1892(49:92;#18#(#<(*9=(:#7&9=%/#
! ")!
fund Silver Lake. The reason for selling Skype was that eBay had failed to connect it to
its other operations in a useful way. The deal valued Skype to $2,75 billion with eBay
keeping 30 percent of the shares (eBay 2009).
Calculations on Skype’s profit were based on eBay’s annual report for 2008. There
revenue is presented separately for Skype so it required no calculation. This does
however not apply to the costs; they had to be separated from eBay’s total costs. This was
achieved by estimating that Skype would be as large a part of costs as it is of revenues
(Skype makes up 7,8 percent of eBay’s total revenue). This gave a net income for the
year (TTM Q4 2008 – Q3 2009) of $108,9 million. A calculation of the P/E ratio was
made using the valuation of the service made in 2009 when 70 percent was sold to the
investors mentioned above. This results in a P/E ratio of 25,3. The revenue per user is
$1,25. (see Appendix 2 Table 6)
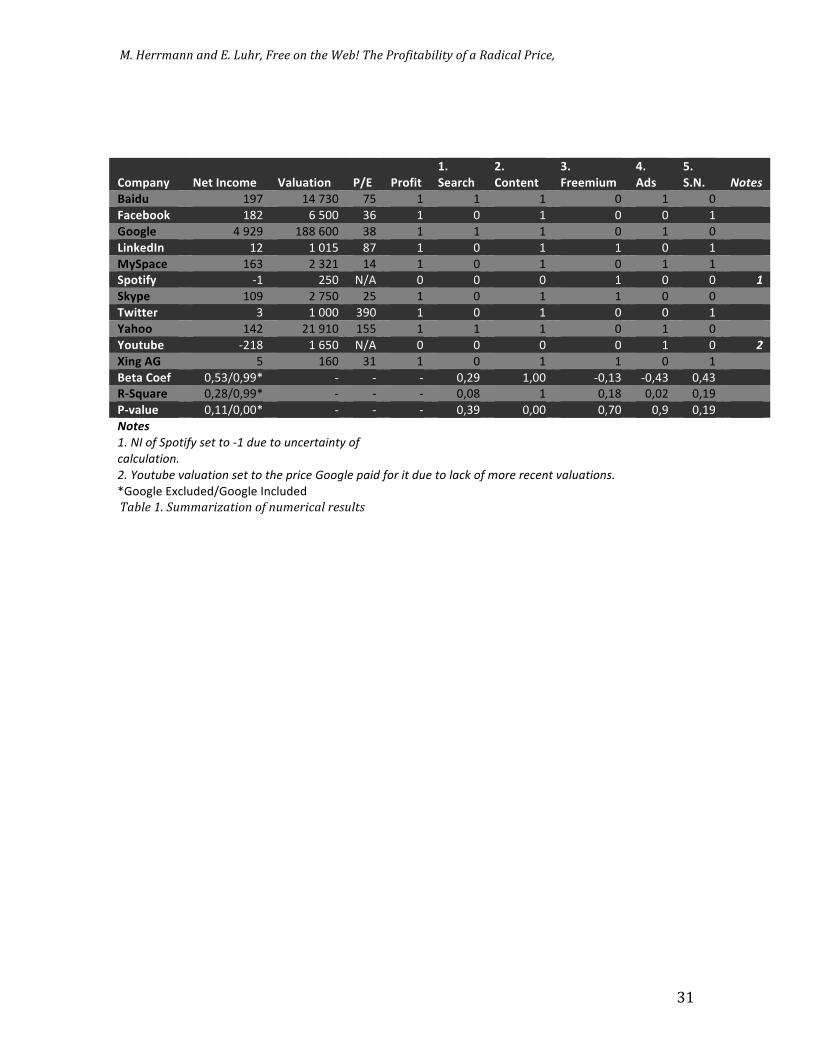
4.5 Regression model results Regression was employed in order to find any significant relationships between the
variables in our data set. Regression was tried with P/E ratios as Dependents with each of
the following as dummy-independents: 1. Being a search engine 2. being content based 3.
using Freemium 4. using only Advertising (all companies sell some form of advertising)
or 5. being a social network. None of these independents were significant on the five
percent level. Skype that is categorized under “other” was not researched separately since
the group only contained one company and comparison would be misleading. The same
independents were used with a dummy of “being profitable” as dependent. This produced
a perfect negative correlation with “being content based” since neither of the two content-
based companies indicated profitability. Results are summarized in Table 1, the values
displayed in the last three numeric rows are the outputs from the second regression with
“being profitable” as dependent, the outputs are placed below each respective
independent.
In order to find out how the valuation is related to net income a simple regression was
performed on these series. At first a strong relationship appeared (a positive relationship
significant on the 0.00 percent level). This did however change when Google (a strong
outlier in both valuation and net income) was removed. A new regression was performed;

!"#$%&&'())#()*#+"#,-.&/#0&%%#1)#2.%#3%45#6.%#7&1892(49:92;#18#(#<(*9=(:#7&9=%/#
! #+!
this time the relationship was not significant. The output is shown at the bottom of the
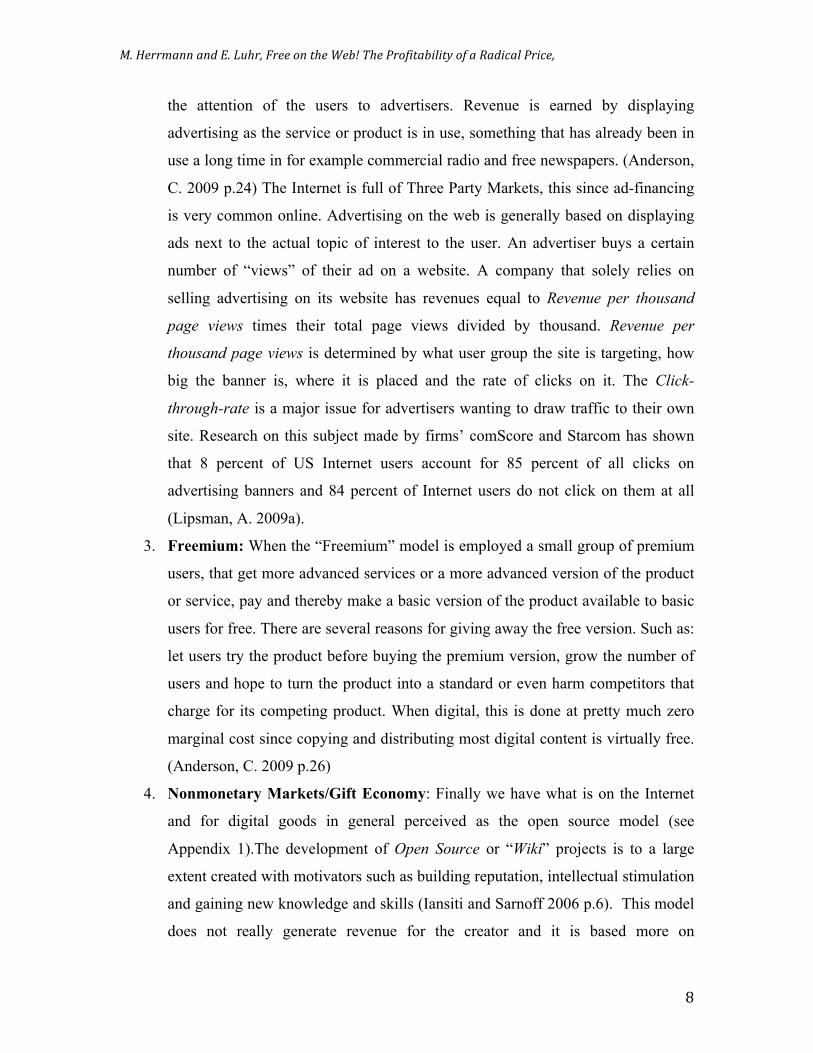
column labelled “Net Income”. Graph 2 shows a scatter plot of net income vs. value
(Google excluded). As can be seen from the graph there is no clear relationship between
value and net income. Such a relationship could be expected if valuations were based on
the current profitability of the companies in the sample.
!
>&(?.#@"#A(:-(291)#18#2.%#=1'?()9%B#?:122%*#(C(9)B2#2.%9&#&%B?%=29D%#E%2#F)=1'%#GA(:-%#9)#'9::91)#H/#E%2#
F)=1'%#9)#'9::91)#HI#
()*+,"-)./0112"
3*456"7*42/+846""
9:1;<=6">?*@/A"
B=C:)./"
92=:/"
D)E11"
D1,F,0/"
G#H!6!"
G#!!6!"
G'H!6!"
G'!!6!"
GH!6!"
6!"
H!6!"
'!!6!"
'H!6!"
#!!6!"
#H!6!"
6!" H!!!6!" '!!!!6!" 'H!!!6!" #!!!!6!" #H!!!6!"
1+2&3%*$4+&
.)#/+&
.)#/+&567&1+2&3%*$4+&
!"#$%&&'())#()*#+"#,-.&/#0&%%#1)#2.%#3%45#6.%#7&1892(49:92;#18#(#<(*9=(:#7&9=%/#
! #*!
#
#
#
8$49)%:& 1+2&3%*$4+& .)#/)2"$%& ;<=& ;>$?"2&
@7&
A+)>*B&
C7&
8$%2+%2&
D7&
(>++4"/4&
E7&
FG6&
H7&
A717& !"#$%&
!)"G/& 'IJ" '$"JK!" JH" '" '" '" !" '" !" !!
()*+,$$-& '&#" %"H!!" K%" '" !" '" !" !" '" &&
I$$J#+& $"I#I" '&&"%!!" K&" '" '" '" !" '" !" !!
K"%-+G3%& '#" '"!'H" &J" '" !" '" '" !" '" &&
L:A9)*+& '%K" #"K#'" '$" '" !" '" !" '" '" !!
A9$2"?:& G'" #H!" LMN" !" !" !" '" !" !" '&
A-:9+& '!I" #"JH!" #H" '" !" '" '" !" !" !!
MN"22+>& K" '"!!!" KI!" '" !" '" !" !" '" &&
O)B$$& '$#" #'"I'!" 'HH" '" '" '" !" '" !" !!
O$/2/,+& G#'&" '"%H!" LMN" !" !" !" !" '" !" (&
P"%J&FI& H" '%!" K'" '" !" '" '" !" '" !!
!+2)&8$+?& !6HKM!6IIO" G" G" G" !6#I" '6!!" G!6'K" G!6$K" !6$K" &&
QRAS/)>+& !6#&M!6IIO" G" G" G" !6!&" '" !6'&" !6!#" !6'I" !!
;R5)#/+& !6''M!6!!O" G" G" G" !6KI" !6!!" !6J!" !6I" !6'I" &&
!"#$%& "" "" "" "" "" "" "" "" "" ""
"#!$%!&'!()&*+',!-.*!*&!/"!01.!*&!123.4*5+2*,!&'!
3563165*+&2#! !! !! "" "" "" ""
7#!8&1*19.!:5615*+&2!-.*!*&!*;.!)4+3.!<&&=6.!)5+0!'&4!+*!01.!*&!653>!&'!?&4.!4.3.2*!:5615*+&2-#! "" ""
OP115Q/"RS.Q,+/+MP115Q/"84.Q,+/+" "" "" "" "" "" "" "" ""
6(4:%#J"#K-''(&9L(291)#18#)-'%&9=(:#&%B-:2B##
!"#$%&&'())#()*#+"#,-.&/#0&%%#1)#2.%#3%45#6.%#7&1892(49:92;#18#(#<(*9=(:#7&9=%/#
! #"!
!
!
5. Analysis and Discussion
Search Engines
The search engines in our sample have the highest market caps of all companies we have
researched. The business model of the search engines works great with advertising, they
know what people are looking for and can charge companies for a spot high up in the
search results. Search engines are simply perfect for the Three Party Market model, users
are looking for something, and advertisers pay in order to be what they find. Compared to
the other groups in the sample that has a harder time when integrating ads with their
services the search engines appear to have found just the right model for revenues. The
selling of search listings reminds of a Cross-Subsidy, companies pay for high listings and
users search for free.
By offering services like mail, maps and finance tools they are able to gather a great deal
of information about users and can therefore match ads to them better. These extended
services also help in driving traffic to the key revenue source, the search engine itself. All
three companies have clear business models and they are publicly traded so there is little
secrecy about how revenue is generated. Since they are not primarily providers of content
the costs related to this are limited. All three search engines predate the dot-com bubble
and when comparing them to others in our sample it could be argued that they belong to a
different generation of dot-com companies. They are all significantly higher valued than
the other companies in the sample. Their P/E ratios do however not show any
relationship, with Google’s P/E ratio being almost half of that of Baidu’s and a quarter of
Yahoo’s. It is very well possible that Google is undervalued compared to its competitors,
the company is market leader in most of the world and known to be highly innovative.
Due to network effects and the economies of scale that arise as these companies grow the
market for web search is expected to continue to be dominated by a few major players, or
only one. It appears as if though Google is moving towards complete domination in the
field of Internet search. Google’s profits and market cap completely dwarfs the two

!"#$%&&'())#()*#+"#,-.&/#0&%%#1)#2.%#3%45#6.%#7&1892(49:92;#18#(#<(*9=(:#7&9=%/#
! ##!
competitors included in the sample. Baidu dominates the large Chinese market but in the
rest of the world Google seem unbeatable.
Social Networks
Having primarily user-generated content like the social communities Facebook, MySpace
and Twitter do is a great way to get content for free from users, and it is content that is
highly relevant to friends of the user. The friends will start using the social community
and draw more friends that will further increase the value of joining the social community
in question as explained by the network effects earlier. There can be no doubt about that
users value their social communities a lot. They spend a lot of time using them accounted
for in number of page views these sites get by users and there is content relevant to them
there. So far it sounds good but what about generating revenue?
Social Networks are not optimal for advertising; people use it to connect with their
friends, not because they want to buy something (then they use Google to search for it). A
“world of atoms” example will explain the difference between search engines and social
networks as advertising tools. The search engine could be compared to a map that you
use to find stores when you are out shopping, where the stores that have paid the most are
the easiest to find. The social networks could be compared to drinking coffee with
friends, chatting and looking at holiday pictures. Unfortunately the photo album is full of
ads for stuff that is not interesting for the user at the moment as the reason for looking in
the album was not to buy anything. And as if that was not enough someone is running
around the table flashing a banner that advertises stuff for sale. This example explains
why social networks do not generate the large revenues from advertising like search
engines do.
The fact that so few users click on advertising banners is a further worry for these
companies that boost so many users and page views. For market leader Facebook the
revenue per user generated is currently $1,57, rather disturbing since Facebook.com is the
second most visited website in the world. The website has page views amounting to 260
billion per month and 350 million users. The company may be profitable but revenues
appear low for a website with this amount of traffic. MySpace success in generating ad

!"#$%&&'())#()*#+"#,-.&/#0&%%#1)#2.%#3%45#6.%#7&1892(49:92;#18#(#<(*9=(:#7&9=%/#
! #$!
revenue was most likely an anomaly, Google was not aware of the relative inefficiency in
generating ad revenue from social networks when it signed the ad deal. There is however
a lot of potential in Virtual Goods, Facebook currently only offer tiny gifts but the
possibilities are much bigger, creating some kind of non-free premium account from
which it would be possible to upload high quality images or get more options for
customization would be one way to go.
Neither of the two companies are deemed as overvalued but the following should be
taken into consideration: History shows that long time domination of a particular social
network is unlikely. Users have generally not invested anything more than their time in
the network and are therefore not reluctant to join “the new thing” as there are no mental
transaction costs to open an account on a competitor’s site. Facebook is adaptable but if
migration to a competitor takes off, the network could end up as MySpace. It is however
not the switching that is the largest worry when it comes to users, if Facebook or
MySpace begin charging for some services in a Freemium way or grow their supply of
virtual goods a competitor that offers those services for free could arise. And just as
research shows the free option will be the first choice. The current leaders need to keep
their free versions uncompromised by premium ones, but if successfully implemented the
addition of revenue sources could reduce the need for annoying ads on the sites. It is
however important that a premium version offers something very different from the basic
version, social networks are traditionally free and users of the free version expect high
quality too.
When it comes to Twitter it appears as if they have at last found some kind of business
model, even though we do not exclude the possibility that it came about by coincidence.
The problem as we see it is the complete dependency upon Google and Microsoft, today
they have a deal that at least appear to cover Twitter’s costs but this could change rapidly.
Both Google and Microsoft have a history of overpaying, Microsoft for Facebook and
Google for Youtube and the MySpace deal. Its P/E ratio is not a very useful indicator
since the company is so young, if it could make more out of its user base remains to be
seen. Twitter is like the other companies in this group involved in different funding
!"#$%&&'())#()*#+"#,-.&/#0&%%#1)#2.%#3%45#6.%#7&1892(49:92;#18#(#<(*9=(:#7&9=%/#
! #%!
rounds. Such need for additional capital hardly signal well thought through business
models.
Compared to the three mentioned above niche networks like Xing and LinkedIn have
stronger business models and several revenue sources, only 25-30 percent of revenue
come from advertising and they are therefore not depending as heavily as other social
networks on generating ad revenue. The premium audience also helps when selling ads as
more information can be retrieved and ads can be targeted and made more relevant to the
user. The important challenge for professional networking sites is to keep the free version
relevant and useful and at the same time convince the users of the advantages of a
premium membership in order to boost revenue. Xing has been more successful in
turning free to fee members with around eight percent of their users paying for the
premium version compared to LinkedIn were only one percent are premium users. Xing
has a very high revenue per user of $7,87 something that could probably be explained by
its audience being not only a premium one but also the strict focus on the German
speaking countries, all which have high buying power.
As can be seen for professional networking sites, the users are on average older and more
influential. Such users generally earn more money and have less time to invest in
avoiding payment. A paid version of content at a premium quality saves time and effort.
The opposite is true for younger users that have a lot of time but little money as can be
applied to Facebook, MySpace and Twitter that have on average younger users. Both
LinkedIn and Xing make excellent use of Freemium. The cost to ad more users is
virtually zero, neither site host images or videos of the users so the content requires very
little bandwidth and storage. And the free users are for LinkedIn what the premium users
pay for, they pay for searches and profile views of free users that they could be interested
in for work related purposes.
Content based
The companies in this segment are those that should be the primary beneficiaries of
Moores law and the similar relationship found for bandwidth and storage. The services
they offer were just a few years ago impossible due to high costs of bandwidth and

!"#$%&&'())#()*#+"#,-.&/#0&%%#1)#2.%#3%45#6.%#7&1892(49:92;#18#(#<(*9=(:#7&9=%/#
! #&!
storage, if the broadband was at all fast enough to stream music or video. As the law
predicts speed has increased greatly and costs have plunged. Speed is now sufficient to
use these services but bandwidth costs have however not fallen enough. Neither Youtube
nor Spotify are according to our estimates earning a profit. Both of them easily attract
users since they are free of charge but both are struggling to cover their costs. For
Spotify it is the license costs to record labels. They are anticipated to be high but not as
high as for their competitors. For Youtube it is the cost of streaming video content that
eats its insufficient advertising revenue. Youtube has a hard time matching ads with their
user generated content, not even Google is successful in selling ads to the main part of
Youtube’s material. The problems are similar to those faced by social networks, users
don’t go to the site for shopping.
Spotify is pursuing a Freemium strategy, which is great as long as the cost for providing
the free version is close to zero. Whether or not Spotify is allowed to stream music to
non-paying users for pretty much nothing is up to the record labels and can only be
speculated about. Marginal cost of supplying the free version to users should be zero for a
successful Freemium company, but as our calculations clearly show it is not. This makes
Spotify a bit of a “bad” Freemium business.
The only significant result of the regression model was that this group of companies was
unprofitable. Strong earnings are however unlikely for a site like Youtube, this since the
only source of revenue is advertising and to find other sources than advertising is key to
survive on the Internet. For Spotify it is about increasing the number of premium
subscribers. The problem for Spotify is that its users might be young and unwilling to
move from free to fee. This could change as the current users grow older and get richer.
The business of supplying content is however one for the future due to the decrease in
costs for bandwidth and storage. The fact that Spotify is the only provider at the moment
that offers its basic version service for free will attract more users due to network effects
in the years to come. At the same time it will harm competitors that offer similar services
but for which users have to pay for. This as users will value free product more than a
service that they will be charged for in line with Hosanger and Szabo findings.

!"#$%&&'())#()*#+"#,-.&/#0&%%#1)#2.%#3%45#6.%#7&1892(49:92;#18#(#<(*9=(:#7&9=%/#
! #'!
Other
Skype has proven that it is possible to attract many users and at the same time exploit the
possibility to get paid along with it. Although relative to how many users Skype has at
the moment (521 million) our calculated net income of $108,9 million is relatively small.
The revenue per user is 1,25, even less than for Facebook. Skype is a good example of
how hard it is to make large profits when offering free services to the majority of users.
But one should nevertheless not underestimate the force of all the free users when
attracting new paying users. With registered accounts amounting to one twelfth of the
world’s population it should however be possible to earn more revenue than today. The
P/E ratio speaks for a valuation that is not overheated compared to its net income
calculated earlier. As the world’s biggest provider of IP-phone services network effects
can probably explain a great deal of its rise to domination. The business model to charge
only for calls to landlines and for sms and calls to mobile phones is however a model that
will not be sustainable in the future. Other sources of revenue such as ad banners are
useless as the user is not interested in watching advertising while making a call and will
feel disturbed and might abandon the service. The fact that net income is low could
partially be explained by Hosanger and Szabo findings that users value a free product or
service higher than a service they need to pay for and will therefore try to avoid using the
option to make paid calls. The usage of the free service is much more appealing as there
are no mental transaction costs attached to it.
Overvaluation
Several of the researched companies have high P/E ratios, indicating that they have high
valuations compared to their profits. We assume that this is due to high expectations on
behalf of the investors; many of the companies are after all close to being start-ups. One
thing though is for sure: With current sources of revenue for the non-publicly traded
companies in our sample we believe that there is good reason to be careful. History
speaks against long-term domination of providers of free services and dot-com
companies without a history of sufficient revenues should be investigated carefully
before buying or investing in. Attracting capital has nevertheless gone smooth for these
companies, having a lot of users seems to be enough to fill the various funding rounds.

!"#$%&&'())#()*#+"#,-.&/#0&%%#1)#2.%#3%45#6.%#7&1892(49:92;#18#(#<(*9=(:#7&9=%/#
! #(!
6. Conclusion !
On the question of how is it possible that all these things are available for free there is a
simple answer. The dot-com companies that supply things for free employ “free”
business models. They have found ways of making money without the need to charge the
user directly for their services. Technological progress and the fact that digital free has a
close to zero marginal cost, has led to this development. The companies that supply these
services for free vary in profitability, it appears as if the search engines and the social
networks in our sample have all been successful in finding revenues at least large enough
to make some profit during the period we researched. The variability in profitability is
large, as are the differences in profits and market cap of the companies in our sample. No
strong tendencies for overvaluation were prevalent for companies in either of these two
groups, with some exceptions among individual companies that had high P/E ratios. It
appears as if they are more soundly valued than their predecessors during the dot-com
bubble and have as opposed to them, profits. Neither of the content-based companies in
the sample was according to estimations profitable. Their marginal costs are deemed as
too high, this may change as technology improves further.
The regression model produced no significant results as to whether companies that
employ Freemium or just advertising (Three Party Market) indicated to be more
profitable than the other. When regression on the different groups was performed a
significant result was found for content-based companies, they did as opposed to all other
companies in the sample, lack profits. Comparison of companies within the sample
groups gave mixed findings but network effects appear to create dominant players in the
companies respective markets. Employing more than one source of revenue appears to be
a good way to raise revenue per user for the companies in the social network group.
!
!"#$%&&'())#()*#+"#,-.&/#0&%%#1)#2.%#3%45#6.%#7&1892(49:92;#18#(#<(*9=(:#7&9=%/#
! #)!
7. Future research !
One of the things this study showed is that it is hard to come by information on providers
of digital free services, especially for privately held companies. Not much to nothing is
publicly known about the profitability of many of the companies. If we want to learn
from history and avoid a new dot-com bubble on the Internet for “digital free” companies
further research is needed. A suggestion for further research is to create a larger sample
then conduct a similar study in order to generate more universal findings. The credibility
of the results would gain from a larger sample and more coherent estimation techniques.
A larger sample makes more advanced statistical methods available and the strength of
their results increases. It also reduces the effect of outliers and reduces variance.
A historical approach taking into consideration former outrivaled IT companies like
Friendster, Geocities, Alta Vista, Lycos etc. and what made them irrelevant would be
interesting in order to study why some “free” companies fail to retain users. Such a study
could be very useful in determining the factors that lead to long time success of “free”
companies and provide valuable results, that could be useful for dot-com “free”
companies today.
!"#$%&&'())#()*#+"#,-.&/#0&%%#1)#2.%#3%45#6.%#7&1892(49:92;#18#(#<(*9=(:#7&9=%/#
! $+!
List of references
Academic Papers
Iansiti, M. & Sarnoff, D. 2006, The Business of Free Software: Enterprise Incentitives, Investment and Motivation in the Open Source Community, Harvard Business School Working Paper, Series, No. 07-028, 2006, Available from: http://www.hbs.edu/research/pdf/07-028.pdf [Accessed: 05.11.2009].
Shampanier, K., Mazar, N., & Ariely, D. 2007, Zero as a Special Price: The True Value of Free Products, Marketing Science, 26(6), 742-757.
Pauwels, K., & Weiss, A. 2008, Moving from Free to Fee: How Online Firms Market to Change Their Business Model Successfully. Journal of Marketing, 72(3), 14-31.
Books Anderson, Chris (2009). Free: The Future of a Radical Price. London: Random House Business.
Jewell,Elizabeth, Abate, Frank R & McKean, Erin (red.) (2005). The new Oxford
American dictionary. 2nd editon, New York: Oxford University Press
Newspaper articles Ante, S.E. 2007, Has Facebook’s Value taken a Hit? [online], BusinessWeek; 8/18/2008, Issue 4096, p. 30-33, 2p,Available from: http://search.ebscohost.com/login.aspx?direct=true&db=buh&AN=33551481&site=ehost-live [Accessed: 16.11.2009].
Arthur, C. 2009a, "Spotify starts rent-a-song service", The Guardian, 3 October 2009, .
Arthur, C. 2009b, "We7 chief helps calculate those elusive Spotify numbers", Guardian Unlimited, 8 October 2009, .
Beaubien, G 2008, Twitter’s mini-blogging service searches for maxi-revenue [online], Public Relations Tactics; Oct2008, Vol. 15 Issue 10, p16-16, 1/5p, Available from: http://search.ebscohost.com/login.aspx?direct=true&db=buh&AN=34876178&site=ehost-live [Accessed: 13.11.2009].
Chmielweski, D.C. & Sarno, D. 2009, "MySpace losing the battle to remain useful and relevant", Los Angeles Times, 18 June 2009, .
Cimilluca, D. 2007, Facing Facebook’s Stratospheric P/E [online], Wall Street Journal - Eastern Edition; 10/27/2007, Vol. 250 Issue 100 Available from: http://search.ebscohost.com/login.aspx?direct=true&db=buh&AN=27400810&site=ehost-live [Accessed: 15.11.2009].

!"#$%&&'())#()*#+"#,-.&/#0&%%#1)#2.%#3%45#6.%#7&1892(49:92;#18#(#<(*9=(:#7&9=%/#
! $*!
Corkery, M. 2009, "How to Value Web’s Twitter?", The Wall Street Journal, 18 September 2009, .
Deagon, B. 2009, "Will Facebook Milestone Hasten An IPO?", Investor’s Business Daily, 18 September 2009, .
Economist 2009, "Class War", The Economist, 21 November 2009, .
Fine, J. 2009, Twitter Makes a Racket. But Revenues? [online], Business Week, 4/20/2009, Issue 4127, p89-89, 1p , Available from: http://search.ebscohost.com/login.aspx?direct=true&db=buh&AN=37383543&site=ehost-live [Accessed: 16.11.2009]
Garrahan, M. 2009, “The rise and fall of MySpace”, Financial Times, 4 December 2009, .
Goldsmith, J. 2009, "News Corp. profits up 11%; Digital strategy in need of a reboot", Daily Variety, 4 November 2009, .
Helft, M. 2009, "In the Blogs: Bits - YouTube opens up a bit on viewership", International Herald Tribune, 13 October 2009, .
Kim, R. 2009, "Stock offer puts value on Facebook", The San Francisco Chronicle, 14 July 2009, .
Lawsky, D. 2009a, "Facebook revenue expected to be "billions" in 5 years; Andreessen sees no rush to push the throttle", Montreal Gazette, 7 July 2009, .
Lashinsky, A. 2009, Twitter hits Tweenhood [online], Fortune; 11/9/2009, Vol. 160 Issue 9, p76-76, 1p, 2 color , Available from: http://search.ebscohost.com/login.aspx?direct=true&db=buh&AN=44910528&site=ehost-live [Accessed: 14.11.2009]. Learmonth, M. 2009, Can Twitter rake in the ads to justify $1B valuation? [online], Advertising Age, 9/28/2009, Vol. 80 Issue 32, p1-25, 2p, Available from: http://search.ebscohost.com/login.aspx?direct=true&db=buh&AN=44392389&site=ehost-live [Accessed: 15.11.2009]
Lefkow, C. 2009, "Myspace into second round of staff cuts; Affects Canadians", National Post, 24 June 2009, .
MacMillan, R. 2009, "MySpace begins redefining itself; News Corp. is taking the first steps to meet challengers Facebook and Twitter", Victoria Times Colonist, 27 June 2009,.
Menn, J. & Bradshaw, T. 2009, "Apple to let Spotify have iPhone access", Financial Times, 28 August 2009, .
Olszewski, P. 2009, "Google paid a billion bucks more for Youtube than it was worth", Media Blab, 8 October 2009, .
!"#$%&&'())#()*#+"#,-.&/#0&%%#1)#2.%#3%45#6.%#7&1892(49:92;#18#(#<(*9=(:#7&9=%/#
! $"!
Ricadela, A 2008, LinkedIn Joins the Billionaires Club [online], BusinessWeek Online; 6/19/2008, p17-17, 1p, Available from: http://search.ebscohost.com/login.aspx?direct=true&db=buh&AN=32876231&site=ehost-live [Accessed: 17.11.2009]. Segal, J. 2009, "The second internet bubble has a slow puncture as MySpace loses its lustre", The Daily Telegraph, 18 June 2009, .
Sonne, P. 2009, "New U.K. music service drums up listeners", The Wall Street Journal Europe, 17 September 2009, .
Spangler, T. 2009, "YouTube’s $300 Million Bandwidth Tab", Multichannel News, September 14 2009, p. 24.
Stone, B. 2009, Twitter Appears Set to Raise $100 Million, Valuing It at $1 Billion [online], New York Times September 24, 2009, Available from: http://www.nytimes.com/2009/09/25/technology/internet/25twitter.html?_r=1 [Accessed: 12.11.2009].
Stone, B. 2009, Twitter Confirms New Funding [online], New York Times September 25, 2009, Available from: http://bits.blogs.nytimes.com/2009/09/25/twitter-confirms-new-funding/?scp=1&sq=Twitter%20Confirms%20New%20Funding&st=Search [Accessed: 12.11.2009].
Stone, B. & Heft, M. 2009, In Developing Countries, Web Grows Without Profit [online], New York Times, Available from: http://www.nytimes.com/2009/04/27/technology/start-ups/27global.html [Accessed: 23.11.2009].
Teather, D. 2009, "Murdoch moves: Internet empire: MySpace is forced to slash workforce as social network users flock to Facebook", The Guardian, 24 June 2009, .
Waters, R. 2008, "LinkedIn networking site joins $1bn club", Financial Times, 18 June 2008, .
Waters, R. & Garrahan, M. 2009, "YouTube looks to have plotted course to profit", Financial Times, 18 July 2009, .
Web Sources Ante, S.E. 2009, Twitter Is Said to Be Profitable After Making Search Agreements [online], Available from: http://www.bloomberg.com/apps/news?pid=newsarchive&sid=a1jwVtGQmErk [Accessed: 28.12.2009].
Arrington, M. 2009, Twitter‚ Financial Forecast Shows First Revenue In Q3, 1 billion
users in 2013 [online], Available from: http://www.techcrunch.com/2009/07/15/twitters-financial-forecast-shows-first-revenue-in-q3-1-billion-users-in-2013/ [Accessed: 16.12.2009].
!"#$%&&'())#()*#+"#,-.&/#0&%%#1)#2.%#3%45#6.%#7&1892(49:92;#18#(#<(*9=(:#7&9=%/#
! $#!
Alexa 2009 [online], Available from: http://www.alexa.com/topsites [Accessed: 16.12.2009].
Baidu 2009a, Products [online], Available from: http://ir.baidu.com/phoenix.zhtml?c=188488&p=irol-products [Accessed: 16.12.09].
Baidu 2009b, Investor FAQ’s [online] Available from: http://ir.baidu.com/phoenix.zhtml?c=188488&p=irol-faq [Accessed: 16.12.09].
Baidu 2009c, Baidu Announces Fourth Quarter and Fiscal Year 2008 Results [online] Available from: http://media.corporate-ir.net/media_files/irol/18/188488/reports/Q408PressRelease.pdf [Accessed: 16.12.09].
Baidu 2009d, Baidu Announces First Quarter 2009 Results [online] Available from: http://phx.corporate-ir.net/External.File?item=UGFyZW50SUQ9MzQyN3xDaGlsZElEPS0xfFR5cGU9Mw==&t=1 [Accessed: 16.12.09].
Baidu 2009e, Baidu Announces Second Quarter 2009 Results [online] Available from: http://phx.corporate-ir.net/External.File?item=UGFyZW50SUQ9MTEwMzd8Q2hpbGRJRD0tMXxUeXBlPTM=&t=1 [Accessed: 16.12.09].
Baidu 2009f, Baidu Announces Third Quarter 2009 Results [online] Available from: http://phx.corporate-ir.net/External.File?item=UGFyZW50SUQ9MjAxMjJ8Q2hpbGRJRD0tMXxUeXBlPTM=&t=1 [Accessed: 16.12.09].
BusinessDictionary.com Profitability [online], BusinessDictionary.com, Available from: http://www.businessdictionary.com/definition/profitability.html [Accessed: 12.1.2010]
Carlson, N. 2009, Everything You Wanted To Know About Facebook's Revenue But Didn't Know Who To Ask [online], The Business Insider, Available from: http://www.businessinsider.com/breaking-down-facebooks-revenues-2009-7 [Accessed: 16.12.2009].
comScore 2009, Baidu Ranked Third Largest Worldwide Search Property by comScore
in December 2007 [online], Available from: http://www.comscore.com/Press_Events/Press_Releases/2008/01/Baidu_Ranked_Third_Largest_World_Wide_Search_Engine/(language)/eng-US [Accessed: 16.12.2009].
eBay 2005, eBay to Acquire Skype [online], Available from: http://investor.ebay.com/releasedetail.cfm?ReleaseID=172666 [Accessed: 8.12.2009].
eBay 2009a, eBay Inc. Completes Sale of Skype [online], Available from: http://investor.ebayinc.com/releasedetail.cfm?ReleaseID=425623 [Accessed: 16.12.2009].
eBay 2009b, eBay Inc. reports Fourth Quarter and Full Year 2008 results [online], Available from:

!"#$%&&'())#()*#+"#,-.&/#0&%%#1)#2.%#3%45#6.%#7&1892(49:92;#18#(#<(*9=(:#7&9=%/#
! $$!
http://files.shareholder.com/downloads/ebay/782048533x0x266606/581a206a-78df-4c3c-81c4-4a8b57e62440/eBay_FINALQ42008EarningsRelease.pdf [Accessed: 16.12.2009].
eBay 2009c, eBay Inc. Reports Third Quarter 2009 results [online], Available from: http://files.shareholder.com/downloads/ebay/782048533x0x330053/d0688073-496e-4ede-8f9a-a83979bf5fd4/eBay_UpdatedFinalQ309EarningsRelease.pdf [Accessed: 16.12.2009].
Encyclopedia Britannica Profit [online], Encyclopedia Britannica, Available from: http://www.britannica.com/EBchecked/topic/478141/profit [Accessed: 12.1.2010]
Facebook 2009a, Company Timeline [online], Available from: http://www.facebook.com/press/info.php?timeline [Accessed: 16.12.2009].
Facebook 2009b, Statistics [online], Available from: http://www.facebook.com/press/info.php?statistics [Accessed: 16.12.2009].
Frommer, D. 2009a, Chart of the day: Hulu Beginning To Eat YouTube’s Lunch [online], The Business Insider, Available from: http://www.businessinsider.com/chart-of-the-day-hulu-beginning-to-eat-youtubes-lunch-2009-4 [Accessed: 23.11.2009].
Frommer, D. 2009b, More Bad News For YouTube: Fox, NBC Extend Hulu Exclusives [online], The Business Insider, Available from: http://www.businessinsider.com/more-bad-news-for-youtube-fox-nbc-extend-hulu-exclusives-2009-5 [Accessed: 23.11.2009].
Google 2009a, Google Announces Fourth Quarter And Fiscal Year 2008 Results [online], Available from: http://investor.google.com/releases/2008Q4_google_earnings.html [Accessed: 16.12.2009].
Google 2009b, Google announces third quarter 2009 results [online], Available from: http://investor.google.com/releases/2009Q3_google_earnings.html [Accessed: 16.12.2009].
Google 2009 Baidu, Google Finance Baidu [online]Available from: http://www.google.com/finance?q=NASDAQ:BIDU [Accessed: 14.12.2009].
Google 2009 Facebook, Google Ad Planner [online] Available from: https://www.google.com/adplanner/planning/site_profile#siteDetails?identifier=facebook.com&geo=001&trait_type=1&lp=true [Accessed: 16.12.2009].
Google 2009 LinkedIn, Google Ad Planner [online] Available from: https://www.google.com/adplanner/planning/site_profile#siteDetails?identifier=LinkedIn.com&lp=true [Accessed: 16.12.2009].
Google 2009 Mixi, Google Finance [online] Available from: http://www.google.com/finance?q=TYO%3A2121 [Accessed: 19.12.2009].

!"#$%&&'())#()*#+"#,-.&/#0&%%#1)#2.%#3%45#6.%#7&1892(49:92;#18#(#<(*9=(:#7&9=%/#
! $%!
Google 2009 Myspace, Google Ad Planner [online] Available from: https://www.google.com/adplanner/planning/site_profile#siteDetails?identifier=myspace.com&geo=001&trait_type=1&lp=true [Accessed: 16.12.2009].
Google 2009 Skype, Google Ad Planner [online] Available from: https://www.google.com/adplanner/planning/site_profile#siteDetails?identifier=skype.com&geo=001&trait_type=1&lp=true [Accessed: 16.12.2009].
Google 2009 Spotify, Google Ad Planner [online] Available from: https://www.google.com/adplanner/planning/site_profile#siteDetails?identifier=spotify.com&geo=001&trait_type=1&lp=true [Accessed: 16.12.2009].
Google 2009 Twitter, Google Ad Planner [online] Available from: https://www.google.com/adplanner/planning/site_profile#siteDetails?identifier=twitter.com&geo=001&trait_type=1&lp=true [Accessed: 16.12.2009].
Google 2009a Xing, Google Ad Planner [online] Available from: https://www.google.com/adplanner/planning/site_profile#siteDetails?identifier=xing.com&geo=001&trait_type=1&lp=true [Accessed: 16.12.2009].
Google 2009b Xing, Google Finance [online]Available from: http://www.google.com/finance?q=ETR%3AO1BC [Accessed: 16.12.2009].
Google 2009a Yahoo, Google Finance [online] Available from: http://www.google.com/finance?q=NASDAQ%3AYHOO [Accessed: 14.12.2009].
Google 2009b Yahoo, Google Ad Planner [online] Available from: https://www.google.com/adplanner/planning/site_profile#siteDetails?identifier=yahoo.com&geo=001&trait_type=1&lp=true [Accessed: 16.12.2009].
Greenberg, T. Veytsel, A. Boatwright, L. & Lerner, S. 2009, YouTube: Google‚ Phantom
Loss Leader [online], RampRate, Available from: http://www.ramprate.com/pdf/RRMarketCommentary-GoogleandYouTube.pdf [Accessed: 16.12.2009].
Lawsky, D. 2009b, LinkedIn CEO says staff increasing 50 pct this year [online], Reuters News, Available from: http://www.reuters.com/article/idUSTRE59800A20091009 [Accessed: 16.12.2009].
LinkedIn 2008a, About Us [online], Available from: http://press.linkedin.com/about [Accessed: 30.11.2009].
LinkedIn 2008b, Compare Account Types [online], Available from: http://www.linkedin.com/static?key=business_info_more&trk=acct_set_compare [Accessed: 30.11.2009].
LinkedIn 2009a, Advertise with us [online], Available from: http://www.linkedin.com/static?key=advertising_info&trk=hb_ft_ads [Accessed: 30.11.2009].

!"#$%&&'())#()*#+"#,-.&/#0&%%#1)#2.%#3%45#6.%#7&1892(49:92;#18#(#<(*9=(:#7&9=%/#
! $&!
Lipsman, A. 2009a, ComScore and Starcom USA Release Updated “Natural Born Clickers” Study Showing 50 Percent Drop in Number of U.S. Internet Users Who Click
on Display Ads [online], Available from: http://www.comscore.com/Press_Events/Press_Releases/2009/10/comScore_and_Starcom_USA_Release_Updated_Natural_Born_Clickers_Study_Showing_50_Percent_Drop_in_Number_of_U.S._Internet_Users_Who_Click_on_Display_Ads/(language)/eng-US [Accessed: 7.12.2009].
Lipsman, A. 2009b, Hulu Delivers Record 856 Million U.S. Video Views in October
During Height of Fall TV Season [online], Available from: http://www.comscore.com/Press_Events/Press_Releases/2009/11/Hulu_Delivers_Record_856_Million_U.S._Video_Views [Accessed: 8.12.2009].
Lyons, D. 2009, Old Media Strikes Back [online], Newsweek, Available from: http://www.newsweek.com/id/185790 [Accessed: 16.12.2009].
McCarthy, C. 2009, Facebook’s valuation: The cheat sheet [online], cnet news, Available from: http://news.cnet.com/8301-13577_3-10286111-36.html [Accessed: 20.12.2009].
Madway, G. 2008, LinkedIn cuts 10 percent of workforce [online], Available from: http://www.reuters.com/article/internetNews/idUSTRE4A4BJX20081105 [Accessed: 30.11.2009].
MySpace 2009, Fact Sheet [online], Available from: http://www.myspace.com/pressroom?url=/fact+sheet/ [Accessed: 16.12.2009].
Skype 2009a, About Skype [online], Available from: http://about.skype.com [Accessed: 8.12.2009].
Skype 2009b, Prices Skype [online], Available from: http://www.skype.com/intl/sv/prices/ [Accessed: 8.12.2009].
Xing 2009a, Q&A’s [online], Available from: http://corporate.xing.com/english/investor-relations/basic-information/q-as/ [Accessed: 16.12.2009].
Xing 2009b, Annual report 2008 [online], Available from: http://corporate.xing.com/fileadmin/image_archive/XING_AG_full_year_results_2008.pdf [Accessed: 16.12.2009].
Xing 2009c, Interim report January 1st to Septemeber 30
th 2008 [online], Available from:
http://corporate.xing.com/fileadmin/image_archive/XING_AG_results_Q3_2008.pdf [Accessed: 16.12.2009].
Xing 2009d, Interim Report Q3 2009 [online], Available from: http://corporate.xing.com/fileadmin/image_archive/XING_AG_results_Q3_2009.pdf [Accessed: 16.12.2009].
Yahoo 2009a, Yahoo Finance [online], Available from: http://finance.yahoo.com/q?s=goog [Accessed: 16.12.2009].

!"#$%&&'())#()*#+"#,-.&/#0&%%#1)#2.%#3%45#6.%#7&1892(49:92;#18#(#<(*9=(:#7&9=%/#
! $'!
Yahoo 2009b, Yahoo! Reports Fourth Quarter and Full Year 2008 Financial Results online], Available from: http://files.shareholder.com/downloads/YHOO/771489913x0x268250/43268c65-53c3-4b3c-8a10-2c8018a6c80a/YHOO_Q4FY08PressReleaseFinal.pdf [Accessed: 16.12.2009].
Yahoo 2009c, Yahoo! Reports Third Quarter 2009 results [online], Available from: http://files.shareholder.com/downloads/YHOO/771489913x0x325221/05a85efe-1094-49b2-95bb-6de5ab880392/YHOO_Q32009EarningsRelease_Final.pdf [Accessed: 16.12.2009].
Journals Baker, S. 2008, “Web 2.0 startups: Who will survive?”, BusinessWeek, Volume 4108, .
Hardy, Q. 2008, "Networking For Profit, Not Fun;", Forbes, Volume 182, Issue 12, .
Learmonth, M. 2009B, "Facebook finds profitability despite nascent ad model", Tire Business, 9/28/2009, Vol. 27 Issue 13, p13-13.
Weinman, J. J. 2006, "Say hello to the YouTube losers", Maclean’s, Vol. 119 Issue 44, p70-70, 8/9p.

!"#$%&&'())#()*#+"#,-.&/#0&%%#1)#2.%#3%45#6.%#7&1892(49:92;#18#(#<(*9=(:#7&9=%/#
! $(!
Appendix 1. Definitions and abbreviations
£ = 1 GBP Great Britain Pound, currency of Great Britain.
! = 1 Euro, currency of several countries of the European Union.
$ = 1 US $, currency of the United States of America.
Advertisement Banner/Ad Banner - Advertisement image or video on a website.
Content Provider/Content based company – Own definition of companies that primarily provide content that uses comparatively large amounts of bandwidth such as music or video. These sites are not “meeting places” like social communities.
Click-through rate – the percentage of people downloading a Web page who access a hypertext link to a particular advertisement. (The new Oxford American Dictionary).
dot-com – a company that relies largely or exclusively on Internet commerce ,-./!0/1!234567!89/6:;<0!=:;>:50<6?@A
IPO - Initial Public Offering. An IPO occurs when a company’s stock is made publicly traded on a stock market.
Market cap/Valuation - Market capitalization - is a measurement of the size of a company. It is equal to the share price times the number of shares outstanding of a publicly traded company. Market Cap is the same as a company’s valuation.
Micropayments – A payment, typical via credit card, of a small amount of money (The new Oxford American Dictionary).
N/A - not applicable
Net income = Total Revenue – Total Cost. Net income is equal to the income that a firm has after subtracting costs and expenses from the total revenue. It is equal to profit.
Open source or Wiki projects – According to The New Oxford American Dictionary: “denoting Software for which the original source code is made freely available and may be redistributed with or without modification.”
P/E - The P/E ratio is calculated by available Market cap (or Valuation) divided by Net Income (in our calculations TTM Q4 2008 to Q3 2009 or estimates for 2009).
!"#$%&&'())#()*#+"#,-.&/#0&%%#1)#2.%#3%45#6.%#7&1892(49:92;#18#(#<(*9=(:#7&9=%/#
! $)!
Peer-to-Peer technology – When people share data files or content among each other without the need for central coordination like to go through a website server.
Preferred Stock – Stocks that give the holder additional rights in case of a bankruptcy.
Profit – Defined by the Encyclopedia Britannica as: “In business usage, the excess of
total revenue over total cost during a specific period of time.” (Encyclopedia Britannica, Profit)
Profitable – Is defined according to the The New Oxford American Dictionary as “(of a business or activity) yielding profit or financial gain.” We use it in this manner and define a profitable company as one that shows a profit. The opposite being unprofitable that is to say shows a loss.
Profitability – Defined on BusinessDictionary.com as “Ability of a firm to generate net
income on a consistent basis. It is often measured by price to earnings ratio.” (BusinessDictionary.com, Profitability). We use this definition with the exception of “on a consistent basis” since we only research one period.
Profit Margin - Net income as a percentage of revenue.
Revenue per User = total revenue/ total amount of users.
Revenue per 1000 page views = total annual revenue/((page views per month*12)/1000)
TTM -Trailing Twelve Months. Twelve consecutive months, often used with quarters as units for example 2nd quarter 2008 to 2nd quarter 2009.
Virtual goods - are non-physical objects an item or a picture that you can buy in social networking/communities like for example Facebook.

!"#$%&&'())#()*#+"#,-.&/#0&%%#1)#2.%#3%45#6.%#7&1892(49:92;#18#(#<(*9=(:#7&9=%/#
! %+!
&
Appendix 2. Calculations 01Q&'-:(B#)12#9)=:-*%*#9)#2.%#&%B?%=29D%#)12%B#B%%#M??%)*9N#J"#
M),#+&@7&!)"G/&&& " "
"" T"B*QQ*14"" $&*.-!
L/F"*4.1U/"V$"#!!&" $#6K" "!
L/F"*4.1U/"V'"#!!I" #%6H" 7!
L/F"*4.1U/"V#"#!!I" H%6'" @!
L/F"*4.1U/"VK"#!!I" J#6#" A!
>1F)Q"4/F"*4.1U/"V$"#!!&")4+"V'GVK"#!!I" 'IJ6'" !!
W)Q,)F*14"" '$JK!" B!
XMR" J$6JK" !
$&*.-C! ! !
"#!D5+01!7EEF3! ! !
7#!D5+01!7EEF0! ! !
@#!D5+01!7EEF.! ! !
A#!D5+01!7EEF'! ! !
B#!<&&=6.!7EEF!D5+01! ! !
!
M),#+&C7&()*+,$$-& " "
Y/Z/4,/C"[BT\" "" $&*.-!
N.F*Z/",C/AC"[U*QQ*14C\" KH!" "!
B14FEQ=":)5/"Z*/?C"[0*QQ*14\" #%!" 7!
(A)4+")+C"" '#H" @!
N+"+/)Q"?*FE"B*.A1C1<F"" 'H!" @!520!A!
W*AF,)Q"511+C"" JH" @!!
9/Q<"9/AZ*./"N+C" #!!" @!
N44,)Q"A/Z/4,/" HH!" @!520!B!
]:/A)F*45"U)A5*4" K'6'#^" G!
L/F"*4.1U/" 'J'6'%" !!
W)Q,)F*14"[BT\" %H!!" ""
XMR"" KJ6I&" ""
Y/Z/4,/":/A"'!!!":)5/"Z*/?C"[T\"" !6'J%" #"
Y/Z/4,/":/A",C/A"[T\" '6HJ" '"
$&*.-C! ! !
"#!H53.9&&>!7EEF9!
7#!<&&=6.!7EEF!H53.9&&>!!
@#!I546-&2J!$#!7EEF! ! !
A#!K.54?&2*;J!L#!7EEF!
B#!M.5=&2J!D#!7EEF! ! !
G#!N.!4.*4+.:.0!*;.!)4&'+*!?54=+2&'!@"JOP!'4&?!L+Q+!J!5!R5)52.-.!-&3+56!
2.*S&4>+2=!-+*.!-+?+654!*&!H53.9&&>J!520!5--1?.0!*;.!-5?.!)4&'+*!

!"#$%&&'())#()*#+"#,-.&/#0&%%#1)#2.%#3%45#6.%#7&1892(49:92;#18#(#<(*9=(:#7&9=%/#
! %*!
?54=+2!'&4!H53.9&&>!T<&&=6.!7EEF!L+Q+U!
!
K"62&$?&()*+,$$-&5)#/)2"$%6&TL*8)>2B:U&87&CVVWX"
Y)2+& =5+%2&
_,4/"#!!$" `"-A*/4+CF/A"1<</A"
N:A*Q"#!!H" `"9/A*/C"N"<,4+*45"
B)A.E"#!!%" `"(,C*4/CC?//2"A/:1AF"
N:A*Q"#!!%" `"9/A*/C"("<,4+*45"
9/:F/U0/A"#!!%" `"D)E11"1<</A"
].F10/A"#!!J" `"B*.A1C1<F"84Z/CFC"T#$!"U*QQ*14"
_,4/"#!!&" `"a144/.F"b".1,AF"+1.,U/4FC"A/Z/)Q"Z)Q,)F*14""
N,5,CF"#!!&" `"RU:Q1=//C"?)4F"F1"C/QQ"CF1.2"1:F*14C"
B)A.E"#!!I" `"91Q+"CF1.2"*C"FA)+*45")F")"Z)Q,)F*14"1<"K"0*QQ*14"
N:A*Q"#!!I" `">/.E.A,4.E"A/:1AFC"-)./0112"F1"5/F")4"1<</A"Z)Q,*45"FE/".1U:)4="F1"#"0*QQ*14"
N:A*Q"#!!I" `"W/4F,A/"(/)F"A/:1AFC"4/?"<,4+*45"Z)Q,*45"-)./0112"F1"$"0*QQ*14"
B)="#!!I" `"T#!!"U*QQ*14"*4Z/CFU/4F")F")4"Z)Q,)F*14"1<"&"0*QQ*14"
_,Q="#!!I"
`"c*5*F)Q"92="0/5*4C"0,=0).2"1<"T'!!"U*QQ*14"*4"CF1.2"<A1U"/U:Q1=//Cd"R).E"CE)A/"
C/QQ*45"<1A"'$6JJ"?E*.E")CC,U/C")"Z)Q,)F*14"1<"%6H"0*QQ*14"
!
M),#+&D7&I$$J#+& " """ T"B*QQ*14"" $&*.!L/F"*4.1U/"V$"#!!&" K$$#" "!
L/F"*4.1U/"V'GVK"#!!I" 4546,348 7!>1F)Q"4/F"*4.1U/"V$"#!!&")4+"V'GVK"#!!I" $I#&6JI" !!W)Q,)F*14"" '&&%!!" @!
XMR" K&6K" !
$&*.-C! " "
"#!<&&=6.!7EEF5! " "
7#!<&&=6.!7EEF9! " "
@#!85;&&!7EEF5! " "
!
M),#+&E7&K"%-+G3%& " " "
NQQ"+)F)"<1A"3*45"A/FA*/Z/+"<A1U"FE/"#!!&")44,)Q"A/:1AF" " "
7*42/+84"+)F)")01,F"FE/"A/Q)F*14C"0/F?//4"A/Z/4,/"C1,A./C"<A1U")4"84F/AZ*/?"?*FE"<1,4+/A"Y/*+"
e1<<U)4"*4"(,C*4/CC"f//2"[()2/A"#!!&\"
Q+5+%/+& "" "" $&*.!
)*+$,#-%-./&01,"2.*&345&"6&,$+$.2$7& "" "" !!
X)5/Z*/?C":/A"=/)A"[U*QQ*14C\" ##&!!" "" "!
Y/Z/4,/":/A"'!!!":)5/"Z*/?C"[g\" !6$$" "" 7!
>1F)Q"N+GA/Z/4,/"[U*QQ*14"g\" '!6!J" "" @!
M$2)#&FGR>+5+%/+&T4"##"$%&'X& && @HU@Z& A!
8$9,2-#:$.#&;$,+-9$%<=">&?"%#-./%&0345&"6&,$+$.2$7& "" "" !!
7*42/+84"4,U0/A"1<",C/AC"[U*QQ*14C\" H!" "" !!
3*45"Y/Z/4,/"<A1U"FE*C"C1,A./"[U*QQ*14"g\" $6&J%" "" !!
3*45"4,U0/A"1<",C/AC"[U*QQ*14C\" &6K" "" !!
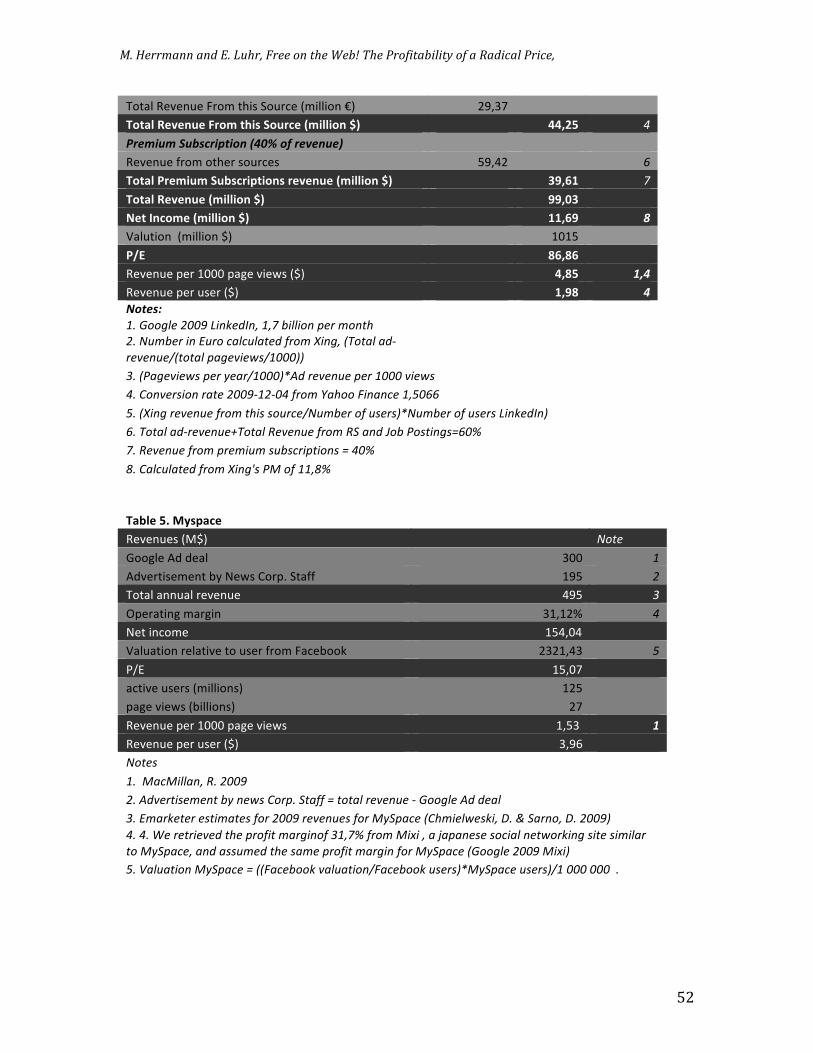
!"#$%&&'())#()*#+"#,-.&/#0&%%#1)#2.%#3%45#6.%#7&1892(49:92;#18#(#<(*9=(:#7&9=%/#
! %"!
>1F)Q"Y/Z/4,/"-A1U"FE*C"91,A./"[U*QQ*14"g\" #I6KJ" "" !!
M$2)#&Q+5+%/+&(>$4&2B"6&A$/>*+&T4"##"$%&'X& "" EEUCH& A!
?,$:-2:&;2>%9,-@#-".&0A45&"6&,$+$.2$7& "" "" !!
Y/Z/4,/"<A1U"1FE/A"C1,A./C" HI6$#" "" G!
M$2)#&;>+4"/4&A/,6*>"92"$%6&>+5+%/+&T4"##"$%&'X& && DWU[@& O!
M$2)#&Q+5+%/+&T4"##"$%&'X& "" WWUVD& !!
1+2&3%*$4+&T4"##"$%&'X& && @@U[W& B&
W)Q,F*14""[U*QQ*14"T\" "" '!'H" !!
;<=&& && \[U\[& &
Y/Z/4,/":/A"'!!!":)5/"Z*/?C"[T\& & EU\H& 'CA&
Y/Z/4,/":/A",C/A"[T\" & @UW\& A&
!"#$%D& & & &
"#!<&&=6.!7EEF!K+2>.0%2J!"JO!9+66+&2!).4!?&2*;! &
7#!$1?9.4!+2!V14&!3563165*.0!'4&?!W+2=J!TX&*56!50/
4.:.21.YT*&*56!)5=.:+.S-Y"EEEUU!
&
& &
@#!TZ5=.:+.S-!).4!,.54Y"EEEU[\0!4.:.21.!).4!"EEE!:+.S-" " &
A#!I&2:.4-+&2!45*.!7EEF/"7/EA!'4&?!85;&&!H+2523.!"JBEGG! " "
B#!TW+2=!4.:.21.!'4&?!*;+-!-&143.Y$1?9.4!&'!1-.4-U[$1?9.4!&'!1-.4-!K+2>.0%2U! " "
G#!X&*56!50/4.:.21.]X&*56!^.:.21.!'4&?!^(!520!_&9!Z&-*+2=-`GEP! " "
O#!^.:.21.!'4&?!)4.?+1?!-19-34+)*+&2-!`!AEP! " " "
a#!I563165*.0!'4&?!W+2=b-!ZL!&'!""JaP!!!!! " " "
!
M),#+&H7&L:69)*+&& " "
Y/Z/4,/C"[BT\" "" $&*.!
P115Q/"N+"+/)Q" K!!" "!
N+Z/AF*C/U/4F"0="L/?C"a1A:d"9F)<<" 'IH" 7!
>1F)Q")44,)Q"A/Z/4,/" $IH" @!
]:/A)F*45"U)A5*4" K'6'#^" A!
L/F"*4.1U/" """"""""""""""""""""""""""""""""""""""""""'H$6!$!
W)Q,)F*14"A/Q)F*Z/"F1",C/A"<A1U"-)./0112" #K#'6$K" B!
XMR" 'H6!J" !!
).F*Z/",C/AC"[U*QQ*14C\" '#H" !!
:)5/"Z*/?C"[0*QQ*14C\" #J" !!
Y/Z/4,/":/A"'!!!":)5/"Z*/?C" ""'6HK!" '&
Y/Z/4,/":/A",C/A"[T\" """"""""""""""""""""""""""K6I%" !
$&*.-! " "
"#!!L53L+6652J!^#!7EEF! " "
7#!\0:.4*+-.?.2*!9,!2.S-!I&4)#!(*5''!`!*&*56!4.:.21.!/!<&&=6.!\0!0.56! "
@#!V?54>.*.4!.-*+?5*.-!'&4!7EEF!4.:.21.-!'&4!L,()53.!TI;?+.6S.->+J!M#!c!(542&J!M#!7EEFU!
A#!A#!N.!4.*4+.:.0!*;.!)4&'+*!?54=+2&'!@"JOP!'4&?!L+Q+!J!5!R5)52.-.!-&3+56!2.*S&4>+2=!-+*.!-+?+654!
*&!L,()53.J!520!5--1?.0!*;.!-5?.!)4&'+*!?54=+2!'&4!L,()53.!T<&&=6.!7EEF!L+Q+U!
B#!d5615*+&2!L,()53.!`!TTH53.9&&>!:5615*+&2YH53.9&&>!1-.4-U[L,()53.!1-.4-UY"!EEE!EEE!!#!
!
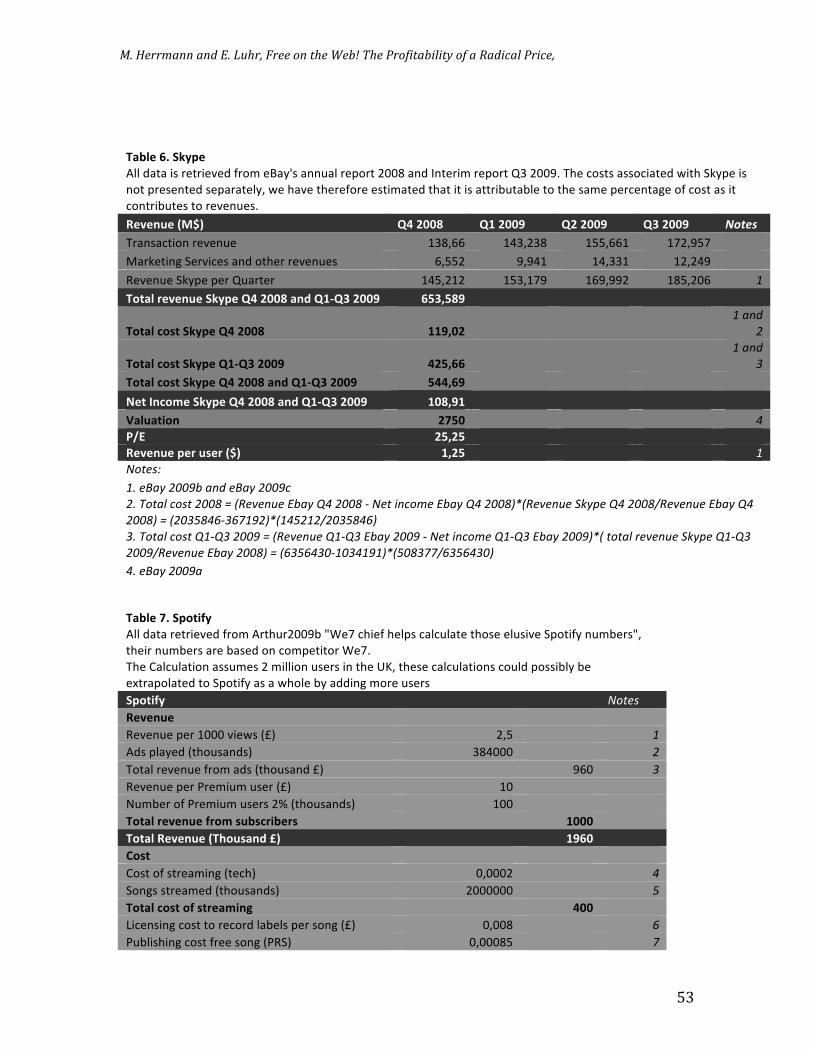
!"#$%&&'())#()*#+"#,-.&/#0&%%#1)#2.%#3%45#6.%#7&1892(49:92;#18#(#<(*9=(:#7&9=%/#
! %#!
!
!
M),#+&[7&A-:9+"
NQQ"+)F)"*C"A/FA*/Z/+"<A1U"/()=hC")44,)Q"A/:1AF"#!!&")4+"84F/A*U"A/:1AF"VK"#!!Id">E/".1CFC")CC1.*)F/+"?*FE"92=:/"*C"
41F":A/C/4F/+"C/:)A)F/Q=6"?/"E)Z/"FE/A/<1A/"/CF*U)F/+"FE)F"*F"*C")FFA*0,F)0Q/"F1"FE/"C)U/":/A./4F)5/"1<".1CF")C"*F"
.14FA*0,F/C"F1"A/Z/4,/Cd""
Q+5+%/+&TL'X& ]E&CVV\& ]@&CVVW& ]C&CVVW& ]D&CVVW& !"#$%&
>A)4C).F*14"A/Z/4,/"" 'K&6%%" '$K6#K&" 'HH6%%'" 'J#6IHJ" !!
B)A2/F*45"9/AZ*./C")4+"1FE/A"A/Z/4,/C" %6HH#" I6I$'" '$6KK'" '#6#$I" !!
Y/Z/4,/"92=:/":/A"V,)AF/A" '$H6#'#" 'HK6'JI" '%I6II#" '&H6#!%" "!
M$2)#&>+5+%/+&A-:9+&]E&CVV\&)%G&]@R]D&CVVW&& [HDUH\W& "" "" "" !!
M$2)#&*$62&A-:9+&]E&CVV\&& @@WUVC& "" "" ""
"!520!
7!
M$2)#&*$62&A-:9+&]@R]D&CVVW&& ECHU[[& "" "" ""
"!520!
@!
M$2)#&*$62&A-:9+&]E&CVV\&)%G&]@R]D&CVVW& HEEU[W& "" "" "" !!
1+2&3%*$4+&A-:9+&]E&CVV\&)%G&]@R]D&CVVW& @V\UW@& "" "" "" !!
.)#/)2"$%& CZHV& "" "" "" !A!
;<=& CHUCH& "" "" "" !!
Q+5+%/+&9+>&/6+>&T'X& @UCH& " " " "!
$&*.-C! " " " " "
"#!.D5,!7EEF9!520!.D5,!7EEF3! " " " " "
7#!X&*56!3&-*!7EEa!`!T^.:.21.!V95,!eA!7EEa!/!$.*!+23&?.!V95,!eA!7EEaU[T^.:.21.!(>,).!eA!7EEaY^.:.21.!V95,!eA!
7EEaU!`!T7E@BaAG/@GO"F7U[T"AB7"7Y7E@BaAGU!
@#!X&*56!3&-*!e"/e@!7EEF!`!T^.:.21.!e"/e@!V95,!7EEF!/!$.*!+23&?.!e"/e@!V95,!7EEFU[T!*&*56!4.:.21.!(>,).!e"/e@!
7EEFY^.:.21.!V95,!7EEaU!`!TG@BGA@E/"E@A"F"U[TBEa@OOYG@BGA@EU!
A#!.D5,!7EEF5!
"
M),#+&Z7&A9$2"?:& " " "
NQQ"+)F)"A/FA*/Z/+"<A1U"NAFE,A#!!I0"if/J".E*/<"E/Q:C".)Q.,Q)F/"FE1C/"/Q,C*Z/"9:1F*<="4,U0/ACi6"
FE/*A"4,U0/AC")A/"0)C/+"14".1U:/F*F1A"f/Jd""
>E/"a)Q.,Q)F*14")CC,U/C"#"U*QQ*14",C/AC"*4"FE/"bj6"FE/C/".)Q.,Q)F*14C".1,Q+":1CC*0Q="0/"
/SFA):1Q)F/+"F1"9:1F*<=")C")"?E1Q/"0=")++*45"U1A/",C/AC"
A9$2"?:& "" "" $&*.-!
Q+5+%/+& "" "" !!
Y/Z/4,/":/A"'!!!"Z*/?C"[k\" #6H" "" "!
N+C":Q)=/+"[FE1,C)4+C\" K&$!!!" "" 7!
>1F)Q"A/Z/4,/"<A1U")+C"[FE1,C)4+"k\" "" I%!" @!
Y/Z/4,/":/A"XA/U*,U",C/A"[k\" '!" "" !!
L,U0/A"1<"XA/U*,U",C/AC"#^"[FE1,C)4+C\" '!!" "" !!
M$2)#&>+5+%/+&?>$4&6/,6*>",+>6& && @VVV& &&
M$2)#&Q+5+%/+&TMB$/6)%G&^X& && @W[V& &&
8$62& "" "" !!
a1CF"1<"CFA/)U*45"[F/.E\" !6!!!#" "" A!
9145C"CFA/)U/+"[FE1,C)4+C\" #!!!!!!" "" B!
M$2)#&*$62&$?&62>+)4"%J& && EVV& &&
7*./4C*45".1CF"F1"A/.1A+"Q)0/QC":/A"C145"[k\" !6!!&" "" G!
X,0Q*CE*45".1CF"<A//"C145"[XY9\" !6!!!&H" "" O!

!"#$%&&'())#()*#+"#,-.&/#0&%%#1)#2.%#3%45#6.%#7&1892(49:92;#18#(#<(*9=(:#7&9=%/#
! %$!
-A//"C145C"CFA/)U/+"I%^" 'I#!!!!" "" a!
M$2)#&*$62&$?&62>+)4"%J&?>++&6$%J6& && @[WWC& E&
XY9":/A"U14FE"C,0C.A*0/A"[k\" !6&" "" "E!
Y7".E)A5/":/A"U14FE"C,0"[k\" H" "" "E!
XA/U*,U",C/AC"#^"[FE1,C)4+C\" '!!" "" ""!
M$2)#&#"*+%6"%J&*$626&9>+4"/46&/6+>6& && H\V& &&
M$2)#&8$62& && @ZWZC& &&
1+2&"%*$4+&TMB$/6)%G&^X& && R@[V@C& &&
$&*.-C!
"#!f7JB!).4!"EEE!50-!)65,.0! " " "
7#!H4..!(&2=-!-*4.5?.0YB`"F7EEEEYB`@aAEEE!!52!50!+-!)65,.0!'&4!.:.4,!'+:.!-&2=-!T&S2!
5--1?)*+&2!59&1*!*;.!'4.g1.23,!&'!50-!95-.0!&2!1-5=.!&'!()&*+',U"
@#!^.:.21.!).4!"EEE!:+.S-[T\0-!)65,.0Y"EEEU!
A#!\!6&S!.-*+?5*.!95-.0!&2!*;5*!()&*+',!1-.-!Z..4/*&/Z..4!*.3;2&6&=,! " "
B#!D5-.0!&2!*;5*!()&*+',!h(*4.5?-!?+66+&2-!&'!-&2=-!.53;!?&2*;h!533&40+2=!*&!*;.!3&?)52,!S.9-+*."
G#!!K+3.2-+2=!3&-*!*&!4.3&40!659.6-!'&4!.53;!h'4..h!-&2=!-*4.5?.0! "
O#!Z196+-;+2=!3&-*!*&!*;.!Z.4'&4?+2=!^+=;*!(&3+.*,!'&4!.53;!'4..!-&2=!-*4.5?.0! "
a#!\--1?+2=!*;5*!FGP!&'!-*4.5?.0!-&2=-!54.!-*4.5?.0!9,!).&)6.!1-+2=!*;.!'4..!:.4-+&2!
F#!H4..!(&2=-!-*4.5?.0[K+3.2-+2=!3&-*!*&!4.3&40!659.6-!).4!-&2=!]!H4..!(&2=-!-*4.5?.0[Z196+-;+2=!
3&-*!'4..!-&2=!TZ^(U!
"E#!(19-34+)*+&2!&''.4-!3;54=.-!;+=;.4!45*.-!'4&?!9&*;!^.3&40!K59.6-!520!Z^(!
""#!Z4.?+1?!1-.4-!54.!.-*+?5*.0!*&!9.!7P!&'!566!1-.4-J!TEJE7[7!L+66+&2`"EEEEEU!
"M),#+&\7&MN"22+>& " "
[U*QQ*14"T\" && $&*.-!
P115Q/" 'H" "!
B*.A1C1<F" '!" "!
_):)4/C/"N+C" !6!%'" 7!
>1F)Q"Y/Z/4,/" #H6!%'" !!
>1F)Q".1CF" ##6H" @!
L/F"84.1U/" #6H%'" ""
Y/Z/4,/":/A",C/A"[T\" !6$%" '"
$&*.-C! " "
"#!\2*.J!(#V#!7EEF! " "
7#!(..!I563165*+&2!9.6&S! " "
@#!\2*.J!(#V#!7EEF!=+:.-!.-*+?5*.-!&'!7E!*&!7BJ!S.!1-.0!*;.!5:.45=.!
MN"22+>&_)9)%+6+&FG6&& && !"#$%&
>1F)Q"X)5/"Z*/?C" K$&!!!" "!
Y/Z/4,/":/A"'!!!":)5/"Z*/?C"[T\" !6'J%" 7!
>1F)Q"Y/Z/4,/"[>E1,C)4+"T\" %'6#$&" @!
$&*.-C! !! ""
"#!XS+**.4#R)!'&4!$&:.?9.4!7EEF!?16*+)6+.0!9,!"7!!T<&&=6.!7EEF!XS+**.4U!
#d"N"A/Z/4,/"/CF*U)F*14"1<"T!6'J%":/A"'!!!":)5/"Z*/?C"[C)U/")C"<1A"
-)./0112\" ""
@#!X&*56!4.:.21.!.g156-!T)5=.:+.S-Y"EEEU[^.:.21.!).4!"EE!)5=.!:+.S-"
"
"
"

!"#$%&&'())#()*#+"#,-.&/#0&%%#1)#2.%#3%45#6.%#7&1892(49:92;#18#(#<(*9=(:#7&9=%/#
! %%!
"
M),#+&W7&P"%J& " " " " " "
>E/"4,U0/AC"<1A"V$"#!!&"F1"VK"#!!I"*C".)Q.,Q)F/+",C*45"FE/")4,)Q"4,U0/AC"<1A"#!!&"U*4,C"FE/"FEA//"<*ACF"l,)AF/AC"
)4+"FE/4")++*45"FE/"FEA//"<*ACF"l,)AF/AC"1<"#!!Id"
Q+5+%/+6&TL`X& V'GVK"#!!&" #!!&" V$"#!!&" V'GVK"#!!I"
V$"#!!&"G"VK"
#!!I" $&*.!
A/,6*>"92"$%6& #!6!HI" #&6'!&" &6!$I" #J6&'J" KH6&%%" !!
FG5+>2"6"%J& '6JK#" #6$#I" !6%IJ" '6'!H" '6&!#" !!
+R*$44+>*+& K6!JH" "" '6#KK" "" $6&J%" "!
_$,6& "" K6I%$" "" K6#J'" "" !!
!+62&a??+>6& "" !6K$$" "" !6KJ#" "" !!
a2B+>6& !6!#&" !6!HI" !6!K'" !6!J" !6'!'" !!
M$2)#&& CEU\WE& DEUWVE& @VUV@& DCU[DH& ECU[EH& !!
]FE/A"1:/A)F*45"*4.1U/" !6'I%" !6KJ" !6'J$" !6HJ#" !6J$%" !!
M$2)#&>+5+%/+& CHUVW& DHUCZE& @VU@\E& DDUCVZ& EDUDW@& !!
1+2&3%*$4+&T4"##"$%&`X& EUZC& ZUD@\& CUHW\& CUHC& HU@@\& 7!
1+2&3%*$4+&T4"##"$%&'X& ZU@@@& @@UVCH& DUW@E& DUZWZ& ZUZ@@& H"
;>$?"2&4)>J"%& @\U\@b& CVUZHb& CHUH@b& ZUHWb& @@U\Vb& ""
.)#/)2"$%&T4"##"$%X& `@HWU[@& 'CEVUEZ& && && && @JB!
;<=& D@UC& && && && && !!
Y/Z/4,/":/A"'!!!":)5/"Z*/?C"" @DUDW& & & & & AJB!
Y/Z/4,/":/A",C/A"[T\& ZU\Z& & & & & B!
'd"/G.1UU/A./".14C*CFC"1<"A/Z/4,/C"<A1U"i_10Ci")4+"i(/CF"]<</ACi" " " "
#d""3*45"#!!I06""3*45"#!!I.")4+"3*45"#!!I+" " " " "
Kd"P115Q/"#!!I0"3*45" " "
$d"P115Q/"#!!I)"3*456"$!!"U*QQ*14":)5/"Z*/?C":/A"U14FE" " " " "
Hd"a14Z/AC*14"Y)F/"#!!IG'#G!$"<A1U"D)E11"-*4)4./"T'6H!%%Mg" " " "
"
M),#+&@V7&O)B$$& " "
"" T"B*QQ*14"" $&*.!
L/F"*4.1U/"V$"#!!&" GK!K6$#&" "!
L/F"*4.1U/"V'GVK"#!!I" $$H6!K&" 7!
>1F)Q"4/F"*4.1U/"V$"#!!&")4+"V'GVK"#!!I" '$'6%'" !!
W)Q,)F*14"" #'I'!" @!
XMR"" 'H$6J#" !
L1F/Cm" " "
"#!85;&&!7EEF9! " "
7#!85;&&!7EEF3! " "
@#!<&&=6.!7EEF5!85;&&! " "
"
"
"
"
"
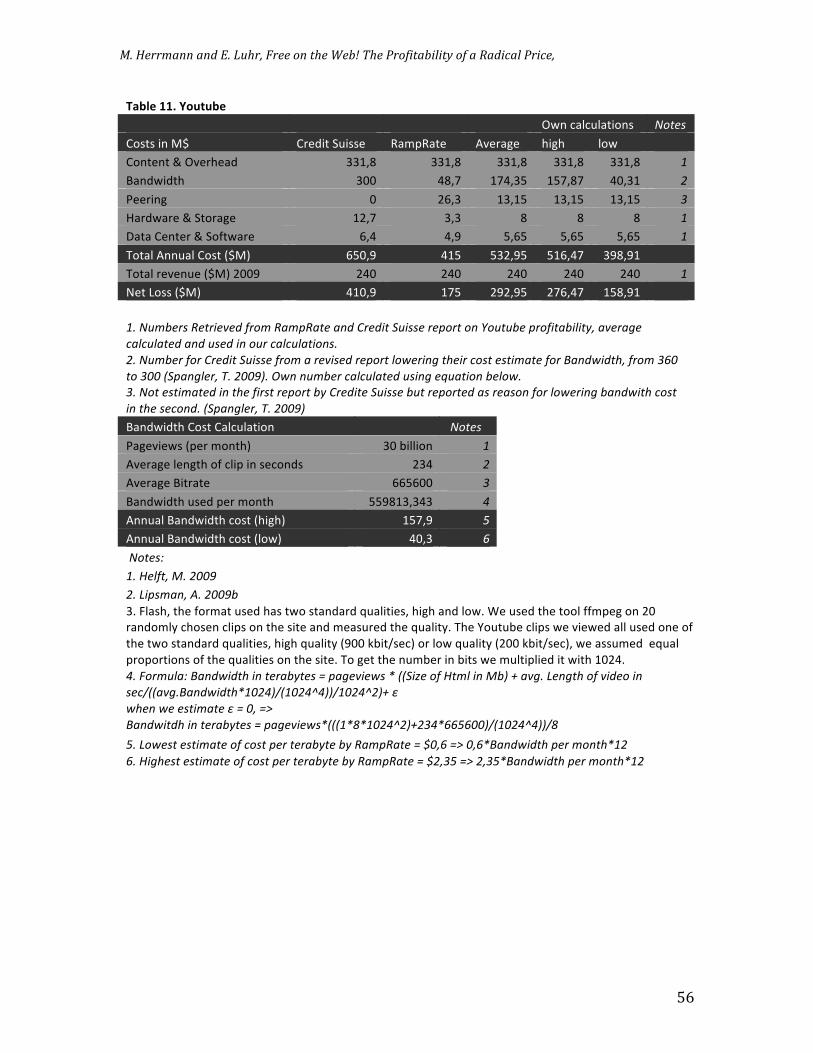
!"#$%&&'())#()*#+"#,-.&/#0&%%#1)#2.%#3%45#6.%#7&1892(49:92;#18#(#<(*9=(:#7&9=%/#
! %&!
M),#+&@@7&O$/2/,+"
"" "" "" "" ]?4".)Q.,Q)F*14C" $&*.-!
a1CFC"*4"BT" aA/+*F"9,*CC/" Y)U:Y)F/" NZ/A)5/" E*5E" Q1?" !!
a14F/4F"n"]Z/AE/)+" KK'6&" KK'6&" KK'6&" KK'6&" KK'6&" "!
()4+?*+FE" K!!" $&6J" 'J$6KH" 'HJ6&J" $!6K'" 7!
X//A*45" !" #%6K" 'K6'H" 'K6'H" 'K6'H" @!
e)A+?)A/"n"9F1A)5/" '#6J" K6K" &" &" &" "!
c)F)"a/4F/A"n"91<F?)A/" %6$" $6I" H6%H" H6%H" H6%H" "!
>1F)Q"N44,)Q"a1CF"[TB\" %H!6I" $'H" HK#6IH" H'%6$J" KI&6I'" !!
>1F)Q"A/Z/4,/"[TB\"#!!I" #$!" #$!" #$!" #$!" #$!" "!
L/F"71CC"[TB\" $'!6I" 'JH" #I#6IH" #J%6$J" 'H&6I'" !!
" " " " " " "
"#!$1?9.4-!^.*4+.:.0!'4&?!^5?)^5*.!520!I4.0+*!(1+--.!4.)&4*!&2!8&1*19.!)4&'+*59+6+*,J!5:.45=.!
3563165*.0!520!1-.0!+2!&14!3563165*+&2-#!
7#!$1?9.4!'&4!I4.0+*!(1+--.!'4&?!5!4.:+-.0!4.)&4*!6&S.4+2=!*;.+4!3&-*!.-*+?5*.!'&4!D520S+0*;J!'4&?!@GE!
*&!@EE!T()52=6.4J!X#!7EEFU#!iS2!21?9.4!3563165*.0!1-+2=!.g15*+&2!9.6&S#!
@#!$&*!.-*+?5*.0!+2!*;.!'+4-*!4.)&4*!9,!I4.0+*.!(1+--.!91*!4.)&4*.0!5-!4.5-&2!'&4!6&S.4+2=!9520S+*;!3&-*!
+2!*;.!-.3&20#!T()52=6.4J!X#!7EEFU!
()4+?*+FE"a1CF"a)Q.,Q)F*14" "" !$&*.-!
X)5/Z*/?C"[:/A"U14FE\" K!"0*QQ*14" "!
NZ/A)5/"Q/45FE"1<".Q*:"*4"C/.14+C" #K$" 7!
NZ/A)5/"(*FA)F/" %%H%!!" @!
()4+?*+FE",C/+":/A"U14FE" HHI&'K6K$K" A!
N44,)Q"()4+?*+FE".1CF"[E*5E\" 'HJ6I" B!
N44,)Q"()4+?*+FE".1CF"[Q1?\" $!6K" G!
"$&*.-C! "" ""
"#!j.6'*J!L#!7EEF! !! !!
7#!K+)-?52J!\#!7EEF9! !! !! ! ! ! !
Kd"-Q)CE6"FE/"<1AU)F",C/+"E)C"F?1"CF)4+)A+"l,)Q*F*/C6"E*5E")4+"Q1?d"f/",C/+"FE/"F11Q"<<U:/5"14"#!"
A)4+1UQ=".E1C/4".Q*:C"14"FE/"C*F/")4+"U/)C,A/+"FE/"l,)Q*F=d">E/"D1,F,0/".Q*:C"?/"Z*/?/+")QQ",C/+"14/"1<"
FE/"F?1"CF)4+)A+"l,)Q*F*/C6"E*5E"l,)Q*F="[I!!"20*FMC/.\"1A"Q1?"l,)Q*F="[#!!"20*FMC/.\6"?/")CC,U/+""/l,)Q"
:A1:1AF*14C"1<"FE/"l,)Q*F*/C"14"FE/"C*F/d">1"5/F"FE/"4,U0/A"*4"0*FC"?/"U,QF*:Q*/+"*F"?*FE"'!#$d"
A#!H&4?165C!D520S+0*;!+2!*.459,*.-!`!)5=.:+.S-![!TT(+k.!&'!j*?6!+2!L9U!]!5:=#!K.2=*;!&'!:+0.&!+2!
-.3YTT5:=#D520S+0*;["E7AUYT"E7AlAUUY"E7Al7U]!m!!
S;.2!S.!.-*+?5*.!m!`!EJ!`n!!
D520S+*0;!+2!*.459,*.-!`!)5=.:+.S-[TTT"[a["E7Al7U]7@A[GGBGEEUYT"E7AlAUUYa!
B#!K&S.-*!.-*+?5*.!&'!3&-*!).4!*.459,*.!9,!^5?)^5*.!`!oEJG!`n!EJG[D520S+0*;!).4!?&2*;["7!
G#!j+=;.-*!.-*+?5*.!&'!3&-*!).4!*.459,*.!9,!^5?)^5*.!`!o7J@B!`n!7J@B[D520S+0*;!).4!?&2*;["7!
&!
&

!"#$%&&'())#()*#+"#,-.&/#0&%%#1)#2.%#3%45#6.%#7&1892(49:92;#18#(#<(*9=(:#7&9=%/#
! %'!
&
Appendix 3. Cross references a1U:)4="" ()*+,"" -)./0112"
L/F"84.1U/" ()*+,"#!!I.G<"
a)AQC146"Ld"#!!Io"7/)AU14FE6"Bd"
#!!Io"c/)5146"(d"#!!Io""
W)Q,)F*14" P115Q/"#!!I"()*+,"
c/)5146"(d"#!!Io"B.a)AFE=6"ad"#!!Io"
j*U6"Yd"#!!I"
N.F*Z/"bC/AC" LMN" -)./0112"#!!I0"
X/./4F)5/"1<"
C/)A.E/CM"
X)5/"Z*/?C" .1U9.1A/"#!!I" P115Q/"#!!I"-)./01125"
a1U:)4="" P115Q/" 7*42/+8L"
L/F"84.1U/" P115Q/"#!!I)G0"
Y*.)+/Q)6"Nd"#!!&o"7)?C2=6"cd"#!!I0o"
f)F/AC6Yd"#!!&""
W)Q,)F*14" D)E11"#!!I)" f)F/AC6"Yd"#!!&o"
N.F*Z/"bC/AC" LMN" 7*42/+84"#!!&)"
X/A./4F)5/"1<"
C/)A.E/CMX)5/"
Z*/?C" .1U9.1A/"#!!I" P115Q/"#!!I"7*42/+84"
a1U:)4="" B=9:)./" 92=:/""
L/F"84.1U/"
aEU*/Q?/C2*6"cd"n"9)A416"cd"#!!Io"P1Q+CU*FE6"_d"
#!!I" /()="#!!I0G."
W)Q,)F*14" LMN" /()="#!!I)"
N.F*Z/"bC/AC" B).B*QQ)46"Yd"#!!I" /()="#!!I."
X)5/"W*/?C" P115Q/"#!!I"B=9:)./" "P115Q/"#!!I"92=:/"
a1U:)4="" 9:1F*<=" >?*FF/A"
L/F"84.1U/" NAFE,A6"ad"#!!I)G0" 7)CE*4C2=6"Nd"#!!I"
W)Q,)F*14" B/446"_d"n"(A)+CE)?6">d"#!!I"" 9F14/6"("#!!I0o"a1A2/A=6"Bd"#!!I"
N.F*Z/"bC/AC" NAFE,A6"ad"#!!I0" 7)CE*4C2=6"Nd"#!!I"
X)5/"W*/?C" "P155Q/"#!!I"9:1F*<=" P115Q/"#!!I">?*FF/A"
a1U:)4="" 3*45" D)E11"
L/F"84.1U/" 3*45"#!!I0G+" D)E11"#!!I0G."
W)Q,)F*14" P115Q/"#!!I)"3*45" P115Q/"#!!I)"D)E11""
N.F*Z/"bC/AC" 3*45"#!!I" LMN"
X)5/"W*/?CM"
X/A./4F)5/1<"
C/)A.E/C" P115Q/"#!!I0"3*45"" .1U9.1A/"#!!I"
a1U:)4="" D1,F,0/" "
L/F"84.1U/" -*4/6"_d"#!!Io"9:)45Q/A6">d"#!!I" "
W)Q,)F*14"
f/*4U)46"_d"_d"#!!%o"]QCp/?C2*6"Xd"#!!Io"e/Q<F6"
Bd"#!!Io"f)F/AC6"Yd"n"P)AA)E)46"Bd"#!!I" "
N.F*Z/"bC/AC" "e/Q<F6"Bd"#!!Io"f)F/AC6"Yd"n"P)AA)E)46"Bd"#!!I" "
X)5/"W*/?C" e/Q<F6"Bd"#!!Io"f)F/AC6"Yd"n"P)AA)E)46"Bd"#!!I" "
!