Embed Size (px)
Citation preview
ARTICLE
Free Nitrous Acid Inhibition on AnoxicPhosphorus Uptake and Denitrification byPoly-Phosphate Accumulating Organisms
Yan Zhou, Maite Pijuan, Zhiguo Yuan
Advanced Wastewater Management Centre (AWMC), The University of Queensland,
St Lucia, Brisbane, Qld 4072, Australia; telephone: (þ61) 7 33654374; fax: (þ61) 7 33654726;
e-mail: [email protected]
Received 22 January 2007; revision received 28 March 2007; accepted 2 April 2007
Published online 7 May 2007 in Wiley InterScience (www.interscience.wiley.com). DO
I 10.1002/bit.21458ABSTRACT: Nitrite has been found in previous research aninhibitor on anoxic phosphorus uptake in enhanced biolo-gical phosphorus removal systems (EBPR). However, theinhibiting nitrite concentration reported varied in a largerange. This study investigates the nitrite inhibition on anoxicphosphorus uptake by using four different mixed culturesperforming EBPR with pH considered an important factor.The results showed that the protonated species of nitrite,HNO2 (or free nitrous acid, FNA), rather than nitrite, islikely the actual inhibitor on the anoxic phosphorus uptake,as revealed by the much stronger correlation of the phos-phorus uptake rate with the FNA than with the nitriteconcentration. All the four EBPR sludges showed decreasedanoxic phosphorus uptake rates with increased FNA con-centrations in the studied range of 0.002–0.02 mg HNO2-N/L. The phosphorus uptake by all four cultures was com-pletely inhibited at 0.02 mg HNO2-N/L. Granular sludgeappeared to be more tolerant to HNO2 than flocular sludgelikely due to its stronger resistance to the transfer of nitriteinto the bacterial aggregates. Furthermore, denitrification bythe phosphorus-accumulating organisms (PAOs) was alsofound to be inhibited by HNO2. The denitrification ratedecreased by approximately 40% when the FNA concentra-tion was increased from 0.002 to 0.02 mg HNO2-N/L.
Biotechnol. Bioeng. 2007;98: 903–912.
� 2007 Wiley Periodicals, Inc.
KEYWORDS: denitrification; enhanced biological phos-phorus removal; free nitrous acid; inhibition; polypho-sphate accumulating organisms; P-uptake
Introduction
Enhanced biological phosphorus removal (EBPR) is themost economical and sustainable process for removingphosphorus from wastewater (Tchobanoglous et al., 2002).EBPR is achieved by recycling poly-phosphate accumulating
Correspondence to: Z. Yuan
Contract grant sponsor: Environmental Biotechnology Cooperative Research Center
(EBCRC) Pty Ltd., Australia
� 2007 Wiley Periodicals, Inc.
organisms (PAOs) through alternating anaerobic andaerobic conditions. PAOs take up carbon sources, primarilyvolatile fatty acids (VFAs) in the anaerobic phase and storethem in the form of PHA. The energy required is primarilygained from the degradation of their intracellular poly-phosphate, which is released to the bulk liquid asorthophosphate. In the subsequent aerobic phase, PAOsgrow and take up orthophosphate to recover the poly-phosphate level by using the stored PHA as the carbon andenergy sources. Phosphorus removal is achieved by with-drawing excess sludge at the end of the aerobic phase, whenthe PAO cells contain a high level of poly-phosphate.
Phosphorus uptake also occurs under anoxic conditions.Previous research has shown at least some PAOs, collectivelycalled denitrifying PAOs (or DPAOs), are able to oxidizetheir intracellular PHA with nitrate and/or nitrite as theterminal electron acceptor, providing energy for phos-phorus uptake (Ahn et al., 2001; Meinhold et al., 1999;Zeng et al., 2003). This means that the carbon source takenup by PAOs in the anaerobic phase is used for bothdenitrification and phosphorus removal, which is advanta-geous when the wastewater contains a relatively low level oforganic carbon.
The requirement for organic carbon can be furtherlowered by achieving nitrogen removal via nitritation anddenitritation. This is a process where ammonium is onlyoxidized to nitrite, which is directly reduced to nitrogen gaswithout being further oxidized to nitrate (Van Loosdrechtand Jetten, 1998). Compared to traditional nitrification anddenitrification, this simplified process reduces the carbonrequirement for denitrification, oxygen consumption fornitrification, and also lowers sludge production (Turk andMavinic, 1986). Zhou et al. (2007) studied a BNR systemwhere the denitrification step in the above nitritation
Biotechnology and Bioengineering, Vol. 98, No. 4, November 1, 2007 903
and denitritation process was primarily carried out bythe DPAOs. Such a system requires a minimum amountof organic carbon for biological nutrient removal.It was observed, however, that the phosphorus uptakeby PAOs was seriously inhibited by the presence of a highlevel of nitrite (e.g. >40 mg N/L). Indeed, several researchershave reported the inhibitory effect of nitrite on thephosphate uptake by PAOs. However, the results reportedto date have been inconsistent and in some cases contra-dictory.
Meinhold et al. (1999) reported that a nitrite con-centration of 8 mg N/L completely inhibited the anoxicphosphorus uptake by an EBPR sludge treating pre-settled domestic wastewater. In contrast, Ahn et al.(2001) reported that the anoxic phosphorus uptake byan EBPR sludge continued to occur at a nitrite concentra-tion of 40 mg N/L. Saito et al. (2004) argued that thelarge difference in the above results was due to the use ofdifferent activated sludges and suggested that enriched PAOcultures should be used in order to get a better under-standing of the inhibition. Using an EBPR sludge enrichedunder anaerobic and aerobic conditions, with acetate as thesole carbon source, Saito et al. (2004) observed that thenitrite inhibition on the anoxic phosphorus uptake startedat approximately 3 mg N/L, with a 35% inhibition at a nitriteconcentration of 12 mg N/L, the highest level used in theirstudy. The results are not in agreement with those reportedin Hu et al. (2003), who also used an enriched lab culture. Itwas reported in Hu et al. (2003) that a nitrite level of 115 mgN/L did not inhibit the phosphorus uptake. However, thepH in Hu et al. (2003) was not controlled and variedbetween 7.0 and 8.3. Saito et al. (2004) suggested thatchemical precipitation may have affected the results in Huet al. (2003).
However, additional reasons may exist for these differentresults. In all of the above-mentioned studies, researcherstried to correlate the level of inhibition with theconcentration of nitrite. In the case that free nitrous acid,rather than nitrite, is the true inhibitor, such a correlationmay not be strong unless pH is constant. Free nitrous acid(FNA) has been reported to inhibit the growth and/orenergy generation of a wide range of phylogenetic types(Sijbesma et al., 1996; Yarbrough et al., 1980), includingboth ammonia and nitrite oxidizing bacteria (Anthonisenet al., 1976; Hellinga et al., 1999; Vadivelu et al., 2006a,b),denitrifiers (Almeida et al., 1995), and also Acinetobacter sp.,a putative PAO (Weon et al., 2002).
The aim of this study is to reveal the true inhibitor behindthe often observed ‘‘nitrite inhibition’’ on phosphate uptakeby PAOs, and at the same time to provide some insightfulinformation concerning the inhibition mechanism. FourEBPR sludges, two flocular and two granular, were used inthe study. One flocular sludge was a PAO culture highlyenriched with Accumulibacter, a known PAO, while theother three were EBPR sludges treating real wastewatercontaining a much smaller size of PAO population(approximately 10%).
904 Biotechnology and Bioengineering, Vol. 98, No. 4, November 1, 2007
Materials and Methods
Sludge Sources
Four different types of sludges from four lab-scale EBPRsystems were used to carry out the experiments.
Sludge 1 was withdrawn from a sequencing batch reactor(SBR) fed with synthetic wastewater containing volatilefatty acids and orthophosphate. The reactor had a workingvolume of 8 L and was operated with a cycle time of 6 hconsisting of 130 min anaerobic, 160 min aerobic, 65 minsettling and decanting, and 5 min anaerobic idle periods. Ineach cycle, 2 L of synthetic wastewater was fed to the reactorin the first 6 min of the anaerobic period, resulting ahydraulic retention time of one day. The sole carbon sourcein the synthetic feed was alternated between acetate andpropionate with a switching frequency of every two sludgeages (16 days), in order to provide further selectiveadvantages to PAOs. Further explanation of the feedingstrategy and more details of the reactor operation and itsperformance can be found in Lu et al. (2006). The SBR wasdisplaying excellent EBPR performance (>99%) when thebatch experiments described below were carried out.
Sludge 2 was withdrawn from a granular sludge SBRworking under alternating anaerobic–anoxic conditionstreating abattoir wastewater. It was operated with an 8 hcycle starting with a 140 min anaerobic phase, at thebeginning of which 3 L of abattoir wastewater was fedresulting in a total working volume of 4 L. After a short2 min settling period, the supernatant of 3 L was dischargedand a second feeding containing PO3�
4 and NO�2 (the
effluent of a nitrifying biofilm reactor) was added leading tothe start of a 286 min anoxic period, where nitrite andphosphorus were removed concomitantly. More details ofthis reactor can be found in Zhou et al. (2007). At the time ofthe batch tests described below, the reactor was achieving a Premoval efficiency of 62.5% from the abattoir wastewatercontaining approximately 40 mg P/L.
Sludge 3 was taken from another granular sludge SBRtreating abattoir wastewater, which was operated underalternating anaerobic-aerobic conditions. The reactor had acycle time of 8 h, with 3 L of abattoir wastewater fed at thebeginning of its 1 h anaerobic period reaching a totalworking volume of 5 L. Nitrogen and phosphorus wereremoved in the subsequent aerobic period of approximately7 h, primarily through simultaneous nitrification, deni-trification and phosphorus uptake. There was temporarynitrite accumulation of up to 40 mg N/L during the aerobicperiod. Steady state performance with excellent N and Premoval (>95%) was being achieved when the batchexperiments were carried out.
Sludge 4 was obtained from a 7 L SBR with flocular sludgetreating also abattoir wastewater operated under alternatinganaerobic-aerobic-anoxic conditions. The 4 h cycle timeconsisted of a 30 min anaerobic period, 65 min aerobicperiod, and a 117 min anoxic period. The reactor received1 L wastewater in each cycle. Nitrite was the primary product
DOI 10.1002/bit
of nitrification during the aerobic period, which accumu-lated to about 20 mg N/L at the end of aerobic period.The reactor was achieving a P removal efficiency of 62%from the same abattoir wastewater at the time of the batchtests.
Table I summarizes the main features of the four types ofsludges.
Batch Experiments
Thirty batch experiments were performed using the fourtypes of sludges. In each test, 250 mL of sludge wastransferred to the batch reactor. N2 was sparged through thehead space of the reactor to ensure anaerobic conditions.Acetate was added to the sludge resulting in an initial acetateconcentration in the reactor of 200 mg COD/L. After 2.5 h,the biomass was washed to remove any acetate residue.Phosphate, ammonium and nitrite were then added. Theresulting initial phosphate and ammonium concentrationswere 30 mg P/L, and 5 mg N/L, respectively, whereas theinitial nitrite concentration varied between 35 and 100 mgN/L, as shown in Table II. Lower nitrite concentration wasnot used to ensure denitrification was not limited by nitrite.The concentration of FNA, the key factor tested in thisstudy, ranged between 0.001 and 0.04 mg HNO2-N/L(Table II), which was achieved by varying pH. TheFNA concentration was calculated using the formulaSN�NO2=Ka � 10pH and with Ka value determined usingthe formula e�2;300=ð273þTÞ for a given temperature T (8C)(Anthonisen et al., 1976). Each anoxic period lasted for 3 h,during which the pH was kept approximately constant to apre-designed set-point (see Table II; pH variation intervalwas �0.01) through manually adding 1 M HCl or 0.4 MNaOH. The initial FNA concentration in each batch testcalculated based on the nitrite concentration and the pH isalso shown in Table II, along with the MLVSS concentra-tions of the sludge. Mixed liquor samples were taken every30 min using a syringe and immediately filtered throughdisposable Millipore filter units (0.45 mm pore size) for theanalyses of ammonia, nitrite and phosphate (methods givenbelow). The rates of phosphate uptake and nitrite reductionwere determined from the measured phosphate and nitriteprofiles using linear regression. During Test 6 and Test 7from sludge 1 (see Table II), ATP levels in the biomass weremeasured using the methods described in the next section.
Analyses
The ammonia (NHþ4 ), nitrate (NO�
3 ) and nitrite (NO�2 ) and
orthophosphate (PO3�4 -P) concentrations were analyzed
Table I. Sludge used in the batch experiments.
Type of sludge SBR cycle configur
Sludge 1 Flocular Anaerobic/aerobic
Sludge 2 Granular Anaerobic/anoxic
Sludge 3 Granular Anaerobic/aerobic
Sludge 4 Flocular Anaerobic/aerobic/a
using a Lachat QuikChem8000 Flow Injection Analyzer(Lachat Instrument, Milwaukee, WI). VFAs were measuredby Perkin-Elmer gas chromatography with column DB-FFAP 15 m� 0.53 mm� 1.0 mm (length� ID� film) at1408C, while the injector and FID detector were operated at220 and 2508C, respectively. High purity helium was used ascarrier gas at a flow rate of 17 mL/min. 0.9 mL of the filteredsample was transferred into a GC vial to which 0.1 mL offormic acid was added. For the analysis, a volume of 1 mLof sample was injected in splitless mode. COD was measuredthrough closed reflux colorimetric method using standardmethods (APHA, 1995). Mixed liquor suspended solid(MLSS) and volatile MLSS (MLVSS) were analyzedaccording to the standard methods (APHA, 1995).
Fluorescence in situ hybridization (FISH) was performedas described in Amann (1995) with Cy5-labelled EUBMIXprobes (for most Bacteria; Daims et al., 1999) and eitherCy3-labelled PAOMIX probes (for Candidatus Accumuli-bacter phosphatis or Accumulibacter, comprising equalamounts of probes PAO462, PAO651 and PAO846, Crocettiet al., 2000), or Cy3-labelled Actino-658 probes (forActinobacteria, Kong et al., 2005). The presence of themajor groups of GAOs currently known was also testedusing Cy3-labelled GAOMIX probes (for CandidatusCompetibacter phosphatis or Competibacter, comprisingequal amounts of probes GAOQ431 and GAOQ989,Crocetti et al., 2002) and Cy3-labelled DF1MIX (forDefluviicoccus vanus cluster 1-related bacteria or a-GAO,comprising equal amounts of probes DEF218 and DEF618,Wong et al., 2004). FISH preparations were visualized with aZeiss LSM 510 Meta confocal laser-scanning microscope(CLSM) using Plan-Apochromat 63� oil (NA1.4) objective.Thirty images were taken from each sample for quantifica-tion. All the images were 8-bit, 512� 512 pixel with 0.1 mmpixel size. Cy3 and Cy5 were excited with a HeNe laser (543nm) and red diode laser (637 nm) and collected with 550–625 nm BP and 660 nm LP emission filters respectively. Thearea containing cells targeted by the Cy3-labelled specificprobes (PAOMIX, Actino, GAOMIX or a-GAO) wasquantified as a percentage of the area of Cy5-labelledBacteria probe (EUBMIX) within each image using a pixelcounting program. The final quantification result wasexpressed as a mean percentage obtained from 30 imagesanalyzed along with a standard error. The standard error ofthe mean (SEmean) was calculated as the standard deviationof the area percentages divided by the square root of thenumber of images analyzed.
ATP was measured with an ATP DeterminationKit (Molecular Probes, Invitrogen Corporation, Mount
ation Wastewater Nitrite accumulation
Synthetic No
Abattoir Up to 50 mg N/L
Abattoir Up to 40 mg N/L
noxic Abattoir Up to 20 mg N/L
Zhou et al.: FNA Inhibition on P-Uptake 905
Biotechnology and Bioengineering. DOI 10.1002/bit
Table II. Experimental conditions applied in batch tests.
Sludge 1
Test 1 Test 2 Test 3 Test 4 Test 5 Test 6 Test 7 Test 8 Test 9 Test 10 Test 11 Test 12 Test 13 Test 14 Test 15
pH 8 8 8 8 7.5 7.5 7.5 7 7 7 7 7 7 7 6.8
NO�2 (mg N/L) 35.9 35.9 36.3 87.4 61.9 62.5 87.9 36.5 37.0 56.5 56.6 62.4 86.1 99.5 103.5
FNA� 103 (mg HNO2-N/L) 0.85 0.85 0.86 2.07 4.64 4.68 6.58 8.64 8.76 13.4 13.4 14.8 20.4 23.6 38.8
VSS (g/L) 1 1.06 1.07 1.12 1.08 1.07 1.1 1.11 1.44 1.24 1.15 1.12 1.13 1.23 0.99
Other sludges
Sludge 2 Sludge 3 Sludge 4
Test 1 Test 2 Test 3 Test 4 Test 5 Test 1 Test 2 Test 3 Test 4 Test 5 Test 1 Test 2 Test 3 Test 4 Test 5
pH 8 8 7 7 7 8 8 7.5 7 7 8 7 7 7 7
NO�2 (mg N/L) 52.5 92 54.6 95 95.2 37.6 87.4 64.4 37.4 87.8 40.1 68.1 40.1 64.5 88.5
FNA� 103 (mg HNO2-N/L) 1.24 2.18 12.9 22.5 22.6 0.89 2.07 4.83 8.86 20.8 0.95 16.1 9.48 15.28 20.97
VSS (g/L) 2.95 2.85 2.2 2.21 2.61 3.33 3.23 3.05 2.61 2.59 2.56 2.65 2.36 2.63 2.74
Waverley, Australia), following the instructions of themanufacturer. The assay is based on the requirement forATP by luciferase in producing light (emission maximum�560 nm) from the reaction:
Luciferingþ ATPþ O2 �!Mg2þ
LuciferaseOxyluciferin
þAMPþ Pyrophosphateþ CO2 þ light
The enriched culture sludge was diluted 200 times with
autoclaved milli-Q water before the ATP Determination Kit
reaction solution was added. The final reaction volume was
100 mL. Luminescence was determined directly after the
addition of the sludge to the reaction cuvettes, which
contained standard reaction solution, and was quantified in a
LKB 1250 Luminometer (LKB Wallace, San Francisco,
CA). The amount of ATP in an experimental sample was
calculated by using an ATP standard curve. Standard curve
was prepared following the directions below: (1) Prepare
low-concentration ATP standard solutions by diluting the
5 mM ATP solution in DNAse and RNAse free distilled
water (Invitrogen Corporation). In this study, ATP con-
centrations ranging from 1 nM to 1 mMwere used. (2) Place
100 mL of standard reaction solution in the luminometer and
measure the background luminescence. (3) Start the reaction
by adding 10 mL of diluted ATP standard solution and
read the luminescence (the volume of the diluted ATP
standard solution that is added in to the standard assay
solution should be no more than 10% of the total assay
volume). (4) Subtract the background luminescence to get
the luminescence from the ATP standard solution. (5) Gen-
erate a standard curve for a series of ATP concentrations.
Parameter Estimation
The FNA inhibitory effects on the anoxic phosphorus uptakewere modeled based on the experimental data. The MAT-LAB1 (Mathworks, Inc., Natick, MA) function ‘lsqcurvefit’
906 Biotechnology and Bioengineering, Vol. 98, No. 4, November 1, 2007
was used to find the parameter values that result in the bestfit between the models used and the experiment data. The95% confidence region of the model parameters wereassessed using the method described in Dochain andVanrolleghem (2001) also using MATLAB1. A parameterspace around the parameter estimates was chosen throughtrial and error, which was sufficiently large to encompass the95% confidence region. The sum of squared errors (SSE)resulting from simulation using each grid point in theparameter space was calculated, and the 95% confidenceregion was constructed by comparing these SSE values tothat defining the boundary of the region (SSE95% boundary).SSE95% boundary is defined as SSEopt� (1þ p/(N� p)�F(1� 0.95, N, p), where SSEopt is the SSE resulting fromthe parameter estimates (optimal parameter values), N is thenumber of data points, p is the number of parameters in themodel and F denotes F-distribution.
Results and Discussion
Microbial Communities
Accumulibacter, a widely reported PAO, was highly enrichedin Sludge 1 at 86.0% (SEmean ¼ 1.2%) and were alsoabundant in all other sludges at 8.0% (SEmean ¼ 0.2%),10.0% (SEmean ¼ 0.2%) and 13.0% (SEmean ¼ 0.4%), inSludges 2–4, respectively. The percentages measured forSludges 2–4 are comparable to the values reported for full-scale sludges (Saunders et al., 2003). Actinobacter, a putativePAO, and GAOs belonging to the Competibacter group orthe D. vanus-cluster 1 group were not detected in any of thesludges.
P-Uptake Inhibition
Figure 1 shows the phosphorus and nitrite concentrationprofiles measured in Test 3 with Sludge 1. Under pH 8.0 and
DOI 10.1002/bit
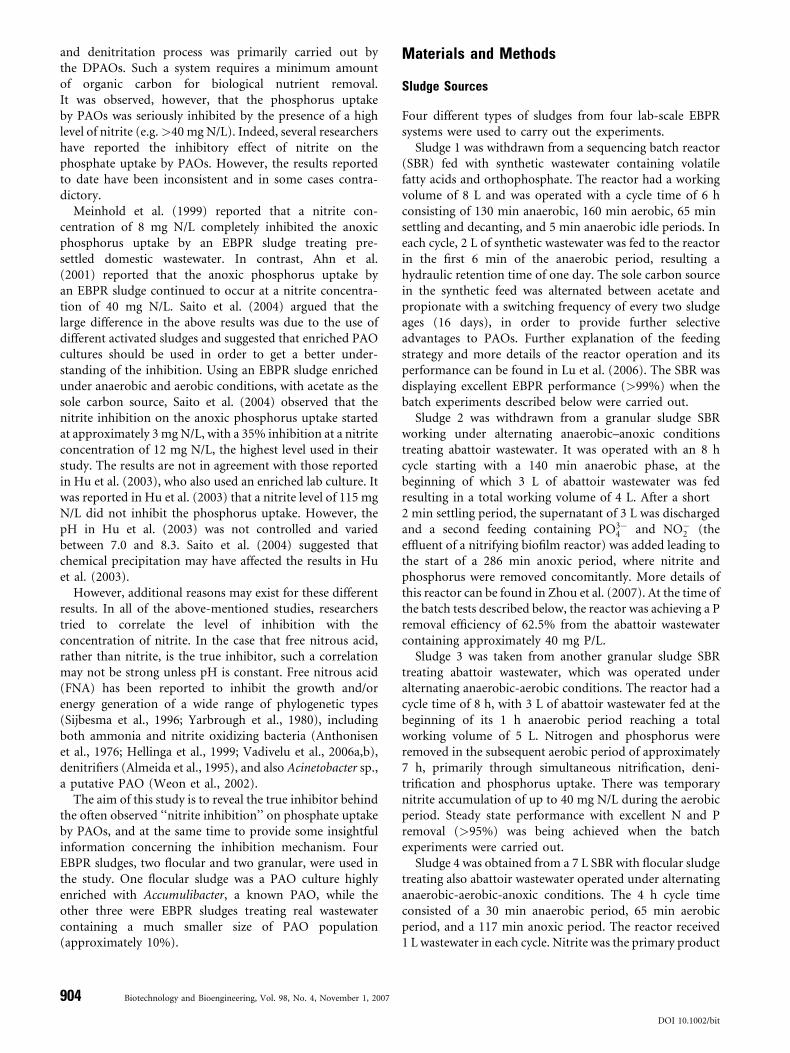
Figure 1. Phosphorus and nitrite concentration profiles measured in Test 3 with
Sludge 1.
an initial nitrite concentration of 36.3 mg N/L, phosphorusuptake and denitrification occurred simultaneously. Therates of the two processes were determined as 1.06 mg P/(h gVSS) and 2.75 mg N/(h g VSS), respectively, through linearregression. The P-uptake and denitrification rates in otherbatch experiments were determined in a similar way.Figure 2a and b shows the correlation between the rates ofphosphorus uptake and the nitrite and FNA concentrations,respectively, measured in the 15 batch experiments withSludge 1.
Figure 2a shows a general negative impact of nitrite onP-uptake. However, the correlation between the extent ofinhibition and the concentration of nitrite is not strong. Thisis in agreement with the broad range of inhibitory nitriteconcentrations reported in literature (see Introduction). pHclearly has an impact on the extent of inhibition as verydifferent inhibition levels were measured at the same nitriteconcentration but different pH values, with lower pHgiving stronger inhibition. This observation suggests thatFNA may be more likely a true inhibitor than nitrite.Figure 2b confirms that the level of inhibition has a muchstronger correlation with the FNA concentration, indicatingthat FNA rather than nitrite directly causes the inhibition.
Figure 2b shows that the P-uptake rate decreased sharplywhen the FNA concentration increased even in the low rangeof 0.001–0.002 mg HNO2-N/L, indicating that the FNAinhibition initiates at a concentration of no higher than0.001–0.002 mg HNO2-N/L (lower FNA concentrationswere not tested in this study). The P-uptake rate decreasedby 50% at around 0.005 mg HNO2-N/L compared to thatmeasured at 0.001 mg HNO2-N/L. P-uptake was totallyinhibited when the FNA concentration was greater than0.02 mg HNO2-N/L.
To compare the experimental data obtained in batch testswith different sludges, a mathematical model is sought todescribe the data measured. The trend of the data suggests
that the Andrew’s inhibition model (Andrew, 1968) may beapplicable:
r ¼ rmax
SHNO2
KS þ SHNO2 þS2HNO2
KI
(1)
where r is the P-uptake rate (mg P/(h g VSS)), SHNO2 is theFNA concentration (mg HNO2-N/L). With an assumedaffinity constant (KS) value of 3.1� 10�5 mg HNO2-N/L(Wiesmann, 1994) (this choice will be further discussedbelow), the maximum P-uptake rate (rmax) and theinhibition constant (KI) were estimated to be 2.47 mg P/(h g VSS) and of 1.9� 10�3 mg HNO2-N/L, respectivelyusing the least square algorithm described in Materials andMethods.
The fit produced by the above model with theexperimental data is shown in Figure 2b, which is clearlyunsatisfactory. The following equation, which gives sig-nificantly better fit (also see Fig. 2b), was thus employed toempirically describe the dependency of the P-uptake rate onthe FNA concentration:
r ¼ rmax
SHNO2
KS þ SHNO2
eaSHNO2 (2)
This equation consists of a Monod kinetic term, whichcharacterizes the dependency of r on the concentration ofFNA as a substrate, and also an exponential term to modelthe inhibitory effect of FNA. A similar kinetic expression formodeling substrate inhibition was used in Almeida et al.(1995). Again, with an assumed KS value of 3.1� 10�5 mgHNO2-N/L (Wiesmann, 1994), rmax and a were found to be1.96 mg P/(h g VSS) and �173.4 mg HNO2-N/L,respectively, using the parameter optimization methoddescribed in Materials and Methods. The shape of the 95%confidence region, which is also shown in Figure 2b, impliesthat the two parameters are only slightly correlated.
It is acknowledged that the KS value used was previouslydetermined for other heterotrophic bacteria rather thanspecifically for PAOs. Also, the value was not determineddirectly, but calculated from the KS value for nitrite and pH.However, sensitivity analysis shows that the estimates of rmax
and a are not sensitive to the KS value. For example, theestimated a would increase by only 1.2% when the KS valueis increased by 100%, and decrease by 2.1% when KS isreduced to 10% of the value used. Similar variations in rmax
are also found with these changes in the KS value. Thesensitivity analysis implies that it is not essential todetermine the KS value accurately for the estimation ofrmax and a. Given the fact that this work focuses on theinhibitory effect of FNA on P-uptake, no further effort wasmade to determine KS more accurately.
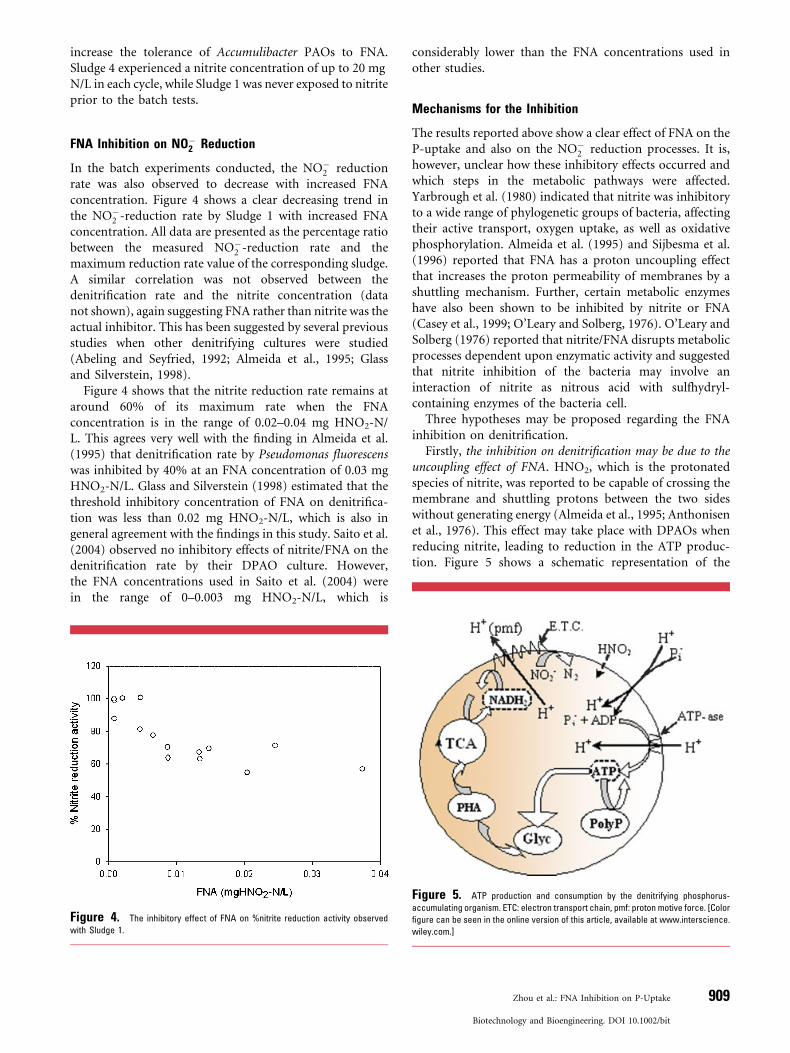
The experimental data obtained with Sludges 2, 3 and 4are presented in Figure 3, where the prediction by Equation(2) is also presented for comparison. All data are presentedas the percentage ratio between the measured P-uptake rate
Zhou et al.: FNA Inhibition on P-Uptake 907
Biotechnology and Bioengineering. DOI 10.1002/bit
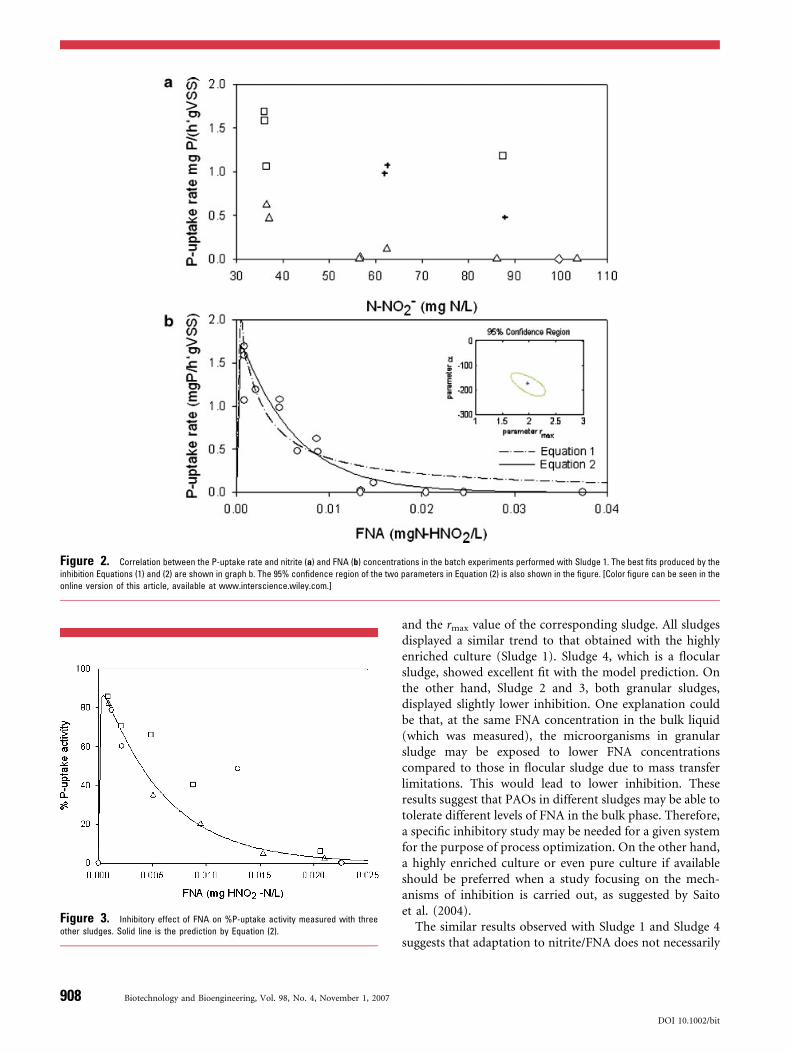
Figure 2. Correlation between the P-uptake rate and nitrite (a) and FNA (b) concentrations in the batch experiments performed with Sludge 1. The best fits produced by the
inhibition Equations (1) and (2) are shown in graph b. The 95% confidence region of the two parameters in Equation (2) is also shown in the figure. [Color figure can be seen in the
online version of this article, available at www.interscience.wiley.com.]
Figure 3. Inhibitory effect of FNA on %P-uptake activity measured with three
other sludges. Solid line is the prediction by Equation (2).
908 Biotechnology and Bioengineering, Vol. 98, No. 4, November 1, 2007
and the rmax value of the corresponding sludge. All sludgesdisplayed a similar trend to that obtained with the highlyenriched culture (Sludge 1). Sludge 4, which is a flocularsludge, showed excellent fit with the model prediction. Onthe other hand, Sludge 2 and 3, both granular sludges,displayed slightly lower inhibition. One explanation couldbe that, at the same FNA concentration in the bulk liquid(which was measured), the microorganisms in granularsludge may be exposed to lower FNA concentrationscompared to those in flocular sludge due to mass transferlimitations. This would lead to lower inhibition. Theseresults suggest that PAOs in different sludges may be able totolerate different levels of FNA in the bulk phase. Therefore,a specific inhibitory study may be needed for a given systemfor the purpose of process optimization. On the other hand,a highly enriched culture or even pure culture if availableshould be preferred when a study focusing on the mech-anisms of inhibition is carried out, as suggested by Saitoet al. (2004).
The similar results observed with Sludge 1 and Sludge 4suggests that adaptation to nitrite/FNA does not necessarily
DOI 10.1002/bit
increase the tolerance of Accumulibacter PAOs to FNA.Sludge 4 experienced a nitrite concentration of up to 20 mgN/L in each cycle, while Sludge 1 was never exposed to nitriteprior to the batch tests.
FNA Inhibition on NO�2 Reduction
In the batch experiments conducted, the NO�2 reduction
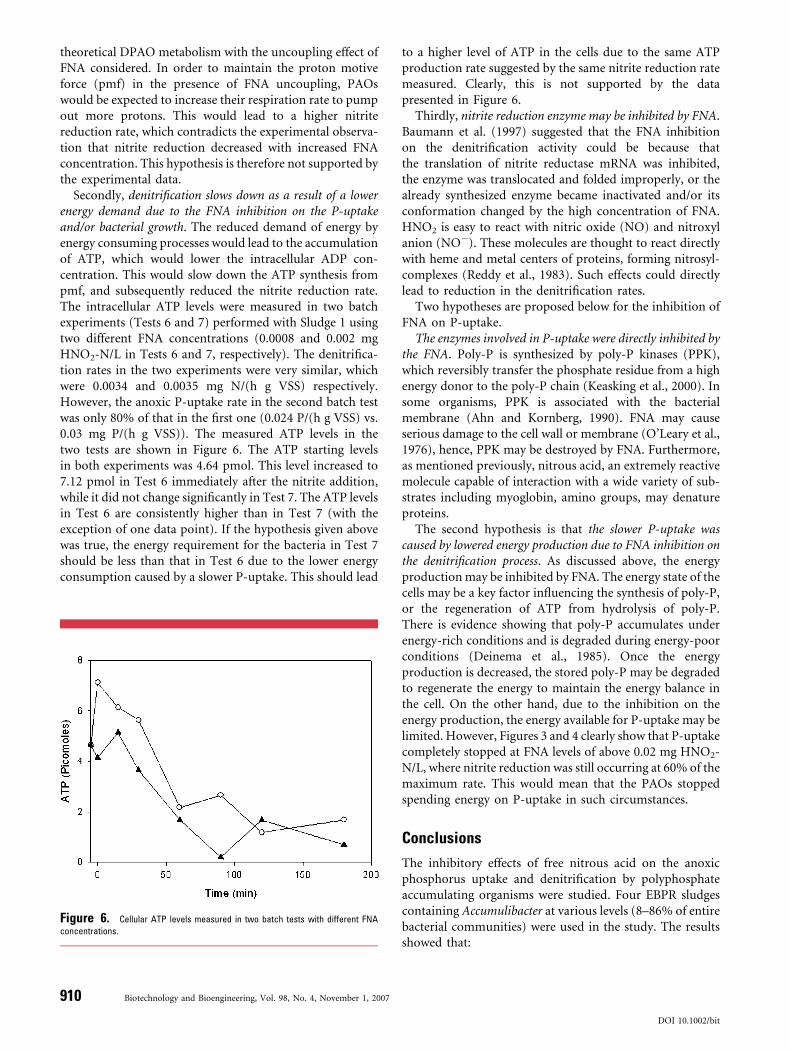
rate was also observed to decrease with increased FNAconcentration. Figure 4 shows a clear decreasing trend inthe NO�
2 -reduction rate by Sludge 1 with increased FNAconcentration. All data are presented as the percentage ratiobetween the measured NO�
2 -reduction rate and themaximum reduction rate value of the corresponding sludge.A similar correlation was not observed between thedenitrification rate and the nitrite concentration (datanot shown), again suggesting FNA rather than nitrite was theactual inhibitor. This has been suggested by several previousstudies when other denitrifying cultures were studied(Abeling and Seyfried, 1992; Almeida et al., 1995; Glassand Silverstein, 1998).
Figure 4 shows that the nitrite reduction rate remains ataround 60% of its maximum rate when the FNAconcentration is in the range of 0.02–0.04 mg HNO2-N/L. This agrees very well with the finding in Almeida et al.(1995) that denitrification rate by Pseudomonas fluorescenswas inhibited by 40% at an FNA concentration of 0.03 mgHNO2-N/L. Glass and Silverstein (1998) estimated that thethreshold inhibitory concentration of FNA on denitrifica-tion was less than 0.02 mg HNO2-N/L, which is also ingeneral agreement with the findings in this study. Saito et al.(2004) observed no inhibitory effects of nitrite/FNA on thedenitrification rate by their DPAO culture. However,the FNA concentrations used in Saito et al. (2004) werein the range of 0–0.003 mg HNO2-N/L, which is
Figure 4. The inhibitory effect of FNA on %nitrite reduction activity observed
with Sludge 1.
considerably lower than the FNA concentrations used inother studies.
Mechanisms for the Inhibition
The results reported above show a clear effect of FNA on theP-uptake and also on the NO�
2 reduction processes. It is,however, unclear how these inhibitory effects occurred andwhich steps in the metabolic pathways were affected.Yarbrough et al. (1980) indicated that nitrite was inhibitoryto a wide range of phylogenetic groups of bacteria, affectingtheir active transport, oxygen uptake, as well as oxidativephosphorylation. Almeida et al. (1995) and Sijbesma et al.(1996) reported that FNA has a proton uncoupling effectthat increases the proton permeability of membranes by ashuttling mechanism. Further, certain metabolic enzymeshave also been shown to be inhibited by nitrite or FNA(Casey et al., 1999; O’Leary and Solberg, 1976). O’Leary andSolberg (1976) reported that nitrite/FNA disrupts metabolicprocesses dependent upon enzymatic activity and suggestedthat nitrite inhibition of the bacteria may involve aninteraction of nitrite as nitrous acid with sulfhydryl-containing enzymes of the bacteria cell.
Three hypotheses may be proposed regarding the FNAinhibition on denitrification.
Firstly, the inhibition on denitrification may be due to theuncoupling effect of FNA. HNO2, which is the protonatedspecies of nitrite, was reported to be capable of crossing themembrane and shuttling protons between the two sideswithout generating energy (Almeida et al., 1995; Anthonisenet al., 1976). This effect may take place with DPAOs whenreducing nitrite, leading to reduction in the ATP produc-tion. Figure 5 shows a schematic representation of the
Figure 5. ATP production and consumption by the denitrifying phosphorus-
accumulating organism. ETC: electron transport chain, pmf: proton motive force. [Color
figure can be seen in the online version of this article, available at www.interscience.
wiley.com.]
Zhou et al.: FNA Inhibition on P-Uptake 909
Biotechnology and Bioengineering. DOI 10.1002/bit
theoretical DPAO metabolism with the uncoupling effect ofFNA considered. In order to maintain the proton motiveforce (pmf) in the presence of FNA uncoupling, PAOswould be expected to increase their respiration rate to pumpout more protons. This would lead to a higher nitritereduction rate, which contradicts the experimental observa-tion that nitrite reduction decreased with increased FNAconcentration. This hypothesis is therefore not supported bythe experimental data.
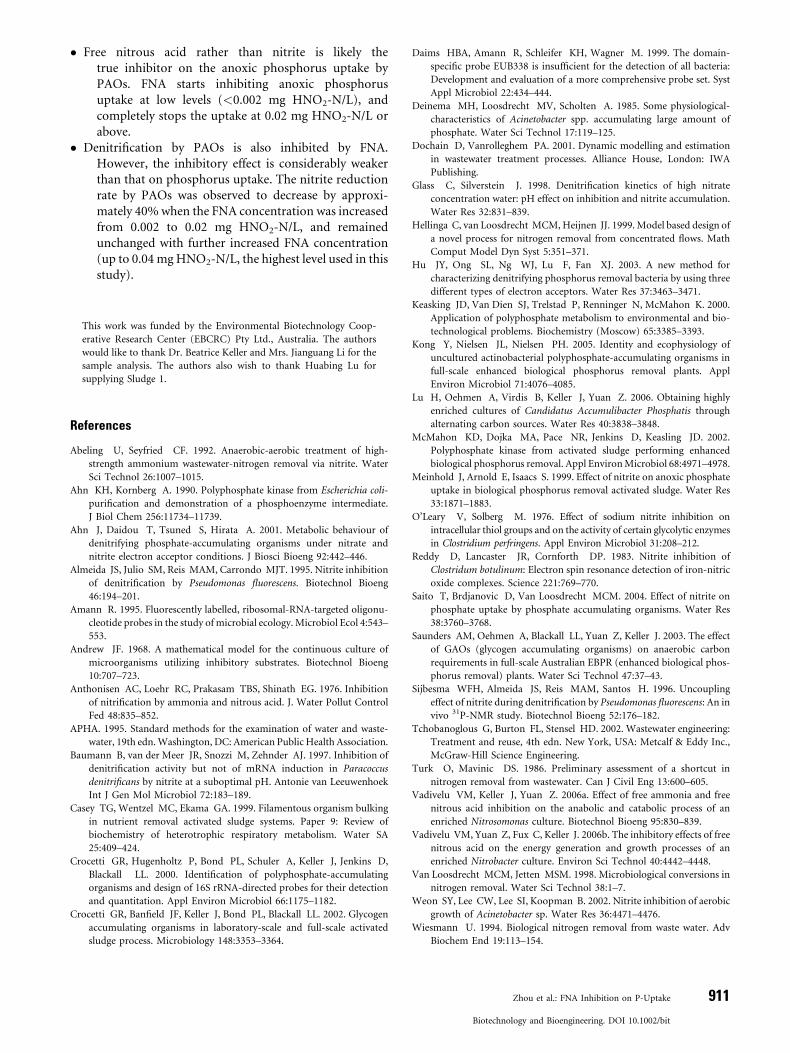
Secondly, denitrification slows down as a result of a lowerenergy demand due to the FNA inhibition on the P-uptakeand/or bacterial growth. The reduced demand of energy byenergy consuming processes would lead to the accumulationof ATP, which would lower the intracellular ADP con-centration. This would slow down the ATP synthesis frompmf, and subsequently reduced the nitrite reduction rate.The intracellular ATP levels were measured in two batchexperiments (Tests 6 and 7) performed with Sludge 1 usingtwo different FNA concentrations (0.0008 and 0.002 mgHNO2-N/L in Tests 6 and 7, respectively). The denitrifica-tion rates in the two experiments were very similar, whichwere 0.0034 and 0.0035 mg N/(h g VSS) respectively.However, the anoxic P-uptake rate in the second batch testwas only 80% of that in the first one (0.024 P/(h g VSS) vs.0.03 mg P/(h g VSS)). The measured ATP levels in thetwo tests are shown in Figure 6. The ATP starting levelsin both experiments was 4.64 pmol. This level increased to7.12 pmol in Test 6 immediately after the nitrite addition,while it did not change significantly in Test 7. The ATP levelsin Test 6 are consistently higher than in Test 7 (with theexception of one data point). If the hypothesis given abovewas true, the energy requirement for the bacteria in Test 7should be less than that in Test 6 due to the lower energyconsumption caused by a slower P-uptake. This should lead
Figure 6. Cellular ATP levels measured in two batch tests with different FNA
concentrations.
910 Biotechnology and Bioengineering, Vol. 98, No. 4, November 1, 2007
to a higher level of ATP in the cells due to the same ATPproduction rate suggested by the same nitrite reduction ratemeasured. Clearly, this is not supported by the datapresented in Figure 6.
Thirdly, nitrite reduction enzyme may be inhibited by FNA.Baumann et al. (1997) suggested that the FNA inhibitionon the denitrification activity could be because thatthe translation of nitrite reductase mRNA was inhibited,the enzyme was translocated and folded improperly, or thealready synthesized enzyme became inactivated and/or itsconformation changed by the high concentration of FNA.HNO2 is easy to react with nitric oxide (NO) and nitroxylanion (NO�). These molecules are thought to react directlywith heme and metal centers of proteins, forming nitrosyl-complexes (Reddy et al., 1983). Such effects could directlylead to reduction in the denitrification rates.
Two hypotheses are proposed below for the inhibition ofFNA on P-uptake.
The enzymes involved in P-uptake were directly inhibited bythe FNA. Poly-P is synthesized by poly-P kinases (PPK),which reversibly transfer the phosphate residue from a highenergy donor to the poly-P chain (Keasking et al., 2000). Insome organisms, PPK is associated with the bacterialmembrane (Ahn and Kornberg, 1990). FNA may causeserious damage to the cell wall or membrane (O’Leary et al.,1976), hence, PPK may be destroyed by FNA. Furthermore,as mentioned previously, nitrous acid, an extremely reactivemolecule capable of interaction with a wide variety of sub-strates including myoglobin, amino groups, may denatureproteins.
The second hypothesis is that the slower P-uptake wascaused by lowered energy production due to FNA inhibition onthe denitrification process. As discussed above, the energyproduction may be inhibited by FNA. The energy state of thecells may be a key factor influencing the synthesis of poly-P,or the regeneration of ATP from hydrolysis of poly-P.There is evidence showing that poly-P accumulates underenergy-rich conditions and is degraded during energy-poorconditions (Deinema et al., 1985). Once the energyproduction is decreased, the stored poly-P may be degradedto regenerate the energy to maintain the energy balance inthe cell. On the other hand, due to the inhibition on theenergy production, the energy available for P-uptake may belimited. However, Figures 3 and 4 clearly show that P-uptakecompletely stopped at FNA levels of above 0.02 mg HNO2-N/L, where nitrite reduction was still occurring at 60% of themaximum rate. This would mean that the PAOs stoppedspending energy on P-uptake in such circumstances.
Conclusions
The inhibitory effects of free nitrous acid on the anoxicphosphorus uptake and denitrification by polyphosphateaccumulating organisms were studied. Four EBPR sludgescontaining Accumulibacter at various levels (8–86% of entirebacterial communities) were used in the study. The resultsshowed that:
DOI 10.1002/bit
� F
ree nitrous acid rather than nitrite is likely thetrue inhibitor on the anoxic phosphorus uptake byPAOs. FNA starts inhibiting anoxic phosphorusuptake at low levels (<0.002 mg HNO2-N/L), andcompletely stops the uptake at 0.02 mg HNO2-N/L orabove.� D
enitrification by PAOs is also inhibited by FNA.However, the inhibitory effect is considerably weakerthan that on phosphorus uptake. The nitrite reductionrate by PAOs was observed to decrease by approxi-mately 40% when the FNA concentration was increasedfrom 0.002 to 0.02 mg HNO2-N/L, and remainedunchanged with further increased FNA concentration(up to 0.04 mg HNO2-N/L, the highest level used in thisstudy).This work was funded by the Environmental Biotechnology Coop-
erative Research Center (EBCRC) Pty Ltd., Australia. The authors
would like to thank Dr. Beatrice Keller and Mrs. Jianguang Li for the
sample analysis. The authors also wish to thank Huabing Lu for
supplying Sludge 1.
References
Abeling U, Seyfried CF. 1992. Anaerobic-aerobic treatment of high-
strength ammonium wastewater-nitrogen removal via nitrite. Water
Sci Technol 26:1007–1015.
Ahn KH, Kornberg A. 1990. Polyphosphate kinase from Escherichia coli-
purification and demonstration of a phosphoenzyme intermediate.
J Biol Chem 256:11734–11739.
Ahn J, Daidou T, Tsuned S, Hirata A. 2001. Metabolic behaviour of
denitrifying phosphate-accumulating organisms under nitrate and
nitrite electron acceptor conditions. J Biosci Bioeng 92:442–446.
Almeida JS, Julio SM, Reis MAM, Carrondo MJT. 1995. Nitrite inhibition
of denitrification by Pseudomonas fluorescens. Biotechnol Bioeng
46:194–201.
Amann R. 1995. Fluorescently labelled, ribosomal-RNA-targeted oligonu-
cleotide probes in the study of microbial ecology. Microbiol Ecol 4:543–
553.
Andrew JF. 1968. A mathematical model for the continuous culture of
microorganisms utilizing inhibitory substrates. Biotechnol Bioeng
10:707–723.
Anthonisen AC, Loehr RC, Prakasam TBS, Shinath EG. 1976. Inhibition
of nitrification by ammonia and nitrous acid. J. Water Pollut Control
Fed 48:835–852.
APHA. 1995. Standard methods for the examination of water and waste-
water, 19th edn. Washington, DC: American Public Health Association.
Baumann B, van der Meer JR, Snozzi M, Zehnder AJ. 1997. Inhibition of
denitrification activity but not of mRNA induction in Paracoccus
denitrificans by nitrite at a suboptimal pH. Antonie van Leeuwenhoek
Int J Gen Mol Microbiol 72:183–189.
Casey TG, Wentzel MC, Ekama GA. 1999. Filamentous organism bulking
in nutrient removal activated sludge systems. Paper 9: Review of
biochemistry of heterotrophic respiratory metabolism. Water SA
25:409–424.
Crocetti GR, Hugenholtz P, Bond PL, Schuler A, Keller J, Jenkins D,
Blackall LL. 2000. Identification of polyphosphate-accumulating
organisms and design of 16S rRNA-directed probes for their detection
and quantitation. Appl Environ Microbiol 66:1175–1182.
Crocetti GR, Banfield JF, Keller J, Bond PL, Blackall LL. 2002. Glycogen
accumulating organisms in laboratory-scale and full-scale activated
sludge process. Microbiology 148:3353–3364.
Daims HBA, Amann R, Schleifer KH, Wagner M. 1999. The domain-
specific probe EUB338 is insufficient for the detection of all bacteria:
Development and evaluation of a more comprehensive probe set. Syst
Appl Microbiol 22:434–444.
Deinema MH, Loosdrecht MV, Scholten A. 1985. Some physiological-
characteristics of Acinetobacter spp. accumulating large amount of
phosphate. Water Sci Technol 17:119–125.
Dochain D, Vanrolleghem PA. 2001. Dynamic modelling and estimation
in wastewater treatment processes. Alliance House, London: IWA
Publishing.
Glass C, Silverstein J. 1998. Denitrification kinetics of high nitrate
concentration water: pH effect on inhibition and nitrite accumulation.
Water Res 32:831–839.
Hellinga C, van Loosdrecht MCM, Heijnen JJ. 1999. Model based design of
a novel process for nitrogen removal from concentrated flows. Math
Comput Model Dyn Syst 5:351–371.
Hu JY, Ong SL, Ng WJ, Lu F, Fan XJ. 2003. A new method for
characterizing denitrifying phosphorus removal bacteria by using three
different types of electron acceptors. Water Res 37:3463–3471.
Keasking JD, Van Dien SJ, Trelstad P, Renninger N, McMahon K. 2000.
Application of polyphosphate metabolism to environmental and bio-
technological problems. Biochemistry (Moscow) 65:3385–3393.
Kong Y, Nielsen JL, Nielsen PH. 2005. Identity and ecophysiology of
uncultured actinobacterial polyphosphate-accumulating organisms in
full-scale enhanced biological phosphorus removal plants. Appl
Environ Microbiol 71:4076–4085.
Lu H, Oehmen A, Virdis B, Keller J, Yuan Z. 2006. Obtaining highly
enriched cultures of Candidatus Accumulibacter Phosphatis through
alternating carbon sources. Water Res 40:3838–3848.
McMahon KD, Dojka MA, Pace NR, Jenkins D, Keasling JD. 2002.
Polyphosphate kinase from activated sludge performing enhanced
biological phosphorus removal. Appl Environ Microbiol 68:4971–4978.
Meinhold J, Arnold E, Isaacs S. 1999. Effect of nitrite on anoxic phosphate
uptake in biological phosphorus removal activated sludge. Water Res
33:1871–1883.
O’Leary V, Solberg M. 1976. Effect of sodium nitrite inhibition on
intracellular thiol groups and on the activity of certain glycolytic enzymes
in Clostridium perfringens. Appl Environ Microbiol 31:208–212.
Reddy D, Lancaster JR, Cornforth DP. 1983. Nitrite inhibition of
Clostridum botulinum: Electron spin resonance detection of iron-nitric
oxide complexes. Science 221:769–770.
Saito T, Brdjanovic D, Van Loosdrecht MCM. 2004. Effect of nitrite on
phosphate uptake by phosphate accumulating organisms. Water Res
38:3760–3768.
Saunders AM, Oehmen A, Blackall LL, Yuan Z, Keller J. 2003. The effect
of GAOs (glycogen accumulating organisms) on anaerobic carbon
requirements in full-scale Australian EBPR (enhanced biological phos-
phorus removal) plants. Water Sci Technol 47:37–43.
Sijbesma WFH, Almeida JS, Reis MAM, Santos H. 1996. Uncoupling
effect of nitrite during denitrification by Pseudomonas fluorescens: An in
vivo 31P-NMR study. Biotechnol Bioeng 52:176–182.
Tchobanoglous G, Burton FL, Stensel HD. 2002. Wastewater engineering:
Treatment and reuse, 4th edn. New York, USA: Metcalf & Eddy Inc.,
McGraw-Hill Science Engineering.
Turk O, Mavinic DS. 1986. Preliminary assessment of a shortcut in
nitrogen removal from wastewater. Can J Civil Eng 13:600–605.
Vadivelu VM, Keller J, Yuan Z. 2006a. Effect of free ammonia and free
nitrous acid inhibition on the anabolic and catabolic process of an
enriched Nitrosomonas culture. Biotechnol Bioeng 95:830–839.
Vadivelu VM, Yuan Z, Fux C, Keller J. 2006b. The inhibitory effects of free
nitrous acid on the energy generation and growth processes of an
enriched Nitrobacter culture. Environ Sci Technol 40:4442–4448.
Van Loosdrecht MCM, Jetten MSM. 1998. Microbiological conversions in
nitrogen removal. Water Sci Technol 38:1–7.
Weon SY, Lee CW, Lee SI, Koopman B. 2002. Nitrite inhibition of aerobic
growth of Acinetobacter sp. Water Res 36:4471–4476.
Wiesmann U. 1994. Biological nitrogen removal from waste water. Adv
Biochem End 19:113–154.
Zhou et al.: FNA Inhibition on P-Uptake 911
Biotechnology and Bioengineering. DOI 10.1002/bit
Wong MT. Tan FM, Ng WJ, Liu WT, 2004. Identification and occurrence
of tetrad-forming Alphaproteobacteria in anaerobic-aerobic activated
sludge process. Microbiology 150:3741–3748.
Yarbrough JM. Rake JB. Eagon RG. 1980. Bacterial inhibition effects
of nitrite: inhibition of active transport, but not of group trans-
location, and of intracellular enzymes. Appl Environ Microbiol 39:
831–834.
912 Biotechnology and Bioengineering, Vol. 98, No. 4, November 1, 2007
Zeng RJ, Saunders AM, Yuan Z, Blackall LL, Keller J. 2003. Identification
and comparison of aerobic and denitrifying polyphosphate-accumu-
lating organisms. Biotechnol Bioeng 83:140–148.
Zhou Y, Pijuan M, Yuan Z. 2007. Development of a 2-sludge, 3-stage
system for nitrogen and phosphorus removal from high-strength
wastewater using granular sludge and biofilms. Proceedings of the
Nutrient Removal Conference-The State of Art 2007, March 4–7.
DOI 10.1002/bit