Embed Size (px)
Citation preview
Free energy of hydration and heat capacity of calcium dipicolinate in Bacillus sporecoresAnkit Mishra, Aravind Krishnamoorthy, Pankaj Rajak, Subodh Tiwari, Chunyang Sheng, Rajiv K. Kalia, AiichiroNakano, and Priya Vashishta
Citation: Appl. Phys. Lett. 113, 113702 (2018); doi: 10.1063/1.5048507View online: https://doi.org/10.1063/1.5048507View Table of Contents: http://aip.scitation.org/toc/apl/113/11Published by the American Institute of Physics
Free energy of hydration and heat capacity of calcium dipicolinate in Bacillusspore cores
Ankit Mishra, Aravind Krishnamoorthy, Pankaj Rajak, Subodh Tiwari, Chunyang Sheng,Rajiv K. Kalia, Aiichiro Nakano, and Priya Vashishtaa)
Collaboratory for Advanced Computing and Simulations, University of Southern California, Los Angeles,California 90089, USA
(Received 15 July 2018; accepted 29 August 2018; published online 12 September 2018)
Wet heat treatments are widely used sterilization techniques for inactivating dangerous and
resistant sporulating bacteria. The effectiveness of such treatments depends upon the
thermodynamics of water uptake by the spore as well as the kinetics of phase transformations in
the hydrated spore core. The mechanism behind these chemical and physical processes remains
unknown because the thermodynamic properties of the spore core constituents are not well
understood. Here, we use reactive molecular dynamics simulations to calculate the vibrational
density of states and specific heat of hydrated calcium dipicolinate as well as the free energy of
hydration based on Jarzynski’s inequality. These two quantities are used to construct a phase
diagram of hydrated calcium dipicolinate, indicating the extent of hydration at different pressures
and temperatures, which can be used to identify potential regimes for wet-heat sterilization of bac-
terial spores. VC 2018 Author(s). All article content, except where otherwise noted, is licensed undera Creative Commons Attribution (CC BY) license (http://creativecommons.org/licenses/by/4.0/).https://doi.org/10.1063/1.5048507
Sporulation is a common defense mechanism in several
bacterial species in response to low nutrient levels and adverse
thermal, mechanical, and chemical environments.1,2 The
extraordinary resilience of bacterial spores permits them to
overcome severe physical and chemical stresses and persist in
a state of dormancy for extended periods of time ranging from
a few days to millions of years.3,4 This process of sporulation
and subsequent re-germination of bacteria after exposure to
sub-lethal stresses is of intense interest for strategic applica-
tions in the defense industry and of considerable commercial
interest to the food preparation and preservation industries.5
Wet-heat treatments like boiling, steaming, and autoclaving
are the most commonly employed strategies to inactivate bac-
terial spores and prevent their re-germination. These steriliza-
tion techniques rely on the interplay of high temperature and
increased water content in the cores of bacterial spores which
contain metabolic enzymes, proteins, genetic materials, and
salts of dipicolinic acid (DPA) with a divalent cation such as
Ca2þ, Mg2þ, and Mn2þ.6–9 Among these, DPA chelated with
the Ca2þ cation to form calcium dipicolinate (Ca-DPA) is
considered to be mechanistically important for the dormancy,
heat resistance, and germination of spores.10–14 Specifically,
experiments involving chemical assays, attenuated total reflec-
tion Fourier transform infrared spectroscopy, and laser twee-
zers Raman spectroscopy15,16 have identified the presence of
Ca-DPA in the spore core matrix as being responsible for the
dormancy of the spore core. Further, there is a correlation
between the release of Ca-DPA from the spore core and sub-
sequent spore death due to exposure to high pressure, temper-
ature, wet-heat, and chemical agents.13,17,18
It has been hypothesized that the heat resistance of
spores arises from suppressed enzymatic activity and protein
agglomeration resulting from decreased diffusivity of the
spore core matrix containing Ca-DPA in a glassy phase.19
This is supported by a recent computational study which
showed that environmental conditions corresponding to
spore death coincide with conditions where the spore core is
in a gel-like or molten phase.20 The extent of spore-core
hydration was found to be a critical parameter that controls
the temperature for the onset of solid-molten phase transfor-
mation and is therefore important for the wet-heat death of
spores. The extent of hydration depends on the thermody-
namics of water uptake, which is difficult to characterize
experimentally.
In this paper, we use reactive molecular dynamics
(RMD) simulations to calculate thermodynamic properties
relevant to the wet-heat treatment process such as the free
energy of Ca-DPA hydration and the heat capacity of the
hydrated Ca-DPA crystal. Various approaches have been
used for accelerated sampling and mapping of free energy
landscape using molecular simulations.21 The free energies
of hydration, computed here using a non-equilibrium calcu-
lation methodology, show monotonically increasing behavior
with increasing hydration of the Ca-DPA in the spore core.
However, the specific heat capacity contribution of added
water to Ca-DPA decreases with hydration. These two ther-
modynamic properties are used to construct a phase diagram
of the spore core showing the extent of hydration at different
pressures and temperatures, which can be used to identify
potential regimes for wet-heat sterilization.
We use RMD simulations based on first-principles
derived reactive force field (ReaxFF)22–24 to calculate the
specific heat and free energy of hydration of the Ca-DPA
crystal. For notational brevity, Ca-DPA implies the [Ca-
DPA.3H2O]4 crystal. This force field was developed to
reproduce physical properties like lattice constants of thea)Author to whom correspondence should be addressed: [email protected]
0003-6951/2018/113(11)/113702/5 VC Author(s) 2018.113, 113702-1
APPLIED PHYSICS LETTERS 113, 113702 (2018)

[Ca-DPA.3H2O]4 crystal.20 Figure 1 shows the unit cell of
the Ca-DPA crystal containing four Ca2þ ions and four DPA
molecules along with twelve water molecules that are bound
to Ca2þ ions. The crystal structure of the native form of cal-
cium dipicolinate, [Ca-DPA.3H2O]4, which is found in the
core of unhydrated spores, contains two types of H2O mole-
cules that differ in the number of calcium ions in their coor-
dination shell.25 We refer to H2O molecules coordinated to
one and two calcium ions as H2O1 and H2O2, respectively.
Addition of excess water molecules increases the level of
hydration of the Ca-DPA crystal, leading to the formation of
[Ca-DPA�3H2O]4 þ nH2O—where n defines the number of
added water molecules per unit cell. We refer to the added
excess water molecules as H2O0 to denote that they are not
bonded to any of the Ca2þ ions in the Ca-DPA crystal. These
unbound water molecules occupy interstitial spaces within
the crystal. We refer to the oxygen atoms in the H2O1, H2O2,
and H2O0 as O1, O2, and O0, respectively. Oxygen atoms
that are part of the Ca-DPA molecule (i.e., do not belong to a
water molecule) are denoted as ODPA.
Hydrated Ca-DPA systems (containing 23.50, 25.99,
29.43, 31.55, and 33.54 wt. % water) are prepared by adding
2, 4, 7, 9, and 11 water molecules, respectively, per unit cell
to the Ca-DPA crystal that already contains 12 bound water
molecules. Zero-pressure configurations of these systems are
obtained by first adding the corresponding number of excess
water molecules to the [Ca-DPA.3H2O]4 unit cells, which
are then expanded in volume and thermalized to obtain zero-
pressure states at room temperature. These thermalized sys-
tems are discussed in detail in the supplementary material
and serve as initial configurations for the calculation of both
the heat capacity and the free energy of hydration as
described in subsequent paragraphs.
The zero pressure configurations obtained at a tempera-
ture of 300 K with n¼ 0, 2, 4, 7, 9, and 11 waters in [Ca-
DPA�3H2O]4 þ nH2O are slowly cooled to 100 K in steps of
50 K. The velocity information from a 6 ps long RMD trajec-
tory in the NVE ensemble is used to calculate normalized
velocity auto correlation functions (VACF) for various spe-
cies (C, H, O, N, and Ca atoms of Ca-DPA and H and O
atoms of H2O0, H2O1, and H2O2) using the following
equation:
Za ¼~via 0ð Þ:~via tð Þ� �~via 0ð Þ:~via 0ð Þ� � : (1)
In the above equation, Za is the VACF for species a, and
viaðtÞ is the velocity of the ith atom of species a at time t and
brackets denote the average over atom and time origins.
From the VACF, we calculate the partial vibrational density
of states26 (pDOS), GaðxÞ, for the different species men-
tioned above using Eq. (2). The total vibrational density of
states, GðxÞ, of the Ca-DPA crystal is a sum of the pDOS
for different species [Eq. (3)]
Ga xð Þ ¼ 6Na
p
ð10
Za tð Þcos xtð Þdt; (2)
G xð Þ ¼X
a
Ga xð Þ: (3)
Density of states is calculated at a relatively low temperature
of 100 K in order to preclude any long-range diffusion of
added water which could affect the calculation of velocity
autocorrelation functions. The total density of states for two
representative hydrations, n¼ 0, 11 (i.e., [Ca-DPA.3H2O]4
and [Ca-DPA.3H2O]4þ 11 H2O), is shown in Fig. 2.
Vibrational density of states for other hydration values is plot-
ted in the supplementary material. The main features of the
calculated vibrational density of states in Fig. 2(a) are in quali-
tative agreement with the experimental Raman and IR spectra
of the [Ca-DPA.3H2O]4.8,9 A comparison of Figs. 2(a) and
2(b) indicates that the main difference between the vibrational
density of states of the hydrated and unhydrated Ca-DPA
arises from the contribution of 11 excess water molecules.
Using the pDOS calculated above in Eqs. (2) and (3), we
calculate partial heat capacities (at constant volume) per mole
of each atomic species, a, present in [Ca-DPA.3H2O]4þ nH2O.
The specific heat of different molecules like Ca-DPA, H2O2,
and H2O0 can be computed as the stoichiometric sum of the par-
tial heat capacities of component atomic species
Cv ¼3NkB
ð10
u2eu
eu � 1ð Þ2G xð Þdx
ð10
G xð Þdx; (4)
where u ¼ �hx=kBT and kB is the Boltzmann constant.
The computed heat capacity values for different constit-
uents of the [Ca-DPA.3H2O]4 þ nH2O system are shown in
Fig. 3. The heat capacities of the Ca-DPA molecule and the
(singly and doubly) bonded water molecules are higher in
the hydrated system at all temperatures, reflecting the rela-
tively weak bonding of excess water molecules.
Figure 4 shows the average heat capacity per water mol-
ecule in the hydrated Ca-DPA as a function of water content.
The heat capacity decreases monotonically from 36 J mol�1
K�1 in [Ca-DPA.3H2O]4 þ 2H2O to 32 J mol�1 K�1 in [Ca-
DPA.3H2O]4 þ 11 H2O, approximately equal to that of bulk
water in ice-Ih,27 suggesting that water uptake detrimentally
affects the heat resistance of spore cores.
FIG. 1. [Ca-DPA.3H2O]4 þ 11 H2O configuration corresponding to addition
of 11 additional water to the unit cell (black) with a water content of
33.54 wt. % H2O. The oxygen atoms corresponding to singly (O1) and dou-
bly (O2) coordinated water molecules with calcium of Ca-DPA are
highlighted in yellow and magenta, respectively. The oxygen atom of added
water O0 is highlighted in green.
113702-2 Mishra et al. Appl. Phys. Lett. 113, 113702 (2018)

Another important thermodynamic metric for the hydra-
tion process is the free energy of hydration, which quantifies
the susceptibility of the spore core to undergo hydration (i.e.,
absorption of water molecules from the environment) or
dehydration (i.e., release of water molecules from the
hydrated spore core) under given P-T conditions. Hydration
free energy was calculated using Jarzynski’s method28–30
[Eq. (5)], which relates the free energy difference between
two systems, DF, to the ensemble average of the work done,
W, along a finite MD trajectory connecting the two systems
DF ¼ �kBT � ln e� W
kBT
� �: (5)
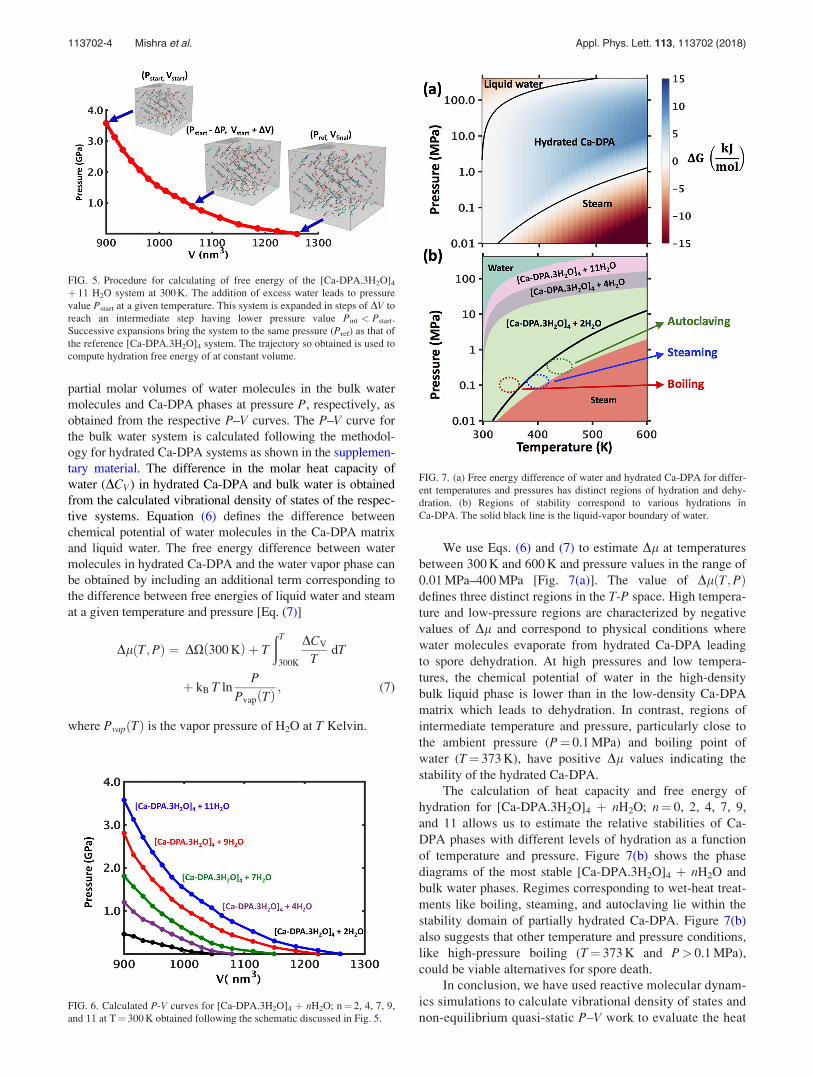
The work done during the addition of water molecules to the
Ca-DPA crystal is calculated as follows. Addition of water
to the zero-pressure [Ca-DPA.3H2O]4 crystal at constant vol-
ume to form [Ca-DPA.3H2O]4 þ nH2O leads to an increase
in pressure to a value of Pstart. This system is expanded in
incremental steps of DV and thermalized at this volume to
obtain several intermediate values of pressure Pint < Pstart.
This volume expansion process is continued until the system
pressure reduces to the initial value of Pref ¼ 0 GPa. The
area under the P-V curve so constructed defines the non-
equilibrium work W, performed during hydration of the [Ca-
DPA.3H2O]4 crystal at constant volume, as shown in Fig. 5.
Based on the calculation methodology discussed above,
we compute P-V curves for Ca-DPA systems at different lev-
els of hydration corresponding to temperatures between
273 K and 368 K. The P-V curve for 300 K is shown in Fig.
6. P–V curves at different temperatures for systems with
n¼ 2, 4, 7, and 9 added water are reported in the supplemen-
tary material. The calculated free energy of hydration
increases with increasing hydration and decreases with
increasing temperature for a given value of hydration, within
the temperature range considered here (273 K–368 K).
The specific heat and free energy of hydration are used
to estimate Dl, the difference in chemical potential of water
molecules in the Ca-DPA matrix and in bulk liquid water at
a constant temperature and pressure. A positive value of Dlindicates that water molecules flow from the bulk liquid
water into the Ca-DPA matrix leading to hydration of the
spore core. Conversely, a negative value of Dl indicates that
water preferentially leaves the Ca-DPA matrix for the bulk
liquid water phase leading to spore dehydration. We estimate
the difference in water chemical potential using the follow-
ing equation:
Dl T;Pð Þ ¼ DX 300 Kð Þ þ T
ðT
300K
DCV
TdT; (6)
where Dl T;Pð Þ is the calculated difference in chemical
potential, and DX is the difference in grand canonical free
energy; X ¼ �PV of water molecules, given by
DX ¼ P � Vwat Pð Þ � VDPAðPÞ� �
. Vwat Pð Þ and VDPA Pð Þ are the
FIG. 2. Total vibrational density of states for (a) [Ca-DPA.3H2O]4 and (b)
[Ca-DPA.3H2O]4 þ11 H2O (33.54 wt. % water) systems. The difference
between the DOS profiles, shown in gray in (b), is due to contributions from
the addition of water.
FIG. 3. Partial heat capacities of (a) Ca-DPA, (b) H2O1, (c) H2O2, and (d)
H2O0. The red curves are computed per mole of un-hydrated [Ca-
DPA.3H2O]4 crystal that has Ca-DPA, H2O1, and H2O2. Blue curves are com-
puted per mole of the hydrated [Ca-DPA.3H2O]4 þ 11H2O system where
H2O0 is added. Contributions of Ca-DPA, H2O1, and H2O2 increase slightly
upon hydration, but the main difference arises from excess added water H2O0.
FIG. 4. Specific heat per mole of added excess water in [Ca-DPA.3H2O]4
þ nH2O as a function of total water content.
113702-3 Mishra et al. Appl. Phys. Lett. 113, 113702 (2018)
partial molar volumes of water molecules in the bulk water
molecules and Ca-DPA phases at pressure P, respectively, as
obtained from the respective P–V curves. The P–V curve for
the bulk water system is calculated following the methodol-
ogy for hydrated Ca-DPA systems as shown in the supplemen-
tary material. The difference in the molar heat capacity of
water (DCV) in hydrated Ca-DPA and bulk water is obtained
from the calculated vibrational density of states of the respec-
tive systems. Equation (6) defines the difference between
chemical potential of water molecules in the Ca-DPA matrix
and liquid water. The free energy difference between water
molecules in hydrated Ca-DPA and the water vapor phase can
be obtained by including an additional term corresponding to
the difference between free energies of liquid water and steam
at a given temperature and pressure [Eq. (7)]
Dl T;Pð Þ ¼ DX 300 Kð Þ þ T
ðT
300K
DCV
TdT
þ kB T lnP
Pvap Tð Þ ; (7)
where PvapðTÞ is the vapor pressure of H2O at T Kelvin.
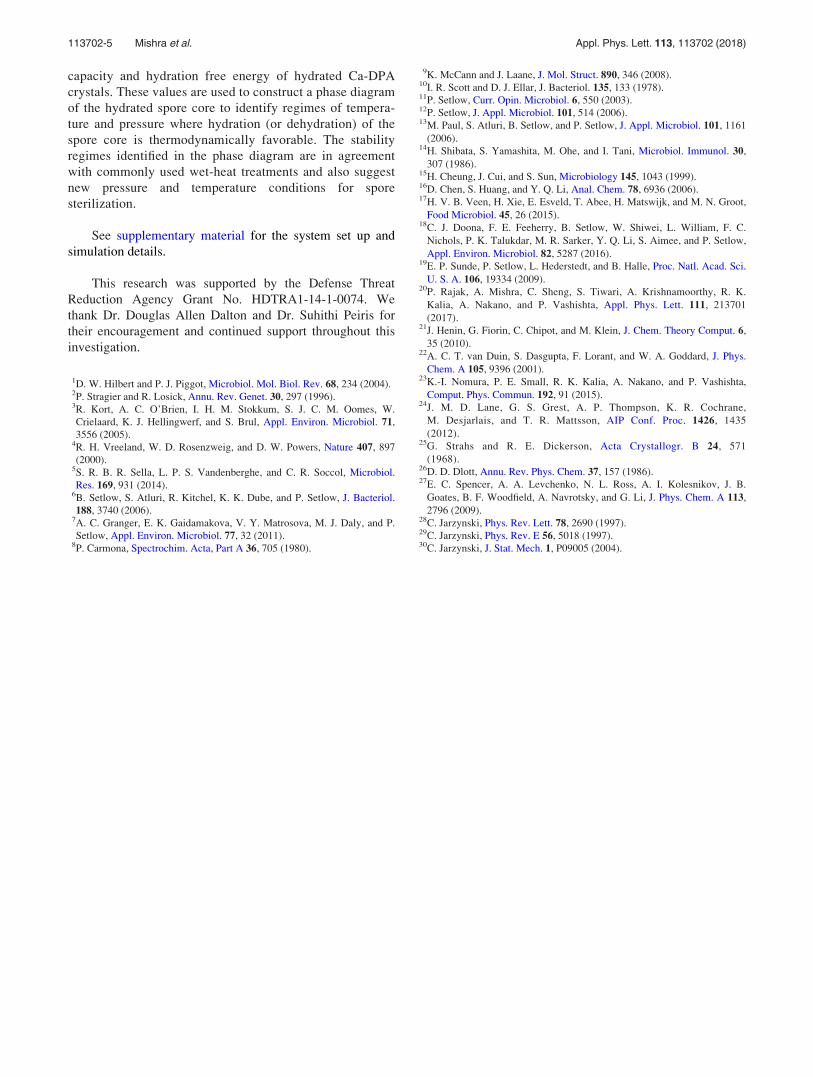
We use Eqs. (6) and (7) to estimate Dl at temperatures
between 300 K and 600 K and pressure values in the range of
0.01 MPa–400 MPa [Fig. 7(a)]. The value of DlðT;PÞdefines three distinct regions in the T-P space. High tempera-
ture and low-pressure regions are characterized by negative
values of Dl and correspond to physical conditions where
water molecules evaporate from hydrated Ca-DPA leading
to spore dehydration. At high pressures and low tempera-
tures, the chemical potential of water in the high-density
bulk liquid phase is lower than in the low-density Ca-DPA
matrix which leads to dehydration. In contrast, regions of
intermediate temperature and pressure, particularly close to
the ambient pressure (P¼ 0.1 MPa) and boiling point of
water (T¼ 373 K), have positive Dl values indicating the
stability of the hydrated Ca-DPA.
The calculation of heat capacity and free energy of
hydration for [Ca-DPA.3H2O]4 þ nH2O; n¼ 0, 2, 4, 7, 9,
and 11 allows us to estimate the relative stabilities of Ca-
DPA phases with different levels of hydration as a function
of temperature and pressure. Figure 7(b) shows the phase
diagrams of the most stable [Ca-DPA.3H2O]4 þ nH2O and
bulk water phases. Regimes corresponding to wet-heat treat-
ments like boiling, steaming, and autoclaving lie within the
stability domain of partially hydrated Ca-DPA. Figure 7(b)
also suggests that other temperature and pressure conditions,
like high-pressure boiling (T¼ 373 K and P> 0.1 MPa),
could be viable alternatives for spore death.
In conclusion, we have used reactive molecular dynam-
ics simulations to calculate vibrational density of states and
non-equilibrium quasi-static P–V work to evaluate the heat
FIG. 5. Procedure for calculating of free energy of the [Ca-DPA.3H2O]4
þ 11 H2O system at 300 K. The addition of excess water leads to pressure
value Pstart at a given temperature. This system is expanded in steps of DV to
reach an intermediate step having lower pressure value Pint < Pstart.
Successive expansions bring the system to the same pressure (Pref) as that of
the reference [Ca-DPA.3H2O]4 system. The trajectory so obtained is used to
compute hydration free energy of at constant volume.
FIG. 6. Calculated P-V curves for [Ca-DPA.3H2O]4 þ nH2O; n¼ 2, 4, 7, 9,
and 11 at T¼ 300 K obtained following the schematic discussed in Fig. 5.
FIG. 7. (a) Free energy difference of water and hydrated Ca-DPA for differ-
ent temperatures and pressures has distinct regions of hydration and dehy-
dration. (b) Regions of stability correspond to various hydrations in
Ca-DPA. The solid black line is the liquid-vapor boundary of water.
113702-4 Mishra et al. Appl. Phys. Lett. 113, 113702 (2018)
capacity and hydration free energy of hydrated Ca-DPA
crystals. These values are used to construct a phase diagram
of the hydrated spore core to identify regimes of tempera-
ture and pressure where hydration (or dehydration) of the
spore core is thermodynamically favorable. The stability
regimes identified in the phase diagram are in agreement
with commonly used wet-heat treatments and also suggest
new pressure and temperature conditions for spore
sterilization.
See supplementary material for the system set up and
simulation details.
This research was supported by the Defense Threat
Reduction Agency Grant No. HDTRA1-14-1-0074. We
thank Dr. Douglas Allen Dalton and Dr. Suhithi Peiris for
their encouragement and continued support throughout this
investigation.
1D. W. Hilbert and P. J. Piggot, Microbiol. Mol. Biol. Rev. 68, 234 (2004).2P. Stragier and R. Losick, Annu. Rev. Genet. 30, 297 (1996).3R. Kort, A. C. O’Brien, I. H. M. Stokkum, S. J. C. M. Oomes, W.
Crielaard, K. J. Hellingwerf, and S. Brul, Appl. Environ. Microbiol. 71,
3556 (2005).4R. H. Vreeland, W. D. Rosenzweig, and D. W. Powers, Nature 407, 897
(2000).5S. R. B. R. Sella, L. P. S. Vandenberghe, and C. R. Soccol, Microbiol.
Res. 169, 931 (2014).6B. Setlow, S. Atluri, R. Kitchel, K. K. Dube, and P. Setlow, J. Bacteriol.
188, 3740 (2006).7A. C. Granger, E. K. Gaidamakova, V. Y. Matrosova, M. J. Daly, and P.
Setlow, Appl. Environ. Microbiol. 77, 32 (2011).8P. Carmona, Spectrochim. Acta, Part A 36, 705 (1980).
9K. McCann and J. Laane, J. Mol. Struct. 890, 346 (2008).10I. R. Scott and D. J. Ellar, J. Bacteriol. 135, 133 (1978).11P. Setlow, Curr. Opin. Microbiol. 6, 550 (2003).12P. Setlow, J. Appl. Microbiol. 101, 514 (2006).13M. Paul, S. Atluri, B. Setlow, and P. Setlow, J. Appl. Microbiol. 101, 1161
(2006).14H. Shibata, S. Yamashita, M. Ohe, and I. Tani, Microbiol. Immunol. 30,
307 (1986).15H. Cheung, J. Cui, and S. Sun, Microbiology 145, 1043 (1999).16D. Chen, S. Huang, and Y. Q. Li, Anal. Chem. 78, 6936 (2006).17H. V. B. Veen, H. Xie, E. Esveld, T. Abee, H. Matswijk, and M. N. Groot,
Food Microbiol. 45, 26 (2015).18C. J. Doona, F. E. Feeherry, B. Setlow, W. Shiwei, L. William, F. C.
Nichols, P. K. Talukdar, M. R. Sarker, Y. Q. Li, S. Aimee, and P. Setlow,
Appl. Environ. Microbiol. 82, 5287 (2016).19E. P. Sunde, P. Setlow, L. Hederstedt, and B. Halle, Proc. Natl. Acad. Sci.
U. S. A. 106, 19334 (2009).20P. Rajak, A. Mishra, C. Sheng, S. Tiwari, A. Krishnamoorthy, R. K.
Kalia, A. Nakano, and P. Vashishta, Appl. Phys. Lett. 111, 213701
(2017).21J. Henin, G. Fiorin, C. Chipot, and M. Klein, J. Chem. Theory Comput. 6,
35 (2010).22A. C. T. van Duin, S. Dasgupta, F. Lorant, and W. A. Goddard, J. Phys.
Chem. A 105, 9396 (2001).23K.-I. Nomura, P. E. Small, R. K. Kalia, A. Nakano, and P. Vashishta,
Comput. Phys. Commun. 192, 91 (2015).24J. M. D. Lane, G. S. Grest, A. P. Thompson, K. R. Cochrane,
M. Desjarlais, and T. R. Mattsson, AIP Conf. Proc. 1426, 1435
(2012).25G. Strahs and R. E. Dickerson, Acta Crystallogr. B 24, 571
(1968).26D. D. Dlott, Annu. Rev. Phys. Chem. 37, 157 (1986).27E. C. Spencer, A. A. Levchenko, N. L. Ross, A. I. Kolesnikov, J. B.
Goates, B. F. Woodfield, A. Navrotsky, and G. Li, J. Phys. Chem. A 113,
2796 (2009).28C. Jarzynski, Phys. Rev. Lett. 78, 2690 (1997).29C. Jarzynski, Phys. Rev. E 56, 5018 (1997).30C. Jarzynski, J. Stat. Mech. 1, P09005 (2004).
113702-5 Mishra et al. Appl. Phys. Lett. 113, 113702 (2018)


![Calcium [Ca2+]i very low ~50-100 nM –Many calcium binding proteins = high buffering capacity Divalent cation forms ionic bridges –Glutamic acid –Aspartic](https://img.pdfslide.us/doc/110x75/5697bf921a28abf838c8efef/calcium-ca2i-very-low-50-100-nm-many-calcium-binding-proteins-high.jpg)